Embed Size (px)
Citation preview
Trends in the Political Ideology of the Cuban-American Voter
Evidence from the Cuba Poll
1991-2011
1
2
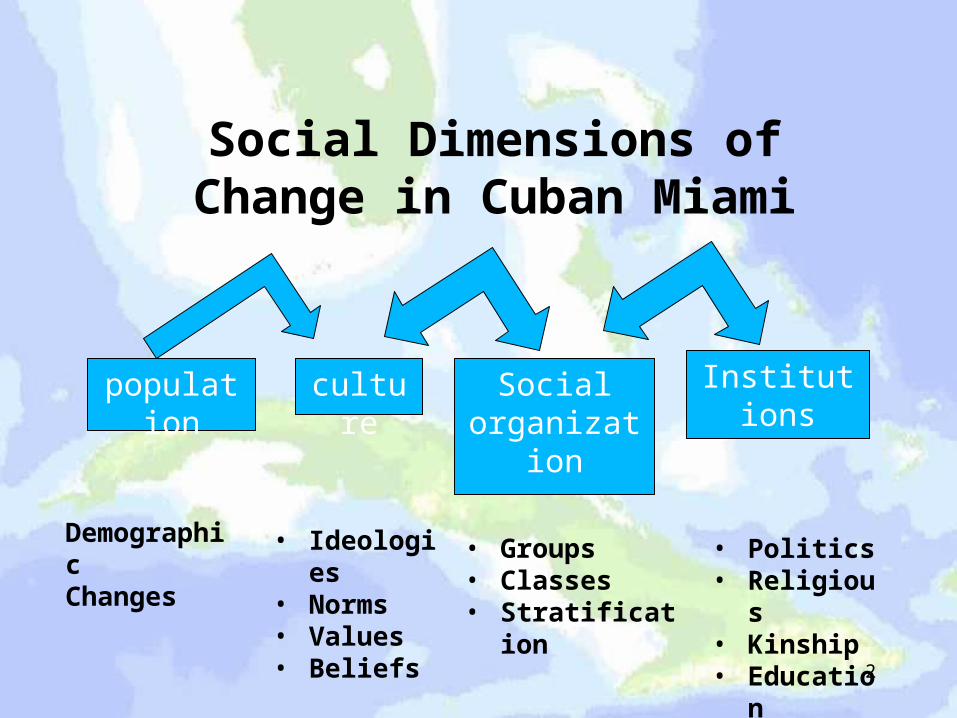
population culture Social organization
Institutions
Demographic Changes
• Ideologies• Norms• Values• Beliefs
• Groups• Classes• Stratification
• Politics• Religious• Kinship• Education• Economy
Social Dimensions of Change in Cuban Miami
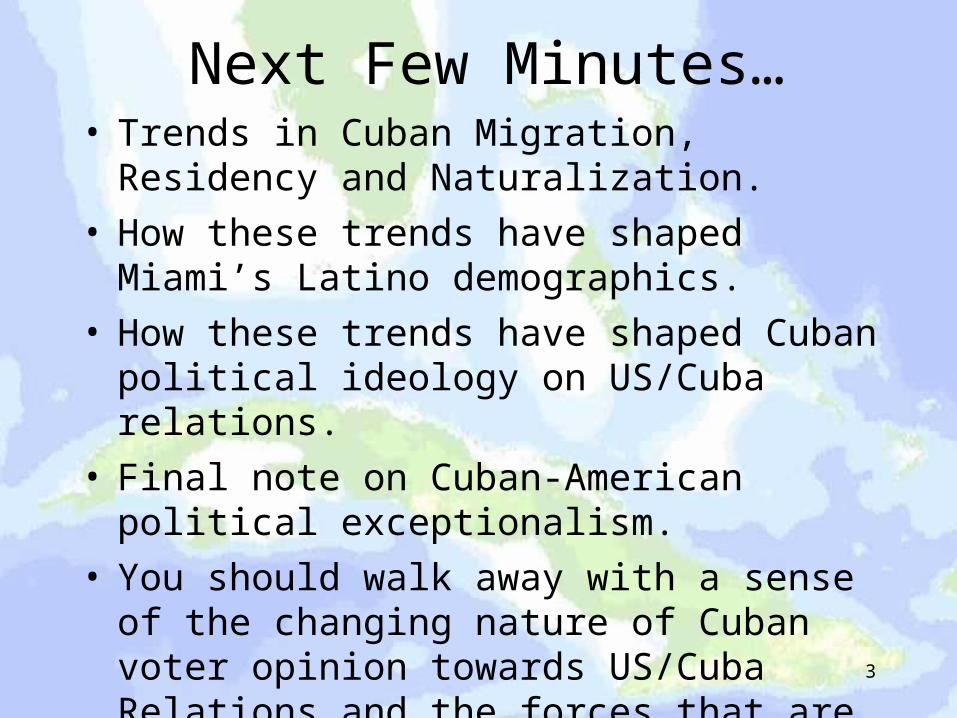
Next Few Minutes…• Trends in Cuban Migration, Residency and
Naturalization.
• How these trends have shaped Miami’s Latino demographics.
• How these trends have shaped Cuban political ideology on US/Cuba relations.
• Final note on Cuban-American political exceptionalism.
• You should walk away with a sense of the changing nature of Cuban voter opinion towards US/Cuba Relations and the forces that are ineluctably creating the changes. 3
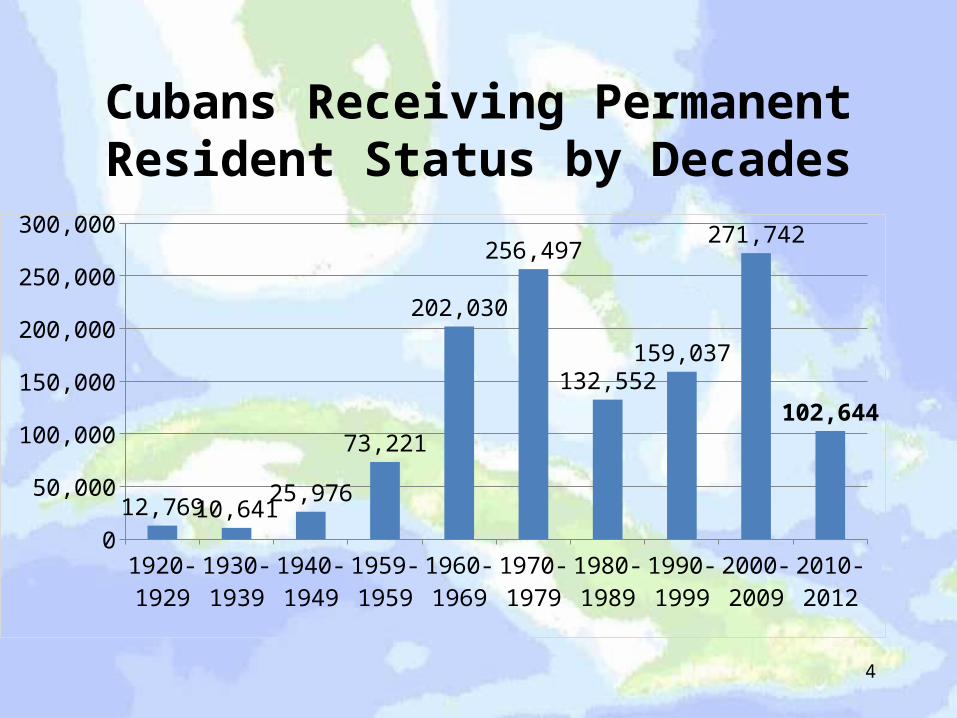
Cubans Receiving Permanent Resident Status by Decades
1920-1929
1930-1939
1940-1949
1959-1959
1960-1969
1970-1979
1980-1989
1990-1999
2000-2009
2010-2012
0
50,000
100,000
150,000
200,000
250,000
300,000
12,769 10,64125,976
73,221
202,030
256,497
132,552159,037
271,742
102,644
4
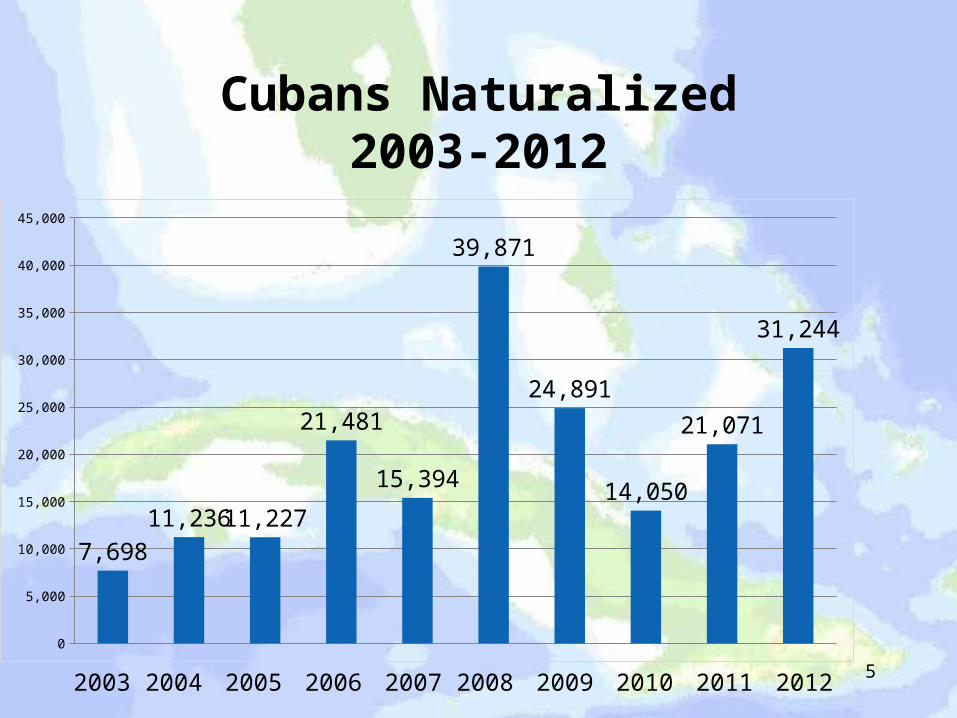
Cubans Naturalized2003-2012
5
0
5,000
10,000
15,000
20,000
25,000
30,000
35,000
40,000
45,000
7,698
11,236 11,227
21,481
15,394
39,871
24,891
14,050
21,071
31,244
2003 2004 2005 2006 2007 2008 2009 2010 2011 2012
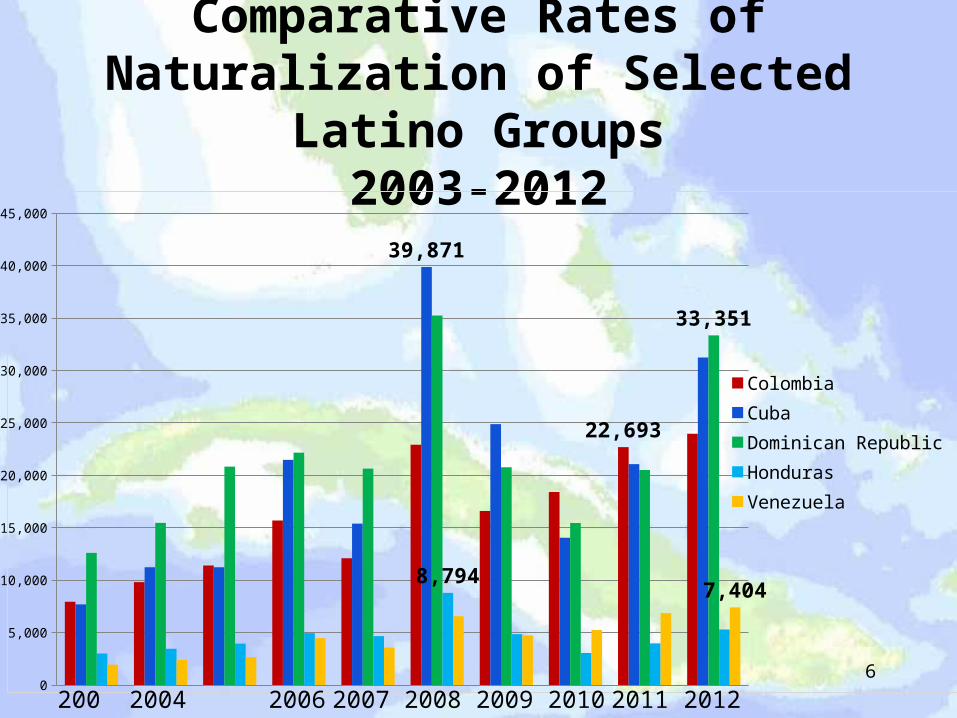
Comparative Rates of Naturalization of Selected Latino Groups
2003-2012
60
5,000
10,000
15,000
20,000
25,000
30,000
35,000
40,000
45,000
39,871
8,794
22,693
33,351
7,404
ColombiaCubaDominican RepublicHondurasVenezuela
2003 2004 2005 2006 2007 2008 2009 2010 2011 2012
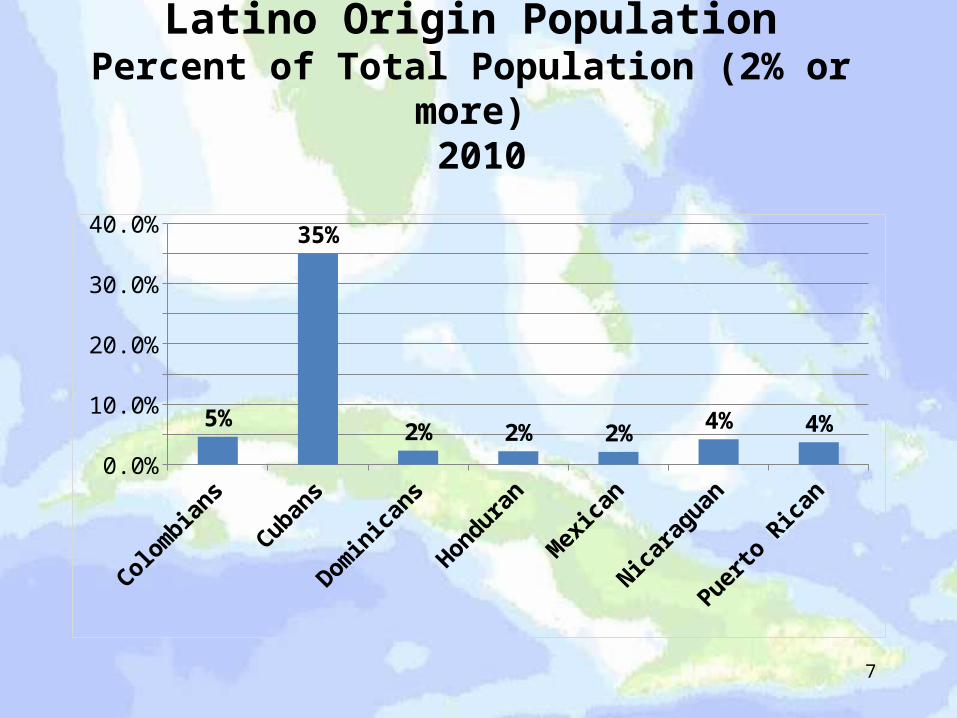
Latino Origin PopulationPercent of Total Population (2% or more)
2010
Colom
bians
Cubans
Domin
icans
Hon
duran
Mex
ican
Nicara
guan
Puerto
Rica
n0.0%
5.0%
10.0%
15.0%
20.0%
25.0%
30.0%
35.0%
40.0%
5%
35%
2% 2% 2%4% 4%
7
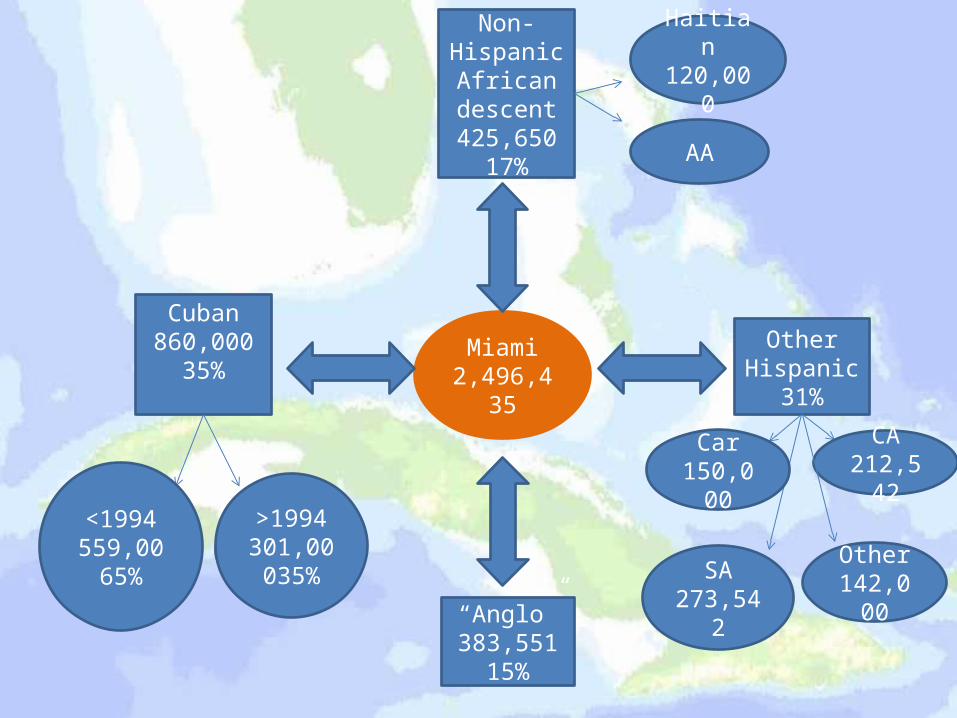
Miami2,496,435
Non-Hispanic African descent425,650
17%
Other Hispanic
31%
“Anglo”383,551
15%
Cuban860,000
35%
<1994559,0065%
1994>
Haitian 120,000
AA
Car150,000
CA212,542
SA273,542
>1994301,000
35% Other142,000
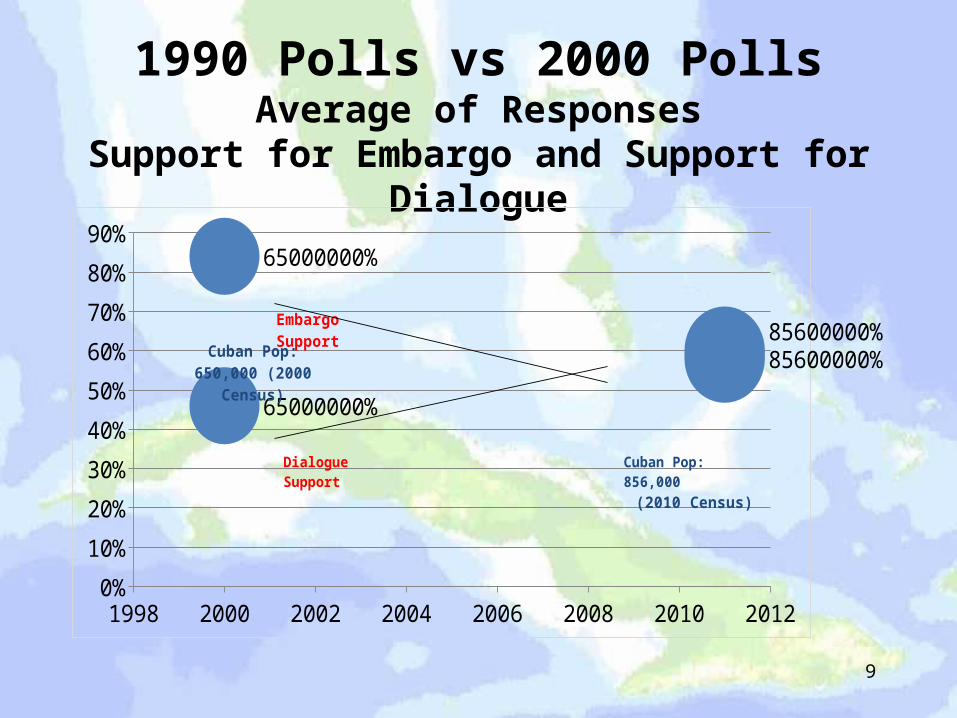
1990 Polls vs 2000 PollsAverage of Responses
Support for Embargo and Support for Dialogue
1998 2000 2002 2004 2006 2008 2010 20120%
10%
20%
30%
40%
50%
60%
70%
80%
90%65000000%
85600000%
65000000%
85600000%Embargo Support
Dialogue Support
Cuban Pop: 650,000 (2000 Census)
Cuban Pop: 856,000(2010 Census)
9
Strongly/Mostly Favor Strongly/Mostly Oppose0%
10%
20%
30%
40%
50%
60%
70%
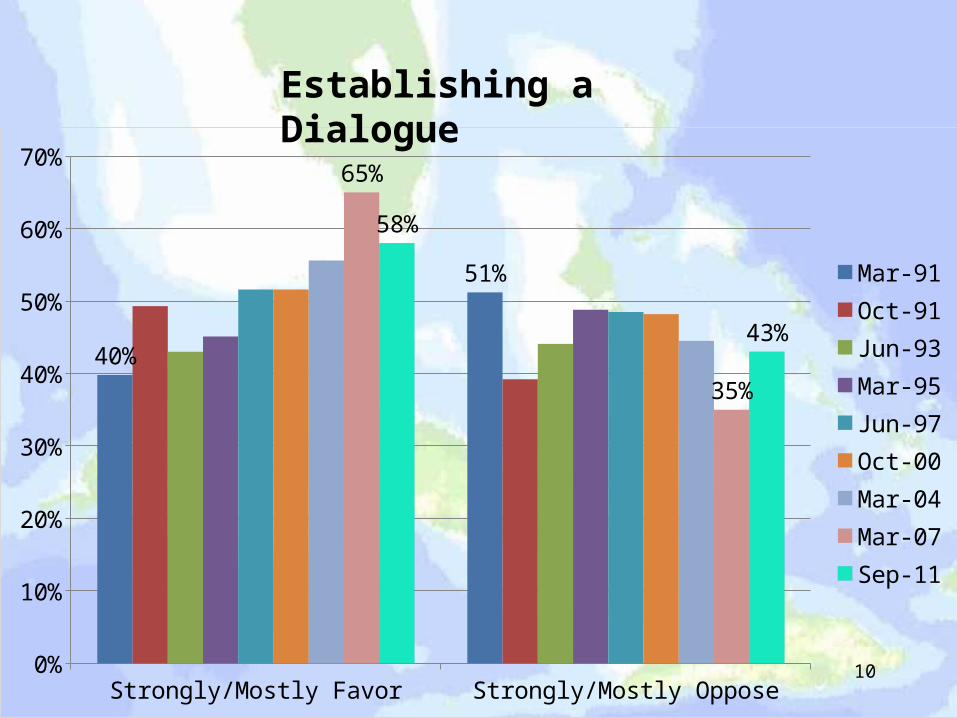
40%
51%
65%
35%
58%
43%
Mar-91Oct-91Jun-93Mar-95Jun-97Oct-00Mar-04Mar-07Sep-11
Establishing a Dialogue
10
Favor0%
10%
20%
30%
40%
50%
60%
70%
80%
90%
100%
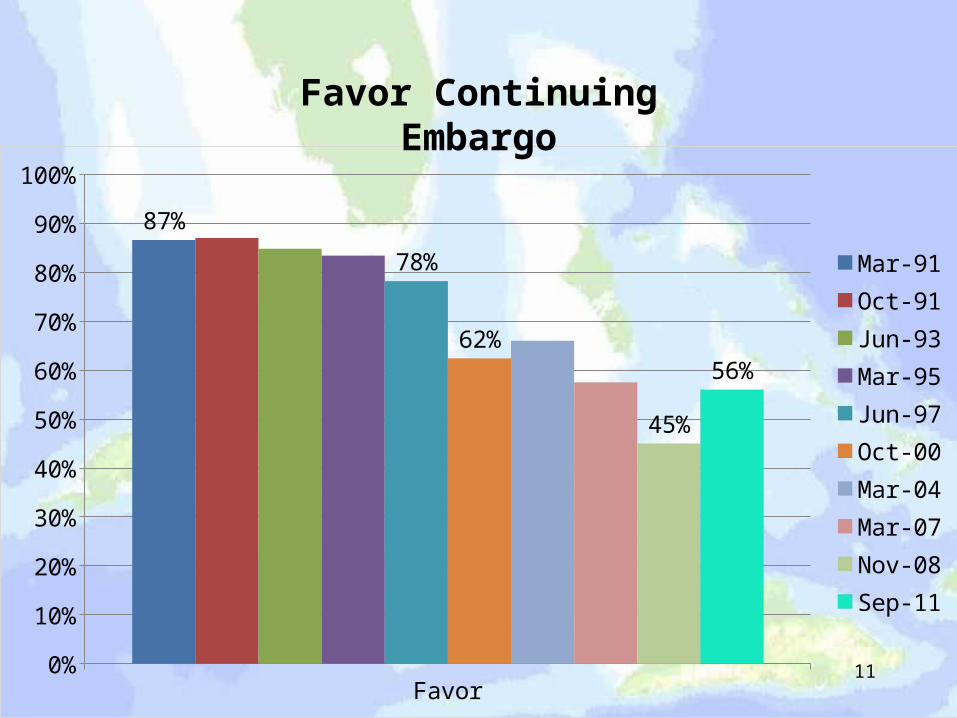
87%
78%
62%
45%
56%
Mar-91Oct-91Jun-93Mar-95Jun-97Oct-00Mar-04Mar-07Nov-08Sep-11
Favor Continuing Embargo
11
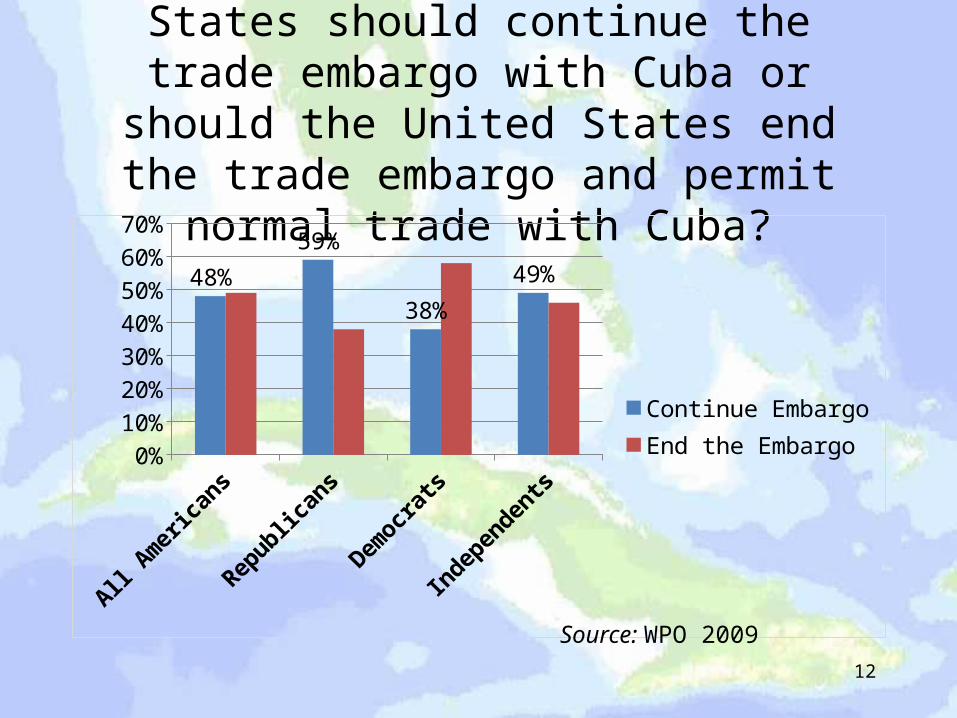
Do you think that the United States should continue the trade embargo with Cuba or
should the United States end the trade embargo and permit normal trade with Cuba?
All Am
erica
ns
Republic
ans
Democ
rats
Indep
enden
ts0%
10%
20%
30%
40%
50%
60%
70%
48%
59%
38%
49%
Continue EmbargoEnd the Embargo
12
Source: WPO 2009
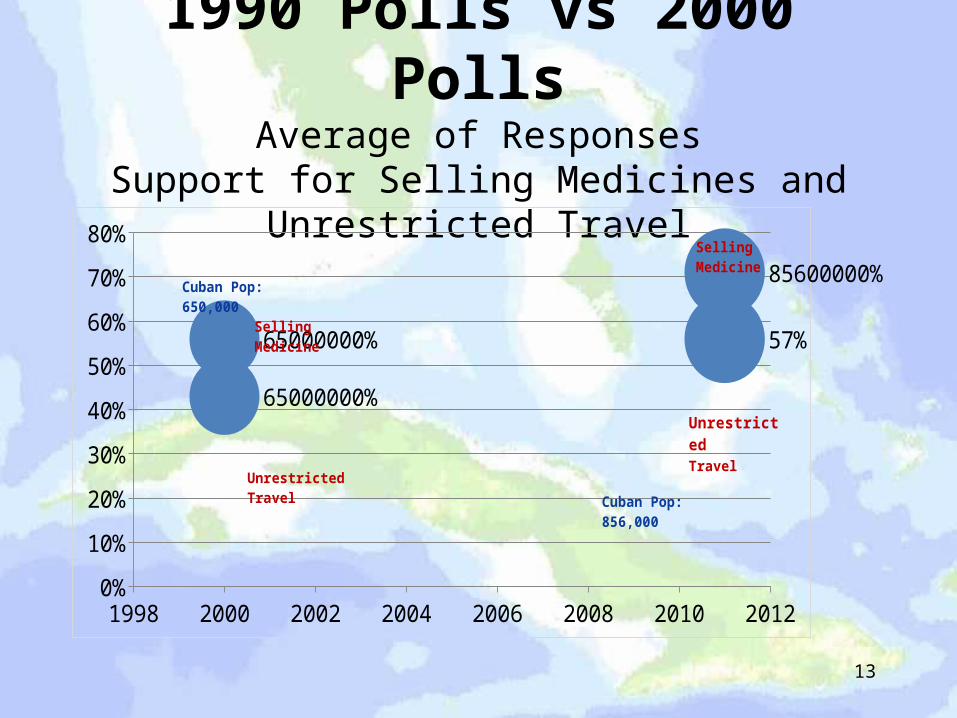
1990 Polls vs 2000 PollsAverage of Responses
Support for Selling Medicines and Unrestricted Travel
1998 2000 2002 2004 2006 2008 2010 20120%
10%
20%
30%
40%
50%
60%
70%
80%
65000000%
57%65000000%
85600000%
Unrestricted Travel
Selling Medicine
UnrestrictedTravel
Selling Medicine
Cuban Pop: 650,000
Cuban Pop: 856,000
13
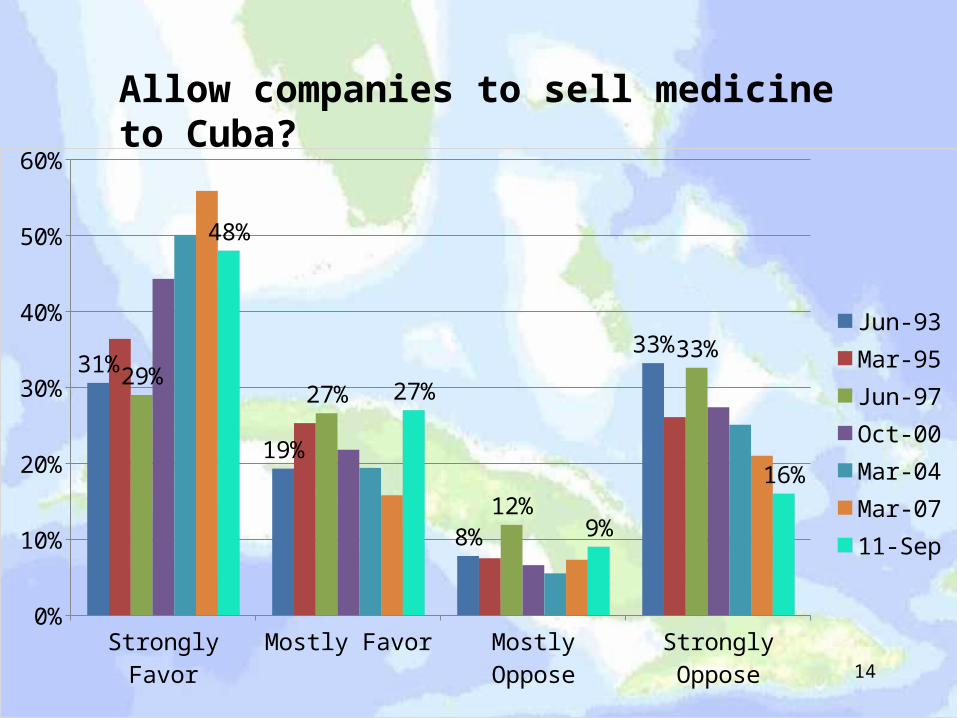
Strongly Favor Mostly Favor Mostly Oppose Strongly Oppose0%
10%
20%
30%
40%
50%
60%
31%
19%
8%
33%
29%27%
12%
33%
48%
27%
9%
16%
Jun-93Mar-95Jun-97Oct-00Mar-04Mar-0711-Sep
Allow companies to sell medicine to Cuba?
14
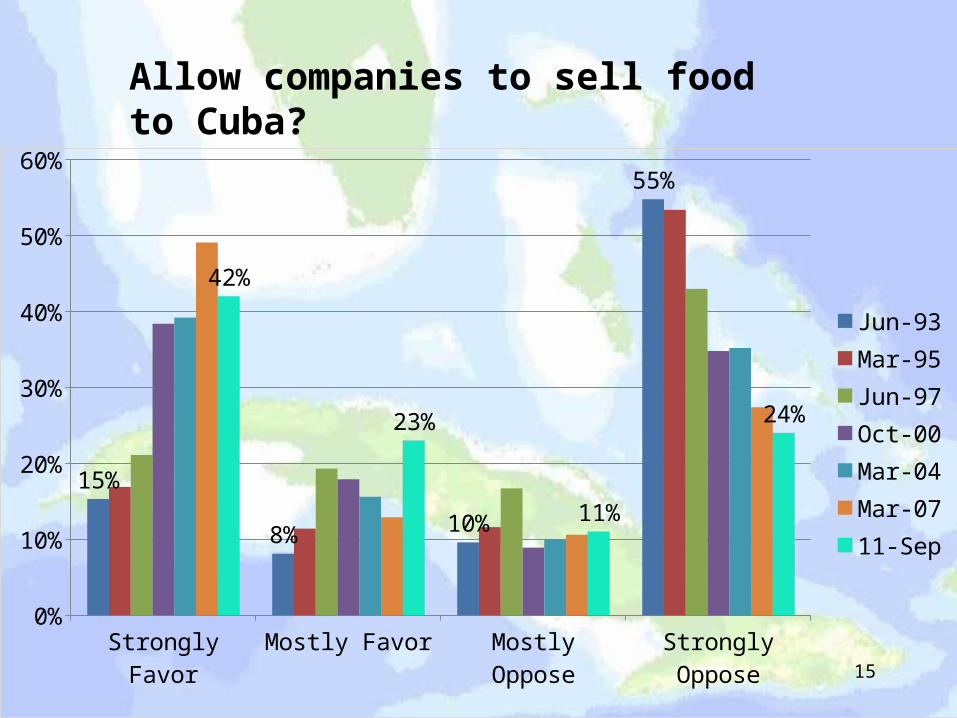
Strongly Favor Mostly Favor Mostly Oppose Strongly Oppose0%
10%
20%
30%
40%
50%
60%
15%
8% 10%
55%
42%
23%
11%
24%
Jun-93Mar-95Jun-97Oct-00Mar-04Mar-0711-Sep
Allow companies to sell food to Cuba?
15
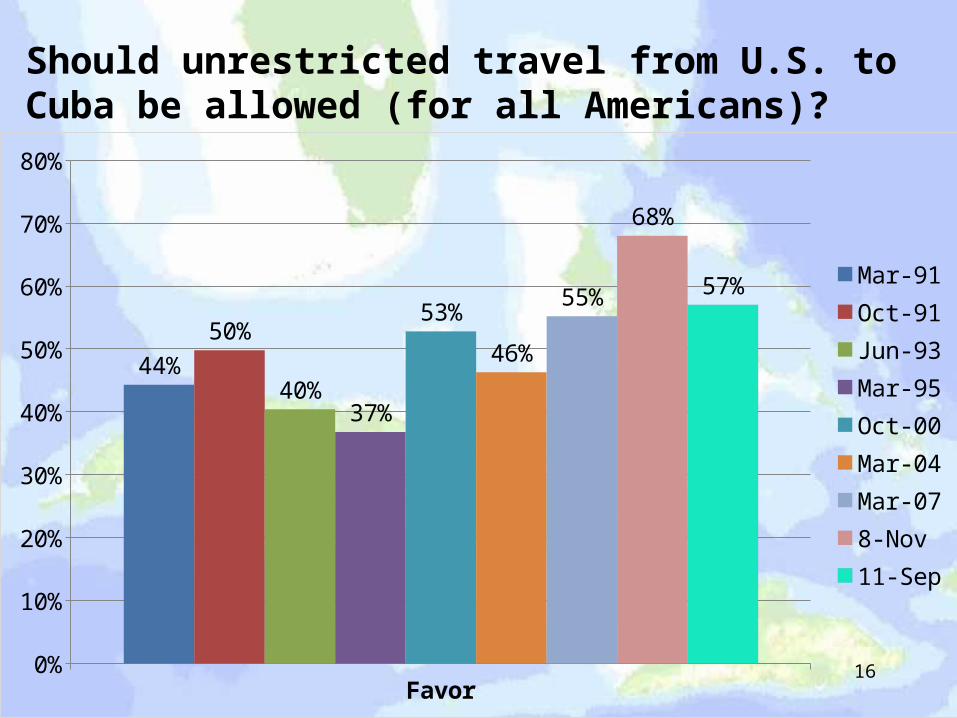
Favor0%
10%
20%
30%
40%
50%
60%
70%
80%
44%
50%
40%37%
53%
46%
55%
68%
57%Mar-91Oct-91Jun-93Mar-95Oct-00Mar-04Mar-078-Nov11-Sep
Should unrestricted travel from U.S. to Cuba be allowed (for all Americans)?
16
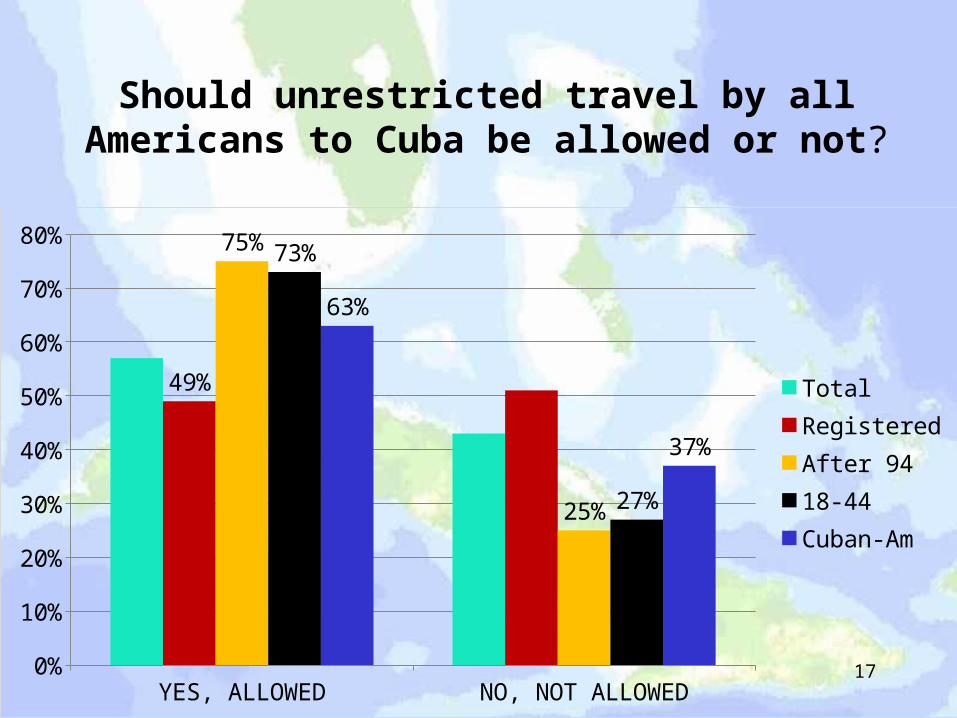
Should unrestricted travel by all Americans to Cuba be allowed or not?
YES, ALLOWED NO, NOT ALLOWED0%
10%
20%
30%
40%
50%
60%
70%
80%
49%
75%
25%
73%
27%
63%
37%
TotalRegisteredAfter 9418-44Cuban-Am
17
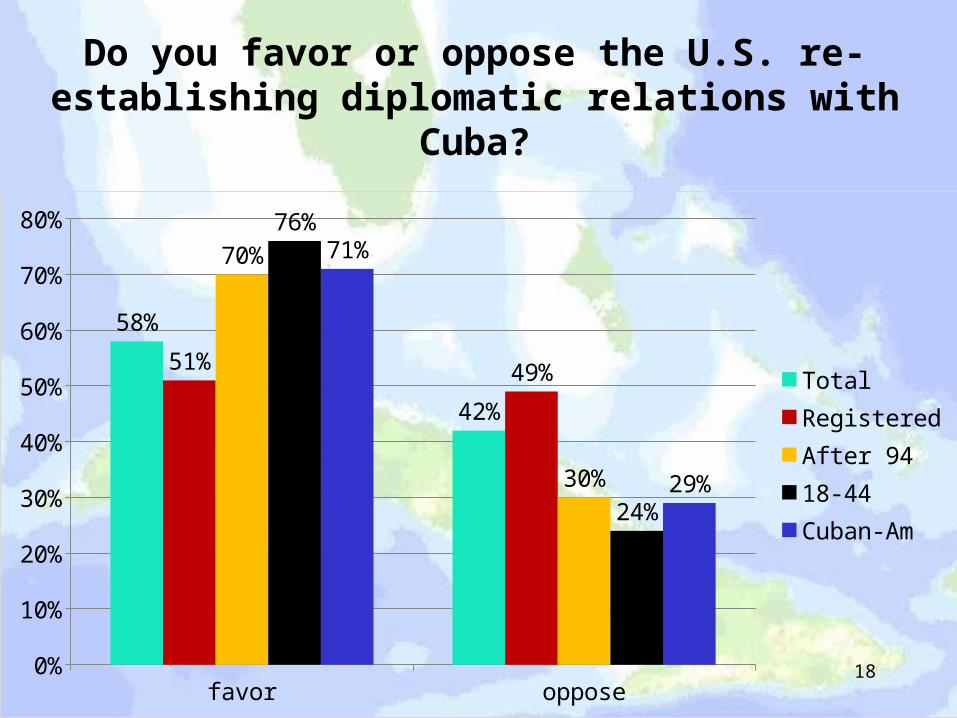
Do you favor or oppose the U.S. re-establishing diplomatic relations with Cuba?
favor oppose0%
10%
20%
30%
40%
50%
60%
70%
80%
58%
42%
51% 49%
70%
30%
76%
24%
71%
29%
TotalRegisteredAfter 9418-44Cuban-Am
18
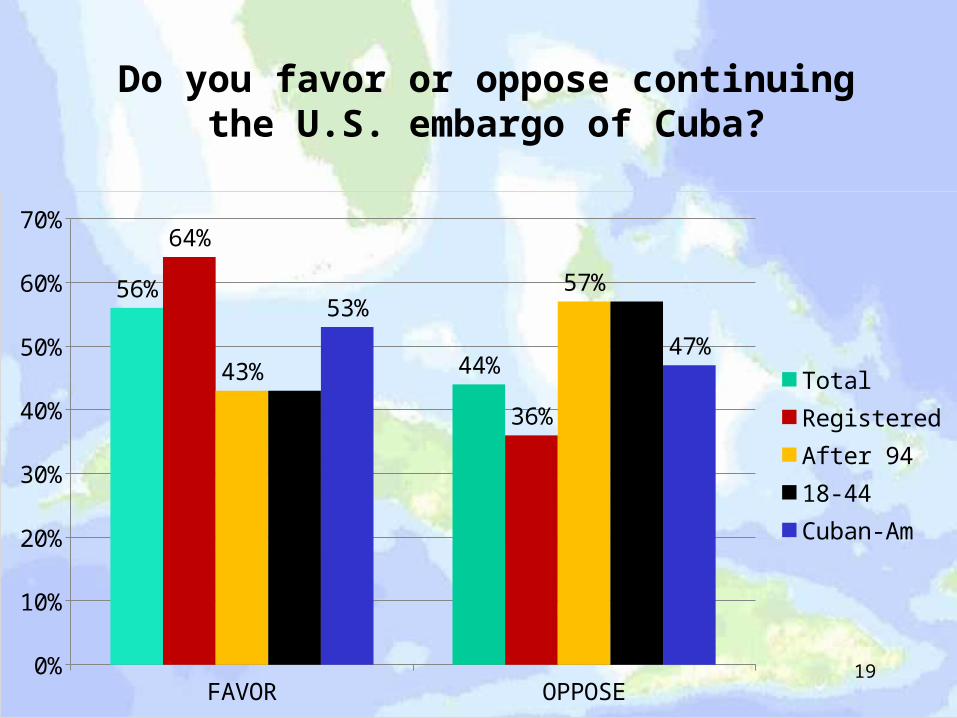
Do you favor or oppose continuing the U.S. embargo of Cuba?
FAVOR OPPOSE0%
10%
20%
30%
40%
50%
60%
70%
56%
44%
64%
36%
43%
57%53%
47%
TotalRegisteredAfter 9418-44Cuban-Am
19
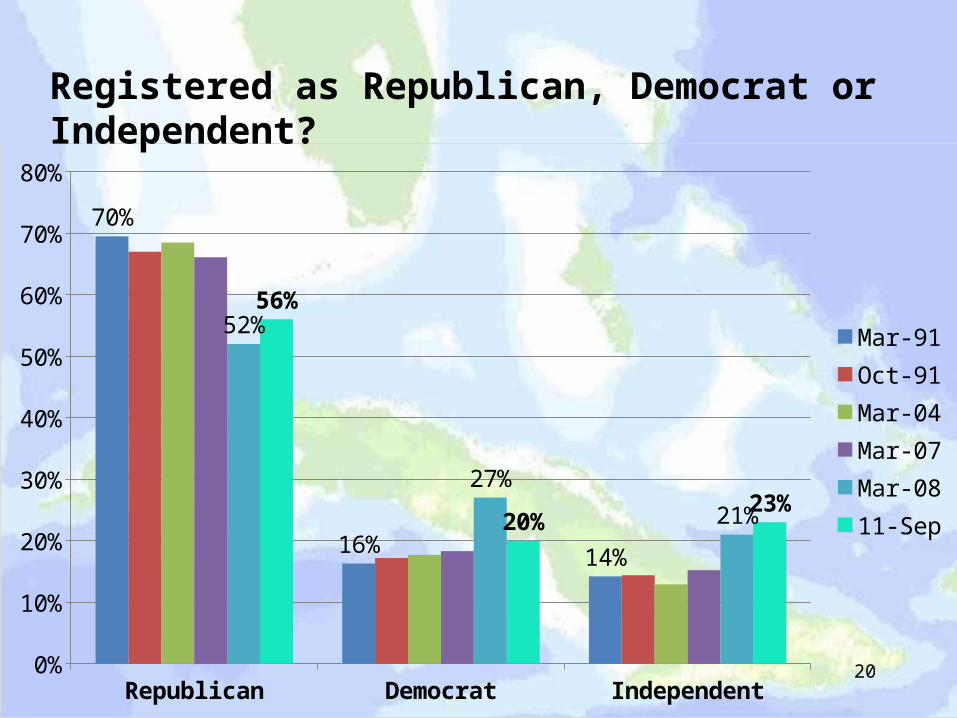
Republican Democrat Independent0%
10%
20%
30%
40%
50%
60%
70%
80%
70%
16% 14%
52%
27%
21%
56%
20%23%
Mar-91Oct-91Mar-04Mar-07Mar-0811-Sep
Registered as Republican, Democrat or Independent?
20
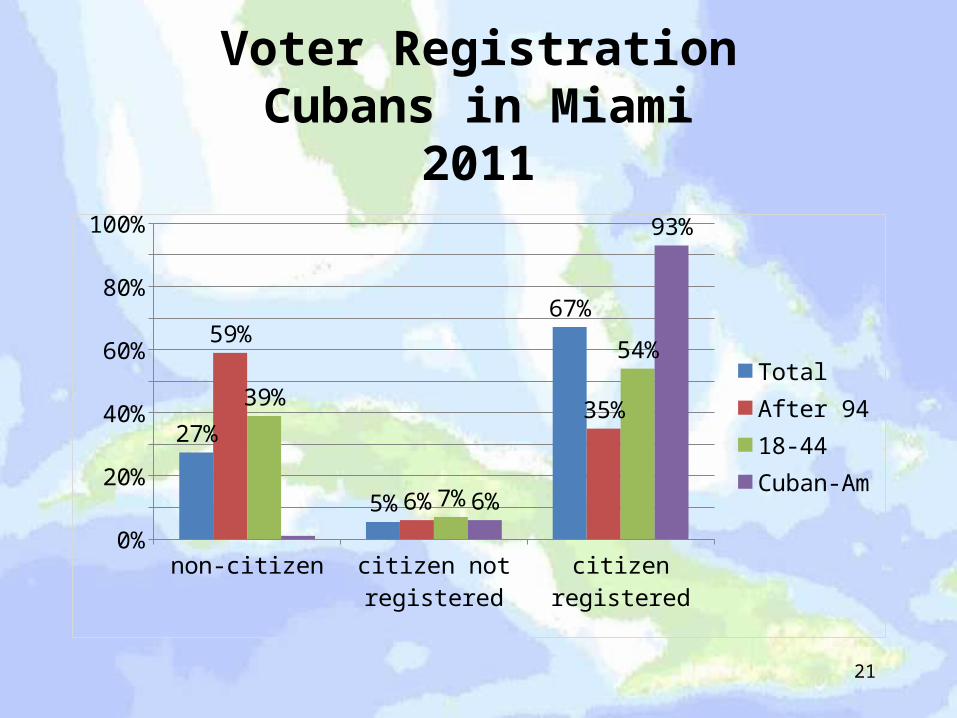
Voter RegistrationCubans in Miami
2011
non-
citize
n
citize
n not
regi
stere
d
citize
n reg
ister
ed0%
20%
40%
60%
80%
100%
27%
5%
67%59%
6%
35%39%
7%
54%
6%
93%
TotalAfter 9418-44Cuban-Am
21
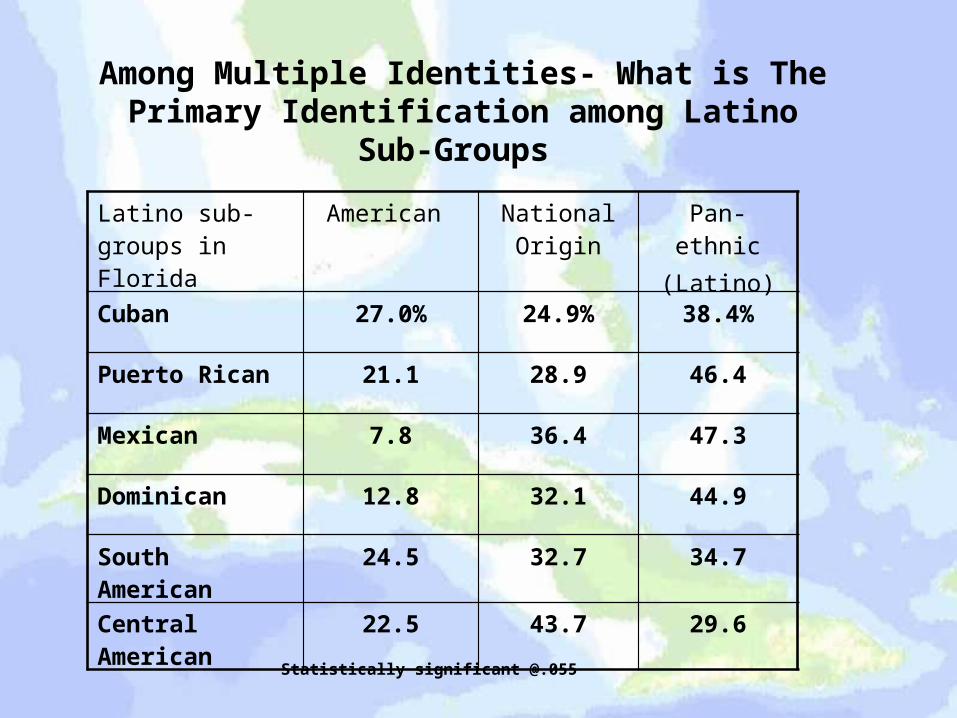
Among Multiple Identities- What is The Primary Identification among Latino Sub-Groups
Latino sub-groups in Florida
American National Origin
Pan-ethnic(Latino)
Cuban 27.0% 24.9% 38.4%
Puerto Rican 21.1 28.9 46.4
Mexican 7.8 36.4 47.3
Dominican 12.8 32.1 44.9
South American 24.5 32.7 34.7
Central American
22.5 43.7 29.6
Statistically significant @.055
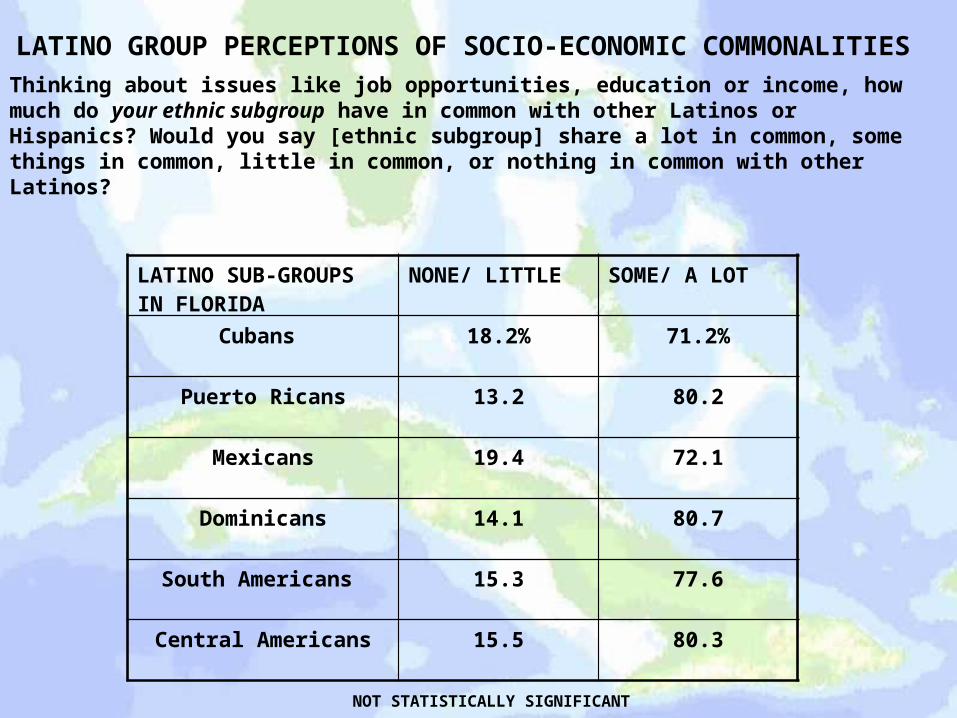
LATINO GROUP PERCEPTIONS OF SOCIO-ECONOMIC COMMONALITIES
Thinking about issues like job opportunities, education or income, how much do your ethnic subgroup have in common with other Latinos or Hispanics? Would you say [ethnic subgroup] share a lot in common, some things in common, little in common, or nothing in common with other Latinos?
LATINO SUB-GROUPS IN FLORIDA
NONE/ LITTLE SOME/ A LOT
Cubans 18.2% 71.2%
Puerto Ricans 13.2 80.2
Mexicans 19.4 72.1
Dominicans 14.1 80.7
South Americans 15.3 77.6
Central Americans 15.5 80.3
NOT STATISTICALLY SIGNIFICANT
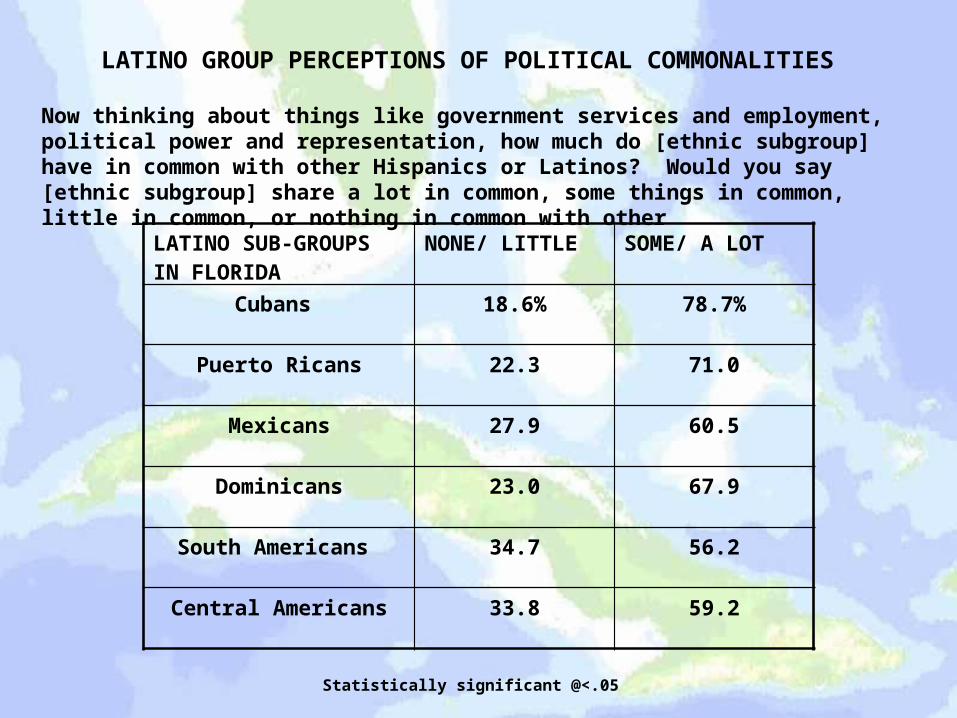
LATINO GROUP PERCEPTIONS OF POLITICAL COMMONALITIES
Now thinking about things like government services and employment, political power and representation, how much do [ethnic subgroup] have in common with other Hispanics or Latinos? Would you say [ethnic subgroup] share a lot in common, some things in common, little in common, or nothing in common with other
LATINO SUB-GROUPS IN FLORIDA
NONE/ LITTLE SOME/ A LOT
Cubans 18.6% 78.7%
Puerto Ricans 22.3 71.0
Mexicans 27.9 60.5
Dominicans 23.0 67.9
South Americans 34.7 56.2
Central Americans 33.8 59.2
Statistically significant @<.05