Embed Size (px)
Citation preview

Phone: +1-800-525-3915 Website: www.3plogistics.com Email: [email protected]
TRENDS IN 3PL / CUSTOMER RELATIONSHIPS
November 2016
Third-Party Logistics Market Results and Trends for 2017 Including Estimates for 190 Countries
June 2017
All Rights Reserved.
No part of this publication may be reproduced, stored in a retrieval system or transmitted in any form by any means, electronic, mechanical, photocopied, recorded or otherwise, without the prior permission of the publisher, Armstrong & Associates, Inc.
The facts of this report are believed to be correct at the time of publication but cannot be guaranteed. Please note that the findings, conclusions and recommendations that Armstrong & Associates delivers will be based on information gathered in good faith from both primary and secondary sources, whose accuracy we are not always in a position to guarantee. As such, Armstrong & Associates can accept no liability whatsoever for actions taken based on any information that may subsequently prove to be incorrect.
©2017 Armstrong & Associates
ABOUT ARMSTRONG & ASSOCIATES, INC.Armstrong & Associates, Inc. (A&A) was established in 1980 to meet the needs of a newly deregulated domestic transportation market. Since then, through its leading Third-Party Logistics (3PL) market research and history of helping companies outsource logistics functions, A&A has become an internationally recognized key resource for 3PL market information and consulting.
A&A’s mission is to have leading proprietary supply chain knowledge and market research not available anywhere else. As proof of our continued work in supporting our mission, A&A’s 3PL market research is frequently cited in media articles, publications, and securities filings by publicly traded 3PLs. In addition, A&A’s email newsletter currently has over 42,000 subscribers globally.
A&A’s market research complements its consulting activities by providing continually updated data for analysis. Based upon its unsurpassed knowledge of the 3PL market and the operations of leading 3PLs, A&A has provided strategic planning consulting services to over 30 3PLs, supported 17 closed investment transactions, and provided advice to numerous companies looking to benchmark existing 3PL operations or outsource logistics functions.

1©2017 Armstrong & Associates
U.S. 3PL MARKET
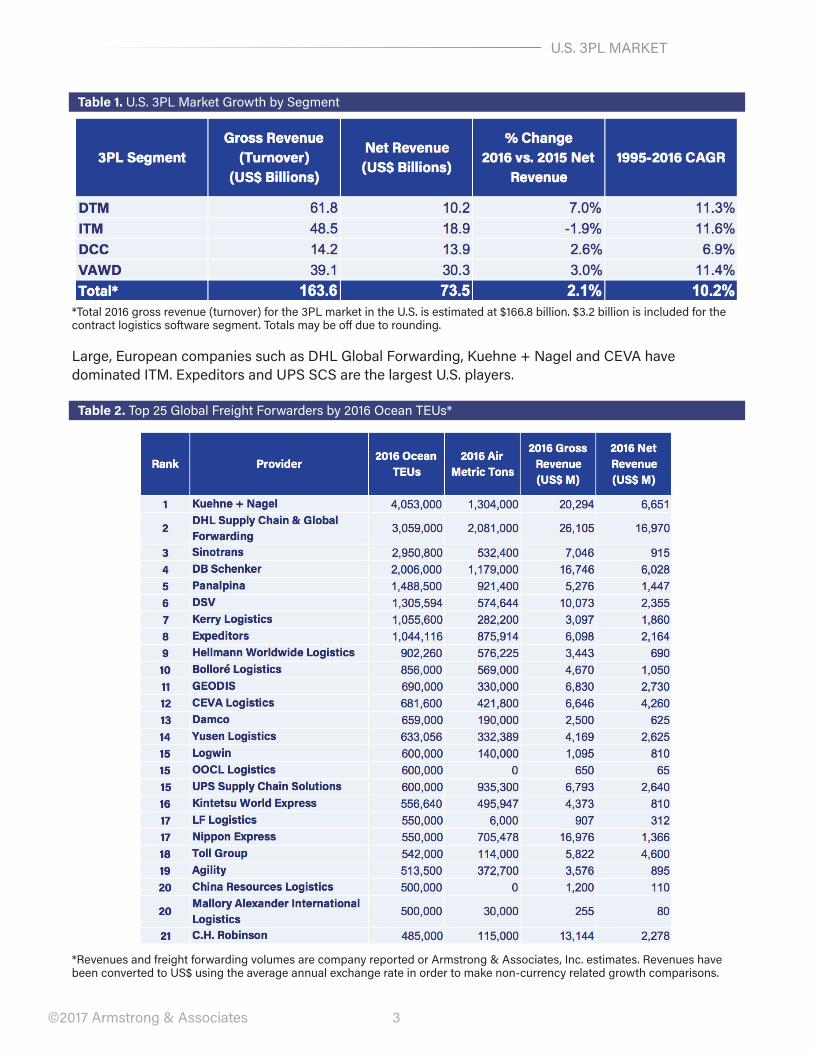
U.S. Third-Party Logistics MarketFor third-party logistics, 2016 was a mediocre year. In the U.S., 3PL net revenues grew 2.1% over 2015 to $73.5 billion. Overall gross revenues increased 3.5% expanding the total U.S. 3PL market to $166.8 billion.
Big M&A deals changed third-party logistics from mid-2014 through 2015. In 2016, the pace slackened significantly. The biggest deal was FedEx’s acquisition of TNT Express in the second quarter. Other big deals were DSV’s acquisition of UTi Worldwide in January and HNA Group’s purchase of Ingram Micro for $6 billion.
Figure 1. U.S. 3PL Market 2000-2017E (US$ Billions)
In 2016, the Domestic Transportation Management (DTM) segment increased 5.3% in gross revenue and 7% in net revenue as Domestic Transportation Management 3PLs (DTMs) tightened up operations in an effort to compensate for ample truck capacity. Segment leader C.H. Robinson’s gross revenue fell 2.5%, net revenue was up 0.4%, and earnings before interest and tax (EBIT) were down 2.4%.
Results were similarly mixed in 2016 for Echo Global Logistics. Its gross revenue was up 13.5%, net revenue increased 10%, and its EBIT dropped 31.6%.
Total Quality Logistics, the largest privately-owned DTM 3PL, had 2016 gross revenue of $2.3 billion (+3.6%), net revenue of $465 million (+4.3%) and EBIT of $96 million (+4.3%).
International Transportation Management (ITM), which had strong growth 10 years ago, grew 2.6% in gross revenue, but net revenue and EBIT fell 1.9% and 7.6% respectively. ITM, like DTM, was negatively impacted by too much air and ocean capacity in the market. On the plus side, thanks to e-commerce and pharma, 2016 ended with higher air freight volumes which have expanded into 2017. CEVA’s ITM

2
U.S. 3PL MARKET
©2017 Armstrong & Associates
segment was down 11.6% in both gross and net revenue. Kuehne + Nagel had mixed results with gross revenue dropping 6.1%, net revenue growing 5.4% and an EBIT increase of 5.2%. GEODIS America has done a good job cross-selling its expanded service offering. It increased gross revenue to $502 million, net revenue to $98 million and EBIT to $25.7 million.
Dedicated Contract Carriage (DCC) grew 3.5%. Segment leader, Ryder, was up 14%. DCC is dominated by J.B. Hunt DCS, Ryder DTS and Cardinal Logistics.
Value-Added Warehousing and Distribution (VAWD) increased 1.9% on tight capacity and warehouse utilization. Ryder was up in this segment with growth in gross revenue of 5.9% and net revenue of 7.6%. Major VAWD provider, GENCO (now part of FedEx and rebranded to FedEx Supply Chain), was down 7.1% in gross revenue, 7.3% in net revenue and EBIT slipped 8% over 2015.
Figure 2. Net Revenue Growth by U.S. 3PL Market Segment 2000-2017E
Since 1995, the U.S. 3PL market has grown at a compound annual growth rate (CAGR) of 10.2%. ITM was the strongest segment over that period, followed by VAWD. However, DTM has dominated the last few years.
3
U.S. 3PL MARKET
©2017 Armstrong & Associates
Table 1. U.S. 3PL Market Growth by Segment
*Total 2016 gross revenue (turnover) for the 3PL market in the U.S. is estimated at $166.8 billion. $3.2 billion is included for the contract logistics software segment. Totals may be off due to rounding.
Large, European companies such as DHL Global Forwarding, Kuehne + Nagel and CEVA have dominated ITM. Expeditors and UPS SCS are the largest U.S. players.
Table 2. Top 25 Global Freight Forwarders by 2016 Ocean TEUs*
*Revenues and freight forwarding volumes are company reported or Armstrong & Associates, Inc. estimates. Revenues have been converted to US$ using the average annual exchange rate in order to make non-currency related growth comparisons.
4
U.S. 3PL MARKET
©2017 Armstrong & Associates
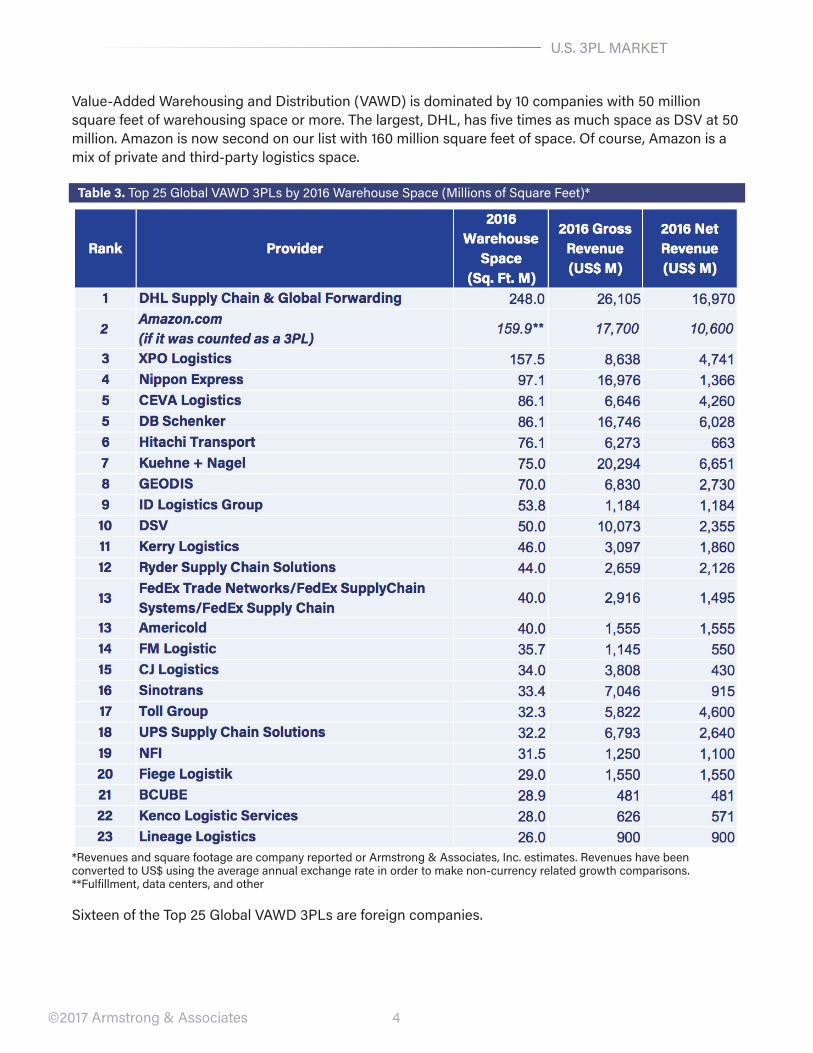
Value-Added Warehousing and Distribution (VAWD) is dominated by 10 companies with 50 million square feet of warehousing space or more. The largest, DHL, has five times as much space as DSV at 50 million. Amazon is now second on our list with 160 million square feet of space. Of course, Amazon is a mix of private and third-party logistics space.
Table 3. Top 25 Global VAWD 3PLs by 2016 Warehouse Space (Millions of Square Feet)*
*Revenues and square footage are company reported or Armstrong & Associates, Inc. estimates. Revenues have been converted to US$ using the average annual exchange rate in order to make non-currency related growth comparisons.**Fulfillment, data centers, and other
Sixteen of the Top 25 Global VAWD 3PLs are foreign companies.
5
THE NEW ASIA INVASION
©2017 Armstrong & Associates
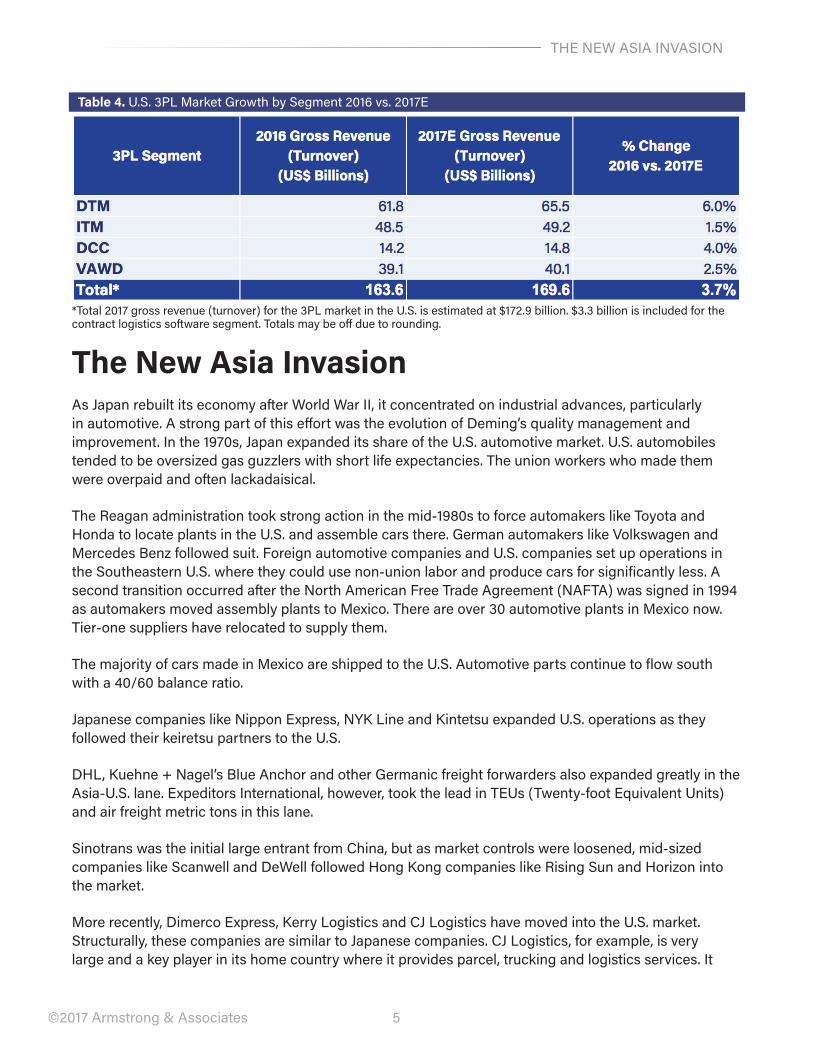
Table 4. U.S. 3PL Market Growth by Segment 2016 vs. 2017E
*Total 2017 gross revenue (turnover) for the 3PL market in the U.S. is estimated at $172.9 billion. $3.3 billion is included for the contract logistics software segment. Totals may be off due to rounding.
The New Asia InvasionAs Japan rebuilt its economy after World War II, it concentrated on industrial advances, particularly in automotive. A strong part of this effort was the evolution of Deming’s quality management and improvement. In the 1970s, Japan expanded its share of the U.S. automotive market. U.S. automobiles tended to be oversized gas guzzlers with short life expectancies. The union workers who made them were overpaid and often lackadaisical.
The Reagan administration took strong action in the mid-1980s to force automakers like Toyota and Honda to locate plants in the U.S. and assemble cars there. German automakers like Volkswagen and Mercedes Benz followed suit. Foreign automotive companies and U.S. companies set up operations in the Southeastern U.S. where they could use non-union labor and produce cars for significantly less. A second transition occurred after the North American Free Trade Agreement (NAFTA) was signed in 1994 as automakers moved assembly plants to Mexico. There are over 30 automotive plants in Mexico now. Tier-one suppliers have relocated to supply them.
The majority of cars made in Mexico are shipped to the U.S. Automotive parts continue to flow south with a 40/60 balance ratio.
Japanese companies like Nippon Express, NYK Line and Kintetsu expanded U.S. operations as they followed their keiretsu partners to the U.S.
DHL, Kuehne + Nagel’s Blue Anchor and other Germanic freight forwarders also expanded greatly in the Asia-U.S. lane. Expeditors International, however, took the lead in TEUs (Twenty-foot Equivalent Units) and air freight metric tons in this lane.
Sinotrans was the initial large entrant from China, but as market controls were loosened, mid-sized companies like Scanwell and DeWell followed Hong Kong companies like Rising Sun and Horizon into the market.
More recently, Dimerco Express, Kerry Logistics and CJ Logistics have moved into the U.S. market. Structurally, these companies are similar to Japanese companies. CJ Logistics, for example, is very large and a key player in its home country where it provides parcel, trucking and logistics services. It

6©2017 Armstrong & Associates
GLOBAL LOGISTICS COSTS
has over 100 warehouses in China. Thirteen percent of its business is in the Americas. It has expanded significantly since 2005 through acquisitions and is hunting for major expansion in the Americas.
Table 5. Major Asia-Based 3PLs by 2016 Americas Gross Revenue (US$ Millions)*
*Revenues are company reported or Armstrong & Associates, Inc. estimates. Revenues have been converted to US$ using the average annual exchange rate in order to make non-currency related growth comparisons.
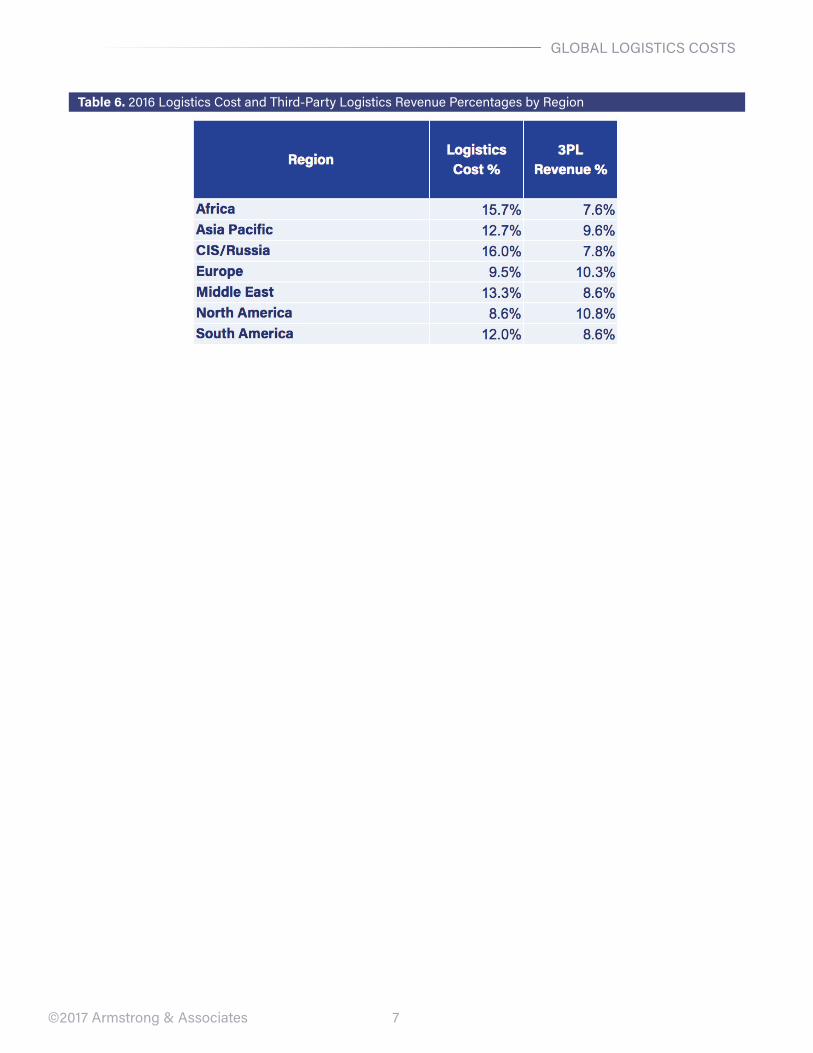
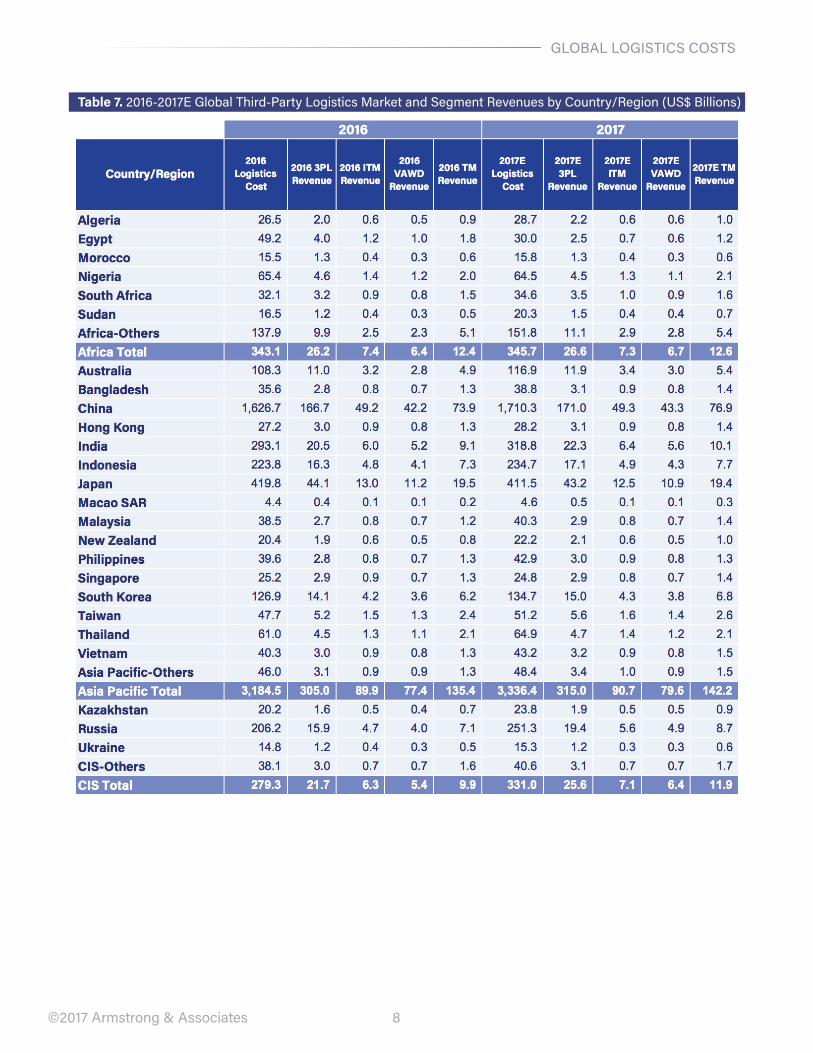
Global Logistics Costs and Third-Party Logistics RevenuesWhile developing economies in Africa, the Middle East and South America have shown growth spurts, it must be remembered that Asia Pacific logistics costs are almost 40% of the total (Europe is 20% and North America is 23%). The countries with the largest logistics spends are China ($1.6 trillion) and the U.S. ($1.5 trillion).
Global 3PL revenues reached $802 billion in 2016 and are on track to exceed $962 billion in 2020. Post-industrial societies have the largest 3PL revenues. Developing countries tend to have lower 3PL revenues. The numbers reflect greater outsourcing to 3PLs in developed, more economically sophisticated countries.
7©2017 Armstrong & Associates
GLOBAL LOGISTICS COSTS
Table 6. 2016 Logistics Cost and Third-Party Logistics Revenue Percentages by Region
8
GLOBAL LOGISTICS COSTS
©2017 Armstrong & Associates
Table 7. 2016-2017E Global Third-Party Logistics Market and Segment Revenues by Country/Region (US$ Billions)
9©2017 Armstrong & Associates
GLOBAL LOGISTICS COSTS
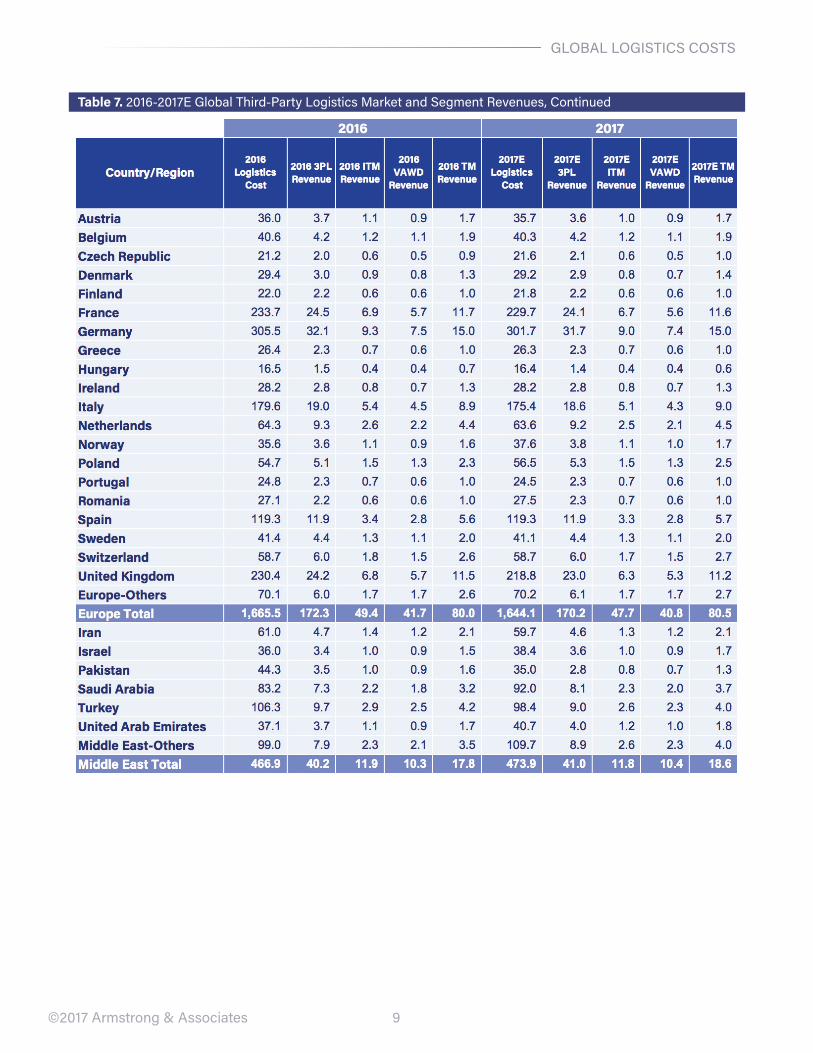
Table 7. 2016-2017E Global Third-Party Logistics Market and Segment Revenues, Continued
10©2017 Armstrong & Associates
GLOBAL LOGISTICS COSTS
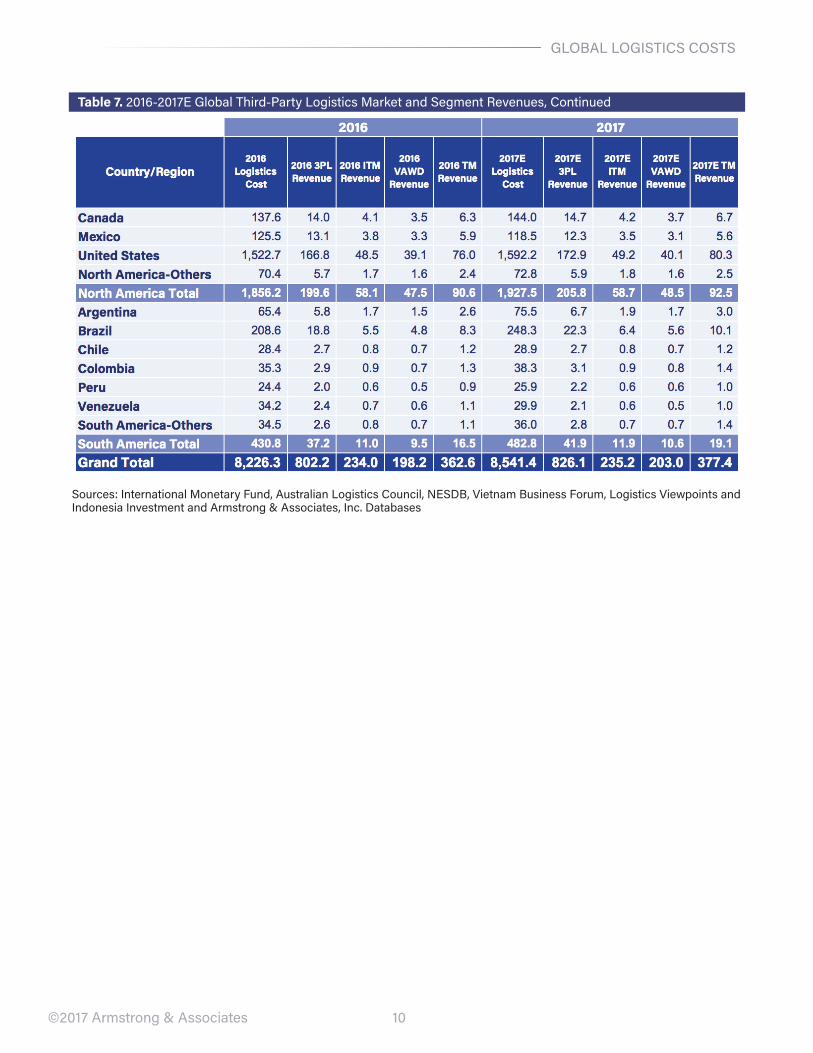
Table 7. 2016-2017E Global Third-Party Logistics Market and Segment Revenues, Continued
Sources: International Monetary Fund, Australian Logistics Council, NESDB, Vietnam Business Forum, Logistics Viewpoints and Indonesia Investment and Armstrong & Associates, Inc. Databases
11©2017 Armstrong & Associates
APPENDIX A
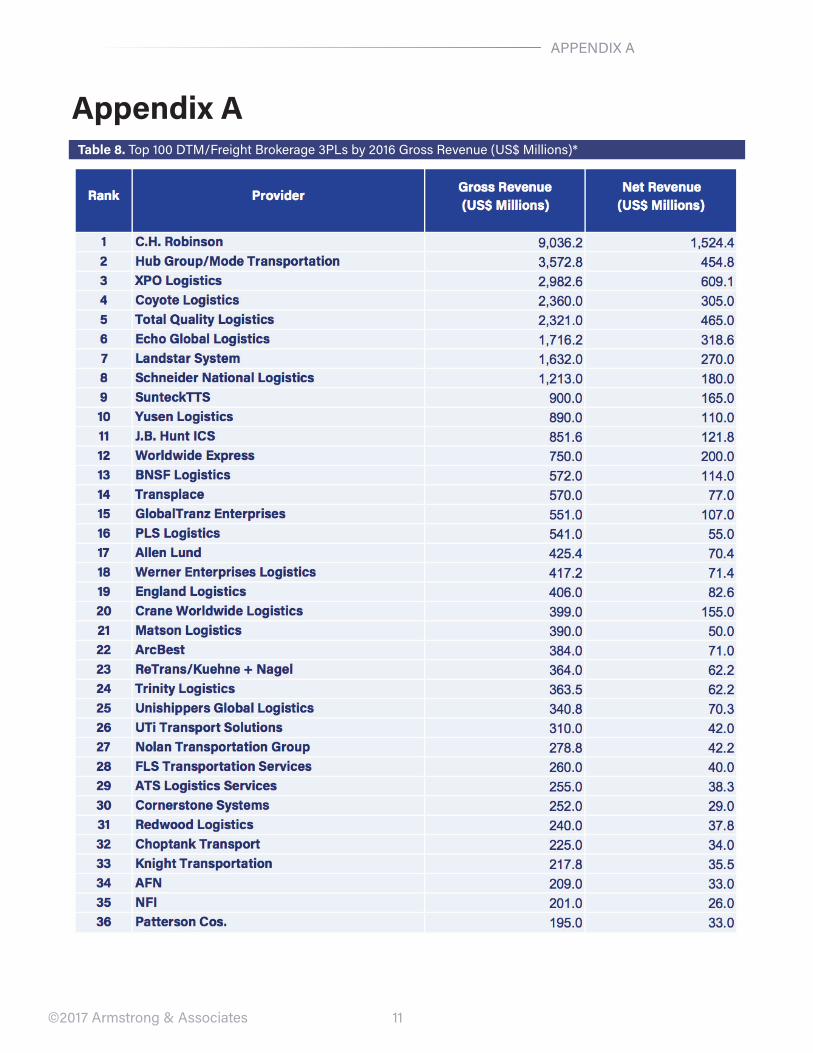
Appendix ATable 8. Top 100 DTM/Freight Brokerage 3PLs by 2016 Gross Revenue (US$ Millions)*
12
APPENDIX A
©2017 Armstrong & Associates
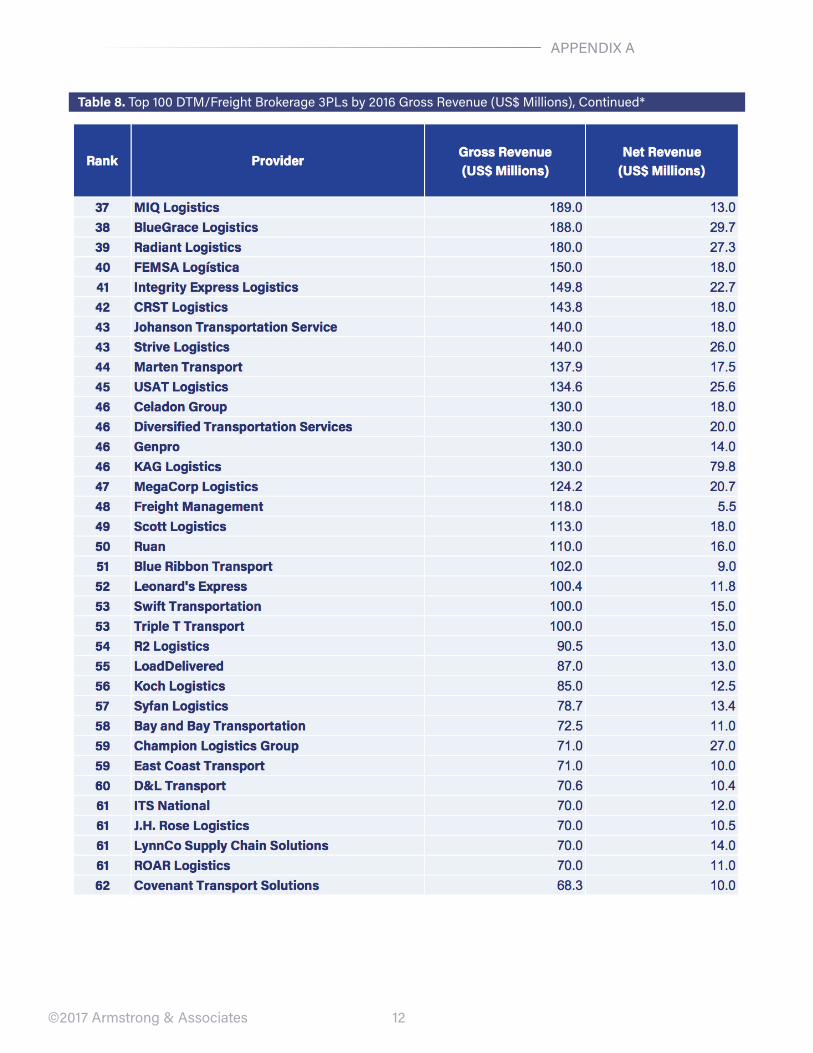
Table 8. Top 100 DTM/Freight Brokerage 3PLs by 2016 Gross Revenue (US$ Millions), Continued*

13
APPENDIX A
©2017 Armstrong & Associates
Table 8. Top 100 DTM/Freight Brokerage 3PLs by 2016 Gross Revenue (US$ Millions), Continued*
*Revenues are company reported or Armstrong & Associates, Inc. estimates.
14©2017 Armstrong & Associates
APPENDIX B
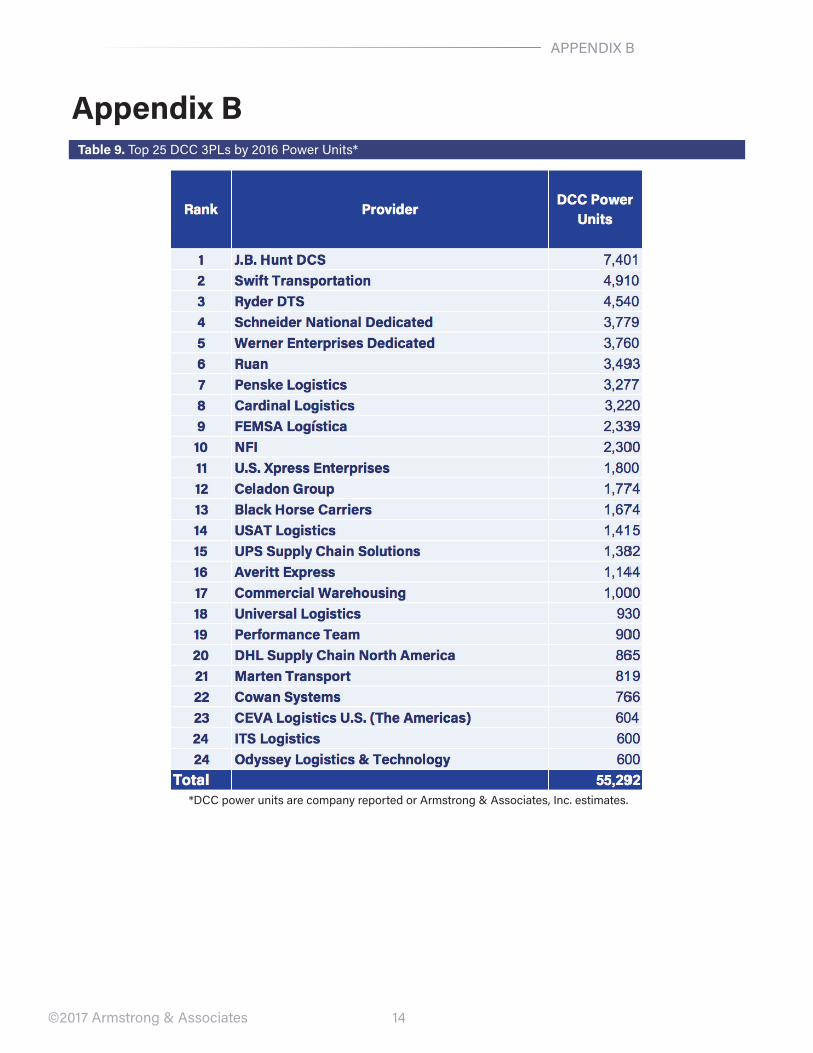
Appendix BTable 9. Top 25 DCC 3PLs by 2016 Power Units*
*DCC power units are company reported or Armstrong & Associates, Inc. estimates.
Market Research New Releases from Armstrong & Associates, Inc.
Expert Information Service (E.I.S.) Our premium market research and analysis offering includes access to our eight most popular 3PL market research reports and a subscription to our leading 3PL guide, Who’s Who in Logistics Online. Phone consulting is available.
Trends in 3PL/Customer Relationships –
2017
A&A’s analysis of trends in 3PL/Customer relationships is based on more than 7,200 3PL customer relationships in 41 countries. Market sizing for Domestic and Global Fortune 3PL revenues is included in the report. 3PL revenues are also available for nine major industry segments. Key 3PL services are detailed, as are capabilities for seven leading 3PLs. Regional and country level trends—a new addition to this year’s report—are also analyzed.
Digital Freight Matching – Capturing Technology-Based
Efficiencies in the Trucking Industry
Digital Freight Matching (DFM) companies, sometimes referred to as “Uber for Trucking,” have gained popularity in the last several years. This report summarizes the DFM landscape, including: an overview of transportation and technology market conditions and trends, comparisons of product offerings, an assessment of five business models, a discussion of industry challenges, and profiles of 27 DFM companies.
Keep It Running – The Quintessential Spare Parts
Logistics Report
Global spare/service parts logistics revenue for third-party logistics providers has grown to $52.7 billion. The report details the spare parts logistics capabilities of seven leading 3PLs: UPS, FedEx, DHL, Ryder, DB Schenker, SEKO, and CEVA. Global spare parts logistics market estimates are included, and are further calculated at the country/region level and for major industry verticals.
Reports are available for purchase at http://www.3plogistics.com