Embed Size (px)
Citation preview
Trends in Travel and Implicationsp
CUTR Webinar SeriesMarch 10, 2011
St E P l i PhD Steven E. Polzin, PhD. Center for Urban Transportation ResearchUniversity of South Florida
Steven E. Polzin
BSCE University of Wisconsin MadisonMSCE & PhD Northwestern UniversityMSCE & PhD Northwestern University
Greater Cleveland Regional Transit Authority 1980-1984Dallas Area Transit Authority 1984-1988 Center for Urban Transit Research 1988-present
Numerous TRB and APTA committees Journal of Public Transportation, Editorial Board Transportation, Editorial Board HART Board 1999-2006, 2008 - presentHillsborough County Metropolitan Planning Organization Board 2003-2005Produced the long-range travel demand forecast model for the Congressional National Surface
Transportation Policy and Revenue Study Commission in 2007
2The opinions expressed are solely those of the author and are not meant to represent positions of CUTR, USF, or HART.
Di l iDisclaimerWe haven’t been able to predictp Who will win the next election, Which movie or TV show will be popular, What will be the hot Christmas gift, or, Which stocks (if any) will do well this year.
The level of understanding and the amount of data di t l b h i h b b tt tregarding travel behavior has never been better, yet we
shouldn’t apologize for uncertainty regarding future travel forecastsforecasts.
But we should plan for uncertainty.
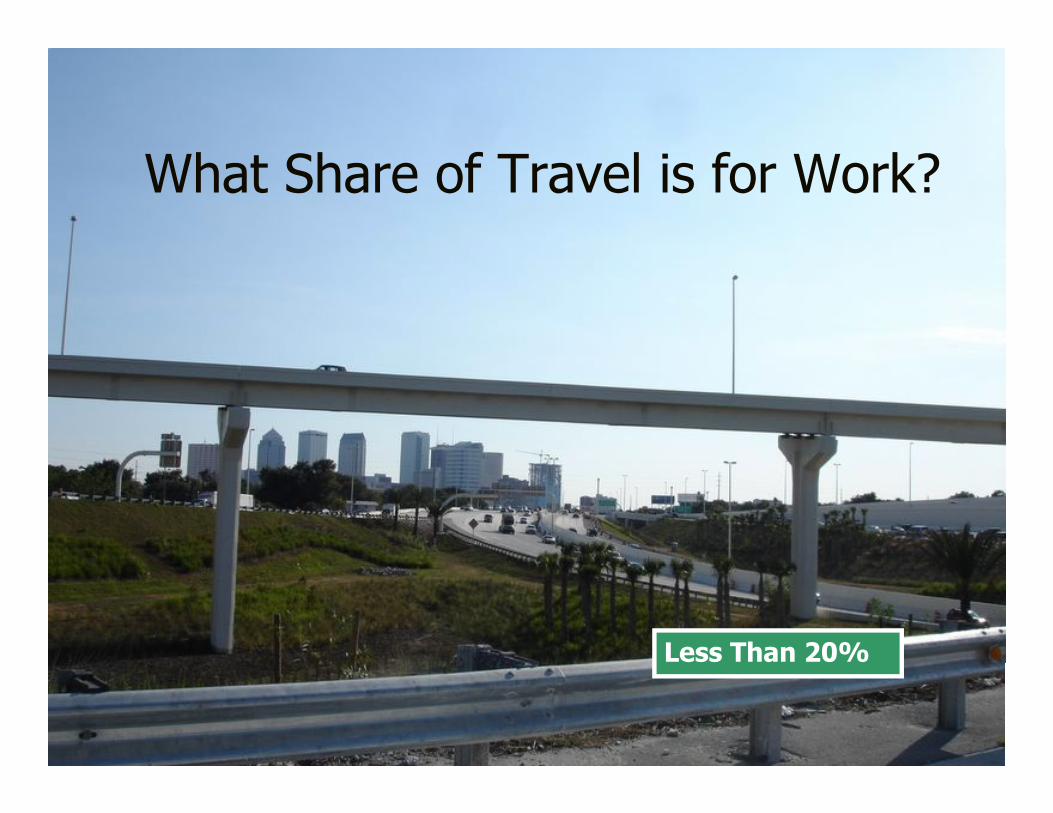
What Share of Travel is for Work?
Less Than 20%
4
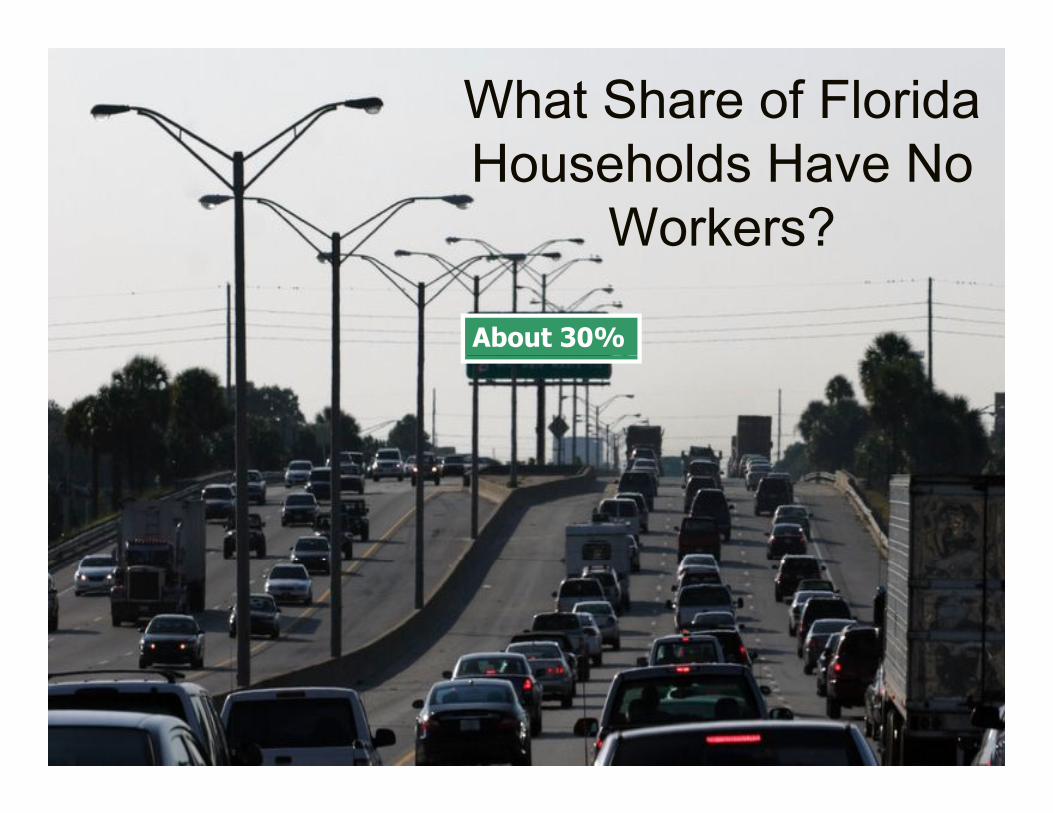
What Share of Florida H h ld H NHouseholds Have No
Workers?
About 30%
5
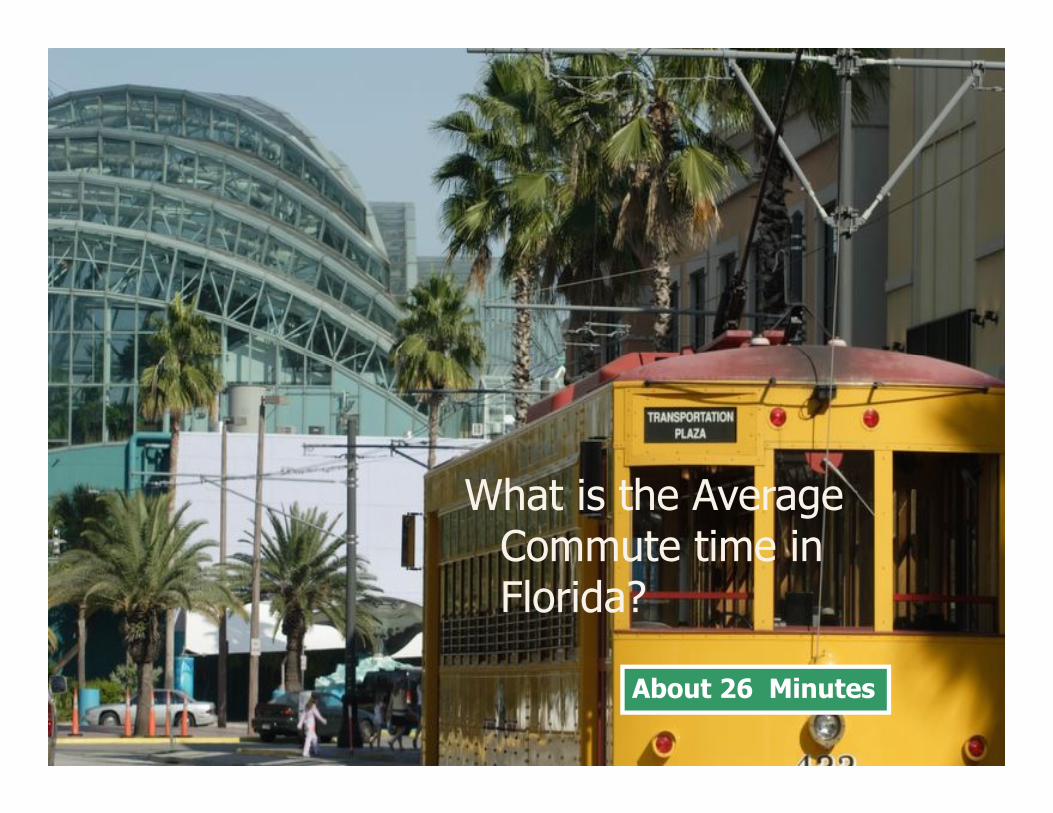
What is the Average Commute time inCommute time in Florida?
6About 26 Minutes
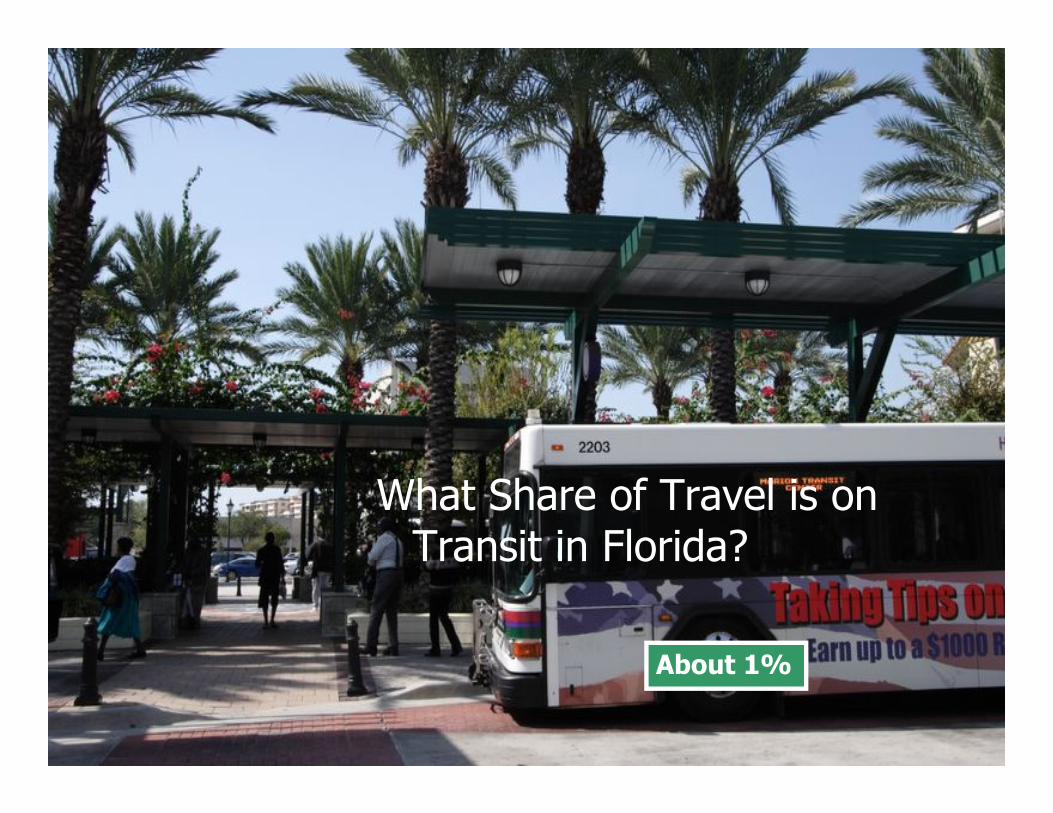
What Share of Travel is on Transit in Florida?Transit in Florida?
About 1%
7
About 1%
liOutlineh f l h Theory of Travel Behavior
Trends and Future Travel Demand?
Key Implications

Social and Economic Interactions CreateSocial and Economic Interactions CreateSocial and Economic Interactions Create Social and Economic Interactions Create Demand for TravelDemand for Travel
Growth in Specialization in Growth in Time
Income
Knowledge
Employment
Consumption Person Travel
CommerceKnowledge Social relationships
Time use Communication
Polzin, CUTR 2010
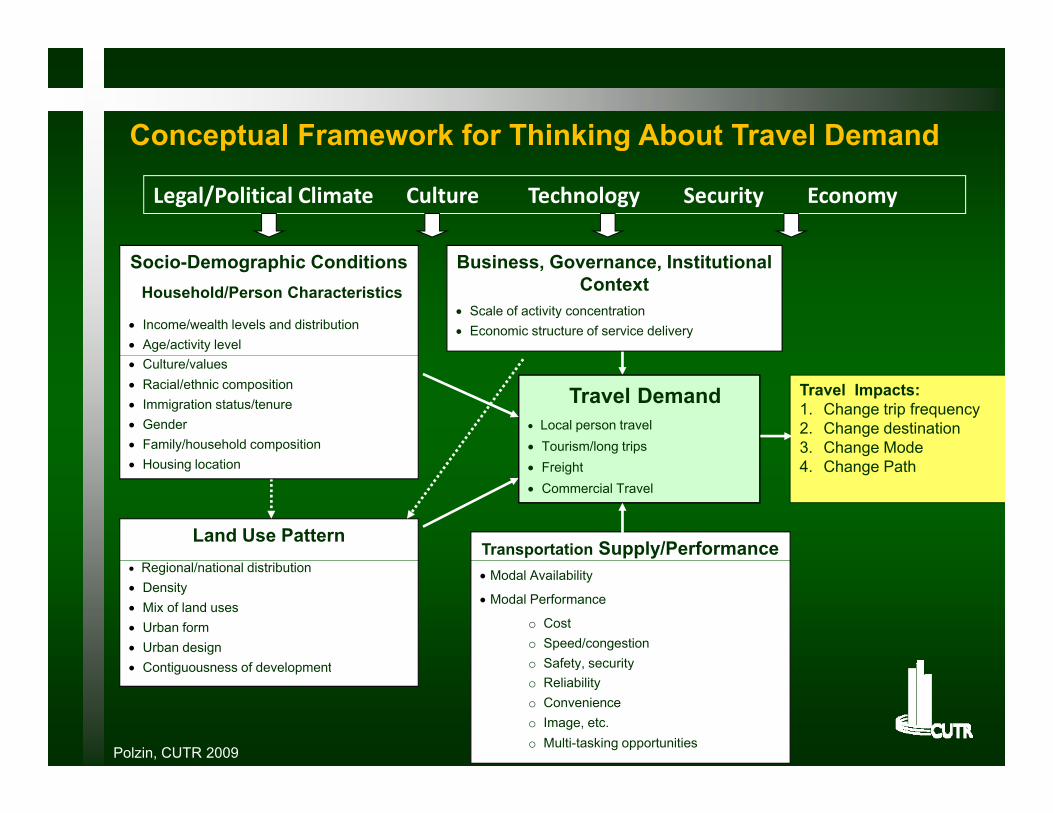
Conceptual Framework for Thinking About Travel Demandp g
Legal/Political Climate Culture Technology Security Economy
Socio-Demographic ConditionsHousehold/Person Characteristics
Income/wealth levels and distribution Age/activity level
Business, Governance, Institutional Context
Scale of activity concentration Economic structure of service delivery
Travel Demand Local person travel Tourism/long trips
Culture/values Racial/ethnic composition Immigration status/tenure Gender Family/household composition
Travel Impacts:1. Change trip frequency2. Change destination3. Change Mode
Land Use Pattern
Freight Commercial Travel
Housing location
Transportation Supply/Performance
4. Change Path
Regional/national distribution Density Mix of land uses Urban form Urban design
C ti f d l t
Modal Availability
Modal Performance
o Costo Speed/congestiono Safety security Contiguousness of development o Safety, securityo Reliabilityo Convenienceo Image, etc.o Multi-tasking opportunities
Polzin, CUTR 2009
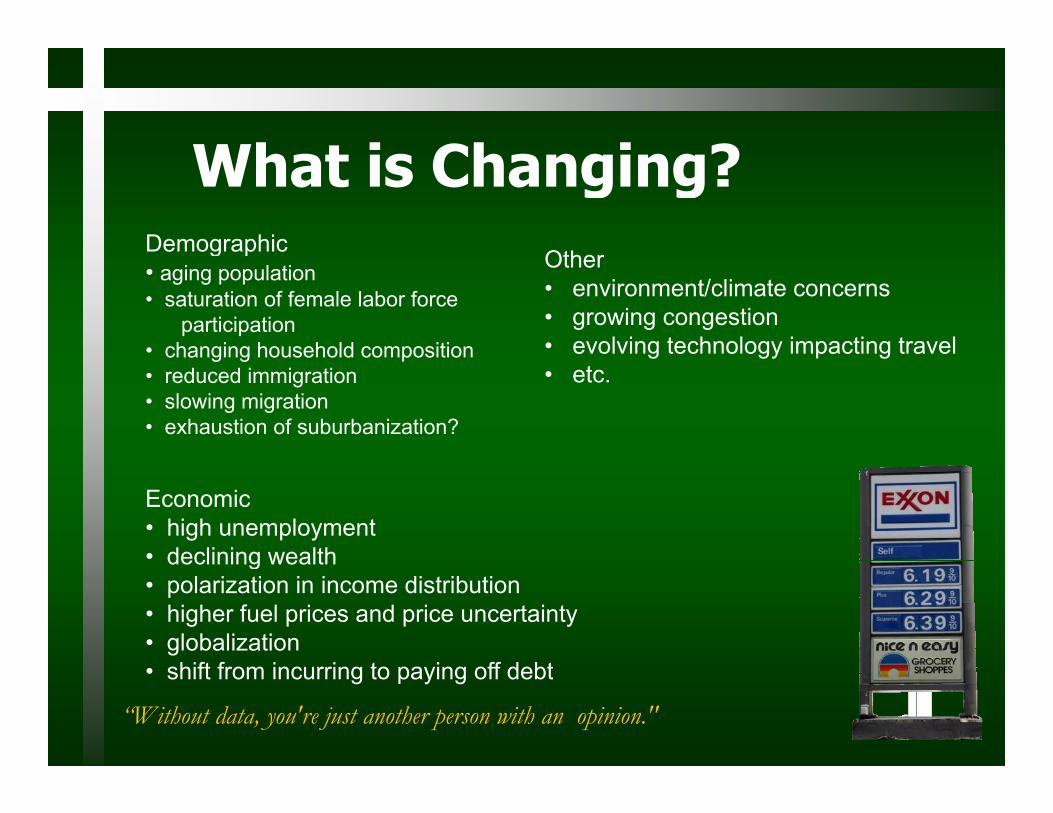
Wh t i Ch i ?What is Changing?Demographic
Othg p
• aging population• saturation of female labor force
participation• changing household composition
Other• environment/climate concerns• growing congestion • evolving technology impacting travelchanging household composition
• reduced immigration• slowing migration• exhaustion of suburbanization?
g gy p g• etc.
Economic• high unemployment• declining wealthdeclining wealth• polarization in income distribution• higher fuel prices and price uncertainty• globalization
hift f i i t i ff d bt
“Without data, you're just another person with an opinion."
• shift from incurring to paying off debt
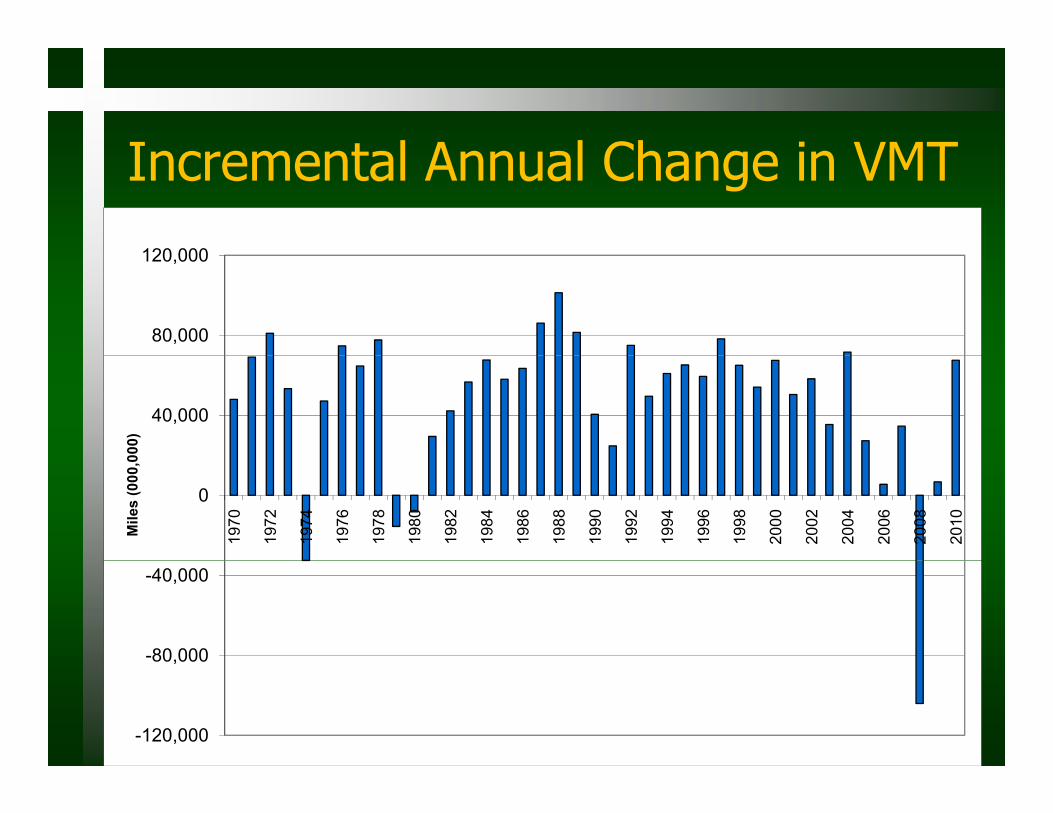
I t l A l Ch i VMTIncremental Annual Change in VMT120 000
80,000
120,000
40,000
000)
0
1970
1972
1974
1976
1978
1980
1982
1984
1986
1988
1990
1992
1994
1996
1998
2000
2002
2004
2006
2008
2010Mile
s (0
00,0
-80,000
-40,000
-120,000
,
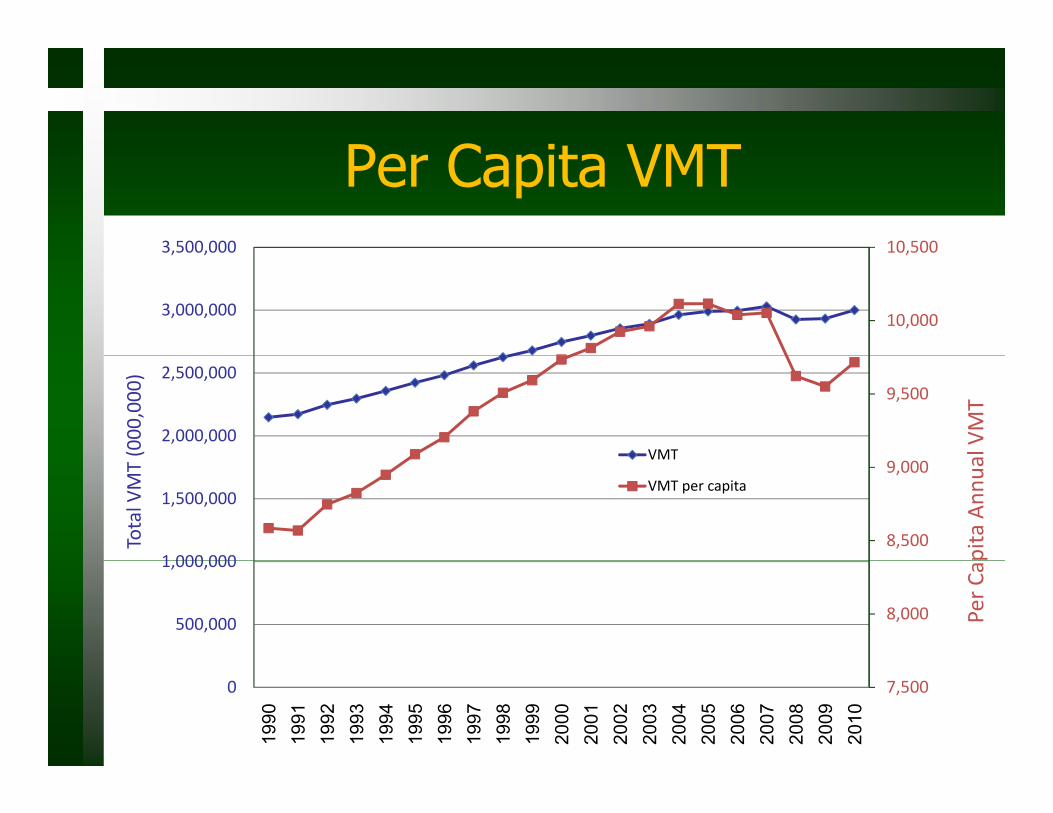
P C it VMTPer Capita VMT10,5003,500,000
10,000
,
3,000,000
, ,
9,500
2,000,000
2,500,000
al VMT
(000,000)
VMT
8,500
9,000
1 000 000
1,500,000
pita Ann
ua
Total V
MT
VMT
VMT per capita
8,000500,000
1,000,000
Per C
a
7,5000
1990
1991
1992
1993
1994
1995
1996
1997
1998
1999
2000
2001
2002
2003
2004
2005
2006
2007
2008
2009
2010
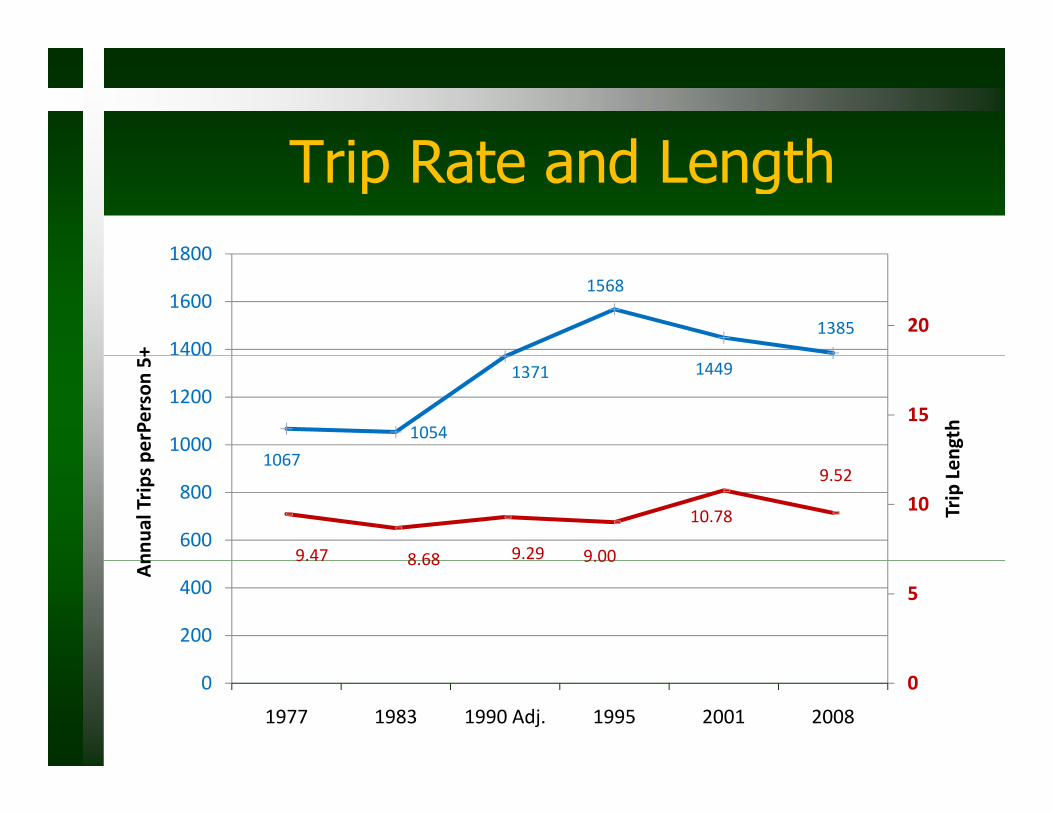
T ip Rate and LengthTrip Rate and Length1800
1568
1385 201400
1600
1800
+
1067
1054
1371 1449
151000
1200
400
ngth
perPerson 5+
1067
9.47 8 68 9.29 9.00
10.78
9.52
10
600
800
Trip Len
nnua
l Trips p
9.47 8.68 9.00
5
200
400
An
00
1977 1983 1990 Adj. 1995 2001 2008
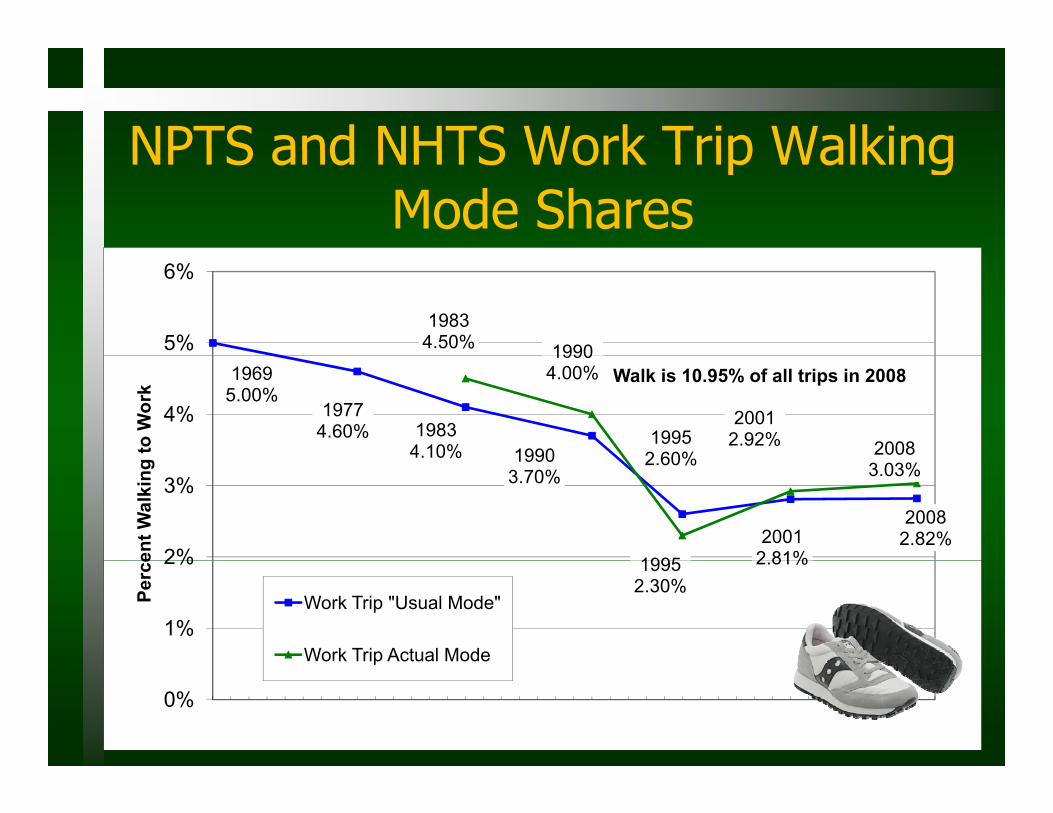
NPTS and NHTS Work Trip WalkingNPTS and NHTS Work Trip Walking Mode Shares
19834.50% 19905%
6%
19695.00%
19774.60% 1983
4.10% 19901995
2 60%
19904.00%
20012.92% 2008
4%
to W
ork
Walk is 10.95% of all trips in 2008
% 19903.70%
2.60%
20012 81%
20082.82%
1995
3.03%
2%
3%
ent W
alki
ng
2.81%19952.30%
1%
2%
Perc
e
Work Trip "Usual Mode"
Work Trip Actual Mode
0%
p
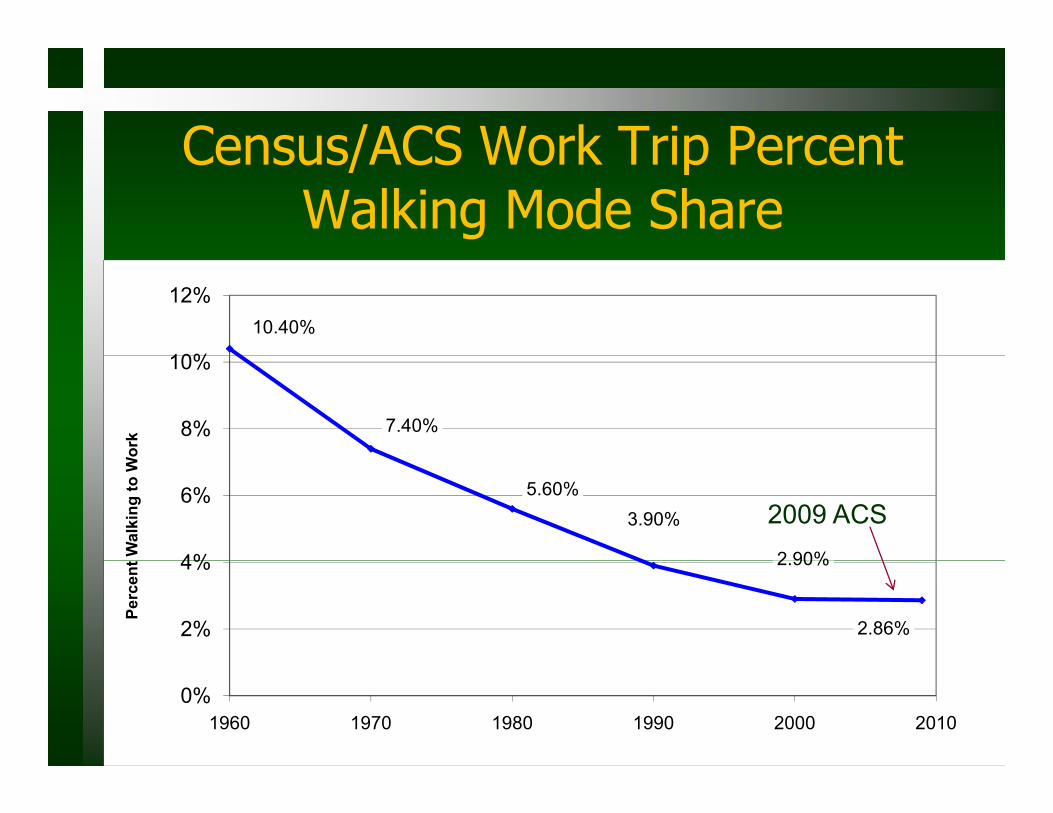
Census/ACS Work Trip PercentCensus/ACS Work Trip Percent Walking Mode Share
10.40%
10%
12%
7.40%8%
10%
Wor
k
5.60%3.90%
2 90%4%
6%
Wal
king
to W
2009 ACS2.90%
2.86%2%
4%
Perc
ent
0%1960 1970 1980 1990 2000 2010
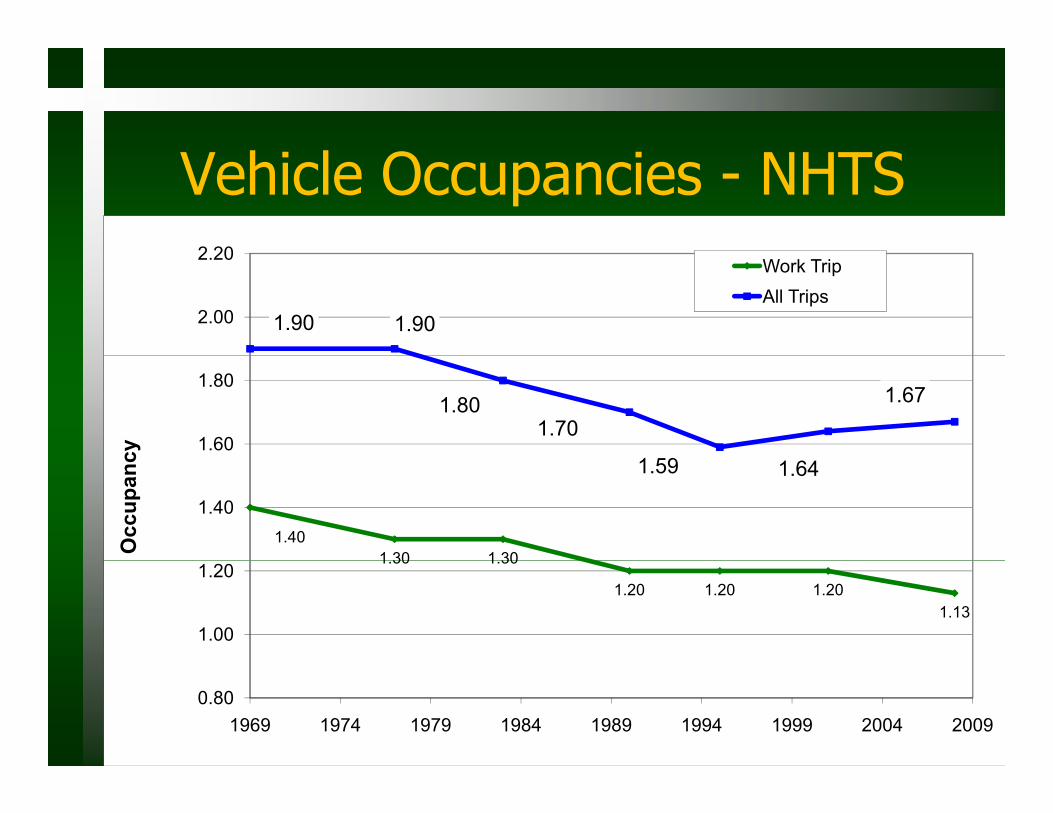
h lVehicle Occupancies - NHTS2 20
1.90 1.902.00
2.20Work Trip All Trips
1.801.70
1 9
1.67
1.60
1.80
cy
1.401 30 1 30
1.59 1.64
1.40
Occ
upan
c
1.30 1.30
1.20 1.20 1.201.13
1.00
1.20
0.801969 1974 1979 1984 1989 1994 1999 2004 2009
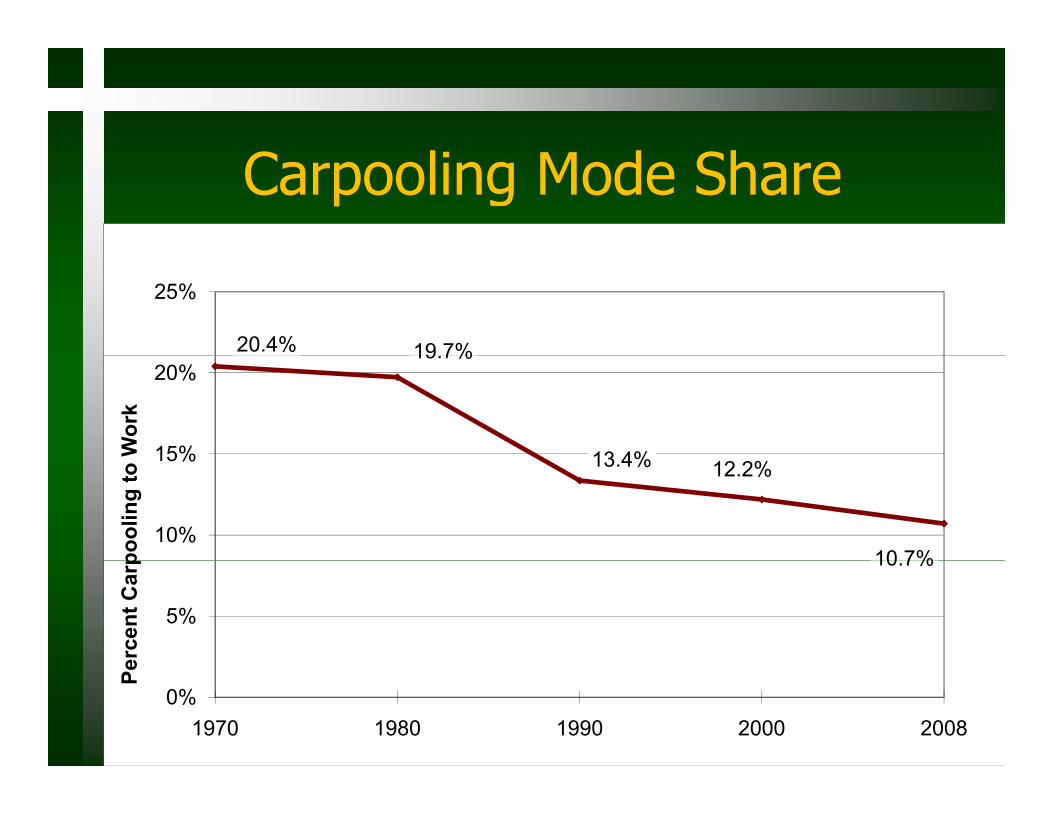
l d hCarpooling Mode Share
20.4% 19 7%
25%
19.7%
13 4%15%
20%
Wor
k
13.4% 12.2%
10 7%10%
15%
pool
ing
to
10.7%
5%
erce
nt C
arp
0%1970 1980 1990 2000 2008
Pe
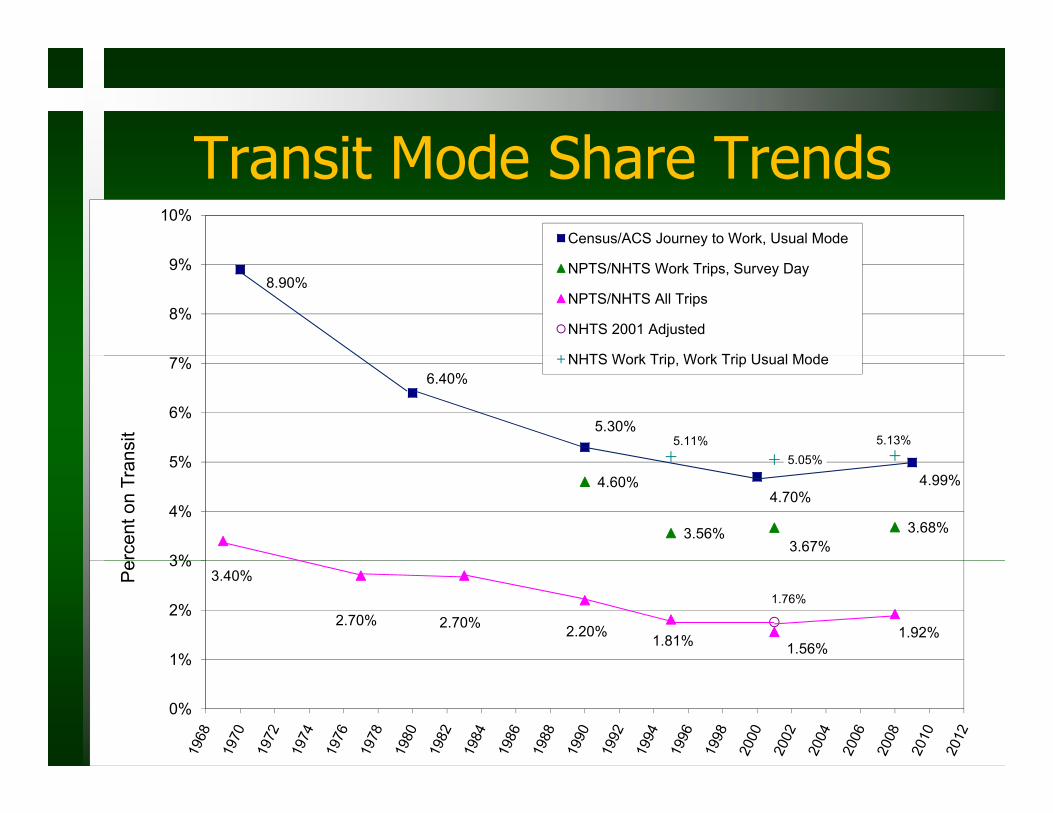
Transit Mode Share Trends10%
Census/ACS Journey to Work, Usual Mode
Transit Mode Share Trends
8.90%
8%
9% NPTS/NHTS Work Trips, Survey Day
NPTS/NHTS All Trips
NHTS 2001 Adjusted
NHTS W k T i W k T i U l M d6.40%
5.30%5.11%
5 05%5.13%
5%
6%
7%
nsit
NHTS Work Trip, Work Trip Usual Mode
4.70%4.99%4.60%
3.56%3.67%
3.68%
5.05%
3%
4%
5%
rcen
t on
Tran
3.40%
2.70% 2.70% 2.20% 1.81% 1.56%1.92%
1.76%
1%
2%
3%
Pe
0%
1%
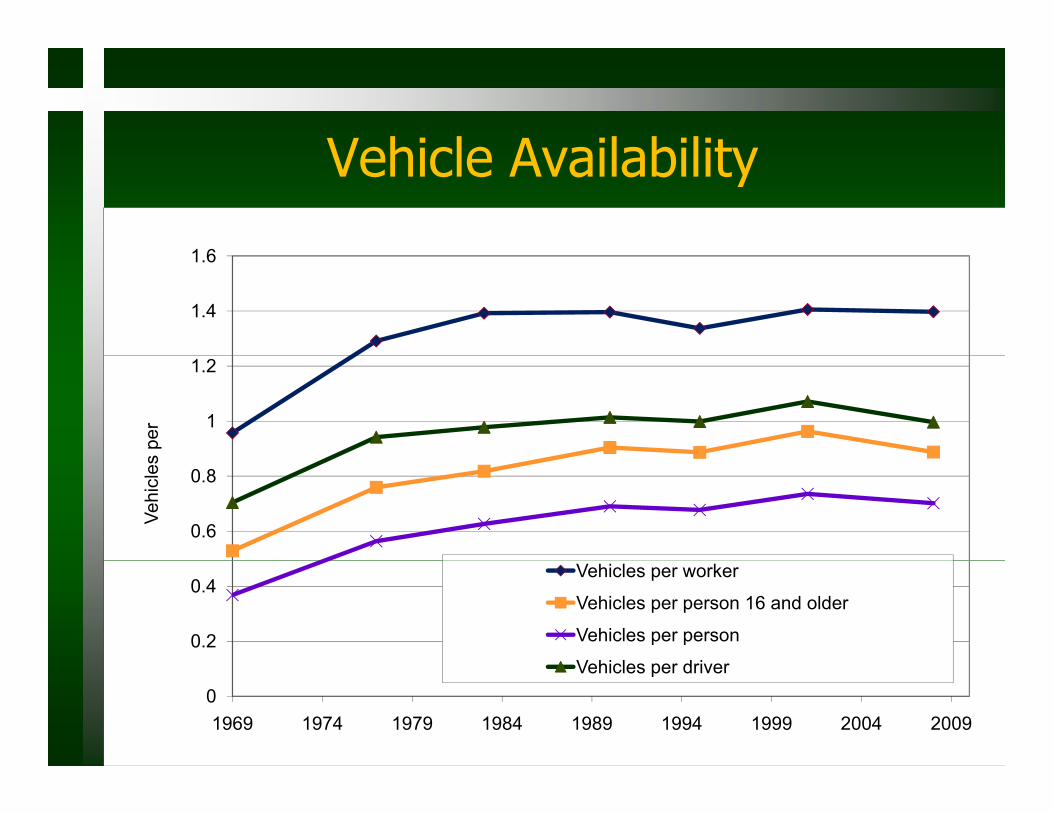
Vehicle AvailabilityVehicle Availability
1 6
1.4
1.6
1
1.2
s pe
r
0.6
0.8
Vehi
cles
0.2
0.4Vehicles per worker
Vehicles per person 16 and older
Vehicles per person
V hi l d i01969 1974 1979 1984 1989 1994 1999 2004 2009
Vehicles per driver
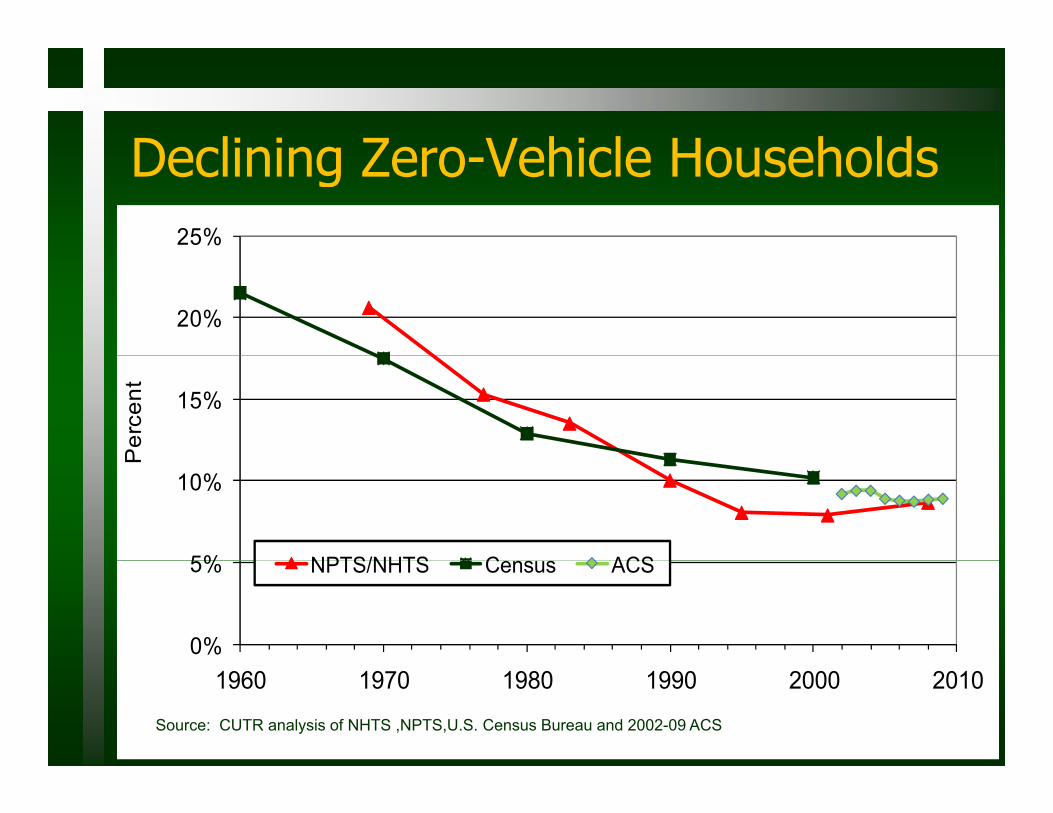
Declining Zero Vehicle HouseholdsDeclining Zero-Vehicle Households25%
20%
15%
Per
cent
5%
10%
P
NPTS/NHTS C ACS
0%
5% NPTS/NHTS Census ACS
1960 1970 1980 1990 2000 2010
Source: CUTR analysis of NHTS ,NPTS,U.S. Census Bureau and 2002-09 ACS
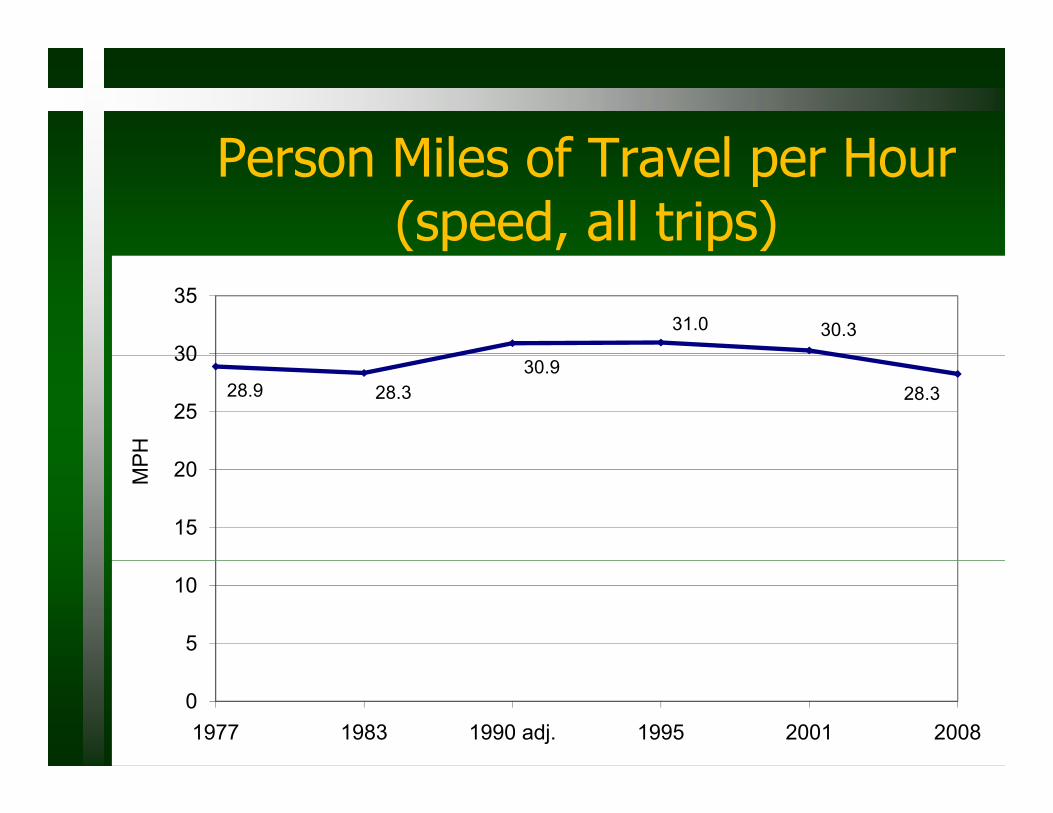
Person Miles of Travel per HourPerson Miles of Travel per Hour (speed, all trips)
31.0 30.330
35
28.9 28.330.9
28.325
30
PH
15
20MP
5
10
01977 1983 1990 adj. 1995 2001 2008
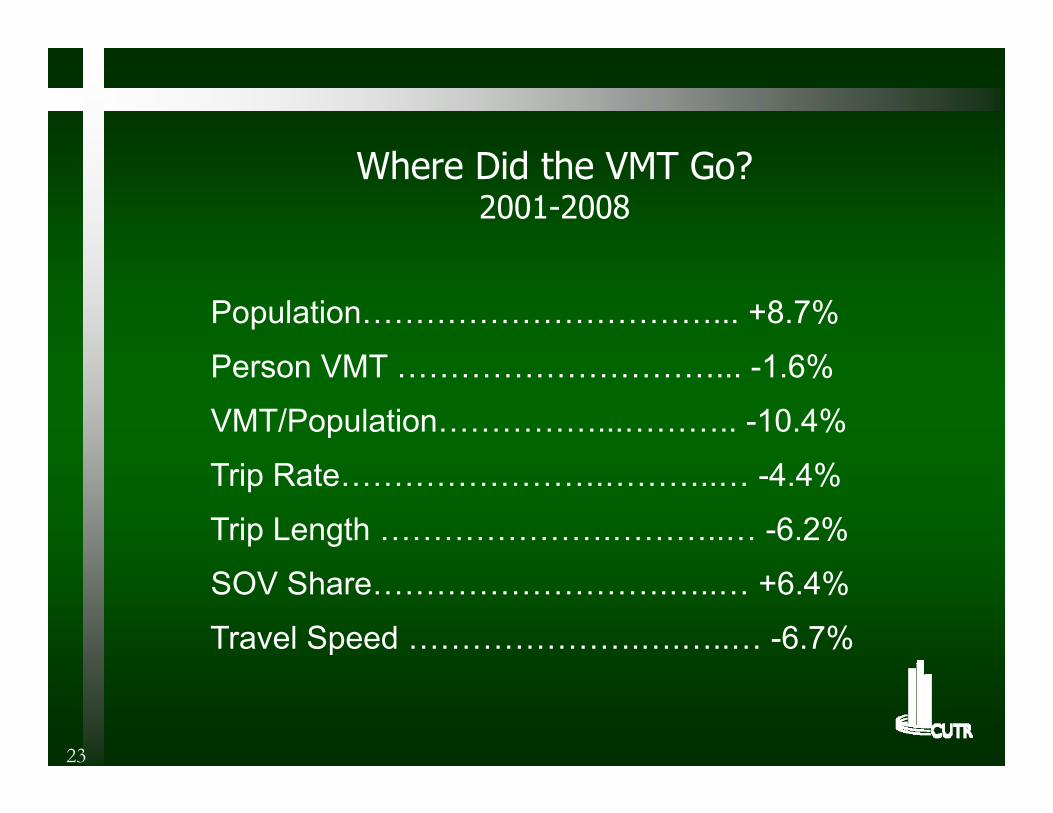
Where Did the VMT Go?2001-2008
Population……………………………... +8.7%
P VMT 1 6%Person VMT …………………………... -1.6%
VMT/Population……………...……….. -10.4%
Trip Rate…………………….………..… -4.4%
Trip Length ………………….………..… -6.2%
SOV Share……………………….…..… +6.4%
Travel Speed ………………….….…..… -6.7%
23
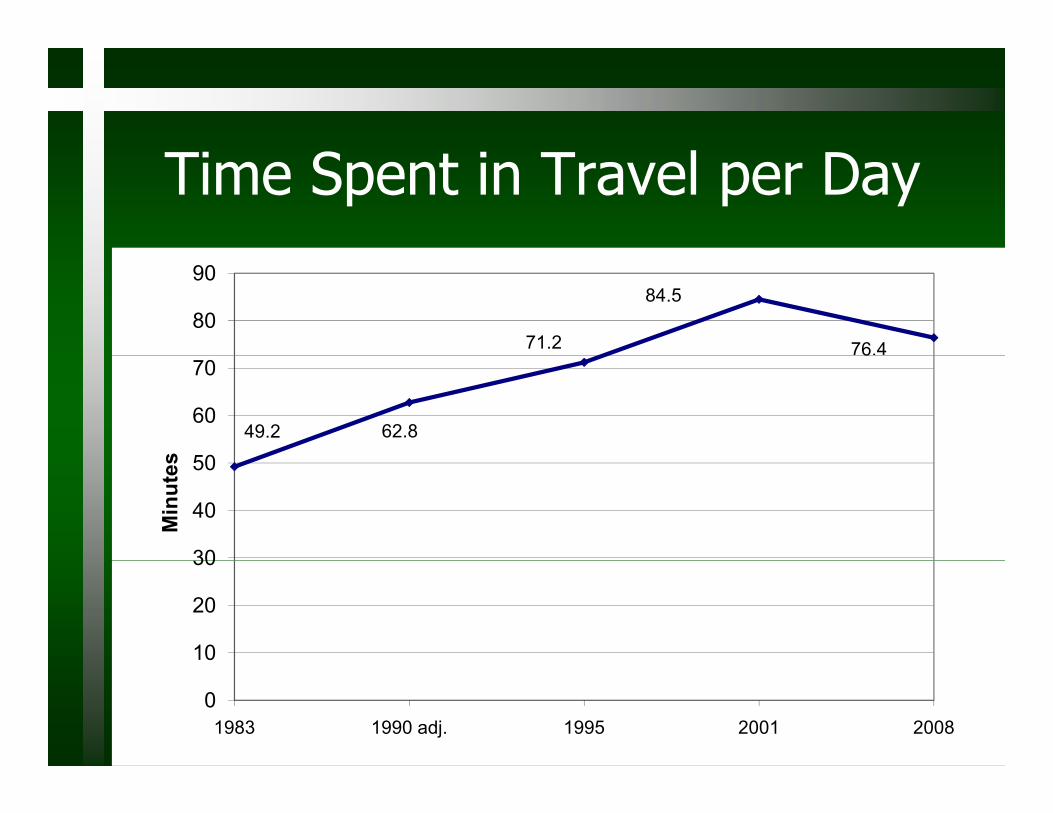
lTime Spent in Travel per Day
71.2
84.5
76.480
90
49.2 62.8
6
50
60
70
s
30
40
50
Min
utes
10
20
30
01983 1990 adj. 1995 2001 2008
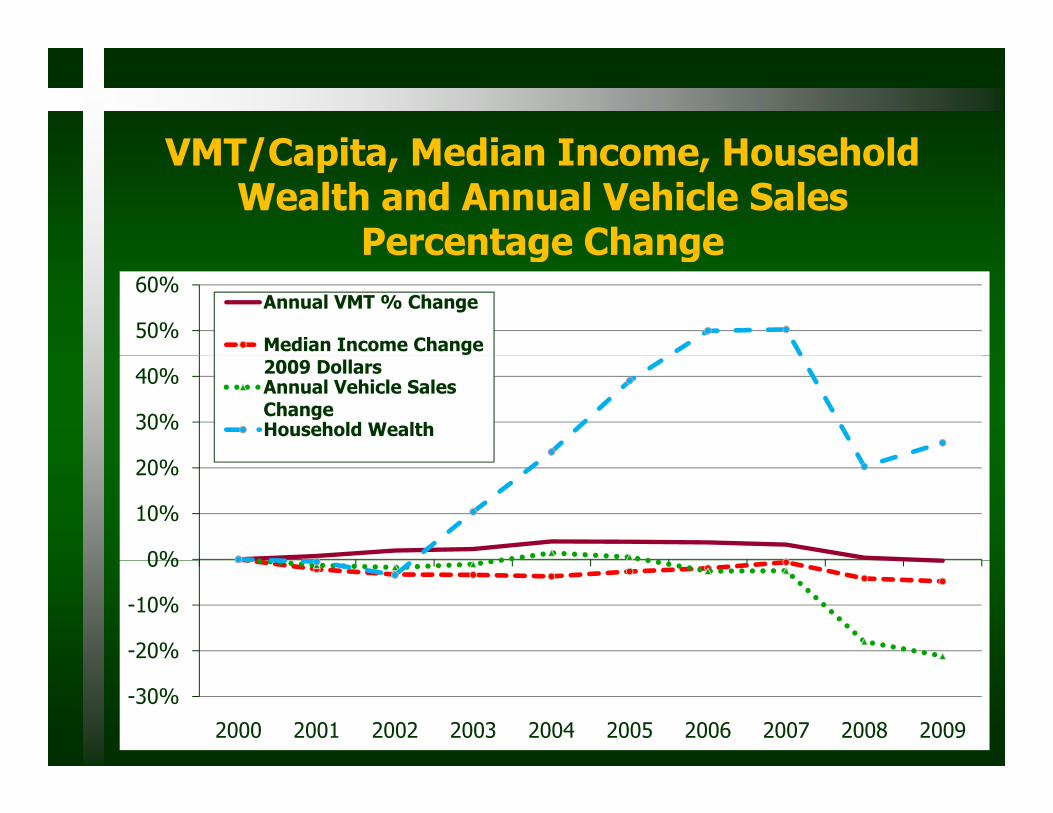
VMT/Capita Median Income HouseholdVMT/Capita, Median Income, Household Wealth and Annual Vehicle Sales
Percentage ChangePercentage Change
50%
60%Annual VMT % Change
Median Income Change
30%
40% 2009 DollarsAnnual Vehicle Sales ChangeHousehold Wealth
0%
10%
20%
-20%
-10%
0%
-30%
2000 2001 2002 2003 2004 2005 2006 2007 2008 2009
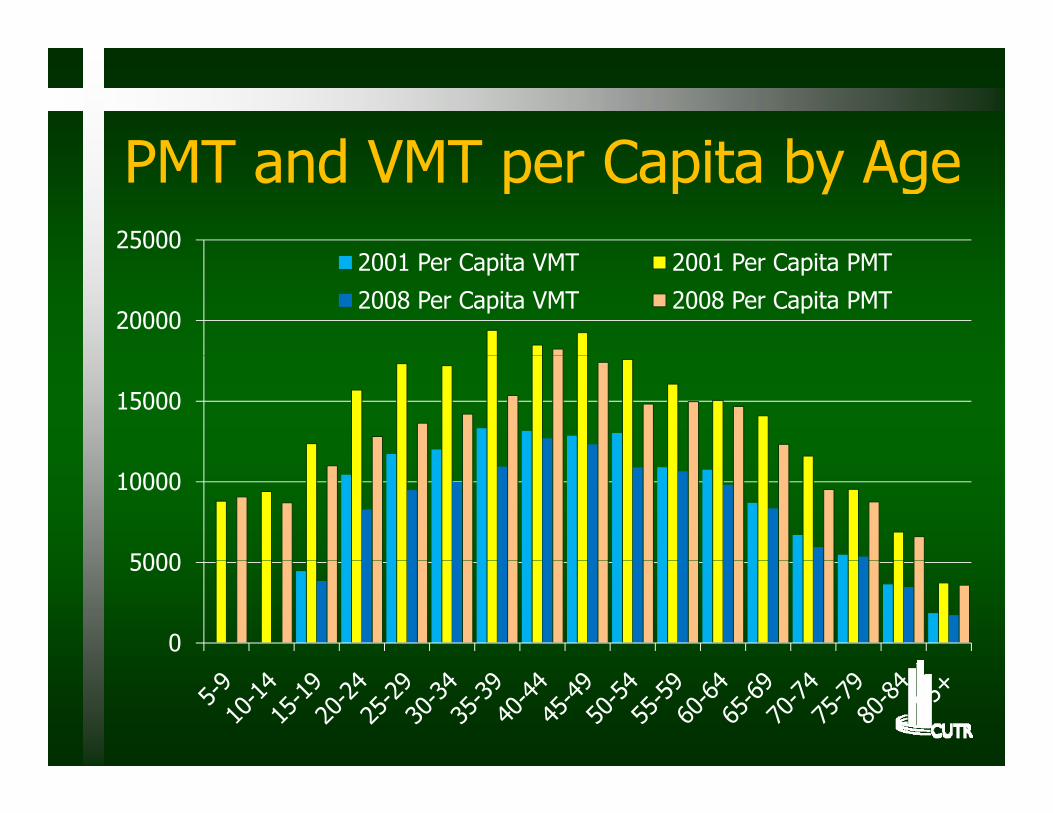
PMT and VMT pe Capita b AgePMT and VMT per Capita by Age25000
20000
2001 Per Capita VMT 2001 Per Capita PMT
2008 Per Capita VMT 2008 Per Capita PMT
15000
5000
10000
0
5000
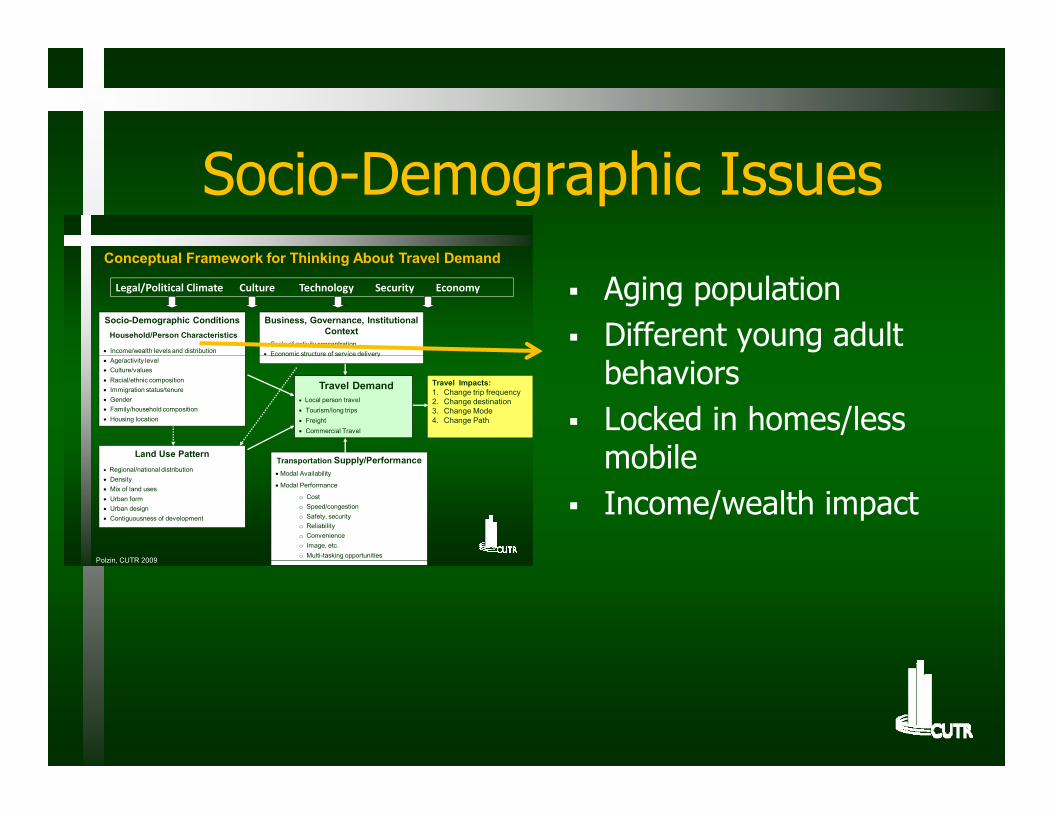
hSocio-Demographic IssuesC t l F k f Thi ki Ab t T l D d
Aging population Different young adult
Conceptual Framework for Thinking About Travel Demand
Socio-Demographic ConditionsHousehold/Person Characteristics
Income/wealth levels and distribution
Legal/Political Climate Culture Technology Security Economy
Business, Governance, Institutional Context
Scale of activity concentration Economic structure of service delivery
behaviors Locked in homes/less
mobileLand Use Pattern
Travel Demand Local person travel Tourism/long trips Freight Commercial Travel
Age/activity level Culture/values Racial/ethnic composition Immigration status/tenure Gender Family/household composition Housing location
T t ti S l /P f
Economic structure of service delivery
Travel Impacts:1. Change trip frequency2. Change destination3. Change Mode4. Change Path
mobile Income/wealth impact
Regional/national distribution Density Mix of land uses Urban form Urban design Contiguousness of development
Transportation Supply/Performance Modal Availability
Modal Performance
o Costo Speed/congestiono Safety, securityo Reliabilityo Convenienceo Image, etc.o Multi-tasking opportunities
Polzin CUTR 2009Polzin, CUTR 2009
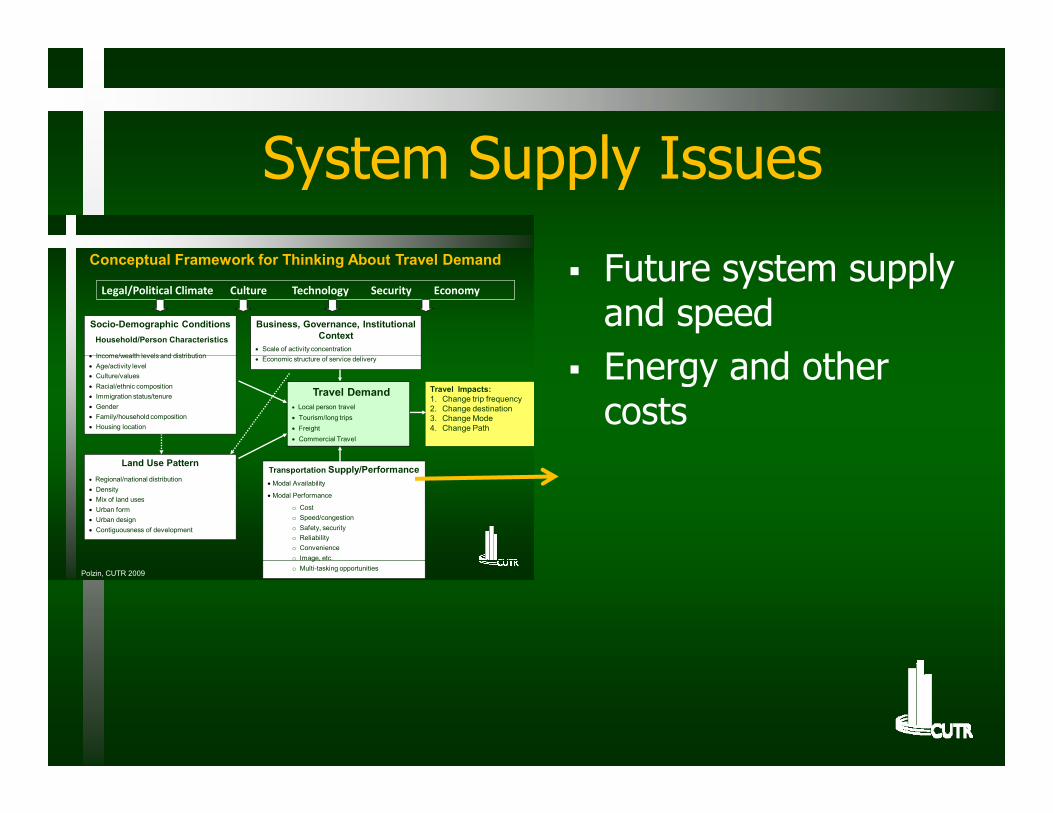
System Supply IssuesSystem Supply Issues
l Future system supply and speedE d th
Conceptual Framework for Thinking About Travel Demand
Socio-Demographic ConditionsHousehold/Person Characteristics
Income/wealth levels and distribution
Legal/Political Climate Culture Technology Security Economy
Business, Governance, Institutional Context
Scale of activity concentration
Energy and other costs
Travel Demand Local person travel Tourism/long trips Freight Commercial Travel
Income/wealth levels and distribution Age/activity level Culture/values Racial/ethnic composition Immigration status/tenure Gender Family/household composition Housing location
Economic structure of service delivery
Travel Impacts:1. Change trip frequency2. Change destination3. Change Mode4. Change Path
Land Use Pattern Regional/national distribution Density Mix of land uses Urban form Urban design Contiguousness of development
Transportation Supply/Performance Modal Availability
Modal Performance
o Costo Speed/congestiono Safety, securityo Reliabilityo Convenienceo Image, etc.g ,o Multi-tasking opportunities
Polzin, CUTR 2009
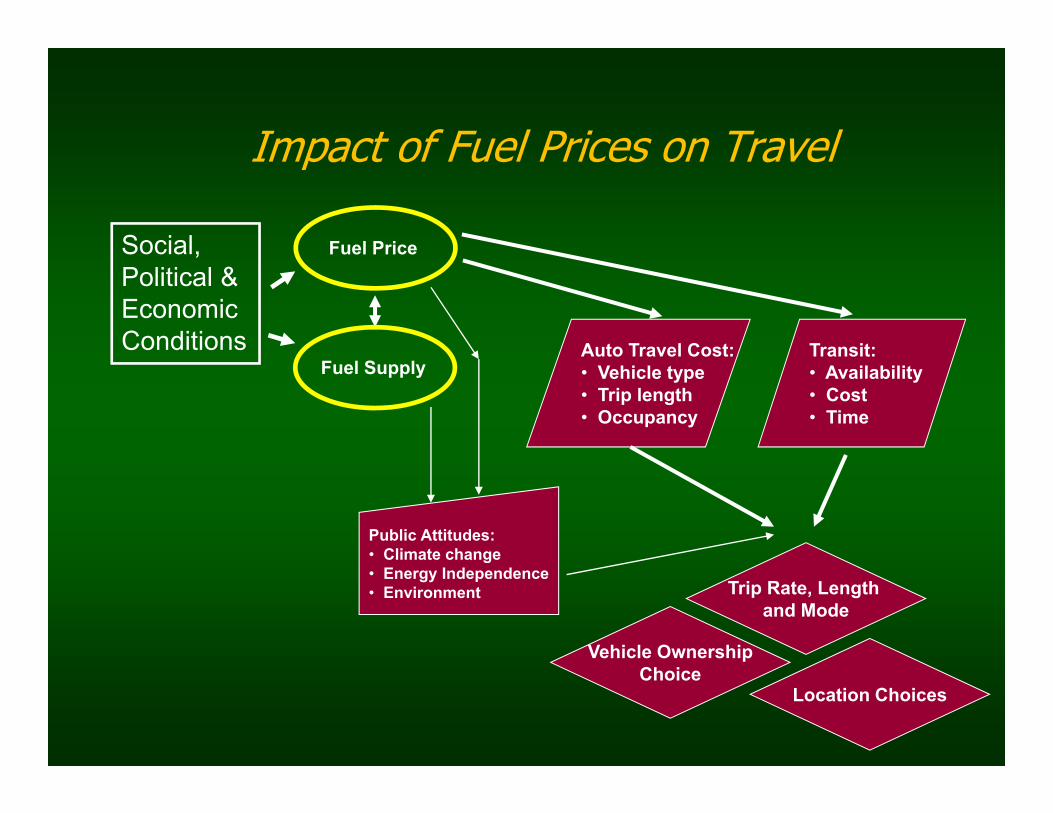
Impact of Fuel Prices on TravelImpact of Fuel Prices on Travel
Social, Fuel PriceSocial, Political & EconomicConditions
Fuel Price
Transit:Auto Travel Cost:Fuel Supply
Transit:• Availability• Cost• Time
Auto Travel Cost:• Vehicle type• Trip length• Occupancy
Public Attitudes: • Climate change
Trip Rate, Length and Mode
g• Energy Independence• Environment
Vehicle Ownership
Location ChoicesChoice
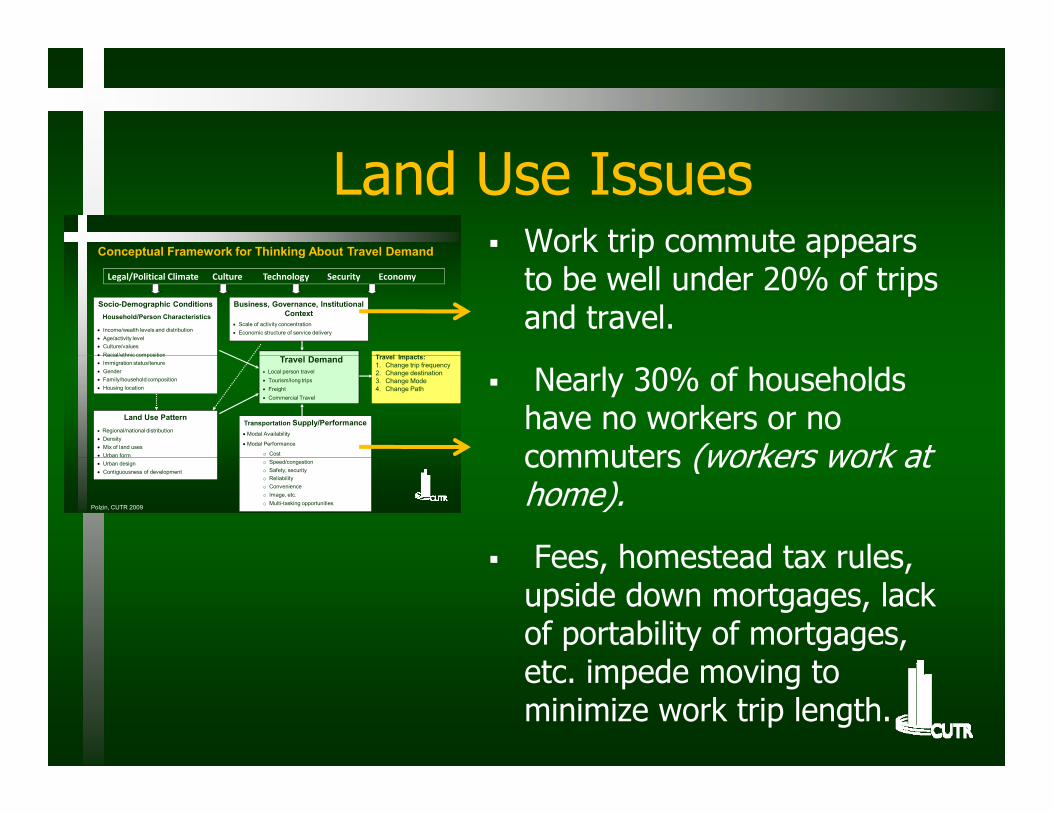
dLand Use Issues Work trip commute appears Conceptual Framework for Thinking About Travel Demand p pp
to be well under 20% of trips and travel.
Conceptual Framework for Thinking About Travel Demand
Socio-Demographic ConditionsHousehold/Person Characteristics
Income/wealth levels and distribution Age/activity level Culture/values Racial/ethnic composition
Legal/Political Climate Culture Technology Security Economy
Business, Governance, Institutional Context
Scale of activity concentration Economic structure of service delivery
T l I t
Nearly 30% of households have no workers or no commuters (workers work at
Land Use Pattern Regional/national distribution Density Mix of land uses Urban form
Travel Demand Local person travel Tourism/long trips Freight Commercial Travel
Racial/ethnic composition Immigration status/tenure Gender Family/household composition Housing location
Transportation Supply/Performance Modal Availability
Modal Performance
o Cost
Travel Impacts:1. Change trip frequency2. Change destination3. Change Mode4. Change Path
commuters (workers work at home).
Fees homestead tax rules
Urban design Contiguousness of development
o Speed/congestiono Safety, securityo Reliabilityo Convenienceo Image, etc.o Multi-tasking opportunities
Polzin, CUTR 2009
Fees, homestead tax rules, upside down mortgages, lack of portability of mortgages, t i d i tetc. impede moving to
minimize work trip length.
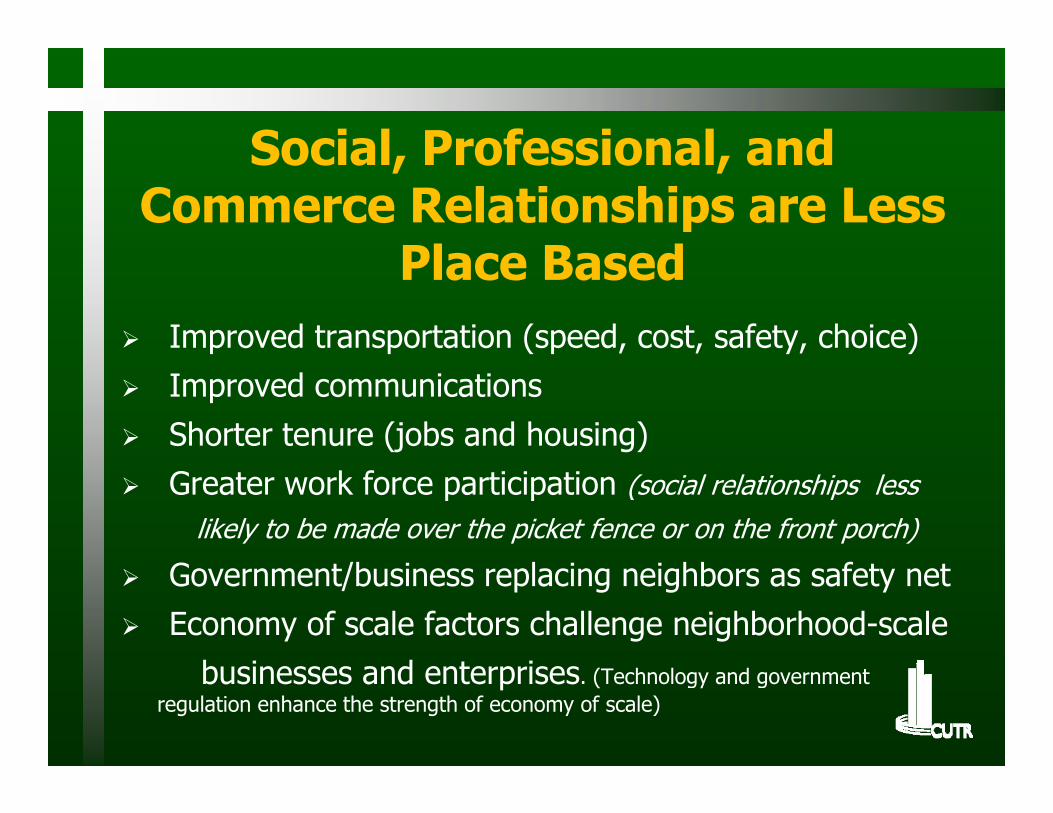
Social Professional andSocial, Professional, and Commerce Relationships are Less
Place BasedPlace Based Improved transportation (speed, cost, safety, choice) Improved communications Shorter tenure (jobs and housing) Greater work force participation (social relationships less
likely to be made over the picket fence or on the front porch)
Government/business replacing neighbors as safety net Economy of scale factors challenge neighborhood-scale
b i d t ibusinesses and enterprises. (Technology and government regulation enhance the strength of economy of scale)
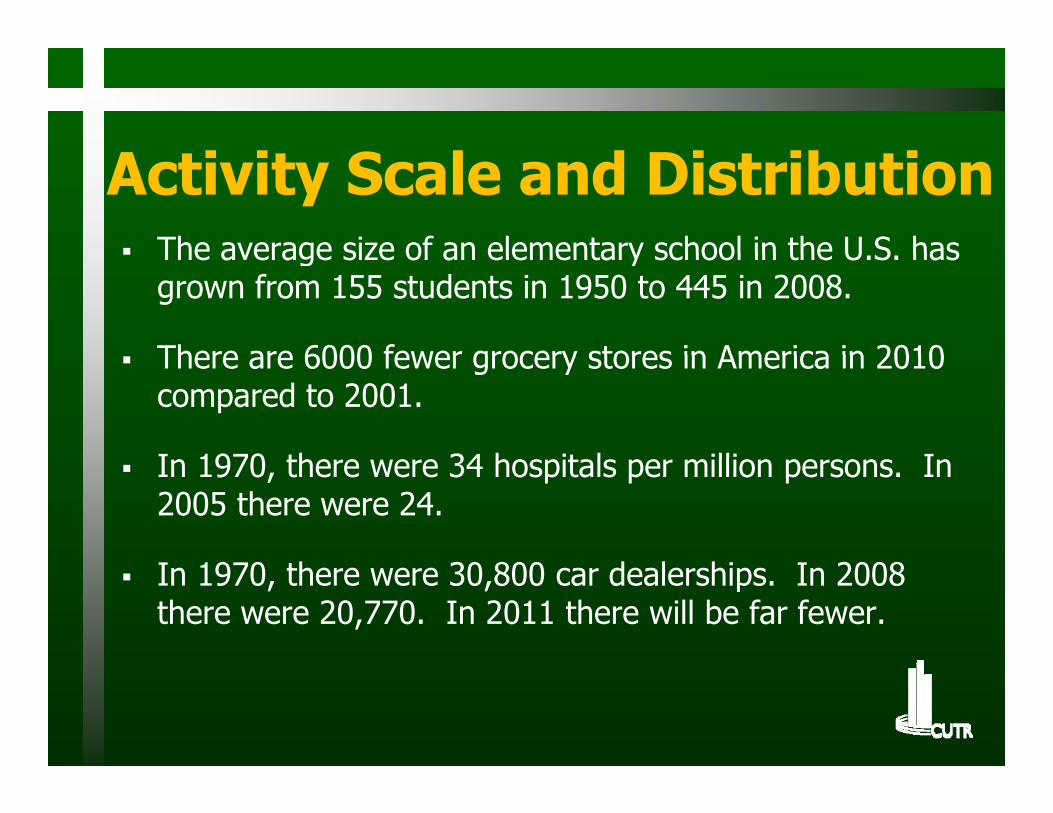
i i l d i ib iActivity Scale and Distribution The average size of an elementary school in the U S has The average size of an elementary school in the U.S. has
grown from 155 students in 1950 to 445 in 2008.
There are 6000 fewer grocery stores in America in 2010 There are 6000 fewer grocery stores in America in 2010 compared to 2001.
I 1970 th 34 h it l illi I In 1970, there were 34 hospitals per million persons. In 2005 there were 24.
In 1970, there were 30,800 car dealerships. In 2008 there were 20,770. In 2011 there will be far fewer.
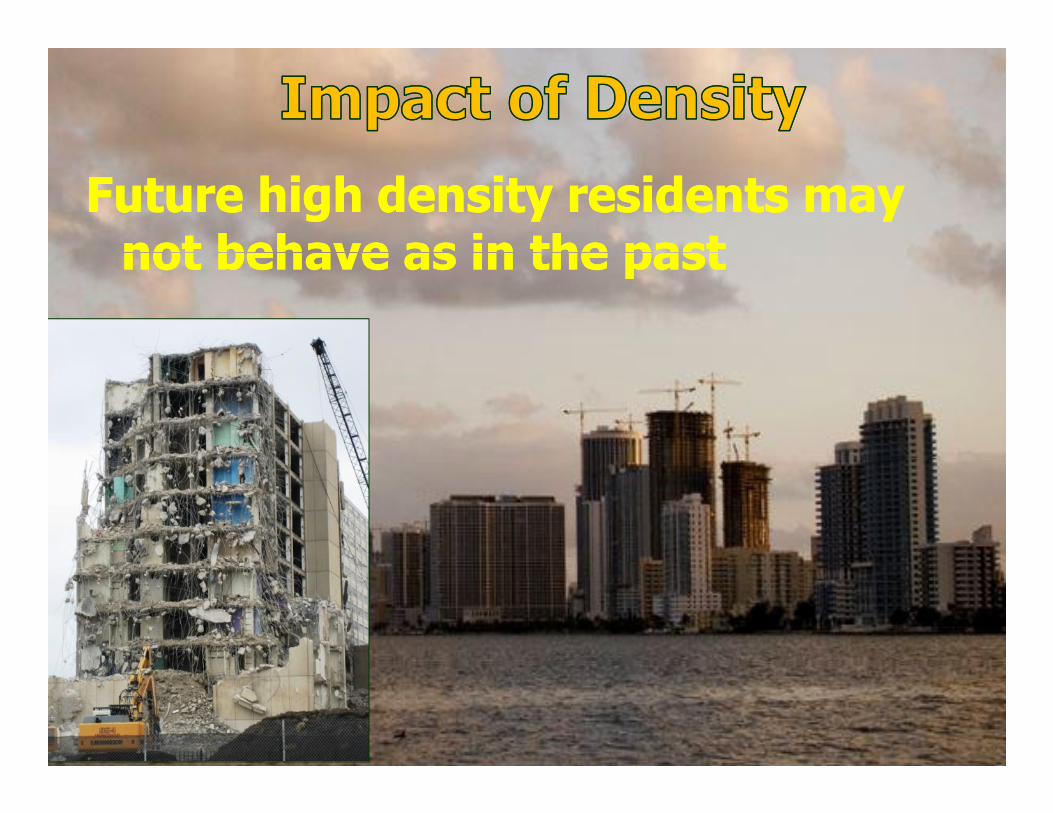
Impact of DensitImpact of DensityFuture high density residents may Future high density residents may not behave as in the pastnot behave as in the pastnot behave as in the pastnot behave as in the past
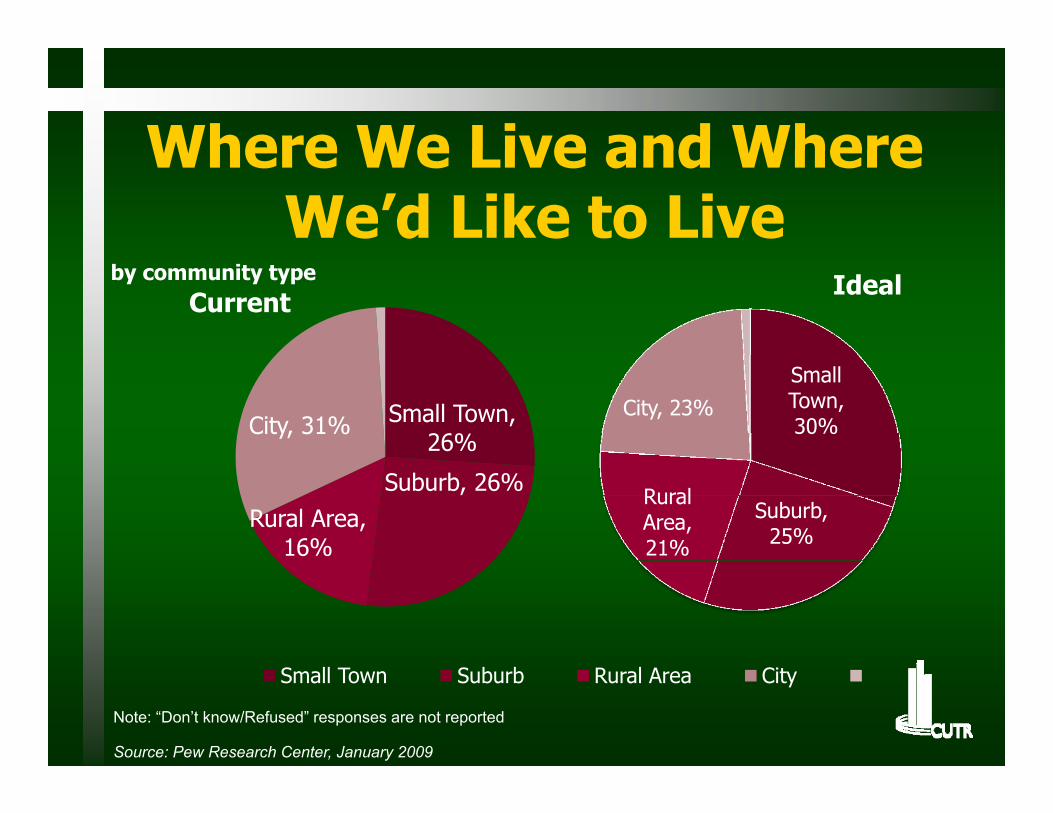
Where We Live and WhereWhere We Live and Where We’d Like to Live
CurrentIdealby community type
Small Town, 26%
City, 31%
Small Town, 30%
City, 23%
Suburb, 26%Rural Area,
16%
Suburb, 25%
Rural Area, 21%
Note: “Don’t know/Refused” responses are not reported
Small Town Suburb Rural Area City
Source: Pew Research Center, January 2009
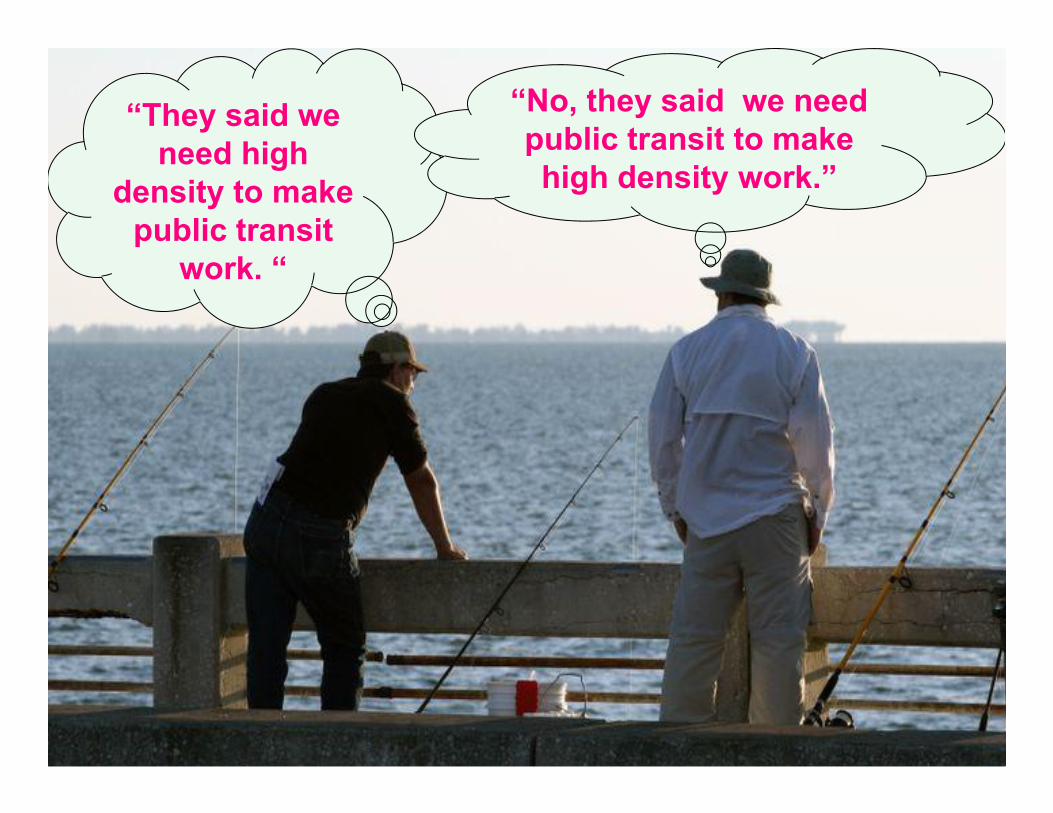
“They said we need high
“No, they said we need public transit to make need high
density to make public transit
phigh density work.”
work. “
35
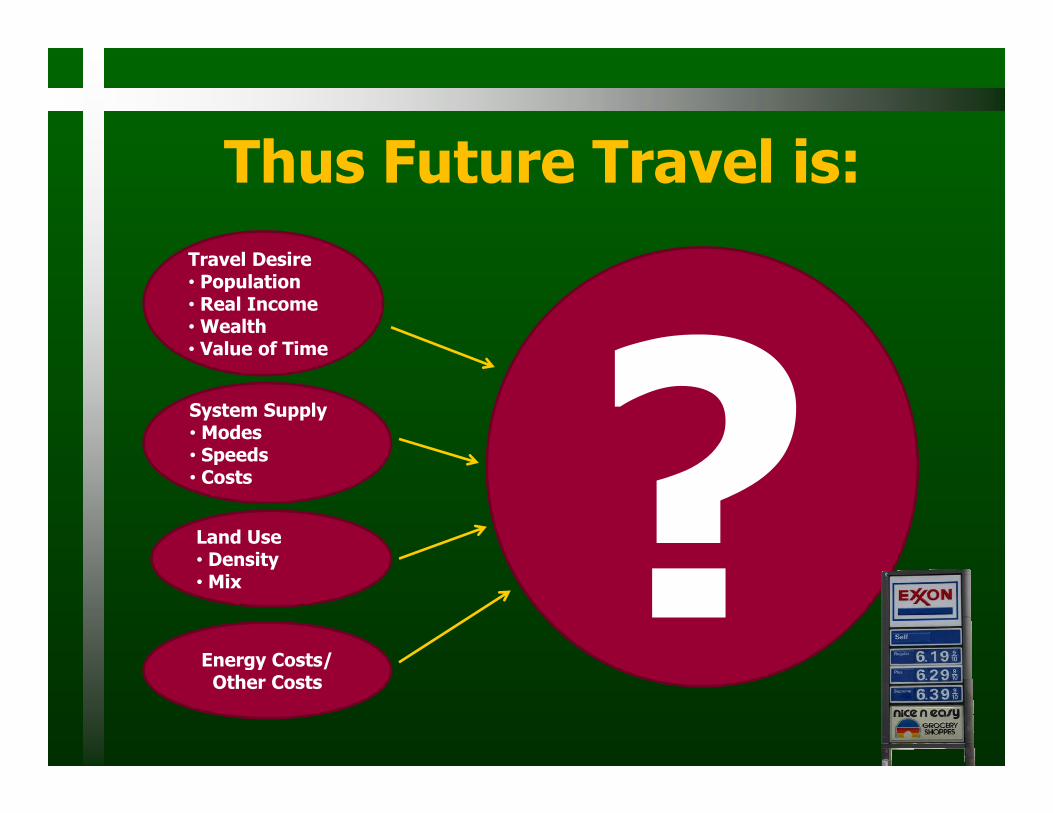
Th s F t e T a el isThus Future Travel is:T l D iTravel Desire• Population• Real Income• Wealth• Value of Timea ue o e
System Supply• Modes• Speeds
Land Use• Density
Speeds• Costs
Energy Costs/
• Density• Mix
Energy Costs/Other Costs
Thank YouThank You
Steven E. Polzin, Ph.D.Steven E. Polzin, [email protected]@cutr.usf.edu813813--974974--9849 (w)9849 (w)813813--416416--7517 (c)7517 (c)