Embed Size (px)
Citation preview

Trends in World Food Supply
Technology has decreased acreage needed per person. With modern agriculture, about 0.1 ha/person.
Number of people experiencing famine has decreased since 1950.
Rapid increases in developing world population mean that greater per-acre yields will be necessary.
0
1
2
3
4
5
6
7
8
9
10
1960 1970 1980 1990 2000
Year
Po
pu
lati
on
/ha
E.S.E. Asia
S. Asia
S. America
N. America
Sub-sahara Africa
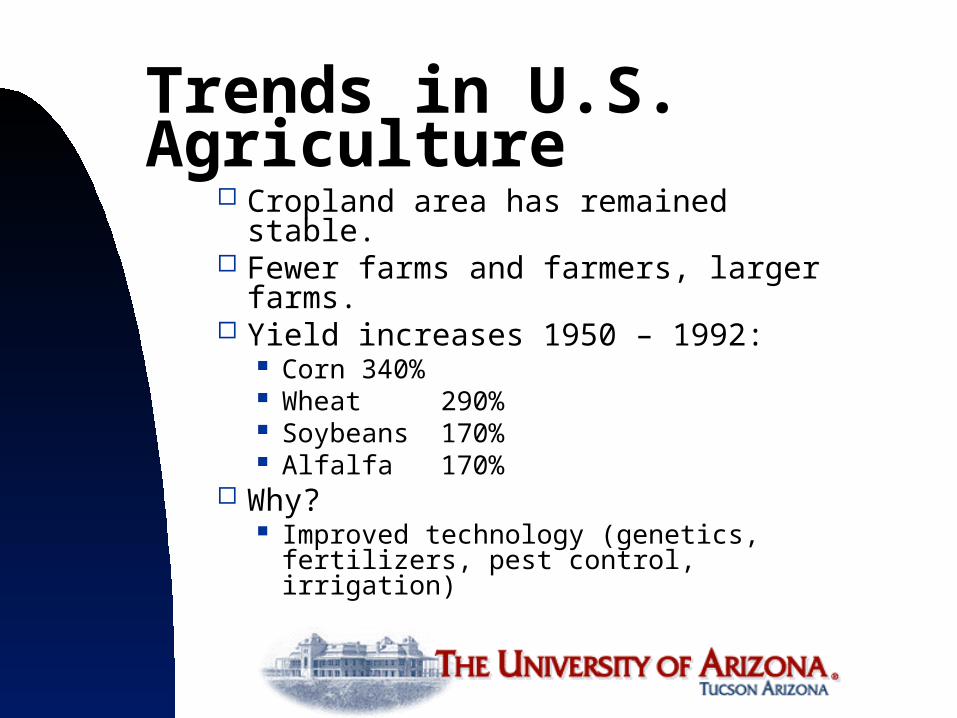
Trends in U.S. Agriculture
Cropland area has remained stable. Fewer farms and farmers, larger
farms. Yield increases 1950 – 1992:
Corn 340% Wheat 290% Soybeans 170% Alfalfa 170%
Why? Improved technology (genetics,
fertilizers, pest control, irrigation)
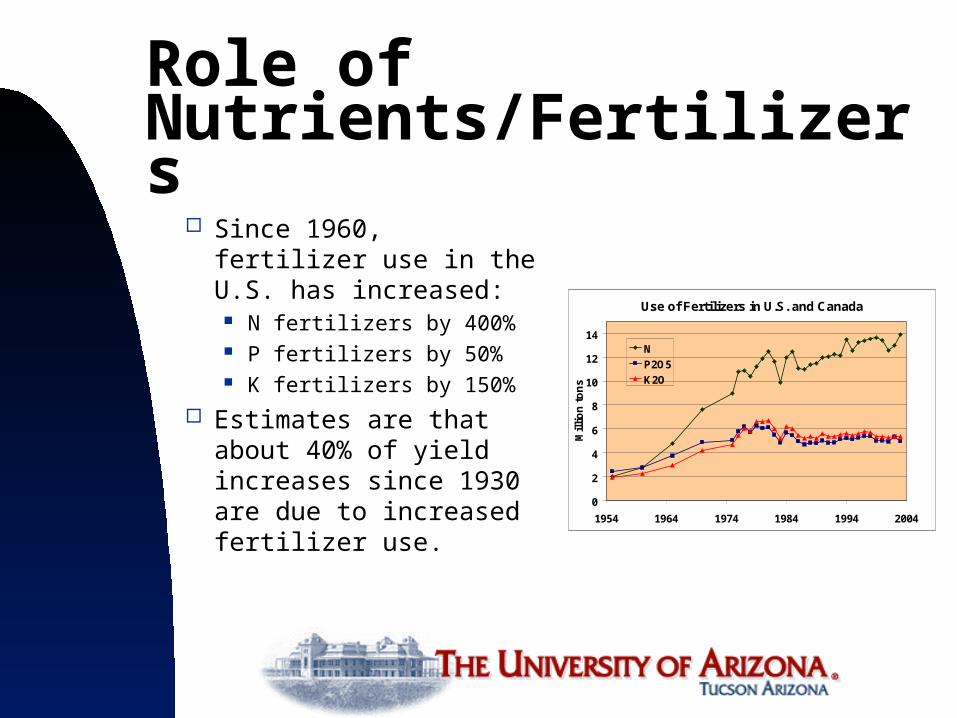
Role of Nutrients/Fertilizers
Since 1960, fertilizer use in the U.S. has increased:
N fertilizers by 400% P fertilizers by 50% K fertilizers by 150%
Estimates are that about 40% of yield increases since 1930 are due to increased fertilizer use.
Use of Fertilizers in U.S. and Canada
0
2
4
6
8
10
12
14
1954 1964 1974 1984 1994 2004
Mil
lio
n t
on
s
N
P2O5
K2O
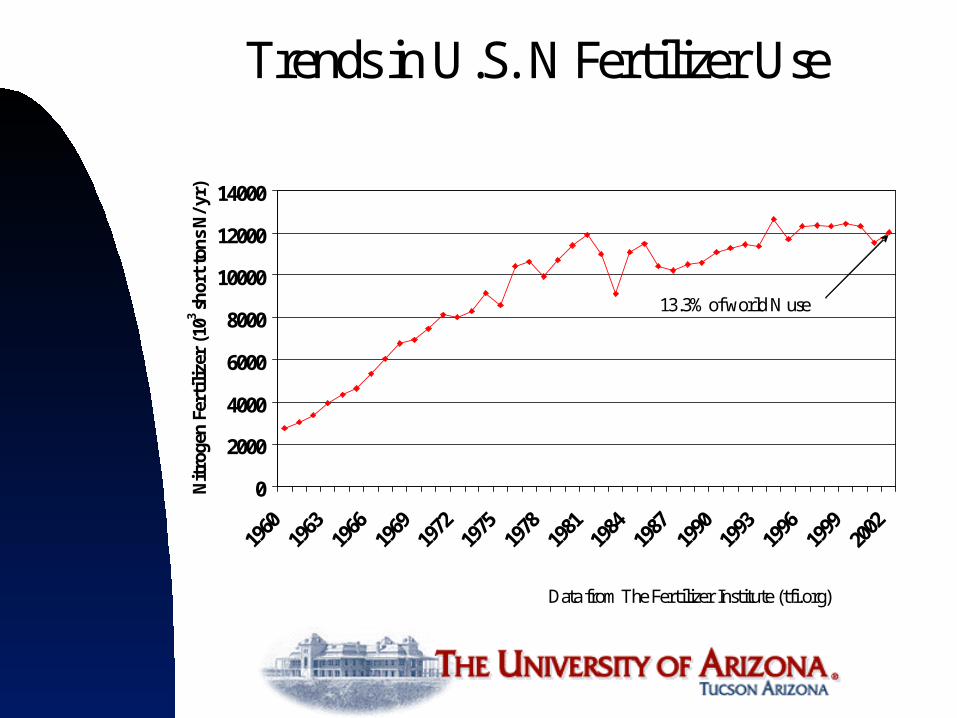
Trends in U.S. N Fertilizer Use
0
2000
4000
6000
8000
10000
12000
14000
1960
1963
1966
1969
1972
1975
1978
1981
1984
1987
1990
1993
1996
1999
2002
Nitro
gen
Fert
ilize
r (1
03 sho
rt to
ns N
/yr)
Data from The Fertilizer Institute (tfi.org)
13.3% of world N use

Average Wheat and Rice yields in China, 221 BC - 1999
Fertilizer use in China, 1950-1999
0
5,000
10,000
15,000
20,000
25,000
1950 1957 1964 1971 1978 1985 1992 1999
'000
t
N
P2O5
K2O
0
1,000
2,000
3,000
4,000
5,000
6,000
Yie
ld, kg
/ha
Wheat
Rice
PPIC, FAO 2002

0
50
100
150
200
250
300
1960 1970 1980 1990 2000
WorldDeveloping CountriesDeveloped CountriesChinaIndia
NPK consumption, kg/ha
IFA, 2001

Key Soil Fertility Concepts
SWES 316Section B
Outline for First Section Today
Defining soil fertility What makes soils fertile? Define growth curves Define response curves Evaluating outcomes of
nutrient management The “law of the minimum”
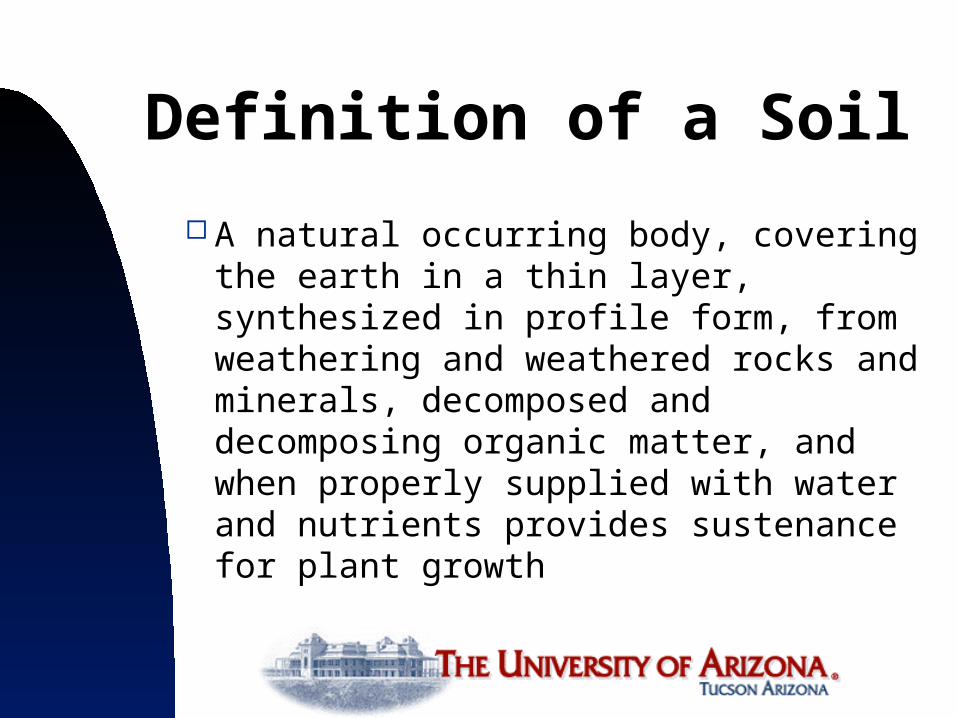
Definition of a Soil
A natural occurring body, covering the earth in a thin layer, synthesized in profile form, from weathering and weathered rocks and minerals, decomposed and decomposing organic matter, and when properly supplied with water and nutrients provides sustenance for plant growth
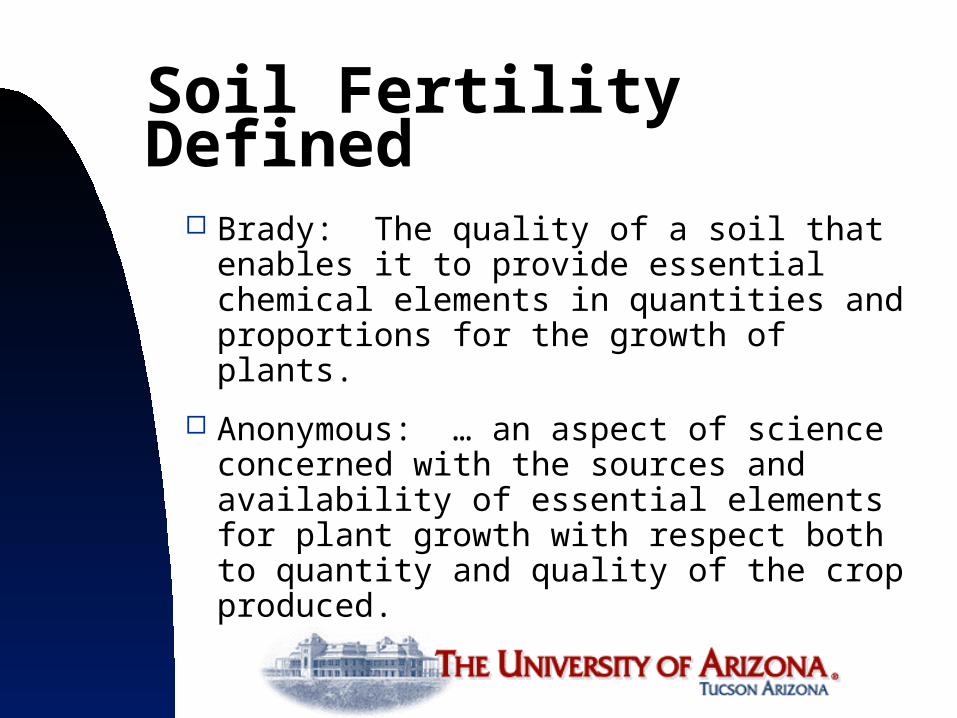
Soil Fertility Defined
Brady: The quality of a soil that enables it to provide essential chemical elements in quantities and proportions for the growth of plants.
Anonymous: … an aspect of science concerned with the sources and availability of essential elements for plant growth with respect both to quantity and quality of the crop produced.
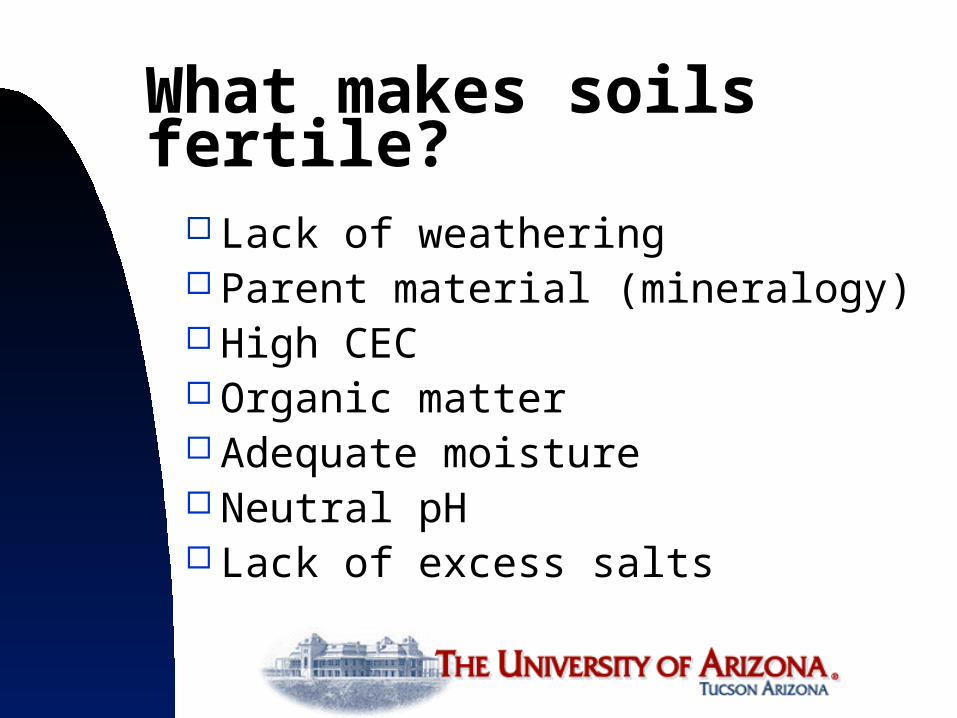
What makes soils fertile?
Lack of weathering Parent material (mineralogy) High CEC Organic matter Adequate moisture Neutral pH Lack of excess salts
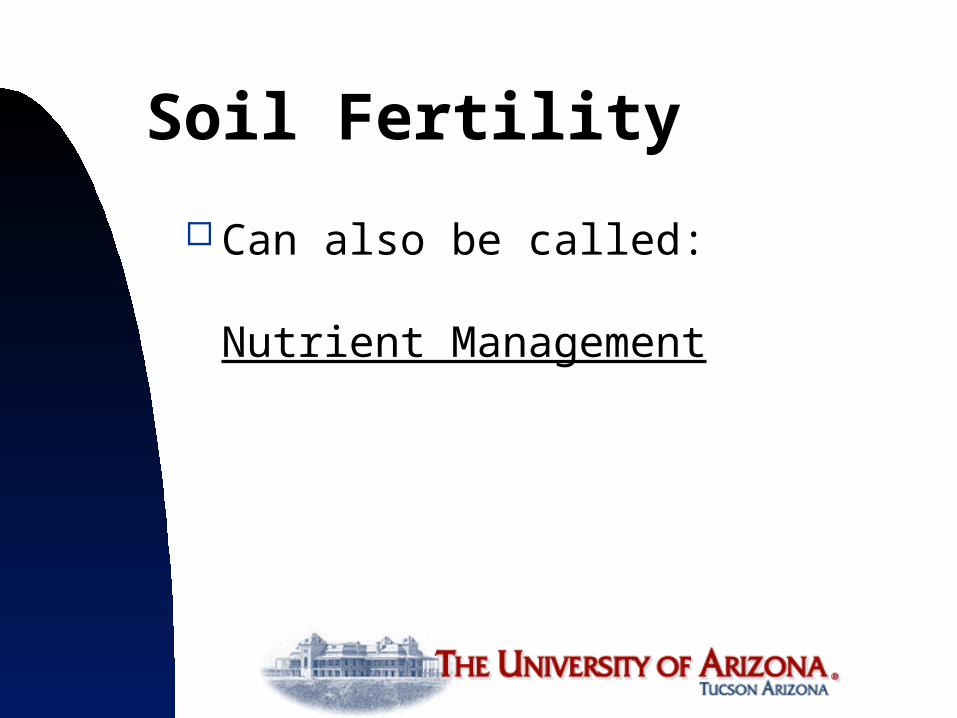
Soil Fertility
Can also be called:
Nutrient Management

Role of the Soil in Plant Growth:
Anchorage Storage/Supply of Water Storage/Supply of O2
Storage/Supply of Nutrients
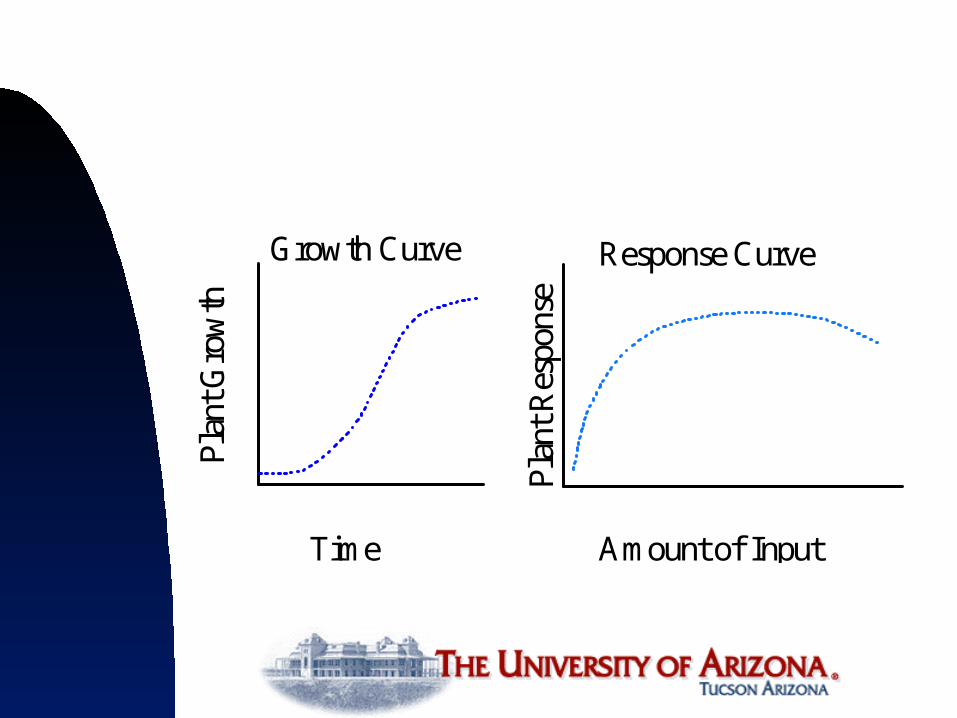
Time Amount of Input
Plan
t Gro
wth
Growth Curve Response Curve
Plan
t Res
pons
e

Crop Growth Curve The generalized crop growth
curve shown applies to annual crops.
Nutrient uptake follows the same general pattern, but is slightly earlier in time than growth.
Growth and nutrient uptake in perennial crops is more complicated.
Time
Plan
t Gro
wth
Growth Curve
How can understandinga crop growth curvebe useful?

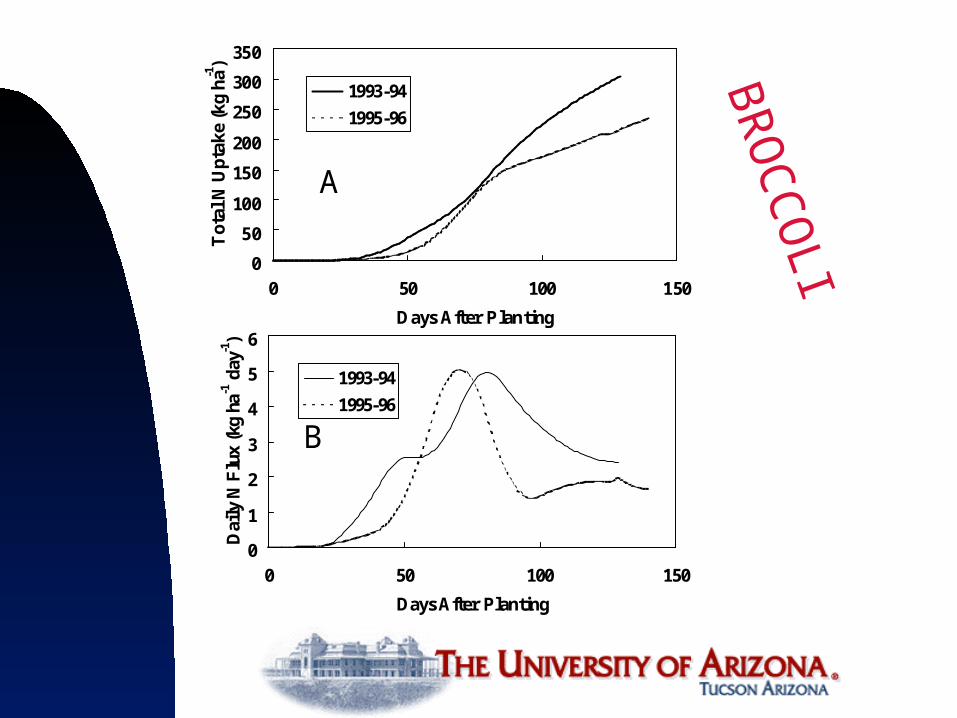
BR
OC
CO
LIA
B
0
1
2
3
4
5
6
0 50 100 150
Days After Planting
Dai
ly N
Flu
x (k
g ha
-1 d
ay-1)
1993-94
1995-96
0
50
100
150
200
250
300
350
0 50 100 150
Days After Planting
To
tal
N U
pta
ke (
kg
ha-1
)
1993-94
1995-96
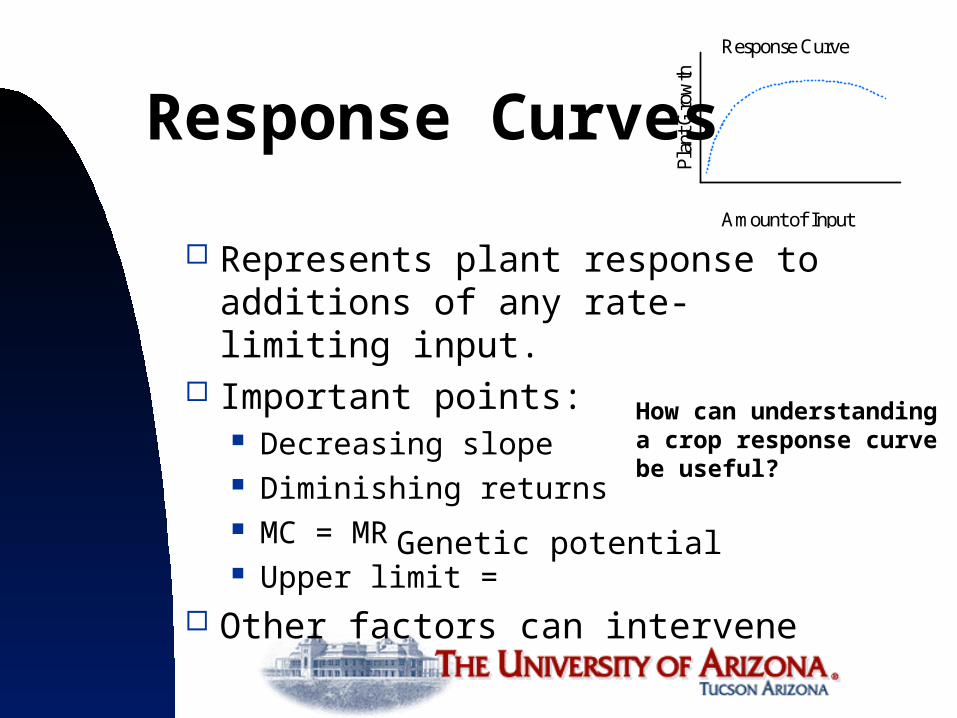
Response Curves
Represents plant response to additions of any rate-limiting input.
Important points: Decreasing slope Diminishing returns MC = MR Upper limit =
Other factors can intervene
Genetic potential
Amount of Input
Response Curve
Plan
t Gro
wth
How can understandinga crop response curvebe useful?

Model Response Curve
Amount of Input
Cro
p R
espo
nse
Maximum Profit
MaximumYield

Important Points on the Yield (Response) Curve
Maximum Yield Determined by either genetic
potential of the crop or the presence of a limiting factor
Maximum Profit Point where marginal cost =
marginal return(MC=MR)
Depends on two things:- Cost of the input- Value of the crop
Plan
t Res
pons
e
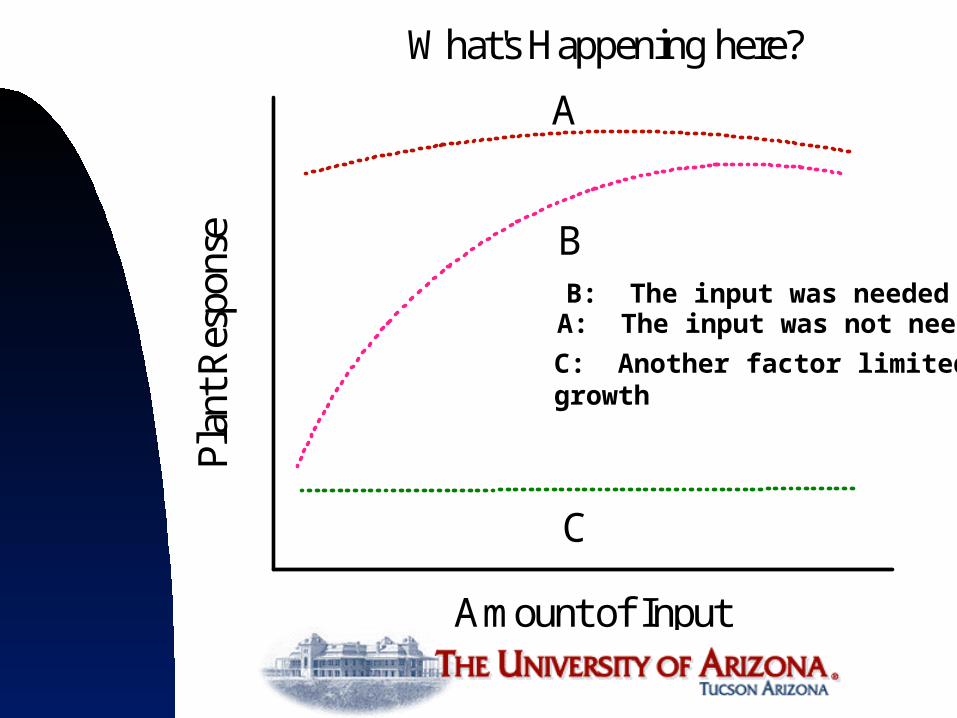
Amount of Input
A
B
C
What's Happening here?
B: The input was neededA: The input was not needed
C: Another factor limitedgrowth
Nutrient Management
Soil Fertility is often concerned with the problem of managing nutrients to be applied to plants.
Three general considerations: Agronomic (how much is needed) Economic (how can profit be
maximized) Environmental (minimize pollution)
Response Factors
Crop Yield The most important
consideration in nutrient management for most crops
Crop Quality Maximum yield and optimum
quality are not always compatible. Example:
- Malting barley yield vs. protein- Fruit Quality
Theory vs. Reality In theory, any time we are practicing
nutrient management we should consider agronomic, economic, and environmental ramifications.
However, in reality some of these factors are often ignored: Economics of adding nutrients may be
unimportant in some high-value crops. Environmental outcome is often ignored—
difficult to see or measure, who’s checking anyway?

“Law of the Minimum”
Crop yield is limited by the most limiting factor. When that factor is removed, yield is limited by the 2nd most limiting factor, and so on.
Barrel metaphor
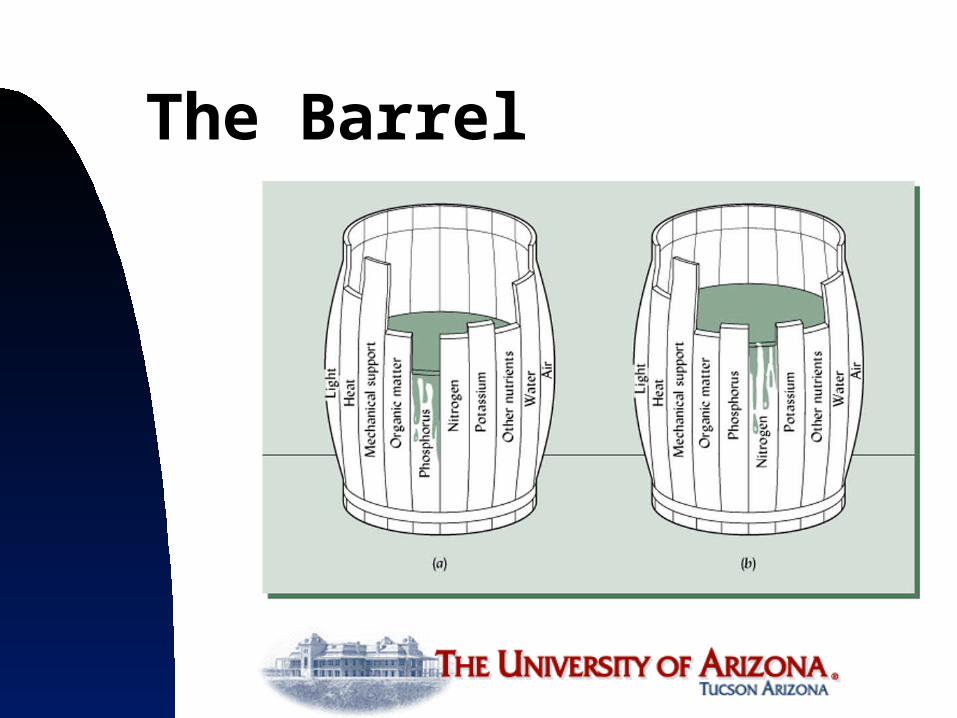
The Barrel
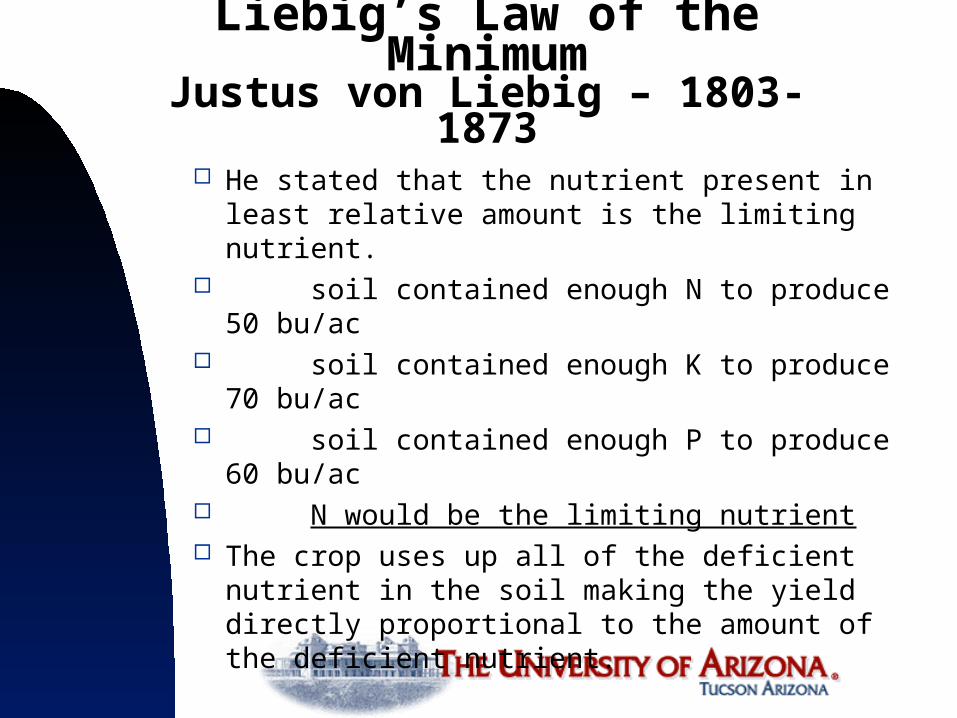
Liebig’s Law of the Minimum
Justus von Liebig – 1803-1873
He stated that the nutrient present in least relative amount is the limiting nutrient.
soil contained enough N to produce 50 bu/ac
soil contained enough K to produce 70 bu/ac
soil contained enough P to produce 60 bu/ac
N would be the limiting nutrient The crop uses up all of the deficient
nutrient in the soil making the yield directly proportional to the amount of the deficient nutrient.