Embed Size (px)
Citation preview
Eastern Kentucky UniversityEncompass
EKU Faculty and Staff Scholarship
2017
Trial 1 versus Trial 2 of the Test of MemoryMalingering: Evaluating Accuracy without a “GoldStandard”Douglas MossmanUniversity of Cincinnati College of Medicine
Dustin B. WygantEastern Kentucky Univeristy
Roger O. GervaisUniversity of Alberta - Neurobehavioural Associates
Kathleen J. HartXavier University, Cincinnati, OH
Follow this and additional works at: http://encompass.eku.edu/fs_research
Part of the Psychological Phenomena and Processes Commons
This Article is brought to you for free and open access by Encompass. It has been accepted for inclusion in EKU Faculty and Staff Scholarship by anauthorized administrator of Encompass. For more information, please contact [email protected].
Recommended CitationMossman, Douglas and Wygant, Dustin B. and Gervais, Roger O. and Hart, Kathleen J., Trial 1 Versus Trial 2 of the Test of MemoryMalingering: Evaluating Accuracy Without a 'Gold Standard' ( January 3, 2017). Psychological Assessment, Forthcoming.
Electronic copy available at: https://ssrn.com/abstract=2898221
TOMM Trial 1 versus Trial 2 1
Trial 1 versus Trial 2 of the Test of Memory Malingering:
Evaluating Accuracy without a “Gold Standard”
Douglas Mossman, M.D.
Department of Psychiatry and Behavioral Neuroscience
University of Cincinnati College of Medicine, Cincinnati, Ohio, USA
Dustin B. Wygant, Ph.D.
Department of Psychology, Eastern Kentucky University, Richmond, Kentucky, USA
Roger O. Gervais, Ph.D.
University of Alberta and Neurobehavioural Associates, Edmonton, Alberta, Canada
Kathleen J. Hart, Ph.D.
School of Psychology, Xavier University, Cincinnati, Ohio, USA
Address correspondence to Dr. Mossman:
Department of Psychiatry and Behavioral Neuroscience, UC College of Medicine
260 Stetson Street, Suite 3200, Cincinnati, Ohio 45219
Telephone: (513) 558-4423 • Fax: (513) 558-3823 • [email protected]
Accepted 6 January 2017 for publication in Psychological Assessment.
This article may not exactly replicate the authoritative document published in
Psychological Assessment. It is not the copy of record.
Electronic copy available at: https://ssrn.com/abstract=2898221
TOMM Trial 1 versus Trial 2 2
Abstract
This study examines the accuracy of the Test of Memory Malingering (TOMM), a
frequently administered measure for evaluating effort during neurocognitive testing. In the
last few years, several authors have suggested that the initial recognition trial of the TOMM
(Trial 1) might be a more useful index for detecting feigned or exaggerated impairment
than Trial 2, which is the source for inference recommended by the original instruction
manual (Tombaugh, 1996). We used latent class modeling (LCM) implemented in a
Bayesian framework to evaluate archival Trial 1 and Trial 2 data collected from 1198
adults who had undergone outpatient forensic evaluations. All subjects were tested with
two other performance validity tests (the Word Memory Test and the Computerized
Assessment of Response Bias), and for 70% of the subjects, data from the California Verbal
Learning Test–Second Edition Forced Choice trial were also available. Our results suggest
that not even a perfect score on Trial 1 or Trial 2 justifies saying that an evaluee is
definitely responding genuinely, although such scores imply a lower-than-base-rate
probability of feigning. If one uses a Trial 2 cut-off higher than the manual’s
recommendation, Trial 2 does better than Trial 1 at identifying individuals who are almost
certainly feigning while maintaining a negligible false positive rate. Using scores from both
trials, one can identify a group of definitely feigning and very likely feigning subjects who
comprise about two-thirds of all feigners; only 1 percent of the members of this group
would not be feigning.
Keywords: malingering; Test of Memory Malingering; gold standard; receiver operating
characteristic; latent class methods; Bayesian models
Introduction
After completing all the steps that comprise an evaluation, the fundamental question
a mental health professional tries to answer is, “Given the evidence that I have assembled,
what should I conclude?” In assessments done for treatment purposes, asking this question
and responding to it are rarely explicit processes; instead, the clinician usually has as a set
of tacit hypotheses about the patient that are tested and reconsidered as the patient
undergoes treatment to alleviate whatever problems led to the clinical encounter.
In forensic mental health assessments, however, the evaluator is much more likely
to ask, “What should I conclude?” explicitly (Wills, 2008). One reason is that forensic
assessments typically are efforts to reach conclusions that can be stated with “reasonable
medical (or scientific) certainty.” Also, to the extent that an evaluator’s truth-seeking
efforts may not lead to the outcome the forensic evaluee desires, the forensic evaluee has
an external motive to deceive the evaluator. The Third, Fourth, and Fifth Editions of the
TOMM Trial 1 versus Trial 2 3
Diagnostic and Statistical Manual of Mental Disorders therefore recommend having a
heightened suspicion of malingering in any evaluation that takes place in a “medicolegal
context.”
To decide whether an evaluee is feigning or exaggerating mental symptoms or
cognitive impairment, mental health evaluators use three approaches, either separately or
in combination. First, mental health professionals compare what an evaluee reports or says
about symptoms to what patients who have no motive to look impaired say about mental
problems (see, e.g., Resnick & Knoll, 2008). Second, evaluators sometimes can identify
inconsistencies between an evaluee’s report and what appears in records or in other
persons’ outside-the-office observations (Resnick, West, & Payne, 2008). Third, mental
health evaluators can use symptom validity tests (SVTs; e.g., the Structured Interview of
Reported Symptoms-2 [Rogers, Sewell, & Gillard, 2010]) or performance validity tests
(PVTs; e.g., the Validity Indicator Profile [Frederick & Crosby, 2000]) developed specifically
to detect dishonest symptom reporting or less-than-full cognitive effort during the
evaluation.
Of these approaches to detecting feigned symptoms or impairment, SVTs and PVTs
are the best candidates for generating quantitative answers to the forensic evaluator’s
question, “What should I conclude?” The reason: SVTs and PVTs produce numerical results
that could help evaluators make mathematical statements about the probability of feigning,
given the evidence. If, for example, a PVT designer had previously assembled data about
PVT scores from evaluees who were known for certain to have answered honestly and
from evaluees known for certain to have feigned or exaggerated their impairment, the
evaluator could use those data to calculate likelihood ratios or other accuracy statistics;
these statistics, combined with base rate information, would lead to numerical conclusions
about the probability of less-than-full effort (Mossman & Hart, 1996; Mossman, 2000).
The Test of Memory Malingering (TOMM; Tombaugh, 1996) is a popular PVT for
reasons that include its relative ease of administration and the logic behind its design. Yet
many authors have noted that the TOMM has limited sensitivity in detecting suboptimal
effort if the results are interpreted in accordance with the standard scoring rule prescribed
by the test manual (i.e., classify feigning if the Trial 2 score falls below 90% correct). This
may be because savvy evaluees (or their attorneys) learn about SVTs and PVTs from legal
citations (Kaufmann, 2009) and Internet resources—such as a Wikipedia article (“Test of
Memory Malingering,” 2016)—and can decide that during the administration of the TOMM,
they should take care to not do too poorly. Other evaluees who intend to display subtle-
but-phony impairment may realize by Trial 2 that the task is not as difficult as it first
seems, or they may discern the purpose of the TOMM by mentally comparing it with other
measures. In this respect, the TOMM likely shares a limitation with other effort measures
(Denning, 2012; Guilmette, Whelihan, Hart, Sporadeo, & Buongiorno, 1996; Marshall et al.,
2010).
TOMM Trial 1 versus Trial 2 4
For these reasons, several recent articles have suggested that the initial recognition
trial of the TOMM (Trial 1) might be a more useful index for detecting feigned impairment
(Denning, 2012; Denning, 2014; Kulas, Axelrod, & Rinaldi, 2014; Schroeder, Baade, Peck, &
Heinrichs, 2011). Denning (2012) reviewed and summarized more than 20 studies
available as of 2012 that report cut-off scores or accuracy indices for Trial 1, and he
described findings from his own data to suggest that Trial 1 might be a more satisfactory
PVT.
In all these studies and those published since, however, investigators have examined
Trial 1 using a less-than-perfect criterion for non-genuine responding. Most commonly, the
criterion has been another effort measure (such as the Medical Symptom Validity Test
[Green, 2004]; see Denning, 2012 for an example), other sections of the TOMM (e.g.,
Armistead-Jehle & Hansen, 2011), or combinations of measures (e.g., Kulas, Axelrod, &
Rinaldi, 2014; Schroeder et al., 2013). In some cases, investigators excluded cases that did
not meet their criteria for unambiguously “poor effort” or “good effort” (e.g., failing at least
two other PVTs, versus “passing” all other PVTs; see Kulas et al., 2014, p. 238). In other
studies, investigators have tried to establish a specific, single Trial 1 cut-off score based on
some independent criterion, such as perfect specificity when compared to a particular Trial
2 score (see Denning, 2012, Table 1 for examples) or “acceptable” specificity, usually >90%
when compared with the study’s criterion of truth (see Gunner, Miele, Lynch, & McCaffrey,
2012, Schroeder et al., 2013, and Kulas et al., 2014 for recent examples).
Although all the methods described in the previous paragraph represent reasonable
approaches, they share a limitation: all require using an imperfect “gold standard” for the
true status of subjects and/or an arbitrary, single cut-off to classify subjects. Because of
this, the resulting accuracy indices incorporate systematic misclassification errors that
potentially bias and limit findings. In this article, we describe results from applying latent
class modeling (LCM) methods similar to those used by Mossman, Wygant, and Gervais
(2012) to examine “real-world” Trial 1 responses from 1198 forensic evaluees. Our hope
was that LCM techniques would let us make inferences about the diagnostic properties of
Trial 1 and compare these to Trial 2 without having to use an imperfect “gold standard” to
categorize study subjects.
Method
Study Subjects
Because the present research used de-identified archival data, it received a
designation of “exempt” from the institutional review board of the University of Cincinnati.
The data originated from 2627 consecutive evaluees who underwent outpatient
assessment at the third author’s office practice. Nothing in pre-evaluation information or
TOMM Trial 1 versus Trial 2 5
the third author’s evaluation findings suggested that any evaluee had a severe cognitive
impairment (e.g., dementia or intellectual disability) that would have required special
cautions beyond those normally applicable to a psychological evaluation.
Our statistical methods (discussed later in this section) required that individuals
have undergone evaluation with multiple measures that test for a similar type of
impression management. We therefore focused on individuals in the dataset whose
evaluations included administration of the TOMM, the Computerized Assessment of
Response Bias (CARB; Allen, Conder, Green, & Cox, 1997), and the Word Memory Test
(WMT; Green, Allen, & Astner, 1996; Green, 2003). This requirement removed just over
half the evaluees (i.e., 1326 individuals) from the subject pool. The remaining 1301
evaluees included 28 persons who did not speak English well enough to take the PVTs in
English. We excluded these persons from the analysis. We also excluded individuals who
had undergone evaluations for treatment purposes and were not evaluated in a forensic
context (e.g., Worker’s Compensation Board). The treatment-oriented evaluees included 15
widows of workers who had been killed on the job or who had died from a progressive
work-related condition (e.g., mesothelioma), and 60 individuals who were not seeking
compensation and underwent evaluation to guide psychological treatment. The resulting
sample thus included 2627 – (1326+28+15+60) = 1198 evaluees who underwent
assessment related to worker’s compensation claims (n = 897, 74.9%), their involvement
in civil litigation (e.g., plaintiffs in personal injury cases, n = 224, 18.7%), both worker’s
compensation and lawsuits (n = 7, 0.6%), disability insurance claims (n = 64, 5.3%), and
pension claims (n = 6, 0.5%).
Most (n = 730, 60.9%) persons in the sample were men. The sample’s mean age was
40.4 (SD = 11.0) years; the mean education level was 11.6 (SD = 2.5) years. One-eighth (n
= 148, 12.4%) of the sample subjects spoke languages other than English (including
Punjabi, Mandarin, Arabic, Spanish, Polish, and Ukrainian) as their primary language,
although all these evaluees completed the PVTs in English. In these 148 individuals, the
mean WAIS-IV Verbal IQ score was 83.2 (SD = 11.6), mean Performance IQ was 86.7 (SD =
14.5), and mean Full Scale IQ score was 83.2 (SD = 11.6). Their scores were lower than the
scores of the native English speakers: Verbal IQ = 97.2 (SD = 12.7), Performance IQ =
101.8 (SD = 14.4), and Full Scale IQ = 99.1 (SD = 13.2).
Motor vehicle accidents were the reported source of injury for 238 members
(19.9%) of the sample; 893 individuals (74.5%) reported being injured at work. The
reported physical problems were mainly musculoskeletal and orthopedic injuries. Primary
sites of pain as specified on the Multidimensional Pain Inventory (Kerns, Turk, & Rudy,
1985) were head, face, or mouth (n = 121, 10.1%); neck (n = 136, 13.6%); shoulders or
upper extremities (n = 223, 18.6%); lower back (n = 289, 24.1%); and lower extremities
(n = 117, 9.8%). Primary psychiatric diagnoses were rendered by the third author in
accordance with then-current DSM-IV or DSM-IV-TR criteria using referral documentation
TOMM Trial 1 versus Trial 2 6
and all data gleaned from the assessments, which included findings from detailed clinical
interviews of the evaluees plus the psychological test results.
Four-fifths of the sample had diagnoses of chronic pain (32%), anxiety or
posttraumatic stress disorder (30%), or depression (17%). As the previous paragraph
notes, one-tenth of the sample had primary pain sites that involved the head and face, and
about one-half these individuals reported physical problems that could have involved brain
trauma. The remaining evaluees had problems such as temporomandibular joint pain. After
accounting for other psychiatric conditions, 15 (1.3%) members of the total subject group
had primary diagnoses of head injury, and two (0.2%) had other neurological conditions.
These 17 subjects were not undergoing evaluations for purposes of neuropsychological
assessment. They had already undergone detailed neuropsychological evaluations
elsewhere that had detected no neurological or neuropsychological impairment severe
enough to prevent them from returning to work, but the presence of other, comorbid
psychological issues had not necessarily been evaluated. These subjects (along with the
others in our sample) had no apparent, neurologically based reason for not being able to
“pass” performance validity tests. None had obvious impairments in conversation, and all
were community-living outpatients (i.e., they did not come from residential or hospital
treatment settings) who traveled independently or with relatives for their assessments.
Test Data
The WMT, CARB, and TOMM yield several scores from which an evaluator might
make judgments about possible feigned cognitive impairment. For this study, we used:
a total WMT score obtained by combining the immediate recognition (IR), delayed
recognition (DR), and consistency scores;
a final CARB score calculated from all three blocks of the instrument, with imputed
scores based on the stopping rules if evaluees scored 100% on a block;
the simple numerical results from Trial 1 and Trial 2 of the TOMM.
Most (843, or 70.4%) of the subjects also had test data available for an additional proposed
measure of malingering, the Forced Choice trial of the California Verbal Learning Test–
Second Edition (CVLTFC; Delis, Kramer, Kaplan, & Ober, 2000), and we included these
subjects’ numerical scores in our analyses.
Approaching the Data without a Gold Standard
Because forensic mental health professionals rarely know for certain whether a
given evaluee has responded genuinely, investigators have tried to assess the accuracy of
PVTs and SVTs in two ways. In so-called “known group” or “criterion” studies, investigators
evaluate discrimination power of validity measures by comparing the responses of
evaluees believed to be responding genuinely with evaluees believed to be feigning or
TOMM Trial 1 versus Trial 2 7
exaggerating problems. In “simulation” studies, investigators ask non-symptomatic
(“healthy”) subjects to answer test items as the subjects believe persons with mental
disorders or cognitive impairments would. The investigators then compare these subjects’
simulated responses to those of persons who actually are mentally ill or cognitively
compromised but who have no known motivation to look more ill or impaired than they
really are.
Each of these methods has limitations, however. Because no gold standard
establishes the truth in known-group studies, investigators must either exclude ambiguous
cases or accept that some feigning or non-feigning subjects may be misclassified. In
simulation studies, subjects’ true status is known, but investigators do not know how well
simulators’ behavior resembles the efforts of real feigners who undergo real forensic
evaluations.
To get around these problems, Mossman and colleagues (2012) used an approach
based on principles of latent class modeling (LCM) (Uebersax & Grove, 1990), which has
helped investigators in several areas of medicine (Henkelman, Kay, & Bronskill, 1990) and
in related fields (e.g., Choi, Johnson, Collins, & Gardner, 2006; Jafarzadeh, Johnson, &
Gardner, 2016 [cattle infections]). Broadly, this approach involves developing a data model
that includes the accuracy parameters, then obtaining data from subjects who have
undergone evaluation for a condition with more than one diagnostic method. If the
resulting number of data categories exceeds the number of parameters in the data model, it
may be possible to identify those model parameters—which would mean that the
investigator could specify the diagnostic methods’ accuracy parameters without ever
knowing the true status of the subjects.
ROC Analysis
Most reports on efforts measures refer to a single PVT score or “cut-off.” For
example, the standard interpretation of the TOMM is that a Trial 2 score below 90%
indicates feigned memory impairment, and reports on the accuracy of the TOMM typically
refer to single values of sensitivity and specificity associated with this cut-off. In our view,
however, this approach to interpreting results omits two key considerations relevant to
understanding the information that PVTs produce.
First, PVTs have several possible scores, and the lower a score, the stronger the
evidence for non-genuine responding. Use of receiver operating characteristic (ROC)
analysis allows the investigator to evaluate the discrimination characteristics of a PVT at
several cut-offs and to quantify trade-offs between sensitivity and specificity as the cut-off
is moved through the test’s full range of possible operating points. Knowing sensitivity and
specificity at several cut-offs allows one to create a ROC graph for a test, which is a plot of
the test’s true positive rate (tpr, which equals test sensitivity) as a function of the false
positive rate (fpr = 1 – test specificity). Because a finite number of cut-offs is actually used,
TOMM Trial 1 versus Trial 2 8
the points that represent (fpr, tpr) pairs may be connected by line segments, and the areas
underneath each segment (calculated using the trapezoidal rule) can be summed to find a
nonparametric estimate of the total area under the ROC curve (AUC). AUC is a useful
summary of accuracy that, in the present application, equals the probability that the PVT
will correctly classify two randomly chosen subjects—one feigning and one responding
honestly—by assigning a lower score to the feigning subject. An AUC of 1.0 would imply
perfect sorting, and an AUC of 0.5 would imply no-better-than-chance discrimination
between invalidly responding and validly responding subjects.
Second, PVT results are evidence that, if used optimally, should alter or revise one’s
belief about the probability that the evaluee is feigning impairment. This Bayesian
interpretation of a PVT result implies that we would like information about the tests that
let an evaluator answer the question, “Now that I have this result, what should I believe
about this evaluee?” If we can somehow establish the values of the ROC parameters for the
PVT, the answer to this question will follow directly.
Our analyses used a Bayesian framework to locate values for the ROC parameters of
the PVTs we studied. Essentially, our data analysis asked, “Given these subjects’ PVT
results, what should we make of them? Given our study data, what should we believe about
the ROC accuracy parameters for these PVTs?” To answer this question, we set about
obtaining estimates of (fpr, tpr) pairs using the nonparametric model described by Albert
(2007) and used in previous studies by Mossman and colleagues (Mossman et al., 2010;
Mossman et al., 2012). Bayesian estimation methods summarize knowledge about
unknown parameter values using ‘‘posterior’’ distributions that represent the probability
that a parameter has a particular value, given the observed data.
Bayes’s Rule states that the posterior probability of a parameter’s value is
proportional to the likelihood of observing the data given that parameter value, multiplied
by a “prior” probability of the parameter’s value. This approach is somewhat like maximum
likelihood estimation (which provides point estimates for the parameter values that are
most likely to have generated the observed data), and when priors are chosen so as to be
“non-informative,” Bayesian and MLE results are often numerically similar (Carlin & Louis,
2009). Bayesian results differ from MLE results in an important theoretical way, however.
MLE results tell us things like, “We can have 95% confidence that a confidence interval
constructed with this estimation method will contain the true value of a parameter.”
Bayesian estimation summarizes what we should believe about a parameter’s true value
via its “credible interval,” which represents a direct probability statements about the
parameters—for example, “the probability is 95% that parameter θ for PVT j lies between x
and y” or “given John Doe’s PVT result, the probability that he feigned impairment is
greater than 95 percent.”
TOMM Trial 1 versus Trial 2 9
We ran our Bayesian analyses in OpenBUGS, a free, open-source software program
that is one of the successors to WinBUGS (Lunn, Spiegelhalter, Thomas, & Best, 2009). Like
WinBUGS, OpenBUGS lets investigators use Markov chain Monte Carlo (MCMC) methods
(Gelfand & Smith, 1990; Geman & Geman, 1984; Metropolis, Rosenbluth, Rosenbluth,
Teller, & Teller, 1953) to generate posterior distributions from which the investigators
draw Bayesian inferences about the parameter values. MCMC methods lead to inferences
about posterior distributions for parameters of complex models if (as we hoped would be
true for our data) mild regularity conditions are met such that a Markov chain will
converge to a unique ‘‘target’’ distribution. This target distribution consists of the most
plausible ranges for the parameters of interest—here, the parameters that, taken together,
describe the accuracy of the PVTs we studied.
To use MCMC methods for our Bayesian analysis, we prepared OpenBUGS code
modified from the WinBUGS code used by Mossman and colleagues (2012). The transition
kernel made the target distribution of the resulting Markov chain the joint posterior
distribution of model parameters. To assure model identification, we found it necessary to
use a modestly informative Beta (6.3, 13.3) prior for the prevalence of feigning, which
implies that one is 99% sure the true value lies between 0.1 and 0.6. We ran two parallel
MCMC chains, and these appeared to converge after approximately 500 updates. We ran
each chain for 20,000 updates, discarded each chain’s first 10,000 “burn-in” updates, and
used the remaining 10,000 values for inference.
Ideally, we would have used both Trial 1 and Trial 2 simultaneously in our analyses.
We found, however, that doing so caused the TOMM scores to “overwhelm” the other
data—that is, the OpenBUGS algorithm identified a model in which the TOMM was taken to
be the truth, a conclusion at odds with what is known regarding the TOMM’s limited
sensitivity. We therefore analyzed the accuracy of Trial 1 separately from Trial 2, by using
either a combination of the WMT, CARB, CVLTFC, and Trial 1, or a combination of the WMT,
CARB, CVLTFC, and Trial 2.
“Agnostic” and “Partial Truth” Analyses
We approached our data analyses in two ways, which (following Mossman et al.,
2012) we term agnostic and partial truth. In the agnostic approach, we used as the sole
information available four PVT scores from the subjects (i.e., WMT-CARB-CVLTFC-Trial 1,
or WMT-CARB-CVLTFC-Trial 2). Consistent with the comments above, the agnostic
approach completely avoids the problem of trying to establish the group membership of
each subject before attempting to estimate accuracy parameters; it simply lets the PVT data
tell the story.
One might argue, however, that the agnostic approach excludes some information
from the analysis if we know enough to classify some of the subjects as honest or invalid
responders with virtual certainty. We therefore should incorporate this partial-truth
TOMM Trial 1 versus Trial 2 10
information into the parameter estimation process.
One source of additional information about the model parameters estimated from
the WMT-CARB-CVLTFC-Trial 1 scores is our knowledge of the subjects’ Trial 2 scores. The
motivation for making inferences about malingering based on TOMM Trial 1 rather than
Trial 2 is not just shorter administration time, but the belief that by the second trial, some
evaluees realize that the recognition task is not as difficult as first appearance suggests.
This means that using the standard cut-off, Trial 2 results are highly specific, and as the
results presented in the next section show, false positive interpretations are rare enough to
be negligible.
For our partial truth analyses of the WMT-CARB-CVLT-Trial 1 data, we assigned 146
subjects to a “definitely responding invalidly” group. This group included 125 subjects who
scored below 90% on Trial 2, plus an additional 21 subjects who scored within or below
the random responding range on at least two other PVTs (that is, below 65% on the DR or
IR section of the WMT, and below 58% on the CARB). Such results, we reasoned, could not
reflect valid responding: the study data came from an outpatient office to which most
subjects had traveled independently, and the subjects did not have conditions such as
dementia that could lead to genuine, no-better-than-chance responding. We also assigned
35 subjects to a “definitely not feigning” group. All these subjects had attained the highest
possible scores on all the SVTs. Here, we reasoned that whether a subject intended to
engage in impression management or not, a perfect score on all PVTs implied that the
subject was not using these measures to feign impairment.
Results
On the PVTs examined for this study, the subjects produced the following results
(summarized as mean percentages of correct answers ± SD, with the range of results in
parentheses):
WMT: 88.3±13.5 (35–100)
CARB: 94.9±11.3 (15–100)
TOMM1: 90.1±12.7 (34–100)
TOMM2: 96.3±10.6 (20–100)
CVLTFC: 88.7±14.1 (0–100)
[place Table 1 about here]
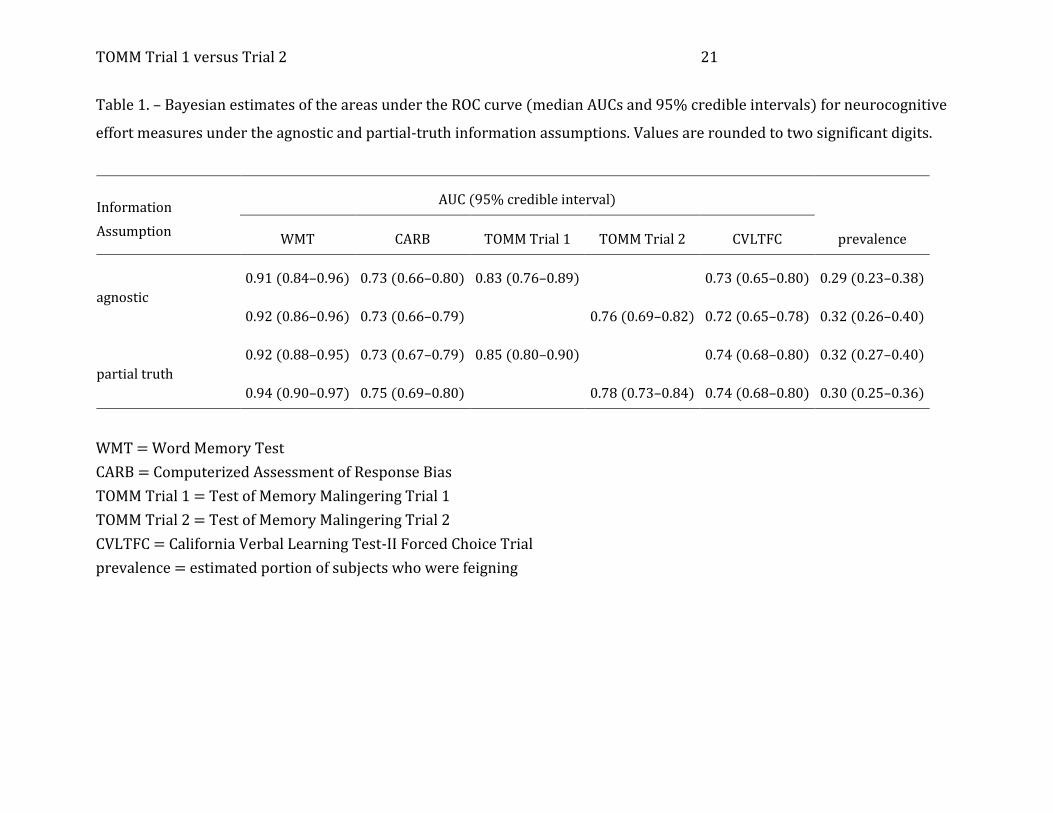
Table 1 shows the AUC estimates (with 95% credible intervals) for the four PVTs
under the agnostic and partial-truth data assumptions. As was true in Mossman and
colleagues’ (2012) study, all PVTs outdid chance sorting of feigned versus genuine
TOMM Trial 1 versus Trial 2 11
cognitive impairment, with the WMT providing superior discrimination.
[place Figures 1, 2, 3, and 4 about here]
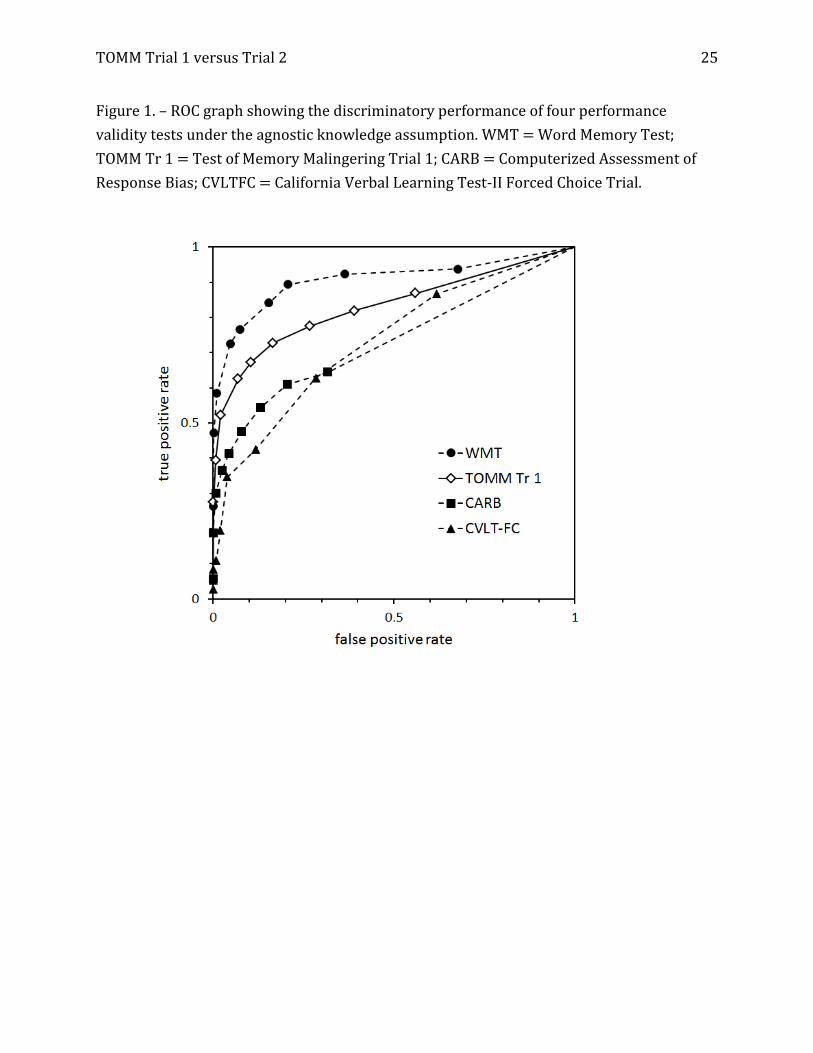
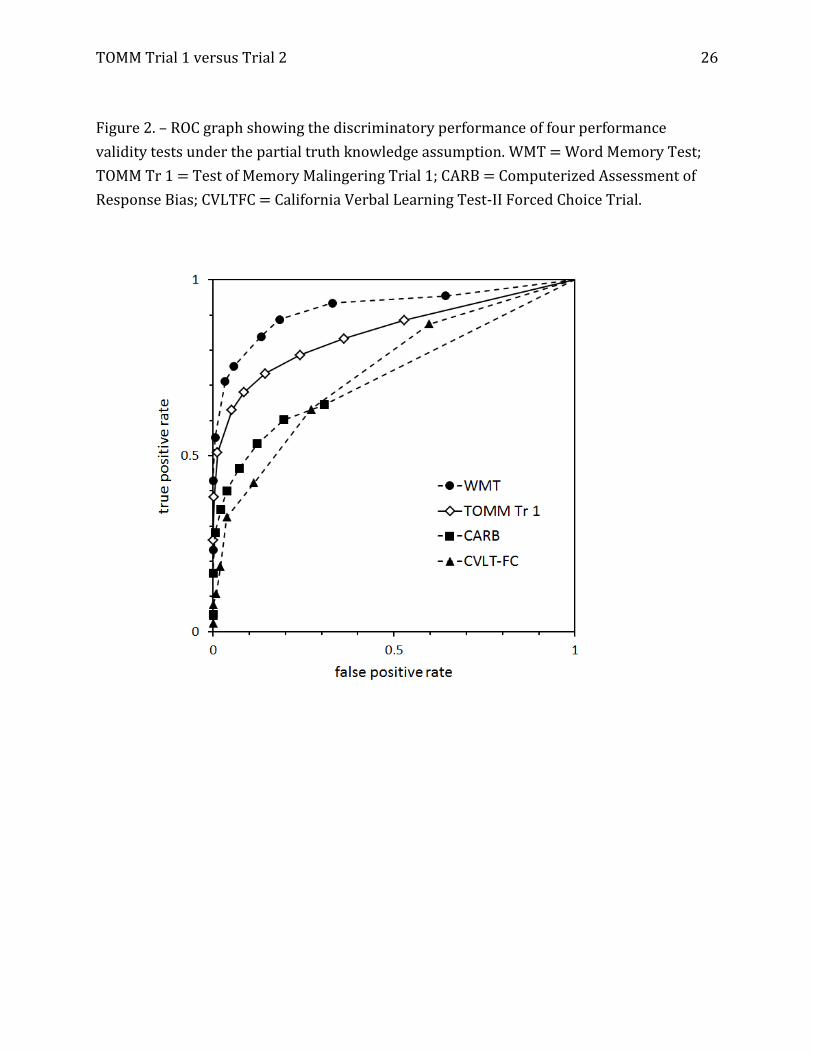
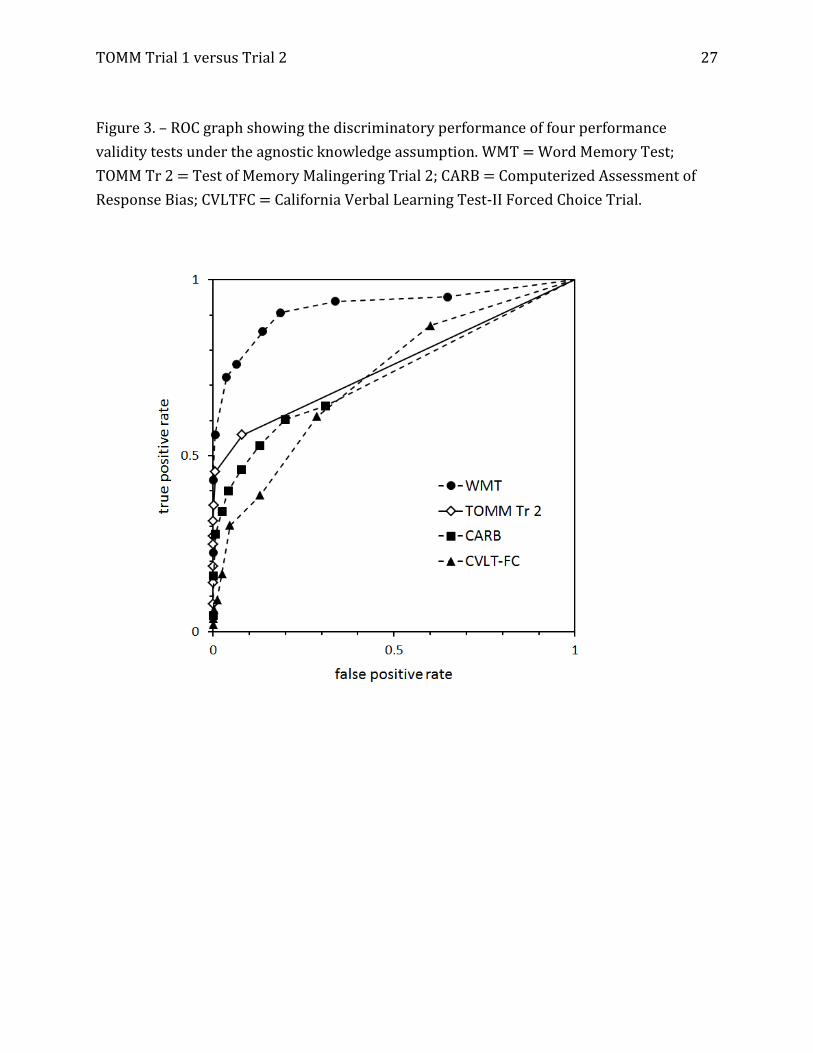
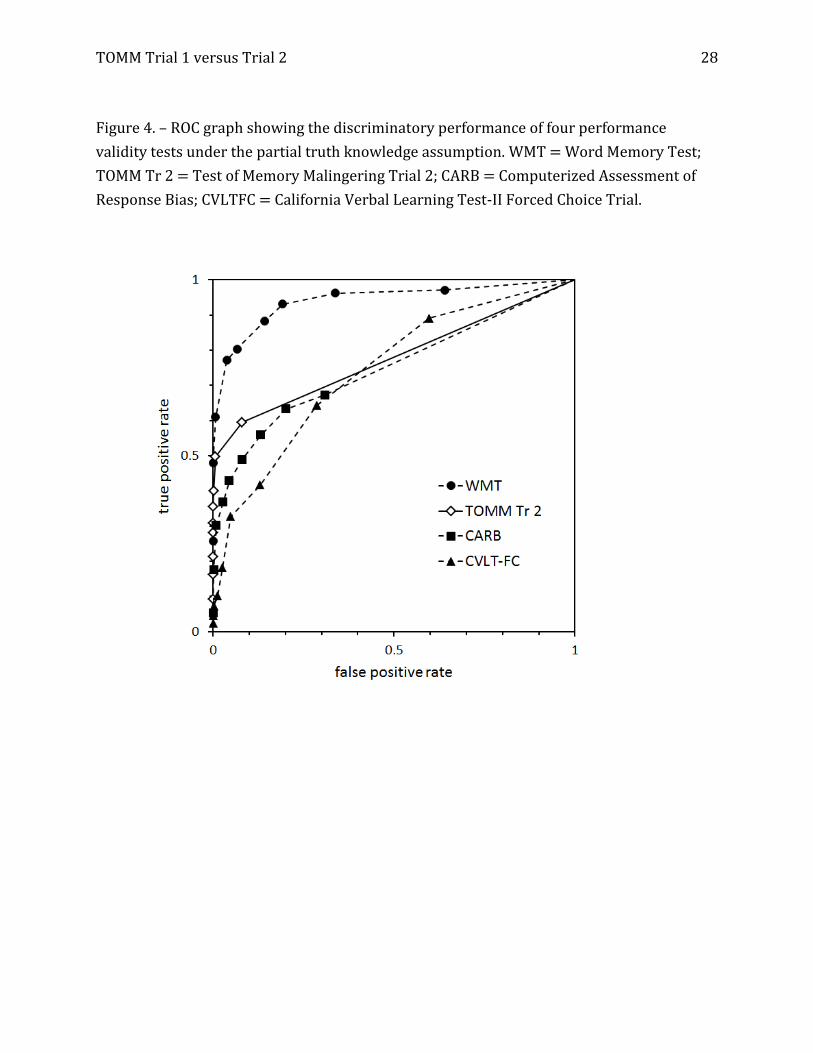
For our present purposes, however, the key finding is that agnostic and partial-truth
assumptions yielded similar results. We show this graphically in Figures 1, 2, 3, and 4.
Figures 1 and 2 show ROC graphs for the data runs that used Trial 1; Figures 3 and 4 show
the ROC graphs from the data runs that used Trial 2. Visual inspection confirms what Table
1 shows numerically: the AUCs for the studies are similar, and the ROC operating points
occupy positions in the ROC square that are similar whether one assumes completed
ignorance or partial information about the feigning status of some evaluees.
[place Figures 5 and 6 about here]
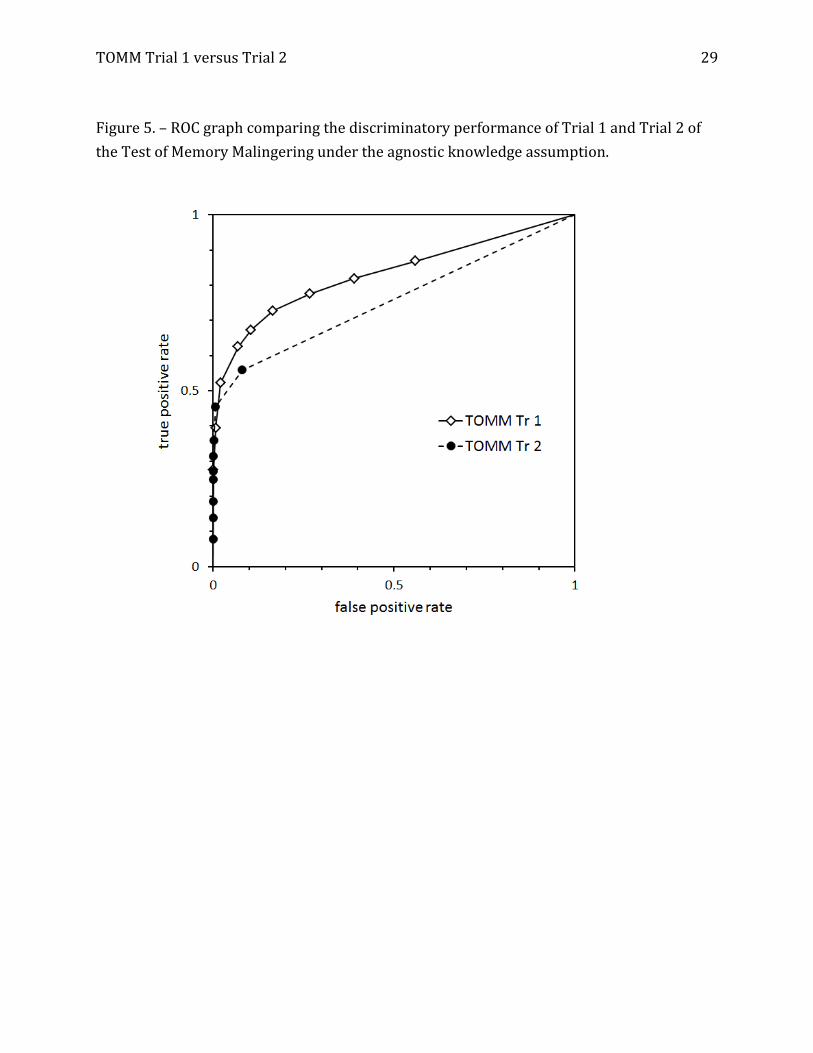
We turn now to our chief area of interest, the performance of Trials 1 and 2 of the
TOMM. Figure 5 shows the ROC graphs for Trial 1 and Trial 2 under the agnostic data
model, and Figure 6 contains the graphs derived from the partial truth model. Inspection of
both Figures shows that Trial 1 is associated with a much larger AUC, but the ROC graphs
cross each other close to the left vertical axis. This means that AUC alone may not be an
adequate basis for comparing the discriminatory power of the two trials.
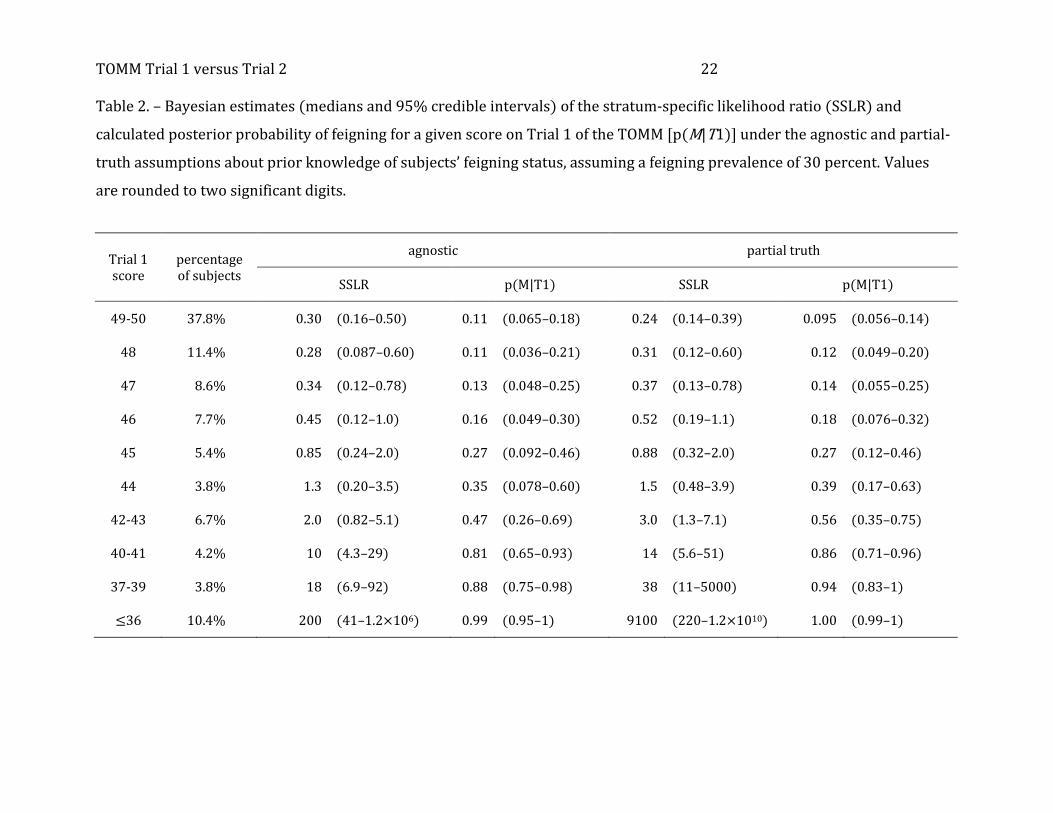
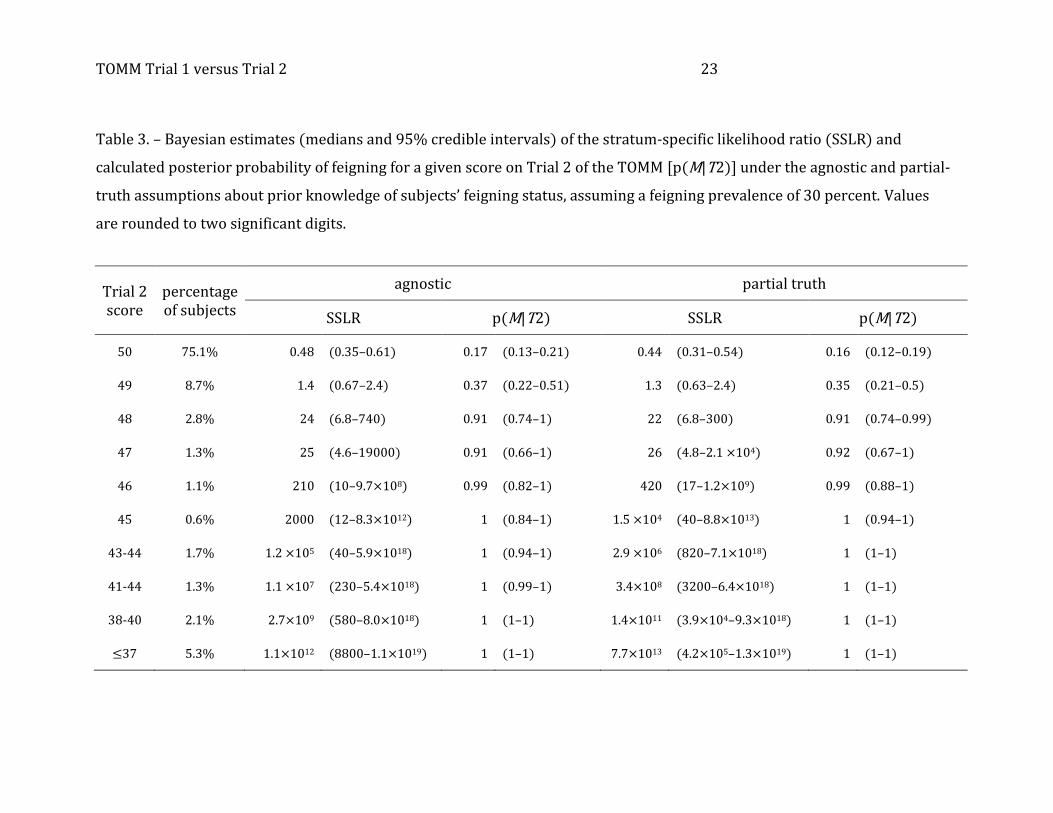
[place Tables 2 and 3 about here]
Tables 2 and 3 provide detailed bases for judgments about what scores on Trials 1
and 2 imply. As implemented in our OpenBUGS code, estimating operating points required
grouping the TOMM scores into ordinal categories. We grouped the subjects’ TOMM Trial 1
and Trial 2 scores such that they fell into the 10 categories shown in the “score” columns of
Tables 2 and 3. The “percentage of subjects” columns show the proportion of subjects who
fell into each category.
One formulation of Bayes’s Theorem expresses the posterior odds as the product of
the prior odds and the likelihood ratio. Here, we are interested in these relationships as
they relate to the presence of feigning (denoted as M, for “malingering”) and to a given test
result T. We can therefore write:
O(M : ¬M|T) = Λ(M : ¬M|T) • O(M : ¬M)
where the odds, O(•), equals p(•)/[1−p(•)], “¬” is the symbol for logical negation, and
Λ(•|T) is the likelihood ratio associated with T. We next introduce the stratum-specific
likelihood ratio (SSLR; Pierce & Cornell, 1993) to denote the likelihood ratio associated
with a particular stratum or category of test results. The SSLR relates directly to a ROC
graph in that the SSLR equals the slope of that portion of the graph that corresponds to the
test result category. Thus, in Figures 5 and 6, the 10 segments that make up each ROC
graph have slopes that equal the SSLRs for the respective test-result categories. Readers
can gain a rough idea of the SSLRs from examining Figures 5 and 6; the actual SSLR values
TOMM Trial 1 versus Trial 2 12
(to two significant digits) appear in Tables 2 and 3. Note that one calculates the SSLRk for
Tk, a test result that falls into category k, from the (fpr, tpr) pairs as follows:
1
1
cc
cck
fprfpr
tprtprSSLR
where c = {0, 1, 2, …, K}, c = {1, 2, …, K−1} are the nine (fpr, tpr) pairs that correspond to the
cut-offs that delimit the K result categories, fprc−1 = tprc−1 = 1, and fprc=K = tprc=K = 0.
To calculate the post-test probabilities shown in Tables 2 and 3, we assumed that
the prevalence or pre-test probability of feigning, p(M), is 0.3, an assumption supported by
the findings shown in Table 1. Therefore, the pre-test odds of feigning, O(M : ¬M) was 3:7,
and the values shown for p(M|T1) and p(M|T2) come from the product of 3/7 and the SSLR
values.
As was true for the AUCs shown in Table 1, Tables 2 and 3 show that the results
under the agnostic and partial-truth assumptions are similar and permit a single set of
judgments about various Trial 1 and Trial 2 scores:
● Two-thirds (65.5%) of the subjects had Trial 1 scores of 46 correct or better.
Concerning these subjects (or future subjects drawn from a sufficiently similar
population), it would be reasonable to say that their Trial 1 performance means
they have a below-base-rate probability of feigning or exaggerating cognitive
impairment. In a few cases, however, Trial 2 scores might alter this opinion (as we
explain further below).
● About one-sixth of our subjects (15.9%) had Trial 1 scores of 42 to 45. Such results
provide less clarity about subjects’ intentions. Another 8% had scores of 37 to 40;
these results are strong (but not certainty-inducing) evidence of feigning
impairment.
● An evaluee who gets 36 or fewer answers correct on Trial 1 is almost certainly
feigning or exaggerating cognitive impairment. Just 10.7% of the subjects did this
poorly. Thus, if one required this level of certainty before declaring that an evaluee
is feigning, one would identify little more than a third of those evaluees who actually
were feigning.
● No score on the Trial 2—not even all 50 correct—rules out malingering, although a
perfect score is evidence that favors genuine responding.
● A Trial 2 score of 49 does not favor a conclusion for or against feigning.
● One out of 17 subjects in our study (N = 69, 5.8%) got Trial 2 scores of 45 to 48.
Under the customary rules of test interpretation, one would not regard scores in this
range as indicative of feigning. Yet a score of 47 or 48 is good evidence of feigning,
TOMM Trial 1 versus Trial 2 13
and scores of 45 and 46 are strong evidence of doing less than one’s best.
● One-tenth (10.4%) of the subjects scored below 45 on Trial 2, the cut-off for
feigning that the TOMM manual (Tombaugh 1996) prescribes and that most
neuropsychologists use for result interpretation. Although we can be highly
confident that these subjects were performing below their true level of functioning,
they represent only a third of all the subjects who were feigning or exaggerating
their cognitive impairment.
[place Table 4 about here]
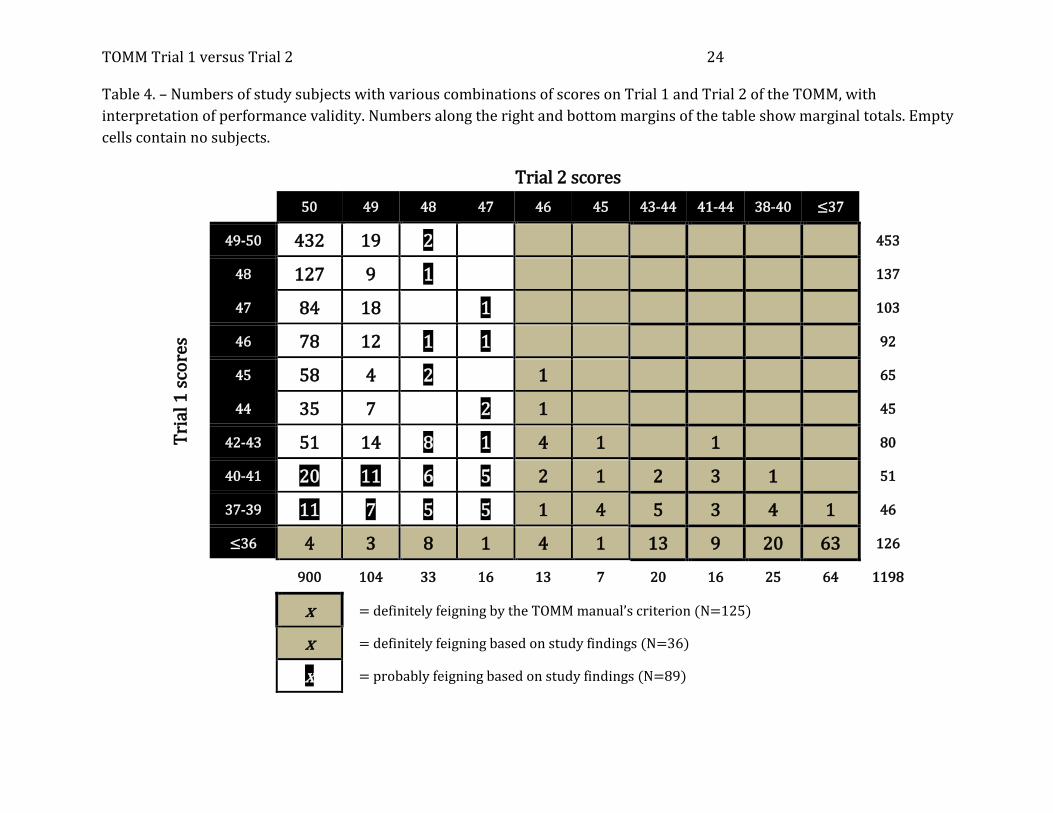
Table 4 provides another way to understand our findings. There, we show the
TOMM Trial 1 and Trial 2 scores for all 1198 subjects. One sees that according the TOMM
manual’s criterion, 125 (10.4%) of all the subjects scored low enough on Trial 2 to be
deemed feigners. If one adds to this group any subject whose Trial 1 or Trial 2 score
implies that the posterior probability of feigning was 0.99 or greater, then an additional 36
feigners (3.5% of all subjects) are detected. An additional 89 subjects (7.4% of the total
group) had a greater-than-80% posterior probability of suboptimal effort.
Thus, 250 subjects had at least an 80% probability of feigning or exaggerating
impairment. If the base rate of feigning among the subjects was exactly 30%, then 359
subjects actually were feigning. Based on their posterior probabilities, 241 of the 250
subjects in the at-least-80% feigning categories were actually feigning or exaggerating.
Therefore, the at-least-80% feigning categories contain 241 actual feigners (that is, about
two-thirds of all feigners), plus 9 of the 839 non-feigning subjects. Put another way,
designating all at-least-80% subjects as feigners would miss one-third of the actual feigners
and would incorrectly identify 1% of the honest subjects.
One final feature of Table 4 deserves mention: it illustrates the presence of
ambiguous results. Above, we explained that Trial 1 scores ≥46 support genuine
responding. Yet six of the subjects who produced such scores had Trial 2 scores of 47 or 48,
strongly suggesting feigning. The best explanation: these individuals were giving sub-
optimal effort, evidenced by Trial 2 scores that showed no improvement over Trial 1, or (in
two cases) worse performance.
Discussion
Although questions about evaluees’ motivation and the validity of findings often
arise in research and clinical treating settings, most (if not all) forensic mental health
evaluations occur under conditions that require examiners to consider explicitly whether
interview findings and test results reflect feigned or exaggerated impairment. Many
combinations of motivations and situational incentives can make malingering an attractive
choice, and feigning or exaggerating neurocognitive problems is a recognized coping
TOMM Trial 1 versus Trial 2 14
strategy for some forensic evaluees involved in civil and criminal litigation (Resnick &
Knoll, 2008). In outpatient evaluation settings, examiners often have limited observational
data from which to judge the genuineness of reported neurocognitive impairment, which
helps to explain the popularity of using scales that are “embedded” within psychological
test materials or tools developed expressly to detect feigned or exaggerated impairment. In
addition, embedded or malingering-specific effort measures often allow evaluators to
render judgments about malingering for which they can cite numerically based empirical
support.
Our approach to examining and comparing inferences from Trials 1 and 2 of the
TOMM differed from other investigators’ studies in two ways. First, we used other PVT
scores to evaluate the TOMM’s accuracy, but we did not try to create criterion groups based
on those PVT scores. Instead, we let OpenBUGS make simultaneous, Bayesian inferences
about group membership and the accuracy indices of all PVTs. To put this another way:
rather than declaring that certain PVTs established the “truth” about subjects’ malingering
status when we know those PVTs are imperfect, we asked OpenBUGS to answer the
question, “Given the data before us, what things about the accuracy of these PVTs are most
reasonable for us to believe?”
Second, we recognized explicitly that the TOMM produces graded results that justify
weaker or stronger beliefs about the likelihood that an individual is malingering. Rather
than reduce TOMM results to “yes” or “no” based on our opinion about what level or
sensitivity or specificity is appropriate, we used ROC methods to characterize the degree to
which a particular TOMM score should alter an evaluator’s pretest belief about the
likelihood that an evaluee is attempting to feign or exaggerate neurocognitive impairment.
Other investigators (e.g., Denning, 2012) have reported AUCs for TOMM Trial 1 of
greater than 0.90. In our study, Trial 1 AUCs exceeded AUCs for Trial 2 but fell below 0.85.
We attribute this to our different way of evaluating data. We did not attempt to exclude any
subjects whose performance might have been “hard” to categorize as genuine versus non-
honest, a decision that virtually guarantees lower sorting accuracy.
Our results also paint a different picture of Trial 1 and Trial 2 scores than other
investigators have suggested. We found that if one sets Trial 1 and Trial 2 cut-offs low
enough to achieve near-certain confidence that an evaluee’s effort was suboptimal, one will
achieve a detection sensitivity of about 40%. If one can settle for feeling “at least 80%
confident” that an individual has given less than full effort, then about 19% of our subjects
had Trial 1 scores and 16% had Trial 2 scores that indicated suboptimal effort. Notice,
however, that in the case of the Trial 2, this required interpreting scores of 48 or lower as
indicating feigned or exaggerated impairment.
Our findings suggest some advantages that LCM methods have over approaches to
evaluating malingering measures that use “known” groups of subjects or simulators. We
TOMM Trial 1 versus Trial 2 15
did not have to use imperfect truth criteria or exclude ambiguous cases from our analyses,
yet our results retained so-called “ecological” validity in that they came from evaluees in
real testing situations. For the following reasons, however, we ask that readers view our
findings with skepticism and cautiousness.
(1) Our data came from a single evaluation context. Although our findings
concerning the TOMM are consistent with those of other investigators (see, e.g., Fox, 2011;
Frederick & Bowden, 2009; Gervais, Rohling, Green, & Ford, 2004; Mossman, Miller, Lee,
Gervais, Hart, & Wygant, 2015), they do not represent definitive judgments about the
performance of the TOMM. We might well have had different findings to report had we
examined data from psychiatric inpatients, from individuals who had suffered
demonstrably serious brain trauma, or from criminal defendants who were facing
prosecution.
(2) Although our prior-knowledge assumptions yielded similar results, our data
models were not the only conceivable ones. We also attempted to evaluate our data using
the conventional “binormal” ROC model and the dual-beta model recently proposed by
Mossman and Peng (2016). These models have the advantage of yielding smooth curves
and potential superior inferences about operating points (for further discussion, see
Mossman & Peng, 2016). However, implementing these models in OpenBUGS produced
highly correlated chains that converged poorly (even after 10,000 iterations) and in some
cases gave results that seemed implausible (e.g., prevalence values below 0.2, and AUCs
above 0.90 for several PVTs).
(3) As Uebersax (1988) notes, latent class methods yield upper bounds for accuracy
because they choose underlying classes that minimize error rates. These error-minimizing
latent classes can differ from the true classes if the probabilities of the empirical classes
depend on covariates. Whether this actually is the case is hard to know (Spencer, 2012),
but we do know that it is a clear possibility.
(4) Our method of analysis also risked unintentionally mistaking reliability for
validity. That is, we assumed that the subjects’ PVT scores represented valid ways of
assessing (a) the subjects’ responses to being tested, (b) whether subjects were trying to
look more impaired than was actually the case, and (c) in the case of those who engaged in
impression management, how those subjects approached the other cognitive evaluation
measures that were administered during their evaluations. Our statistical methods were
limited by the fact that irrelevant yet highly reliable assessment methods (e.g., assessing
malingering by counting letters in the evaluee’s last name) can appear very accurate. We
could also run into this problem if most evaluees (including malingerers) knew about these
tests and “played it straight” on the PVTs only. Many of our subjects’ PVTs scores were low
enough that we doubt this was the case—that is, they did so poorly on the PVTs that
exaggerating or feigning impairment was the only plausible explanation for their test
TOMM Trial 1 versus Trial 2 16
results. Nonetheless, this could have happened for a subset of actually malingering
evaluees.
(5) Our statistical inferences about malingering rates and PVT accuracy were based
on PVT data alone, which is an approach that mental health professionals should not and
ordinarily would not actually use. Usually, mental health professionals obtain additional
data from the evaluation session and from outside sources (e.g., family members, treatment
records) that are relevant to deciding how accurately evaluees are portraying themselves
and their abilities. We did not use non-test data in our study because in general, such data
are not quantified precisely and are therefore not amenable to the kinds of analysis we
employed. If mental health professionals did generate such data from their assessment,
however, then one could evaluate those data using the same methods we used here. If, for
example, evaluators provided Likert-scale judgments about the probability of invalid
responding based on their clinical data, the accuracy of those judgments could be treated as
an “effort measure” to be evaluated along with other PVTs or SVTs, using the statistical
approaches we employed.
(6) As is true for most investigations of PVTs and SVTs, we evaluated our data under
the assumption that subjects either gave valid responses or did not. Indeed, either evaluees
do their best or they don’t, but those evaluees who do less than their best may feign or
exaggerate with greater and lesser subtlety. Some disengaged evaluees simply do not put
forth much effort (see Frederick & Bowden, 2009) but do not necessarily intend to perform
at less than their best level. Our LCM model does not incorporate several notions that
Rogers (2008) has emphasized: evaluees engage in malingering to different degrees, they
have motivations that can affect PVT outcomes, and invalid responding has more causes
than conscious effort to do worse than one’s actual ability level. Notwithstanding this
limitation, we still believe it makes sense to draw a distinction between those evaluees who
engage in compliant, honest responding and those who respond to testing in other ways.
That is, we can know that non-genuine response styles take various forms while still
believing—consistent with the approach taken by all investigators who have tried to
quantify the accuracy of PVTs and SVTs—that evaluees either perform at their full ability
or do not.
Conclusion
Several recent articles have provided theoretical and data-based arguments to
suggest that Trial 1 of the TOMM is better than Trial 2 at detecting suboptimal effort in
neurocognitive assessments. Our findings showed that for about half the evaluees, Trial 1
data would allow an examiner to say, “This score means it’s unlikely that this individual
was feigning or exaggerating impairment,” and to say this with at least as much confidence
as a perfect Trial 2 result alone would justify. But given our data and statistical approach,
TOMM Trial 1 versus Trial 2 17
Trial 1 did not outperform Trial 2 in how often it would justify an examiner’s saying, “The
evidence makes me virtually sure that this individual was feigning.”
These TOMM-based characterizations of effort would apply only to evaluation
settings similar to those that generated our study data. We hope readers will consider
using the statistical techniques we have described to examine the TOMM and other
measures used in psycholegal determinations. We also hope that our work will inspire
development of additional ways to evaluate assessment tools used by forensic mental
health professionals.
References
Albert, P. S. (2007). Random effects modeling approaches for estimating ROC curves from
repeated ordinal tests without a gold standard. Biometrics, 63, 593-602.
Allen, L., Conder, R. L., Green, P., & Cox, D. R. (1997). CARB ‘97 Manual for the Computerized
Assessment of Response Bias. Durham, NC: CogniSyst, Inc.
Armistead-Jehle, P., & Hansen, C. L. (2011). Comparison of the repeatable battery for the
assessment of neuropsychological status effort index and stand-alone symptom
validity tests in a military sample. Archives of Clinical Neuropsychology, 26, 592–601.
Carlin, B. P., & Louis, T. A. (2009). Bayesian methods for data analysis. (3rd ed.). Boca
Raton, FL: Chapman & Hall/CRC.
Choi, Y. K., Johnson, W. O., Collins, M. T., & Gardner, I. A. (2006). Bayesian inferences for
receiver operating characteristic curves in the absence of a gold standard. Journal of
Agricultural, Biological, and Environmental Statistics, 11, 210-229.
Delis, D.C., Kramer, J.H., Kaplan, E., & Ober, B.A. (2000). California Verbal Learning Test –
Second Edition. San Antonio, TX: Psychological Corporation.
Denning, J. H. (2012). The efficiency and accuracy of the Test of Memory Malingering trial
1, errors on the first 10 items of the test of memory malingering, and five embedded
measures in predicting invalid test performance. Archives of Clinical
Neuropsychology, 27, 417-432. doi: 10.1093/arclin/acs044.
Denning, J. H. (2014). Combining the Test of Memory Malingering trial 1 with behavioral
responses improves the detection of effort test failure. Applied Neuropsychology:
Adult, 16, 269-277.
Fox, D. D. (2011). Symptom validity test failure indicates invalidity of neuropsychological
tests. The Clinical Neuropsychologist, 25, 488-95.
Frederick, R. I., & Bowden, S. C. (2009). The test validation summary. Assessment, 16, 215-
TOMM Trial 1 versus Trial 2 18
236.
Frederick, R. I., & Crosby, R. D. (2000). Development and validation of the Validity Indicator
Profile. Law and Human Behavior, 24, 59-82.
Gelfand, A. E., & Smith, A. F. M. (1990). Sampling-based approaches to calculating marginal
densities. Journal of the American Statistical Association, 85, 398-409.
Geman, S., & Geman, D. (1984). Stochastic relaxation, Gibbs distributions, and the Bayesian
restoration of images. IEEE Transactions on Pattern Analysis and Machine
Intelligence, PAMI–6, 721–741. http://dx.doi.org/10.1109/TPAMI.1984.4767596
Gervais, R. O., Rohling, M. L., Green, P., & Ford, W. (2004). A comparison of WMT, CARB, and
TOMM failure rates in non-head injury disability claimants. Archives of Clinical
Neuropsychology, 19, 475-487.
Green, P. (2003). Green’s Word Memory Test for Windows: User’s Manual. Edmonton,
Alberta, Canada: Green’s Publishing.
Green, P. (2004). Green’s Medical Symptom Validity Test (MSVT) for Windows: User’s
Manual. Edmonton, Alberta, Canada: Green’s Publishing.
Green, P., Allen, L., & Astner, K. (1996). The Word Memory Test: A user’s guide to the oral
and computer-administered forms, US Version 1.1. Durham, NC: CogniSyst, Inc.
Guilmette, T. J., Whelihan, W. M., Hart, K. J., Sporadeo, F. R., & Buongiorno, G. (1996). Order
effects in the administration of a forced-choice procedure for detection of malingering
in disability claimants’ evaluations. Perceptual and Motor Skills, 83, 1007–1016.
Gunner, J. H., Miele, A. D., Lynch, J. K., & McCaffrey, R. J. (2012). The Albany consistency
index for the Test of Memory Malingering. Archives of Clinical Neuropsychology, 27,
1–9.
Henkelman, R. M., Kay, I., & Bronskill, M. J. (1990). Receiver operator characteristic (ROC)
analysis without truth. Medical Decision Making, 10, 24-29.
Jafarzadeh, S. R., Johnson, W. O., & Gardner, I. A. (2016). Bayesian modeling and inference
for diagnostic accuracy and probability of disease based on multiple diagnostic
biomarkers with and without a perfect reference standard. Statistics in Medicine, 35,
859-876.
Kaufmann, P. M. (2009). Protecting raw data and psychological tests from wrongful
disclosure: A primer on the law and other persuasive strategies. The Clinical
Neuropsychologist, 23, 1130-1159.
Kerns, R. D., Turk, D. C., Rudy, T. E. (1985). The West Haven-Yale Multidimensional Pain
Inventory (WHYMPI). Pain, 23, 345–356.
TOMM Trial 1 versus Trial 2 19
Kulas, J. F., Axelrod, B. N., & Rinaldi, A. R. (2014). Cross-validation of supplemental Test of
Memory Malingering scores as performance validity measures. Psychological Injury
and Law, 7, 236-244.
Lunn, D., Spiegelhalter, D., Thomas, A., & Best, N. (2009). The BUGS project: Evolution,
critique and future directions. Statistics in Medicine, 28, 3049-3067
Marshall, P., Schroeder, R., O’Brien, J., Fischer, R., Ries, A., Blesi, B., et al. (2010).
Effectiveness of symptom validity measures in identifying cognitive and behavioral
symptom exaggeration in adult attention deficit hyperactivity disorder. The Clinical
Neuropsychologist, 24, 1204–1237.
Metropolis, N., Rosenbluth, A., Rosenbluth, M., Teller, A., & Teller, E. (1953). Equations of
state calculations by fast computing machines. The Journal of Chemical Physics, 21,
1087–1091. http://dx.doi.org/10.1063/1.1699114
Mossman, D. (2000). The meaning of malingering data: Further applications of Bayes’s
Theorem. Behavioral Sciences and the Law, 18, 761-779
Mossman, D., Bowen, M. D., Vanness, D. J., Bienenfeld, D., Correll, T., Kay, J., Klykylo, W. M., &
Lehrer, D. S. (2010). Quantifying the accuracy of forensic examiners in the absence of
a “gold standard.” Law and Human Behavior, 34, 402-417 doi: 10.1007/s10979-009-
9197-5
Mossman, D., & Hart, K. J. (1996). Presenting evidence of malingering to courts: insights
from decision theory. Behavioral Sciences and the Law, 14, 271-291
Mossman, D., Miller, W. G., Lee, E. R., Gervais, R. O., Hart, K. J., & Wygant, D. G. (2015). A
Bayesian approach to mixed group validation of performance validity tests.
Psychological Assessment, 27, 763–776. doi: 10.1037/pas0000085
Mossman, D., & Peng, H. (2016). Using dual beta distributions to create “proper” ROC
curves based on rating category data. Medical Decision Making, 36, 349–365 doi:
10.1177/0272989X15582210
Mossman, D., Wygant D. B., & Gervais R. O. (2012). Estimating the accuracy of
neurocognitive effort measures in the absence of a “gold standard.” Psychological
Assessment, 24, 815-822
Peirce, J. C., & Cornell, R. G. (1993). Integrating stratum-specific likelihood ratios with the
analysis of ROC curves. Medical Decision Making, 13, 141-51.
Resnick, P. J., & Knoll, J. L. IV. (2008). Malingered psychosis. In R. Rogers (ed.), Clinical
assessment of malingering and deception (3rd Edition, pp. 51-68). New York: Guilford
Press.
Resnick, P. J., West, S., & Payne, J. W. (2008). Malingering of posttraumatic stress disorders.
TOMM Trial 1 versus Trial 2 20
In R. Rogers (Ed.), Clinical assessment of malingering and deception (3rd Ed., pp. 109-
127). New York: Guilford Press.
Rogers, R. (2008). Clinical assessment of malingering and deception, 3rd ed. New York: The
Guilford Press.
Rogers, R., Sewell, K. W., & Gillard, N. D. (2010). SIRS-2: Structured Interview of Reported
Symptoms: Professional manual. Psychological Assessment Resources, Incorporated.
Schroeder, R. W., Buddin, W. H., Jr., Hargrave, D. D., VonDran, E. J., Campbell, E. B.,
Brockman, C. J., Heinrichs, R. J., & Baade, L. E. (2013). Efficacy of test of memory
malingering Trial 1, Trial 2, the Retention Trial, and the Albany Consistency Index in a
criterion group forensic neuropsychological sample. Archives of Clinical
Neuropsychology, 28, 21-9. doi: 10.1093/arclin/acs094.
Schroeder, R. W., Baade, L. E., Peck, C. P., & Heinrichs, R. J. (2011). Use of test of memory
malingering trial 1 as a measure of response bias. Clinical Neuropsychologist, 26, 564.
Spencer, B. D. (2012). When do latent class models overstate accuracy for diagnostic and
other classifiers in the absence of a gold standard? Biometrics, 68, 559-566.
Test of Memory Malingering. (n.d.). In Wikipedia. Retrieved October 23, 2016 from
https://en.wikipedia.org/wiki/Test_of_Memory_Malingering.
Tombaugh, T. N. (1996). The Test of Memory Malingering. Toronto, Canada: Multi-Health
Systems.
Tombaugh, T. N. (2003). The Test of Memory Malingering in forensic psychology. In J. Hom,
& R.L. Denney (Eds.), Detection of response bias in forensic neuropsychology (Volume
2, pp. 69-96). Binghamton, NY: Haworth Medical Press.
Uebersax, J. S., Grove, W. M. (1990). Latent class analysis of diagnostic agreement. Statistics
in Medicine, 9, 559-572.
Wills, C. D. (2008). The CHESS method of forensic opinion formulation: striving to
checkmate bias. Journal of the American Academy of Psychiatry and the Law, 36, 535–
40.
TOMM Trial 1 versus Trial 2 21
Table 1. – Bayesian estimates of the areas under the ROC curve (median AUCs and 95% credible intervals) for neurocognitive
effort measures under the agnostic and partial-truth information assumptions. Values are rounded to two significant digits.
Information
Assumption
AUC (95% credible interval)
WMT CARB TOMM Trial 1 TOMM Trial 2 CVLTFC prevalence
agnostic
0.91 (0.84–0.96) 0.73 (0.66–0.80) 0.83 (0.76–0.89) 0.73 (0.65–0.80) 0.29 (0.23–0.38)
0.92 (0.86–0.96) 0.73 (0.66–0.79) 0.76 (0.69–0.82) 0.72 (0.65–0.78) 0.32 (0.26–0.40)
partial truth
0.92 (0.88–0.95) 0.73 (0.67–0.79) 0.85 (0.80–0.90) 0.74 (0.68–0.80) 0.32 (0.27–0.40)
0.94 (0.90–0.97) 0.75 (0.69–0.80) 0.78 (0.73–0.84) 0.74 (0.68–0.80) 0.30 (0.25–0.36)
WMT = Word Memory Test
CARB = Computerized Assessment of Response Bias
TOMM Trial 1 = Test of Memory Malingering Trial 1
TOMM Trial 2 = Test of Memory Malingering Trial 2
CVLTFC = California Verbal Learning Test-II Forced Choice Trial
prevalence = estimated portion of subjects who were feigning
TOMM Trial 1 versus Trial 2 22
Table 2. – Bayesian estimates (medians and 95% credible intervals) of the stratum-specific likelihood ratio (SSLR) and
calculated posterior probability of feigning for a given score on Trial 1 of the TOMM [p(M|T1)] under the agnostic and partial-
truth assumptions about prior knowledge of subjects’ feigning status, assuming a feigning prevalence of 30 percent. Values
are rounded to two significant digits.
Trial 1 score
percentage of subjects
agnostic partial truth
SSLR p(M|T1) SSLR p(M|T1)
49-50 37.8% 0.30 (0.16–0.50) 0.11 (0.065–0.18) 0.24 (0.14–0.39) 0.095 (0.056–0.14)
48 11.4% 0.28 (0.087–0.60) 0.11 (0.036–0.21) 0.31 (0.12–0.60) 0.12 (0.049–0.20)
47 8.6% 0.34 (0.12–0.78) 0.13 (0.048–0.25) 0.37 (0.13–0.78) 0.14 (0.055–0.25)
46 7.7% 0.45 (0.12–1.0) 0.16 (0.049–0.30) 0.52 (0.19–1.1) 0.18 (0.076–0.32)
45 5.4% 0.85 (0.24–2.0) 0.27 (0.092–0.46) 0.88 (0.32–2.0) 0.27 (0.12–0.46)
44 3.8% 1.3 (0.20–3.5) 0.35 (0.078–0.60) 1.5 (0.48–3.9) 0.39 (0.17–0.63)
42-43 6.7% 2.0 (0.82–5.1) 0.47 (0.26–0.69) 3.0 (1.3–7.1) 0.56 (0.35–0.75)
40-41 4.2% 10 (4.3–29) 0.81 (0.65–0.93) 14 (5.6–51) 0.86 (0.71–0.96)
37-39 3.8% 18 (6.9–92) 0.88 (0.75–0.98) 38 (11–5000) 0.94 (0.83–1)
≤36 10.4% 200 (41–1.2×10⁶) 0.99 (0.95–1) 9100 (220–1.2×10¹⁰) 1.00 (0.99–1)
TOMM Trial 1 versus Trial 2 23
Table 3. – Bayesian estimates (medians and 95% credible intervals) of the stratum-specific likelihood ratio (SSLR) and
calculated posterior probability of feigning for a given score on Trial 2 of the TOMM [p(M|T2)] under the agnostic and partial-
truth assumptions about prior knowledge of subjects’ feigning status, assuming a feigning prevalence of 30 percent. Values
are rounded to two significant digits.
Trial 2 score
percentage of subjects
agnostic partial truth
SSLR p(M|T2) SSLR p(M|T2)
50 75.1% 0.48 (0.35–0.61) 0.17 (0.13–0.21) 0.44 (0.31–0.54) 0.16 (0.12–0.19)
49 8.7% 1.4 (0.67–2.4) 0.37 (0.22–0.51) 1.3 (0.63–2.4) 0.35 (0.21–0.5)
48 2.8% 24 (6.8–740) 0.91 (0.74–1) 22 (6.8–300) 0.91 (0.74–0.99)
47 1.3% 25 (4.6–19000) 0.91 (0.66–1) 26 (4.8–2.1 ×10⁴) 0.92 (0.67–1)
46 1.1% 210 (10–9.7×10⁸) 0.99 (0.82–1) 420 (17–1.2×10⁹) 0.99 (0.88–1)
45 0.6% 2000 (12–8.3×10¹²) 1 (0.84–1) 1.5 ×10⁴ (40–8.8×10¹³) 1 (0.94–1)
43-44 1.7% 1.2 ×10⁵ (40–5.9×10¹⁸) 1 (0.94–1) 2.9 ×10⁶ (820–7.1×10¹⁸) 1 (1–1)
41-44 1.3% 1.1 ×10⁷ (230–5.4×10¹⁸) 1 (0.99–1) 3.4×10⁸ (3200–6.4×10¹⁸) 1 (1–1)
38-40 2.1% 2.7×10⁹ (580–8.0×10¹⁸) 1 (1–1) 1.4×10¹¹ (3.9×10⁴–9.3×10¹⁸) 1 (1–1)
≤37 5.3% 1.1×10¹² (8800–1.1×10¹⁹) 1 (1–1) 7.7×10¹³ (4.2×10⁵–1.3×10¹⁹) 1 (1–1)
TOMM Trial 1 versus Trial 2 24
Table 4. – Numbers of study subjects with various combinations of scores on Trial 1 and Trial 2 of the TOMM, with
interpretation of performance validity. Numbers along the right and bottom margins of the table show marginal totals. Empty
cells contain no subjects.
Trial 2 scores
50 49 48 47 46 45 43-44 41-44 38-40 ≤37
Tri
al 1
sco
res
49-50 432 19 2 453
48 127 9 1 137
47 84 18
1 103
46 78 12 1 1 92
45 58 4 2
1 65
44 35 7
2 1 45
42-43 51 14 8 1 4 1
1
80
40-41 20 11 6 5 2 1 2 3 1
51
37-39 11 7 5 5 1 4 5 3 4 1 46
≤36 4 3 8 1 4 1 13 9 20 63 126
900 104 33 16 13 7 20 16 25 64 1198
x = definitely feigning by the TOMM manual’s criterion (N=125)
x = definitely feigning based on study findings (N=36)
x = probably feigning based on study findings (N=89)
TOMM Trial 1 versus Trial 2 25
Figure 1. – ROC graph showing the discriminatory performance of four performance
validity tests under the agnostic knowledge assumption. WMT = Word Memory Test;
TOMM Tr 1 = Test of Memory Malingering Trial 1; CARB = Computerized Assessment of
Response Bias; CVLTFC = California Verbal Learning Test-II Forced Choice Trial.
TOMM Trial 1 versus Trial 2 26
Figure 2. – ROC graph showing the discriminatory performance of four performance
validity tests under the partial truth knowledge assumption. WMT = Word Memory Test;
TOMM Tr 1 = Test of Memory Malingering Trial 1; CARB = Computerized Assessment of
Response Bias; CVLTFC = California Verbal Learning Test-II Forced Choice Trial.
TOMM Trial 1 versus Trial 2 27
Figure 3. – ROC graph showing the discriminatory performance of four performance
validity tests under the agnostic knowledge assumption. WMT = Word Memory Test;
TOMM Tr 2 = Test of Memory Malingering Trial 2; CARB = Computerized Assessment of
Response Bias; CVLTFC = California Verbal Learning Test-II Forced Choice Trial.
TOMM Trial 1 versus Trial 2 28
Figure 4. – ROC graph showing the discriminatory performance of four performance
validity tests under the partial truth knowledge assumption. WMT = Word Memory Test;
TOMM Tr 2 = Test of Memory Malingering Trial 2; CARB = Computerized Assessment of
Response Bias; CVLTFC = California Verbal Learning Test-II Forced Choice Trial.
TOMM Trial 1 versus Trial 2 29
Figure 5. – ROC graph comparing the discriminatory performance of Trial 1 and Trial 2 of
the Test of Memory Malingering under the agnostic knowledge assumption.

TOMM Trial 1 versus Trial 2 30
Figure 6. – ROC graph comparing the discriminatory performance of Trial 1 and Trial 2 of
the Test of Memory Malingering under the partial truth knowledge assumption.