Embed Size (px)
Citation preview
Flagstaff Metropolitan
Planning Organization 211 West Aspen Avenue Flagstaff, AZ 86001 Coconino County 219 East Cherry Avenue Flagstaff, AZ 86001 City of Flagstaff 211 West Aspen Avenue Flagstaff, AZ 86001 Prepared by: 3005 30th Street Boulder, CO 80301 t: 303-444-7863 f: 303-444-1145 www.n-r-c.com In association with:
Trip Diary Survey of Community Travel Patterns Report of Results May 2007
Table of Contents
EXECUTIVE SUMMARY ............................................................................................................ 1
REPORT OF RESULTS ............................................................................................................. 6 Survey Background ...............................................................................................................6
Modal Share................................................................................................................................9 Modal Share of the Work Commute ................................................................................... 12 Modal Share of Northern Arizona University Students’ Travel .................................................17 Modal Share of Children’s School Commute...................................................................... 18
Trip Characteristics..................................................................................................................... 19 Trip Chaining ...................................................................................................................... 28 Deliveries to the Home or Work ........................................................................................... 31 Trip Characteristics of the Work Commute.......................................................................... 31 Personal Motorized Vehicle Trip Characteristics ................................................................. 32 Transit Trip Characteristics ...................................................................................................33 Non-Vehicle Trip Characteristics: Walking and Biking ..........................................................35
Resident Perceptions of Travel in the Flagstaff Area ...................................................................37 Comparisons to Other Jurisdictions .....................................................................................39
APPENDIX A: RESPONDENT DEMOGRAPHICS ............................................................................. 43
APPENDIX B: SELECTED STUDY RESULTS BY TRIP AND RESPONDENT CHARACTERISTICS ..............................47
APPENDIX C: STUDY METHODS.............................................................................................. 55 Study Design........................................................................................................................55 Response Rates...................................................................................................................55 Weather Conditions During the Study Period .......................................................................56 Analysis of Results ................................................................................................................56
APPENDIX D: SURVEY MATERIALS ........................................................................................... 58

Trip Diary Survey of Community Travel Patterns Report of Results
© 2007 National Research Center, Inc.
Page 1
EXECUTIVE SUMMARY
Survey Background
The Travel Diary Study is a survey of the Flagstaff Metropolitan Planning Organization’s (FMPO) area residents’ travel patterns and mode selection. This is the first implementation of this study. The study is designed to provide feedback to FMPO staff on resident travel behaviors useful for future transportation planning. The FMPO intends to repeat this study about every five years to provide trend data.
A random sample of about 2,400 households and students living in campus housing were invited to participate in the study. This sample was divided into three areas: the “Core” area of the City of Flagstaff, the rest of the City, and then the rest of the Flagstaff area. (The figure on page 8 shows the division of the Flagstaff area into these three subareas.)
From the selected sample, 320 completed surveys were received, providing a response rate of approximately 14%. While lower than a typical resident opinion survey response rate (which usually ranges from 25% to 40%), this response rate is not untypical for a travel diary study of this type, which places a greater burden on respondents. Typical response rates for these types of studies range from 12% to 20%.
A sample size of 320 yields a 95% confidence interval of ±5.5% around results.
Participants in the 2006 Travel Diary Study were asked to keep a log or “diary” of their travel for one randomly assigned day (Monday-Friday) during the week of October 2nd (or a replacement week if necessary). For every trip made during the 24 hour period, respondents recorded the origin and destination of the travel, the travel mode used, the time of day, the number of people in the vehicle (if applicable), and the number of miles or blocks traversed during the 24 hour period. A trip was defined as any “one-way travel from one point to another that takes you farther than one city block (about 200 yards) from the original location.”
The participants were also asked to complete a survey regarding their household characteristics such as number of vehicles and bicycles present in the household, receipt of deliveries, quality of transportation and other general socioeconomic demographics.
Drive Alone Trips Accounted for 57% of All Resident Trips
Transportation mode choice or “modal share” can be defined as a method of dividing travel into all available transportation modes and can refer to the number of modes, number of trips or number of miles traveled. This study uses the number of trips and number of miles when calculating modal share, and classifies the modes as single-occupancy vehicle (SOV, an automobile, van, truck or motorcycle which has only one occupant), multiple-occupancy vehicle (MOV, an automobile, truck or motorcycle with more than one occupant), transit (including school bus), pedestrian (foot), and bicycle.
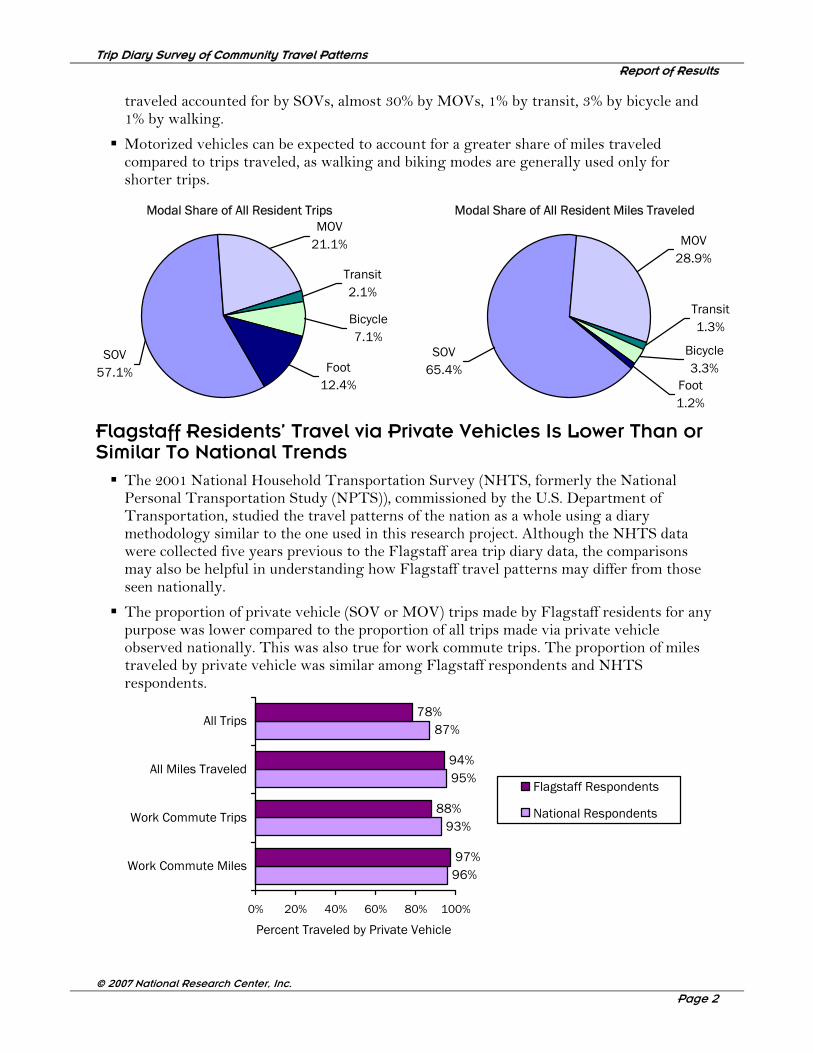
Over half of all the trips made by respondents were made by driving alone. About 1 in 5 trips were made via MOV, while 12% of trips were made by walking, 7% by biking, and 2% by transit.
When examining the proportion of miles traveled by the various modes, the proportion of miles traveled by vehicle was somewhat greater, with nearly two-thirds of all miles
Trip Diary Survey of Community Travel Patterns Report of Results
© 2007 National Research Center, Inc.
Page 2
MOV21.1%
Transit2.1%
Bicycle7.1%
SOV57.1% Foot
12.4%
traveled accounted for by SOVs, almost 30% by MOVs, 1% by transit, 3% by bicycle and 1% by walking.
Motorized vehicles can be expected to account for a greater share of miles traveled compared to trips traveled, as walking and biking modes are generally used only for shorter trips.
Modal Share of All Resident Trips Modal Share of All Resident Miles Traveled
Flagstaff Residents’ Travel via Private Vehicles Is Lower Than or Similar To National Trends
The 2001 National Household Transportation Survey (NHTS, formerly the National Personal Transportation Study (NPTS)), commissioned by the U.S. Department of Transportation, studied the travel patterns of the nation as a whole using a diary methodology similar to the one used in this research project. Although the NHTS data were collected five years previous to the Flagstaff area trip diary data, the comparisons may also be helpful in understanding how Flagstaff travel patterns may differ from those seen nationally.
The proportion of private vehicle (SOV or MOV) trips made by Flagstaff residents for any purpose was lower compared to the proportion of all trips made via private vehicle observed nationally. This was also true for work commute trips. The proportion of miles traveled by private vehicle was similar among Flagstaff respondents and NHTS respondents.
96%
93%
95%
87%
97%
88%
94%
78%
0% 20% 40% 60% 80% 100%
Work Commute Miles
Work Commute Trips
All Miles Traveled
All Trips
Percent Traveled by Private Vehicle
Flagstaff Respondents
National Respondents
MOV28.9%
Transit1.3%
Bicycle3.3%
SOV65.4%
Foot1.2%
Trip Diary Survey of Community Travel Patterns Report of Results
© 2007 National Research Center, Inc.
Page 3
70
%
8%
0% 2%
21
%
71
%
18
%
0% 5
% 6%
82
%
16
%
0% 1%
0%
0%
20%
40%
60%
80%
100%
SOV MOV Transit Bicycle Foot
Perc
ent o
f Wor
k Co
mm
ute
Trip
s
24.8
18.7
16.8
16.6
0 5 10 15 20 25
Work-Related Trip Duration
Average Trip Duration (All Trips)
Minutes
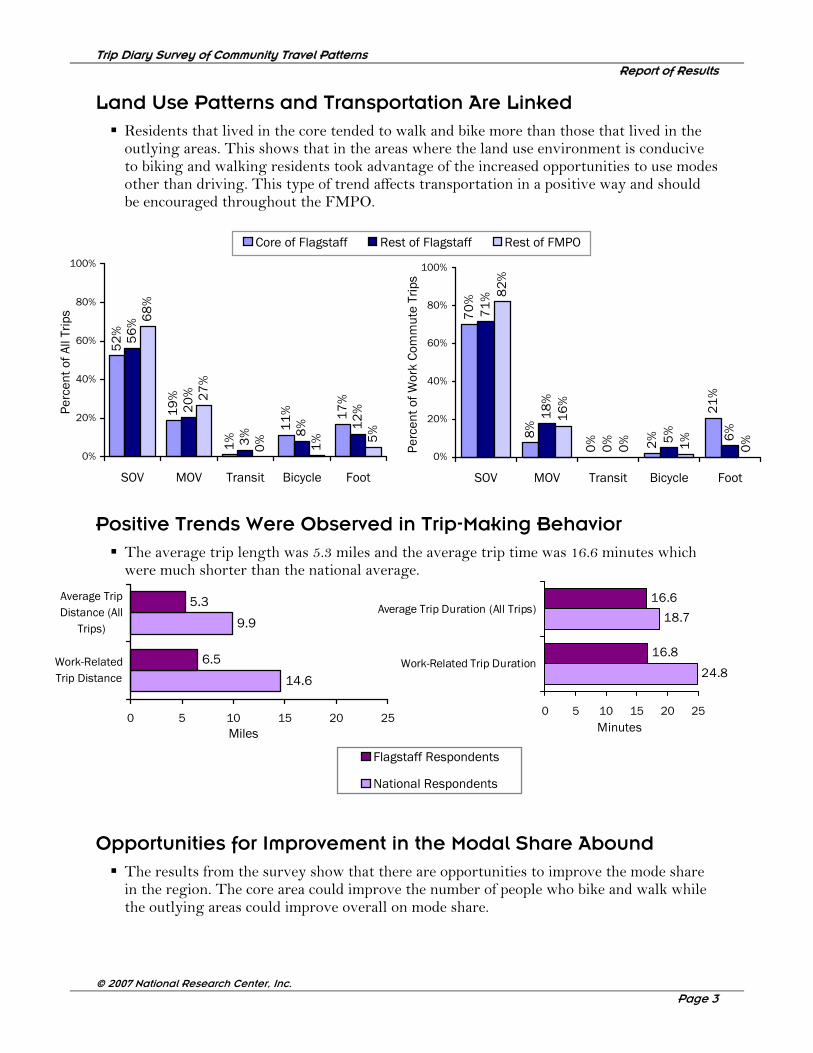
Land Use Patterns and Transportation Are Linked
Residents that lived in the core tended to walk and bike more than those that lived in the outlying areas. This shows that in the areas where the land use environment is conducive to biking and walking residents took advantage of the increased opportunities to use modes other than driving. This type of trend affects transportation in a positive way and should be encouraged throughout the FMPO.
Positive Trends Were Observed in Trip-Making Behavior
The average trip length was 5.3 miles and the average trip time was 16.6 minutes which were much shorter than the national average.
14.6
9.9
6.5
5.3
0 5 10 15 20 25
Work-RelatedTrip Distance
Average TripDistance (All
Trips)
Miles
Flagstaff Respondents
National Respondents
Opportunities for Improvement in the Modal Share Abound
The results from the survey show that there are opportunities to improve the mode share in the region. The core area could improve the number of people who bike and walk while the outlying areas could improve overall on mode share.
52
%
19
%
1%
11
% 17
%
56
%
20
%
3% 8
% 12
%
68
%
27
%
0% 1% 5
%
0%
20%
40%
60%
80%
100%
SOV MOV Transit Bicycle Foot
Perc
ent o
f All
Trip
s
Core of Flagstaff Rest of Flagstaff Rest of FMPO
Trip Diary Survey of Community Travel Patterns Report of Results
© 2007 National Research Center, Inc.
Page 4
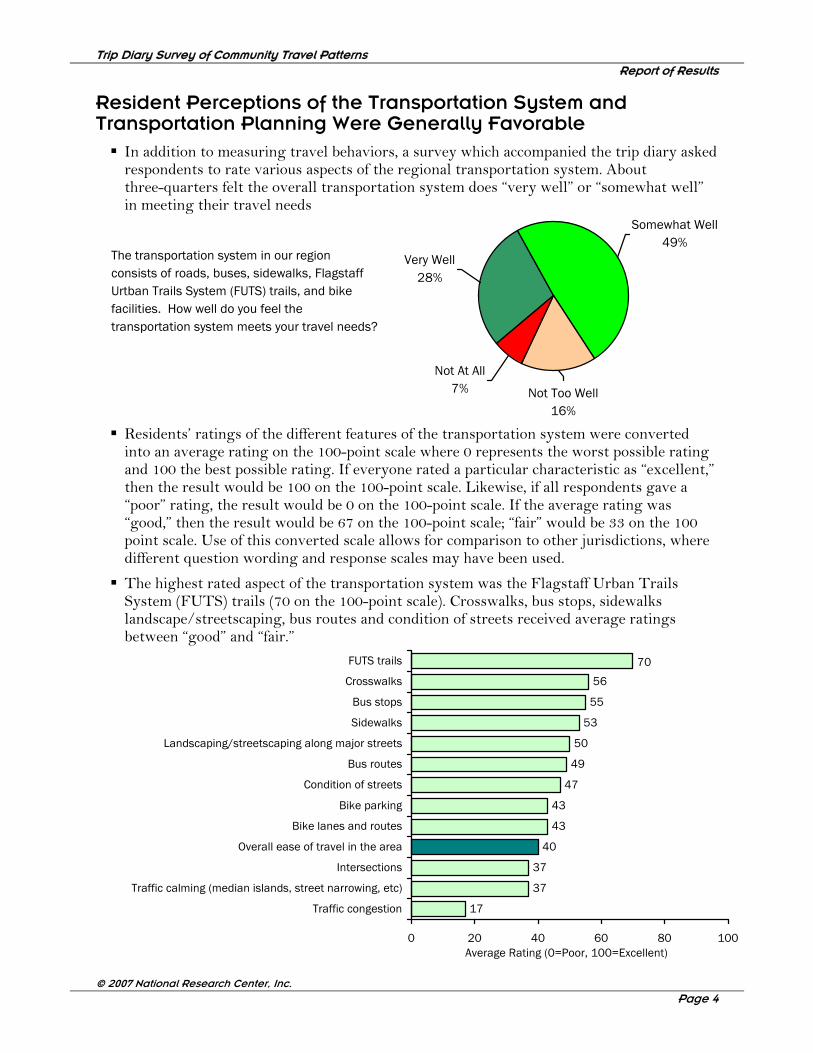
17
37
37
40
43
43
47
49
50
53
55
56
70
0 20 40 60 80 100
Traffic congestion
Traffic calming (median islands, street narrowing, etc)
Intersections
Overall ease of travel in the area
Bike lanes and routes
Bike parking
Condition of streets
Bus routes
Landscaping/streetscaping along major streets
Sidewalks
Bus stops
Crosswalks
FUTS trails
Average Rating (0=Poor, 100=Excellent)
Resident Perceptions of the Transportation System and Transportation Planning Were Generally Favorable
In addition to measuring travel behaviors, a survey which accompanied the trip diary asked respondents to rate various aspects of the regional transportation system. About three-quarters felt the overall transportation system does “very well” or “somewhat well” in meeting their travel needs
Very Well28%
Not At All7% Not Too Well
16%
Somewhat Well49%
The transportation system in our region consists of roads, buses, sidewalks, Flagstaff Urtban Trails System (FUTS) trails, and bike facilities. How well do you feel the transportation system meets your travel needs?
Residents’ ratings of the different features of the transportation system were converted into an average rating on the 100-point scale where 0 represents the worst possible rating and 100 the best possible rating. If everyone rated a particular characteristic as “excellent,” then the result would be 100 on the 100-point scale. Likewise, if all respondents gave a “poor” rating, the result would be 0 on the 100-point scale. If the average rating was “good,” then the result would be 67 on the 100-point scale; “fair” would be 33 on the 100 point scale. Use of this converted scale allows for comparison to other jurisdictions, where different question wording and response scales may have been used.
The highest rated aspect of the transportation system was the Flagstaff Urban Trails System (FUTS) trails (70 on the 100-point scale). Crosswalks, bus stops, sidewalks landscape/streetscaping, bus routes and condition of streets received average ratings between “good” and “fair.”
Trip Diary Survey of Community Travel Patterns Report of Results
© 2007 National Research Center, Inc.
Page 5
Some of the ratings of aspects of the transportation system were able to be compared to ratings given by residents to similar items on surveys conducted across the country.
Of the six items for which comparison data were available, four of the items scored statistically significantly above average. Aspects of the transportation system rated above the norm were:
- FUTS trails - Bus routes - Sidewalks - Condition of streets
There are Opportunities for Improvement in Resident Perceptions
The average rating for overall ease of travel was below the midpoint of the range; 40 on the 100-point scale.
Several of the items included on the survey received average ratings lower than 40 on the 100-point scale. Traffic congestion received an especially low rating of 17 on the 100-point scale, while “intersections” and “traffic calming” each received average ratings of 37 on the 100-point scale.
Two of the six items for which comparison data were available received average ratings below the norm. These were:
- Bike lanes/routes - Traffic congestion
Trip Diary Survey of Community Travel Patterns Report of Results
© 2007 National Research Center, Inc.
Page 6
REPORT OF RESULTS Survey Background
The Travel Diary Study is a periodic survey of the Flagstaff Metropolitan Planning Organization’s (FMPO) area residents’ travel patterns and mode selection. This is the first implementation of the travel diary in Flagstaff. The study is designed to provide feedback to FMPO staff on travel patterns useful for future transportation planning. The FMPO intends to repeat this study about every five years to provide trend data.
A random sample of about 2,400 households and students living in campus housing were invited to participate in the study. This sample was divided into three areas: the “Core” area of the City of Flagstaff, the rest of the City, and then the rest of the Flagstaff area. The figure on page 8 shows the division of the Flagstaff area into these three subareas. From the selected sample, 320 completed the surveys were received, providing a response rate of approximately 14%. While lower than a typical resident opinion survey response rate (which usually ranges from 25% to 40%), this response rate is not untypical for a travel diary study of this type, which places a greater burden on respondents. Typical response rates for these types of studies range from 12% to 20%. A sample size of 320 yields a 95% confidence interval of ±5.5% around results.
Selected households were mailed a pre-notification postcard informing them they had been randomly selected to participate in the Travel Diary Study, while the selected students in University group quarters were sent an e-mail prenotification. One week after their pre-notification, the full travel study packets were sent to all those selected for the study. Additionally, a reminder postcard was sent to residents one week after the travel study packets were sent.
Participants in the study were asked to keep a log or “diary” of their travel for one randomly assigned day during the week (Monday-Friday) of October 2nd (or a replacement week if necessary). For every trip made during the 24 hour period, they recorded the origin and destination of the travel, the travel mode used, the time of day, the number of people in the vehicle (if applicable), and the number of miles or blocks traversed during the 24 hour period. A trip was defined as any “one-way travel from one point to another that takes you farther than one city block (about 200 yards) from the original location.”
The participants were also asked to complete a survey regarding their adult household members’ attitudes towards the quality of local transportation, alternative transportation options provided by employers, number of vehicles, and general socioeconomic information about the household and the study participant (see Appendix D: Survey Materials for copies of the survey materials). Results were statistically weighted so that demographics of respondents matched population demographics. More information about the study methodology is contained in Appendix C: Study Methods.
Study Limitations
Several methodological limitations of the research should be considered when interpreting these results. First, the self-report nature of the data collection meant that the data had the potential to be limited by social desirability bias, i.e., the tendency to respond to questions in a
Trip Diary Survey of Community Travel Patterns Report of Results
© 2007 National Research Center, Inc.
Page 7
manner that is socially acceptable or preferred. While asking people to record each trip made should help to limit this bias in reporting trip-making behavior, other questions may have been influenced by this type of bias. For example, people may have tended to report having voted, or having voted in a certain way, if they perceive that a certain answer would be considered “more acceptable.”
Second, selection bias may have influenced the results due to the fact that participants were not required to participate in the survey. Of those who were invited to do so, only 14% chose to complete a trip diary. The type of respondent who was interested in participating may have different travel behaviors or opinions than those who ignored the invitation, or forgot to complete their survey. It is assumed that those with an interest in transportation issues are more likely to be traveling by modes other than driving alone. Selection bias is a limitation with which most studies of this type have to contend. By replicating the same survey methods over time, changes observed in the trend line can be deemed accurate, although the point estimates for each year may underestimate the proportion of trips traveled by driving alone.
Third, the weather may have influenced travel behavior. However, it does not appear that the weather during the travel diary week was extremely unusual (see Table 68 on page 56 in Appendix C: Study Methods).
Finally, the relatively small sample size limits the ability to examine travel behavior by subgroups. For example, investigation of the characteristics of transit trips and those who used transit is limited by the fact that less than 5% of respondents made any trips via transit, and only 2% of all the trips recorded were made using transit. The 95% confidence interval around results is ±5.5%; this may be sufficient for many planning purposes, but more precise estimates may be desirable. In future implementations, if resources allow, a larger sample should be recruited, and additional efforts made to increase the response rate among those who are contacted.

Trip Diary Survey of Community Travel Patterns Report of Results
© 2007 National Research Center, Inc.
Page 8
Figure 1: Map of Flagstaff Area Showing "Core," the Rest of the City and the Rest of the Flagstaff Area
Rest of the Flagstaff Area
City of Flagstaff
“Core”
Detail of the “Core”
E
W
N S
Trip Diary Survey of Community Travel Patterns Report of Results
© 2007 National Research Center, Inc.
Page 9
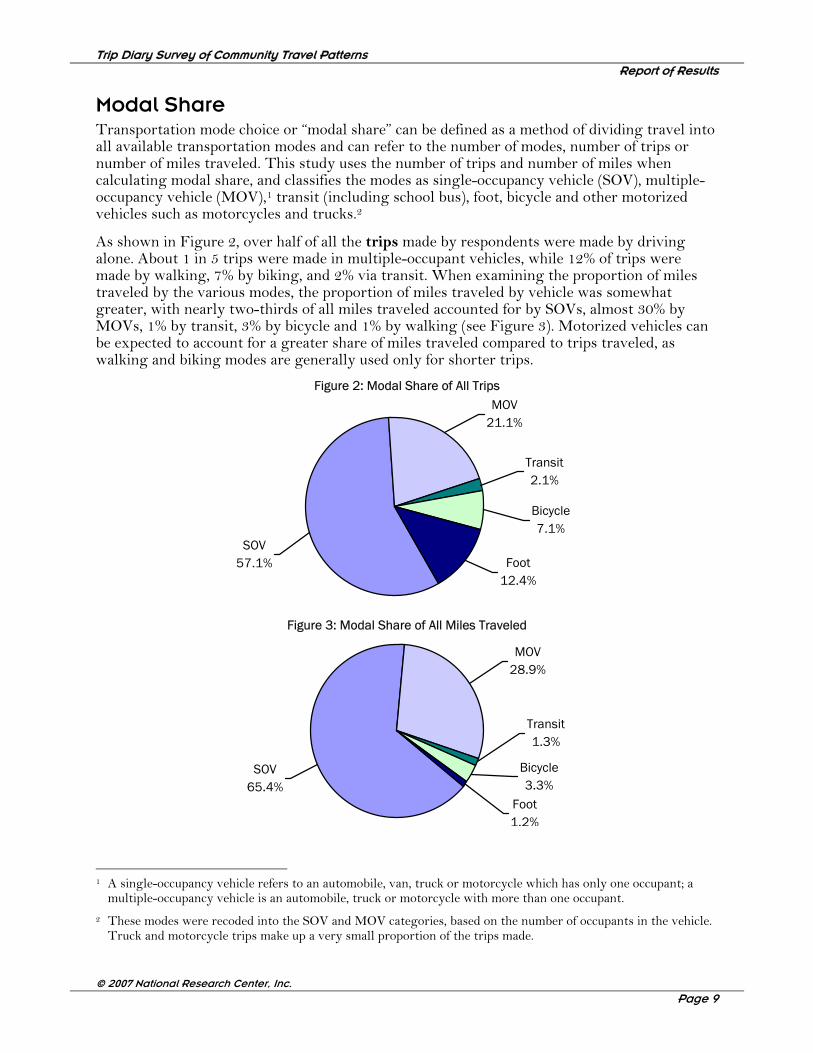
Modal Share Transportation mode choice or “modal share” can be defined as a method of dividing travel into all available transportation modes and can refer to the number of modes, number of trips or number of miles traveled. This study uses the number of trips and number of miles when calculating modal share, and classifies the modes as single-occupancy vehicle (SOV), multiple-occupancy vehicle (MOV),1 transit (including school bus), foot, bicycle and other motorized vehicles such as motorcycles and trucks.2
As shown in Figure 2, over half of all the trips made by respondents were made by driving alone. About 1 in 5 trips were made in multiple-occupant vehicles, while 12% of trips were made by walking, 7% by biking, and 2% via transit. When examining the proportion of miles traveled by the various modes, the proportion of miles traveled by vehicle was somewhat greater, with nearly two-thirds of all miles traveled accounted for by SOVs, almost 30% by MOVs, 1% by transit, 3% by bicycle and 1% by walking (see Figure 3). Motorized vehicles can be expected to account for a greater share of miles traveled compared to trips traveled, as walking and biking modes are generally used only for shorter trips.
Figure 2: Modal Share of All Trips MOV
21.1%
Transit2.1%
Bicycle7.1%
SOV57.1% Foot
12.4%
Figure 3: Modal Share of All Miles Traveled
1 A single-occupancy vehicle refers to an automobile, van, truck or motorcycle which has only one occupant; a
multiple-occupancy vehicle is an automobile, truck or motorcycle with more than one occupant. 2 These modes were recoded into the SOV and MOV categories, based on the number of occupants in the vehicle.
Truck and motorcycle trips make up a very small proportion of the trips made.
MOV28.9%
Transit1.3%
Bicycle3.3%
SOV65.4%
Foot1.2%

Trip Diary Survey of Community Travel Patterns Report of Results
© 2007 National Research Center, Inc.
Page 10
Examination of modal share by area of residence showed that those who lived in the “core” area of the city of Flagstaff were less likely to have made trips by driving alone (52%) than were those who lived in the rest of the city (56%) or in the remainder of the Flagstaff Metropolitan Planning Organization (FMPO) area (68%, see Figure 4). Likewise, those who lived in the core were more likely to have made trips by bicycling or walking than those who lived outside the core area. The survey results show a positive relationship between land use and transportation. People are more willing to walk and bike if they are located in the core because the land use patterns and accommodations make it a more viable option. The FMPO should think about transit and mobility differently in each of the geographic areas. There may need to be a focus on walkability and mode share within the core and a focus on levels of service in the outlying areas where mode shift is less likely.
Figure 4: Modal Share of All Trips by Area of Residence
52
.3%
18
.7%
1.0
%
11
.1%
16
.8%
56
.3%
20
.4%
3.4
% 8.1
%
11
.8%
67
.7%
26
.6%
0.0
%
0.6
% 5.0
%
0%
20%
40%
60%
80%
100%
SOV MOV Transit Bicycle Foot
Perc
ent o
f All
Trip
s
Core of Flagstaff Rest of Flagstaff Rest of FMPO
Trip Diary Survey of Community Travel Patterns Report of Results
© 2007 National Research Center, Inc.
Page 11
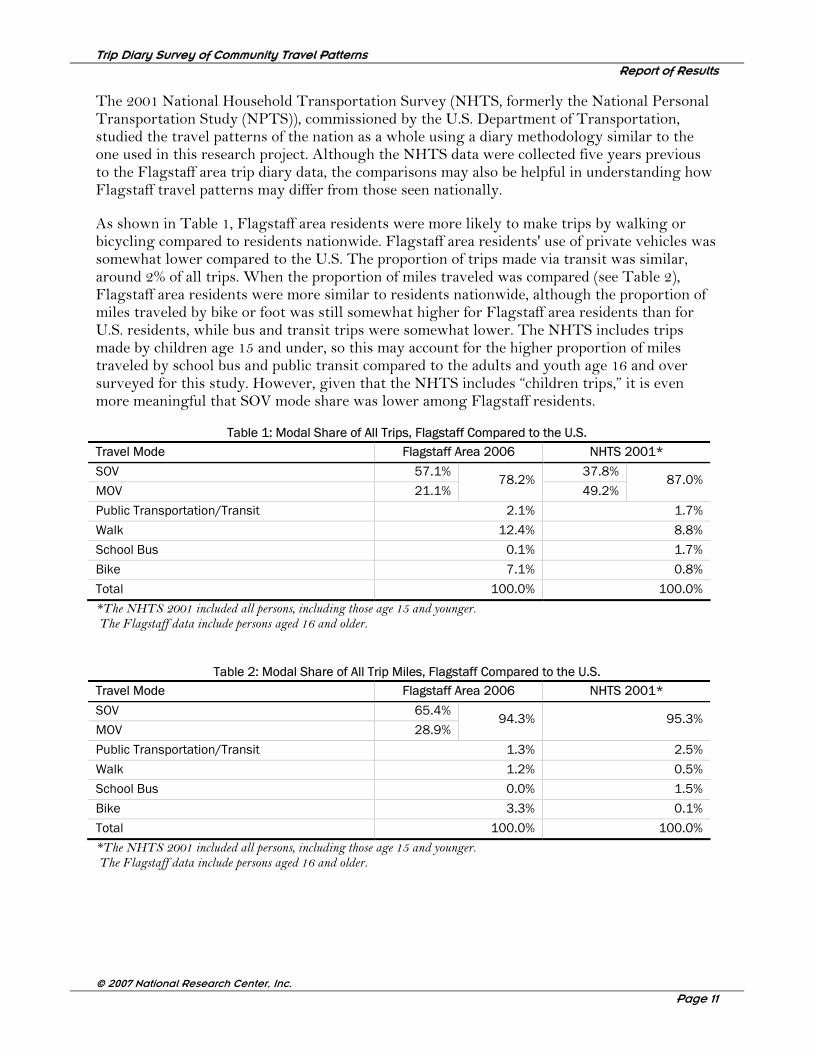
The 2001 National Household Transportation Survey (NHTS, formerly the National Personal Transportation Study (NPTS)), commissioned by the U.S. Department of Transportation, studied the travel patterns of the nation as a whole using a diary methodology similar to the one used in this research project. Although the NHTS data were collected five years previous to the Flagstaff area trip diary data, the comparisons may also be helpful in understanding how Flagstaff travel patterns may differ from those seen nationally.
As shown in Table 1, Flagstaff area residents were more likely to make trips by walking or bicycling compared to residents nationwide. Flagstaff area residents' use of private vehicles was somewhat lower compared to the U.S. The proportion of trips made via transit was similar, around 2% of all trips. When the proportion of miles traveled was compared (see Table 2), Flagstaff area residents were more similar to residents nationwide, although the proportion of miles traveled by bike or foot was still somewhat higher for Flagstaff area residents than for U.S. residents, while bus and transit trips were somewhat lower. The NHTS includes trips made by children age 15 and under, so this may account for the higher proportion of miles traveled by school bus and public transit compared to the adults and youth age 16 and over surveyed for this study. However, given that the NHTS includes “children trips,” it is even more meaningful that SOV mode share was lower among Flagstaff residents.
Table 1: Modal Share of All Trips, Flagstaff Compared to the U.S. Travel Mode Flagstaff Area 2006 NHTS 2001*
SOV 57.1% 37.8%
MOV 21.1% 78.2%
49.2% 87.0%
Public Transportation/Transit 2.1% 1.7%
Walk 12.4% 8.8%
School Bus 0.1% 1.7%
Bike 7.1% 0.8%
Total 100.0% 100.0% *The NHTS 2001 included all persons, including those age 15 and younger. The Flagstaff data include persons aged 16 and older.
Table 2: Modal Share of All Trip Miles, Flagstaff Compared to the U.S. Travel Mode Flagstaff Area 2006 NHTS 2001*
SOV 65.4%
MOV 28.9% 94.3% 95.3%
Public Transportation/Transit 1.3% 2.5%
Walk 1.2% 0.5%
School Bus 0.0% 1.5%
Bike 3.3% 0.1%
Total 100.0% 100.0% *The NHTS 2001 included all persons, including those age 15 and younger. The Flagstaff data include persons aged 16 and older.
Trip Diary Survey of Community Travel Patterns Report of Results
© 2007 National Research Center, Inc.
Page 12
Modal Share of the Work Commute
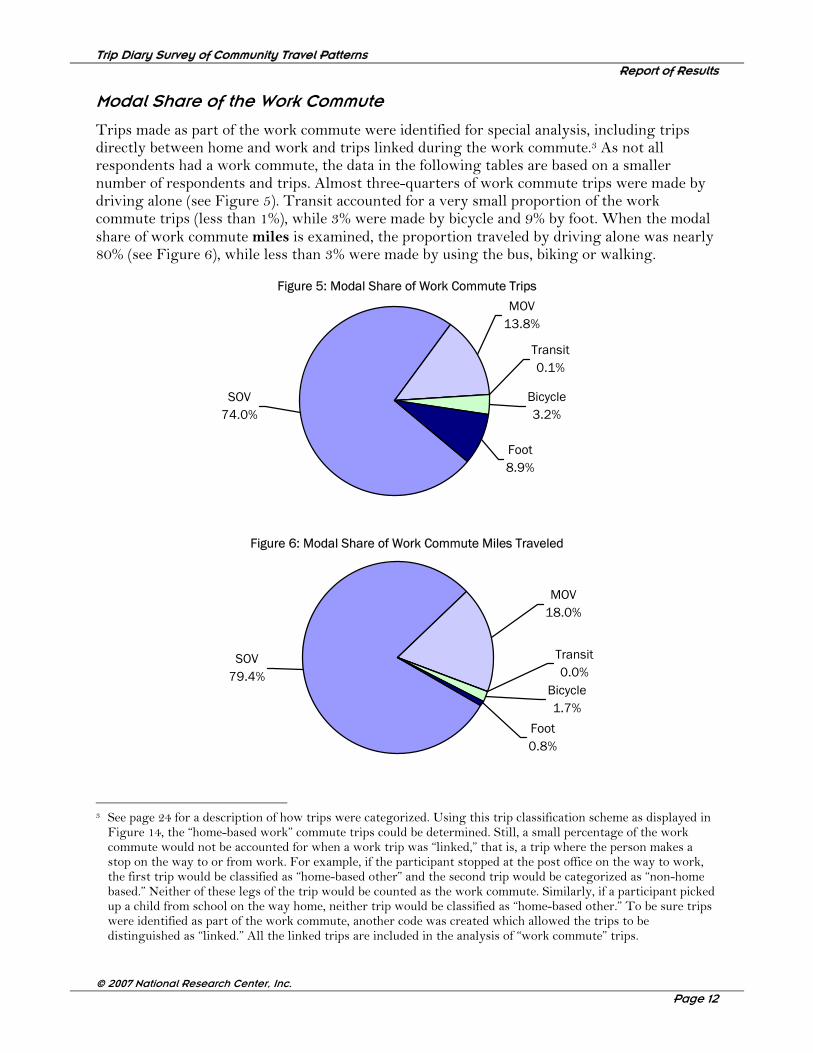
Trips made as part of the work commute were identified for special analysis, including trips directly between home and work and trips linked during the work commute.3 As not all respondents had a work commute, the data in the following tables are based on a smaller number of respondents and trips. Almost three-quarters of work commute trips were made by driving alone (see Figure 5). Transit accounted for a very small proportion of the work commute trips (less than 1%), while 3% were made by bicycle and 9% by foot. When the modal share of work commute miles is examined, the proportion traveled by driving alone was nearly 80% (see Figure 6), while less than 3% were made by using the bus, biking or walking.
Figure 5: Modal Share of Work Commute Trips
MOV13.8%
Transit0.1%
Bicycle3.2%
SOV74.0%
Foot8.9%
Figure 6: Modal Share of Work Commute Miles Traveled
MOV18.0%
Transit0.0%
Bicycle1.7%
SOV79.4%
Foot0.8%
3 See page 24 for a description of how trips were categorized. Using this trip classification scheme as displayed in
Figure 14, the “home-based work” commute trips could be determined. Still, a small percentage of the work commute would not be accounted for when a work trip was “linked,” that is, a trip where the person makes a stop on the way to or from work. For example, if the participant stopped at the post office on the way to work, the first trip would be classified as “home-based other” and the second trip would be categorized as “non-home based.” Neither of these legs of the trip would be counted as the work commute. Similarly, if a participant picked up a child from school on the way home, neither trip would be classified as “home-based other.” To be sure trips were identified as part of the work commute, another code was created which allowed the trips to be distinguished as “linked.” All the linked trips are included in the analysis of “work commute” trips.
Trip Diary Survey of Community Travel Patterns Report of Results
© 2007 National Research Center, Inc.
Page 13
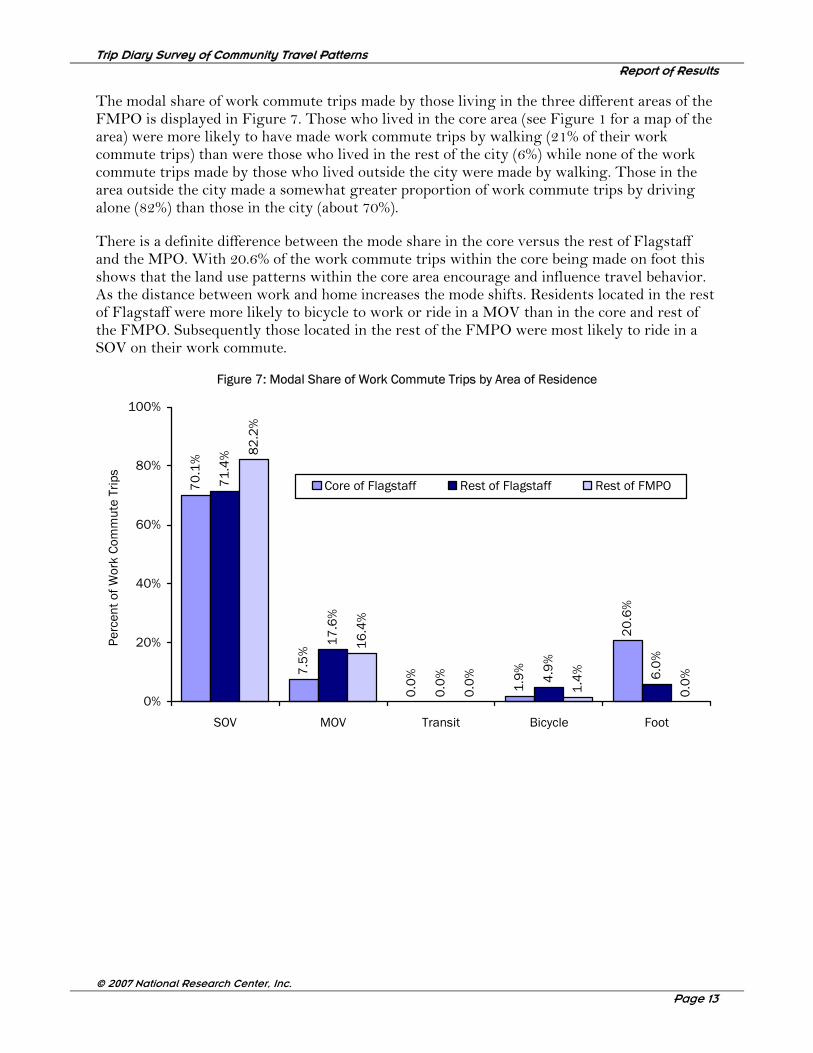
The modal share of work commute trips made by those living in the three different areas of the FMPO is displayed in Figure 7. Those who lived in the core area (see Figure 1 for a map of the area) were more likely to have made work commute trips by walking (21% of their work commute trips) than were those who lived in the rest of the city (6%) while none of the work commute trips made by those who lived outside the city were made by walking. Those in the area outside the city made a somewhat greater proportion of work commute trips by driving alone (82%) than those in the city (about 70%).
There is a definite difference between the mode share in the core versus the rest of Flagstaff and the MPO. With 20.6% of the work commute trips within the core being made on foot this shows that the land use patterns within the core area encourage and influence travel behavior. As the distance between work and home increases the mode shifts. Residents located in the rest of Flagstaff were more likely to bicycle to work or ride in a MOV than in the core and rest of the FMPO. Subsequently those located in the rest of the FMPO were most likely to ride in a SOV on their work commute.
Figure 7: Modal Share of Work Commute Trips by Area of Residence
70
.1%
7.5
%
0.0
%
1.9
%
20
.6%
71
.4%
17
.6%
0.0
% 4.9
%
6.0
%
82
.2%
16
.4%
0.0
%
1.4
%
0.0
%0%
20%
40%
60%
80%
100%
SOV MOV Transit Bicycle Foot
Perc
ent o
f Wor
k Co
mm
ute
Trip
s
Core of Flagstaff Rest of Flagstaff Rest of FMPO

Trip Diary Survey of Community Travel Patterns Report of Results
© 2007 National Research Center, Inc.
Page 14
The 2001 NHTS also analyzed trip-making behavior for the work commute. When the modal share of work commute trips was compared, Flagstaff area residents made a smaller proportion of trips by private vehicle compared to residents of the U.S. as a whole (Table 3), with a larger proportion of work commute trips made by walking or bicycling, although a smaller proportion were made by transit. However, when the modal share of work commute miles traveled was examined (see Table 4), the proportion of work commute miles traveled by private vehicle of Flagstaff area residents was similar to that of U.S. residents. The proportion of miles traveled by transit for the work commute by Flagstaff area residents was less than that of U.S. residents, but the proportion of miles traveled by bike or foot by Flagstaff area residents was greater than that of U.S. residents.
Table 3: Modal Share of Work Commute Trips, Flagstaff Compared to the U.S. Travel Mode Flagstaff Area 2006 NHTS 2001
SOV 74.0%
MOV 13.8% 87.8% 92.7%
Public Transportation/Transit 0.1% 3.7%
Walk 8.9% 3.1%
School Bus 0.0% 0.1%
Bike 3.2% 0.4%
Total 100.0% 100.0%
Table 4: Modal Share of Work Commute Miles, Flagstaff Compared to the U.S. Travel Mode Flagstaff Area 2006 NHTS 2001
SOV 79.4%
MOV 18.0% 97.4% 95.7%
Public Transportation/Transit 0.0% 3.7%
Walk 0.8% 0.1%
School Bus 0.0% 0.3%
Bike 1.7% 0.1%
Total 100.0% 100.0%
Trip Diary Survey of Community Travel Patterns Report of Results
© 2007 National Research Center, Inc.
Page 15
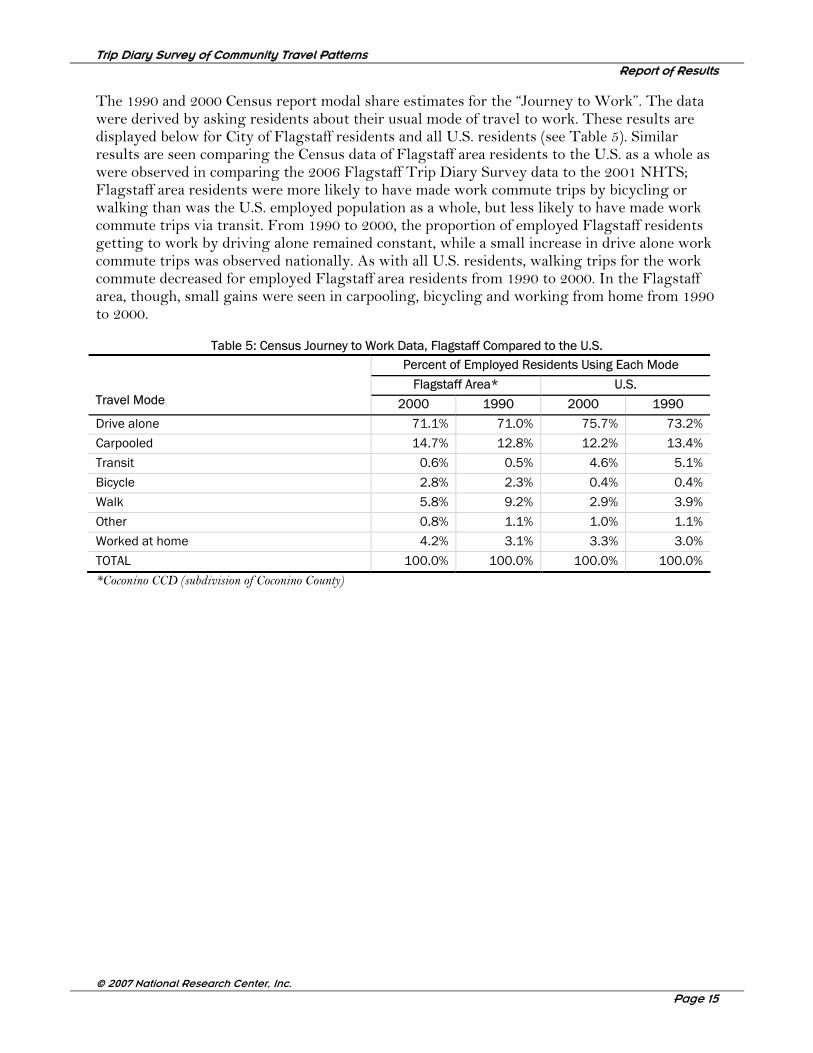
The 1990 and 2000 Census report modal share estimates for the “Journey to Work”. The data were derived by asking residents about their usual mode of travel to work. These results are displayed below for City of Flagstaff residents and all U.S. residents (see Table 5). Similar results are seen comparing the Census data of Flagstaff area residents to the U.S. as a whole as were observed in comparing the 2006 Flagstaff Trip Diary Survey data to the 2001 NHTS; Flagstaff area residents were more likely to have made work commute trips by bicycling or walking than was the U.S. employed population as a whole, but less likely to have made work commute trips via transit. From 1990 to 2000, the proportion of employed Flagstaff residents getting to work by driving alone remained constant, while a small increase in drive alone work commute trips was observed nationally. As with all U.S. residents, walking trips for the work commute decreased for employed Flagstaff area residents from 1990 to 2000. In the Flagstaff area, though, small gains were seen in carpooling, bicycling and working from home from 1990 to 2000.
Table 5: Census Journey to Work Data, Flagstaff Compared to the U.S. Percent of Employed Residents Using Each Mode
Flagstaff Area* U.S. Travel Mode 2000 1990 2000 1990
Drive alone 71.1% 71.0% 75.7% 73.2%
Carpooled 14.7% 12.8% 12.2% 13.4%
Transit 0.6% 0.5% 4.6% 5.1%
Bicycle 2.8% 2.3% 0.4% 0.4%
Walk 5.8% 9.2% 2.9% 3.9%
Other 0.8% 1.1% 1.0% 1.1%
Worked at home 4.2% 3.1% 3.3% 3.0%
TOTAL 100.0% 100.0% 100.0% 100.0%
*Coconino CCD (subdivision of Coconino County)
Trip Diary Survey of Community Travel Patterns Report of Results
© 2007 National Research Center, Inc.
Page 16
Alternative Work Commute Options Offered by Employers
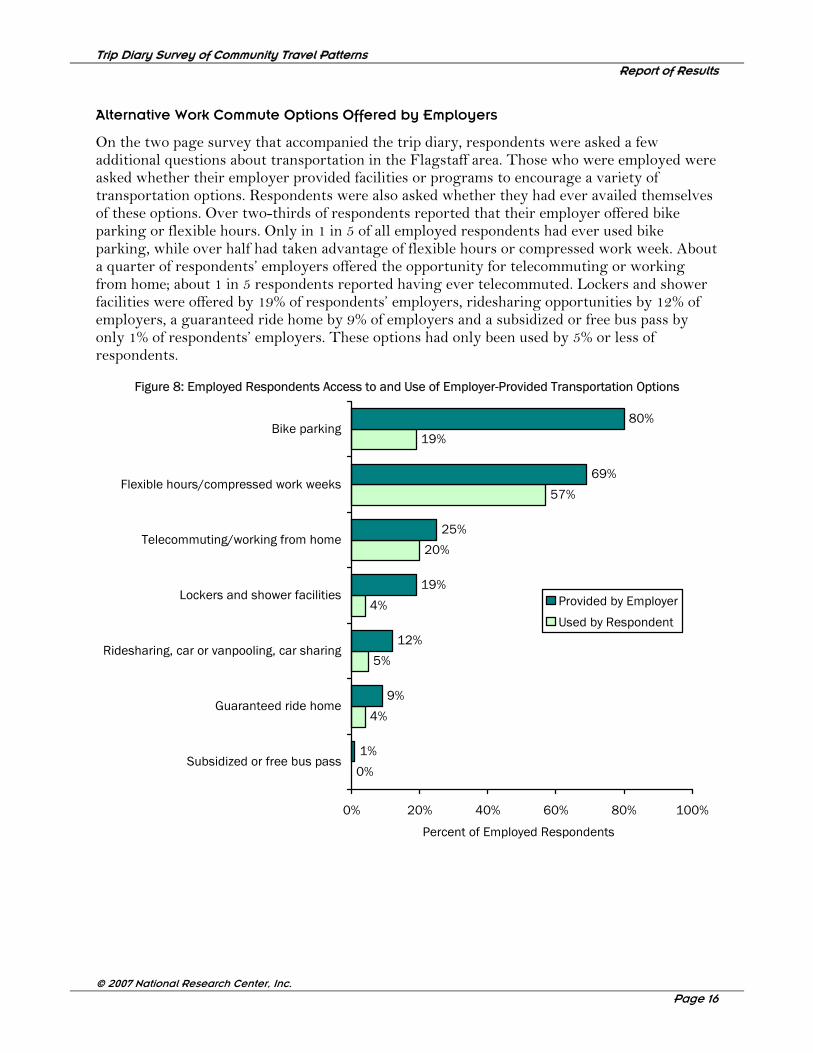
On the two page survey that accompanied the trip diary, respondents were asked a few additional questions about transportation in the Flagstaff area. Those who were employed were asked whether their employer provided facilities or programs to encourage a variety of transportation options. Respondents were also asked whether they had ever availed themselves of these options. Over two-thirds of respondents reported that their employer offered bike parking or flexible hours. Only in 1 in 5 of all employed respondents had ever used bike parking, while over half had taken advantage of flexible hours or compressed work week. About a quarter of respondents’ employers offered the opportunity for telecommuting or working from home; about 1 in 5 respondents reported having ever telecommuted. Lockers and shower facilities were offered by 19% of respondents’ employers, ridesharing opportunities by 12% of employers, a guaranteed ride home by 9% of employers and a subsidized or free bus pass by only 1% of respondents’ employers. These options had only been used by 5% or less of respondents.
Figure 8: Employed Respondents Access to and Use of Employer-Provided Transportation Options
0%
4%
5%
4%
20%
57%
19%
1%
9%
12%
19%
25%
69%
80%
0% 20% 40% 60% 80% 100%
Subsidized or free bus pass
Guaranteed ride home
Ridesharing, car or vanpooling, car sharing
Lockers and shower facilities
Telecommuting/working from home
Flexible hours/compressed work weeks
Bike parking
Percent of Employed Respondents
Provided by Employer
Used by Respondent
Trip Diary Survey of Community Travel Patterns Report of Results
© 2007 National Research Center, Inc.
Page 17
Modal Share of Northern Arizona University Students’ Travel
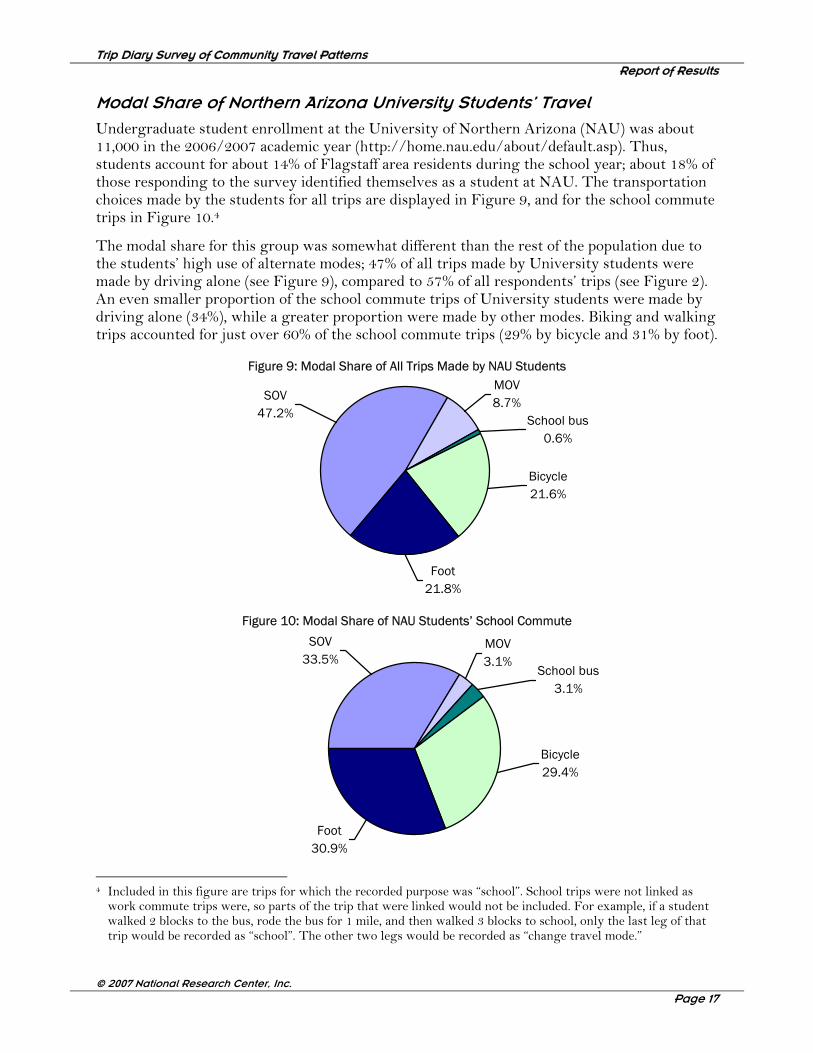
Undergraduate student enrollment at the University of Northern Arizona (NAU) was about 11,000 in the 2006/2007 academic year (http://home.nau.edu/about/default.asp). Thus, students account for about 14% of Flagstaff area residents during the school year; about 18% of those responding to the survey identified themselves as a student at NAU. The transportation choices made by the students for all trips are displayed in Figure 9, and for the school commute trips in Figure 10.4
The modal share for this group was somewhat different than the rest of the population due to the students’ high use of alternate modes; 47% of all trips made by University students were made by driving alone (see Figure 9), compared to 57% of all respondents’ trips (see Figure 2). An even smaller proportion of the school commute trips of University students were made by driving alone (34%), while a greater proportion were made by other modes. Biking and walking trips accounted for just over 60% of the school commute trips (29% by bicycle and 31% by foot).
Figure 9: Modal Share of All Trips Made by NAU Students MOV8.7%
School bus0.6%
Bicycle21.6%
SOV47.2%
Foot21.8%
Figure 10: Modal Share of NAU Students’ School Commute
MOV3.1%
School bus3.1%
Bicycle29.4%
SOV33.5%
Foot30.9%
4 Included in this figure are trips for which the recorded purpose was “school”. School trips were not linked as
work commute trips were, so parts of the trip that were linked would not be included. For example, if a student walked 2 blocks to the bus, rode the bus for 1 mile, and then walked 3 blocks to school, only the last leg of that trip would be recorded as “school”. The other two legs would be recorded as “change travel mode.”
Trip Diary Survey of Community Travel Patterns Report of Results
© 2007 National Research Center, Inc.
Page 18
Modal Share of Children’s School Commute
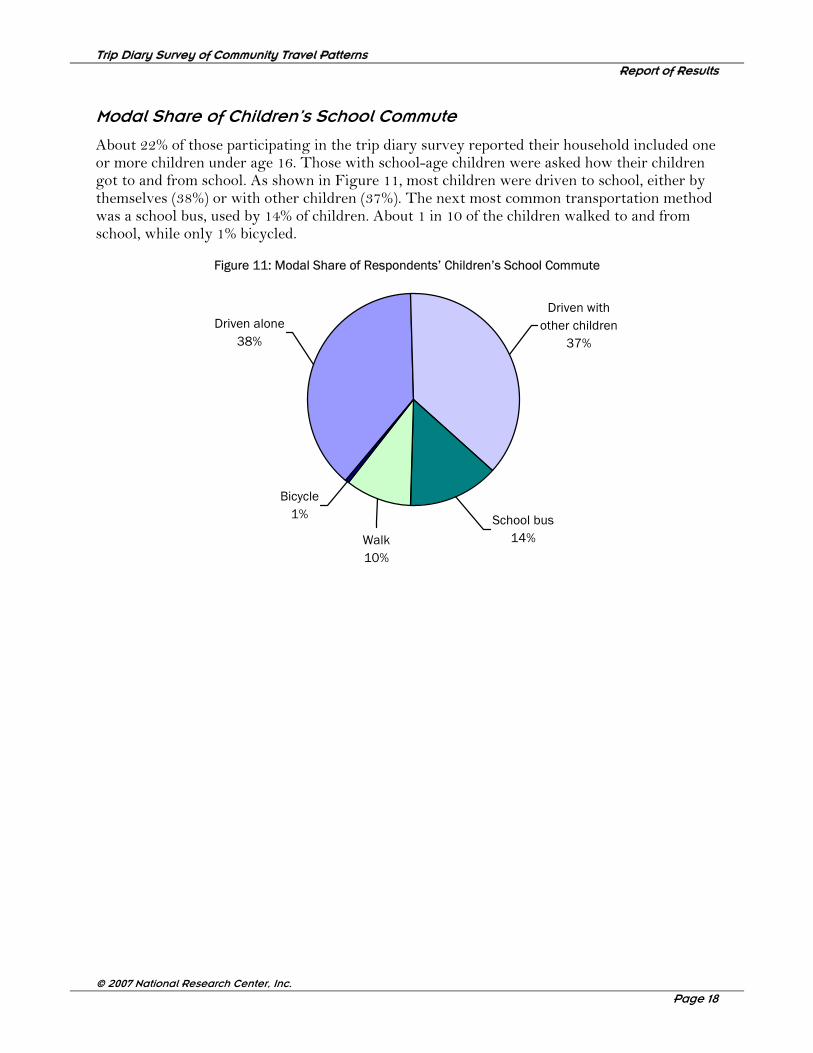
About 22% of those participating in the trip diary survey reported their household included one or more children under age 16. Those with school-age children were asked how their children got to and from school. As shown in Figure 11, most children were driven to school, either by themselves (38%) or with other children (37%). The next most common transportation method was a school bus, used by 14% of children. About 1 in 10 of the children walked to and from school, while only 1% bicycled.
Figure 11: Modal Share of Respondents’ Children’s School Commute
Driven with other children
37%
School bus14%Walk
10%
Driven alone38%
Bicycle1%
Trip Diary Survey of Community Travel Patterns Report of Results
© 2007 National Research Center, Inc.
Page 19
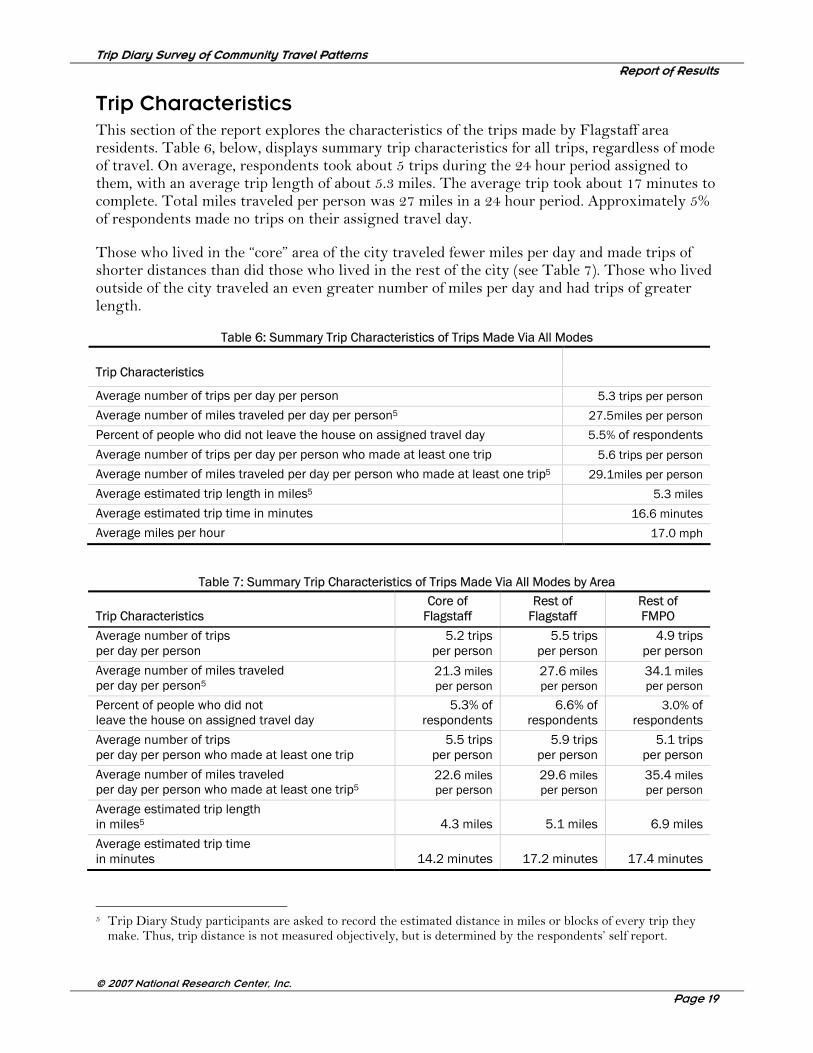
Trip Characteristics This section of the report explores the characteristics of the trips made by Flagstaff area residents. Table 6, below, displays summary trip characteristics for all trips, regardless of mode of travel. On average, respondents took about 5 trips during the 24 hour period assigned to them, with an average trip length of about 5.3 miles. The average trip took about 17 minutes to complete. Total miles traveled per person was 27 miles in a 24 hour period. Approximately 5% of respondents made no trips on their assigned travel day.
Those who lived in the “core” area of the city traveled fewer miles per day and made trips of shorter distances than did those who lived in the rest of the city (see Table 7). Those who lived outside of the city traveled an even greater number of miles per day and had trips of greater length.
Table 6: Summary Trip Characteristics of Trips Made Via All Modes
Trip Characteristics
Average number of trips per day per person 5.3 trips per person Average number of miles traveled per day per person5 27.5miles per person
Percent of people who did not leave the house on assigned travel day 5.5% of respondents
Average number of trips per day per person who made at least one trip 5.6 trips per person Average number of miles traveled per day per person who made at least one trip5 29.1miles per person
Average estimated trip length in miles5 5.3 miles
Average estimated trip time in minutes 16.6 minutes Average miles per hour 17.0 mph
Table 7: Summary Trip Characteristics of Trips Made Via All Modes by Area
Trip Characteristics Core of
Flagstaff Rest of
Flagstaff Rest of FMPO
Average number of trips per day per person
5.2 trips per person
5.5 trips per person
4.9 trips per person
Average number of miles traveled per day per person5
21.3 miles per person
27.6 miles per person
34.1 miles per person
Percent of people who did not leave the house on assigned travel day
5.3% of respondents
6.6% of respondents
3.0% of respondents
Average number of trips per day per person who made at least one trip
5.5 trips per person
5.9 trips per person
5.1 trips per person
Average number of miles traveled per day per person who made at least one trip5
22.6 miles per person
29.6 miles per person
35.4 miles per person
Average estimated trip length in miles5 4.3 miles 5.1 miles 6.9 miles
Average estimated trip time in minutes 14.2 minutes 17.2 minutes 17.4 minutes
5 Trip Diary Study participants are asked to record the estimated distance in miles or blocks of every trip they
make. Thus, trip distance is not measured objectively, but is determined by the respondents’ self report.
Trip Diary Survey of Community Travel Patterns Report of Results
© 2007 National Research Center, Inc.
Page 20
Trip Distance
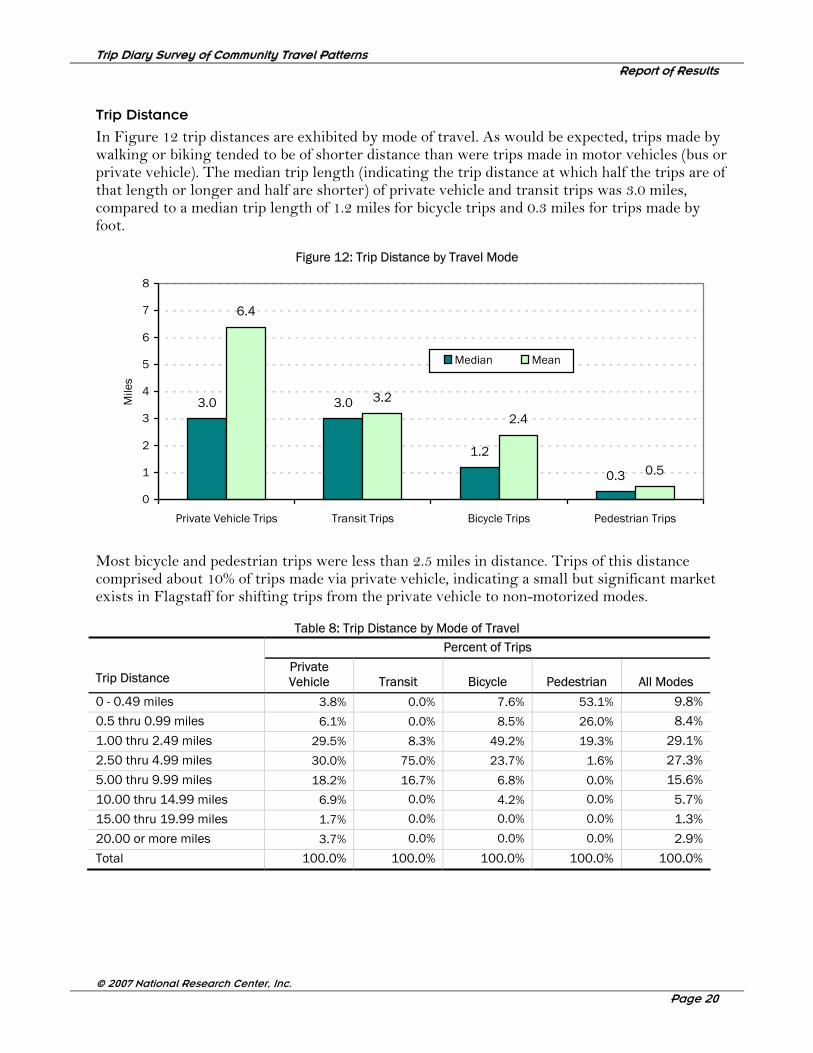
In Figure 12 trip distances are exhibited by mode of travel. As would be expected, trips made by walking or biking tended to be of shorter distance than were trips made in motor vehicles (bus or private vehicle). The median trip length (indicating the trip distance at which half the trips are of that length or longer and half are shorter) of private vehicle and transit trips was 3.0 miles, compared to a median trip length of 1.2 miles for bicycle trips and 0.3 miles for trips made by foot.
Figure 12: Trip Distance by Travel Mode
3.0 3.0
1.2
0.3
6.4
3.2
2.4
0.5
0
1
2
3
4
5
6
7
8
Private Vehicle Trips Transit Trips Bicycle Trips Pedestrian Trips
Mile
s
Median Mean
Most bicycle and pedestrian trips were less than 2.5 miles in distance. Trips of this distance comprised about 10% of trips made via private vehicle, indicating a small but significant market exists in Flagstaff for shifting trips from the private vehicle to non-motorized modes.
Table 8: Trip Distance by Mode of Travel Percent of Trips
Trip Distance Private Vehicle Transit Bicycle Pedestrian All Modes
0 - 0.49 miles 3.8% 0.0% 7.6% 53.1% 9.8%
0.5 thru 0.99 miles 6.1% 0.0% 8.5% 26.0% 8.4%
1.00 thru 2.49 miles 29.5% 8.3% 49.2% 19.3% 29.1%
2.50 thru 4.99 miles 30.0% 75.0% 23.7% 1.6% 27.3%
5.00 thru 9.99 miles 18.2% 16.7% 6.8% 0.0% 15.6%
10.00 thru 14.99 miles 6.9% 0.0% 4.2% 0.0% 5.7%
15.00 thru 19.99 miles 1.7% 0.0% 0.0% 0.0% 1.3%
20.00 or more miles 3.7% 0.0% 0.0% 0.0% 2.9%
Total 100.0% 100.0% 100.0% 100.0% 100.0%
Trip Diary Survey of Community Travel Patterns Report of Results
© 2007 National Research Center, Inc.
Page 21
Trip Start Times
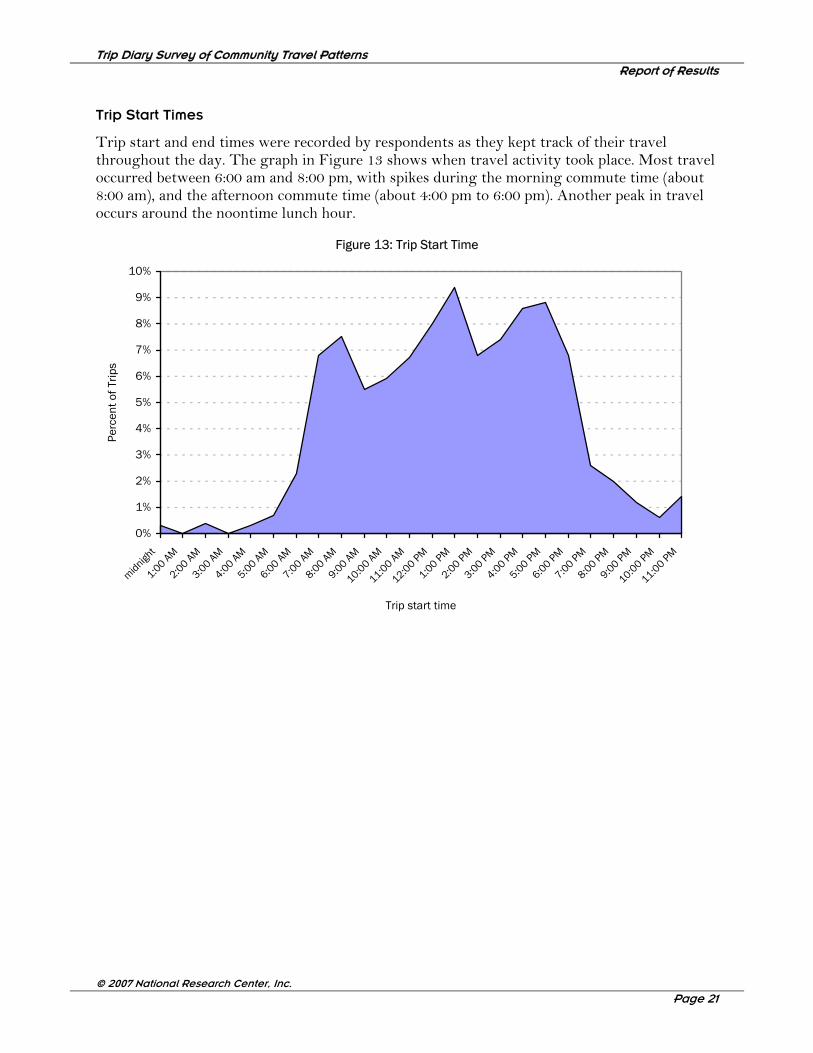
Trip start and end times were recorded by respondents as they kept track of their travel throughout the day. The graph in Figure 13 shows when travel activity took place. Most travel occurred between 6:00 am and 8:00 pm, with spikes during the morning commute time (about 8:00 am), and the afternoon commute time (about 4:00 pm to 6:00 pm). Another peak in travel occurs around the noontime lunch hour.
Figure 13: Trip Start Time
0%
1%
2%
3%
4%
5%
6%
7%
8%
9%
10%
midnight
1:00 AM
2:00 AM
3:00 AM
4:00 AM
5:00 AM
6:00 AM
7:00 AM
8:00 AM
9:00 AM
10:00 AM
11:00 AM
12:00 PM
1:00 PM
2:00 PM
3:00 PM
4:00 PM
5:00 PM
6:00 PM
7:00 PM
8:00 PM
9:00 PM
10:00 PM
11:00 PM
Trip start time
Perc
ent o
f Trip
s
Trip Diary Survey of Community Travel Patterns Report of Results
© 2007 National Research Center, Inc.
Page 22
Purpose of Travel
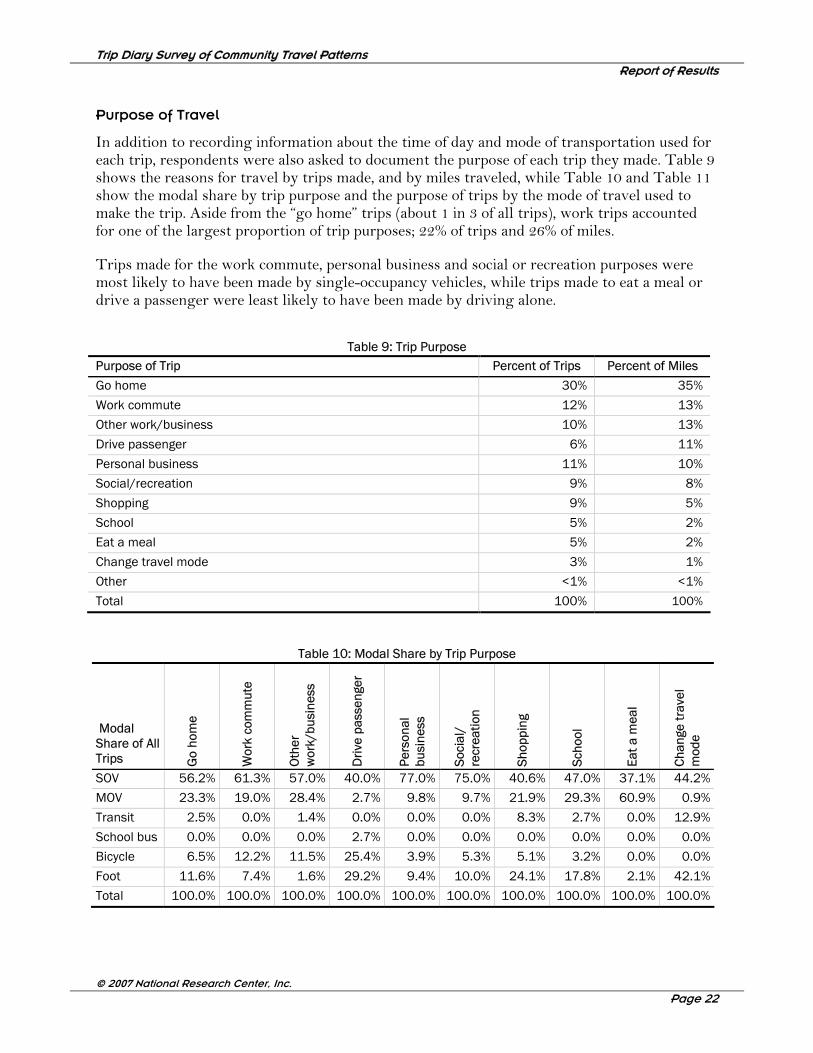
In addition to recording information about the time of day and mode of transportation used for each trip, respondents were also asked to document the purpose of each trip they made. Table 9 shows the reasons for travel by trips made, and by miles traveled, while Table 10 and Table 11 show the modal share by trip purpose and the purpose of trips by the mode of travel used to make the trip. Aside from the “go home” trips (about 1 in 3 of all trips), work trips accounted for one of the largest proportion of trip purposes; 22% of trips and 26% of miles.
Trips made for the work commute, personal business and social or recreation purposes were most likely to have been made by single-occupancy vehicles, while trips made to eat a meal or drive a passenger were least likely to have been made by driving alone.
Table 9: Trip Purpose
Purpose of Trip Percent of Trips Percent of Miles
Go home 30% 35%
Work commute 12% 13%
Other work/business 10% 13%
Drive passenger 6% 11%
Personal business 11% 10%
Social/recreation 9% 8%
Shopping 9% 5%
School 5% 2%
Eat a meal 5% 2%
Change travel mode 3% 1%
Other <1% <1%
Total 100% 100%
Table 10: Modal Share by Trip Purpose
Modal Share of All Trips G
o ho
me
Wor
k co
mm
ute
Oth
er
wor
k/bu
sine
ss
Driv
e pa
ssen
ger
Pers
onal
bu
sine
ss
Soci
al/
re
crea
tion
Shop
ping
Scho
ol
Eat a
mea
l
Chan
ge tr
avel
m
ode
SOV 56.2% 61.3% 57.0% 40.0% 77.0% 75.0% 40.6% 47.0% 37.1% 44.2%
MOV 23.3% 19.0% 28.4% 2.7% 9.8% 9.7% 21.9% 29.3% 60.9% 0.9%
Transit 2.5% 0.0% 1.4% 0.0% 0.0% 0.0% 8.3% 2.7% 0.0% 12.9%
School bus 0.0% 0.0% 0.0% 2.7% 0.0% 0.0% 0.0% 0.0% 0.0% 0.0%
Bicycle 6.5% 12.2% 11.5% 25.4% 3.9% 5.3% 5.1% 3.2% 0.0% 0.0%
Foot 11.6% 7.4% 1.6% 29.2% 9.4% 10.0% 24.1% 17.8% 2.1% 42.1%
Total 100.0% 100.0% 100.0% 100.0% 100.0% 100.0% 100.0% 100.0% 100.0% 100.0%

Trip Diary Survey of Community Travel Patterns Report of Results
© 2007 National Research Center, Inc.
Page 23
Table 11: Trip Purpose by Mode of Travel Percent of Trips
Purpose of Trip SOV MOV Transit School bus Bicycle Foot
Go home 29.6% 33.2% 34.7% 0.0% 27.6% 28.1%
Work commute 15.7% 5.4% 0.0% 0.0% 6.3% 8.8%
Other work/business 13.2% 4.6% 0.0% 0.0% 7.4% 8.1%
Drive passenger 4.0% 17.6% 0.0% 0.0% 0.0% 1.0%
Personal business 12.0% 10.1% 0.0% 0.0% 19.2% 6.7%
Social/recreation 6.3% 9.2% 34.7% 0.0% 6.3% 17.2%
Shopping 9.2% 12.4% 6.0% 0.0% 14.8% 1.2%
School 3.2% 0.6% 0.0% 100.0% 16.2% 10.7%
Eat a meal 4.0% 6.8% 6.0% 0.0% 2.2% 7.0%
Change travel mode 2.4% 0.1% 18.6% 0.0% 0.0% 10.5%
Other 0.4% 0.0% 0.0% 0.0% 0.0% 0.7%
Total 100.0% 100.0% 100.0% 100.0% 100.0% 100.0%
Trip Diary Survey of Community Travel Patterns Report of Results
© 2007 National Research Center, Inc.
Page 24
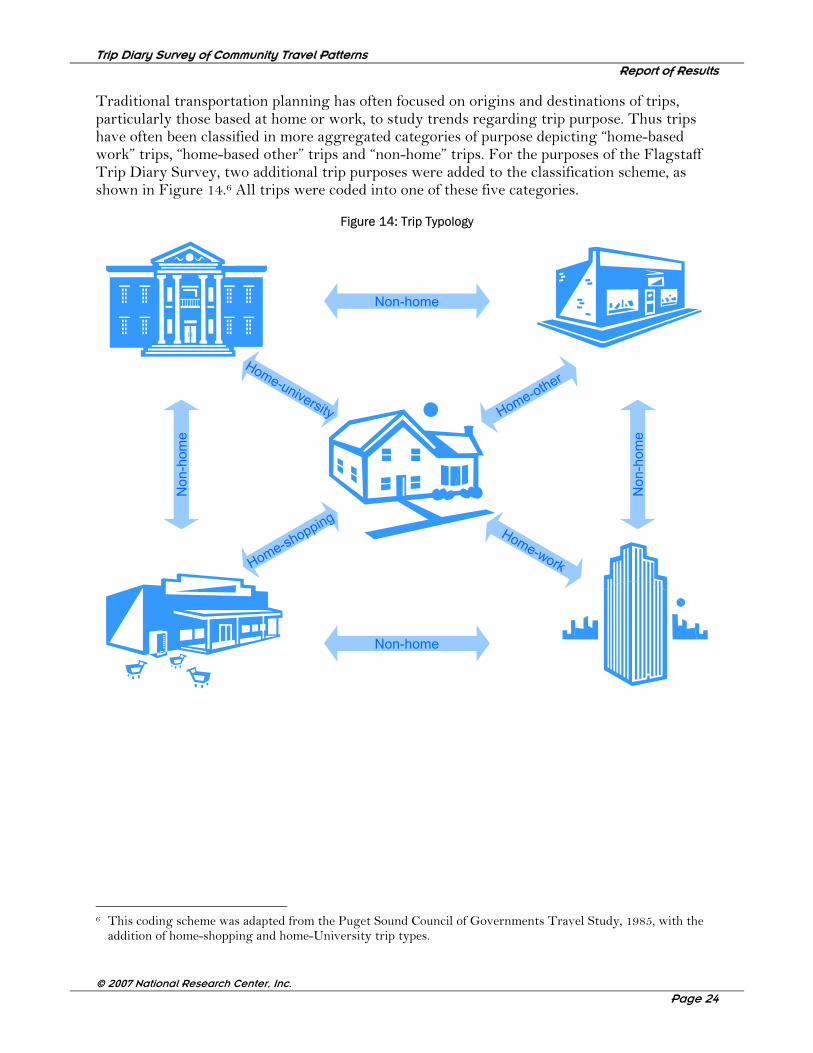
Traditional transportation planning has often focused on origins and destinations of trips, particularly those based at home or work, to study trends regarding trip purpose. Thus trips have often been classified in more aggregated categories of purpose depicting “home-based work” trips, “home-based other” trips and “non-home” trips. For the purposes of the Flagstaff Trip Diary Survey, two additional trip purposes were added to the classification scheme, as shown in Figure 14.6 All trips were coded into one of these five categories.
Figure 14: Trip Typology
Non-home
Non-home
Non
-hom
e
Non
-hom
e
Home-other
Home-workHome-shopping
Home-university
6 This coding scheme was adapted from the Puget Sound Council of Governments Travel Study, 1985, with the
addition of home-shopping and home-University trip types.
Trip Diary Survey of Community Travel Patterns Report of Results
© 2007 National Research Center, Inc.
Page 25
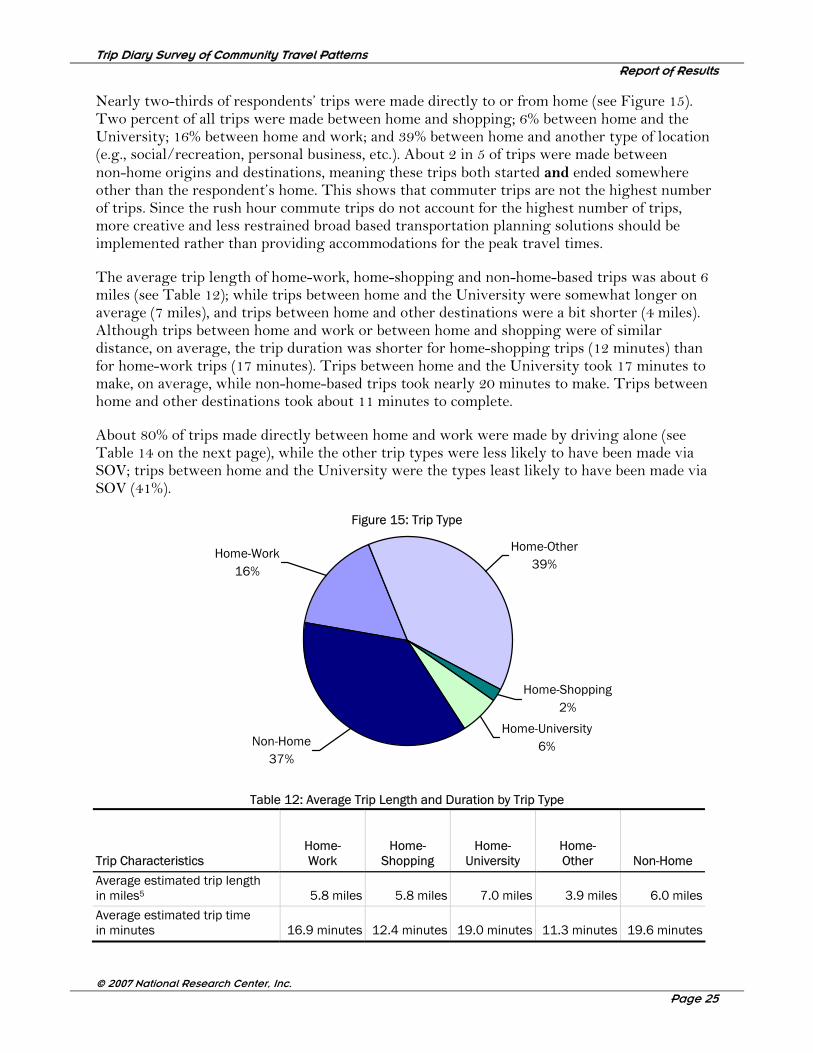
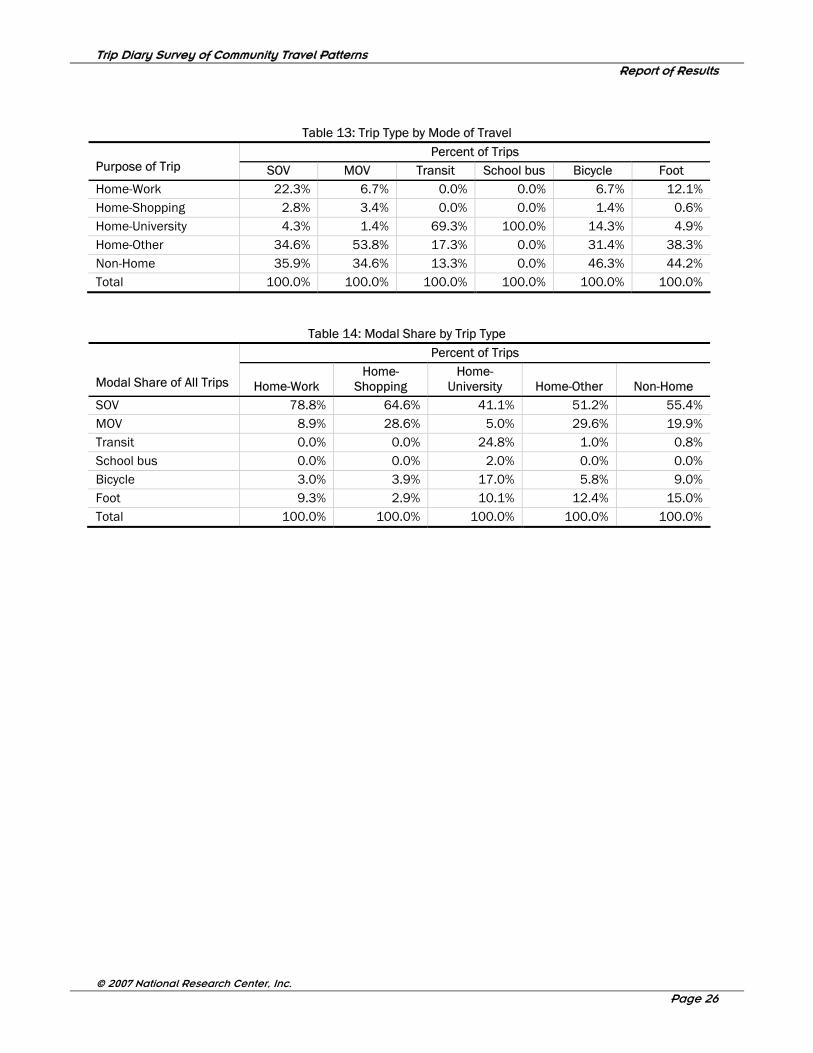
Nearly two-thirds of respondents’ trips were made directly to or from home (see Figure 15). Two percent of all trips were made between home and shopping; 6% between home and the University; 16% between home and work; and 39% between home and another type of location (e.g., social/recreation, personal business, etc.). About 2 in 5 of trips were made between non-home origins and destinations, meaning these trips both started and ended somewhere other than the respondent’s home. This shows that commuter trips are not the highest number of trips. Since the rush hour commute trips do not account for the highest number of trips, more creative and less restrained broad based transportation planning solutions should be implemented rather than providing accommodations for the peak travel times.
The average trip length of home-work, home-shopping and non-home-based trips was about 6 miles (see Table 12); while trips between home and the University were somewhat longer on average (7 miles), and trips between home and other destinations were a bit shorter (4 miles). Although trips between home and work or between home and shopping were of similar distance, on average, the trip duration was shorter for home-shopping trips (12 minutes) than for home-work trips (17 minutes). Trips between home and the University took 17 minutes to make, on average, while non-home-based trips took nearly 20 minutes to make. Trips between home and other destinations took about 11 minutes to complete.
About 80% of trips made directly between home and work were made by driving alone (see Table 14 on the next page), while the other trip types were less likely to have been made via SOV; trips between home and the University were the types least likely to have been made via SOV (41%).
Figure 15: Trip Type
Home-Other39%
Home-Shopping2%
Home-University6%
Home-Work16%
Non-Home37%
Table 12: Average Trip Length and Duration by Trip Type
Trip Characteristics Home- Work
Home-Shopping
Home-University
Home- Other Non-Home
Average estimated trip length in miles5 5.8 miles 5.8 miles 7.0 miles 3.9 miles 6.0 miles
Average estimated trip time in minutes 16.9 minutes 12.4 minutes 19.0 minutes 11.3 minutes 19.6 minutes
Trip Diary Survey of Community Travel Patterns Report of Results
© 2007 National Research Center, Inc.
Page 26
Table 13: Trip Type by Mode of Travel Percent of Trips
Purpose of Trip SOV MOV Transit School bus Bicycle Foot Home-Work 22.3% 6.7% 0.0% 0.0% 6.7% 12.1% Home-Shopping 2.8% 3.4% 0.0% 0.0% 1.4% 0.6% Home-University 4.3% 1.4% 69.3% 100.0% 14.3% 4.9% Home-Other 34.6% 53.8% 17.3% 0.0% 31.4% 38.3% Non-Home 35.9% 34.6% 13.3% 0.0% 46.3% 44.2% Total 100.0% 100.0% 100.0% 100.0% 100.0% 100.0%
Table 14: Modal Share by Trip Type Percent of Trips
Modal Share of All Trips Home-Work Home-
Shopping Home-
University Home-Other Non-Home SOV 78.8% 64.6% 41.1% 51.2% 55.4% MOV 8.9% 28.6% 5.0% 29.6% 19.9% Transit 0.0% 0.0% 24.8% 1.0% 0.8% School bus 0.0% 0.0% 2.0% 0.0% 0.0% Bicycle 3.0% 3.9% 17.0% 5.8% 9.0% Foot 9.3% 2.9% 10.1% 12.4% 15.0% Total 100.0% 100.0% 100.0% 100.0% 100.0%
Trip Diary Survey of Community Travel Patterns Report of Results
© 2007 National Research Center, Inc.
Page 27
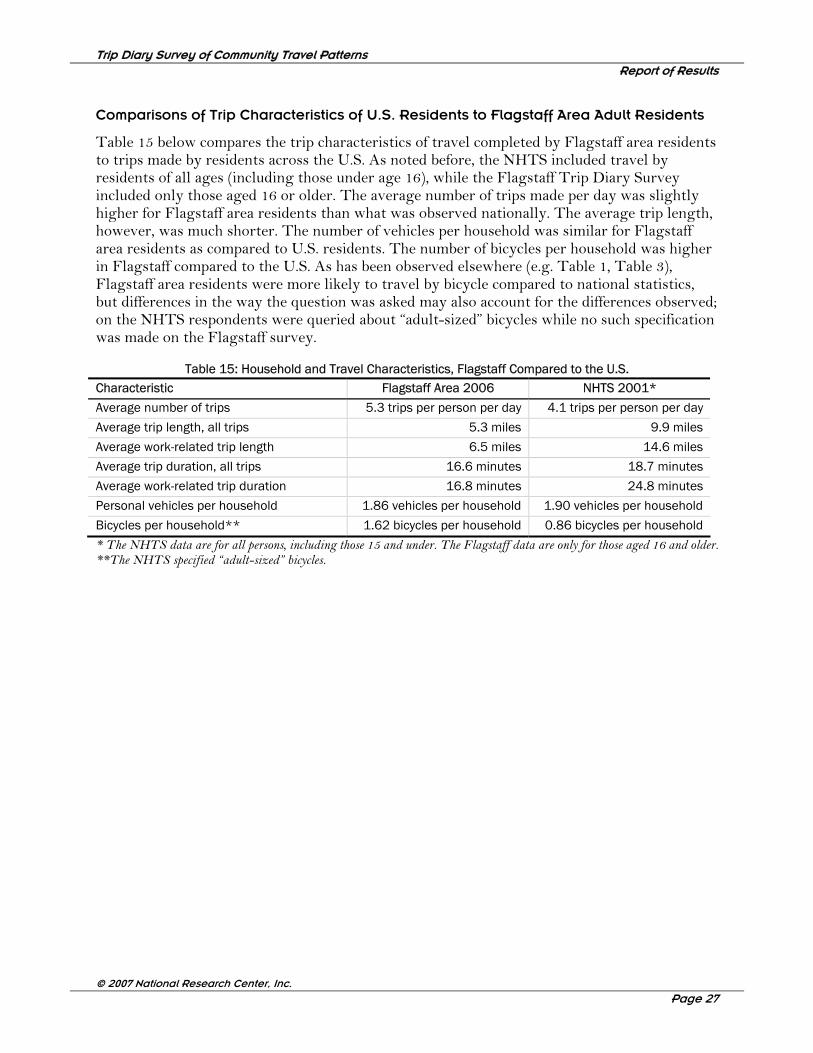
Comparisons of Trip Characteristics of U.S. Residents to Flagstaff Area Adult Residents
Table 15 below compares the trip characteristics of travel completed by Flagstaff area residents to trips made by residents across the U.S. As noted before, the NHTS included travel by residents of all ages (including those under age 16), while the Flagstaff Trip Diary Survey included only those aged 16 or older. The average number of trips made per day was slightly higher for Flagstaff area residents than what was observed nationally. The average trip length, however, was much shorter. The number of vehicles per household was similar for Flagstaff area residents as compared to U.S. residents. The number of bicycles per household was higher in Flagstaff compared to the U.S. As has been observed elsewhere (e.g. Table 1, Table 3), Flagstaff area residents were more likely to travel by bicycle compared to national statistics, but differences in the way the question was asked may also account for the differences observed; on the NHTS respondents were queried about “adult-sized” bicycles while no such specification was made on the Flagstaff survey.
Table 15: Household and Travel Characteristics, Flagstaff Compared to the U.S. Characteristic Flagstaff Area 2006 NHTS 2001*
Average number of trips 5.3 trips per person per day 4.1 trips per person per day
Average trip length, all trips 5.3 miles 9.9 miles
Average work-related trip length 6.5 miles 14.6 miles
Average trip duration, all trips 16.6 minutes 18.7 minutes
Average work-related trip duration 16.8 minutes 24.8 minutes
Personal vehicles per household 1.86 vehicles per household 1.90 vehicles per household
Bicycles per household** 1.62 bicycles per household 0.86 bicycles per household
* The NHTS data are for all persons, including those 15 and under. The Flagstaff data are only for those aged 16 and older. **The NHTS specified “adult-sized” bicycles.
Trip Diary Survey of Community Travel Patterns Report of Results
© 2007 National Research Center, Inc.
Page 28
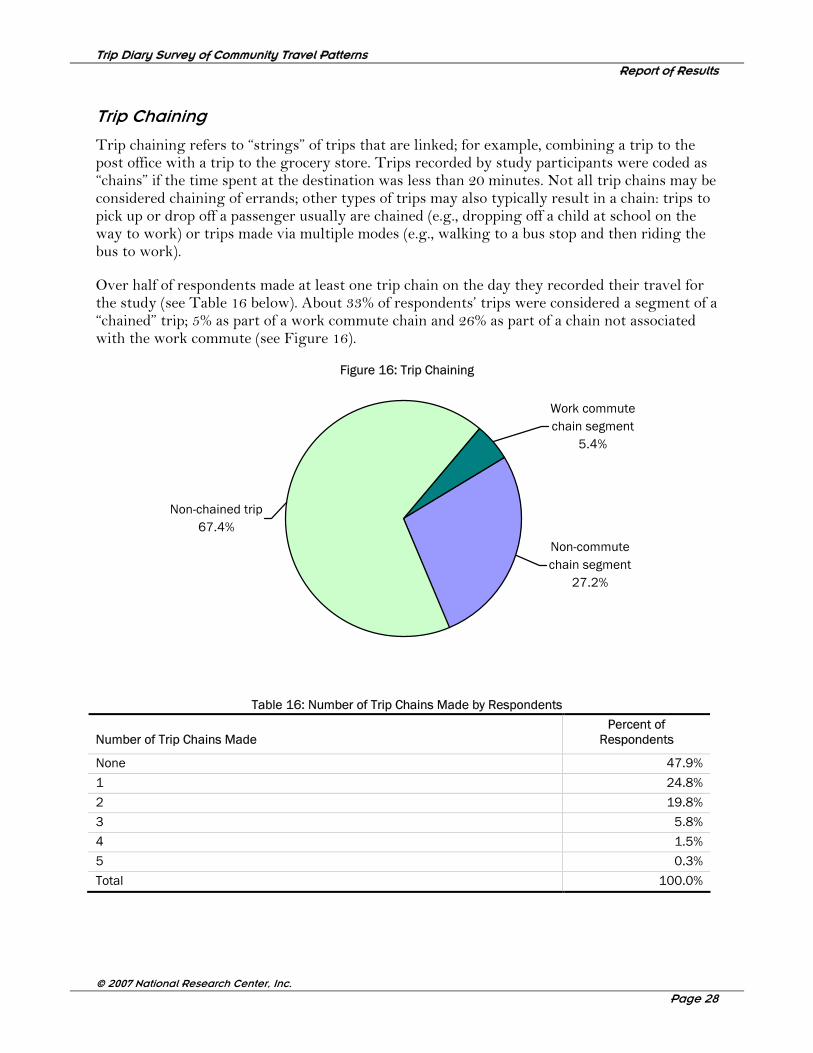
Trip Chaining
Trip chaining refers to “strings” of trips that are linked; for example, combining a trip to the post office with a trip to the grocery store. Trips recorded by study participants were coded as “chains” if the time spent at the destination was less than 20 minutes. Not all trip chains may be considered chaining of errands; other types of trips may also typically result in a chain: trips to pick up or drop off a passenger usually are chained (e.g., dropping off a child at school on the way to work) or trips made via multiple modes (e.g., walking to a bus stop and then riding the bus to work).
Over half of respondents made at least one trip chain on the day they recorded their travel for the study (see Table 16 below). About 33% of respondents’ trips were considered a segment of a “chained” trip; 5% as part of a work commute chain and 26% as part of a chain not associated with the work commute (see Figure 16).
Figure 16: Trip Chaining
Work commute chain segment
5.4%
Non-chained trip67.4%
Non-commute chain segment
27.2%
Table 16: Number of Trip Chains Made by Respondents
Number of Trip Chains Made Percent of
Respondents
None 47.9%
1 24.8%
2 19.8%
3 5.8%
4 1.5%
5 0.3%
Total 100.0%
Trip Diary Survey of Community Travel Patterns Report of Results
© 2007 National Research Center, Inc.
Page 29
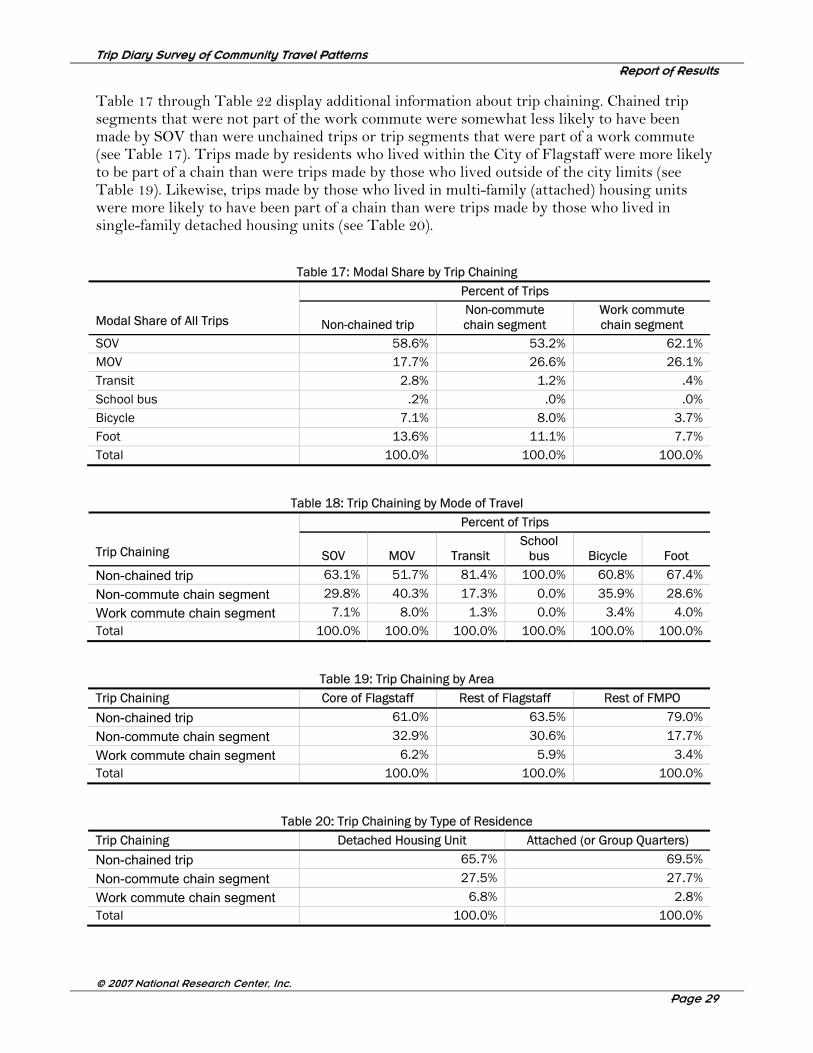
Table 17 through Table 22 display additional information about trip chaining. Chained trip segments that were not part of the work commute were somewhat less likely to have been made by SOV than were unchained trips or trip segments that were part of a work commute (see Table 17). Trips made by residents who lived within the City of Flagstaff were more likely to be part of a chain than were trips made by those who lived outside of the city limits (see Table 19). Likewise, trips made by those who lived in multi-family (attached) housing units were more likely to have been part of a chain than were trips made by those who lived in single-family detached housing units (see Table 20).
Table 17: Modal Share by Trip Chaining
Percent of Trips
Modal Share of All Trips Non-chained trip Non-commute chain segment
Work commute chain segment
SOV 58.6% 53.2% 62.1% MOV 17.7% 26.6% 26.1% Transit 2.8% 1.2% .4% School bus .2% .0% .0% Bicycle 7.1% 8.0% 3.7% Foot 13.6% 11.1% 7.7% Total 100.0% 100.0% 100.0%
Table 18: Trip Chaining by Mode of Travel Percent of Trips
Trip Chaining SOV MOV Transit School
bus Bicycle Foot
Non-chained trip 63.1% 51.7% 81.4% 100.0% 60.8% 67.4%
Non-commute chain segment 29.8% 40.3% 17.3% 0.0% 35.9% 28.6%
Work commute chain segment 7.1% 8.0% 1.3% 0.0% 3.4% 4.0% Total 100.0% 100.0% 100.0% 100.0% 100.0% 100.0%
Table 19: Trip Chaining by Area Trip Chaining Core of Flagstaff Rest of Flagstaff Rest of FMPO
Non-chained trip 61.0% 63.5% 79.0%
Non-commute chain segment 32.9% 30.6% 17.7%
Work commute chain segment 6.2% 5.9% 3.4% Total 100.0% 100.0% 100.0%
Table 20: Trip Chaining by Type of Residence Trip Chaining Detached Housing Unit Attached (or Group Quarters)
Non-chained trip 65.7% 69.5%
Non-commute chain segment 27.5% 27.7%
Work commute chain segment 6.8% 2.8% Total 100.0% 100.0%
Trip Diary Survey of Community Travel Patterns Report of Results
© 2007 National Research Center, Inc.
Page 30
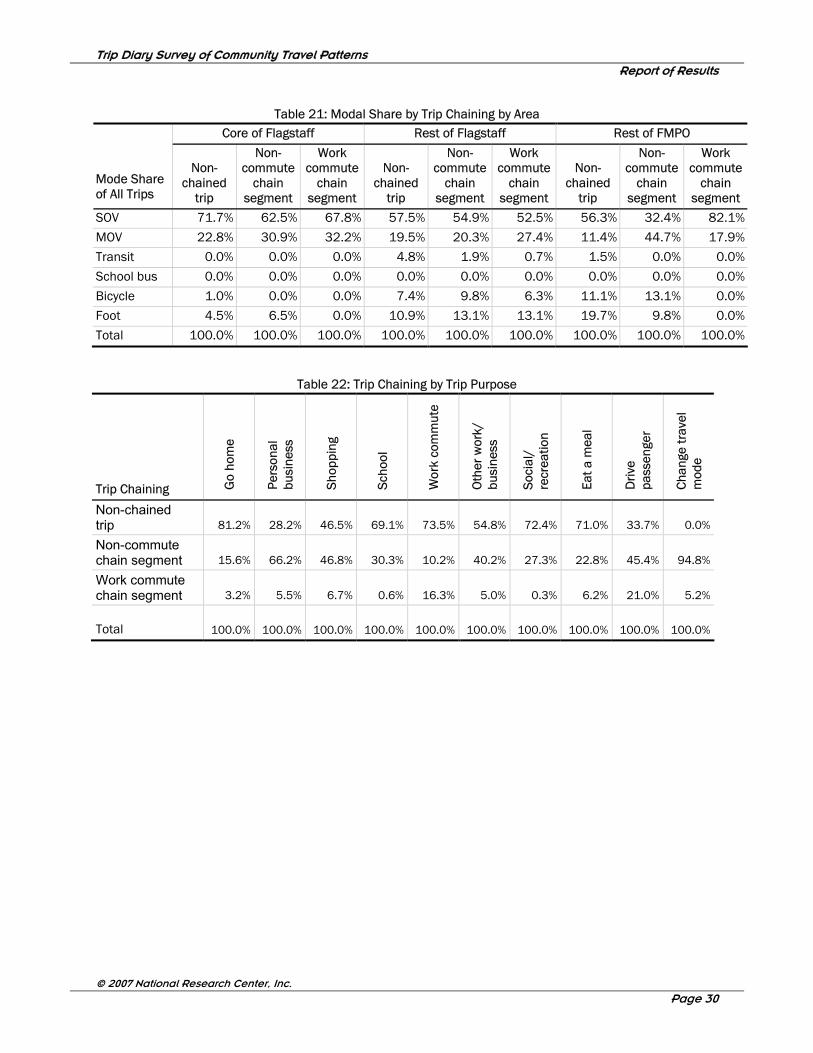
Table 21: Modal Share by Trip Chaining by Area
Core of Flagstaff Rest of Flagstaff Rest of FMPO
Mode Share of All Trips
Non-chained
trip
Non-commute
chain segment
Work commute
chain segment
Non-chained
trip
Non-commute
chain segment
Work commute
chain segment
Non-chained
trip
Non-commute
chain segment
Work commute
chain segment
SOV 71.7% 62.5% 67.8% 57.5% 54.9% 52.5% 56.3% 32.4% 82.1%
MOV 22.8% 30.9% 32.2% 19.5% 20.3% 27.4% 11.4% 44.7% 17.9%
Transit 0.0% 0.0% 0.0% 4.8% 1.9% 0.7% 1.5% 0.0% 0.0%
School bus 0.0% 0.0% 0.0% 0.0% 0.0% 0.0% 0.0% 0.0% 0.0%
Bicycle 1.0% 0.0% 0.0% 7.4% 9.8% 6.3% 11.1% 13.1% 0.0%
Foot 4.5% 6.5% 0.0% 10.9% 13.1% 13.1% 19.7% 9.8% 0.0%
Total 100.0% 100.0% 100.0% 100.0% 100.0% 100.0% 100.0% 100.0% 100.0%
Table 22: Trip Chaining by Trip Purpose
Trip Chaining Go
hom
e
Pers
onal
bu
sine
ss
Shop
ping
Scho
ol
Wor
k co
mm
ute
Oth
er w
ork/
bu
sine
ss
Soci
al/
recr
eatio
n
Eat a
mea
l
Driv
e pa
ssen
ger
Chan
ge tr
avel
m
ode
Non-chained trip 81.2% 28.2% 46.5% 69.1% 73.5% 54.8% 72.4% 71.0% 33.7% 0.0%
Non-commute chain segment 15.6% 66.2% 46.8% 30.3% 10.2% 40.2% 27.3% 22.8% 45.4% 94.8%
Work commute chain segment 3.2% 5.5% 6.7% 0.6% 16.3% 5.0% 0.3% 6.2% 21.0% 5.2%
Total 100.0% 100.0% 100.0% 100.0% 100.0% 100.0% 100.0% 100.0% 100.0% 100.0%
Trip Diary Survey of Community Travel Patterns Report of Results
© 2007 National Research Center, Inc.
Page 31
Deliveries to the Home or Work
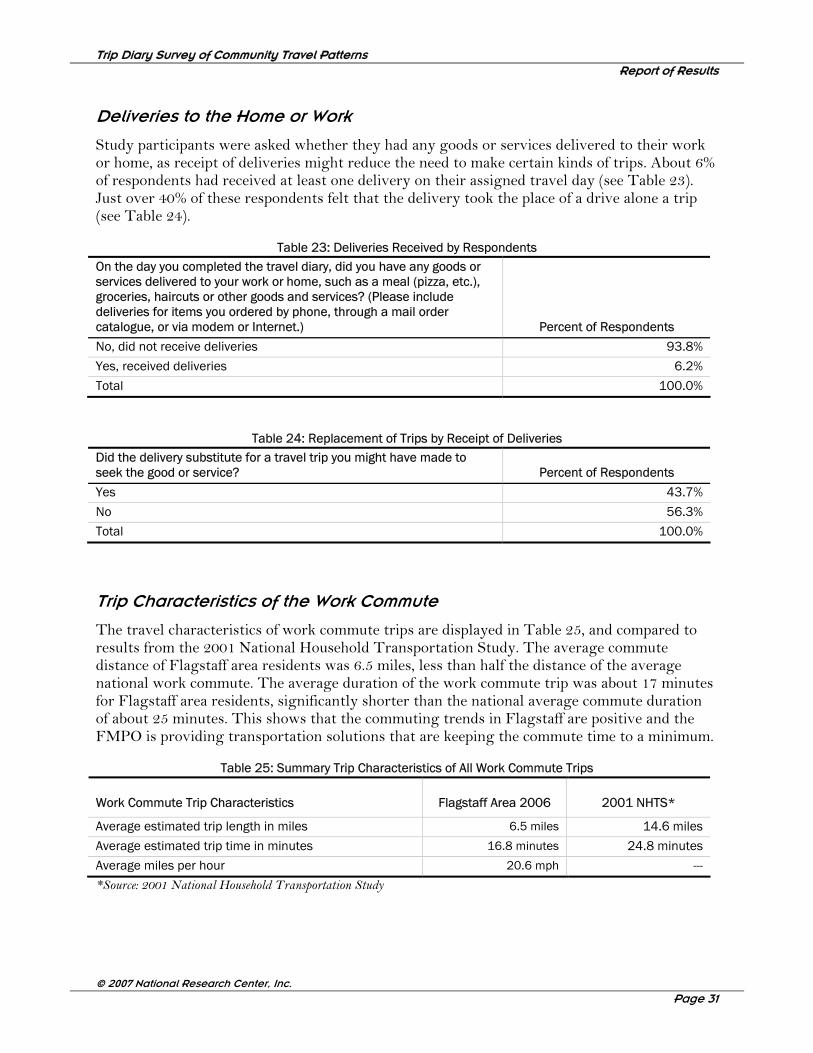
Study participants were asked whether they had any goods or services delivered to their work or home, as receipt of deliveries might reduce the need to make certain kinds of trips. About 6% of respondents had received at least one delivery on their assigned travel day (see Table 23). Just over 40% of these respondents felt that the delivery took the place of a drive alone a trip (see Table 24).
Table 23: Deliveries Received by Respondents On the day you completed the travel diary, did you have any goods or services delivered to your work or home, such as a meal (pizza, etc.), groceries, haircuts or other goods and services? (Please include deliveries for items you ordered by phone, through a mail order catalogue, or via modem or Internet.) Percent of Respondents
No, did not receive deliveries 93.8%
Yes, received deliveries 6.2%
Total 100.0%
Table 24: Replacement of Trips by Receipt of Deliveries Did the delivery substitute for a travel trip you might have made to seek the good or service? Percent of Respondents
Yes 43.7%
No 56.3%
Total 100.0%
Trip Characteristics of the Work Commute
The travel characteristics of work commute trips are displayed in Table 25, and compared to results from the 2001 National Household Transportation Study. The average commute distance of Flagstaff area residents was 6.5 miles, less than half the distance of the average national work commute. The average duration of the work commute trip was about 17 minutes for Flagstaff area residents, significantly shorter than the national average commute duration of about 25 minutes. This shows that the commuting trends in Flagstaff are positive and the FMPO is providing transportation solutions that are keeping the commute time to a minimum.
Table 25: Summary Trip Characteristics of All Work Commute Trips
Work Commute Trip Characteristics Flagstaff Area 2006 2001 NHTS*
Average estimated trip length in miles 6.5 miles 14.6 miles
Average estimated trip time in minutes 16.8 minutes 24.8 minutes
Average miles per hour 20.6 mph ---
*Source: 2001 National Household Transportation Study
Trip Diary Survey of Community Travel Patterns Report of Results
© 2007 National Research Center, Inc.
Page 32
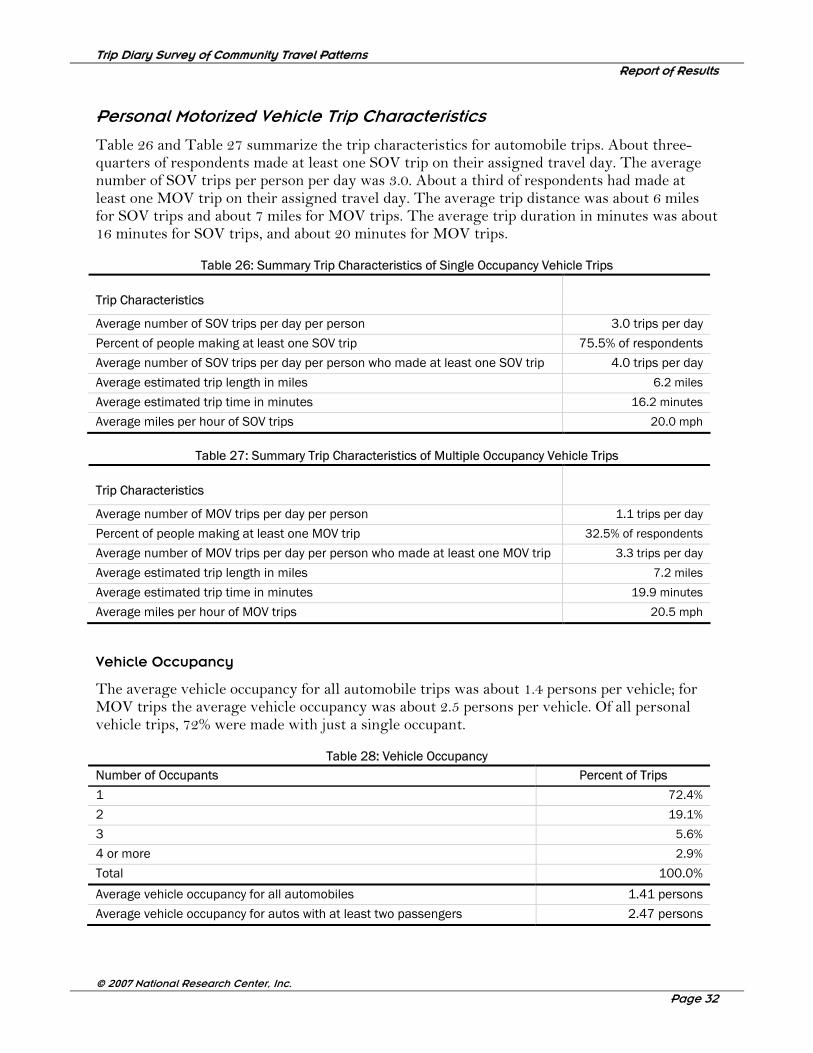
Personal Motorized Vehicle Trip Characteristics
Table 26 and Table 27 summarize the trip characteristics for automobile trips. About three-quarters of respondents made at least one SOV trip on their assigned travel day. The average number of SOV trips per person per day was 3.0. About a third of respondents had made at least one MOV trip on their assigned travel day. The average trip distance was about 6 miles for SOV trips and about 7 miles for MOV trips. The average trip duration in minutes was about 16 minutes for SOV trips, and about 20 minutes for MOV trips.
Table 26: Summary Trip Characteristics of Single Occupancy Vehicle Trips
Trip Characteristics
Average number of SOV trips per day per person 3.0 trips per day
Percent of people making at least one SOV trip 75.5% of respondents
Average number of SOV trips per day per person who made at least one SOV trip 4.0 trips per day
Average estimated trip length in miles 6.2 miles
Average estimated trip time in minutes 16.2 minutes
Average miles per hour of SOV trips 20.0 mph
Table 27: Summary Trip Characteristics of Multiple Occupancy Vehicle Trips
Trip Characteristics
Average number of MOV trips per day per person 1.1 trips per day
Percent of people making at least one MOV trip 32.5% of respondents
Average number of MOV trips per day per person who made at least one MOV trip 3.3 trips per day
Average estimated trip length in miles 7.2 miles
Average estimated trip time in minutes 19.9 minutes
Average miles per hour of MOV trips 20.5 mph
Vehicle Occupancy
The average vehicle occupancy for all automobile trips was about 1.4 persons per vehicle; for MOV trips the average vehicle occupancy was about 2.5 persons per vehicle. Of all personal vehicle trips, 72% were made with just a single occupant.
Table 28: Vehicle Occupancy Number of Occupants Percent of Trips
1 72.4%
2 19.1%
3 5.6%
4 or more 2.9%
Total 100.0%
Average vehicle occupancy for all automobiles 1.41 persons
Average vehicle occupancy for autos with at least two passengers 2.47 persons
Trip Diary Survey of Community Travel Patterns Report of Results
© 2007 National Research Center, Inc.
Page 33
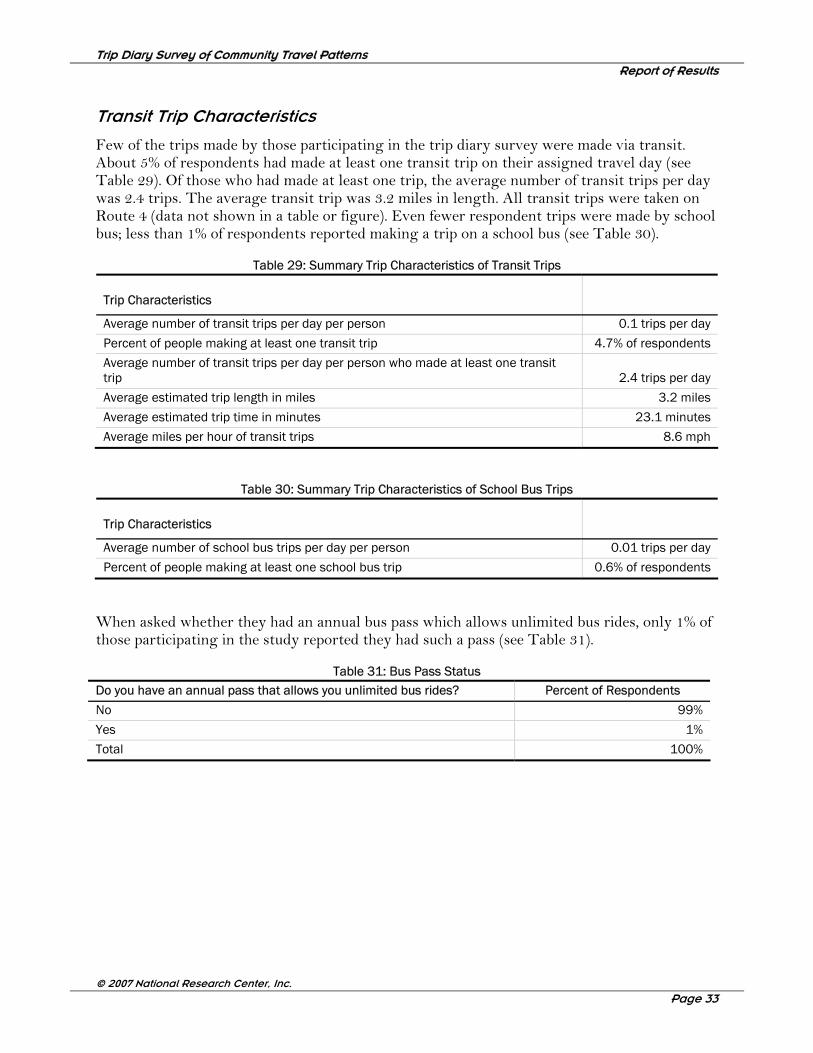
Transit Trip Characteristics
Few of the trips made by those participating in the trip diary survey were made via transit. About 5% of respondents had made at least one transit trip on their assigned travel day (see Table 29). Of those who had made at least one trip, the average number of transit trips per day was 2.4 trips. The average transit trip was 3.2 miles in length. All transit trips were taken on Route 4 (data not shown in a table or figure). Even fewer respondent trips were made by school bus; less than 1% of respondents reported making a trip on a school bus (see Table 30).
Table 29: Summary Trip Characteristics of Transit Trips
Trip Characteristics
Average number of transit trips per day per person 0.1 trips per day
Percent of people making at least one transit trip 4.7% of respondents
Average number of transit trips per day per person who made at least one transit trip 2.4 trips per day
Average estimated trip length in miles 3.2 miles
Average estimated trip time in minutes 23.1 minutes
Average miles per hour of transit trips 8.6 mph
Table 30: Summary Trip Characteristics of School Bus Trips
Trip Characteristics
Average number of school bus trips per day per person 0.01 trips per day
Percent of people making at least one school bus trip 0.6% of respondents
When asked whether they had an annual bus pass which allows unlimited bus rides, only 1% of those participating in the study reported they had such a pass (see Table 31).
Table 31: Bus Pass Status Do you have an annual pass that allows you unlimited bus rides? Percent of Respondents
No 99%
Yes 1%
Total 100%
Trip Diary Survey of Community Travel Patterns Report of Results
© 2007 National Research Center, Inc.
Page 34
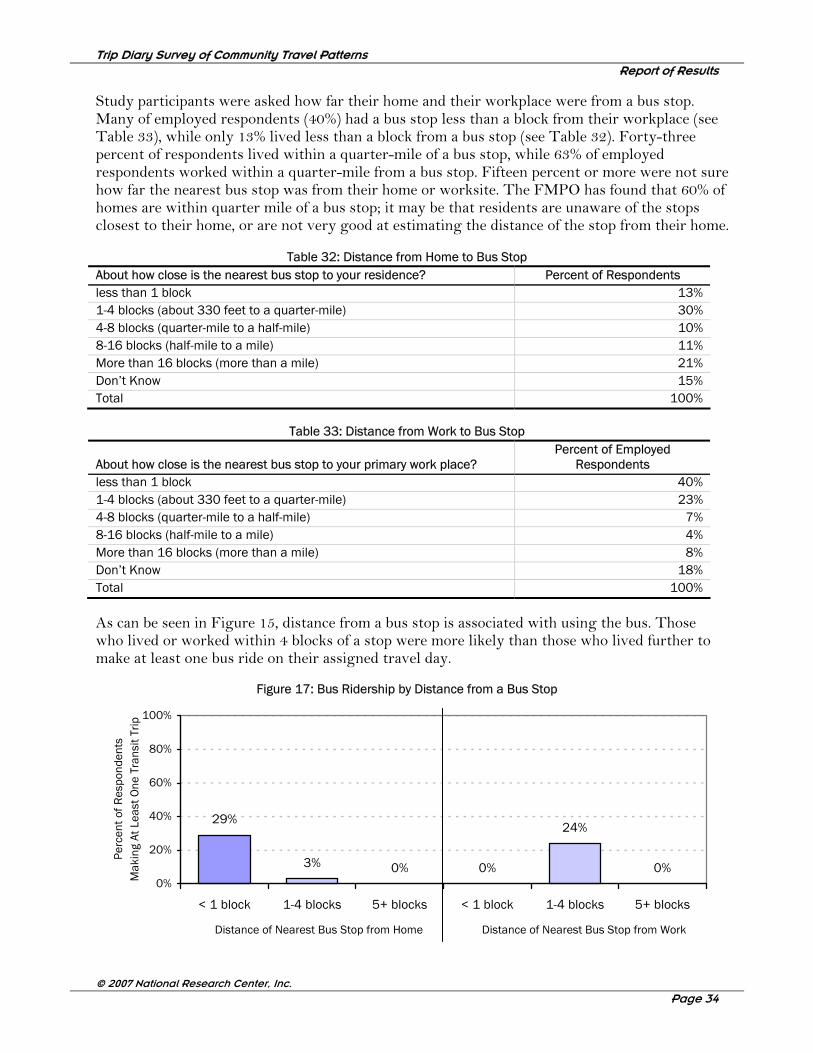
Study participants were asked how far their home and their workplace were from a bus stop. Many of employed respondents (40%) had a bus stop less than a block from their workplace (see Table 33), while only 13% lived less than a block from a bus stop (see Table 32). Forty-three percent of respondents lived within a quarter-mile of a bus stop, while 63% of employed respondents worked within a quarter-mile from a bus stop. Fifteen percent or more were not sure how far the nearest bus stop was from their home or worksite. The FMPO has found that 60% of homes are within quarter mile of a bus stop; it may be that residents are unaware of the stops closest to their home, or are not very good at estimating the distance of the stop from their home.
Table 32: Distance from Home to Bus Stop About how close is the nearest bus stop to your residence? Percent of Respondents less than 1 block 13% 1-4 blocks (about 330 feet to a quarter-mile) 30% 4-8 blocks (quarter-mile to a half-mile) 10% 8-16 blocks (half-mile to a mile) 11% More than 16 blocks (more than a mile) 21% Don’t Know 15% Total 100%
Table 33: Distance from Work to Bus Stop
About how close is the nearest bus stop to your primary work place? Percent of Employed
Respondents less than 1 block 40% 1-4 blocks (about 330 feet to a quarter-mile) 23% 4-8 blocks (quarter-mile to a half-mile) 7% 8-16 blocks (half-mile to a mile) 4% More than 16 blocks (more than a mile) 8% Don’t Know 18% Total 100% As can be seen in Figure 15, distance from a bus stop is associated with using the bus. Those who lived or worked within 4 blocks of a stop were more likely than those who lived further to make at least one bus ride on their assigned travel day.
Figure 17: Bus Ridership by Distance from a Bus Stop
29%
3% 0% 0%
24%
0%0%
20%
40%
60%
80%
100%
< 1 block 1-4 blocks 5+ blocks < 1 block 1-4 blocks 5+ blocks
Perc
ent o
f Res
pond
ents
M
akin
g At
Lea
st O
ne T
rans
it Tr
ip
Distance of Nearest Bus Stop from Home Distance of Nearest Bus Stop from Work
Trip Diary Survey of Community Travel Patterns Report of Results
© 2007 National Research Center, Inc.
Page 35
Non-Vehicle Trip Characteristics: Walking and Biking
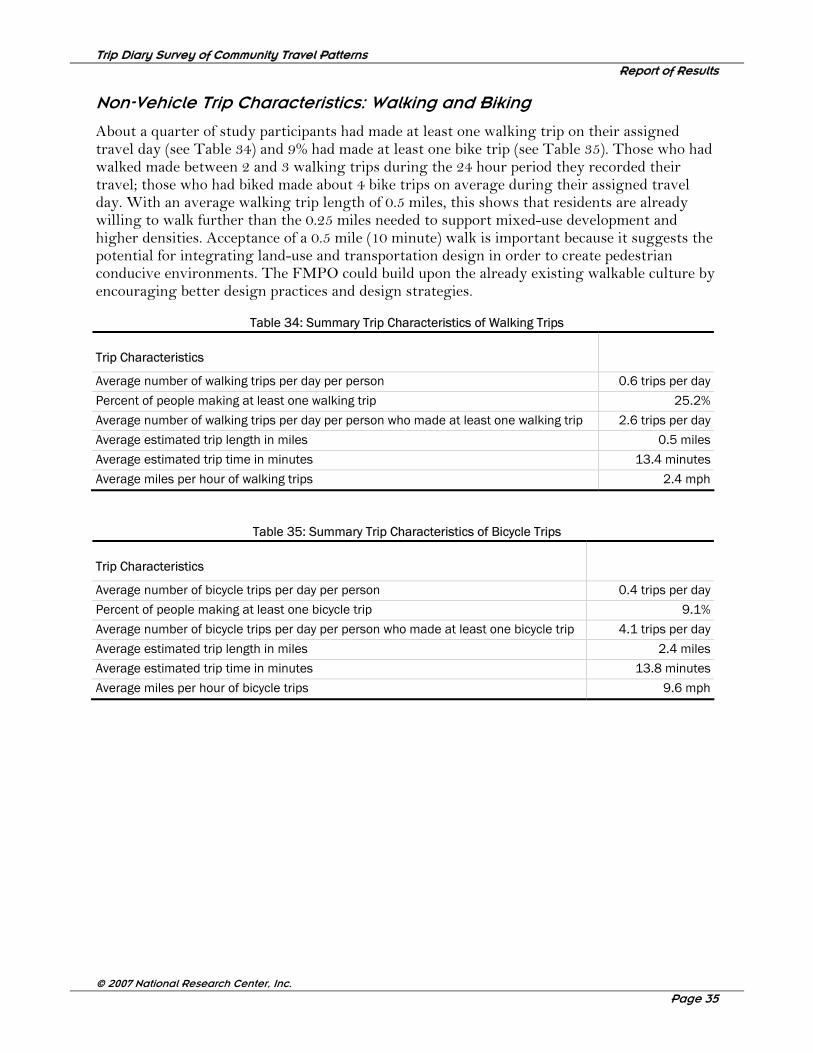
About a quarter of study participants had made at least one walking trip on their assigned travel day (see Table 34) and 9% had made at least one bike trip (see Table 35). Those who had walked made between 2 and 3 walking trips during the 24 hour period they recorded their travel; those who had biked made about 4 bike trips on average during their assigned travel day. With an average walking trip length of 0.5 miles, this shows that residents are already willing to walk further than the 0.25 miles needed to support mixed-use development and higher densities. Acceptance of a 0.5 mile (10 minute) walk is important because it suggests the potential for integrating land-use and transportation design in order to create pedestrian conducive environments. The FMPO could build upon the already existing walkable culture by encouraging better design practices and design strategies.
Table 34: Summary Trip Characteristics of Walking Trips
Trip Characteristics
Average number of walking trips per day per person 0.6 trips per day
Percent of people making at least one walking trip 25.2%
Average number of walking trips per day per person who made at least one walking trip 2.6 trips per day
Average estimated trip length in miles 0.5 miles
Average estimated trip time in minutes 13.4 minutes
Average miles per hour of walking trips 2.4 mph
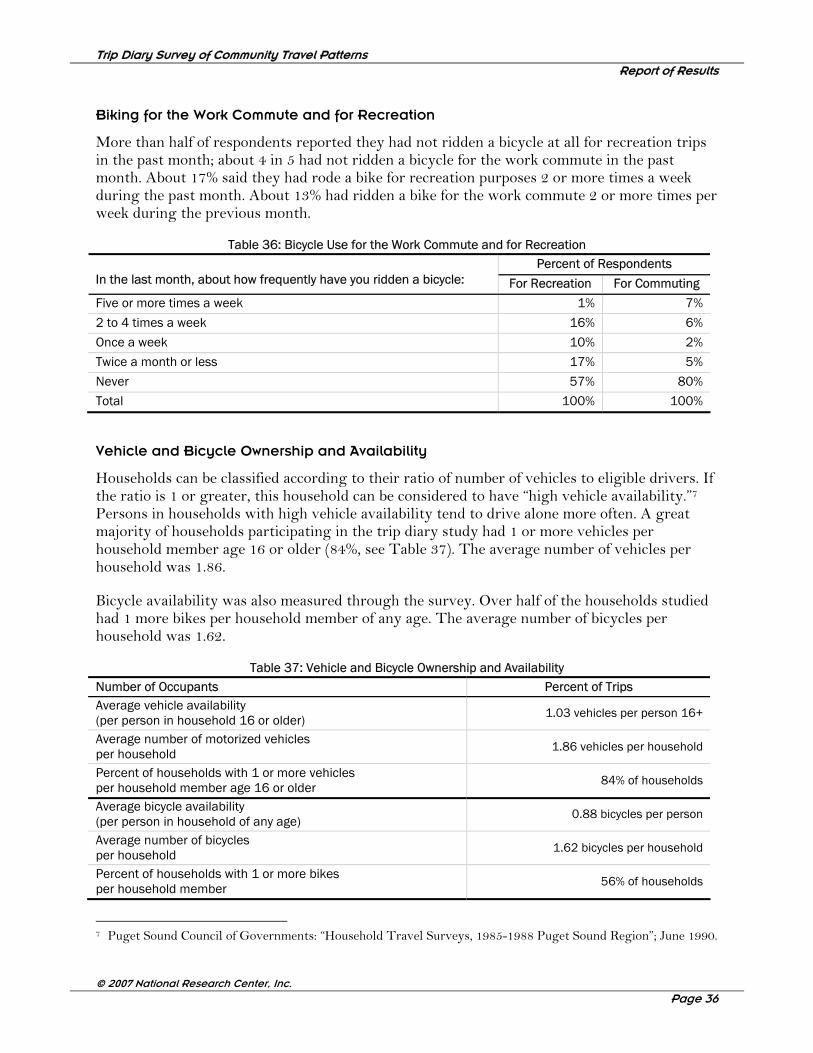
Table 35: Summary Trip Characteristics of Bicycle Trips
Trip Characteristics
Average number of bicycle trips per day per person 0.4 trips per day
Percent of people making at least one bicycle trip 9.1%
Average number of bicycle trips per day per person who made at least one bicycle trip 4.1 trips per day
Average estimated trip length in miles 2.4 miles
Average estimated trip time in minutes 13.8 minutes
Average miles per hour of bicycle trips 9.6 mph
Trip Diary Survey of Community Travel Patterns Report of Results
© 2007 National Research Center, Inc.
Page 36
Biking for the Work Commute and for Recreation
More than half of respondents reported they had not ridden a bicycle at all for recreation trips in the past month; about 4 in 5 had not ridden a bicycle for the work commute in the past month. About 17% said they had rode a bike for recreation purposes 2 or more times a week during the past month. About 13% had ridden a bike for the work commute 2 or more times per week during the previous month.
Table 36: Bicycle Use for the Work Commute and for Recreation Percent of Respondents
In the last month, about how frequently have you ridden a bicycle: For Recreation For Commuting
Five or more times a week 1% 7%
2 to 4 times a week 16% 6%
Once a week 10% 2%
Twice a month or less 17% 5%
Never 57% 80%
Total 100% 100% Vehicle and Bicycle Ownership and Availability
Households can be classified according to their ratio of number of vehicles to eligible drivers. If the ratio is 1 or greater, this household can be considered to have “high vehicle availability.”7 Persons in households with high vehicle availability tend to drive alone more often. A great majority of households participating in the trip diary study had 1 or more vehicles per household member age 16 or older (84%, see Table 37). The average number of vehicles per household was 1.86.
Bicycle availability was also measured through the survey. Over half of the households studied had 1 more bikes per household member of any age. The average number of bicycles per household was 1.62.
Table 37: Vehicle and Bicycle Ownership and Availability Number of Occupants Percent of Trips Average vehicle availability (per person in household 16 or older) 1.03 vehicles per person 16+
Average number of motorized vehicles per household 1.86 vehicles per household
Percent of households with 1 or more vehicles per household member age 16 or older 84% of households
Average bicycle availability (per person in household of any age) 0.88 bicycles per person
Average number of bicycles per household 1.62 bicycles per household
Percent of households with 1 or more bikes per household member 56% of households
7 Puget Sound Council of Governments: “Household Travel Surveys, 1985-1988 Puget Sound Region”; June 1990.

Trip Diary Survey of Community Travel Patterns Report of Results
© 2007 National Research Center, Inc.
Page 37
Resident Perceptions of Travel in the Flagstaff Area
In addition to measuring travel behaviors, a survey which accompanied the trip diary asked respondents to rate various aspects of the regional transportation system. About three-quarters felt the overall transportation system does “very well” or “somewhat well” in meeting their travel needs (see Figure 18).
Figure 18: Rating of the Region’s Transportation System
The transportation system in our region consists of roads, buses, sidewalks, Flagstaff Urtban Trails System (FUTS) trails, and bike facilities. How well do you feel the transportation system meets your travel needs?
Very Well28%
Not At All7%
Not Too Well16%
Somewhat Well49%
Trip Diary Survey of Community Travel Patterns Report of Results
© 2007 National Research Center, Inc.
Page 38
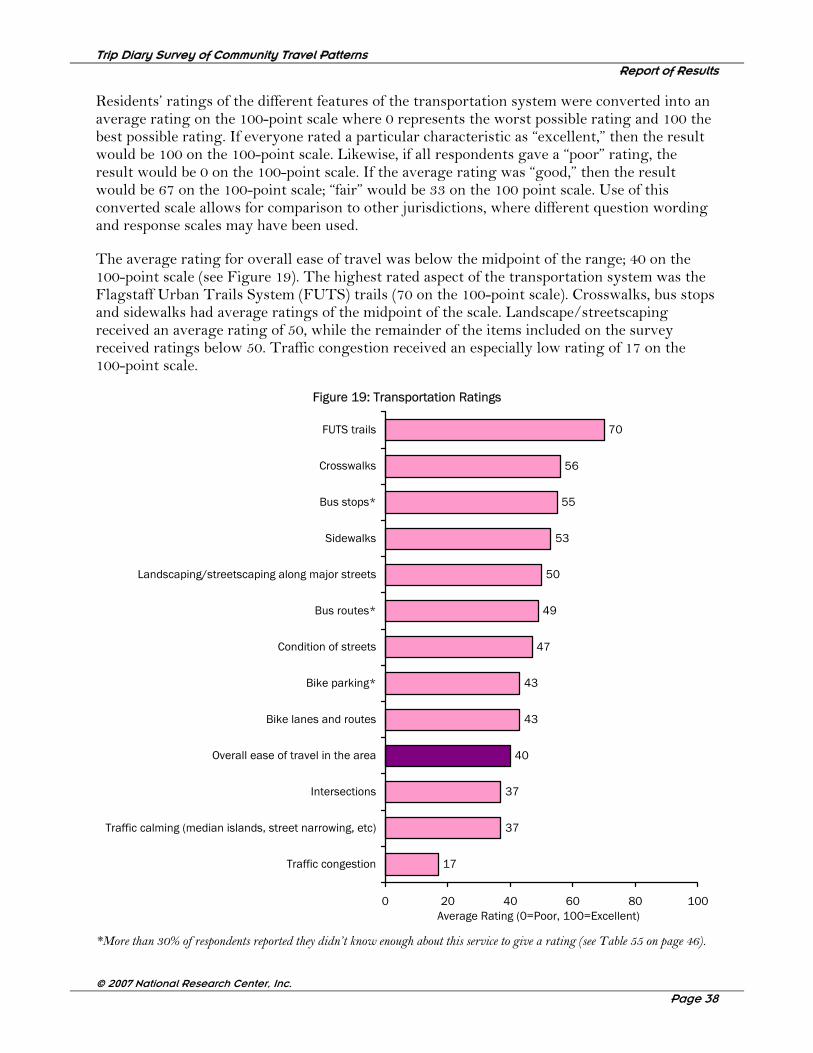
Residents’ ratings of the different features of the transportation system were converted into an average rating on the 100-point scale where 0 represents the worst possible rating and 100 the best possible rating. If everyone rated a particular characteristic as “excellent,” then the result would be 100 on the 100-point scale. Likewise, if all respondents gave a “poor” rating, the result would be 0 on the 100-point scale. If the average rating was “good,” then the result would be 67 on the 100-point scale; “fair” would be 33 on the 100 point scale. Use of this converted scale allows for comparison to other jurisdictions, where different question wording and response scales may have been used.
The average rating for overall ease of travel was below the midpoint of the range; 40 on the 100-point scale (see Figure 19). The highest rated aspect of the transportation system was the Flagstaff Urban Trails System (FUTS) trails (70 on the 100-point scale). Crosswalks, bus stops and sidewalks had average ratings of the midpoint of the scale. Landscape/streetscaping received an average rating of 50, while the remainder of the items included on the survey received ratings below 50. Traffic congestion received an especially low rating of 17 on the 100-point scale.
Figure 19: Transportation Ratings
17
37
37
40
43
43
47
49
50
53
55
56
70
0 20 40 60 80 100
Traffic congestion
Traffic calming (median islands, street narrowing, etc)
Intersections
Overall ease of travel in the area
Bike lanes and routes
Bike parking*
Condition of streets
Bus routes*
Landscaping/streetscaping along major streets
Sidewalks
Bus stops*
Crosswalks
FUTS trails
Average Rating (0=Poor, 100=Excellent)
*More than 30% of respondents reported they didn’t know enough about this service to give a rating (see Table 55 on page 46).
Trip Diary Survey of Community Travel Patterns Report of Results
© 2007 National Research Center, Inc.
Page 39
Comparisons to Other Jurisdictions
On a report card, an “A” mark is usually a 90 or above. Few services actually receive ratings as high as 90 on the 100-point scale, in part because certain kinds of services tend to be thought less well of by residents in many communities across the country, while other services get better ratings. For example, police protection tends to be received better than street maintenance by residents of most American cities. Where possible, the better comparison is not from one service to another within the jurisdiction, but from a particular jurisdiction’s services to services like them provided by other jurisdictions. National Research Center, Inc. (NRC) has collected citizen surveys conducted in about 400 jurisdictions in the United States. Responses to over 6,000 survey questions dealing with resident perceptions about the quality of community life and services provided by local government were recorded, analyzed and stored in an electronic database. The jurisdictions in the database represent a wide geographic and population range.
Comparisons to several of the ratings from the Flagstaff area trip diary survey results are provided when similar questions were included in the NRC database, and where there were at least five other jurisdictions in which the question was asked. Where comparisons were available, several numbers are provided. The first is the average rating given by Flagstaff area respondents. The second is the rank assigned to this rating among jurisdictions where a similar question was asked. It is followed by the number of jurisdictions that asked a similar question. Fourth, the rank is expressed as a percentile to indicate its distance from the top score. This rank (5th highest out of 25 jurisdictions’ results, for example) translates to a percentile (the 80th percentile in this example). A percentile indicates the percent of jurisdictions with identical or lower ratings. Therefore, a rating at the 80th percentile would mean that Flagstaff’s rating is equal to or better than 80% of the ratings from other jurisdictions. Conversely, 20% of the jurisdictions where a similar question was asked had higher ratings.
Alongside the rank and percentile appears a comparison: “above norm,” “below norm” or “similar to norm.” This evaluation of “above,” “below” or “similar to” comes from a statistical comparison of the rating to the norm (the average rating from all the comparison jurisdictions where a similar question was asked). Differences of 5 or more points on the 100-point scale between Flagstaff’s ratings and the average based on the appropriate comparisons from the database are considered “statistically significant,” and thus are marked as “above” or “below” the norm. When differences between Flagstaff’s ratings and the national norms are 4 points or less, they are marked as “similar to” the norm.
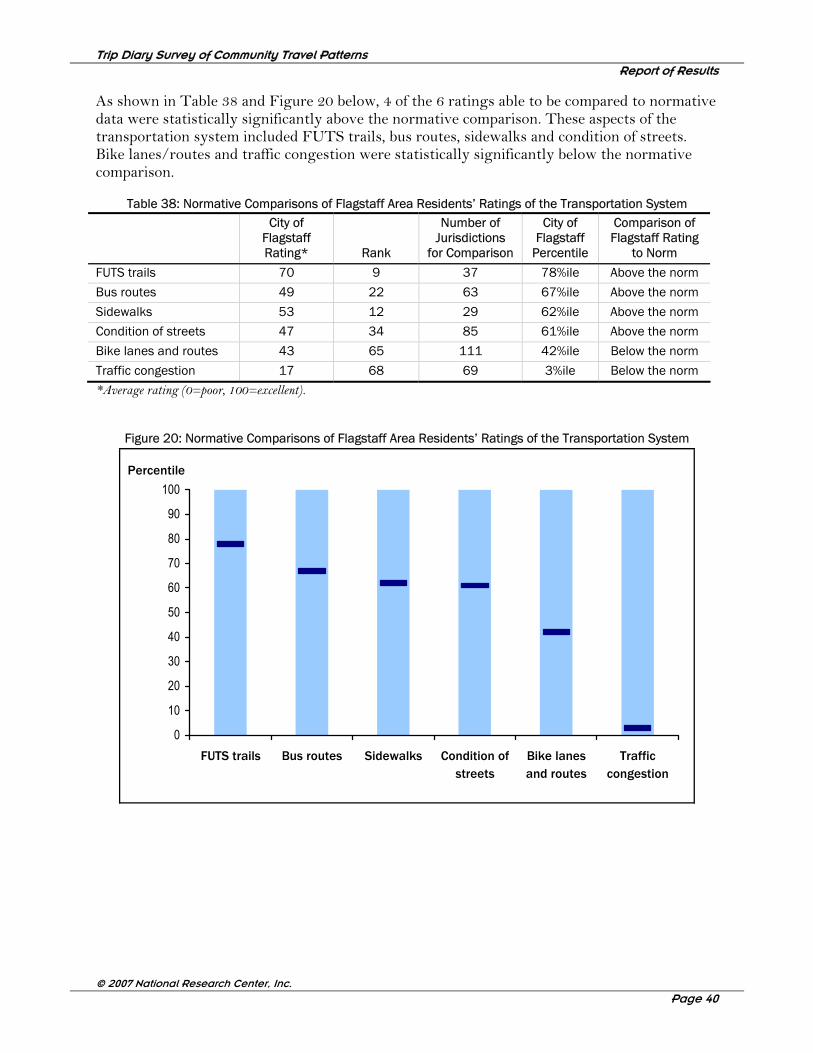
Trip Diary Survey of Community Travel Patterns Report of Results
© 2007 National Research Center, Inc.
Page 40
As shown in Table 38 and Figure 20 below, 4 of the 6 ratings able to be compared to normative data were statistically significantly above the normative comparison. These aspects of the transportation system included FUTS trails, bus routes, sidewalks and condition of streets. Bike lanes/routes and traffic congestion were statistically significantly below the normative comparison.
Table 38: Normative Comparisons of Flagstaff Area Residents’ Ratings of the Transportation System
City of Flagstaff Rating* Rank
Number of Jurisdictions
for Comparison
City of Flagstaff
Percentile
Comparison of Flagstaff Rating
to Norm
FUTS trails 70 9 37 78%ile Above the norm
Bus routes 49 22 63 67%ile Above the norm
Sidewalks 53 12 29 62%ile Above the norm
Condition of streets 47 34 85 61%ile Above the norm
Bike lanes and routes 43 65 111 42%ile Below the norm
Traffic congestion 17 68 69 3%ile Below the norm *Average rating (0=poor, 100=excellent).
Figure 20: Normative Comparisons of Flagstaff Area Residents’ Ratings of the Transportation System
0
10
20
30
40
50
60
70
80
90
100
FUTS trails Bus routes Sidewalks Condition ofstreets
Bike lanesand routes
Trafficcongestion
Percentile
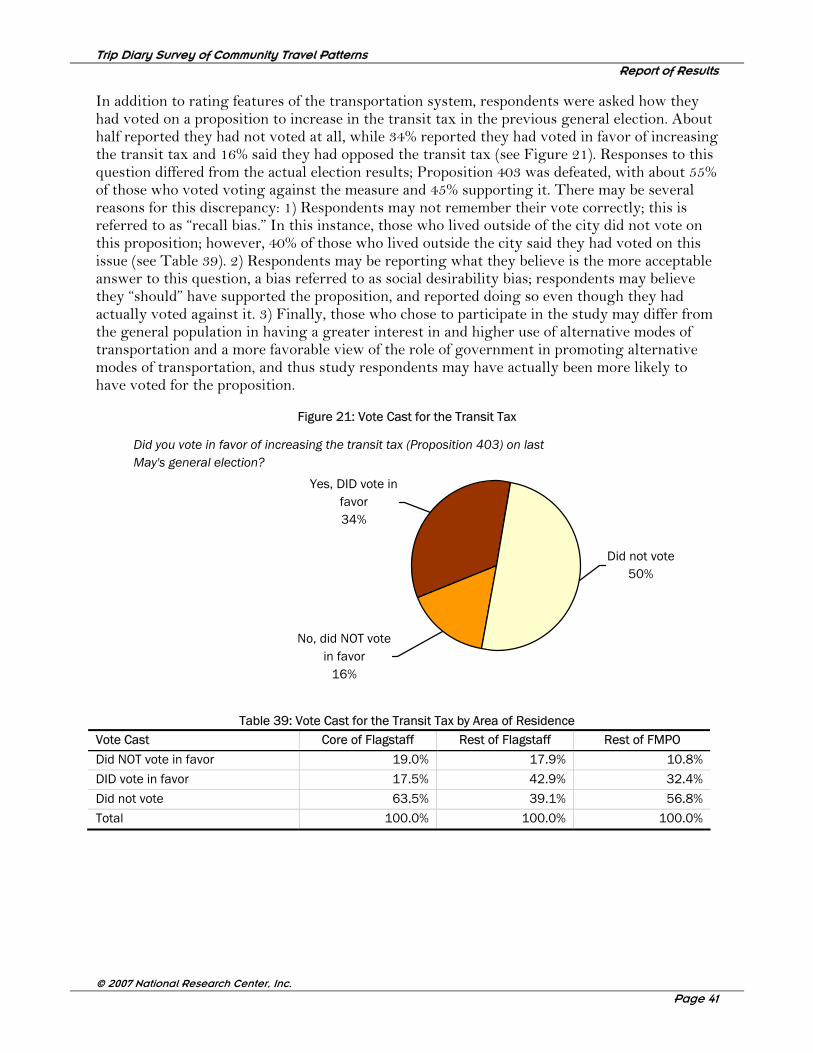
Trip Diary Survey of Community Travel Patterns Report of Results
© 2007 National Research Center, Inc.
Page 41
In addition to rating features of the transportation system, respondents were asked how they had voted on a proposition to increase in the transit tax in the previous general election. About half reported they had not voted at all, while 34% reported they had voted in favor of increasing the transit tax and 16% said they had opposed the transit tax (see Figure 21). Responses to this question differed from the actual election results; Proposition 403 was defeated, with about 55% of those who voted voting against the measure and 45% supporting it. There may be several reasons for this discrepancy: 1) Respondents may not remember their vote correctly; this is referred to as “recall bias.” In this instance, those who lived outside of the city did not vote on this proposition; however, 40% of those who lived outside the city said they had voted on this issue (see Table 39). 2) Respondents may be reporting what they believe is the more acceptable answer to this question, a bias referred to as social desirability bias; respondents may believe they “should” have supported the proposition, and reported doing so even though they had actually voted against it. 3) Finally, those who chose to participate in the study may differ from the general population in having a greater interest in and higher use of alternative modes of transportation and a more favorable view of the role of government in promoting alternative modes of transportation, and thus study respondents may have actually been more likely to have voted for the proposition.
Figure 21: Vote Cast for the Transit Tax
Did you vote in favor of increasing the transit tax (Proposition 403) on last May's general election?
No, did NOT vote in favor
16%
Did not vote50%
Yes, DID vote in favor34%
Table 39: Vote Cast for the Transit Tax by Area of Residence
Vote Cast Core of Flagstaff Rest of Flagstaff Rest of FMPO
Did NOT vote in favor 19.0% 17.9% 10.8%
DID vote in favor 17.5% 42.9% 32.4%
Did not vote 63.5% 39.1% 56.8%
Total 100.0% 100.0% 100.0%
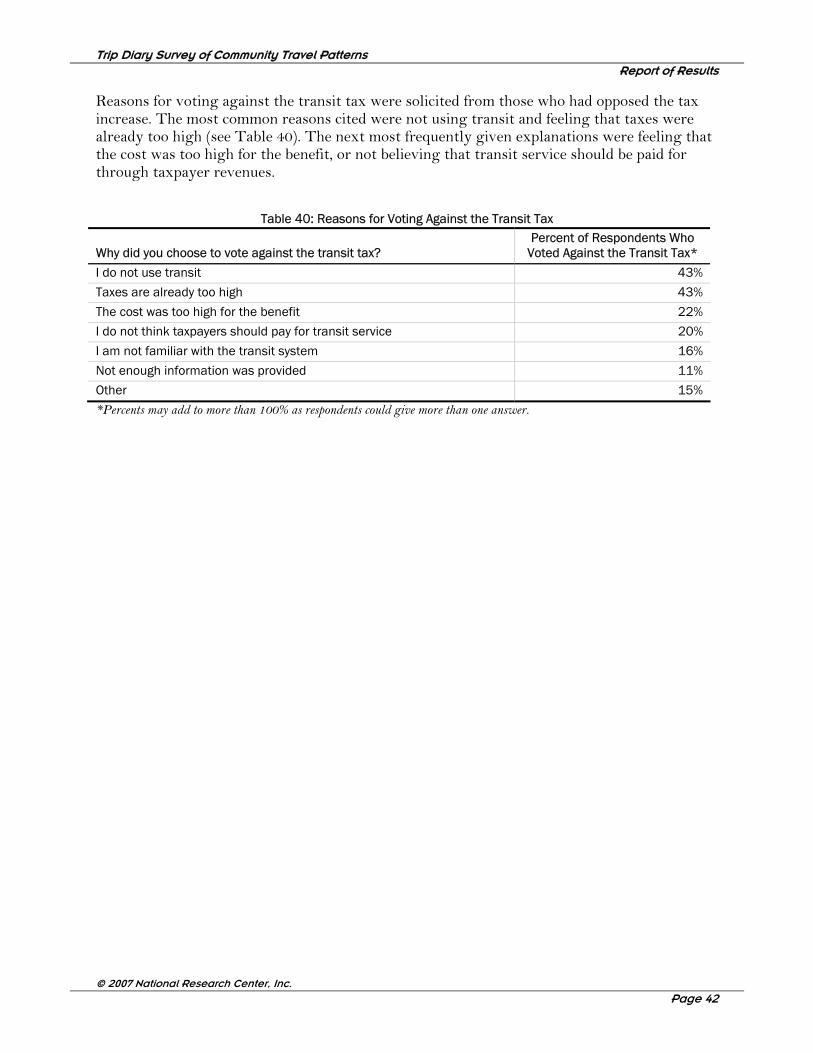
Trip Diary Survey of Community Travel Patterns Report of Results
© 2007 National Research Center, Inc.
Page 42
Reasons for voting against the transit tax were solicited from those who had opposed the tax increase. The most common reasons cited were not using transit and feeling that taxes were already too high (see Table 40). The next most frequently given explanations were feeling that the cost was too high for the benefit, or not believing that transit service should be paid for through taxpayer revenues.
Table 40: Reasons for Voting Against the Transit Tax
Why did you choose to vote against the transit tax? Percent of Respondents Who
Voted Against the Transit Tax*
I do not use transit 43%
Taxes are already too high 43%
The cost was too high for the benefit 22%
I do not think taxpayers should pay for transit service 20%
I am not familiar with the transit system 16%
Not enough information was provided 11%
Other 15%
*Percents may add to more than 100% as respondents could give more than one answer.
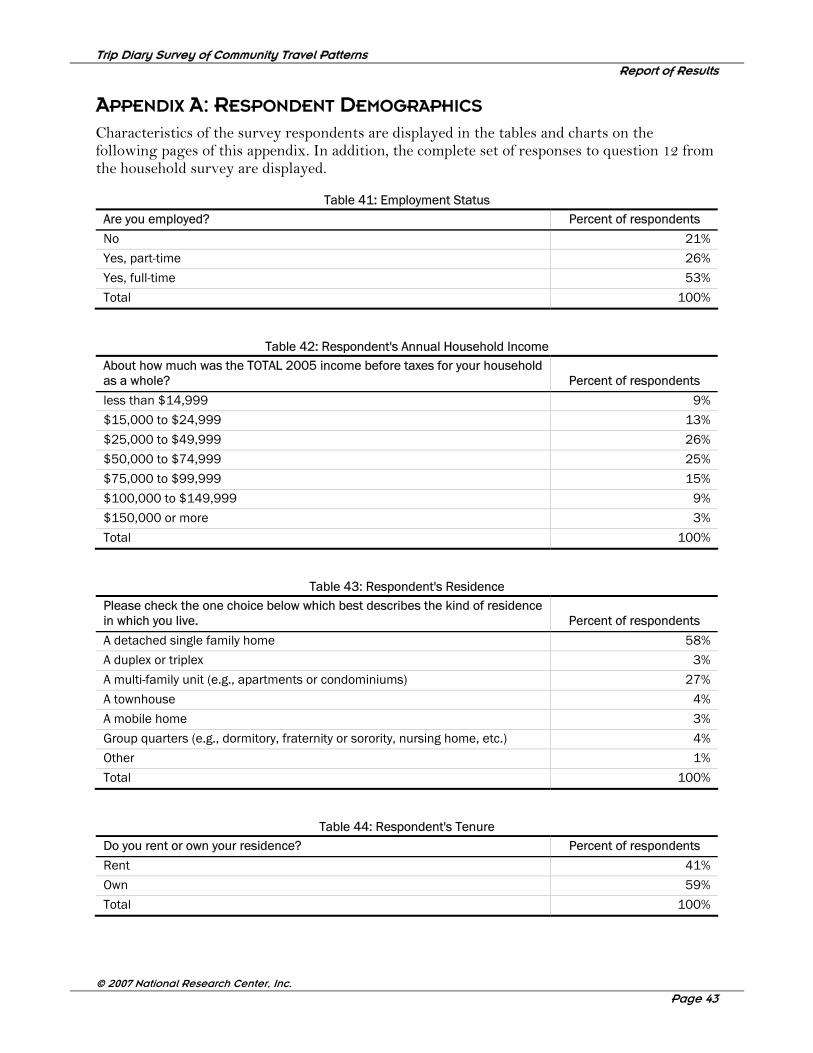
Trip Diary Survey of Community Travel Patterns Report of Results
© 2007 National Research Center, Inc.
Page 43
APPENDIX A: RESPONDENT DEMOGRAPHICS Characteristics of the survey respondents are displayed in the tables and charts on the following pages of this appendix. In addition, the complete set of responses to question 12 from the household survey are displayed.
Table 41: Employment Status Are you employed? Percent of respondents
No 21%
Yes, part-time 26%
Yes, full-time 53%
Total 100%
Table 42: Respondent's Annual Household Income About how much was the TOTAL 2005 income before taxes for your household as a whole? Percent of respondents
less than $14,999 9%
$15,000 to $24,999 13%
$25,000 to $49,999 26%
$50,000 to $74,999 25%
$75,000 to $99,999 15%
$100,000 to $149,999 9%
$150,000 or more 3%
Total 100%
Table 43: Respondent's Residence Please check the one choice below which best describes the kind of residence in which you live. Percent of respondents
A detached single family home 58%
A duplex or triplex 3%
A multi-family unit (e.g., apartments or condominiums) 27%
A townhouse 4%
A mobile home 3%
Group quarters (e.g., dormitory, fraternity or sorority, nursing home, etc.) 4%
Other 1%
Total 100%
Table 44: Respondent's Tenure Do you rent or own your residence? Percent of respondents
Rent 41%
Own 59%
Total 100%
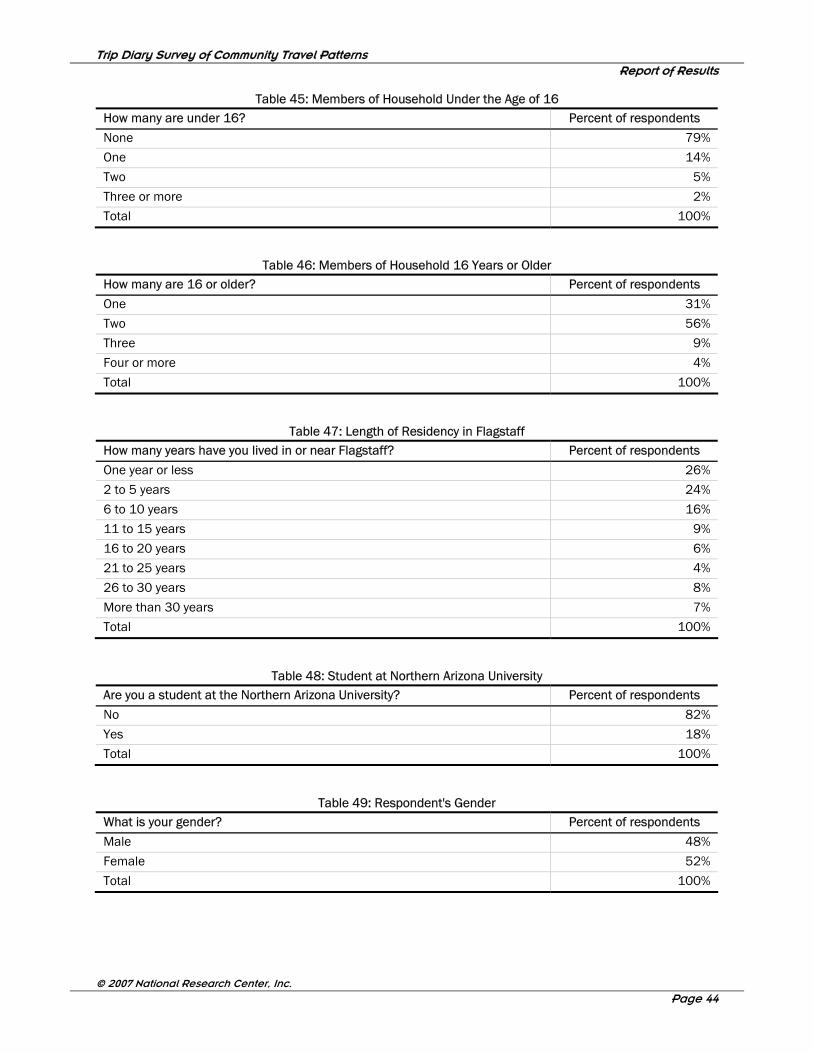
Trip Diary Survey of Community Travel Patterns Report of Results
© 2007 National Research Center, Inc.
Page 44
Table 45: Members of Household Under the Age of 16 How many are under 16? Percent of respondents
None 79%
One 14%
Two 5%
Three or more 2%
Total 100%
Table 46: Members of Household 16 Years or Older How many are 16 or older? Percent of respondents
One 31%
Two 56%
Three 9%
Four or more 4%
Total 100%
Table 47: Length of Residency in Flagstaff How many years have you lived in or near Flagstaff? Percent of respondents
One year or less 26%
2 to 5 years 24%
6 to 10 years 16%
11 to 15 years 9%
16 to 20 years 6%
21 to 25 years 4%
26 to 30 years 8%
More than 30 years 7%
Total 100%
Table 48: Student at Northern Arizona University Are you a student at the Northern Arizona University? Percent of respondents
No 82%
Yes 18%
Total 100%
Table 49: Respondent's Gender What is your gender? Percent of respondents
Male 48%
Female 52%
Total 100%
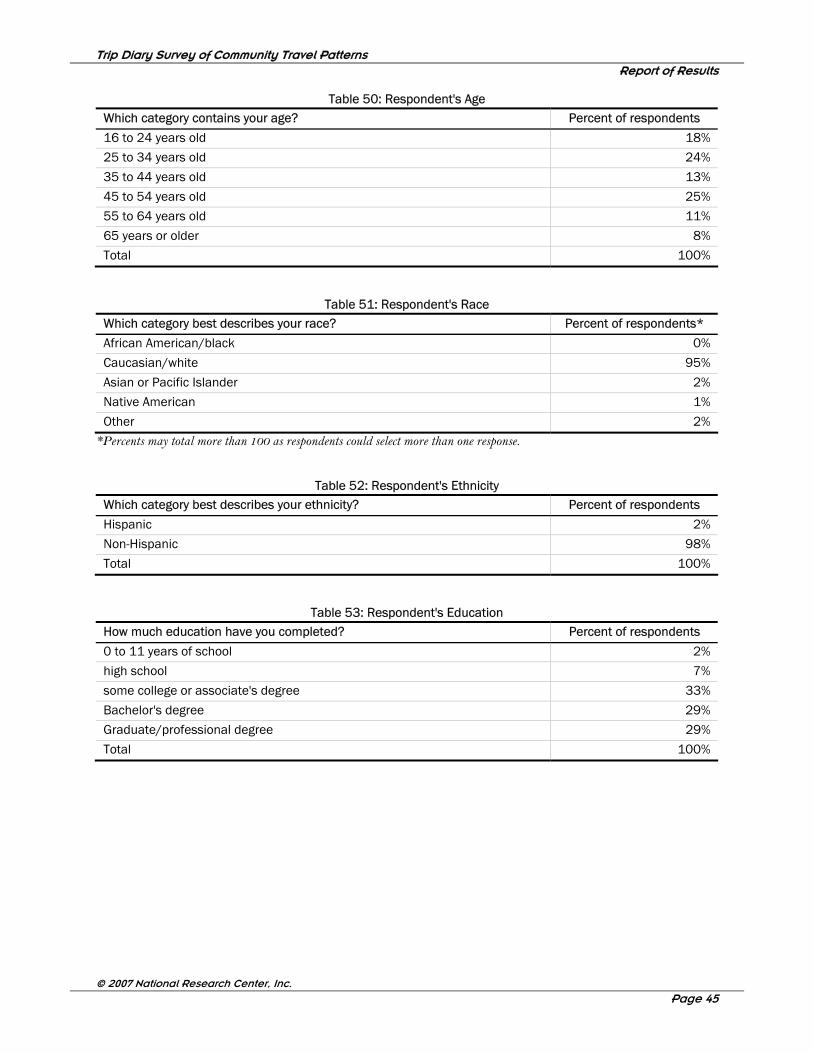
Trip Diary Survey of Community Travel Patterns Report of Results
© 2007 National Research Center, Inc.
Page 45
Table 50: Respondent's Age Which category contains your age? Percent of respondents
16 to 24 years old 18%
25 to 34 years old 24%
35 to 44 years old 13%
45 to 54 years old 25%
55 to 64 years old 11%
65 years or older 8%
Total 100%
Table 51: Respondent's Race Which category best describes your race? Percent of respondents*
African American/black 0%
Caucasian/white 95%
Asian or Pacific Islander 2%
Native American 1%
Other 2% *Percents may total more than 100 as respondents could select more than one response.
Table 52: Respondent's Ethnicity Which category best describes your ethnicity? Percent of respondents
Hispanic 2%
Non-Hispanic 98%
Total 100%
Table 53: Respondent's Education How much education have you completed? Percent of respondents
0 to 11 years of school 2%
high school 7%
some college or associate's degree 33%
Bachelor's degree 29%
Graduate/professional degree 29%
Total 100%
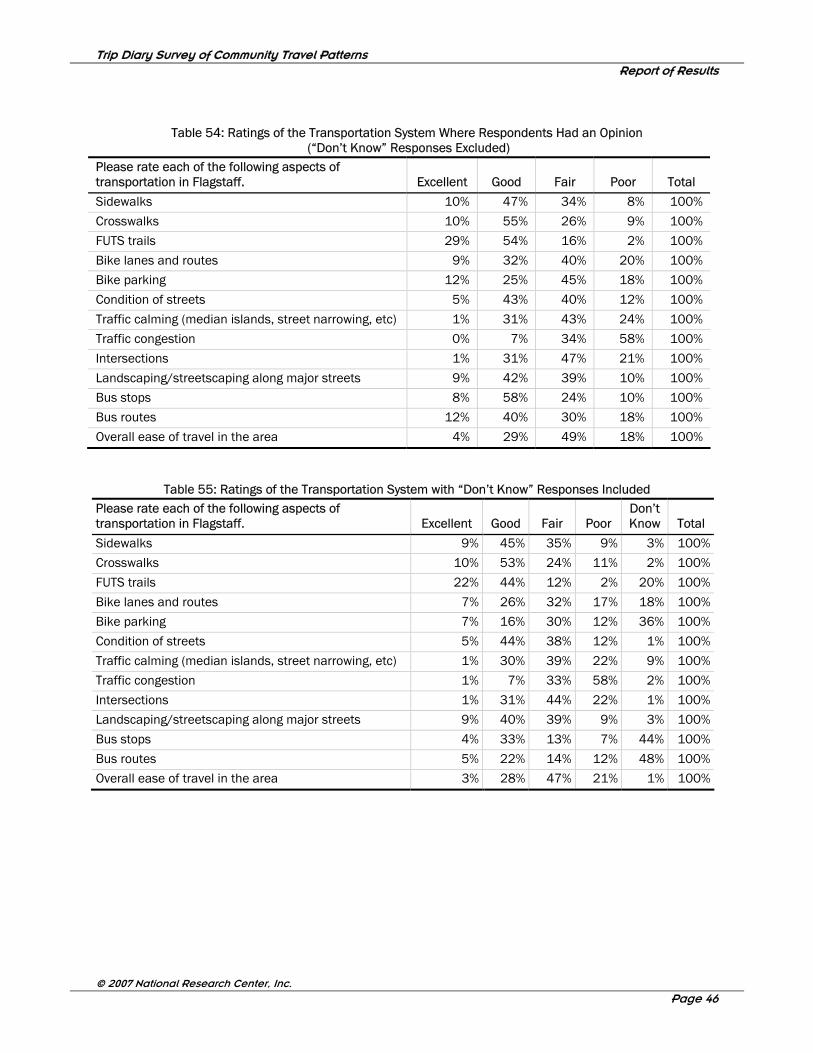
Trip Diary Survey of Community Travel Patterns Report of Results
© 2007 National Research Center, Inc.
Page 46
Table 54: Ratings of the Transportation System Where Respondents Had an Opinion (“Don’t Know” Responses Excluded)
Please rate each of the following aspects of transportation in Flagstaff. Excellent Good Fair Poor Total
Sidewalks 10% 47% 34% 8% 100%
Crosswalks 10% 55% 26% 9% 100%
FUTS trails 29% 54% 16% 2% 100%
Bike lanes and routes 9% 32% 40% 20% 100%
Bike parking 12% 25% 45% 18% 100%
Condition of streets 5% 43% 40% 12% 100%
Traffic calming (median islands, street narrowing, etc) 1% 31% 43% 24% 100%
Traffic congestion 0% 7% 34% 58% 100%
Intersections 1% 31% 47% 21% 100%
Landscaping/streetscaping along major streets 9% 42% 39% 10% 100%
Bus stops 8% 58% 24% 10% 100%
Bus routes 12% 40% 30% 18% 100%
Overall ease of travel in the area 4% 29% 49% 18% 100%
Table 55: Ratings of the Transportation System with “Don’t Know” Responses Included Please rate each of the following aspects of transportation in Flagstaff. Excellent Good Fair Poor
Don’t Know Total
Sidewalks 9% 45% 35% 9% 3% 100%
Crosswalks 10% 53% 24% 11% 2% 100%
FUTS trails 22% 44% 12% 2% 20% 100%
Bike lanes and routes 7% 26% 32% 17% 18% 100%
Bike parking 7% 16% 30% 12% 36% 100%
Condition of streets 5% 44% 38% 12% 1% 100%
Traffic calming (median islands, street narrowing, etc) 1% 30% 39% 22% 9% 100%
Traffic congestion 1% 7% 33% 58% 2% 100%
Intersections 1% 31% 44% 22% 1% 100%
Landscaping/streetscaping along major streets 9% 40% 39% 9% 3% 100%
Bus stops 4% 33% 13% 7% 44% 100%
Bus routes 5% 22% 14% 12% 48% 100%
Overall ease of travel in the area 3% 28% 47% 21% 1% 100%
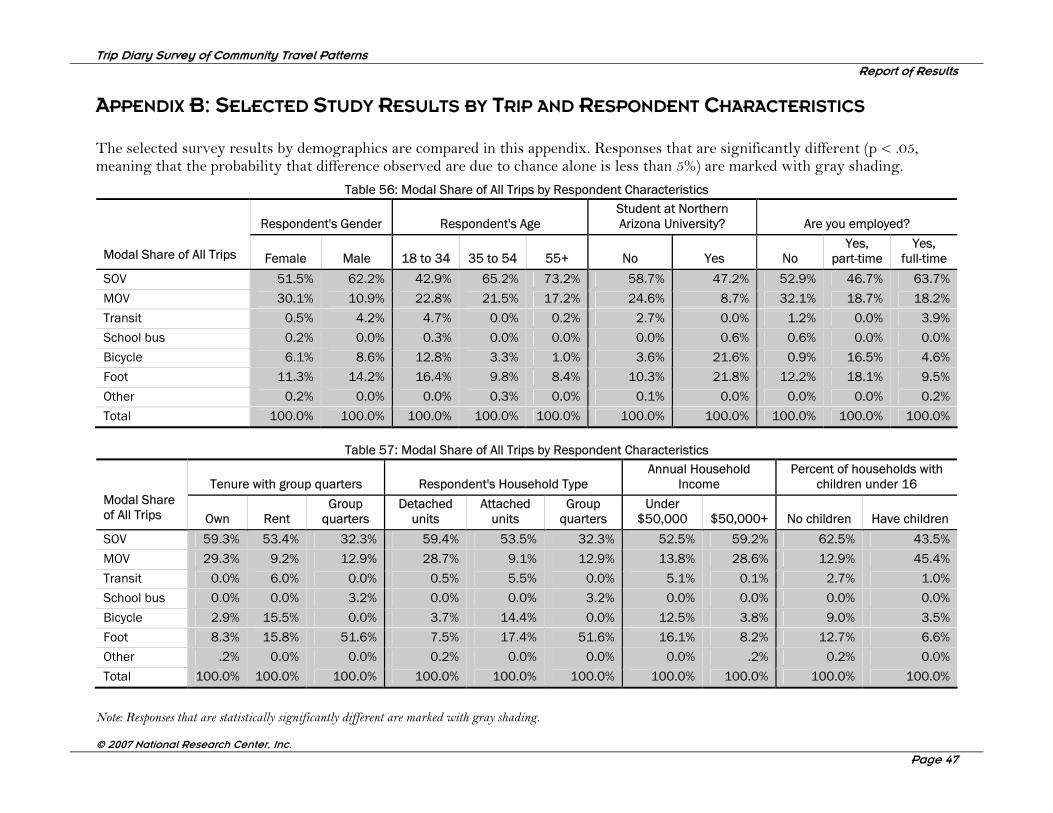
Trip Diary Survey of Community Travel Patterns Report of Results
Note: Responses that are statistically significantly different are marked with gray shading. © 2007 National Research Center, Inc.
Page 47
APPENDIX B: SELECTED STUDY RESULTS BY TRIP AND RESPONDENT CHARACTERISTICS The selected survey results by demographics are compared in this appendix. Responses that are significantly different (p < .05, meaning that the probability that difference observed are due to chance alone is less than 5%) are marked with gray shading.
Table 56: Modal Share of All Trips by Respondent Characteristics
Respondent's Gender Respondent's Age Student at Northern Arizona University? Are you employed?
Modal Share of All Trips Female Male 18 to 34 35 to 54 55+ No Yes No Yes,
part-time Yes,
full-time
SOV 51.5% 62.2% 42.9% 65.2% 73.2% 58.7% 47.2% 52.9% 46.7% 63.7%
MOV 30.1% 10.9% 22.8% 21.5% 17.2% 24.6% 8.7% 32.1% 18.7% 18.2%
Transit 0.5% 4.2% 4.7% 0.0% 0.2% 2.7% 0.0% 1.2% 0.0% 3.9%
School bus 0.2% 0.0% 0.3% 0.0% 0.0% 0.0% 0.6% 0.6% 0.0% 0.0%
Bicycle 6.1% 8.6% 12.8% 3.3% 1.0% 3.6% 21.6% 0.9% 16.5% 4.6%
Foot 11.3% 14.2% 16.4% 9.8% 8.4% 10.3% 21.8% 12.2% 18.1% 9.5%
Other 0.2% 0.0% 0.0% 0.3% 0.0% 0.1% 0.0% 0.0% 0.0% 0.2%
Total 100.0% 100.0% 100.0% 100.0% 100.0% 100.0% 100.0% 100.0% 100.0% 100.0%
Table 57: Modal Share of All Trips by Respondent Characteristics
Tenure with group quarters Respondent's Household Type Annual Household
Income Percent of households with
children under 16 Modal Share of All Trips Own Rent
Group quarters
Detached units
Attached units
Group quarters
Under $50,000 $50,000+ No children Have children
SOV 59.3% 53.4% 32.3% 59.4% 53.5% 32.3% 52.5% 59.2% 62.5% 43.5%
MOV 29.3% 9.2% 12.9% 28.7% 9.1% 12.9% 13.8% 28.6% 12.9% 45.4%
Transit 0.0% 6.0% 0.0% 0.5% 5.5% 0.0% 5.1% 0.1% 2.7% 1.0%
School bus 0.0% 0.0% 3.2% 0.0% 0.0% 3.2% 0.0% 0.0% 0.0% 0.0%
Bicycle 2.9% 15.5% 0.0% 3.7% 14.4% 0.0% 12.5% 3.8% 9.0% 3.5%
Foot 8.3% 15.8% 51.6% 7.5% 17.4% 51.6% 16.1% 8.2% 12.7% 6.6%
Other .2% 0.0% 0.0% 0.2% 0.0% 0.0% 0.0% .2% 0.2% 0.0%
Total 100.0% 100.0% 100.0% 100.0% 100.0% 100.0% 100.0% 100.0% 100.0% 100.0%

Trip Diary Survey of Community Travel Patterns Report of Results
Note: Responses that are statistically significantly different are marked with gray shading. © 2007 National Research Center, Inc.
Page 48
Table 58: Modal Share of All Trips by Respondent Characteristics
Ratio of Autos to Drivers HH own any
bikes? Area Modal Share of All Trips
Less than 1 vehicle per driver
1 or more vehicles per driver No Yes
Rest of FMPO
Rest of Flagstaff
Core of Flagstaff Dorm
SOV 23.7% 63.6% 64.7% 53.4% 67.8% 56.2% 52.1% 33.3%
MOV 21.8% 21.6% 14.6% 23.8% 26.7% 20.3% 18.7% 19.0%
Transit 11.0% 0.5% 7.2% 0.4% 0.0% 3.5% 1.1% 0.0%
School bus 0.8% 0.0% 0.5% 0.0% 0.0% 0.0% 0.0% 4.8%
Bicycle 25.2% 3.9% 0.0% 9.8% 0.6% 8.2% 11.0% 0.0%
Foot 17.5% 10.3% 13.1% 12.4% 4.9% 11.8% 16.7% 42.9%
Other 0.0% 0.1% 0.0% 0.1% 0.0% 0.0% 0.5% 0.0%
Total 100.0% 100.0% 100.0% 100.0% 100.0% 100.0% 100.0% 100.0%
Table 59: Modal Share of Work Commute Trips by Respondent Characteristics
Respondent's Gender Respondent's Age Student at Northern Arizona University? Are you employed?
Modal Share of Work Commute Trips Female Male 18 to 34 35 to 54 55+ No Yes No
Yes, part-time
Yes, full-time
SOV 67.2% 78.0% 59.8% 80.0% 82.8% 73.9% 66.0% --- 63.5% 76.3%
MOV 22.1% 7.3% 21.9% 10.5% 6.9% 14.4% 13.2% --- 8.7% 14.9%
Transit 0.3% 0.0% 0.0% 0.0% 1.0% 0.1% 0.0% --- 0.0% 0.2%
School bus 0.0% 0.0% 0.0% 0.0% 0.0% 0.0% 0.0% --- 3.8% 3.2%
Bicycle 3.0% 3.6% 1.6% 4.8% 2.1% 2.7% 7.6% --- 24.1% 5.0%
Foot 6.9% 11.2% 16.7% 4.2% 7.1% 8.6% 13.2% --- 0.0% 0.3%
Other 0.5% 0.0% 0.0% 0.5% 0.0% 0.3% 0.0% --- 63.5% 76.3%
Total 100.0% 100.0% 100.0% 100.0% 100.0% 100.0% 100.0% --- 100.0% 100.0%
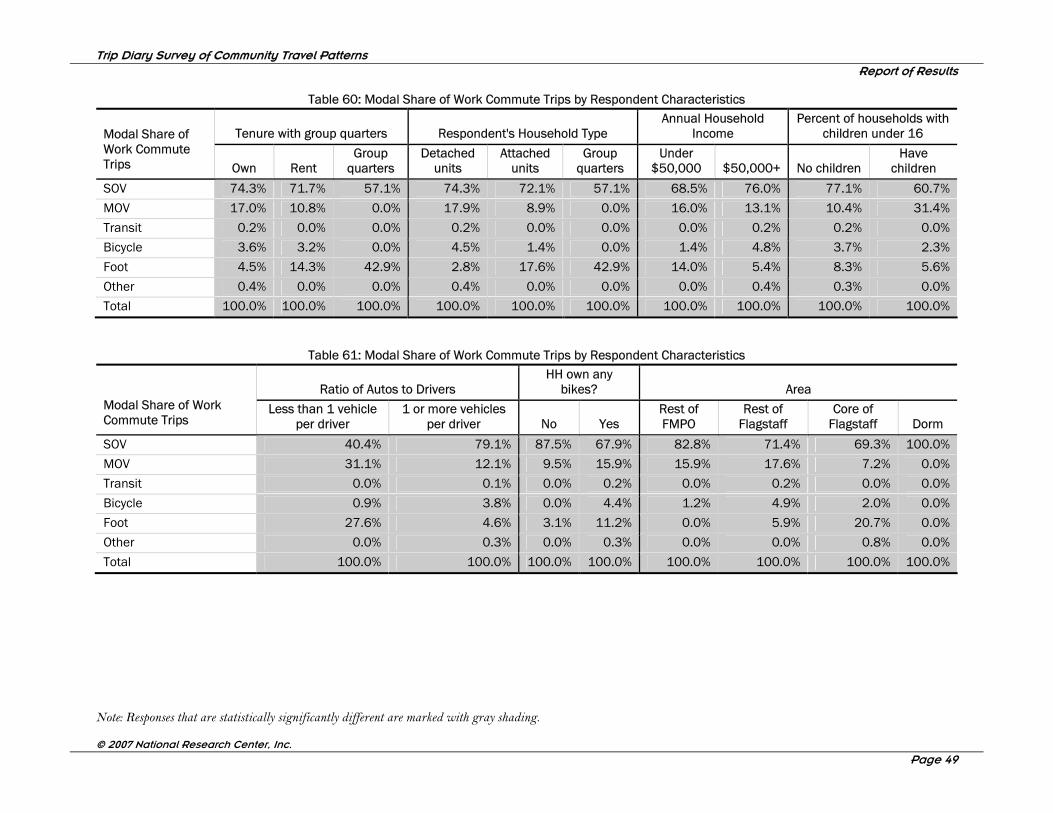
Trip Diary Survey of Community Travel Patterns Report of Results
Note: Responses that are statistically significantly different are marked with gray shading. © 2007 National Research Center, Inc.
Page 49
Table 60: Modal Share of Work Commute Trips by Respondent Characteristics
Tenure with group quarters Respondent's Household Type Annual Household
Income Percent of households with
children under 16 Modal Share of Work Commute Trips Own Rent
Group quarters
Detached units
Attached units
Group quarters
Under $50,000 $50,000+ No children
Have children
SOV 74.3% 71.7% 57.1% 74.3% 72.1% 57.1% 68.5% 76.0% 77.1% 60.7%
MOV 17.0% 10.8% 0.0% 17.9% 8.9% 0.0% 16.0% 13.1% 10.4% 31.4%
Transit 0.2% 0.0% 0.0% 0.2% 0.0% 0.0% 0.0% 0.2% 0.2% 0.0%
Bicycle 3.6% 3.2% 0.0% 4.5% 1.4% 0.0% 1.4% 4.8% 3.7% 2.3%
Foot 4.5% 14.3% 42.9% 2.8% 17.6% 42.9% 14.0% 5.4% 8.3% 5.6%
Other 0.4% 0.0% 0.0% 0.4% 0.0% 0.0% 0.0% 0.4% 0.3% 0.0%
Total 100.0% 100.0% 100.0% 100.0% 100.0% 100.0% 100.0% 100.0% 100.0% 100.0%
Table 61: Modal Share of Work Commute Trips by Respondent Characteristics
Ratio of Autos to Drivers HH own any
bikes? Area Modal Share of Work Commute Trips
Less than 1 vehicle per driver
1 or more vehicles per driver No Yes
Rest of FMPO
Rest of Flagstaff
Core of Flagstaff Dorm
SOV 40.4% 79.1% 87.5% 67.9% 82.8% 71.4% 69.3% 100.0%
MOV 31.1% 12.1% 9.5% 15.9% 15.9% 17.6% 7.2% 0.0%
Transit 0.0% 0.1% 0.0% 0.2% 0.0% 0.2% 0.0% 0.0%
Bicycle 0.9% 3.8% 0.0% 4.4% 1.2% 4.9% 2.0% 0.0%
Foot 27.6% 4.6% 3.1% 11.2% 0.0% 5.9% 20.7% 0.0%
Other 0.0% 0.3% 0.0% 0.3% 0.0% 0.0% 0.8% 0.0%
Total 100.0% 100.0% 100.0% 100.0% 100.0% 100.0% 100.0% 100.0%
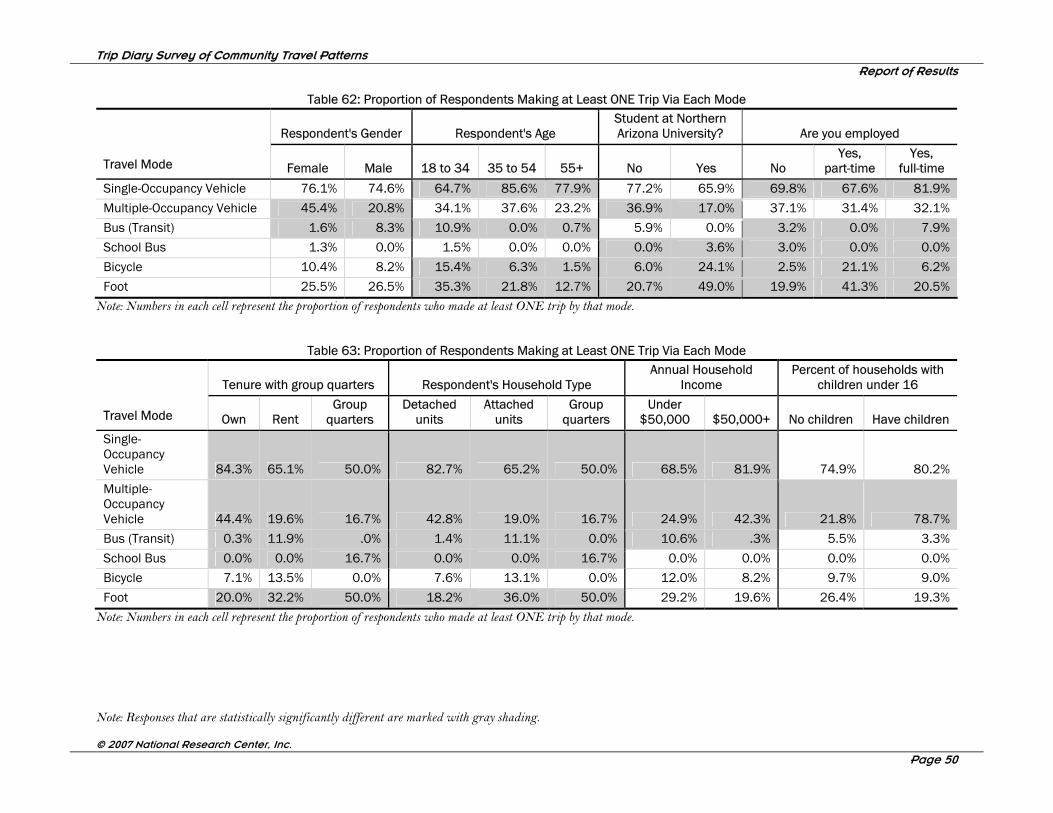
Trip Diary Survey of Community Travel Patterns Report of Results
Note: Responses that are statistically significantly different are marked with gray shading. © 2007 National Research Center, Inc.
Page 50
Table 62: Proportion of Respondents Making at Least ONE Trip Via Each Mode
Respondent's Gender Respondent's Age Student at Northern Arizona University? Are you employed
Travel Mode Female Male 18 to 34 35 to 54 55+ No Yes No Yes,
part-time Yes,
full-time
Single-Occupancy Vehicle 76.1% 74.6% 64.7% 85.6% 77.9% 77.2% 65.9% 69.8% 67.6% 81.9%
Multiple-Occupancy Vehicle 45.4% 20.8% 34.1% 37.6% 23.2% 36.9% 17.0% 37.1% 31.4% 32.1%
Bus (Transit) 1.6% 8.3% 10.9% 0.0% 0.7% 5.9% 0.0% 3.2% 0.0% 7.9%
School Bus 1.3% 0.0% 1.5% 0.0% 0.0% 0.0% 3.6% 3.0% 0.0% 0.0%
Bicycle 10.4% 8.2% 15.4% 6.3% 1.5% 6.0% 24.1% 2.5% 21.1% 6.2%
Foot 25.5% 26.5% 35.3% 21.8% 12.7% 20.7% 49.0% 19.9% 41.3% 20.5% Note: Numbers in each cell represent the proportion of respondents who made at least ONE trip by that mode.
Table 63: Proportion of Respondents Making at Least ONE Trip Via Each Mode
Tenure with group quarters Respondent's Household Type Annual Household
Income Percent of households with
children under 16
Travel Mode Own Rent Group
quarters Detached
units Attached
units Group
quarters Under
$50,000 $50,000+ No children Have children
Single-Occupancy Vehicle 84.3% 65.1% 50.0% 82.7% 65.2% 50.0% 68.5% 81.9% 74.9% 80.2%
Multiple-Occupancy Vehicle 44.4% 19.6% 16.7% 42.8% 19.0% 16.7% 24.9% 42.3% 21.8% 78.7%
Bus (Transit) 0.3% 11.9% .0% 1.4% 11.1% 0.0% 10.6% .3% 5.5% 3.3%
School Bus 0.0% 0.0% 16.7% 0.0% 0.0% 16.7% 0.0% 0.0% 0.0% 0.0%
Bicycle 7.1% 13.5% 0.0% 7.6% 13.1% 0.0% 12.0% 8.2% 9.7% 9.0%
Foot 20.0% 32.2% 50.0% 18.2% 36.0% 50.0% 29.2% 19.6% 26.4% 19.3%
Note: Numbers in each cell represent the proportion of respondents who made at least ONE trip by that mode.
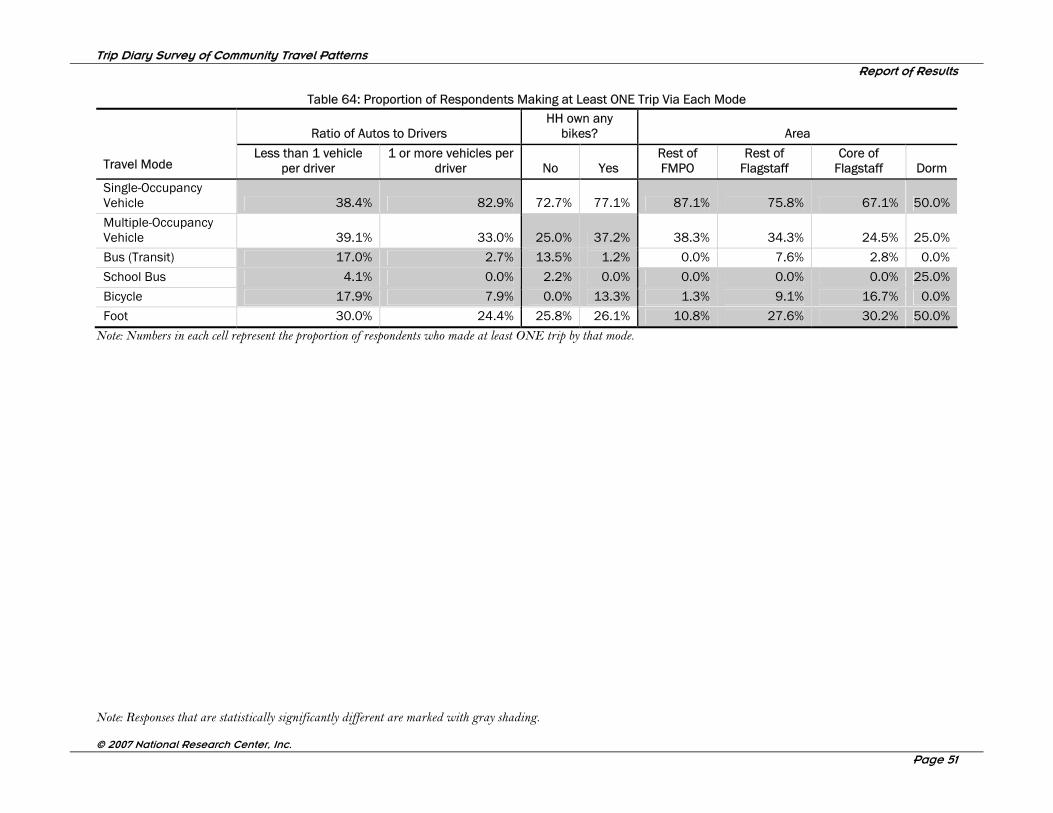
Trip Diary Survey of Community Travel Patterns Report of Results
Note: Responses that are statistically significantly different are marked with gray shading. © 2007 National Research Center, Inc.
Page 51
Table 64: Proportion of Respondents Making at Least ONE Trip Via Each Mode
Ratio of Autos to Drivers HH own any
bikes? Area
Travel Mode Less than 1 vehicle
per driver 1 or more vehicles per
driver No Yes Rest of FMPO
Rest of Flagstaff
Core of Flagstaff Dorm
Single-Occupancy Vehicle 38.4% 82.9% 72.7% 77.1% 87.1% 75.8% 67.1% 50.0%
Multiple-Occupancy Vehicle 39.1% 33.0% 25.0% 37.2% 38.3% 34.3% 24.5% 25.0%
Bus (Transit) 17.0% 2.7% 13.5% 1.2% 0.0% 7.6% 2.8% 0.0%
School Bus 4.1% 0.0% 2.2% 0.0% 0.0% 0.0% 0.0% 25.0%
Bicycle 17.9% 7.9% 0.0% 13.3% 1.3% 9.1% 16.7% 0.0%
Foot 30.0% 24.4% 25.8% 26.1% 10.8% 27.6% 30.2% 50.0%
Note: Numbers in each cell represent the proportion of respondents who made at least ONE trip by that mode.
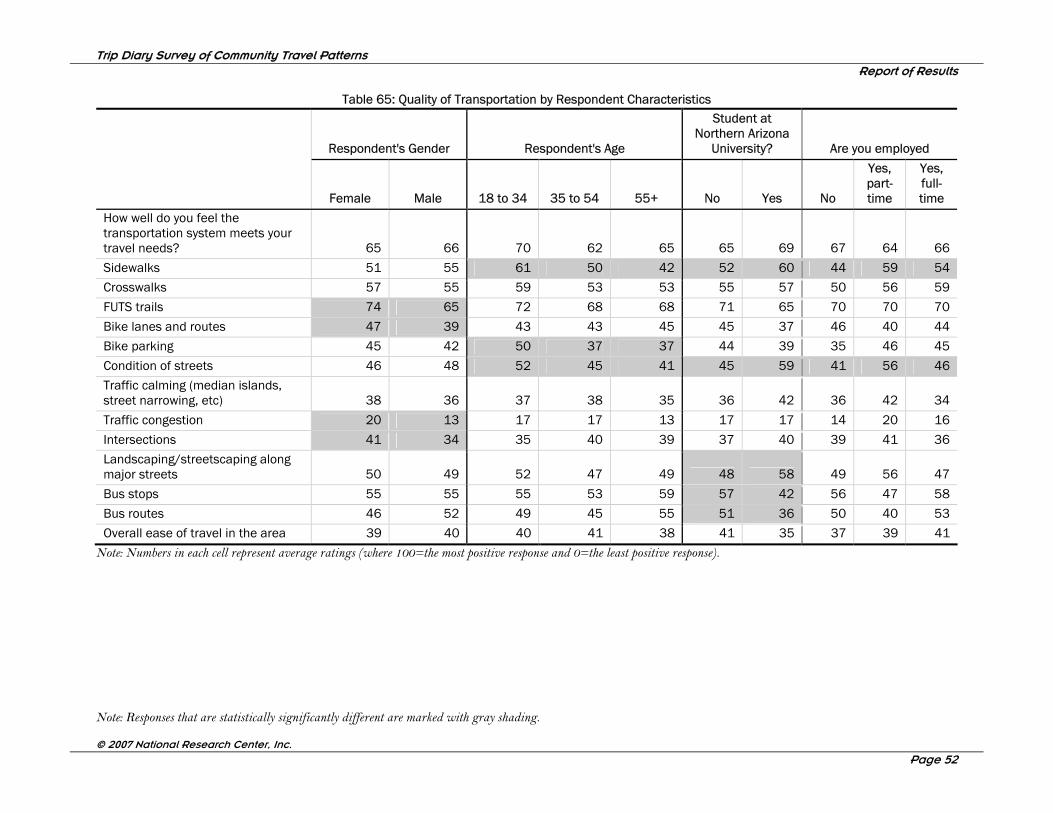
Trip Diary Survey of Community Travel Patterns Report of Results
Note: Responses that are statistically significantly different are marked with gray shading. © 2007 National Research Center, Inc.
Page 52
Table 65: Quality of Transportation by Respondent Characteristics
Respondent's Gender Respondent's Age
Student at Northern Arizona
University? Are you employed
Female Male 18 to 34 35 to 54 55+ No Yes No
Yes, part-time
Yes, full-time
How well do you feel the transportation system meets your travel needs? 65 66 70 62 65 65 69 67 64 66
Sidewalks 51 55 61 50 42 52 60 44 59 54
Crosswalks 57 55 59 53 53 55 57 50 56 59
FUTS trails 74 65 72 68 68 71 65 70 70 70
Bike lanes and routes 47 39 43 43 45 45 37 46 40 44
Bike parking 45 42 50 37 37 44 39 35 46 45
Condition of streets 46 48 52 45 41 45 59 41 56 46
Traffic calming (median islands, street narrowing, etc) 38 36 37 38 35 36 42 36 42 34
Traffic congestion 20 13 17 17 13 17 17 14 20 16
Intersections 41 34 35 40 39 37 40 39 41 36
Landscaping/streetscaping along major streets 50 49 52 47 49 48 58 49 56 47
Bus stops 55 55 55 53 59 57 42 56 47 58
Bus routes 46 52 49 45 55 51 36 50 40 53
Overall ease of travel in the area 39 40 40 41 38 41 35 37 39 41
Note: Numbers in each cell represent average ratings (where 100=the most positive response and 0=the least positive response).
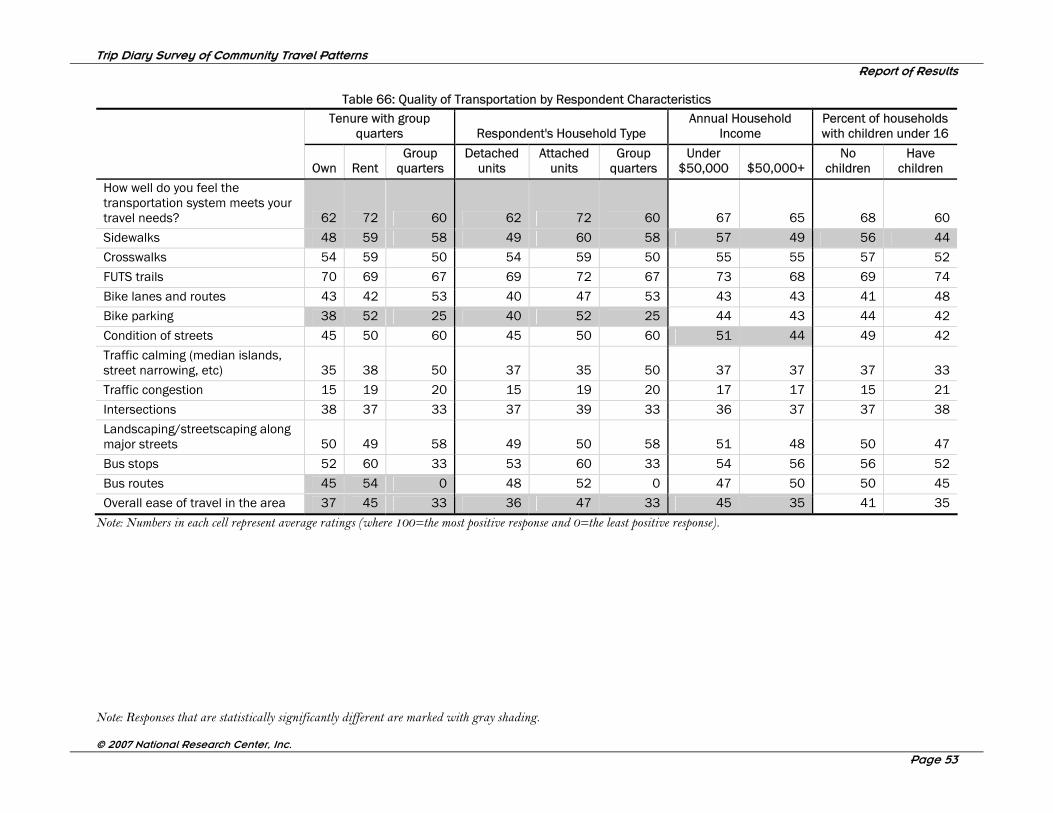
Trip Diary Survey of Community Travel Patterns Report of Results
Note: Responses that are statistically significantly different are marked with gray shading. © 2007 National Research Center, Inc.
Page 53
Table 66: Quality of Transportation by Respondent Characteristics Tenure with group
quarters Respondent's Household Type Annual Household
Income Percent of households with children under 16
Own Rent
Group quarters
Detached units
Attached units
Group quarters
Under $50,000 $50,000+
No children
Have children
How well do you feel the transportation system meets your travel needs? 62 72 60 62 72 60 67 65 68 60
Sidewalks 48 59 58 49 60 58 57 49 56 44
Crosswalks 54 59 50 54 59 50 55 55 57 52
FUTS trails 70 69 67 69 72 67 73 68 69 74
Bike lanes and routes 43 42 53 40 47 53 43 43 41 48
Bike parking 38 52 25 40 52 25 44 43 44 42
Condition of streets 45 50 60 45 50 60 51 44 49 42
Traffic calming (median islands, street narrowing, etc) 35 38 50 37 35 50 37 37 37 33
Traffic congestion 15 19 20 15 19 20 17 17 15 21
Intersections 38 37 33 37 39 33 36 37 37 38
Landscaping/streetscaping along major streets 50 49 58 49 50 58 51 48 50 47
Bus stops 52 60 33 53 60 33 54 56 56 52
Bus routes 45 54 0 48 52 0 47 50 50 45
Overall ease of travel in the area 37 45 33 36 47 33 45 35 41 35
Note: Numbers in each cell represent average ratings (where 100=the most positive response and 0=the least positive response).
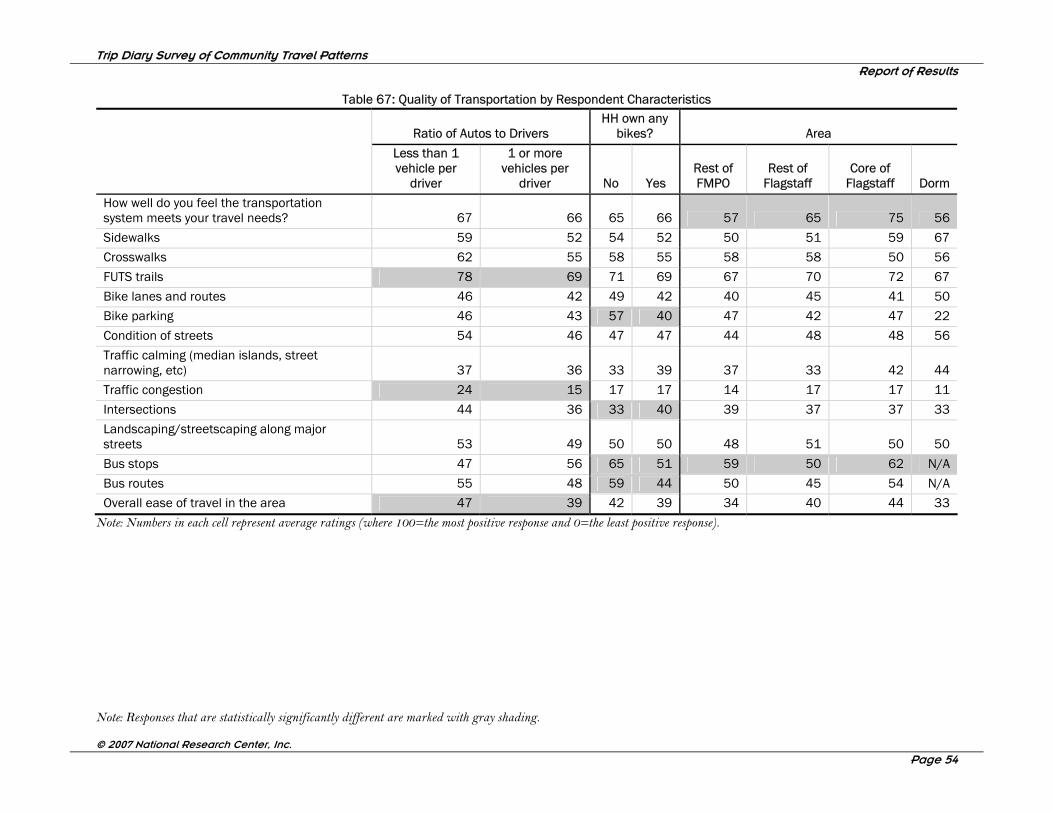
Trip Diary Survey of Community Travel Patterns Report of Results
Note: Responses that are statistically significantly different are marked with gray shading. © 2007 National Research Center, Inc.
Page 54
Table 67: Quality of Transportation by Respondent Characteristics
Ratio of Autos to Drivers HH own any
bikes? Area
Less than 1 vehicle per
driver
1 or more vehicles per
driver No Yes Rest of FMPO
Rest of Flagstaff
Core of Flagstaff Dorm
How well do you feel the transportation system meets your travel needs? 67 66 65 66 57 65 75 56
Sidewalks 59 52 54 52 50 51 59 67
Crosswalks 62 55 58 55 58 58 50 56
FUTS trails 78 69 71 69 67 70 72 67
Bike lanes and routes 46 42 49 42 40 45 41 50
Bike parking 46 43 57 40 47 42 47 22
Condition of streets 54 46 47 47 44 48 48 56
Traffic calming (median islands, street narrowing, etc) 37 36 33 39 37 33 42 44
Traffic congestion 24 15 17 17 14 17 17 11
Intersections 44 36 33 40 39 37 37 33
Landscaping/streetscaping along major streets 53 49 50 50 48 51 50 50
Bus stops 47 56 65 51 59 50 62 N/A
Bus routes 55 48 59 44 50 45 54 N/A
Overall ease of travel in the area 47 39 42 39 34 40 44 33
Note: Numbers in each cell represent average ratings (where 100=the most positive response and 0=the least positive response).
Trip Diary Survey of Community Travel Patterns Report of Results
© 2007 National Research Center, Inc.
Page 55
APPENDIX C: STUDY METHODS Study Design
Sample Selection
Approximately 2,100 households within the boundaries of the Flagstaff Metropolitan Planning Organization area were selected to participate in the survey using a stratified, systematic sampling method on addresses within carrier routes. (Systematic sampling is a method that closely approximates random sampling by selecting every Nth address until the desired number of households are chosen. Carrier routes are mail carrier delivery zones defined by the USPS.) Attached housing units (e.g., apartment, condominiums) were over-sampled to compensate for detached housing unit residents’ tendency to return surveys at a higher rate. An individual within each household was randomly selected to complete the survey using the birthday method. (The birthday method selects a person within the household by asking the “person whose birthday has most recently passed” to complete the questionnaire. The underlying assumption in this method is that day of birth has no relationship to the way people respond to surveys.)
An additional 300 students were selected from student group quarters, that is, the dorms at the Northern Arizona University.
Recruitment
Selected households were mailed a pre-notification postcard informing them they had been randomly selected to participate in the Travel Diary Study, while the selected students in University group quarters were sent an e-mail prenotification. One week after their pre-notification, the full travel study packets were sent to all those selected for the study. Additionally, a reminder postcard was sent to residents one week after the travel study packets were sent.
The Travel Diaries
The diary materials (see Appendix D: Survey Materials) were mailed to the participants in households a week in advance, describing the study, explaining the materials and assigning a travel day. The subjects were instructed to call the research staff if they had any questions or problems. Assigned travel days came from the week of October 2-6, 2006 (Monday through Friday). If a respondent was unable to complete the diary on their assigned day (e.g., they would be out of town) they were instructed to complete the diary exactly one week from their originally assigned day.
Response Rates
Nearly 9% of the trip diary surveys mailed to households (~184) were estimated to be undeliverable because the housing unit was vacant or the postal service was unable to deliver the survey as addressed. Of the 2,216 eligible households and dormitory students, 320 completed the survey, providing a response rate of 14%.
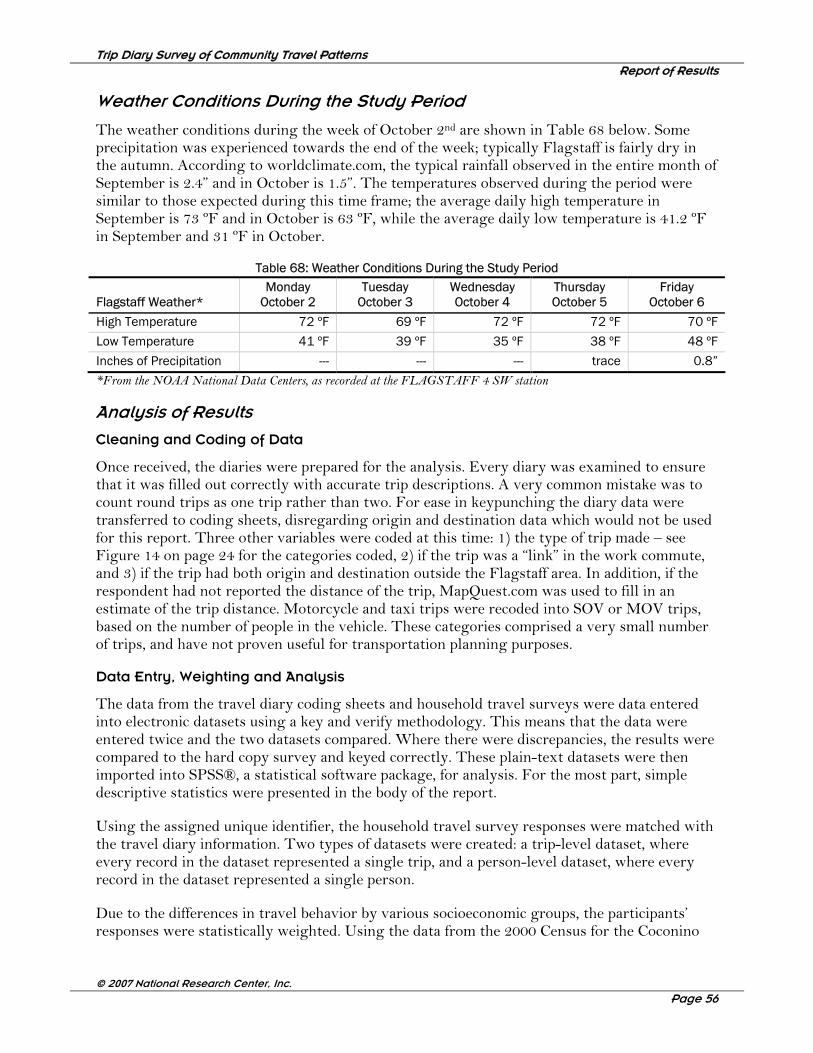
Trip Diary Survey of Community Travel Patterns Report of Results
© 2007 National Research Center, Inc.
Page 56
Weather Conditions During the Study Period
The weather conditions during the week of October 2nd are shown in Table 68 below. Some precipitation was experienced towards the end of the week; typically Flagstaff is fairly dry in the autumn. According to worldclimate.com, the typical rainfall observed in the entire month of September is 2.4” and in October is 1.5”. The temperatures observed during the period were similar to those expected during this time frame; the average daily high temperature in September is 73 ºF and in October is 63 ºF, while the average daily low temperature is 41.2 ºF in September and 31 ºF in October.
Table 68: Weather Conditions During the Study Period
Flagstaff Weather* Monday
October 2 Tuesday
October 3 Wednesday October 4
Thursday October 5
Friday October 6
High Temperature 72 ºF 69 ºF 72 ºF 72 ºF 70 ºF
Low Temperature 41 ºF 39 ºF 35 ºF 38 ºF 48 ºF
Inches of Precipitation --- --- --- trace 0.8” *From the NOAA National Data Centers, as recorded at the FLAGSTAFF 4 SW station Analysis of Results
Cleaning and Coding of Data
Once received, the diaries were prepared for the analysis. Every diary was examined to ensure that it was filled out correctly with accurate trip descriptions. A very common mistake was to count round trips as one trip rather than two. For ease in keypunching the diary data were transferred to coding sheets, disregarding origin and destination data which would not be used for this report. Three other variables were coded at this time: 1) the type of trip made – see Figure 14 on page 24 for the categories coded, 2) if the trip was a “link” in the work commute, and 3) if the trip had both origin and destination outside the Flagstaff area. In addition, if the respondent had not reported the distance of the trip, MapQuest.com was used to fill in an estimate of the trip distance. Motorcycle and taxi trips were recoded into SOV or MOV trips, based on the number of people in the vehicle. These categories comprised a very small number of trips, and have not proven useful for transportation planning purposes.
Data Entry, Weighting and Analysis
The data from the travel diary coding sheets and household travel surveys were data entered into electronic datasets using a key and verify methodology. This means that the data were entered twice and the two datasets compared. Where there were discrepancies, the results were compared to the hard copy survey and keyed correctly. These plain-text datasets were then imported into SPSS®, a statistical software package, for analysis. For the most part, simple descriptive statistics were presented in the body of the report.
Using the assigned unique identifier, the household travel survey responses were matched with the travel diary information. Two types of datasets were created: a trip-level dataset, where every record in the dataset represented a single trip, and a person-level dataset, where every record in the dataset represented a single person.
Due to the differences in travel behavior by various socioeconomic groups, the participants’ responses were statistically weighted. Using the data from the 2000 Census for the Coconino
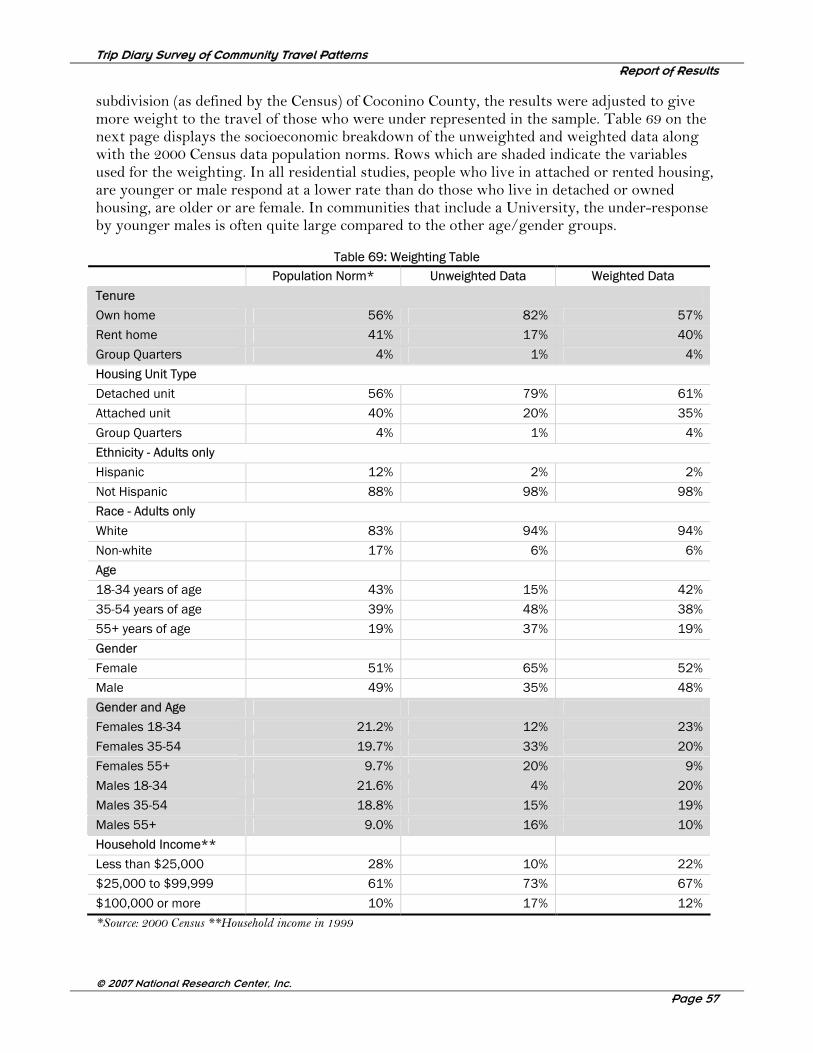
Trip Diary Survey of Community Travel Patterns Report of Results
© 2007 National Research Center, Inc.
Page 57
subdivision (as defined by the Census) of Coconino County, the results were adjusted to give more weight to the travel of those who were under represented in the sample. Table 69 on the next page displays the socioeconomic breakdown of the unweighted and weighted data along with the 2000 Census data population norms. Rows which are shaded indicate the variables used for the weighting. In all residential studies, people who live in attached or rented housing, are younger or male respond at a lower rate than do those who live in detached or owned housing, are older or are female. In communities that include a University, the under-response by younger males is often quite large compared to the other age/gender groups.
Table 69: Weighting Table Population Norm* Unweighted Data Weighted Data
Tenure
Own home 56% 82% 57%
Rent home 41% 17% 40%
Group Quarters 4% 1% 4%
Housing Unit Type
Detached unit 56% 79% 61%
Attached unit 40% 20% 35%
Group Quarters 4% 1% 4%
Ethnicity - Adults only
Hispanic 12% 2% 2%
Not Hispanic 88% 98% 98%
Race - Adults only
White 83% 94% 94%
Non-white 17% 6% 6%
Age
18-34 years of age 43% 15% 42%
35-54 years of age 39% 48% 38%
55+ years of age 19% 37% 19%
Gender
Female 51% 65% 52%
Male 49% 35% 48%
Gender and Age
Females 18-34 21.2% 12% 23%
Females 35-54 19.7% 33% 20%
Females 55+ 9.7% 20% 9%
Males 18-34 21.6% 4% 20%
Males 35-54 18.8% 15% 19%
Males 55+ 9.0% 16% 10%
Household Income**
Less than $25,000 28% 10% 22%
$25,000 to $99,999 61% 73% 67%
$100,000 or more 10% 17% 12%
*Source: 2000 Census **Household income in 1999
Trip Diary Survey of Community Travel Patterns Report of Results
© 2007 National Research Center, Inc.
Page 58
APPENDIX D: SURVEY MATERIALS This Appendix contains the instruments and materials used for the data collection of the 2006 Trip Diary Study. Included are:
Pre-notification postcard
Diary packet cover letter to Flagstaff area residents
Diary packet cover letter to group quarters University students
Travel Diary instructions
Travel Diary card
Travel Diary Overflow sheet
Household Survey
Reminder postcard

Dear Flagstaff or Flagstaff-Area Resident, Travel is something we all do and can be frustrating at times. We are inviting a member of your household to be part of a small group of residents who will keep a simple travel log for a single day during the week of October 2, 2006. Basically, the log will show how you get where you’re going and how long it takes you to get there. This will help the City of Flagstaff and Coconino County better understand existing travel patterns and work to improve your travel experience. Your household was chosen at random and your participation will be completely confidential. We are only mailing travel logs to a small number of Flagstaff area residents, so your participation is extremely important. The results will be used in transportation planning to improve our community. Your travel log will arrive on or before the week of October 2, at which time you’ll receive your assigned log day. Many thanks in advance for your help. Sincerely, Matt Ryan Joseph "Joe" C. Donaldson Chairman, Mayor, Coconino Board of Supervisors City of Flagstaff
Dear Flagstaff or Flagstaff-Area Resident, Travel is something we all do and can be frustrating at times. We are inviting a member of your household to be part of a small group of residents who will keep a simple travel log for a single day during the week of October 2, 2006. Basically, the log will show how you get where you’re going and how long it takes you to get there. This will help the City of Flagstaff and Coconino County better understand existing travel patterns and work to improve your travel experience. Your household was chosen at random and your participation will be completely confidential. We are only mailing travel logs to a small number of Flagstaff area residents, so your participation is extremely important. The results will be used in transportation planning to improve our community. Your travel log will arrive on or before the week of October 2, at which time you’ll receive your assigned log day. Many thanks in advance for your help. Sincerely, Matt Ryan Joseph "Joe" C. Donaldson Chairman, Mayor, Coconino Board of Supervisors City of Flagstaff
Dear Flagstaff or Flagstaff-Area Resident, Travel is something we all do and can be frustrating at times. We are inviting a member of your household to be part of a small group of residents who will keep a simple travel log for a single day during the week of October 2, 2006. Basically, the log will show how you get where you’re going and how long it takes you to get there. This will help the City of Flagstaff and Coconino County better understand existing travel patterns and work to improve your travel experience. Your household was chosen at random and your participation will be completely confidential. We are only mailing travel logs to a small number of Flagstaff area residents, so your participation is extremely important. The results will be used in transportation planning to improve our community. Your travel log will arrive on or before the week of October 2, at which time you’ll receive your assigned log day. Many thanks in advance for your help. Sincerely, Matt Ryan Joseph "Joe" C. Donaldson Chairman, Mayor, Coconino Board of Supervisors City of Flagstaff
Dear Flagstaff or Flagstaff-Area Resident, Travel is something we all do and can be frustrating at times. We are inviting a member of your household to be part of a small group of residents who will keep a simple travel log for a single day during the week of October 2, 2006. Basically, the log will show how you get where you’re going and how long it takes you to get there. This will help the City of Flagstaff and Coconino County better understand existing travel patterns and work to improve your travel experience. Your household was chosen at random and your participation will be completely confidential. We are only mailing travel logs to a small number of Flagstaff area residents, so your participation is extremely important. The results will be used in transportation planning to improve our community. Your travel log will arrive on or before the week of October 2, at which time you’ll receive your assigned log day. Many thanks in advance for your help. Sincerely, Matt Ryan Joseph "Joe" C. Donaldson Chairman, Mayor, Coconino Board of Supervisors City of Flagstaff
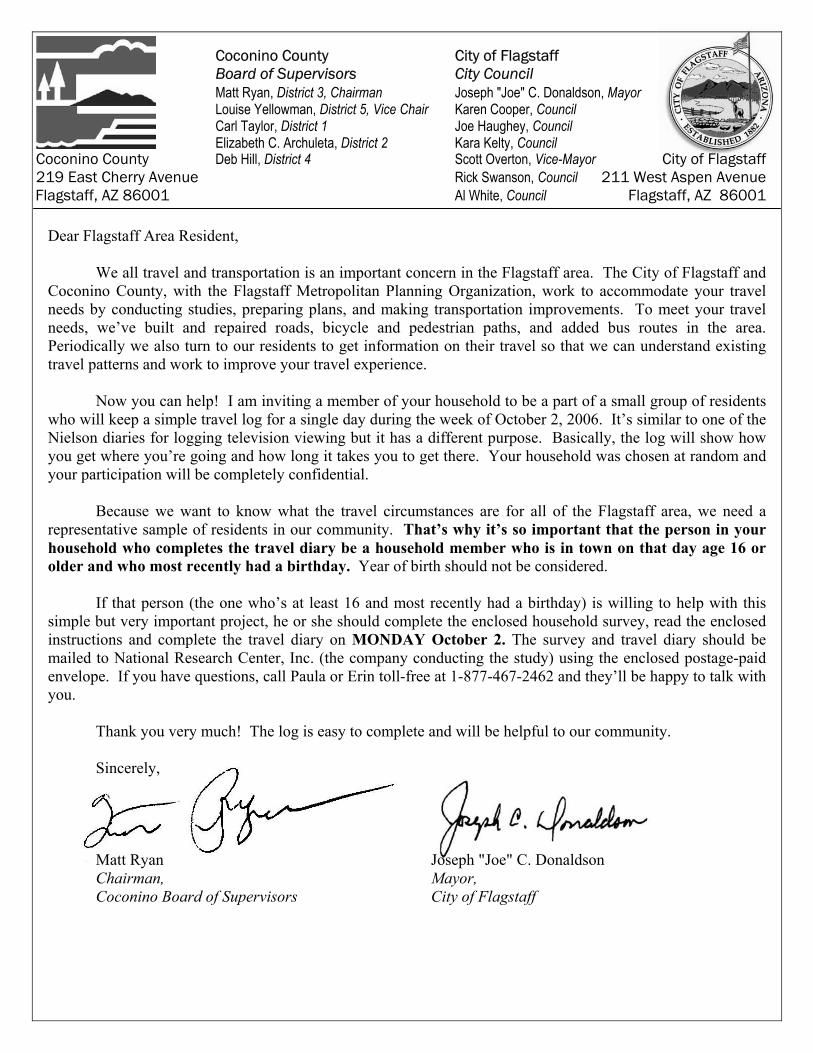
Coconino County City of Flagstaff Board of Supervisors City Council Matt Ryan, District 3, Chairman Joseph "Joe" C. Donaldson, Mayor Louise Yellowman, District 5, Vice Chair Karen Cooper, Council Carl Taylor, District 1 Joe Haughey, Council Elizabeth C. Archuleta, District 2 Kara Kelty, Council Coconino County Deb Hill, District 4 Scott Overton, Vice-Mayor City of Flagstaff 219 East Cherry Avenue Rick Swanson, Council 211 West Aspen Avenue Flagstaff, AZ 86001 Al White, Council Flagstaff, AZ 86001
Dear Flagstaff Area Resident, We all travel and transportation is an important concern in the Flagstaff area. The City of Flagstaff and Coconino County, with the Flagstaff Metropolitan Planning Organization, work to accommodate your travel needs by conducting studies, preparing plans, and making transportation improvements. To meet your travel needs, we’ve built and repaired roads, bicycle and pedestrian paths, and added bus routes in the area. Periodically we also turn to our residents to get information on their travel so that we can understand existing travel patterns and work to improve your travel experience. Now you can help! I am inviting a member of your household to be a part of a small group of residents who will keep a simple travel log for a single day during the week of October 2, 2006. It’s similar to one of the Nielson diaries for logging television viewing but it has a different purpose. Basically, the log will show how you get where you’re going and how long it takes you to get there. Your household was chosen at random and your participation will be completely confidential. Because we want to know what the travel circumstances are for all of the Flagstaff area, we need a representative sample of residents in our community. That’s why it’s so important that the person in your household who completes the travel diary be a household member who is in town on that day age 16 or older and who most recently had a birthday. Year of birth should not be considered. If that person (the one who’s at least 16 and most recently had a birthday) is willing to help with this simple but very important project, he or she should complete the enclosed household survey, read the enclosed instructions and complete the travel diary on MONDAY October 2. The survey and travel diary should be mailed to National Research Center, Inc. (the company conducting the study) using the enclosed postage-paid envelope. If you have questions, call Paula or Erin toll-free at 1-877-467-2462 and they’ll be happy to talk with you. Thank you very much! The log is easy to complete and will be helpful to our community.
Sincerely,
Matt Ryan Joseph "Joe" C. Donaldson Chairman, Mayor, Coconino Board of Supervisors City of Flagstaff
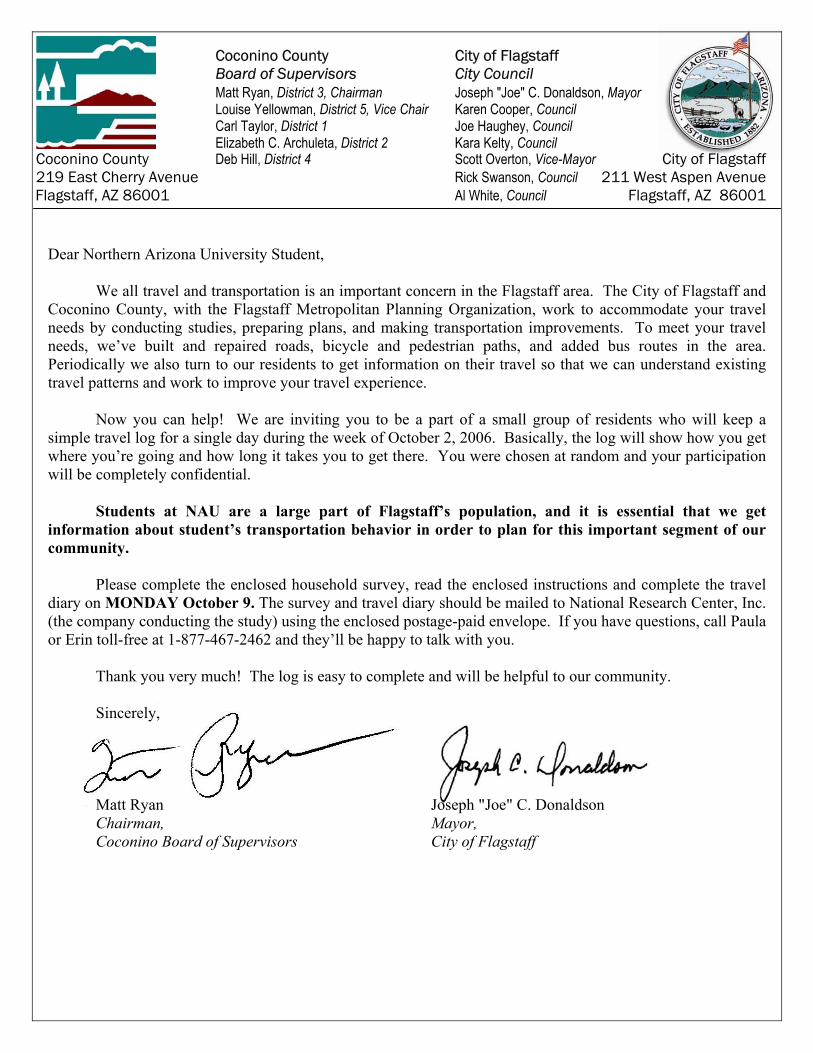
Coconino County City of Flagstaff Board of Supervisors City Council Matt Ryan, District 3, Chairman Joseph "Joe" C. Donaldson, Mayor Louise Yellowman, District 5, Vice Chair Karen Cooper, Council Carl Taylor, District 1 Joe Haughey, Council Elizabeth C. Archuleta, District 2 Kara Kelty, Council Coconino County Deb Hill, District 4 Scott Overton, Vice-Mayor City of Flagstaff 219 East Cherry Avenue Rick Swanson, Council 211 West Aspen Avenue Flagstaff, AZ 86001 Al White, Council Flagstaff, AZ 86001
Dear Northern Arizona University Student, We all travel and transportation is an important concern in the Flagstaff area. The City of Flagstaff and Coconino County, with the Flagstaff Metropolitan Planning Organization, work to accommodate your travel needs by conducting studies, preparing plans, and making transportation improvements. To meet your travel needs, we’ve built and repaired roads, bicycle and pedestrian paths, and added bus routes in the area. Periodically we also turn to our residents to get information on their travel so that we can understand existing travel patterns and work to improve your travel experience. Now you can help! We are inviting you to be a part of a small group of residents who will keep a simple travel log for a single day during the week of October 2, 2006. Basically, the log will show how you get where you’re going and how long it takes you to get there. You were chosen at random and your participation will be completely confidential. Students at NAU are a large part of Flagstaff’s population, and it is essential that we get information about student’s transportation behavior in order to plan for this important segment of our community. Please complete the enclosed household survey, read the enclosed instructions and complete the travel diary on MONDAY October 9. The survey and travel diary should be mailed to National Research Center, Inc. (the company conducting the study) using the enclosed postage-paid envelope. If you have questions, call Paula or Erin toll-free at 1-877-467-2462 and they’ll be happy to talk with you. Thank you very much! The log is easy to complete and will be helpful to our community.
Sincerely,
Matt Ryan Joseph "Joe" C. Donaldson Chairman, Mayor, Coconino Board of Supervisors City of Flagstaff
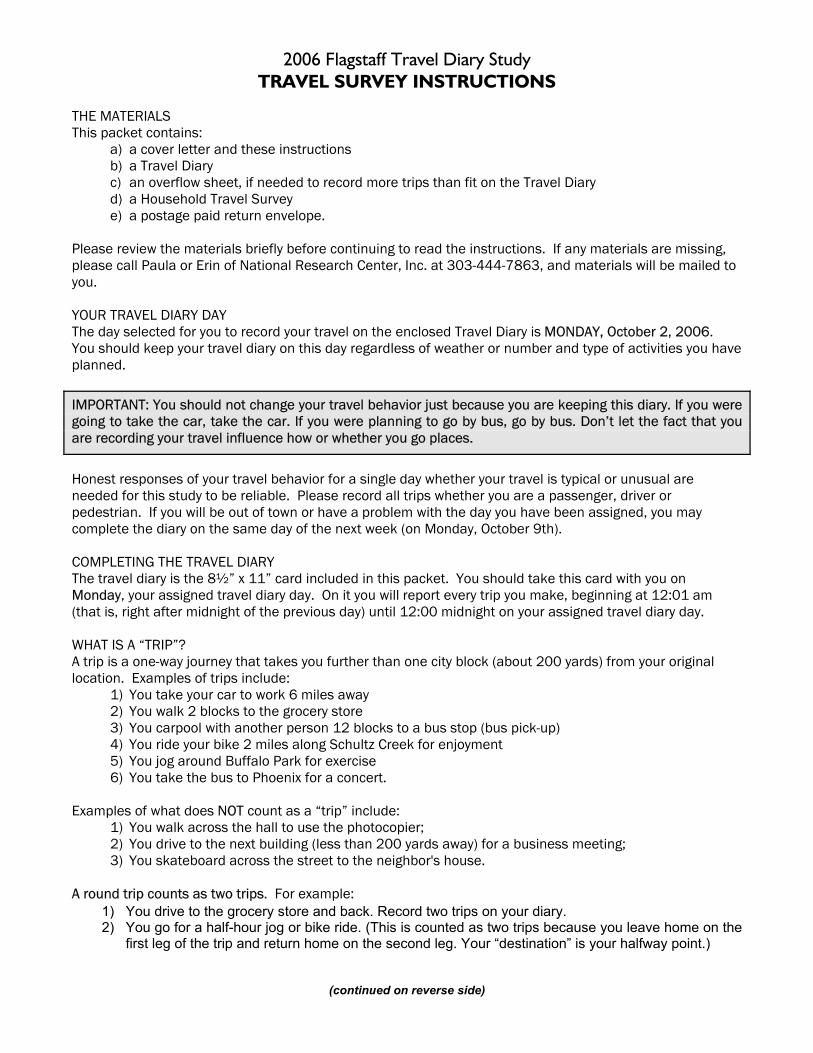
2006 Flagstaff Travel Diary Study TRAVEL SURVEY INSTRUCTIONS
THE MATERIALS This packet contains:
a) a cover letter and these instructions b) a Travel Diary c) an overflow sheet, if needed to record more trips than fit on the Travel Diary d) a Household Travel Survey e) a postage paid return envelope.
Please review the materials briefly before continuing to read the instructions. If any materials are missing, please call Paula or Erin of National Research Center, Inc. at 303-444-7863, and materials will be mailed to you. YOUR TRAVEL DIARY DAY The day selected for you to record your travel on the enclosed Travel Diary is MONDAY, October 2, 2006. You should keep your travel diary on this day regardless of weather or number and type of activities you have planned.
IMPORTANT: You should not change your travel behavior just because you are keeping this diary. If you were going to take the car, take the car. If you were planning to go by bus, go by bus. Don’t let the fact that you are recording your travel influence how or whether you go places.
Honest responses of your travel behavior for a single day whether your travel is typical or unusual are needed for this study to be reliable. Please record all trips whether you are a passenger, driver or pedestrian. If you will be out of town or have a problem with the day you have been assigned, you may complete the diary on the same day of the next week (on Monday, October 9th). COMPLETING THE TRAVEL DIARY The travel diary is the 8½” x 11” card included in this packet. You should take this card with you on Monday, your assigned travel diary day. On it you will report every trip you make, beginning at 12:01 am (that is, right after midnight of the previous day) until 12:00 midnight on your assigned travel diary day. WHAT IS A “TRIP”? A trip is a one-way journey that takes you further than one city block (about 200 yards) from your original location. Examples of trips include:
1) You take your car to work 6 miles away 2) You walk 2 blocks to the grocery store 3) You carpool with another person 12 blocks to a bus stop (bus pick-up) 4) You ride your bike 2 miles along Schultz Creek for enjoyment 5) You jog around Buffalo Park for exercise 6) You take the bus to Phoenix for a concert.
Examples of what does NOT count as a “trip” include:
1) You walk across the hall to use the photocopier; 2) You drive to the next building (less than 200 yards away) for a business meeting; 3) You skateboard across the street to the neighbor's house.
A round trip counts as two trips. For example:
1) You drive to the grocery store and back. Record two trips on your diary. 2) You go for a half-hour jog or bike ride. (This is counted as two trips because you leave home on the
first leg of the trip and return home on the second leg. Your “destination” is your halfway point.)
(continued on reverse side)
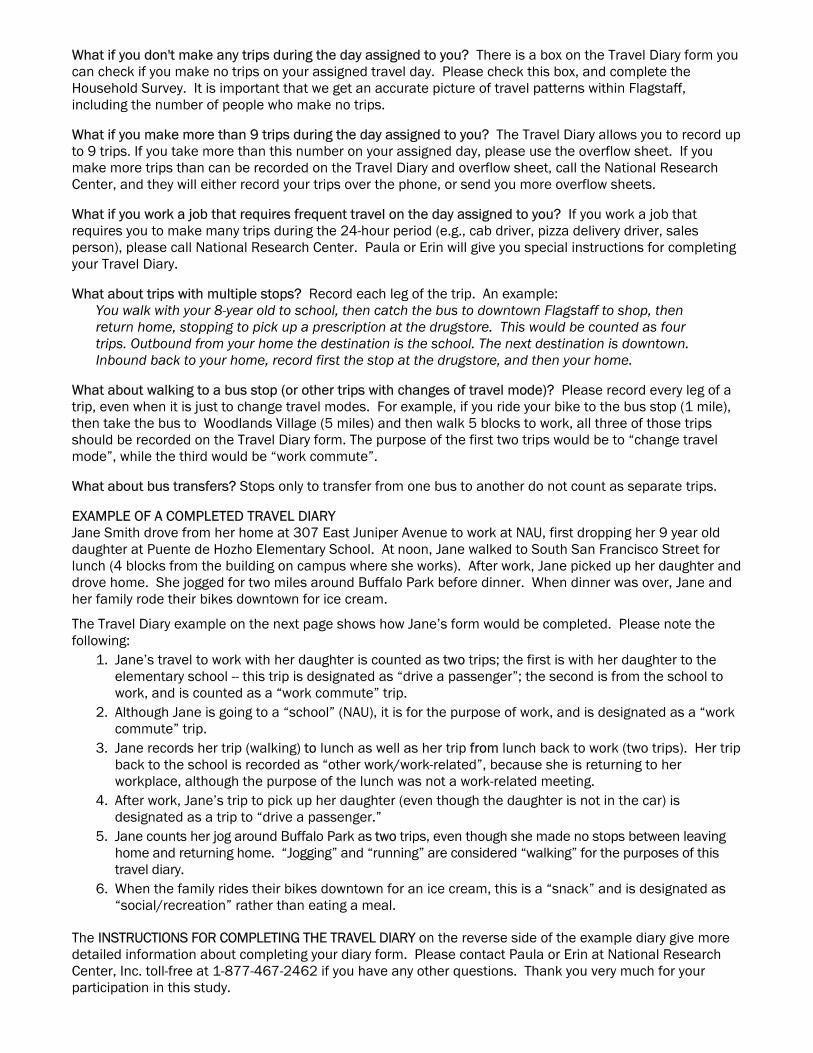
What if you don't make any trips during the day assigned to you? There is a box on the Travel Diary form you can check if you make no trips on your assigned travel day. Please check this box, and complete the Household Survey. It is important that we get an accurate picture of travel patterns within Flagstaff, including the number of people who make no trips. What if you make more than 9 trips during the day assigned to you? The Travel Diary allows you to record up to 9 trips. If you take more than this number on your assigned day, please use the overflow sheet. If you make more trips than can be recorded on the Travel Diary and overflow sheet, call the National Research Center, and they will either record your trips over the phone, or send you more overflow sheets. What if you work a job that requires frequent travel on the day assigned to you? If you work a job that requires you to make many trips during the 24-hour period (e.g., cab driver, pizza delivery driver, sales person), please call National Research Center. Paula or Erin will give you special instructions for completing your Travel Diary. What about trips with multiple stops? Record each leg of the trip. An example:
You walk with your 8-year old to school, then catch the bus to downtown Flagstaff to shop, then return home, stopping to pick up a prescription at the drugstore. This would be counted as four trips. Outbound from your home the destination is the school. The next destination is downtown. Inbound back to your home, record first the stop at the drugstore, and then your home.
What about walking to a bus stop (or other trips with changes of travel mode)? Please record every leg of a trip, even when it is just to change travel modes. For example, if you ride your bike to the bus stop (1 mile), then take the bus to Woodlands Village (5 miles) and then walk 5 blocks to work, all three of those trips should be recorded on the Travel Diary form. The purpose of the first two trips would be to “change travel mode”, while the third would be “work commute”. What about bus transfers? Stops only to transfer from one bus to another do not count as separate trips. EXAMPLE OF A COMPLETED TRAVEL DIARY Jane Smith drove from her home at 307 East Juniper Avenue to work at NAU, first dropping her 9 year old daughter at Puente de Hozho Elementary School. At noon, Jane walked to South San Francisco Street for lunch (4 blocks from the building on campus where she works). After work, Jane picked up her daughter and drove home. She jogged for two miles around Buffalo Park before dinner. When dinner was over, Jane and her family rode their bikes downtown for ice cream. The Travel Diary example on the next page shows how Jane’s form would be completed. Please note the following:
1. Jane’s travel to work with her daughter is counted as two trips; the first is with her daughter to the elementary school -- this trip is designated as “drive a passenger”; the second is from the school to work, and is counted as a “work commute” trip.
2. Although Jane is going to a “school” (NAU), it is for the purpose of work, and is designated as a “work commute” trip.
3. Jane records her trip (walking) to lunch as well as her trip from lunch back to work (two trips). Her trip back to the school is recorded as “other work/work-related”, because she is returning to her workplace, although the purpose of the lunch was not a work-related meeting.
4. After work, Jane’s trip to pick up her daughter (even though the daughter is not in the car) is designated as a trip to “drive a passenger.”
5. Jane counts her jog around Buffalo Park as two trips, even though she made no stops between leaving home and returning home. “Jogging” and “running” are considered “walking” for the purposes of this travel diary.
6. When the family rides their bikes downtown for an ice cream, this is a “snack” and is designated as “social/recreation” rather than eating a meal.
The INSTRUCTIONS FOR COMPLETING THE TRAVEL DIARY on the reverse side of the example diary give more detailed information about completing your diary form. Please contact Paula or Erin at National Research Center, Inc. toll-free at 1-877-467-2462 if you have any other questions. Thank you very much for your participation in this study.
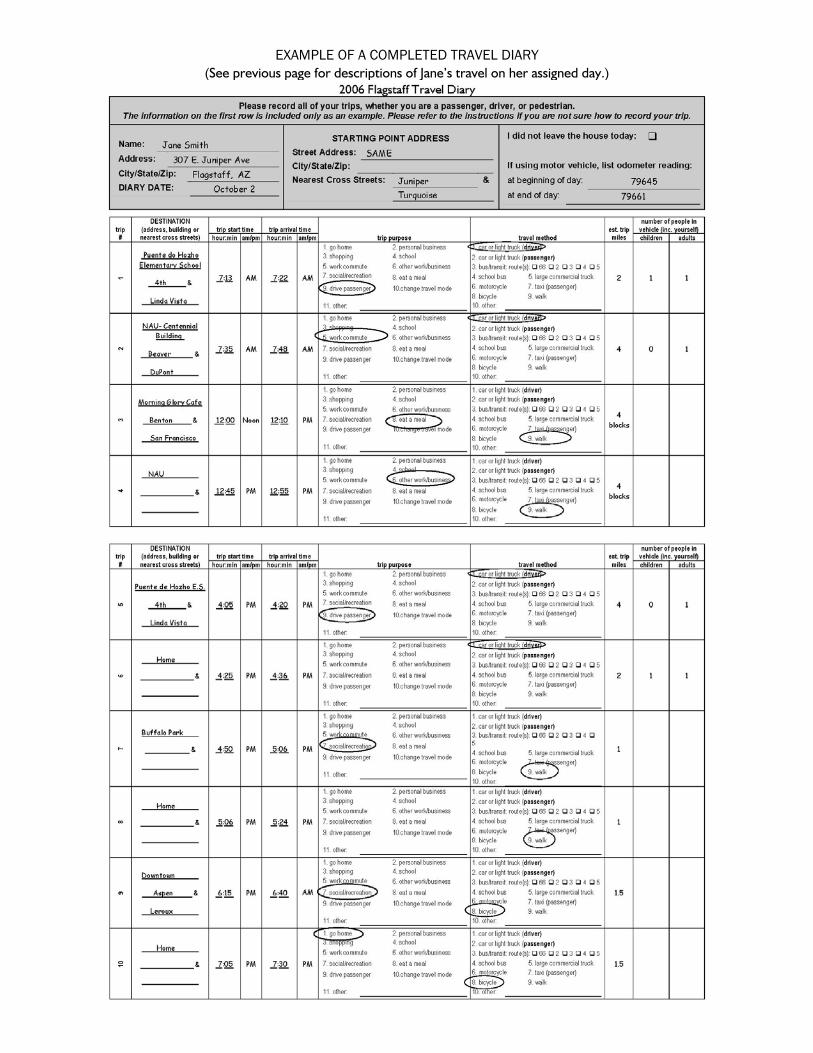
EXAMPLE OF A COMPLETED TRAVEL DIARY (See previous page for descriptions of Jane’s travel on her assigned day.)
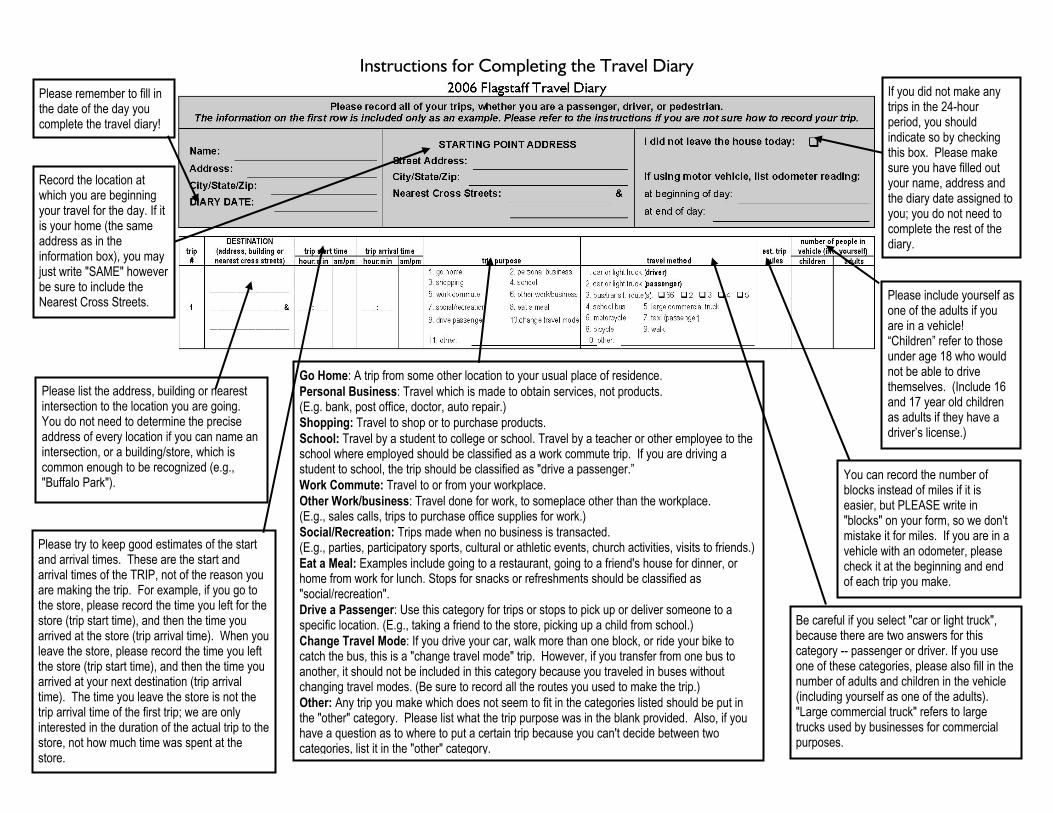
Instructions for Completing the Travel Diary Please remember to fill in
the date of the day you complete the travel diary!
Record the location at which you are beginning your travel for the day. If it is your home (the same address as in the information box), you may just write "SAME" however be sure to include the Nearest Cross Streets.
Please list the address, building or nearest intersection to the location you are going. You do not need to determine the precise address of every location if you can name an intersection, or a building/store, which is common enough to be recognized (e.g., "Buffalo Park").
Please try to keep good estimates of the start and arrival times. These are the start and arrival times of the TRIP, not of the reason you are making the trip. For example, if you go to the store, please record the time you left for the store (trip start time), and then the time you arrived at the store (trip arrival time). When you leave the store, please record the time you left the store (trip start time), and then the time you arrived at your next destination (trip arrival time). The time you leave the store is not the trip arrival time of the first trip; we are only interested in the duration of the actual trip to the store, not how much time was spent at the store.
Go Home: A trip from some other location to your usual place of residence. Personal Business: Travel which is made to obtain services, not products. (E.g. bank, post office, doctor, auto repair.) Shopping: Travel to shop or to purchase products. School: Travel by a student to college or school. Travel by a teacher or other employee to the school where employed should be classified as a work commute trip. If you are driving a student to school, the trip should be classified as "drive a passenger.” Work Commute: Travel to or from your workplace. Other Work/business: Travel done for work, to someplace other than the workplace. (E.g., sales calls, trips to purchase office supplies for work.) Social/Recreation: Trips made when no business is transacted. (E.g., parties, participatory sports, cultural or athletic events, church activities, visits to friends.) Eat a Meal: Examples include going to a restaurant, going to a friend's house for dinner, or home from work for lunch. Stops for snacks or refreshments should be classified as "social/recreation". Drive a Passenger: Use this category for trips or stops to pick up or deliver someone to a specific location. (E.g., taking a friend to the store, picking up a child from school.) Change Travel Mode: If you drive your car, walk more than one block, or ride your bike to catch the bus, this is a "change travel mode" trip. However, if you transfer from one bus to another, it should not be included in this category because you traveled in buses without changing travel modes. (Be sure to record all the routes you used to make the trip.) Other: Any trip you make which does not seem to fit in the categories listed should be put in the "other" category. Please list what the trip purpose was in the blank provided. Also, if you have a question as to where to put a certain trip because you can't decide between two categories, list it in the "other" category.
Be careful if you select "car or light truck", because there are two answers for this category -- passenger or driver. If you use one of these categories, please also fill in the number of adults and children in the vehicle (including yourself as one of the adults). "Large commercial truck" refers to large trucks used by businesses for commercial purposes.
You can record the number of blocks instead of miles if it is easier, but PLEASE write in "blocks" on your form, so we don't mistake it for miles. If you are in a vehicle with an odometer, please check it at the beginning and end of each trip you make.
Please include yourself as one of the adults if you are in a vehicle! “Children” refer to those under age 18 who would not be able to drive themselves. (Include 16 and 17 year old children as adults if they have a driver’s license.)
If you did not make any trips in the 24-hour period, you should indicate so by checking this box. Please make sure you have filled out your name, address and the diary date assigned to you; you do not need to complete the rest of the diary.
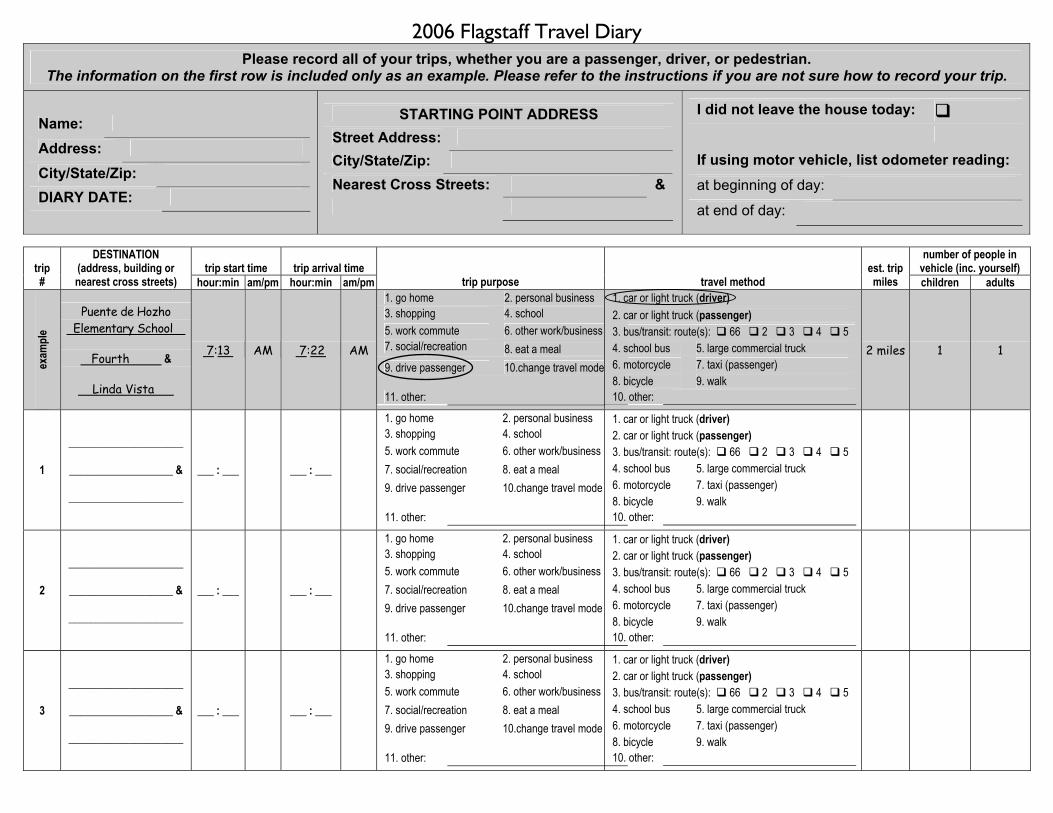
2006 Flagstaff Travel Diary Please record all of your trips, whether you are a passenger, driver, or pedestrian.
The information on the first row is included only as an example. Please refer to the instructions if you are not sure how to record your trip.
Name:
Address:
City/State/Zip: DIARY DATE:
STARTING POINT ADDRESS Street Address: City/State/Zip: Nearest Cross Streets: &
I did not leave the house today:
If using motor vehicle, list odometer reading: at beginning of day:
at end of day:
trip start time trip arrival time number of people in
vehicle (inc. yourself) trip #
DESTINATION (address, building or nearest cross streets) hour:min am/pm hour:min am/pm trip purpose travel method
est. trip miles children adults
exam
ple
Puente de Hozho Elementary School
Fourth &
Linda Vista
7:13 AM 7:22 AM
1. go home 2. personal business 3. shopping 4. school 5. work commute 6. other work/business 7. social/recreation 8. eat a meal 9. drive passenger 10.change travel mode
11. other:
1. car or light truck (driver) 2. car or light truck (passenger) 3. bus/transit: route(s): 66 2 3 4 5 4. school bus 5. large commercial truck 6. motorcycle 7. taxi (passenger) 8. bicycle 9. walk 10. other:
2 miles 1 1
1
_____________________
___________________ &
_____________________
___ : ___ ___ : ___
1. go home 2. personal business 3. shopping 4. school 5. work commute 6. other work/business 7. social/recreation 8. eat a meal 9. drive passenger 10.change travel mode
11. other:
1. car or light truck (driver) 2. car or light truck (passenger) 3. bus/transit: route(s): 66 2 3 4 5 4. school bus 5. large commercial truck 6. motorcycle 7. taxi (passenger) 8. bicycle 9. walk 10. other:
2
_____________________
___________________ &
_____________________
___ : ___ ___ : ___
1. go home 2. personal business 3. shopping 4. school 5. work commute 6. other work/business 7. social/recreation 8. eat a meal 9. drive passenger 10.change travel mode
11. other:
1. car or light truck (driver) 2. car or light truck (passenger) 3. bus/transit: route(s): 66 2 3 4 5 4. school bus 5. large commercial truck 6. motorcycle 7. taxi (passenger) 8. bicycle 9. walk 10. other:
3
_____________________
___________________ &
_____________________
___ : ___ ___ : ___
1. go home 2. personal business 3. shopping 4. school 5. work commute 6. other work/business 7. social/recreation 8. eat a meal 9. drive passenger 10.change travel mode
11. other:
1. car or light truck (driver) 2. car or light truck (passenger) 3. bus/transit: route(s): 66 2 3 4 5 4. school bus 5. large commercial truck 6. motorcycle 7. taxi (passenger) 8. bicycle 9. walk 10. other:
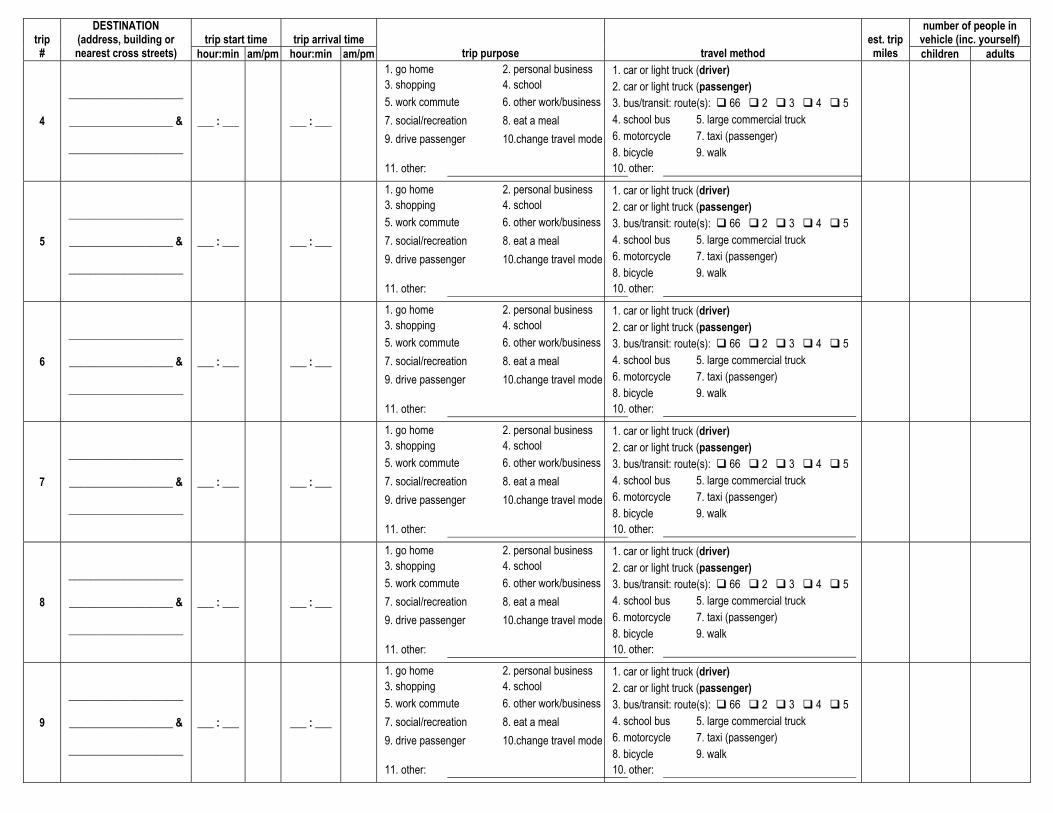
trip start time trip arrival time number of people in
vehicle (inc. yourself) trip #
DESTINATION (address, building or nearest cross streets) hour:min am/pm hour:min am/pm trip purpose travel method
est. trip miles children adults
4
_____________________
___________________ &
_____________________
___ : ___ ___ : ___
1. go home 2. personal business 3. shopping 4. school 5. work commute 6. other work/business 7. social/recreation 8. eat a meal 9. drive passenger 10.change travel mode
11. other:
1. car or light truck (driver) 2. car or light truck (passenger) 3. bus/transit: route(s): 66 2 3 4 5 4. school bus 5. large commercial truck 6. motorcycle 7. taxi (passenger) 8. bicycle 9. walk 10. other:
5
_____________________
___________________ &
_____________________
___ : ___ ___ : ___
1. go home 2. personal business 3. shopping 4. school 5. work commute 6. other work/business 7. social/recreation 8. eat a meal 9. drive passenger 10.change travel mode
11. other:
1. car or light truck (driver) 2. car or light truck (passenger) 3. bus/transit: route(s): 66 2 3 4 5 4. school bus 5. large commercial truck 6. motorcycle 7. taxi (passenger) 8. bicycle 9. walk 10. other:
6
_____________________
___________________ &
_____________________
___ : ___ ___ : ___
1. go home 2. personal business 3. shopping 4. school 5. work commute 6. other work/business 7. social/recreation 8. eat a meal 9. drive passenger 10.change travel mode
11. other:
1. car or light truck (driver) 2. car or light truck (passenger) 3. bus/transit: route(s): 66 2 3 4 5 4. school bus 5. large commercial truck 6. motorcycle 7. taxi (passenger) 8. bicycle 9. walk 10. other:
7
_____________________
___________________ &
_____________________
___ : ___ ___ : ___
1. go home 2. personal business 3. shopping 4. school 5. work commute 6. other work/business 7. social/recreation 8. eat a meal 9. drive passenger 10.change travel mode
11. other:
1. car or light truck (driver) 2. car or light truck (passenger) 3. bus/transit: route(s): 66 2 3 4 5 4. school bus 5. large commercial truck 6. motorcycle 7. taxi (passenger) 8. bicycle 9. walk 10. other:
8
_____________________
___________________ &
_____________________
___ : ___ ___ : ___
1. go home 2. personal business 3. shopping 4. school 5. work commute 6. other work/business 7. social/recreation 8. eat a meal 9. drive passenger 10.change travel mode
11. other:
1. car or light truck (driver) 2. car or light truck (passenger) 3. bus/transit: route(s): 66 2 3 4 5 4. school bus 5. large commercial truck 6. motorcycle 7. taxi (passenger) 8. bicycle 9. walk 10. other:
9
_____________________
___________________ &
_____________________
___ : ___ ___ : ___
1. go home 2. personal business 3. shopping 4. school 5. work commute 6. other work/business 7. social/recreation 8. eat a meal 9. drive passenger 10.change travel mode
11. other:
1. car or light truck (driver) 2. car or light truck (passenger) 3. bus/transit: route(s): 66 2 3 4 5 4. school bus 5. large commercial truck 6. motorcycle 7. taxi (passenger) 8. bicycle 9. walk 10. other:
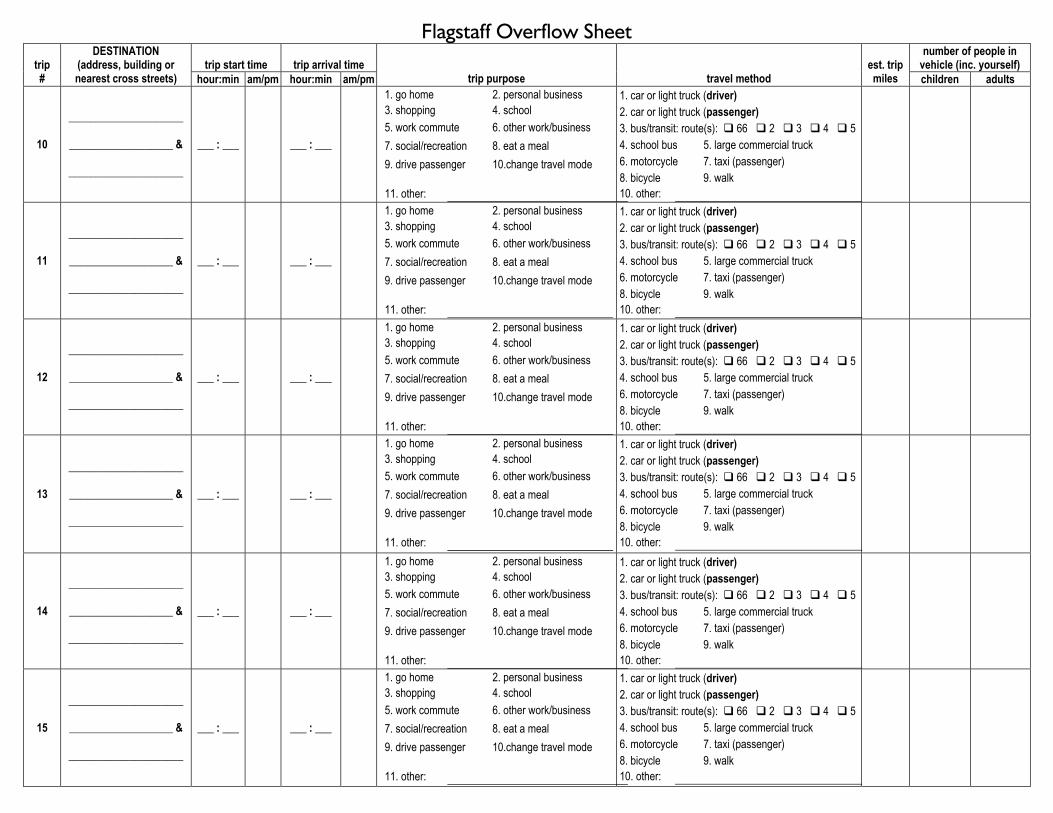
Flagstaff Overflow Sheet trip start time trip arrival time
number of people in vehicle (inc. yourself) trip
#
DESTINATION (address, building or nearest cross streets) hour:min am/pm hour:min am/pm trip purpose travel method
est. trip miles children adults
10
_____________________
___________________ &
_____________________
___ : ___ ___ : ___
1. go home 2. personal business 3. shopping 4. school 5. work commute 6. other work/business 7. social/recreation 8. eat a meal 9. drive passenger 10.change travel mode
11. other:
1. car or light truck (driver) 2. car or light truck (passenger) 3. bus/transit: route(s): 66 2 3 4 5 4. school bus 5. large commercial truck 6. motorcycle 7. taxi (passenger) 8. bicycle 9. walk 10. other:
11
_____________________
___________________ &
_____________________
___ : ___ ___ : ___
1. go home 2. personal business 3. shopping 4. school 5. work commute 6. other work/business 7. social/recreation 8. eat a meal 9. drive passenger 10.change travel mode
11. other:
1. car or light truck (driver) 2. car or light truck (passenger) 3. bus/transit: route(s): 66 2 3 4 5 4. school bus 5. large commercial truck 6. motorcycle 7. taxi (passenger) 8. bicycle 9. walk 10. other:
12
_____________________
___________________ &
_____________________
___ : ___ ___ : ___
1. go home 2. personal business 3. shopping 4. school 5. work commute 6. other work/business 7. social/recreation 8. eat a meal 9. drive passenger 10.change travel mode
11. other:
1. car or light truck (driver) 2. car or light truck (passenger) 3. bus/transit: route(s): 66 2 3 4 5 4. school bus 5. large commercial truck 6. motorcycle 7. taxi (passenger) 8. bicycle 9. walk 10. other:
13
_____________________
___________________ &
_____________________
___ : ___ ___ : ___
1. go home 2. personal business 3. shopping 4. school 5. work commute 6. other work/business 7. social/recreation 8. eat a meal 9. drive passenger 10.change travel mode
11. other:
1. car or light truck (driver) 2. car or light truck (passenger) 3. bus/transit: route(s): 66 2 3 4 5 4. school bus 5. large commercial truck 6. motorcycle 7. taxi (passenger) 8. bicycle 9. walk 10. other:
14
_____________________
___________________ &
_____________________
___ : ___ ___ : ___
1. go home 2. personal business 3. shopping 4. school 5. work commute 6. other work/business 7. social/recreation 8. eat a meal 9. drive passenger 10.change travel mode
11. other:
1. car or light truck (driver) 2. car or light truck (passenger) 3. bus/transit: route(s): 66 2 3 4 5 4. school bus 5. large commercial truck 6. motorcycle 7. taxi (passenger) 8. bicycle 9. walk 10. other:
15
_____________________
___________________ &
_____________________
___ : ___ ___ : ___
1. go home 2. personal business 3. shopping 4. school 5. work commute 6. other work/business 7. social/recreation 8. eat a meal 9. drive passenger 10.change travel mode
11. other:
1. car or light truck (driver) 2. car or light truck (passenger) 3. bus/transit: route(s): 66 2 3 4 5 4. school bus 5. large commercial truck 6. motorcycle 7. taxi (passenger) 8. bicycle 9. walk 10. other:
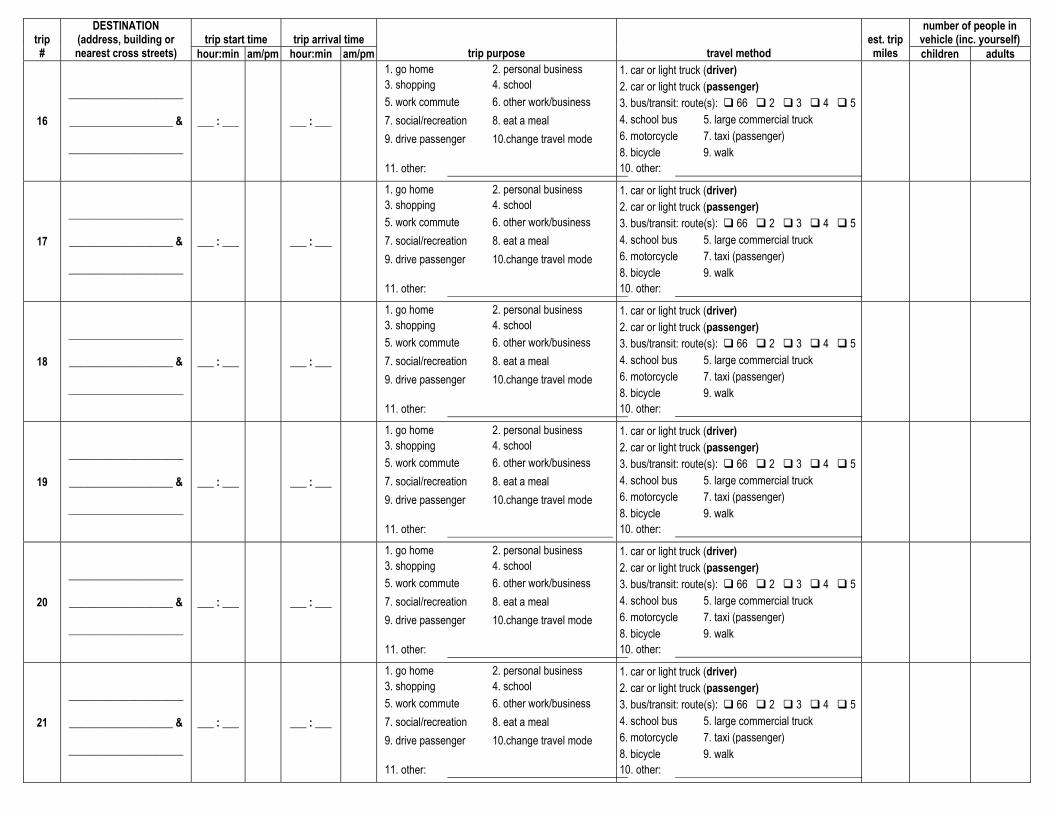
trip start time trip arrival time number of people in
vehicle (inc. yourself) trip #
DESTINATION (address, building or nearest cross streets) hour:min am/pm hour:min am/pm trip purpose travel method
est. trip miles children adults
16
_____________________
___________________ &
_____________________
___ : ___ ___ : ___
1. go home 2. personal business 3. shopping 4. school 5. work commute 6. other work/business 7. social/recreation 8. eat a meal 9. drive passenger 10.change travel mode
11. other:
1. car or light truck (driver) 2. car or light truck (passenger) 3. bus/transit: route(s): 66 2 3 4 5 4. school bus 5. large commercial truck 6. motorcycle 7. taxi (passenger) 8. bicycle 9. walk 10. other:
17
_____________________
___________________ &
_____________________
___ : ___ ___ : ___
1. go home 2. personal business 3. shopping 4. school 5. work commute 6. other work/business 7. social/recreation 8. eat a meal 9. drive passenger 10.change travel mode
11. other:
1. car or light truck (driver) 2. car or light truck (passenger) 3. bus/transit: route(s): 66 2 3 4 5 4. school bus 5. large commercial truck 6. motorcycle 7. taxi (passenger) 8. bicycle 9. walk 10. other:
18
_____________________
___________________ &
_____________________
___ : ___ ___ : ___
1. go home 2. personal business 3. shopping 4. school 5. work commute 6. other work/business 7. social/recreation 8. eat a meal 9. drive passenger 10.change travel mode
11. other:
1. car or light truck (driver) 2. car or light truck (passenger) 3. bus/transit: route(s): 66 2 3 4 5 4. school bus 5. large commercial truck 6. motorcycle 7. taxi (passenger) 8. bicycle 9. walk 10. other:
19
_____________________
___________________ &
_____________________
___ : ___ ___ : ___
1. go home 2. personal business 3. shopping 4. school 5. work commute 6. other work/business 7. social/recreation 8. eat a meal 9. drive passenger 10.change travel mode
11. other:
1. car or light truck (driver) 2. car or light truck (passenger) 3. bus/transit: route(s): 66 2 3 4 5 4. school bus 5. large commercial truck 6. motorcycle 7. taxi (passenger) 8. bicycle 9. walk 10. other:
20
_____________________
___________________ &
_____________________
___ : ___ ___ : ___
1. go home 2. personal business 3. shopping 4. school 5. work commute 6. other work/business 7. social/recreation 8. eat a meal 9. drive passenger 10.change travel mode
11. other:
1. car or light truck (driver) 2. car or light truck (passenger) 3. bus/transit: route(s): 66 2 3 4 5 4. school bus 5. large commercial truck 6. motorcycle 7. taxi (passenger) 8. bicycle 9. walk 10. other:
21
_____________________
___________________ &
_____________________
___ : ___ ___ : ___
1. go home 2. personal business 3. shopping 4. school 5. work commute 6. other work/business 7. social/recreation 8. eat a meal 9. drive passenger 10.change travel mode
11. other:
1. car or light truck (driver) 2. car or light truck (passenger) 3. bus/transit: route(s): 66 2 3 4 5 4. school bus 5. large commercial truck 6. motorcycle 7. taxi (passenger) 8. bicycle 9. walk 10. other:
National Research Center, Inc. 3005 30th Street Boulder, CO 80301 303-444-7863
2006 Flagstaff Travel Diary Study HOUSEHOLD TRAVEL SURVEY
Please complete the following survey regarding your household and return it with your Travel Diary in the enclosed postage-paid envelope. This survey should take only a few minutes. It is important because it will help research staff to better understand trip-making patterns in the area, your opinions about trip-making, and how representative the people who participated in the diary study are in relation to Flagstaff area residents as a whole. Your answers to this survey will be kept in strict confidence and only used in group form. Thank you for your time and help! GENERAL TRAVEL INFORMATION 1. On the day you completed the travel diary, did you
have any goods or services delivered to your work or home, such as a meal (pizza, etc.), groceries, haircuts or other goods and services? (Please include deliveries for items you ordered by phone, through a mail order catalogue, or via modem or Internet.)
No Go to question #3 Yes From how many different sources did you receive deliveries? ................. sources
2. Did the delivery or deliveries substitute for a travel trip
you might have made to seek the good or service? No Yes
3. About how close is the nearest bus stop to your
residence? less than 1 block 1-4 blocks (about 330 feet to a quarter-mile) 4-8 blocks (quarter-mile to a half-mile) 8-16 blocks (half-mile to a mile) More than 16 blocks (more than a mile) Don’t know
4. Do you have an annual pass that allows you unlimited
bus rides? No Yes, an Eco-Pass yes, provided by my employer yes, provided by my school yes, purchased myself
5. Did you vote in favor of increasing the transit tax
(Proposition 403) on last May’s general election? No Yes Go to question #7 Did not vote Go to question #7
6. Why did you choose to vote against the transit tax?
(Please check all that apply). I do not use transit The cost was too high for the benefit Taxes are already too high I do not think taxpayers should pay for transit service
Not enough information was provided I am not familiar with the transit system Other ___________________
7. Are you employed? No Go to question #11 Yes, part-time Yes, full-time
8. Please write in the address, building and/or nearest
cross streets of your primary work place.
Building or address:
Nearest cross streets:
&
City:
9. About how close is the nearest bus stop to your
primary work place? less than 1 block 1-4 blocks (about 330 feet to a quarter-mile) 4-8 blocks (quarter-mile to a half-mile) 8-16 blocks (half-mile to a mile) More than 16 blocks (more than a mile) Don’t know
10. For each of the following, please indicate which your
employer makes available to you and which you have used in the past 6 months.
Employer Used in last Provides? 6 months? Yes No Yes No Flexible hours/ compressed work weeks ......... Telecommuting/ working from home .................. Ridesharing, car or van pooling, car sharing................. Bike parking.............................. Lockers and shower facilities .. Guaranteed ride home............. Subsidized or free bus pass ...
11. The transportation system in our region consists of roads, buses, sidewalks, Flagstaff Urban Trails System (FUTS) trails, and bike facilities. How well do you feel the transportation system meets your travel needs?
Very Well Somewhat Well Not Too Well Not At All
12. Please rate each of the following aspects of transportation in Flagstaff.
Excellent Good Fair Poor Don’t Know Sidewalks ........................... 1 2 3 4 5 Crosswalks ......................... 1 2 3 4 5 FUTS trails .......................... 1 2 3 4 5 Bike lanes and routes........ 1 2 3 4 5 Bike parking ....................... 1 2 3 4 5 Condition of streets ........... 1 2 3 4 5 Traffic calming (median islands, street narrowing, etc).. 1 2 3 4 5 Traffic congestion .............. 1 2 3 4 5 Intersections ...................... 1 2 3 4 5 Landscaping/streetscaping along major streets............ 1 2 3 4 5 Bus stops............................ 1 2 3 4 5 Bus routes .......................... 1 2 3 4 5 Overall ease of travel in the area .......................... 1 2 3 4 5 HOUSEHOLD INFORMATION
13. How many usable passenger cars, vans and light trucks does your household own or normally have use of? ......... vehicles
14. How many usable bicycles
does your household have?............. bicycles
15. In the last month, about how frequently have you ridden a bicycle:
For Recreation For Commuting Five or more times a week Five or more times a week 2 to 4 times a week 2 to 4 times a week Once a week Once a week Twice a month or less Twice a month or less Never Never
16. About how much was the TOTAL 2005 income before taxes for your household as a whole? In the total, please include income before taxes as well as money from all sources for all persons living in your household
less than $14,999 $75,000 to $99,999 $15,000 to $24,999 $100,000 to $149,999 $25,000 to $49,999 $150,000 or more $50,000 to $74,999
17. Please check the one choice below which best
describes the kind of residence in which you live. A detached single family home A duplex or triplex A multi-family unit (e.g., apartments or condominiums)
A townhouse A mobile home Group quarters (e.g., dormitory, fraternity or sorority, nursing home) go to question #21
Other: __________________________
18. Do you rent or own your residence? Rent Own
19. Please record the number of household members in each of the following age categories. (Please remember to include yourself.)
How many are under 16? ....... ________
How many are 16 or older? ....... ________
20. For all children (under the age of 16) living in your household, please check the box that indicates their most frequently used travel mode to school. (If no children live in your household, or none that attend school, please go to question #21)
Most frequent travel mode to school
Child #1
Child #2
Child #3
Child #4
Child #5
Walk Bicycle School bus Mountain Line bus Charter bus Driven alone Driven with other children
INDIVIDUAL INFORMATION 21. How many years have you lived
in or near Flagstaff? ........................ years (Please mark “0” if less than 6 months.)
22. Are you a student at the Northern Arizona University?
No Yes
23. What is your gender? Male Female
24. Which category contains your age?
16 to 24 years old 25 to 34 years old 35 to 44 years old 45 to 54 years old 55 to 64 years old 65 years or older
25. Which category best describes your race?
African American/black Caucasian/white Asian or Pacific Islander Native American Other
26. Which category best describes your ethnicity?
Hispanic Non-Hispanic
27. How much education have you completed? 0 to 11 years of school high school some college or associate's degree bachelor's degree graduate/professional degree
Dear Flagstaff or Flagstaff-Area Resident, This is a friendly reminder: Please complete your travel diary! You are part of only a small group of residents who will keep a simple travel log for a single day this week. Study results will help the City of Flagstaff and Coconino County better understand existing travel patterns and work to improve your travel experience. If you have questions, or did not receive your packet, please call National Research Center, the organization conducting the study, toll-free at 1-877-467-2462. Ask for Paula or Erin. Sincerely,
Matt Ryan Chairman, Joseph "Joe" C. Donaldson Coconino Board of Supervisors Mayor, City of Flagstaff