Embed Size (px)
Citation preview
TÁRKI Social Report Reprint Series No 10.
Péter Róbert Educational Performance and Social Background in International Comparison
Abstract
The paper is based on the PISA 2000 survey and focuses on the international variation in reading scores of students in selected European nations. The analysis investigates the effect of students’ sociological characteristics (like family background or family social and educational climate) as well as that of school climate and student-teacher relationship on students’ performance. Both bivariate and multivariate relationships are considered in order to dis-play the rank order of the countries with respect to the determination of stu-dents’ achievement. The research confirms previous findings on existing variation how family background influences students’ performance: this effect is stronger in some post-socialist countries (especially in Hungary) and in Germany, and is weaker in the Scandinavian and in some Anglo-Saxon countries. Students’ reading skills turn out to be less affected by the school climate and teachers’ behavior in comparison to family background. Keywords: PISA 2000, school performance, educational inequalities JEL Classification: I21 Author:
PÉTER RÓBERT is a sociologist, Senior Researcher at TÁRKI; Reader at the Sociology Institute, Faculty of Social Science, Eötvös Loránd University, Budapest; Hungarian representative of the International Social Survey Programme (ISSP) and the European Social Survey (ESS). Major research interests include social inequalities, social mobility, educational and occupational life paths, attitudes and preferences relating to social inequalities.
TÁRKI Budapest, 2005

Reprint from Tamás Kolosi, György Vukovich, István György Tóth eds.: Social Report 2004, Budapest: TÁRKI, 2004
pp. 186–197. Please use the book reference for citation.
English translation: Eszter Berán
Published by: TÁRKI Social Research Centre Inc.
P.O. Box 71, H-1518 Budapest, Hungary Tel: +361 309-7676, http://www.tarki.hu
Coordinator: Ildikó Nagy
Language Editor: Clive Liddiard-Maár
All rights reserved, including the right of reproduction in whole or in part in any form.
© TÁRKI, Péter Róbert, 2004
The Social Report 2004 was published with the support of the Hungarian Ministry of Health
and the Hungarian Ministry of Youth, Family, Social Affairs and Equal
Opportunities.

186 Péter Róbert
Introduction The usual research question used to investigate educational inequalities re-fers to the impact of social background on the highest level of education attained, the choice of various school types, or the probabilities of educa-tional transitions.1 This study, however, has a different topic and investigates another dependent variable, namely educational performance as reflected by students’ abilities plus the results of the knowledge accumulated. Grading students is part of education, but its most frequent forms––the school grades––are far from the best and most objective measures of knowledge, especially in a comparative sense. It is well known that the same school grades can cover different competencies in various schools. Evaluation of students is relative, and the teacher’s decision on how to grade a pupil’s achievement can be affected by the school as a whole, the specific class community, the previous performance of the pupil, or some other considera-tion.2 This is why alternative test methods have been developed in order to compare the actual knowledge and competence of the students. Accordingly, degrees and diplomas and the other markers of school progression indicate educational achievement on the one hand, while, on the other hand, the suc-cessful performance of different tasks and students’ various actual compe-tencies reflect the effectiveness of education. International comparative stud-ies like the Adult Literacy Survey (OECD 2000) or the Programme for In-ternational Student Assessment (PISA) (OECD 2001) aim to investigate the latter type of educational outcomes. This analysis is based on the PISA 2000 database.3
1 Examples of such studies in international comparison: Shavit and Blossfeld (1993), Erikson and Jonsson (1996); for Hungary particularly: Simkus and Andorka (1982), Róbert (1991, 2003), Bukodi (1999), Andor and Liskó (2000). 2 School marks of different students in different schools cannot be compared because they are based on different answers to different questions at different times. Tests with the same con-tent are better measures, such as those used in the secondary school final examinations (Gen-eral Maturity Certificate ‘érettségi’)––except if they are evaluated by the teacher of the stu-dent in his/her school, as in Hungary. This explains why entrance exams to higher educational establishments or language exams involve identical tasks for everybody and why ‘unknown’ teachers evaluate the results anonymously. 3 The PISA 2000 survey was carried out by Péter Vári and his colleagues in Hungary. They have published several articles from the data in Hungarian, as well as a comprehensive book (Vári 2003). Their publications make extensive use of the materials that are available from the PISA reports. This analysis, however, is based on our own calculations from the original micro data, which are available on the internet.

Educational Performance and Social Background… 187
The PISA survey was initiated by the OECD; about 265 thousand 15-year-old students were investigated in 32 countries in order to test their abili-ties with respect to their performance in reading, maths and scientific liter-acy. Researchers were not interested in replication of any ‘lexicological’ knowledge; instead they wanted to learn about students’ analytical and prob-lem-solving competence and about their ability to make use of learning skills under everyday circumstances. The PISA survey put a greater emphasis on reading skills and focused on students’ ability to retrieve information from written texts by understanding, using and reflecting on them. Achievement was measured separately in these three dimensions and the results were summarized. In the fields of maths and science, the tests were less detailed and contained fewer items, but recognition of problems and skill in solving them were crucial in these respects, too. The performance of the 15-year-old students was measured on continuous scales. The whole approach differs markedly from investigating the extent to which students have mastered the school curriculum and are able to replicate it. On the basis of the PISA sur-vey, the OECD aimed to reveal the level of students’ capacity to continue learning, as well as their ability to use knowledge in real life. Accordingly, the PISA survey measures the relationship between educational inputs and learning outcomes in international comparison for tapping students’ prepar-edness for life and for future employment (‘skills for life’)4.
In this analysis we use the performance of students to investigate the ex-tent to which different countries are at risk from bad test results and low competency levels, insofar as these predict unsatisfactory labour market potentials for the future. We also present a multivariate analysis of how far students’ achievement and test results are influenced by sociological factors. In this respect we place great emphasis on the impact of the family back-ground. For students’ performance the outcomes of the reading test are used, as it was considered the ‘main field’ in the PISA study and was measured more accurately.
4 For the theoretical framework of student assessment, see OECD (1999).

Péter Róbert 188
Competence disadvantages in international comparison Based on the test scores derived from the reading items, the OECD research-ers placed the students on five levels.5 The lowest level contains the ‘at risk group’ of 15-year-old pupils who have basic difficulties in understanding everyday texts and who are practically and functionally illiterate. According to the approach of the OECD, these youngsters will later be unable to par-ticipate adequately in the life of society because they will most probably have difficulties in finding any job or in continuing their studies to obtain the appropriate skills. The proportion of such students is displayed in Table 1 for selected European countries, based on the PISA data.
The left-hand columns of Table 1 reveal that between a fifth and a quarter of Hungarian youngsters will have difficulty participating in the division of labour or acquiring the necessary skills because of their inadequate reading competencies. The situation is similar in Germany and test results reveal even higher proportions of this ‘at risk group’ in Poland, as well as in two nations on the periphery of the European Union: Greece and Portugal. Table 1: Students on the lowest level according to the reading test by countries and among
the offspring of low-status parents Country Percentage
(%) Country* Percentage
(%) Increase in percentage
Finland 6.9 Finland 9.9 3.0 Ireland 11.0 Ireland 18.2 7.2 Sweden 12.6 Sweden 22.0 9.4 United Kingdom 12.8 United Kingdom 22.2 9.4 Austria 14.6 Denmark 22.5 4.6 France 15.2 France 24.5 9.3 Czech Republic 17.5 Italy 27.0 8.1 Norway 17.5 Austria 31.4 16.8 Denmark 17.9 Norway 32.0 12.5 Italy 18.9 Greece 33.1 8.7 Germany 22.6 Portugal 35.6 9.3 Hungary 22.7 Poland 35.9 12.1 Poland 23.8 Czech Republic 36.6 19.1 Greece 24.4 Hungary 37.6 14.9 Portugal 26.3 Germany 38.2 15.6 N 41 002 N 7563
Note: * Only those students whose father (or mother) is in the lowest quintile of the ISEI status index. (See also Footnote 6.) Source: PISA 2000 Database, own calculations.
5 See pp. 25–26 in the Manual for the PISA 2000 Database (http://www.pisa.org).
Educational Performance and Social Background… 189
One cannot speak, however, of a universal deficit among the peripheral European countries, since the proportion of the ‘at risk group’ is much lower in Ireland. Students from the Scandinavian countries, especially from Finland, performed very well in the test. Although, of the post-socialist countries, Hungary and Poland are characterized by bad results, the Czech Republic is situated in the middle of the rankings. The pattern of the results is not so far unequivocal. The international variation in educational perform-ance or in competencies of the 15-year-old students cannot be interpreted as a centre–periphery distinction. Nor is it the case that the PISA study found the educational system of the former socialist countries to be wanting. The rankings do not prove the failure of the ‘Prussian’ educational system that one hears and reads so much about. The poor position of Germany and Hun-gary could have been interpreted in this way, but that does not explain the results of Greece and Portugal. It is especially interesting that the thesis of the ‘common educational traditions of the Monarchy’ is not confirmed by the data either, as the results presented above show that the position of Aus-tria is rather better than that of Hungary.
This is why it is worth considering the social origin of the students. The right-hand columns of Table 1 display the rankings of the countries based only on the performance of those students who come from disadvantaged, low-status families.6 The ‘top nations’––those with a low proportion of stu-dents with poor competencies––are the same from this perspective as well: Finland, Ireland, Sweden and the UK. In addition, there is an improvement in the position of Denmark. The group of countries on the bottom, however, has altered and the pattern has become more detectable. Germany and three former socialist countries occupy the bottom positions (Hungary takes the place last but one and the position of the Czech Republic has worsened). These are countries where the educational system is/was characterized by its ‘Prussian’ nature and/or the rigorous and inflexible planning system. Greece and Portugal, however, fare relatively better in this second order of ranking.
The rightmost column of Table 1 displays how much of an increase there is in the proportion of students with test results at the lowest level in conse-quence of coming from a disadvantaged family. This value is a double-digit number for the last four nations in the rankings. But disadvantaged family background increased by a similar amount the proportion of students who performed poorly in the reading test even in Austria and Norway, which occupy better positions otherwise. Greece and Portugal differ somewhat, in that having low-status parents appears to have less of a bearing on having a 6 Determining low-status family background is based on the ISEI scores (Ganzeboom et al. 1992). The PISA database contains a variable indicating this score for the father or mother depending on which has the higher value. Quintiles were computed from the parental status scores and the low-status family background equals the case where the index-value was in the lowest quintile.

Péter Róbert 190
low level of reading competence. The increase in the proportion of students in the ‘at risk group’ is moderate for France, Italy, Ireland, Sweden and the UK as well. The results are not unequivocal for the Scandinavian countries, because coming from a disadvantaged family background hardly impacts at all on performance in the reading test in some countries, like Finland or Denmark, but in Sweden, and especially in Norway, there is a stronger influ-ence. The determination of educational performance After a descriptive examination of the international differences for the 15-year-old students’ educational achievement, we turn to investigating the influential factors of the test results (in particular for reading tasks). This causal analysis is built on the theoretical framework for social capital on the one hand, and focuses on the role of the family background on the other hand. Conceptually, we follow Coleman’s thesis (1988), which states that social capital plays a crucial role in the creation of human capital (in this context on skill competencies). Related research reveals that the attitude of parents to learning, and the connection between the parents and the school, have an impact on students’ educational performance (Coleman et al. 1982; Schneider and Coleman 1993). However, the students benefit educationally from the accumulated cultural and financial capital of their parents only if the parents invest in the human capital of their offspring (Coleman 1988).
Four groups of predictor variables are distinguished in the analysis. (1) Two demographic variables are considered: the student’s gender and
age.7 (2) In accordance with the social capital concept, we investigate the im-
pact of the family climate––something which the PISA survey tackled in the student questionnaire. In this way, there is information on how frequently parents discuss political and social issues, books, films or television pro-grammes with their offspring. The individual items have been aggregated into the cultural communication index labelled as Parental academic inter-est. Similarly, students were asked to report on how frequently parents dis-cussed school issues with them, ate together with them around the table or spent time talking to them at all. These variables resulted in the social com-munication index labelled as Parental social interest. For social capital it also matters whether parents work with the student on their schoolwork or 7 Though it was in principle 15-year-old students who were examined in the PISA study, the sampling frame was a specific school grade and the field work lasted 3 months; thus there was some deviation in age among the students. Age was measured in months in the PISA database and its range was in fact between 182 and 195 in the sample.

Educational Performance and Social Background… 191
help them to do their homework. The frequency of these events, as reported by the students, is measured by the Family educational support index.8
(3) We also investigate the influence of the teaching and learning envi-ronment. In this respect students were asked to report on how much interest teachers showed in their learning progress, how frequently teachers let them express their own opinions in school, or how frequently teachers helped them to understand course materials. The Teacher support index is based on these items. Further information was gleaned on the school climate by ask-ing how students got on with their teachers, to what extent teachers were interested in the students, how much they listened to what students told them, how fairly they treated students. These questions are summarized in the Teacher–student relationship index. The next relevant aspect to be con-sidered is how much the teacher wants students to work hard, how much he/she tells them they can work better, how much he/she dislikes it if stu-dents do not work well. What students report on these questions appears in the Achievement pressure index.9
(4) For measuring the family background, we use the ISEI scores of pa-rental status, the number of siblings, and a few other variables that can be interpreted in the conceptual framework of social capital, such as the single-parent background or whether the mother works full time or part time.
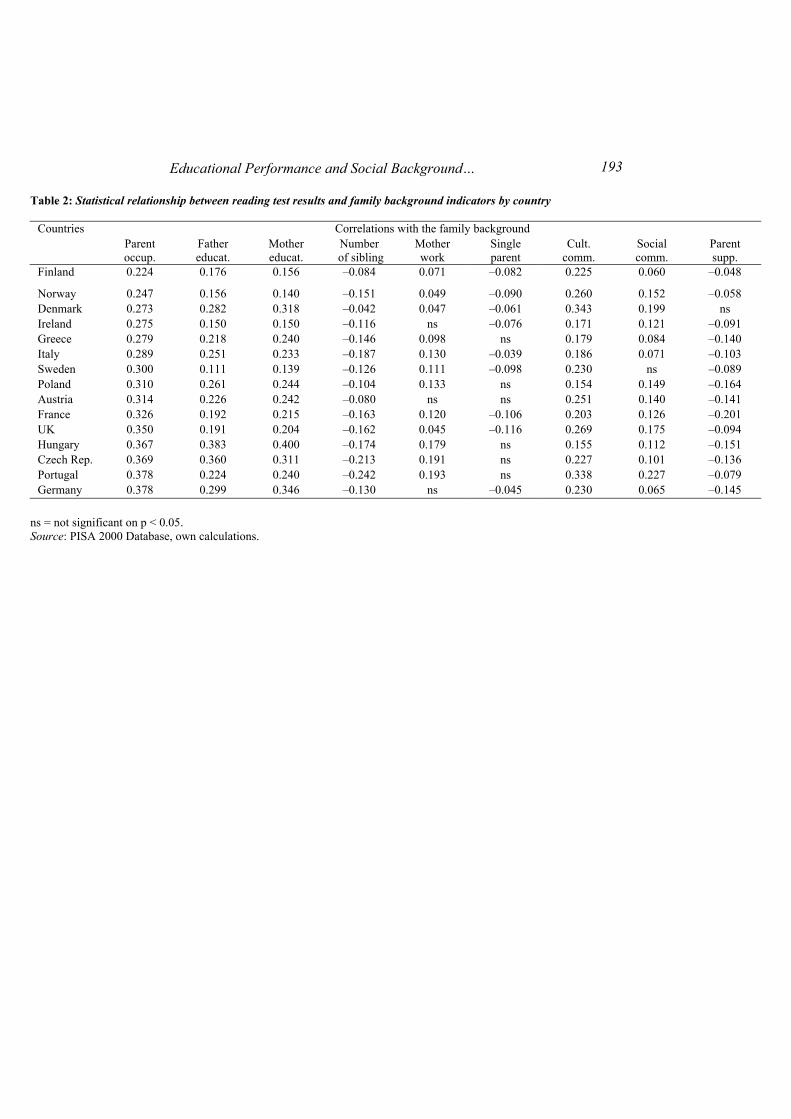
Before we go into the details of the multivariate analysis, we should say that the strength of the statistical relationship between the reading test and vari-ous independent variables related to family background was examined in the different countries. These bivariate associations are presented in Table 2; the order of the countries is based on the correlation between students’ perform-ance and parental occupation (ISEI), which is displayed in the first column of the table.
This relationship turns out to be weaker again in some of the Scandina-vian countries (especially in Finland and Norway in this case) and in Ireland. The strongest correlation between the reading test results and the parental occupation appears in Portugal and Germany, followed by the Czech Repub-lic and Hungary. This ranking indicates some differences over the previous one presented in the right-hand panel of Table 1. Obviously, the results are not completely independent of how we approach the connection between students’ performance and their social origin, e.g. one Scandinavian country, Norway, and one post-socialist country, Poland, fare better, while the UK occupies a much lower position in Table 2 than before. But otherwise the 8 For further details of the concrete measures, see OECD (2001). 9 For details related to the exact measures, see again OECD (2001). We repeat that all infor-mation of this kind is based on students’ answers. The PISA study contained a questionnaire for the students and the school principals, but not for the parents. This is a disadvantage when it comes to social capital measurement in PISA.
Péter Róbert 192
results are pretty similar. Moreover, when we look at the father’s and mother’s education, the coefficients are highest for Hungary, the Czech Re-public and Germany.10
A higher number of siblings correlates negatively with reading perform-ance in every country. This relationship is strongest in Portugal, followed by the Czech Republic, Italy, and Hungary again in fourth position. The number of children in the family has least impact on reading ability in Denmark, Austria and Finland. A working mother increases, rather than decreases, educational performance in most of the countries. This relationship is strongest in Portugal, the Czech Republic and Hungary, but is not present in Germany, Austria or Ireland. It is a disadvantage to live in a single-parent family only in some of the countries; this is quite noticeable in the UK and France, but is not significant in the former socialist countries or in Greece and Portugal.
For the family climate, a parent’s academic interest (cultural communica-tion) indicates a stronger correlation with educational performance than the parent’s social interest (social communication). It is interesting that parental support correlates negatively with the test results in reading. This is probably explained by the fact that the parents are more likely to be helping their chil-dren if those children are having problems in their studies.
For the multivariate analysis we constructed a model around the data; the dependent variable is the student’s performance in the reading test, and the independent variables are added to the equation in four steps. The first model contains the demographic variables, the second one involves the family background characteristics, the third model adds the cultural climate vari-ables, and the fourth model includes the teaching and learning environment measures. Table 3 displays the adjusted R2 values from each model, i.e. the extent to which the given group of variables explains the student’s educa-tional performance.11
10 In fact, it is Hungary (and Denmark) where education correlates more strongly with student performance than does occupation. Other Hungarian studies analysing educational inequali-ties found the same thing (Róbert 1991, 2003). In the majority of the countries, parental occu-pation is a stronger predictor than education. 11 The R2 value is a condensed measure for the explanatory power of the independent vari-ables included in the statistical model. It is suitable for providing an answer to our research question using relatively few figures. The actual regression coefficients that belong to each independent variable are not presented here in order to keep the article short. The correlation coefficients in Table 2 to some extent provide information about the size and direction of the effects.
Educational Performance and Social Background… 193
Table 2: Statistical relationship between reading test results and family background indicators by country
Countries Correlations with the family background Parent
occup. Father educat.
Mother educat.
Number of sibling
Mother work
Single parent
Cult. comm.
Social comm.
Parent supp.
Finland 0.224 0.176 0.156 –0.084 0.071 –0.082 0.225 0.060 –0.048
Norway 0.247 0.156 0.140 –0.151 0.049 –0.090 0.260 0.152 –0.058 Denmark 0.273 0.282 0.318 –0.042 0.047 –0.061 0.343 0.199 ns Ireland 0.275 0.150 0.150 –0.116 ns –0.076 0.171 0.121 –0.091 Greece 0.279 0.218 0.240 –0.146 0.098 ns 0.179 0.084 –0.140 Italy 0.289 0.251 0.233 –0.187 0.130 –0.039 0.186 0.071 –0.103 Sweden 0.300 0.111 0.139 –0.126 0.111 –0.098 0.230 ns –0.089 Poland 0.310 0.261 0.244 –0.104 0.133 ns 0.154 0.149 –0.164 Austria 0.314 0.226 0.242 –0.080 ns ns 0.251 0.140 –0.141 France 0.326 0.192 0.215 –0.163 0.120 –0.106 0.203 0.126 –0.201 UK 0.350 0.191 0.204 –0.162 0.045 –0.116 0.269 0.175 –0.094 Hungary 0.367 0.383 0.400 –0.174 0.179 ns 0.155 0.112 –0.151 Czech Rep. 0.369 0.360 0.311 –0.213 0.191 ns 0.227 0.101 –0.136 Portugal 0.378 0.224 0.240 –0.242 0.193 ns 0.338 0.227 –0.079 Germany 0.378 0.299 0.346 –0.130 ns –0.045 0.230 0.065 –0.145
ns = not significant on p < 0.05. Source: PISA 2000 Database, own calculations.

Péter Róbert 194
Table 3: Determination of the reading test results
Countries Explained variance (and its increase)* Model 1 Model 2 Model 3 Model 4
Finland 8.7 15.4(+6.7) 19.8(+4.4) 22.3(+2.5) Norway 3.9 11.2(+7.3) 16.2(+5.0) 19.9(+3.7) Ireland 3.0 12.2(+9.2) 16.4(+4.2) 18.1(+1.7) Austria 3.8 13.6(+9.8) 20.1(+6.5) 20.4(+0.3) Sweden 2.7 13.1(+10.4) 20.0(+6.9) 21.9(+1.9) Greece 4.8 15.5(+10.7) 18.6(+3.1) 19.0(+0.4) Poland 3.4 14.5(+11.1) 20.7(+6.2) 20.9(+0.2) Italy 3.3 15.0(+11.7) 18.2(+3.2) 18.8(+0.6) United Kingdom 2.4 15.0(+12.6) 22.5(+7.5) 24.4(+1.9) France 3.0 15.9(+12.9) 22.1(+6.2) 22.3(+0.2) Denmark 2.3 15.6(+13.3) 21.4(+5.8) 22.7(+1.3) Czech Republic 3.2 18.8(+15.5) 24.4(+5.6) 24.8(+0.4) Germany 3.4 20.5(+17.1) 25.8(+5.3) 26.9(+1.1) Portugal 1.8 20.6(+18.8) 27.3(+6.7) 27.4(+0.1) Hungary 2.8 23.7(+20.9) 27.5(+3.8) 27.9(+0.4)
Notes: * Adjusted R2 in percentage; increase over the previous model in brackets in italic. Independent variables in Model 1: gender, age. Independent variables in Model 2: Model 1 + parental occupation, education, number of sib-lings, working mother, single parent family. Independent variables in Model 3: Model 2 + parental academic interest, parental social inter-est, parental support. Independent variables in Model 4: Model 3 + teacher support, teacher–student relationship, achievement pressure. Source: PISA 2000 Database, own calculations. The ranking of the countries in Table 3 is based on Model 2, i.e. on the italic values in Column 3, which express the amount by which the family back-ground variables increased the explanatory power for the reading test results in comparison to Model 1. (Model 1 plays only the role of control, it reveals that the demographic characteristics, gender and age, do not have much ex-planatory power––with the exception of Finland and perhaps Greece.) Ac-cording to the results of the multivariate analysis, family background con-tributes to the differences in educational performance to a lesser extent in Finland, Norway and Ireland. (Denmark is in a worse position because of the stronger role of parental education.) Parental background seems to be less crucial in Austria and Sweden, in Greece (one more peripheral country of the European Union) and in Poland (one of the former socialist countries). It is in Hungary that social origin determines educational performance most––due to the strong relationship with parental education. Reading test results are strongly affected by family background in Portugal, Germany and the Czech Republic.

Educational Performance and Social Background… 195
According to Model 3, the social and cultural climate in the family in-creases the explanatory power of the model only to a limited extent––at least if controlled for the hard characteristics of family background. The positive influence of parents’ cultural and social interest and the negative effect of parental support make a stronger contribution to understanding students’ reading competence in the UK, Sweden, Portugal, Austria, France and Po-land. In Greece, Italy and Hungary, by contrast, family circumstances hardly affect students’ test results for reading.
Model 4 examines the impact of the teaching and learning environment. In this respect, the focus was put on those criteria that can be interpreted in the framework of the social capital theory. Such institutional features like school infrastructure or teacher autonomy (for which measures are available from the questionnaire for principals) were not considered in this paper. We were interested in the possible influence of the climate in the school and in the class, and our results indicate quite a small contribution to the explana-tory power of the model in the different countries. This kind of determina-tion for the reading test results is more characteristic of the Scandinavian countries (especially Norway and Finland) as well as of the UK and Ireland, though to a lesser extent. These measures increase the explanatory power of the model by less than half a percent in the former socialist countries, in Portugal, Greece and Austria. These are the countries where the teaching and learning environment in the school plays a particularly small role in compen-sating for the differences in advantages or disadvantages of the family back-ground. Implications for educational policy This paper has examined the social determination of reading performance for 15-year-old students, using data from the PISA survey. According to the OECD, the tests in the PISA survey aimed to measure students’ competence for labour market participation in the future and for the accumulation of the skills needed for this purpose. In other words, the OECD research investi-gates the risk probabilities that students in the various countries cannot take part properly in the division of labour because of their missing reading profi-ciency. This study focused only on European nations. The analysis is based on different measurements and we grouped the data in various ways. Conse-quently, the order of ranking of countries was not completely equal for each step in the analysis, but the results were still consistent and in line with other publications based on the PISA data.
According to these results––and findings from other analyses with differ-ent methods––Hungary has one of the strongest associations between stu-dents’ family background and educational performance. Here the offspring

Péter Róbert 196
of low-status families have a higher than average probability of belonging to the ‘at risk group’ with poorer chances of labour market success due to low competencies. While social origin affects students’ educational performance in every country, in Hungary it increased the explanatory power of the re-lated statistical model to a higher degree than elsewhere. We can confirm that the Hungarian results are similar to the German ones, but we cannot speak of a strict post-communist pattern. It is not possible to interpret the results either in terms of whether countries are at the centre or the periphery of Europe, or in terms of whether or not they have an educational system rooted in the traditions of the Austro–Hungarian monarchy. The Scandina-vian and Anglo–Saxon educational systems seem to be more effective than the Prussian one, but this pattern is not consistent either.
Based on the results of the PISA survey, previous publications in Hun-gary argued that the requirements of the education and school curriculum should be brought closer to the demands of the labour market and practical life. One should add that narrowing the differences based on family back-ground is a similarly important task, especially at a younger age, in the early stages of the school career. At present the PISA data prove that in Hungary social disadvantage and missing competencies feed off one another. REFERENCES Andor, M. and I. Liskó 2000: Iskolaválasztás és mobilitás [School Selection and Mobility].
Budapest: Iskolakultúra. Bukodi, E. 1999: ‘Educational choices in Hungary’, Hungarian Statistical Review (English
edition) vol. 77, pp. 71–94. Coleman, J. S. 1988: ‘Social capital in the creation of human capital’, American Journal of
Sociology vol. 94, S95–121 (supplement). Coleman, J. S., T. Hoffer and S. Kilgore 1982: High School Achievement: Public, Catholic,
and Private Schools Compared. New York: Basic Books. Erikson, R. and J. O. Jonsson eds. 1996: Can Education Be Equalized? The Swedish Case in
Comparative Perspective. Boulder: Westview Press, Inc. Ganzeboom, H. B. G., P. de Graaf and D. J. Treiman 1992: ‘A standard international socio–
economic index of occupational status’. Social Science Research, vol. 21, pp. 1–56. OECD 1999: Measuring Student Knowledge and Skills––A New Framework for Assessment.
Paris: OECD. OECD 2000: Literacy in the Information Age. Final report of the International Adult Literacy
Survey. Paris: OECD. OECD 2001: Knowledge and Skills for Life. First results from PISA 2000. Paris: OECD. Róbert, P. 1991: ‘Educational transition in Hungary from the postwar period up to the end of
the 1980s’, European Sociological Review Special Edition on Eastern Europe vol. 7, no. 3, pp. 213–236.
Róbert, P. 2003: ‘Self–selection and selection: transition from secondary to tertiary education in Hungary’, Czech Sociological Review, vol. 39, no. 3, pp. 325–349.
Schneider, B. and J. S. Coleman eds. 1993: Parents, Their Children, and Schools. Boulder: Westview Press.
Educational Performance and Social Background… 197
Shavit, Y. and H. P. Blossfeld eds. 1993: Persistent Inequality. Changing Educational At-tainment in Thirteen Countries. Boulder: Westview Press, Inc.
Simkus, A. and R. Andorka 1982: ‘Inequalities in education in Hungary 1923–1973’, Ameri-can Sociological Review vol. 47, pp. 740–751.
Vári, P. ed. 2003: PISA vizsgálat 2000. [The PISA Investigation]. Budapest: Műszaki Könyv-kiadó.
Social Report 2004, Budapest: TÁRKI, 2004 Tamás Kolosi, György Vukovich, István György Tóth eds.
Table of Contents
Introduction
Tamás Kolosi, István György Tóth and György Vukovich PART I: SOCIAL INDICATORS, SOCIAL STRUCTURE
1. Hungarian Society Reflected in Indicators (Erzsébet Bukodi, István Harcsa and György Vukovich)
2. Key Processes of Structural Transformation and Mobility in Hungarian Society since the Fall of Communism (Tamás Kolosi and Péter Róbert)
3. Income Composition and Inequalities, 1987–2003 (István György Tóth)
4. Poverty in Hungary on the Eve of Entry to the EU (András Gábos and Péter Szivós)
PART II: DEMOGRAPHIC PROCESSES AND WELFARE SYSTEM 5. Hungarian Population Characteristics in the EU Context
(Gabriella Vukovich) 6. Fertility Decline, Changes in Partnership Formation and Their Linkages
(Zsolt Spéder) 7. Lifestyle and Well-being in the Elderly Population
(Edit S. Molnár) 8. Effects of Intergenerational Public Transfers on Fertility: Test on Hungarian Data
(Róbert Iván Gál and András Gábos) 9. Housing Conditions and State Assistance, 1999–2003
(János Farkas, József Hegedüs and Gáborné Székely) 10. Educational Performance and Social Background in International Comparison
(Péter Róbert) PART III: LABOUR MARKET AND HOUSEHOLD ECONOMICS
11. Labour Market Trends, 2000–2003 (Gábor Kézdi, Hedvig Horváth, and Péter Hudomiet)
12. Business Expectations of the Largest Exporters at the Beginning of 2004 (István János Tóth)
13. Low Participation among Older Men and the Disincentive Effects of Social Transfers: The Case of Hungary (Orsolya Lelkes and Ágota Scharle)
14. Overeducation, Undereducation and Demand (Péter Galasi)
15. The Labour Market and Migration: Threat or Opportunity? (Ágnes Hárs, Bori Simonovits and Endre Sik)
16. General Characteristics of Household Consumption with Focus on Two Fields of Expenditure (Anikó Bernát and Péter Szivós)

PART IV: INFORMATION SOCIETY
17. Digital Inequality and Types of Info-communication Tool Use (Róbert Angelusz, Zoltán Fábián and Róbert Tardos)
18. The Spread of Information Technology: Objective and Subjective Obstacles (Tibor Dessewffy and Zsófia Rét)
19. The Development of Electronic Commerce in Hungary and in Countries of the European Union (László Szabó)
20. E-government in Hungary Today (Teréz N. Vajdai)
PART V: MINORITY AND MAJORITY IN HUNGARY
21. Is Prejudice Growing in Hungary (Zsolt Enyedi, Zoltán Fábián and Endre Sik)
22. The Income Situation of Gypsy Families (Béla Janky)
23. Residential Segregation and Social Tensions in Hungarian Settlements (Marianna Kopasz)
24. The Social Position of Immigrants (Irén Gödri and Pál Péter Tóth)
PART VI: POLITICAL BEHAVIOUR, SOCIAL ATTITUDES
25. Trends in Party Choice after the Change in Government (István Stumpf)
26. Public Support for EU Accession in Hungary (Gergely Karácsony)
27. National Identity in Hungary at the Turn of the Millennium (György Csepeli, Antal Örkény, Mária Székelyi and János Poór)
28. The Individual and Social Components of Insecurity (György Lengyel and Lilla Vicsek)
------------------------------------------------------------------------------ Cataloging in Publication Data
Social Report 2004 /ed. by Tamás Kolosi, István György Tóth,
György Vukovich—Budapest: TÁRKI, 2004 487 p.
Society—Hungary—Social structure—Social indicators—Welfare systems Labour market—Information society—Migration—Election.
-------------------------------------------------------------------------------
Hard copies of the book can be ordered directly from TÁRKI. Order form: www.tarki.hu/
Contact information: Ilona Pallagi
H-1518 Budapest, Pf. 71., Hungary E-mail: [email protected]
Research Areas: • social structure, labour market • income distribution, poverty, inequalities • social policy, welfare systems • boom study, economic attitudes • election research, market research • survey methodology, statistical analyses • microsimulation implementation References: • government agencies • international organizations • professional organizations • local councils • financial institutions • major companies Services: • non-profit public data archive with more than 650 databases • empirical surveys carried out with the help of highly qualified survey apparatus • acclaimed research results, wide-ranging training experience • revealing analyses, advance effect studies • occasional, half-yearly and yearly reports, Social Report,
TÁRKI Public Policy Discussion Papers Contact Information for TÁRKI Social Research Centre: Address: Budaörsi út 45, H-1112 Budapest, Hungary Postal address: P.O. Box 71, H-1518 Budapest, Hungary Phone: +36 1 309-7676 Fax: +36 1 309-7666 E-mail: [email protected] Internet: http://www.tarki.hu Useful Addresses: President: Tamás Kolosi, [email protected] General Director: István György Tóth, [email protected] Scientific Director: Tamás Rudas, [email protected] Survey Dept: Matild Sági, [email protected] Data Archive Dept: Zoltán Fábián, [email protected] Office Manager: Katalin Werner, [email protected]