Embed Size (px)
Citation preview

Trunk control in children with cerebral palsy
A reliability study of the Trunk Impairment Scale
Rannei Sæther
Mastergradsoppgave i helsefag, studieretning klinisk nevrologisk
fysioterapi, fordypning barn
Faggruppe for master og PhD- utdanning i helse- og omsorgsfag
Institutt for helse- og omsorgsfag
Det helsevitenskapelige fakultet
Universitetet i Tromsø
Juni 2010

FORORD
Gjennom mange års arbeid med barn med cerebral parese har jeg fått innsikt i at våre
undersøkelser og tiltak bygger på ulike kilder kunnskapskilder. Det utvikles avanserte
undersøkelsesmetoder, som databasert ganganalyse og oppfølgingsprogrammer for barn med
cerbral parese, som tilfører ny kunnskap. Det er en tendens til at det fokuseres på deler av
kroppen, i hovedsak armer og bein. Fokus på undersøkelse av overkroppen kan bidra til at
beslutninger om tiltak kan gjøres på et bredere grunnlag.
Jeg vil takke foreldre og barn som velvillig har stilt opp. Takk til observatørene Toril Fjørtoft
og Sigrun Flækken som satte av tid til gjennomføringen av studien. Toril har også bidratt med
uvurderlig erfaring fra sitt eget metode studie.
Takk til Torarin Lamvik, Siri Brændvik og Ann Kristin Elvrum i Nevroortopedisk team ved
St. Olavs Hospital for et inspirerende og utviklende fagmiljø.
Takk til veilederen min ved Institutt for samfunnsmedisinske fag, Universitetet i Tromsø,
Professor Lone Jørgensen for grundighet og faglig kompetanse, og ikke minst inspirasjon til å
skrive artikkel.
Takk til Klinikk for kliniske servicefunksjoner ved St. Olavs Hospital ved Lise Lundbom
Støylen og Anne Sørlie for permisjoner og fleksibilitet i forbindelse med samlinger i Tromsø,
og takk til NFFs fond for etter- og videreutdanning.
Og sist, men ikke minst, en stor takk til Torbjørn, Even og Guro for tålmodighet og
selvstendighet.
Trondheim, april 2010
Rannei Sæther

Contents
Sammendrag………………………………………………………………………... 1
Abstract……………………………………………………………………………. 2
Abbrevations………………………………………………………………………. 3
Definitions………………………………………………………………………….. 4
1 Introduction………………………………………………………………………... 5
1.1 Background to the study…………………………………………………………… 5
1.2 Decription of the thesis……………………………………………………………... 7
2 Theoretical perspective…………………………………………………………… 8
2.1 Neurobiology……………………………………………………………………….. 8
2.2 Motor control……………………………………………………………………….. 9
2.3 Motor development…………………………………………………………………. 12
2.4 Previous research ………………………………………………………................... 13
2.4.1 Postural control in sitting…………………………………………………………… 14
2.4.2 Postural control in standing and walking…………………………………………… 14
2.4.3 Tests………………………………………………………………………………… 15
2.4.4 Trunk Impairment Scale (TIS)……………………………………………………… 15
3 The aim of the study………………………………………………………………. 16
4 Methodological and methodical considerations…………………………………. 17
4.1 Terminology………………………………………………………………………… 17
4.2 Considerations of measuring in a historical perspective……………………………. 17
4.3 Methodical requirements of a measurement………………………………………… 19
4.4 Reliability and validity associated with measuring instruments…………………… 20
4.4.1 Reliability…………………………………………………………………………… 20
4.4.2 Validity……………………………………………………………………………… 22
4.5 Statistical methods………………………………………………………………….. 22
4.5.1 Intraclass correlation coefficient (ICC)…………………………………………….. 23
4.5.2 Within standard subject deviation (Sw)…………………………………………….. 24
4.5.3 Bland Altman Plot………………………………………………………………….. 25
4.5.4 Cohens kappa……………………………………………………………………….. 26
5 Summary of results………………………………………………………………… 28
6 Discussion………………………………………………………………………….. 28
6.1 Discussion of aspects of the results in a methodical perspective……………….. 28
6.1.1 Relative reliability………………………………………………………………….. 28
6.1.2 Absolute reliability…………………………………………………………………. 29
6.1.3 A discriminating measure………………………………………………………….. 29
6.1.4 Validity……………………………………………………………………………… 31
6.2 Discussion of aspects of the results in a methodological perspective………….... 31
7 Conclusions………………………………………………………………………….. 33
8 Future research…………………………………………………………………….. 34
9 References………………………………………………………………………….. 35
Appendix: thesis…………………………………………………………………….. 41
10 Paper………………………………………………………………………………... 62
References………………………………………………………………………….. 77
Tables/Figures………………………………………………………………………. 81
Appendix: paper…………………………………………………………………...... 87

1
Trunkus kontroll hos barn: En studie av intra og inter- observatør reliabilitet av Trunk
Impairment Scale for barn med cerebral parese
Rannei Sæther, Master i helsefag, studieretning klinisk nevrologisk fysioterapi, fordypning barn. Faggruppe for
PhD -utdanning i helse-og omsorgsfag. Institutt for helse- og omsorgsfag, Det helsevitenskaplige fakultet,
Universitetet i Tromsø
Sammendrag
Barn med cerbral parese (CP) har forstyrrelser knyttet til utviklingen av bevegelse og
kroppsholdning, og de kan ha vansker med å oppnå trunkuskontroll. Trunkuskontroll er viktig
for å kunne bevege hodet og ekstremitetene fritt. Vi trenger gode undersøkelsesmetoder for å
kunne undersøke aktivitets begrensninger som grunnlag for å planlegge intervensjon. Det
finnes så vidt jeg vet ingen standardisert undersøkelse av trunkus kontroll for barn. Trunk
Impairment Scale (TIS), laget for voksne, kan eventuelt benyttes for barn. Målet for dette
metodologiske studiet var å undersøke intra- og inter- observatør reliabiliteten av TIS til barn
med CP. Video opptak av 25 barn, 5 barn uten motoriske vansker og 5 barn på hvert
grovmotoriske klassifiserings nivå fra 1-4, i alderen 5-12 år ble analysert av tre observatører
ved to anledninger. Intraclass correlation coefficient, målefeil, kappa verdier eller prosentvis
enighet og Bland Altman Plot ble kalkulert.
Resultater: Relativ reliabilitet (intra- og inter-observatør reliabilitet) var høy for total- og
subkategoriskår for TIS. ICC [1,1] og [3,1] varierte mellom .96 og 1.00. Kappa verdier for de
ulike del-oppgavene varierte fra .45 til 1.00. Absolutt reliabilitet for parametrene er rapportert.
Bland Altman analysene viste konsistens for skårene.
Konklusjon: Dette studiet av intra- og inter- observatør reliabilitet ved bruk av TIS
demonstrerte høy reliabilitet av subkategoriene og totalskår og moderat til veldig gode kappa
verdier for del-oppgavene. Erfaring i fysioterapi og erfaring med TIS kan ha hatt inflydelse på
målefeil. TIS diskriminerer barna ut i fra grovmotorisk funksjonsnivå. Det synes mest
utfordrende å undersøke barn på grovmotorisk klassifiserings nivå 2, barn med moderat
trukus funksjon. Videre studier bør undersøke validiteten av TIS.
Nøkkelord: Intra- og inter observatør reliabilitet, trunkus kontroll, postual kontroll, barn, cerebral parese

2
Trunk control in children: A study of intra- and inter-observer reliability of the Trunk
Impairment Scale for children with cerebral palsy
Rannei Sæther, Institute of Health and Care Sciences. Faculty of Health Sciences. University of Tromsø.
Abstract
Children with cerebral palsy (CP) have disorders of the development of movement and
posture, and they may have difficulties achieving trunk control. Trunk control is essential for
free and selective movements of the head and extremities. In order to examine activity
limitations to make plans for interventions we need good investigation methods. To my
knowledge, there is no standardized clinical tool available to measure trunk control in
children. The Trunk Impairment Scale (TIS), made for adults, could possibly be used for
children. The aim of this methodological study was to examine the intra- and inter-observer
reliability of the TIS in children with CP. Video recordings of 25 children, 5 children with no
motor impairment and 5 children in each gross motor classification level from 1-4, in the age
group 5−12 years were analyzed by three observers on two occasions. Intraclass correlation
coefficients, within-subject standard deviation, kappa values or percent agreement, and Bland
Altman Plots were calculated.
Results: The relative reliability (intra- and inter-observer reliability) was very high for the
total score and subscale score of TIS. ICC [1,1] and [3,1] varied between .96 and 1.00. Kappa
values for the items ranged from .45 to 1.00. The absolute reliability values for the parameters
are reported. The Bland Altman analysis showed consistency of scores.
Conclusion: The present study of intra- and inter-observer agreement of TIS demonstrated
high reliability of the subscales and the total score, and also moderate to very good kappa
values for the items. Experience in physiotherapy and with TIS may have influenced the
within-subject standard deviation. The TIS appears to discriminate children according to their
gross motor function. It seems most demanding to examine children at gross motor
classification level 2, children with moderate trunk performance. We need further studies to
examine the validity of the TIS.
Keywords: Intra- and inter-observer reliability, trunk control, postural control, children, cerebral palsy

3
Abbreviations
CI Confidence interval
CP Cerebral Palsy
CPG Central pattern generator
GMFCS Gross Motor Function Classification System
GMFM Gross Motor Function Measure
GMPM Gross Motor Performance Measure
HAT Head arm trunk segment
ICC Intraclass correlation coefficient
ICF International Classification System of Functioning, Disability and Health
κ Kappa
NGST Neural Group Selection Theory
Sw Within subject standard deviation
SEM Standard error of measurement
TIS Trunk Impairment Scale
QUEST Quality of Upper Extremity Skills Test

4
Definitions
o Cerebral palsy (CP):
Describes: “a group of disorders of the development of movement and posture,
causing activity limitation, that are attributed to non-progressive disturbances that
occurred in the developing fetal or infant brain. The motor disorders of cerebral palsy
are often accompanied by disturbances of sensation, cognition, communication,
perception and/or behavior, and/or by a seizure disorder”.
o Center of gravity:
is defined as the vertical projection of the center of mass.
o Center of mass:
is defined as a point that is at the center of the total body mass.
o Gross Motor Function Classification System (GMFCS):
The severity and dysfunction in everyday life can be described using the classification
system. It consists of five levels, where children at level 1 have the best function.
o Motor control:
is defined as the ability to regulate or direct the mechanisms essential for movement.
o Postural control:
involves controlling the body’s position in space for the dual purposes of stability and
orientation.
o Synergies:
are neural organizations of sets of elements, the purpose of which is to stabilize a
particular feature of performance.
o Trunk control/ trunk performance:
involves stabilization and selective movements of the trunk in flexion, extension,
lateral flexion, and rotation:
o To stabilize means to find or keep a position.
o Selective movements are controlled, specific and coordinated movements of a
joint or body part in relation to other segments.

5
1. Introduction
1.1 Background to the study
“The computer screen shows (figure 1.) the lower half of somebody walking. From this half of
the body only, we were asked to interpret the walking pattern of the child with cerebral palsy
(CP), in order to make planes for surgery.” This situation briefly summarizes my background
to this study.
Figure 1. From three-dimensional gait analysis
Cerebral palsy (CP) is described as “a group of disorders of the development of movement
and posture, causing activity limitation that are attributed to non-progressive disturbances
that occurred in the developing fetal or infant brain. The motor disorders of cerebral palsy
are often accompanied by disturbances of sensation, cognition, communication, perception
and/or behavior, and/or by a seizure disorder.”1 The disorder covered by the term cerebral
palsy is very heterogeneous and it is one of the most common movement disorders in infancy,
occurring in 2.2 of every 1000 children.2 In this new definition of CP the inclusion of postural
abnormalities, as seen in the clinical picture, is clearly emphasized. The extent of the
problems varies with the degree of disability, from minor dysfunctions in the least impaired to
clearly limited motor control in the most impaired.3 The severity of dysfunction in everyday
life can be described using the Gross Motor Classification System (GMFCS) (Appendix 1),
which contain five levels of severity (level 1 the least affected to level 5 the most affected).4
However, in order to examine why a child’s activity is limited we need good investigation
methods which target the body structure/function, activity, and participation dimension,
according to the International Classification System of Functioning, Disability and Health
6
(ICF).5 During my work as a physiotherapist for many years with children in general and with
children with cerebral palsy in particular, I have experienced, and others have described,6 that
it is particularly difficult for children with CP to achieve trunk control. However, to date, the
investigation of trunk control seems to have received little attention.7 If we ignore certain
parts of the body, our investigations might lead to wrong decisions. My concern for this is
described initially.
Performing everyday activities requires flexible control of posture, meaning that we
continuingly have to control the position of either parts of our body or the whole of our body
in an often changing environment.3 Postural control involves controlling the body’s position
in space for the dual purposes of stability and orientation, and is a basis for all components of
movements.8-10
Trunk control is defined as a part of postural control.10
Trunk control involves
stabilization and selective movements of the trunk. This stabilization is essential for free and
selective movements of the head and the extremities.11
Trunk control, as a part of postural
control, is a prerequisite for adequate mobility. It is thus of great importance to understand the
postural problems in children with CP. The term “postural control of the trunk” has been used
in some research,12
but in this thesis the terms trunk control and trunk performance are used
interchangeably.
Clinical scales can be of great value for both therapists in clinical practice and in research to
identify problems, exchange communication, and monitor progress. The choice of a measure
will depend on their administrative demands, the acceptability to patients, and ease of
interpretation.13
To my knowledge, there is no standardized clinical tool available to measure
trunk performance in children with CP. The Trunk Impairment Scale (TIS) was developed to
measure motor impairment in adults after a stroke.14
The test assesses static and dynamic
sitting balance and trunk coordination. The TIS seems relevant also for children with CP, due
to their postural abnormalities.
In this study, I wish to shed light on the clinical examination of trunk control by examining
whether TIS, developed for adults, can be used for children with cerebral palsy. The first step
7
is to perform a methodical study to determine whether the test is accurate, consistent, and
stabile when applied to children with cerebral palsy.
1.2 Description and structure of the thesis
This thesis focuses on a study of trunk control in children with CP, which is presented in the
paper “Intra- and inter-observer reliability of the Trunk Impairment Scale for children with
cerebral palsy” in the last section of the thesis. The paper constitutes the main part of this
thesis and is planned to be submitted to the journal Physical Therapy. It has therefore been
written in accordance with the journal’s guidelines (Appendix 2). It is recommended that
readers first read the paper in order to gain an overview of the study.
The first section of the thesis deals with theoretical perspectives related to the study. First, the
theoretical perspectives related to trunk control are described. The theory describes
neurobiology, motor control, and motor development. I further refer to previous research in
the field, such as research of postural control and measuring instruments for children with CP.
In the next section I expand upon the methodological and methodical considerations. The
section contains considerations of measuring in a historical perspective, the methodical
requirements of a measure, and the statistical method used in this study. A short presentation
of the main results of the study follows, with a discussion of the results from different
perspectives. Finally, there is a conclusion and thoughts on the need for further studies.

8
2. Theoretical perspective
This chapter describes first some neurobiological aspects of postural control and trunk control
and second the neurobiological aspects of the deficits associated with CP. Further theoretical
models for motor control and motor development related to postural control are described. I
then focus on some studies of postural control in children with CP and the importance of
trunk control in general, and some comments are made on available tests to assess motor
function in children with CP. Finally, the TIS is described.
2.1 Neurobiology
The human body is poorly adapted to vertical balance. It has a high center of gravity, it
consists of many moving segments on top of each other, and has a small support surface.9
Postural control involves controlling the body’s position in space for the purposes of stability
and orientation.15
Postural orientation is defined as the ability to maintain an appropriate
relationship between the body segments and between the body and the environment for a
given task.15
In the process of establishing a vertical orientation, we use multiple sensory
references, including gravity (the vestibular system), the support surface (somatosensory
system), and the relationship of our body to objects in the environment (visual system).9,10,15
Postural stability, also referred to as balance, is the ability to control the center of mass in
relationship to the base of support. Normal postural control is flexible and highly task and
context dependent. Postural control depends to a large degree on neural networks in the brain
which process the different types of sensory information continuously.9,10,15
It is an active
process, where the control system continually probes the limits of stability on the basis of
continuous feedback and feedforward information. Feedback control refers to postural control
in response to sensory feedback from an external perturbation.15
Feedforward control refers to
postural responses that are made in anticipation of a voluntary movement that is potentially
destabilizing in order to maintain stability during the movement.15
Complex tasks such as
whole body motion are characterized in particular by center of mass location and trunk
orientation.16
The system of postural control develops many years after birth, and the patterns
of postural adjustments seen in adulthood are not seen before adolecenscence.16,17

9
Children with CP may have disturbances in both their motor and sensory systems.
Disturbances in the motor system may result in muscle weakness, abnormal muscle tone,
coordination problems, and involuntary movements.18
The corticospinal paths that provide the
trunk may be affected.19
The venteromedial systems of these paths influence motoneurons that
innervate proximal and axial musculature.10
This may affect the role of the trunk in postural
control. Mayston6 highlights that increased survival of extremely preterm or term children
with server asphyxia, which leads to increased risk of CP,20-22
has resulted in children who
seem to have a low tone and proximal weakness, especially in the trunk, with increased tone
in the lower limbs. Instability of the trunk may lead to reduced alignment and limited postural
repertoire.6
Sensory information is required for postural control. It originates (as described above) from
vision, the vestibulum, proprioceptive, and cutaneous receptors. Each type of sensory
information has its own effect on postural control and the effects of the various sources of
sensory information vary with age.3 Children with CP frequently show visual deficits (poor
visual acuity, reduced visual fields) and deficits in the processing of visuospatial information.
Children with CP may also have problems with propriception, for example in the detection of
passive movements and in the sense of position of body parts. In children with spastic CP, the
motor units are oversensitive to information of the proprioceptors dealing with stretch of the
muscle. This means that in children with CP a discrepancy exists between segmental and
central processing of proprioceptive information. Only a few studies address the effect of
sensory information on postural control in children with CP.3
2.2 Motor control
Motor control is defined as the ability to regulate or direct the mechanisms essential to
movement.23
It addresses questions such as how does the central nervous system organize the
many individual muscles and joints into coordinated functional movements? Such questions
are of interest in order to understand the underlying factors of trunk control. Different theories
of motor control reflect philosophically varied views about how the brain controls movement.
Such theories often reflect differences in the option about the importance of various neural

10
components. There are several theories of motor control: reflex theory, hierarchical theory,
motor programming theories, system theory, dynamic action theory, and ecological theory.23
In this thesis, elements from both program theory and system theory are described to illustrate
aspects of postural control in children with CP. Postural control is situation specific24
and
considered as a element in motor control,15
while trunk control is considered to be part of
postural control.10
The program theory is relevant because a “functional model of postural
control” has been developed called “the central pattern generator model.” In system theory the
description of muscle synergies is essential for the organization of “functional levels of
postural control.” This will be described in the following.
Motor program theory has been used in a number of ways by different researchers, and hence
care should be taken in determining how the term is used. The motor program may be used to
identify a central pattern generator (CPG), which is a specific neural circuit that generates
rhythmical movement. In general, CPG activity is used to describe the neural organization of
rhythmical movements. The term is also associated with higher level motor programs that
represent action in more abstract terms. The concept is more flexible than the concept of a
reflex because it can either be activated by sensory stimuli or by central processes.23
Bernstein, who also participated in the development of motor program theories, looked at the
nervous system and the body in a new way, and contributed to the development of system
theory.23
He recognized that one cannot understand the neural control of movement without
an understanding of characteristics of the system in which one is moving and external and
internal forces acting on the body. System theory takes into account not only the nervous
system’s contribution to action, but also the contribution of the muscular and skeletal systems,
as well as forces of gravity. Movement emerges from the interaction of three factors: the
individual, the task, and the environment. Movements are organized around both task and
environmental demands. Postural control requirements thus vary with the task and
environment.23
Bernstein was the first to realize that the central problem of motor control,

11
including postural control and trunk control, was organizing the redundant sets of elements,
muscles and joints in task-specific ways. He suggested that the motor problem posed by
excessive degrees of freedom might be solved by organizing the elements into synergies.23
Synergies have been defined as neural organizations of sets of elements with the purpose of
stabilizing a particular feature of performance.16
Forsberg and Hirchfeld25
developed a functional model of the organization of postural
control, during externally trigged perturbations studies in sitting adults. This model, called the
CPG model, may be useful for discussing development of postural control.26
The CPG refers
to neural networks coordinating the activity of many muscles, described in motor program
theory. The activity level in the networks is controlled by reticulospinal neurons, and afferent
input results in a modulation of the output pattern. Essential to the CPG model for postural
adjustments is its organization of two functional levels of control.26-28
These levels can be of
interest when investigating trunk control in children with CP.
The first level consists of a network which coordinates the basic structure of postural
synergies. At this level, direction-specific synergies are performed. This means that a forward
sway induces activity in the muscles on the dorsal side of the body, while backward sway
induces activity in the muscles in the ventral muscles, and a similar synergy is present in the
frontal plane. It has been hypothesized that the basic structure of postural synergies is
generated by the above mentioned spinal networks. To counteract a perturbation in a specific
direction, there is a repertoire of direction-specific adjustments patterns which are activated in
terms of muscle recruitment.26
The second level of control is involved in the fine tuning of the basic pattern of adjustment on
the basis of multisensory afferent input from somatosensory, visual, and vestibular systems.
Modulation can occur by means of: 1) the selection of the best-fitting muscle activation
pattern out of the repertoire of direction specific-patterns; 2) the recruitment of antagonist

12
muscles; 3) the recruitment order of the direction specific muscles; and 4) the degree of
contraction of the direction-specific muscles.26
2.3 Motor development
Concurrent with changes in insight into the neural mechanisms involved in motor control,
knowledge on motor development decreased.26
Motor development was initially regarded as
an innate, maturational process, described in Neural-Maturationist Theories, but gradually it
became clear that motor development is also affected by experience. To what extent
experience affects motor development is still a matter of debate.26
This is reflected by two
theoretical frameworks which are most frequently used today:26,29
the Dynamic System
Theory, which assigns a dominant role to experience, and the Neural Group Selection Theory
(NGST), in which genetic endowment, epigenic cascades, and experience play equally
prominent roles.26
In this thesis the NGST is emphasized to facilitate the understanding of the
development of postural control and contribute to understanding of the effects of brain
damage at an early age.
In a maturationist perspective behavioral patterns are seen as emerging in an orderly genetic
sequence, and this has resulted in general developmental rules, such as the cranial-caudal and
proximal-to-distal sequences of development.29
This in turn characterized physiotherapy
treatment, which tried to achieve proximal before distal control. The trunk is described as a
“key area”, and an area of “core stability”.10
Systems theory have shown that development
also can be from distal to proximal. A child may, for example, succeed when reaching out for
a toy, when it has help in the form of external stability. The distal competence is hidden due
to lack of postural control. This and other observations have led to the assumption that
postural control is a limiting factor in early motor development.29
The NGST introduced by Edelman explains the variation in motor development on the basis
of experience and selection.27-29
Healthy infants show great variation in spontaneous
movements. During the phase of primary variability the neural system explores all motor

13
possibilities available for a function. This phase is characterized by variability, but non-
adaptive behavior. At a certain point in time the nervous system starts to use the afferent
information produced by behavior and experience for the selection of motor behavior which
fits a given situation best. This is followed by the phase of secondary variability. The
selection process is based on active trial-and-error experiences which are unique to the
individual. Forsberg and Hirchfeldt25
find support for their functional model for the
organization of postural control in Edelman’s theory when they describe the organization on
the two levels, the direction-specific response pattern and the fine-tuning response pattern, as
described above. From birth to six months there is a phase of primary variability in direction-
specific adjustments and from six months onwards there is a phase of secondary variability in
which children learn to adapt postural activity.30
Postural problems, including problems of trunk control,6 play a central role in the motor
dysfunction of children with CP.1 In general, children with CP can produce direction-specific
postural muscular activity, and the first functional level is intact. Only children with severe
CP, GMFCS level 5, who cannot sit independently, totally lack these adjustments. Two
explanations for this are suggested: 1) the postural synergies cannot be programmed, and 2)
the sensory pathways cannot elicit activity in synergies. A parietal loss of direction-specific
adjustments at the level of the hip was found in children at GMFCS level 4 and in young
children at level 3.31
The most frequent dysfunctions in children with CP are related to the second functional level,
in the adaption of postural muscular activity, the fine-tuning of the basic direction-specific
adjustments to environmental conditions based on experience and sensory information from
somatosensory, visual, and vestibular systems.26
Typical characteristics of movements in
children with CP are a top-down recruitment of postural muscles, excessive degree of
antagonist co-activation, and lack of modulation to task-specific constraints.31
2.4 Previous research

14
2.4.1 Postural control in sitting
Postural control in sitting has not been studied as much as postural control in standing.
Postural control is fundamental to sitting balance, and important for independence in daily
living skills. The acquisition of sitting balance has proven to be a predictor of function in both
children and adults with neurological damage.32
Studies have shown that achieved sitting
balance before two years of age can predict walking in children with all forms of CP.33,34
Graaf-Peters35
and Van der Heide36
have tried to create an overview of knowledge about
muscular dyscoordination underlying postural problems in children with CP. Van der Heide37
describes this in the GMFCS levels, where level five is missing direction-specific adaptation,
while some children at level four have intact direction-specific adaptation. At levels one to
three the basic level of control is intact, but also here one sees a stereotype pattern, in which
all direction-specific muscles are activated. A direction-specific adaptation is found in one
month old infants, and it is assumed that the basic level of postural control with direction
specific adaptation is innate.36
Assaiante38
investigated postural control in children with
normal development and mentions the trunk as an initial frame of reference for postural
control. Several researchers have examined postural sway in children with CP, and found that
children with CP showed a greater degree of postural sway than children who develop
normally.39-41
Children with CP also have a longer latency before starting muscle activation42
,
they have reduced reactive control and need longer time to stabilize balance.43
Children with
unilateral spastic CP can modulate the degree of postural muscle co-contraction on the basis
of sensory information to some extent, but they do not use sensory information which
originates from the trunk.44
Several researchers have investigated the correlation between
postural stability and hand function, and found that children with CP differ from healthy
children.45-47
Various aspects of the sitting position in children with CP have also been
investigated.42,44,48
2.4.2 Postural control in standing and walking
The head, arm and trunk segment (HAT) account for two-thirds of the total body mass.
Studies show that during steady-state walking the HAT segment’s primary task is to control
balance. The trunk and hip muscles play an important role in this respect.49
The trunk has a
control function during gait,50-52
it plays an important role in navigation,53
minimizes the

15
vertical displacement of the upper body, and weakens the time related fluctuations in head
movements.54
These examples shed light on the role of the trunk in ensuring an upright
position during walking, and reinforce the general view that the upper body should not simply
be described as a “passive passenger unit during gait.”50
The kinematics of the trunk can be
complementary to the kinematics in the legs, such as when the trunk is oriented secondary to
foot position or vice versa.55
Some studies have been conducted on gait analysis with full
body marker sets of children. In these studies it has been concluded that this analysis provides
a better understanding of compensatory mechanisms for pathological walking.56-59
It has been
concluded that the movement of the trunk should be included in the study of gait asymmetry
among stroke patients.60
2.4.3 Tests
The global assessment of postural control and balance forms an integral part of the standard
neuropediatric examination.26
The Gross Motor Function Measure (GMFM)61
for children
with CP assesses achievement of gross motor abilities, but it does not supply information on
the nature or origin of postural dysfunction. Two complementary measuring instruments are
available to measure movement quality in children with cerebral palsy: Gross Motor
Performance Measure (GMPM)62
and Quality of Upper Extremity Skills Test (QUEST).63
Both of these are time consuming tests to perform.64
Recently, two measures have been
developed for the assessment of balance in children with motor impairment, the Pediatric
Balance Scale65
and Pediatric Reach Test.66
These tests aim to evaluate balance performance
in sitting and standing, however they do not evaluate trunk performance specifically.
2.4.4 Trunk Impairment Scale
The TIS was developed by Verheyden et al., and aims to evaluate the trunk in patients who
have suffered a stroke.14
The TIS assesses static and dynamic sitting balance and trunk
coordination in a sitting position (Appendix 1 in the paper). The static subscale investigates:
1) the ability of the subject to maintain a sitting position with feet supported; 2) the ability to
maintain a sitting position while the legs are passively crossed, and 3) the ability to maintain a

16
sitting position when the subject crosses their legs actively. In the present study, the children
crossed their strongest leg over their weakest leg. The dynamic subscale contains items on
lateral flexion of the trunk and unilateral lifting of the hip. To assess the coordination of the
trunk, the subject is asked to rotate the upper or lower part of his or her trunk 6 times,
initiating the movements either from the shoulder girdle or from the pelvic girdle,
respectively. For each item, a 2-, 3- or 4-point ordinal scale is used. On the static and dynamic
sitting balance and coordination subscales the maximal scores that can be attained are 7, 10
and 6 points. The total score for the TIS ranges between 0 for a minimal performance to 23
for a perfect performance.
3. The aim of the study
Children with CP have disorders of the development of postural control. Performing everyday
activities requires a flexible control of posture, including trunk control. Clinical scales can be
of great value in clinical practice to identify problems, exchange communication, and monitor
progress. The Trunk Impairment Scale has been developed to measure motor impairments
after a stroke in adults. To my knowledge, there is no clinical tool available to measure trunk
control in children with CP. For such a tool to be useful, it would have to be reliable
(accurate, stabile, and consistent). The aim of this methodical study was to examine the intra-
and inter-observer reliability of the Trunk Impairment Scale in children with CP.

17
4. Methodological and methodical considerations
This chapter describes and discusses the terms methodological and methodical, considerations
of measuring in a historical perspective, methodical requirements of a measurement,
reliability and validity associated with measuring instruments, and the statistical methods used
in this study.
4.1 Terminology
The term method covers the procedures used in research in the collection and processing of
data. Thornquist67
claims that a method cannot stand alone but must be anchored in a
philosophy of science perspective. The term methodological is a wider scientific theoretical
framework for method. There is a connection between the reflections of what reality is,
ontology, and how scientists can provide relevant and valid scientific knowledge about this
reality, epistemology.67
4.2 Considerations of measuring in a historical perspective
Measurement is the systematic process by which things are differentiated. This definition
emphasizes that measurement is not a random process, but one that proceeds according to
rules and guidelines.68
Thornquist67
focuses on how the kind of research we do depends on our understanding of
movement and our view of the human being and the body. History informs us that the view of
the body and knowledge has evolved through the ages. The crucial question has been how we
can obtain “curtain/truth” knowledge.69
In Western scientific traditions the physicist and
astronomer Galilei (1564–1642 BC) initiated the scientific age, and is renowned for his
studies of motion. Throughout the experiment he believed to be in control of all relevant
factors. He achieved this by isolating and idealizing the phenomenon he studied.69
Rational
conclusions derived from observations.70
The philosopher Descartes (1596–1650 BC)
represented rationalism and is regarded as the founder of modern science. His main concern,

18
too, was to ascertain “certain/truth” knowledge. For Descartes, the body was part of the
mechanical world. The body was regarded as “matter” and the soul as “mind”. He tried to
explain the world, including the body, by dividing it into parts and then reconstructing its
properties out of the parts.67
In the 1700s came empiricism, where experience was related to
the measurable, namely that which can be counted and weighed. The method used was
observation under controlled conditions. Observations were considered to be independent of
experience and theory. Neutrality and objectivity were maintained as a cardinal sign of
science.67
Phenomenology, founded by Hussel (1859–1938) represented a different direction
to the epistemological dualism. The philosopher Maurice Merleau-Ponty (1907–1961)
developed the phenomenology further, and related the human subject status to the body. In
this perspective the body is not only an object, but is also always an experienced bodily
subject. Phenomenology stands in contrast to an emphasis on scientific and intellectual
reflection on the cost of life experience, common sense and practical experience.67
Through examination of the reliability of a measuring instrument both children and observers
made objects. The term instrument can be linked to the described “machine model,” where
one looks for parts that can be “repaired.” In this study, the trunk (a part of the body) is in
focus. This can be considered as a reductionist approach, where everything can be examined
piece by piece. The use of a standardized measurement does not exclude placing it in a
holistic perspective. The extent to which a standardized examination of trunk performance can
be useful depends on the reasons for using it and how the results are interpreted. If our
working methods are based on tests only, we may risk losing experience-based knowledge.
Thus, using both types of knowledge seems reasonable. In recent years “evidence-based”
work has been in focus. “Evidence-based” is described as “knowledge-based.” There is
disagreement in the debate about the interpretation of what valid knowledge is and what
methods are appropriate for “knowledge-based” approaches.71
In rehabilitation, professionals use measurements to help them decide what is wrong with
their patients, how to intervene, and when to discontinue treatment. In fact, some investigators
focus the majority of their research on the evaluation of rehabilitation measures. Knowledge

19
about the usefulness of measurements is not reserved for research specialists; clinicians also
need to understand the meaning and usefulness of the measurements they use. In turn,
usefulness depends among other things on reliability.68
4.3 Methodical requirements of a measurement
Measures are developed for different purposes, such as discrimination, prediction and
evaluation.72
Discriminating measures discriminate among clients on a particular construct,
predicting measures predict an outcome in the future based on the results of measuring a
construct at an earlier point of time, and evaluating measures measure change over time in an
individual or group. The measurement properties of these different measures will be used to
emphasize different strengths to suit their purposes. A discriminative measure should
emphasize good cross-sectional validity, whereas a predictive measure should have good
predictive criterion validity, and a evaluative measure should have good test-retest reliability,
longitudinal construct validity, and responsiveness.72
These qualities are described below.
Another issue is language and cultural adaptions to outcome measures. This should be
considered when using a measure in a setting that differs from the one in which it was
developed.72
There are two basic frameworks in which measurements are conducted and
evaluated: norm referenced and criterion referenced. Norm referenced frameworks are those
used to judge individual performance in relation to group norms. Criterion referenced
frameworks are those in which each individual’s performance is evaluated with respect to
some absolute level of achievement.68
When investigating the responsiveness of an outcome
measure we are usually interested in its sensitivity to true, clinically meaningful change.13
The
responsiveness of an outcome measure cannot be evaluated separately from its reliability,
since changes in average scores on the measure can only be attributed to true clinical change
if we can be confident that the outcome measure is stable, i.e. that it will not change unless
there is no true clinical change. The level of sensitivity required depends on the range of
values we may expect and the goal of assessment. Increased sensitivity of an outcome
measure is often achieved at the expense of reliability and simplicity. The choice of a measure
will depend on its administrative demands, its acceptability to patients, and its ease of
interpretation.13

20
4.4 Reliability and validity associated with measuring instruments
Reliability is the “degree to which test scores are free from errors of measurement.” Other
terms that are similar to reliability are accuracy, stability, and consistency.68
Reliability is a
necessary, but not sufficient, condition for validity. Measurement validity is the
“appropriateness, meaningfulness and usefulness of the specific interferences made from test
scores.”68
An unreliable measure is also an invalid measurement, because measurements with
a great deal of error have little meaning or utility. A reliable measure is valid only if, in
addition to being repeatable, it provides meaningful information.68
In the following, reliability
and validity will be discussed further, with extra emphasis on reliability.
4.4.1 Reliability
Two basic measurement theories, classical measurement theory and generalizability theory,
referred to by Domholdt,68
provide different views on reliability. Classical measurement
theory rests on the assumption that every measurement, or obtained score, consists of a true
component and an error component. Because we can never know the true score for any
measurement, the relationship between repeated measurements is used to estimate
measurement errors. The classical theory has been extended to generalizability theory, which
recognizes that there are different sources of variability, such as the tester, the test, the subject
being tested, and extraneous factors for any measure, and it aims if possible to differentiate
between sources of measurement error. There are several components of reliability:
instrument-, intra-rater-, inter-rater-, and intra-subject- reliability.68
In this study the intra-
observer-/intra-rater reliability and the inter-observer-/inter-rater reliability are assessed.
Intra-observer reliability is “the consistency with which one rater assigns scores to a single
set of responses on two occasions.”68
By definition, inter-observer reliability holds that it is
the “consistency of performance among different raters or judges in assigning scores to the
same object or response. It is determined when two or more groups of raters judge the
performance of one group of subjects at the same point in time.”68
Reliability is quantified in two ways, and researchers68,72,73
refer to relative reliability and
absolute reliability. Relative reliability examines the relationship between two or more sets of

21
repeated measures. It is based on the idea that if a measurement is reliable, individual
measurements within a group will maintain their position within the group on repeated
measurement. Relative reliability is measured with some form of an intraclass correlation
coefficient (ICC),68
reflecting the relation of variability caused by measurement error to total
variability in data.74
The choice of method for statistical analysis is determined, among other
things, on the basis of the chosen measurement scale. For example, for methods of
measurement with categorical data Cohen’s kappa statistics are often used,75
while for
methods of measurement with an interval or “range” scale, ICC statistics are often used.76
Both forms of analysis are used in this study.
It is known that a correlation coefficient of 1.0 indicates a perfect association between
repeated measures. However, it is not easy to determine how much less than 1.0 the
coefficient can be to still be considered as reliable.68
According Domholdt,68
it might depend
on what the measurement instrument is used for, such as whether it requires high accuracy or
whether a wide screening is sufficient. Munro describes the strength of correlation
coefficients as follows: .00 – .25, little if any correlation; .26 – .49; low correlation; .50 – .69,
moderate correlation; .70 – .89, high correlation; and .90–1.00, very high correlation.77
Due to
the limitation of determining relative reliability with correlation coefficients, often researchers
should supplement relative information with absolute reliability.68
Absolute reliability is reported in units of the scale applied, and is typically used to estimate
the extent to which a score varies on repeated measurements (observations) for the same
subject.68
Several measurements of the same quality on the same subject will not, in general,
be the same, according Bland and Altman.78
This may be due to natural variations in the
subject, variations in the measurement process, or both. If the child has a “true” average value
over all possible measurements, repeated measurements on the same subject will vary around
the true value as a consequence of measurement error. The standard deviation of repeated
measurements of the same subject enables us to measure the size of the within-subject
deviation (Sw),79
also called the standard error of measurement (SEM).80
In this study,
absolute reliability, Sw, was calculated for the sitting balance subscale and the total TIS score.

22
To clarify the terms, Kirkwood79
describes that the standard deviation1 of the sampling
distribution is (as mentioned) called the standard error,2 and is equal to the standard deviation
of the population divided by the square root of n. This means that approximately 95% of the
values in this theoretical sampling distribution of sample means lie within two standard errors
of the population mean. This fact can be used to construct a range of likely values for the
(unknown) population mean, based on the observed sample mean and its standard error. Such
a range is called a confidence interval.
4.4.2 Validity
Validity is not an all or none property but rather a matter of degree, and a measure’s validity
will constantly evolve as new information becomes available. Validity has been divided into
face validity, content validity, construct validity, and criterion validity.72
Face validity considers whether a measure appears to be measuring what it is intended to
measure. Content validity exists to the extent that a measure is composed for a comprehensive
sample of items that completely assesses the domain of interest. Criterion validity examines
the extent to which a measure provides results that are consistent with a gold standard.
Construct validity involves forming theories about the attribute of interest and then assessing
the extent to which a measure under investigation provides results that are consistent with the
theories.72
Internal validity is the evaluation of other possible explanations for changes in the
dependent variable and external validity is concerned with whom, in what setting, and at what
time the results of research can be generalized.81
4.5 Statistical methods
1 The standard deviation measures the amount of variability in a population
2 The standard error (= standard deviation/ √n) measures the amount of variability in the sample mean; it
indicates how closely the population mean is likely to be estimated by sample mean

23
Statistical methods, which constitute a separate mathematical discipline, are used to establish
the reliability of the TIS for children with CP. What is interesting about statistics is on the one
hand the acceptance of uncertainty, while on the other hand it seeks to control it.69
In this
study ICC and Cohen’s kappa are used for the calculation of relative reliability, within
standard subject deviation (Sw) for the calculation of absolute reliability, and Bland Altman’s
plot for verifying the consistency of measurement graphically. These methods will be
explained in the following.
4.5.1 Intraclass correlation coefficient (ICC)
To assess the degree of agreement in scorings between and within the observers and
measurement errors, intraclass correlation coefficients (ICC) for the sitting balance subscale
and total TIS score were used. ICC [1,1] statistics were used because the observers had been
strategically chosen. This model assumes all within-subject variability to be an error of
measurement. In ICC [3,1]) the effect of any systematic shift is not considered part of the
error of measurement. When no systematic error is present, ICC [1,1] = ICC [3,1].82
For this
reason, both models are used in this study.
The ICCs are a family of coefficients that allow comparison of two or more repeated
measures or observations, and the coefficient expresses the degree of agreement between
measurements.83
An ICC is a ratio between the true variance and the total variance, where the
true variance is the difference between the total variance and the variance due to error of
measurement. The technique depends on repeated measures analysis of variance (ANOVA).
There are at least six different ICC formulas,3 and the issue of which one to use in a particular
calculation has led to considerable confusion.83
In addition to being able to handle more than
two repeated measures, an ICC is thought to be a better measure than Pearson’s correlation
coefficient because it accounts for absolute as well as relative reliability. It takes into account
“level” differences, but is not a true measure of concordance and one should still report the
3 The six forms are: (1,1), (2,1), (3,1) (1,k), (2,k), and (3,k)

24
results of an absolute reliability indicator, such as the Sw. A precondition of performing an
ICC analysis is that data are normally distributed.83
A reliability coefficient may at first seem relatively easy to interpret: the closer to 1, the
greater the reliability is. However, interpretation is not that simple, as the coefficient is only
based on one selected sample.84
Relative reliability is particularly useful for comparison
between measures with different scales, but applied on the same sample.74
In addition, an ICC
cannot be interpreted clinically because it does not give any indication of the magnitude of
disagreement between measurements. It should therefore be supplemented (as mentioned
above) with calculation of the Sw and/or Bland and Altman 95% limits of agreement. A major
criticism of the ICC method is the influence of between subject variance on the ratio. If the
true score variance is large, reliability will always appear to be high and vice versa. Hence, for
a group of subjects with a wide range of total TIS scores, the ICC is likely to be greater than
for a more homogeneous sample.84
4.5.2 Within standard subject deviation (Sw)
In addition to relative reliability it is recommended that the absolute reliability expressed as
Sw is investigated.68,78
This was done in this study. Absolute reliability is (as described
above) used to estimate the extent to which a score varies on repeated observations for the
same observer. Bland and Altman78
describe that there are natural variations in subjects,
variations in the measurement process, or both. In the present study, there was no variation
found in the children because video-clips of one measurement of each child were observed
twice.
The standard deviation of repeated measurements by the same observer enables us to measure
the size of the measurement error. To obtain the common standard deviation we average the
variances, the squares of the standard deviations.78
When calculating the Sw for the overall
total TIS score for observer A-B-C in this study, the mean within-subject variance was .987.
Sw was estimated by the √ .987, and the Sw = 0.99. Sw is reported in units of the scale

25
applied, and the Sw is 0.99 points of the scale 0–23. The calculation is made using a program
that performs one way of variance. Approximately 96% of the time the true total TIS score for
observer A-B-C was within 2 Sw or ± 1.98 points of the original measure, which equals 3.96
points on the scale 0–23. For repeated measurements √2 x 1.96 Sw or 2.77 Sw were
calculated. The difference between an observer’s measurement and the true value was
expected to be less than 2.77 Sw for 95% of the observations. To make meaningful statements
about whether a child’s condition has changed, we must know how much variability in scores
can be expected due to measurement error.78
4.5.3 Bland Altman Plot
In this study the consistency of measurements was verified graphically using the Bland and
Altman method for the total score of the TIS. This is described as a method to assess
agreement between clinical measurements/observations. The approach is based on the
analysis of differences between measurements. The extent of agreement can be examined by
plotting differences between pairs of measurements on the vertical axis against the mean of
each pair on the horizontal axis. 95% limits of agreement are plotted, given by the mean
difference plus or minus twice the standard deviation of the differences. If differences are
normally distributed, 95% of them will lie within this range.79
In this study the Bland and
Altman plot is used to visualize both the intra- and inter-observer reliability. In Figure 2,
which shows the intra-observer agreement for observer A, the mean of the differences is 0.4,
the standard deviation is 1.72, and the 95% limits of agreement range from −3.44 to 3.36.
Bland and Altman80
state that the plot of difference against the mean allows us to investigate
any possible relationship between the measurement error and the true value. We do not know
the true value, and the mean of the two measurements is the best estimate we have.
Bland and Altman method has two advantages in comparison to the ICC method: the
powerful visual representation of the degree of agreement, and the easy identification of bias,
outliers, and any relationship between the variance in measures with the size of the mean. A
disadvantage is that the analysis is more complex if there are more than two raters or data
sets, in which case mean measures or data then need to be transformed.84

26
Figure 2. Bland Altman plot of agreement of first and second observations for observer A
4.5.4 Cohen’s kappa
To assess the degree of agreement in scorings between and within the observers of the items
of the TIS, Cohen’s kappa statistics were used. This was done in pairs and between all
observers. The kappa correlation coefficient adjusts the agreement percentage to account for
chance agreements.83
The simplest approach to assessing agreement is to see how many exact
agreements were observed.75
Table 1 shows the agreement in a symmetrical two-way table of
static balance subscale, item 3, for observers B and C, which here are 5+1+9+9 = 24. There is
thus agreement for 24/25= 0.96 (96%) of the items. A weakness in this calculation in that it
would be reasonable to expect some agreement between observers by chance. The expected
frequency in a cell in a frequency table is the product of the total of the relevant column and
the total of the relevant row divided by the grand total.75
The expected frequencies along the
diagonal in this example are (Table 1):
Table 1. Symmetrical two-way table of static balance subscale, item 3 of the TIS, observers B and C
TIS, static balance subscale, item 3, observer C
0 1 2 3 Total
TIS, static balance subscale, item 3, observer B 0 5 1 0 0 6
1 0 1 0 0 1
2 0 0 9 0 9
3 0 0 9 9 9
Total 5 2 9 9 25
6 x 5/25 = 1.20
1 x 2/25 = 0.08
9 x 9/25 = 3.24
9 x 9/25 = 3.24
Total = 7.76

27
The number of agreements expected by chance is 7.76, which as a proportion of the total is
7.76/25 =0.31. How much better were the observers than 0.31? The maximum agreement is
1.00, and the possible scope for doing better than chance is 1.00 - 0.31. We can calculate
agreement as: κ = Po4- Pe
5/ 1 - Pe = 0.96 - 0.31/ 1.00 - 0.31 = 0.94. The name of this measure
is kappa (κ). It has a maximum of 1 when agreement is perfect, while a value of zero indicates
no agreement better than chance agreement. Guidelines prepared by Landis and Koch85
should help in interpreting values between 0 and 1. The reduction of the data to a single
number inevitably yields an answer that is not very meaningful without the examination of a
table of frequencies.75
There are, according Altman,75
difficulties associated with the use and interpretation of κ
values. The value of κ depends on upon the proportion of subjects (prevalence) in each
category. The consequence of this property is that it is misleading to compare values of κ
from different studies where prevalences of the categories differ. For some of the items in this
study κ values could not be calculated, and for these items percent of agreement was
calculated instead.
4 Po is expected agreement
5 Pe is expected agreement on the basis of chance

28
5. Summary of results
The present study of intra- and inter- observer agreement of the TIS for children with CP,
GMFCS levels 1–4, in the age group 5–12 years, demonstrated high reliability. The reliability
of both the subscales and the total score was high. Moderate to very good κ values for the
items were found. Experience in physiotherapy and with the TIS may have influenced the Sw.
The TIS appears to discriminate between children according to their gross motor function. It
seems most demanding to examine children at GMFCS level 2, with moderate trunk
performance.
6. Discussion of the results
6.1 Discussion of aspects of the results in a methodical perspective
6.1.1 Relative reliability
A very high correlation coefficient showed that the relative reliability of the TIS was very
high. This means that the observers must have maintained their relative positions in the group
almost perfectly on repeated measurements.68
The consistency of measurements was verified
graphically using the method developed by Bland and Altman. It has been claimed that the
interpretation of correlation coefficients should not extend beyond the range of the original
data.77
In this study the Bland Altman plot shows that correlation coefficient could be
interpreted in the whole range of the scale for children with moderate trunk performance, but
with some caution in the middle range of the scale.
One explanation for the high reliability may be that this group of children had a wide range of
total TIS scores, and the ICC is likely to be greater than for a more homogeneous sample.68,84
The children included in this study were children with CP, classified in GMFCS levels 1–4,
which can be characterized as a heterogeneous sample. Some children with no motor
impairment were also included to ensure differences in trunk performance. This contributed to
sufficient variability in the variables to demonstrate a relationship. According to Domholdt,77
if variables have a restricted range, the correlation coefficient will be artificially low and
uninterpretable. The high degree of standardization of the study might also have contributed

29
to high correlation coefficients. By using video recording we ensured that the variability is not
due to variability in a child’s performance or the instructions given to the children. Rather, the
variation is due to the observers and how the observers used the TIS scale. This is considered
to be a strength if one wishes to find out whether a test is applicable to a different group of
subjects than that it was developed for. A reliability study conducted in a clinic might give
different results. In a clinical setting there will be several factors influencing the outcome. A
study with another degree of standardization might be appropriate for further studies. The
standardization in this study consisted also of organization of the environment to avoid
external disruptive elements. The observers were located in a separate locked room with a
video screen. The test consisted of a manual with descriptions of the qualities of movements,
and the observers could see the same quality of movement several times. To ensure that the
children had understood the tasks, instructions for the TIS were prepared and some tasks were
visualized. The observers had thorough training in the test by observing children without
motor impairment and children with CP at different GMFCS levels. This was to ensure that
the scoring did not change during the study as a consequence of developed experience with
the test. The results of the calculation of ICC [1,1] and ICC [3,1] suggest that there was no
measurable learning effect during the study.
6.1.2 Absolute reliability
The absolute reliability, Sw, showed how much error, expressed in the units of the measure,
could be expected using the TIS. The observers’ experience seemed to have influence on the
Sw. One observer was the most experienced with children with CP, and by editing the video
recordings she gained further experience relating to the test. This observer also had an
advantage in doing the TIS assessment of the children. Given that this only applies to the
present study with three observers, one should investigate importance of experience with
children with CP further. Considerations of experience are described later in this thesis.
6.1.3 A discriminating measure

30
Measurement is the systematic process by which things are differentiated. Discriminating
measures discriminate among subjects on a particular construct.72
The Bland Altman plot
shows that the TIS appears to discriminate between children according to their gross motor
function. Decreasing GMFCS levels were associated with an increasing total TIS score. The
plot showed most agreement for the children with either a high TIS score, corresponding to a
high trunk performance, or the children with a low TIS score, corresponding to a low trunk
performance. For the children with no motor impairment and high trunk performance, the
items were easy to perform, and the observers were in no doubt about how to score. There
was a ceiling effect for these children. However, the intention is to use the scale for children
with CP and there was no ceiling or floor effect for such children. For the children with low
trunk performance some items were difficult to perform, the observers were not in much
doubt about how to score, there was no floor effect, but this might to some extent explain the
agreement between observers for children with a low TIS score. According the functional
levels of postural control, described earlier, the children at GMFCS level 4 showed difficulties
at both the first level, direction-specific adaption, and the second level, fine-tuning adaption.
This explains their difficulties in attaining a high score in a test which evaluates qualities of
movement. In levels 1–3 a stereotype pattern is described 37
and this means that they differ
from the children with no motor impairment, as shown in this study.
The general headings for each GMFCS level state that level 1 walks without limitations, level
2 walks with limitations, level 3 walks using a handheld mobility device, and level 4 has self-
mobility with limitations. In the distinction between levels, trunk control is not mentioned for
levels 1 or 2. For level 3, the classification describes that the children can sit on their own, or
they require at most limited external support. For level 4, the classification describes that they
have severe limitations in head and trunk control.4 Most interest was therefore linked to levels
1 and 2. This study suggests that there is a difference in trunk control between children with
no motor impairment and GMFCS levels 1 and 2. The plot shows that it is most demanding to
examine children at GMFCS level 2, with moderate trunk performance.

31
Adequate postural control is a prerequisite for adequate mobility.24
Complex tasks such as
whole body motion are characterized in particular by center of mass location and trunk
orientation.16
This supports that evaluation of trunk control should be part of the clinical
examination of children with cerebral palsy.
6.1.4 Validity
Reliability is a necessary, but not sufficient, condition for validity.68
In this study intern
validity concerns whether we can trust the results, i.e. whether the degree of agreement
between the observers is to be trusted. Factors that may affect this have been described above.
External validity is concerned with whom, in what setting, and at what time the results of
research can be generalized.81
From a design perspective, controlling threats to external
validity requires thoughtful consideration of the population to whom the results of the study
can be applied, combined with practical considerations of the population in terms of the
availability of participants for study and attention to how closely the research resembles
clinical practice.81
The latter consideration has been discussed above. In this study there are
two populations, the children and the observers. There is no reason to assume that children
with CP from the middle part of Norway are much different from other parts of the country or
other countries with the same follow-up programs. Hence, one must consider whether there
are substantial cultural differences. The classification of the children with CP is based on an
international system. One must, however, consider that therapists’ competence in making
classifications might differ. In this study the observers were not randomly selected, but
selected on the basis of experience in physiotherapy. This might prohibit the generalizability
of the results.
6.2 Discussion of aspects of the results in a methodological perspective
It is important to collect information on measurable conditions systematically. Systematically
collected information might be helpful in recognizing important phenomena in clinical work.
Thornquist67
points out that we also have to take into consideration that such measurable
standards may come from meaningful experiences and events that are expressed and specified
in the body over time. Measureable factors must also be interpreted and contextualized in

32
different ways, depending on the researcher’s basic orientation, with respect to scientific
theory and knowledge of the clinical field. Perspectives on professional competence have, as
described earlier in this thesis, changed over time. The positivistic epistemology (in this
instance referring to objective, knowable work beyond the worker) has led to description of
work activities that are independent of the worker that accomplishes them.86
The impossibility
of making theory-free observations has, however, long been understood.70
Bland and Altman claim that there are natural variations in the subject, in the measurement
process, or both. In this study the variation is, as described above, related to the observers.
According Thornquist,67
humans are “situated,” “being in the world.” What humans
experience before, during, and after an observation will affect the performance and hence
variation is natural.
In this reliability study the observers had different experiences. In choosing physical
therapists with different experiences, there is an understanding that this might mean
something for the scoring of the test, although the observers in this study had a test manual to
follow. This understanding finds support in the phenomenologist Hussel’s statement that
“Nothing provides without providing for some!”67
In phenomenology there is a qualitative
different description of experience than the former philosophical directions. Experience is
something far more than what meets the eyes, ears, and other sense organs.67
Perception is
described as an active process that involves the subject, and that meaning is always added.
Our attention and perception are influenced by what kind of projects we are involved in, an
expanded life-historical meaning.67
According phenomenology, observers do not leave
previous experience behind when participating in a reliability study.
To achieve low Sw, which expresses a low measurement error, the observers’ experience with
children with CP and experience with the TIS seemed to have been influential. One observer
was more experienced with children with CP than the other observers. When practitioners
construct meaning for a unique situation, they see it as something that already exists in their

33
repertoire. According to Dahlgren et al.,86
this means that a familiar situation functions as
metaphor or pattern for the interpretation of a new situation. Any given observation is the
result of largely unarticulated theories, assumptions, and interferences, that guide the method
of selecting and interpreting the observation.70
The most experienced therapist with children
with CP probably recognized the movement qualities more readily than the therapists with
less experience in working with these children. This observer also had an advantage in
carrying out the TIS assessment, and might, as described above, have had broader perceptual
experience. Practical experience, which according Thornquist67
is “incorporated” in the body,
might had have influenced the reassessment of the TIS.
There are no standard criteria regarding time between assessments. It is has been argued that
enough time has to elapse to minimize the influence of an observer’s memory.87
In this study
there were 4 weeks between first and second observation. Comparable studies to this one have
described different intervals, such as 10 days,87
2 weeks,88
and 6 weeks64
between
observations. Using the term memory in this way may be problematic; one can associate the
human with a machine, in the same manner as philosopher Descartes (as described earlier in
this thesis). Like a computer, we “delete” information from the “hard drive.” The fact that
many studies measure test-retest reliability with days or weeks between observations indicates
that the term memory may be interpreted in a broader sense.
7. Conclusions
Trunk control, as part of postural control, is a prerequisite for adequate mobility. It is thus of
great importance to understand the postural problems of children with CP. To my knowledge,
there is no standardized clinical tool available to measure trunk performance in children with
CP. To be able to rely on the results of clinical tools, the tools need to be reliable and valid.
This study shows that the TIS, developed to measure motor impairment after stroke, is
reliable for children with CP, aged between 5 and 12 years. The test may be used by
physiotherapists with varying experience, but it seems to be an advantageous to have
experience of working with children with CP. The results of a test should be interpreted in a

34
holistic perspective. A reliable clinical tool to measure trunk performance may contribute to a
focus on “the body (not parts of it) walking on the computer screen (figure 3).”
Figure 3. From three-dimensional gait analysis
8. Future research
High inter- and intra-observer reliability for the TIS is necessary but insufficient to claim
validity of the test. According to the definition of validity, it should be examined whether the
test assesses what is it meant to measure.72
Content validity exists to the extent that a measure
is composed of a comprehensive sample of items that completely assesses the domain of
interest.72
One would expect a set of activities that covers all aspects of trunk performance.
Content validity may be considered good since there is a wide range of items in the TIS.
There may still be some movement qualities that are important for motor functions that the
test does not capture, and this possibility might be explored further. Criterion validity
examines the extent to which a measure provides results that are consistent with a gold
standard. The TIS could be compared with the sitting subscale of GMFM for examination of
criterion validity. The results of this study show that experience in physiotherapy may have
influenced the Sw, and future studies could examine this further. This study had a high degree
of standardization as a consequence of using video recordings, and in these respect reliability
studies of the TIS in clinical use may be useful. In this study the age range of the children’s
was limited. Further studies should examine a wider age span.

35
9. References
1. Bax M, Goldstein M, Rosenbaum P, Leviton A, Paneth N. Proposed definition and
classification of cerebral palsy. Developmental Medicine & Child Neurology. 2005;47:571-
576.
2. Europe SoCPi. Surveillance of cerebral palsy in Europe. Developmental Medicine & Child
Neurology. 2000;42:816-824.
3. Carlberg EB, Hadders-Algra M. Postural control in sitting children with cerebral palsy. In:
Carlberg EB, Hadders-Algra M (eds). Postural control: a key issue in developmental
disorders. 1 ed. London: Mac Keith Press, 2008:74-96.
4. Palisano R, Rosenbaum P, Bartlett D, Livingstone M. GMFCS-E&R. Gross Motor
Classification system. Expanded and revised. Accessed 2007.
http://motorgrowth.canchild.ca/en/GMFCS/resources/GMFCS-ER.pdf, Hamilton, 2007.
5. WHO. ICF. http://www.who.int/classifications/icf/en/, 2001.
6. Mayston MJ. People with cerebral palsy: effects of and perspectives for therapy. Neural
Plasticity. 2001;8(1):51-69.
7. Rikshospitalet. CPOP: Cerebral parese oppfølgingsprogram. http://www.rikshospitalet.no,
2009.
8. Shumway-Cook A, Woollacott MH. A lifespan perspective of mobility. Motor Control:
Translating research into clinical practice. 3 ed. Baltimore: Lippincott Williams & Wilkins,
2007:330-358.
9. Brodal P. Det nevrobiologiske grunnlaget for balanse. Fysioterapeuten 2004;8:25-30.
10. Gjelsvik BEB. The Bobath concept in adult neurology. 1 ed. Stuttgart: Georg Thieme Vorlag;
2008.
11. Verheyden G, Nieuwboer A, With Ld, et al. Trunk Performance after stroke and the
relationship with balance, gait and functional ability. Journal of Neurology Neurosurgery
Psychiatry. 2006;78:694-698.
12. Huang Q, Hodges P, Thorstensson A. Postural control of the trunk in response to lateral
support surface translations during trunk movement and loading. Experimental Brain
Research. 2001;141:552-559.
13. Kersten P. Principles of physiotherapy assessment and outcome measures. In: Stokes M (ed).
Physical management in neurological rehabilitation. Volume 2. London: Elsevier, 2004.
14. Verheyden G, Martin J, Preger R, Kiekens C, Weerdt WD. The Trunk Impairment Scale: a
new tool to measure motor impairment of the trunk after stroke. Clinical Rehabilitation.
2004;18:326-334.

36
15. Shumway-Cook A, Woollacott MH. Normal postural control. In: Shumway-Cook A,
Woollacott MH (eds). Motor Control: Translating research into clinical practice. 3 ed.
Baltimore: Lippincott Williams & Wilkins, 2007:157-186.
16. Latash M, Hadders-Algra M. What is posture and how is it controlled? In: Algra MH,
Carlberg EB (eds). Postural Control: A key issue in developmental disorders. London: Mac
Keith Press, 2008:3-21.
17. Brodal P. Sentralnervesystemet. 4 ed. Oslo: Universitetsforlaget; 2007.
18. Shumway-Cook A, Woollacott MH. Constraints on motor control: an overview of neurologic
impairments. In: Shumway-Cook A, Woollacott MH (eds). Motor Control:Translating
research into clinical practice. 3 ed. Baltimore: Lippincott Williams & Wilkins, 2007:100-135.
19. Gage JR. The treatment of gait problems in cerebral palsy. 1 ed. London: Mac Keith Press;
2004.
20. Moster D, Lie R, Irgens L, Bjerkedal T, Markestad T. The association of Apgar score in
subsequent death and cerebral palsy in infants exposed to intrauterine infections. Journal of
Pediatrics. 2001;138:798-803.
21. Markestad T, Halvorsen B. Faglige retningslinjer for oppfølging av for tidlig fødte barn.
Nasjonale faglige retningslinjer. Volume IS-1419. Oslo: Sosial og helsedirektoratet, 2007.
22. Vohr B, Wright L, Dusick A, Mele L, Verter J, Steichen J. Neurodevelopmental and
functional outcomes of extremely low birth weight infants in the National Institute of Child
Health and Human Developmental Neonatal Research Network, 1993-1994. Pediatrics.
2000;105:1216-1226.
23. Shumway-Cook A, Woollacott MH. Motor control: Issues and theories. In: Shumway-Cook
A, Woollacott MH (eds). Motor Control: Translating research into clinical practice. 3 ed.
Baltimore: Lippincott Williams & Wilkins, 2007:3-20.
24. Hadders-Algra M, Carlberg EB. Introduction: Why bother about postural control? In:
Hadders-Algra M, Carlberg EB (eds). Postural control: A key issue in developmental
disorders. 1 ed. London: Mac Keith Press, 2008:1-2.
25. Forssberg H, Hirchfeld H. Postural adjustment in sitting humans following external
perturbations: muscle activity and kinematics. Experimental Brain Research. 1994;97:515-
527.
26. Hadders-Algra M. Development of postural control. In: Carlberg EB, Hadders-Algra M (eds).
Postural control: A key issue in developmental disorders. 1 ed. London: Mach Keith Press
2008.
27. Hadders-Algra M. The neuronal group selection theory: promising principles for
understanding and treating developmental motor disorders. Developmental Medicine & Child
Neurology. 2000;42:707-715.
28. Hadders-Algra M. The neural group selection theory: a framework to explain variation in
normal motor development. Developmental Medicine & Child Neurology. 2000;42:566-572.

37
29. Campbell SK, Linden DWV, Palisano RJ. Physical therapy for children. 3 ed. St. Louis
Missouri: Saunders Elsevier; 2007.
30. Hadders-Algra M. Development of postural control during the first 18 months of life. Neural
Plasticity. 2005;12(2-3):99-108.
31. Carlberg EB, Hadders-Algra M. Postural dysfunction in children with cerebral palsy: some
implications for therapeutic guidance. Neural Plasticity. 2005;12(2-3):221-228.
32. Palisano R, Cameron D, Rosenbaum P, Walter S, Russell D. Stability of the gross motor
function classification system. Developmental Medicine & Child Neurology. 2006;48:424-
428.
33. Verheyden G, Nieuwboer A, Wit LD, et al. Trunk Performance after stroke: an eye catching
predictor of functional outcome. Journal of Neurology, Neurosurgery and Psychiatry.
2006;78:694-698.
34. Wu YW, Day SM, Strauss DJ, Shavelle RM. Prognosis for ambulation in cerebral palsy: a
population-based study. Pediatrics. 2004;114:1264-1271.
35. Graaf-Peters VBd, Blauw-Hospers CH, Dirks T, Bakker H, Bos AF, Hadders-Algra M.
Development of postural control in typically developing children and children with cerebral
palsy: Possibilities for intervention? Neuroscience and Biobehavioral Rewievs 2007;31:1191-
1200.
36. Hedberg Å, Forssberg H, Hadders-Algra M. Early development of postural adjustment in
sitting position: evidence for the innate origin of direction specificity. Experimental Brain
Research. 2004;157:10-17.
37. Heide Vd, Hadders-Algra M. Postural muscle dyscoordination in children with cerebral palsy.
Neural Plasticity. 2005;12(2-3):197-203.
38. Assaiante C, Malllau S, Viel S, Jover M, Schmitz C. Development of postural control in
healthy children: A functional approach. Neural Plasticity.2005;2-3:109-117.
39. Liao SF, Yang TF, Hsu TC, Chan RC, Wei TS. Differences in seated postural control in
children with spastic cerebral palsy and children who are typically developing. American
Journal of Physical Medicine Rehabilitation. 2003;82(8):622-626.
40. Donker SF, Ledebt A, Roerdink M, Savelsbergh GJ, Beek PJ. Children with cerebral palsy
exhibit greater and more regular postural sway than typically developing children.
Experimental Brain Research. 2008;184:363-370.
41. Rose J, Wolff DR, Jones VK, Bloch DA, Gamble JG. Postural balance in children with
cerebral palsy. Developmental Medicine & Child Neurology. 2002;44:58-63.
42. Brogren E, Forssberg H, Hadders-Algra M. Influence of two different sitting positions on
postural adjustment in children with spastic diplegia. Developmental Medicine & Child
Neurology. 2001;43:534-546.
43. Wollacott MH, Shumway-Cook A. Postural dysfunction during standing and walking in
children with cerebral palsy: What are the underlying problems and what new therapies might
improve balance? Neural Plasticity. 2005;12(2-3):211-219.

38
44. Heide JVd, Fock JM, Otten B, Stremmelaar E, Eykern LAv, Hadders-Algra M. Postural
control during reaching in preterm children with cerebal palsy. Developmental Medicine &
Child Neurology. 2004;46:253-266.
45. Hopkins B, Rønnqvist L. Facilitating postural control: effects on the reaching behaviour of the
6- month old infants. Developmental Psychobiology. 2002;40:168-182.
46. Coluccini M, Maini ES, Martelloni C, Sgandurra G, Cioni G. Kinematic characterization of
functional reach to grasp in normal and in motor disabled children. Gait & Posture. 2007:493-
501.
47. Roon Dv, Steenbergen B, Meulenbroek RGJ. Trunk use and co-contraction in cerebral palsy
as regulatory mechanisms for accuracy control. Neuropsychologia. 2005;43:497-508.
48. Brogren E, Hadders-Algra M, Forssberg H. Postural control in sitting children with cerebral
palsy. Neuroscience and Biobehavioral Reviews. 1998;22(4):591-596.
49. Shumway-Cook A, Woollacott MH. Control of normal mobility. In: Shumway-Cook A,
Woollacott MH (eds). Motor Control: Translating research into clinical practice. 3 ed.
Baltimore: Lippincott Williams & Wilkins, 2007:299-329.
50. Kavanagh JJ, Morrison S, Barret RS. Coordination of head and trunk acceleration during
walking. European Journal Appl Physiology. 2005;94:468-475.
51. Kavanagh JJ, Morrison S, James DA, Barrett R. Reliability of segmental accelerations
measured using a new wireless gait analysis system. Journal of Biomechanics 2006;39:2863-
2872.
52. Prince F, Winter D, Stergiou P, Walt S. Anticipatory control of upper body balance during
human locomotion. Gait & Posture. 1994;2:19-25.
53. Patla A, Adkin A, Ballard T. Online steering: coordinate orientation. Experimental Brain
Research. 1999;129:629-634.
54. Thorstensson A. Trunk movements in human locomotion. Acta Pysiol Scand. 1984;121:9-22.
55. Moe-Nilssen R, Helbostad JL. Interstride trunk acceleration variability but not step width
variability can differentiate between fit and frail older adults. Gait & Posture. 2005;21:164-
170.
56. Brostrøm E, Ørtquist M, Haglund-Åkerlind Y, Hagelberg S, Gutierrez-Farewick E. Trunk and
center of mass movements during gait in children with juvenile idiopathic arthritis. Human
Movement Science. 2007;26:296-305.
57. Romkes J, Wietske P, Oosterom A, Molenaar S, Bakels I, Brunner R. Evaluating upper body
movements during gait in healthy children and children with diplegic cerebral palsy. Journal
of pediatric orthopaedics. 2007;16(3):175-180.
58. Bartonek Å, Saraste H, Eriksson M, Knutson L, Gresswell A. Upper body movement during
walking in children with lumbo-sacral myelomeningocele. Gait & Posture. 2002;15:120-29.

39
59. Gutierrez EM, Bartonek Å, Haglund-Åkerlind Y, Saraste H. Centre of mass motion during
gait in persons with myelomeningocele. Gait & Posture. 2003;18:37-46.
60. Hodt-Billington C, Helbostad JL, Moe-Nilsen R. Should trunk movement or footfall
parameters quantify gait asymmetry in chronic stroke patients? Gait&Posture. 2008;27:552-
558.
61. Russell D, Rosenbaum P, Lane L. Gross motor function measure (GMFM-66& GMFM-88)
User's manual. London, England: Mac Keith Press; 2002.
62. Boyce W, Gowland C, Rosenbaum P, et al. The gross motor performance measure: validity
and responsiveness of a measure of quality of movement. Physical Therapy. 1995;75:603-613.
63. DeMatteo C, Law M, Rusell D, Pollock N, Rosenbaum P, Walter S. QUEST: quality of upper
extremity skills test: Hamilton, ON: Mc Master University, Neurodevelopmental Clinical
Research Unit; 1992.
64. Sorsdahl A, Moe-Nilssen R, Strand LI. Observer reliability of the Gross Motor Performance
Measure and the Quality of Upper Extremitiy Skills Test, based on video recordings.
Develpmental Medicine & Child Neurology. 2008;50(2):146-151.
65. Franjoine MR, Gunther JS, Taylor MJ. Pediatric Balance Scale: A modified version of Berg
Balance Scale for the school-age child with mild to moderate impairment. Pediatric Physical
Therapy. 2003;15:114-128.
66. Barlett D, Birmingham T. Validity and reliability of a Pediatric Reach Test. Pediatric
Physical Therapy. 2003;15:84-92.
67. Thornquist E. Vitenskapsfilosofi og vitenskapsteori. 2 ed. Bergen: Fagbokforlaget; 2006.
68. Domholdt E. Measurement Theory. In: Domholdt E (ed). Rehabilitation Research Principles
and Applications. 3 ed. St. Louis: Elsevier Saunders, 2005:245-264.
69. Fjelland R. Innføring i vitenskapsteori. 1 ed. Oslo: Universitetsforlaget AS; 1999.
70. Harari E. Whose evidence? Lesson from the philosophy of science and the epistemology of
medicine. Australian and New Zealand Journal of Psychiatry. 2001;35:724-730.
71. Ekeli BV. Evidensbasert praksis. Snublestein i arbeidet for bedre kvalitet i helsetjenesten?
Tromsø: Eureka Forlag; 2002.
72. Finch E, Brooks D, Standford P, Mayo N. Physical rehabilitation outcome measures: a guide
to enhanced clinical decition making. 2 ed. Philadelphia (PA): Lippincott Williams and
Wilkins; 2002.
73. Polit D, Beck C. Nursing research: principles and methodes. 7 ed. Philadelphia (PA):
Lippincott Williams and Wilkins; 2004.
74. Moe-Nilssen R, Nordin E, Lundin-Olsson L. Criteria for evaluation of measurement properties
of clinical balance measures for use in fall prevention studies. Journal of Evaluation in
Clinical Practice. 2008;14:236-240.
75. Altman DG. Practical statistics for medical research. 8 ed. London: Chapman & Hall; 1999.

40
76. Shrout PE, Fleiss JL. Intraclass correlations: Uses in assessing rater reliability. Psychological
Bulletein. 1979;86(2):420-428.
77. Domholdt E. Statistical Analysis of Relationships: The Basis. In: Domholdt E (ed).
Rehabilitation Research Principles and Applications. 3 ed. St.Louis: Elsevier Saunders,
2005:351-363.
78. Bland JM, Altman DG. Statistics notes: Measurement error. BMJ. 1996;313:744.
79. Kirkwood BR, Sterne JAC. Medical statistics. 2 ed. Malden: Blackwell Science Ltd; 2003.
80. Bland JM, Altman DG. Statistical methods for assessing agreement between two methods of
clinical measurement. Lancet. 1986(1):307-310.
81. Domholdt E. Research validity. In: Domholdt E (ed). Rehabilitation Research Principles and
Applications. 3 ed. St. Louis: Elsevier Saunders, 2005:85-103.
82. Moe-Nilssen R. Test-retest reliability of trunk accelometry during standing and walking.
Archives Physical Medicine Rehabilitation. 1998;79:1377-385.
83. Domholdt E. Statistical Analysis of Relationships: Advanced and Special Techniques. In:
Domholdt E (ed). Rehabilitation Research Principles and Applications. 3 ed. St.Louis:
Elsevier Saunders, 2005:364-382.
84. Rankin G, Stokes M. Reliability of assessment tools in rehabilitation: an illustration of
appropriate statistical analyses. Clinical Rehabilitation. 1998;12:187-199.
85. Landis JR, Koch GG. The measurement of observer agreement for categorical data.
Biometrics. 1977;33(1):159-174.
86. Dahlgren M, Richardsson B, Kalman H. Redefining the reflective practione. In: Higgs J (ed).
Developing Practice Knowledge for Health Professionals: Butterworth-Heineman. 2004:15-
33.
87. Steffen T, Seney M. Test -retest reliability and minimal detectable change on balance and
ambulation tests, the 36 -item short-form health survey, and the unified Parkinson disease
rating scale in people with parkinsonism. Physical Therapy. 2008;88(6):733-746.
88. Randall M, Carlin JB, Chondros P, Reddihough D. Reliability of the Melbourne Assessment
of Unilateral Upper Limb Function. Developmental Medicine & Child Neurology.
2001;43:761-767.

41
Contents appendix
1. Gross motor classification system (GMFCS)
2. Instructions for preparing manuscripts for the Physical Therapy journal
3. Regional Committee for Medical Health Research Ethics
4. Request and consent statement to parents with children with cerebral palsy
5. Request and consent statement to parents with children with no motor impairment
6. Request to children with cerebral palsy
7. Request to children with no motor impairment

42
Appendix 1

43

44

45
Appendix 2

46

47

48

49
Appendix 3

50
Appendix 4
Forespørsel om deltakelse i forskningsprosjektet
”Overkroppen i sentrum”
Har overkroppens funksjon betydning for hvordan barn med cerebral
parese kan sitte, stå og gå?
Bakgrunn og hensikt.
Dette er et spørsmål til deg om å la barnet ditt delta i en forskningsstudie for å undersøke om en test,
utviklet for voksne slagpasienter, kan benyttes til barn med cerebral parese. Testen skal undersøke
hvordan barnet bruker overkroppen. Hensikten er å se om dette har betydning for hvordan barnet
sitter, står og går. Funksjon i armer og ben undersøkes ofte. Undersøkelse av overkroppens funksjon er
like viktig. Pr. i dag fins det ingen test som viser hvordan barn med cerebral parese bruker
overkroppen. For å iverksette tiltak som spesifikk trening, botox behandling osv. trenger man gode
undersøkelsesmetoder. Vi ønsker gjennom denne studien å bidra til å bedre undersøkelsesmetodene
for barn med cerebral parese. Studien utføres i forbindelse med Mastergradsprogram i helsefag,
studieretning klinisk nevrologisk fysioterapi, fordypning barn, ved Universitetet i Tromsø.
Hva innebærer studien?
Dersom du ønsker at barnet ditt skal delta i prosjektet, vil dere få inkalling til en time ved St. Olavs
Hospital i november/desember 09. Testen gjennomføres sittende på en bred benk. Vi vil se på barnets
sittebalanse når det sitter i ro og når det beveger armen eller benet. Videre vil vi se hvordan barnet
koordinerer bevegelsene av overkroppen. For å se om det er noen sammenheng mellom hvordan
barnet bruker overkroppen og hvordan det sitter og eventuelt står/ går, skal deler av den mye brukte
testen GMFM/GMPM gjennomføres. Dette gjelder sitte-, og eventuelt stå- og gådelen. Da dette er en
vanlig test, har barnet trolig gjennomført den tidligere. For å kunne se på sammenhenger mellom
testene, må testene imidlertid utføres på samme tidspunkt. Barnet skal være kledd i shorts og eventuelt

51
en overdel. Det vil bli tatt opp video, slik at testene kan vurderes i etterkant. Det hele tar fra 15-45
minutter.
Mulige fordeler og ulemper.
Barnet kalles inn til en ekstra undersøkelse. Det er ingen direkte fordeler for barnet ditt, men barnets
deltagelse bidrar til å hjelpe barn med cerebral parese.
Hva skjer med informasjonen om barnet?
Informasjonen som registreres om barnet ditt, skal kun brukes slik som beskrevet i hensikten med
studien. Alle opplysningene vil bli behandlet uten navn og fødselsnummer eller andre direkte
gjenkjennende opplysninger. En kode knytter barnet til opplysninger om barnet gjennom en
navneliste. Det er kun autorisert personell knyttet til prosjektet som har adgang til navnelisten og som
kan finne tilbake til barnet. Alle medarbeidere i studien er underlagt tausethsplikt i samsvar med lover
og regler for helsepersonell og forskere. Prosjektet er vurdert og godkjent av Regional komite for
medisinsk og helsefaglig forskningsetikk. Alle opplysninger og videoopptak vil oppbevares slik det er
angitt overfor, på et eget filområde som er opprettet for forskningsdata ved St. Olavs Hospital.
Informasjonssikkerhetskoordinator er ansvarlig for dette. Dataene skal oppbevares i 5 år, før de slettes.
Dette er for at de skal kunne benyttes i en doktorgradsstudie. Det vil komme en ny forespørsel om
deltagelse i doktorgradsprosjektet, innen 5 år. Denne må først godkjennes av Regional komite for
medisinsk og helsefaglig forskningsetikk. Det vil ikke være mulig å identifisere barnet ditt i
resultatene av studien når disse publiseres.
Frivillig deltakelse
Det er frivillig å delta i studien. Du kan når som helst og uten å oppgi noen grunn trekke ditt samtykke
til at barnet ditt deltar i studien. Dette vil ikke få konsekvenser for barnets videre behandling. Dersom
du ønsker at barnet ditt skal delta i studien, undertegner du samtykkeerklæringen på siste side. Dersom
du senere ønsker å trekke barnet eller har spørsmål til studien, kan du kontakte Rannei Sæther
72574557/ 99248133/ [email protected]
Rett til innsyn og sletting av opplysninger om barnet.
Hvis du sier ja til at barnet ditt deltar i studien, har du rett til å få innsyn i hvilke opplysninger som er
registrert. Du har videre rett til å få korrigert eventuelle feil i de opplysningene vi har registrert.

52
Dersom du trekker barnet fra studien, kan du kreve å få slettet innsamlede opplysninger, med mindre
opplysningene allerede er inngått i analyser eller brukt i vitenskapelige publikasjoner.
Økonomi
Dere vil få dekket reiseutgifter til konsultasjonen.
Forsikring
Pasientskadeforsikring gjelder ved deltagelse i studien.
Informasjon om utfallet av studien
Du har rett til informasjon om utfallet/resultatet av studien.

53
Samtykke til deltakelse i studien
Jeg har lest informasjonsskrivet og har hatt anledning til å stille spørsmål. Barnet er orientert skriftlig
og muntlig om hva deltagelse innebærer og har ingen innvendinger mot å delta. Jeg samtykker derfor i
at
……………………………………….deltar i prosjektet
Underskrift: Barnets forelder/foreldre: Navn, sted, dato.
___________________________________________________________________________
Underskrift: Barnet (dersom det selv kan skrive): Navn
Samtykke erklæringen sendes til prosjektmedarbeider Rannei Sæther ved Barne- og
Ungdomsklinikken ved St. Olavs Hospital, 7006 Trondheim, innen to uker dersom det er ønskelig at
barnet deltar i studien.

54
Appendix 5
Forespørsel om deltakelse i forskningsprosjektet
”Overkroppen i sentrum”
Har overkroppens funksjon betydning for hvordan barn med cerebral
parese kan sitte, stå og gå?
Bakgrunn og hensikt.
Dette er et spørsmål til deg om å la barnet ditt delta i en forskningsstudie for å undersøke om en test,
utviklet for voksne slagpasienter, kan benyttes til barn med cerebral parese. Testen skal undersøke
hvordan barnet bruker overkroppen. Hensikten er å se om dette har betydning for hvordan barnet
sitter, står og går. Funksjon i armer og ben undersøkes ofte. Undersøkelse av overkroppens funksjon er
like viktig. Pr. i dag fins det ingen test som viser hvordan barn med cerebral parese bruker
overkroppen. For å iverksette tiltak som spesifikk trening, botox behandling osv. trenger man gode
undersøkelsesmetoder. Vi ønsker gjennom denne studien å bidra til å bedre undersøkelsesmetodene
for barn med cerebral parese. For å kunne gjennomføre studien, trenger vi å vite hvordan friske barn
bruker overkroppen. Det er i denne forbindelse vi spør ditt barn om å delta. Studien utføres i
forbindelse med Mastergradsprogram i helsefag, studieretning klinisk nevrologisk fysioterapi,
fordypning barn, ved Universitetet i Tromsø.
Hva innebærer studien?
Dersom du ønsker at barnet ditt skal delta i prosjektet, vil dere få inkalling til en time ved St. Olavs
Hospital i november/desember 09. Testen gjennomføres sittende på en bred benk. Vi vil se på barnets
sittebalanse når det sitter i ro og når det beveger armen eller benet. Videre vil vi se hvordan barnet
koordinerer bevegelsene av overkroppen. Barnet skal være kledd i shorts og eventuelt en overdel. Det
vil bli tatt opp video, slik at testene kan vurderes i etterkant. Det hele tar ca 10 minutter.

55
Mulige fordeler og ulemper.
Forskningen kommer ikke ditt barn til gode, men barnets deltagelse vil komme barn med cerebral
parese til gode.
Hva skjer med informasjonen om barnet?
Informasjonen som registreres om barnet ditt, skal kun brukes slik som beskrevet i hensikten med
studien. Alle opplysningene vil bli behandlet uten navn og fødselsnummer eller andre direkte
gjenkjennende opplysninger. En kode knytter barnet til opplysninger om barnet gjennom en
navneliste. Det er kun autorisert personell knyttet til prosjektet som har adgang til navnelisten og som
kan finne tilbake til barnet. Alle medarbeidere i studien er underlagt tausethsplikt i samsvar med lover
og regler for helsepersonell og forskere. Prosjektet er vurdert og godkjent av Regional komite for
medisinsk og helsefaglig forskningsetikk. Alle opplysninger og videoopptak vil oppbevares slik det er
angitt overfor, på et eget filområde som er opprettet for forskningsdata ved St. Olavs Hospital.
Informasjonssikkerhetskoordinator er ansvarlig for dette. Dataene skal oppbevares i 5 år, før de slettes.
Dette er for at de skal kunne benyttes i en doktorgradsstudie. Det vil komme en ny forespørsel om
deltagelse i doktorgradsprosjektet, innen 5 år. Denne skal først godkjennes av Regional komite for
medisink og helsefaglig forskningsetikk. Det vil ikke være mulig å identifisere barnet ditt i resultatene
av studien når disse publiseres.
Frivillig deltakelse
Det er frivillig å delta i studien. Du kan når som helst og uten å oppgi noen grunn trekke ditt samtykke
til at barnet ditt deltar i studien. Dette vil ikke få konsekvenser for barnets videre behandling. Dersom
du ønsker at barnet ditt skal delta i studien, undertegner du samtykkeerklæringen på siste side. Dersom
du senere ønsker å trekke barnet eller har spørsmål til studien, kan du kontakte Rannei Sæther
72574557/ 99248133/ [email protected]
Rett til innsyn og sletting av opplysninger om barnet.
Hvis du sier ja til at barnet ditt deltar i studien, har du rett til å få innsyn i hvilke opplysninger som er
registrert. Du har videre rett til å få korrigert eventuelle feil i de opplysningene vi har registrert.
Dersom du trekker barnet fra studien, kan du kreve å få slettet innsamlede opplysninger, med mindre
opplysningene allerede er inngått i analyser eller brukt i vitenskapelige publikasjoner.

56
Økonomi
Dere vil få dekket reiseutgifter til konsultasjonen.
Forsikring
Pasientskadeforsikring gjelder ved deltagelse i studien.
Informasjon om utfallet av studien
Du har rett til informasjon om utfallet/resultatet av studien.

57
Samtykke til deltakelse i studien
Jeg har lest informasjonsskrivet og har hatt anledning til å stille spørsmål. Barnet er orientert skriftlig
og muntlig om hva deltagelse innebærer og har ingen innvendinger mot å delta. Jeg samtykker derfor i
at
……………………………………….deltar i prosjektet.
Underskrift: Barnets forelder/foreldre: Navn, sted, dato.
_________________________________________________________________________________
Underskrift: Barnet (dersom det selv kan skrive): Navn
Samtykke erklæringen sendes til prosjektmedarbeider Rannei Sæther ved Barne- og ungdomsklinikken
ved St. Olavs Hospital, 7006 Trondheim, innen to uker dersom det er ønskelig at barnet deltar i
studien.
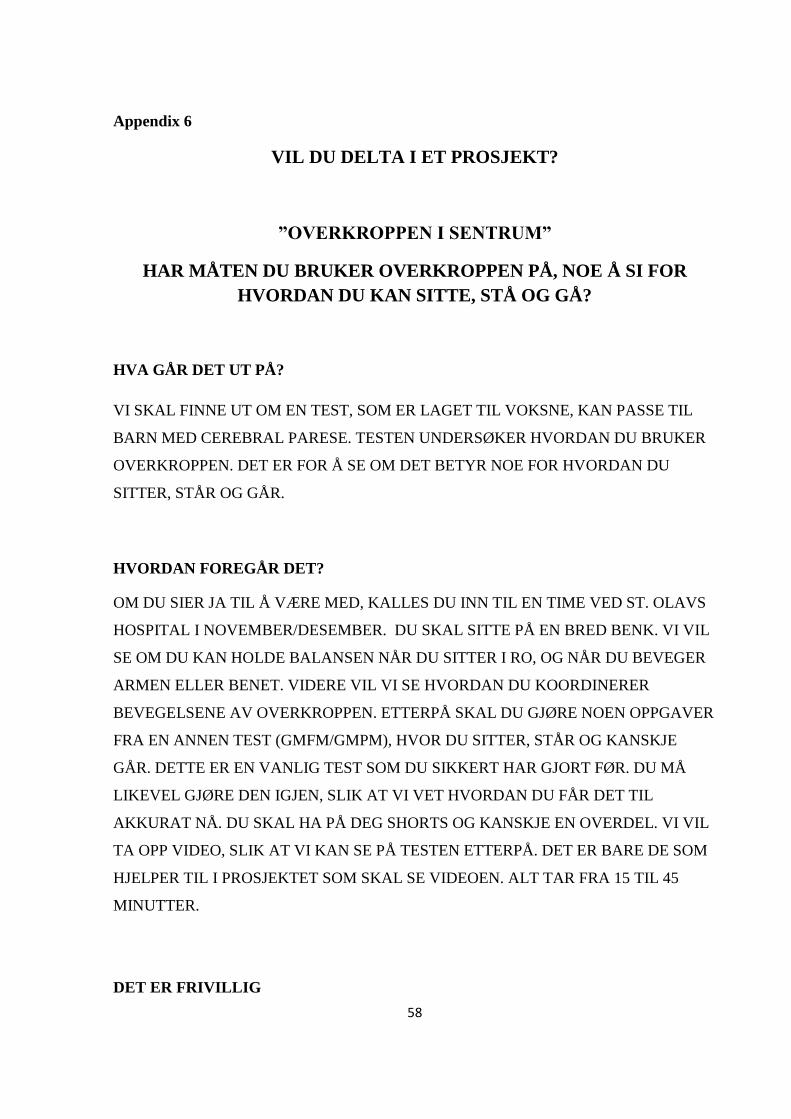
58
Appendix 6
VIL DU DELTA I ET PROSJEKT?
”OVERKROPPEN I SENTRUM”
HAR MÅTEN DU BRUKER OVERKROPPEN PÅ, NOE Å SI FOR
HVORDAN DU KAN SITTE, STÅ OG GÅ?
HVA GÅR DET UT PÅ?
VI SKAL FINNE UT OM EN TEST, SOM ER LAGET TIL VOKSNE, KAN PASSE TIL
BARN MED CEREBRAL PARESE. TESTEN UNDERSØKER HVORDAN DU BRUKER
OVERKROPPEN. DET ER FOR Å SE OM DET BETYR NOE FOR HVORDAN DU
SITTER, STÅR OG GÅR.
HVORDAN FOREGÅR DET?
OM DU SIER JA TIL Å VÆRE MED, KALLES DU INN TIL EN TIME VED ST. OLAVS
HOSPITAL I NOVEMBER/DESEMBER. DU SKAL SITTE PÅ EN BRED BENK. VI VIL
SE OM DU KAN HOLDE BALANSEN NÅR DU SITTER I RO, OG NÅR DU BEVEGER
ARMEN ELLER BENET. VIDERE VIL VI SE HVORDAN DU KOORDINERER
BEVEGELSENE AV OVERKROPPEN. ETTERPÅ SKAL DU GJØRE NOEN OPPGAVER
FRA EN ANNEN TEST (GMFM/GMPM), HVOR DU SITTER, STÅR OG KANSKJE
GÅR. DETTE ER EN VANLIG TEST SOM DU SIKKERT HAR GJORT FØR. DU MÅ
LIKEVEL GJØRE DEN IGJEN, SLIK AT VI VET HVORDAN DU FÅR DET TIL
AKKURAT NÅ. DU SKAL HA PÅ DEG SHORTS OG KANSKJE EN OVERDEL. VI VIL
TA OPP VIDEO, SLIK AT VI KAN SE PÅ TESTEN ETTERPÅ. DET ER BARE DE SOM
HJELPER TIL I PROSJEKTET SOM SKAL SE VIDEOEN. ALT TAR FRA 15 TIL 45
MINUTTER.
DET ER FRIVILLIG

59
DU KAN BESTEMME SELV OM DU VIL VÆRE MED I PROSJEKTET. DU KAN
TREKKE DEG NÅR SOM HELST, OG DU BEHØVER IKKE Å SI HVORFOR. OM DU
TREKKER DEG, VIL DET IKKE HA NOE Å SI. HAR DU SPØRSMÅL, KAN DU RINGE
RANNEI SÆTHER PÅ TLF 72574557 ELLER SENDE MAILTIL [email protected]
DERSOM DU SIER JA TIL Å DELTA, MÅ FORELDRENE DINE SKRIVE UNDER PÅ
SAMTYKKEERKLÆRINGEN.

60
Appendix 7
VIL DU DELTA I ET PROSJEKT?
”OVERKROPPEN I SENTRUM”
HAR MÅTEN DU BRUKER OVERKROPPEN PÅ, NOE Å SI FOR
HVORDAN DU KAN SITTE, STÅ OG GÅ?
HVA GÅR DET UT PÅ?
VI SKAL FINNE UT OM EN TEST, SOM ER LAGET TIL VOKSNE, KAN PASSE TIL
BARN MED CEREBRAL PARESE. FOR Å VITE HVORDAN FRISKE BARN UTFØRER
TESTEN, SPØR VI OM DU VIL DELTA I UNDERSØKELSEN. TESTEN UNDERSØKER
HVORDAN DU BRUKER OVERKROPPEN. DET ER FOR Å SE OM DET BETYR NOE
FOR HVORDAN DU SITTER, STÅR OG GÅR.
HVORDAN FOREGÅR DET?
OM DU SIER JA TIL Å VÆRE MED, KALLES DU INN TIL EN TIME VED ST. OLAVS
HOSPITAL I NOVEMBER/DESEMBER. DU SKAL SITTE PÅ EN BRED BENK. VI VIL
SE OM DU KAN HOLDE BALANSEN NÅR DU SITTER I RO, OG NÅR DU BEVEGER
ARMEN ELLER BENET. VIDERE VIL VI SE HVORDAN DU KOORDINERER
BEVEGELSENE AV OVERKROPPEN. DU SKAL HA PÅ DEG SHORTS OG KANSKJE
EN OVERDEL. VI VIL TA OPP VIDEO, SLIK AT VI KAN SE PÅ TESTEN ETTERPÅ.
DET ER BARE DE SOM HJELPER TIL I PROSJEKTET SOM SKAL SE VIDEOEN. ALT
TAR CA 10 MINUTTER.
DET ER FRIVILLIG
DU KAN BESTEMME SELV OM DU VIL VÆRE MED I PROSJEKTET. DU KAN
TREKKE DEG NÅR SOM HELST, OG DU BEHØVER IKKE Å SI HVORFOR. OM DU
TREKKER DEG, VIL DET IKKE HA NOE Å SI. HAR DU SPØRSMÅL, KAN DU RINGE
RANNEI SÆTHER PÅ TLF 72574557 ELLER SENDE MAILTIL [email protected]

61
DERSOM DU SIER JA TIL Å DELTA, MÅ FORELDRENE DINE SKRIVE UNDER PÅ
SAMTYKKEERKLÆRINGEN.

62
10. Paper
Intra- and inter- observer reliability of the Trunk Impairment Scale for
children with cerebral palsy.
Rannei Sæther
Department of Clinical Services, Physiotherapy section, Trondheim University Hospital,
Trondheim, Norway
Corresponding author: Rannei Sæther, Department of Clinical Services, Physiotherapy
section, Trondheim University Hospital, Trondheim, Norway.
e-mail: [email protected]

63
Abstract
Background and objective. Standardized scales are useful for treatment planning and
evaluation. The purpose of this study was to examine the reliability of the Trunk Impairment
Scale (TIS) for children with cerebral palsy (CP). Design. This was an intra- and inter-
observer reliability study. Methods. Video recordings of 25 children, 20 with CP and 5 with
no motor impairment, in the age group 5–12 years of age, were analyzed by three observers
on two occasions. Intraclass correlation coefficients (ICC [1,1] and [3,1]) with 95%
confidence intervals, within-subject standard deviation, kappa values or percent agreement,
and Bland Altman Plots were calculated. Results. The relative reliability (intra- and inter-
observer reliability) was very high for the total score and subscale score of TIS: ICC [1,1] and
[3,1] varied between .96 and 1.00. Kappa values for the items ranged from .45 to 1.00. The
absolute reliability values for the parameters are reported. The Bland Altman analysis showed
consistency of scores. Limitations. The study was limited to children aged 5–12 years.
Moreover, the observers were not randomly selected, but selected on the basis of varying
experience in physiotherapy. Conclusion. This study indicates that TIS is a simple and
reliable measure of trunk performance for children with CP.
Abstract = 203 words
Body of article = 4416 words

64
Introduction
Cerebral palsy (CP) is described as: “a group of disorders of the development of movement
and posture, causing activity limitation .”1 The extent of problems varies with the degree of
disability, ranging from minor dysfunctions in the least impaired to clearly limited motor
control in the most impaired.2 The severity of dysfunction in everyday life can be described
using the Gross Motor Classification System (GMFCS), which contain five levels of severity
(level 1– the least affected to level 5– the most affected).3 In order to examine why a child’s
activity is limited we need good investigation methods which target the body structure and
function dimension according to the International Classification System of Functioning,
Disability and Health (ICF).4 Clinical scales can be of great value for therapists in clinical
practice and also in research to identify problems, exchange communication and monitor
progress. To date, the investigation of trunk performance has received little attention.
Performing everyday activities requires a flexible control of posture, meaning that we
continuingly have to control the position of either parts of the body or the whole body in an
often changing environment.2 Postural control for stability and orientation requires a complex
interaction of musculoskeletal and neural systems.5-7
The trunk plays a critical role in the
organization of postural reactions.8 The primary contribution of the trunk muscles is to
stabilize the spine and trunk, and this stabilization is essential for free and selective
movements of the head and the extremities.9
Many studies have shown that the postural muscles are dyscoordinated in children with CP.
2,10-23 Assaiante et al.
24 have assessed the development of postural control in healthy children
and describe the trunk as a key segment in the organization of postural stabilization and
orientation control. Measures of trunk performance are related to values of balance, gait and
functional ability, and trunk control has been identified as an important early predictor of
activities of daily living after a stroke.9 The acquisition of sitting balance has proven to be a
predictor of function in both children and adults with neurological damage.25,26
Studies have
shown that achieved independent sitting balance can predict walking in children with CP.26
The trunk plays a multifaceted role in controlling upright posture during walking,27-30
thus

65
reinforcing the general view that the upper body should not simply be described a “passive
passenger unit during gate”.31
The global assessment of postural control and balance forms an integral part of the standard
pediatric neurological examination.2 The Gross Motor Function Measure (GMFM)
32 for
children with CP assesses achievement of gross motor abilities, but it does not supply
information on the nature or origin of postural dysfunction.2 Two complementary measuring
instruments are available to measure movement quality in children with cerebral palsy: the
Gross Motor Performance Measure (GMPM)33
and Quality of Upper Extremity Skills Test
(QUEST),34
both of which are time-consuming.35
Recently, two measures have been
developed for the assessment of balance in children with motor impairments, the Pediatric
Balance Scale36
and Pediatric Reach Test.37
These aim to evaluate balance performance in
sitting and standing; however, they do not evaluate trunk performance specifically.
The trunk impairment scale (TIS) was developed to measure motor impairment after a stroke.8
The test assesses static and dynamic sitting, balance and trunk coordination. The TIS seems
relevant also for children with CP because, as described above, clinical impairments are
present. To our knowledge, there is no standardized clinical tool available to measure trunk
performance in children with CP.
The aim of this methodical study was to examine the inter- and intra-observer reliability of the
Trunk Impairment Scale in children with CP.
.

66
Methods
Subjects
A total of 25 participants, 20 children with CP, GMFCS levels 1–4, and 5 children with no
motor impairment, were recruited from the habilitation department of St. Olav’s Hospital,
Trondheim, Norway. The inclusion criteria were the ability to sit on a bench without support,
and that the children had the ability to understand instructions. The exclusion criteria were all
kinds of surgery within the preceding six months. Information about the diagnosis and
classification of CP was given by the children’s physiotherapist in the habilitation department.
Observers
Three physiotherapists, labeled A–C, were observers. They all worked with children in St.
Olav’s Hospital. Observer A had 4 months of experience as a physiotherapist, observer B had
19 years of experience, working mostly with children with CP, and observer C had 29 years
of experience, mainly with children. Observer B instructed the children in the TIS while they
were video recorded (see below). None of the therapists had any experience of the test prior to
this study. The first observations are labeled A1, B1 and C1, while the second observations
are labeled A2, B2 and C2.
The assessment tool
The TIS was developed by Verheyden et al., and aims to evaluate the trunk in patients who
have suffered a stroke.8 The test has been found reliable and valid for persons with stroke,
8
and subsequently also in patients with multiple sclerosis38
and Parkinson’s disease.39
As
described by Verheyden,38
the TIS assesses static and dynamic sitting balance and trunk
coordination in a sitting position (see Appendix 1). The static subscale investigates: 1) the
ability of the subject to maintain a sitting position with feet supported; 2) the ability to
maintain a sitting position while the legs are passively crossed, and 3) the ability to maintain a
sitting position when the subject crosses the legs actively. In the present study, the children
crossed their strongest leg over their weakest leg. The dynamic subscale contains items on
lateral flexion of the trunk and unilateral lifting of the hip. To assess the coordination of the
trunk, the subject is asked to rotate the upper or lower part of his or her trunk 6 times,
67
initiating the movements either from the shoulder girdle or from the pelvic girdle,
respectively. For each item, a 2-, 3- or 4-point ordinal scale is used. On the static and dynamic
sitting balance and coordination subscales the maximal scores that can be attained are 7, 10
and 6 points. The total score for TIS ranges between 0 for a minimal performance to 23 for a
perfect performance.
Assessment procedure
The assessments of the children were carried out in the same room in St. Olav’s Hospital. The
children sat on a wide bench with support for their feet. Each child was tested in a single
session by therapist B. The session was video recorded by a video camera on a tripod. The
children were video recorded in frontal plane for all of the tasks with the exception of static
sitting balance, items 2 and 3. These items were recorded in sagital plane. For item 3, a red
mark at 10 cm distance to the rear of the child’s pelvis was placed on the bench, to make
observations of trunk movement more than 10 cm backward easier. The children were
permitted to wear a tight shirt/no shirt, shorts/tights and regular footwear (orthoses, shoes),
but could be barefoot if preferred.
The test items were carried out in accordance with to the test manual (Appendix 1). Two
modifications of TIS were made (Appendix 1): 1) for children with equines one should not
expect them to be able to place their feet flat on the floor; 2) children might need physical
guidance to understand the tasks. To ensure that the children had understood the tasks,
instructions were prepared and some tasks were visualized (Appendix 2).
The video recordings from the assessment were edited by Pinnacle Studio 11.0 by therapist B.
In accordance with the manual each child had three attempts at completing the tasks, and the
best attempt was selected for scoring.
Training
To become familiar with the test and the definitions of the scoring, the observers watched a
demonstration video made by Verheyden, and tried to imitate the movements demonstrated.
Thereafter, video clips of children carrying out the TIS test items were scored by the
observers collectively in order to achieve a common understanding of the criteria for scoring.

68
Later, the observers rated video clips independently and discussed their scorings afterwards to
obtain consensus. The video clips in the training session were not of the children included in
our study.
Scoring
Assessment of the 25 video recordings of the children included in the study took place in the
same room for all the observers, using a video screen. There was no communication between
the observers. The observers always started by observing a child with normal motor
development who was not included in the study. Video clips of the children included in the
study were shown in random order. If one or more of the observers wanted to see the video
clip more than one time, this was allowed. The observers could see the video clips several
times. All observers watched each video clip the same number of times and for the same
length of time. A standardized manual for assessment was used by the observers (Appendix
1). The video clips were rescored after 4 weeks by the same observers, using the same
procedure.
Data analysis
All variables were examined for normality using the Kolmogorov-Smirnov Test.40
The results
for the total TIS score and the subscale score “dynamic sitting balance” were not found to be
significant (p > 0.05), and parametric statistic were employed. Relative reliability was
assessed by calculating an intraclass correlation coefficient. ICC [1,1] statistics were used
because the observers were strategically chosen. This model assumes all within-subject
variability to be error of measurement. In ICC [3,1] the effect of any systematic shift is not
considered part of the error of measurement. When no systematic error is present, ICC [1,1] =
ICC [3,1].41
Both models were therefore used. According to Munro reliability was considered
to be high when the ICC was .70 or higher.42
The intra-observer (A1–A2, B1–B2, C1–C2)
and inter-observer (A1–B1, A1–C1, B1–C1) reliability of total score and the subscale score of
dynamic sitting balance was assessed using ICC. Data from the first observation in the intra-
observer study are used in the inter-observer study. The subscale scores “static sitting
balance” and “coordination” had a limited range of scores, and ICC statistics could not be
used. For the single items of these subscales scores, kappa statistics were used to test
agreement.
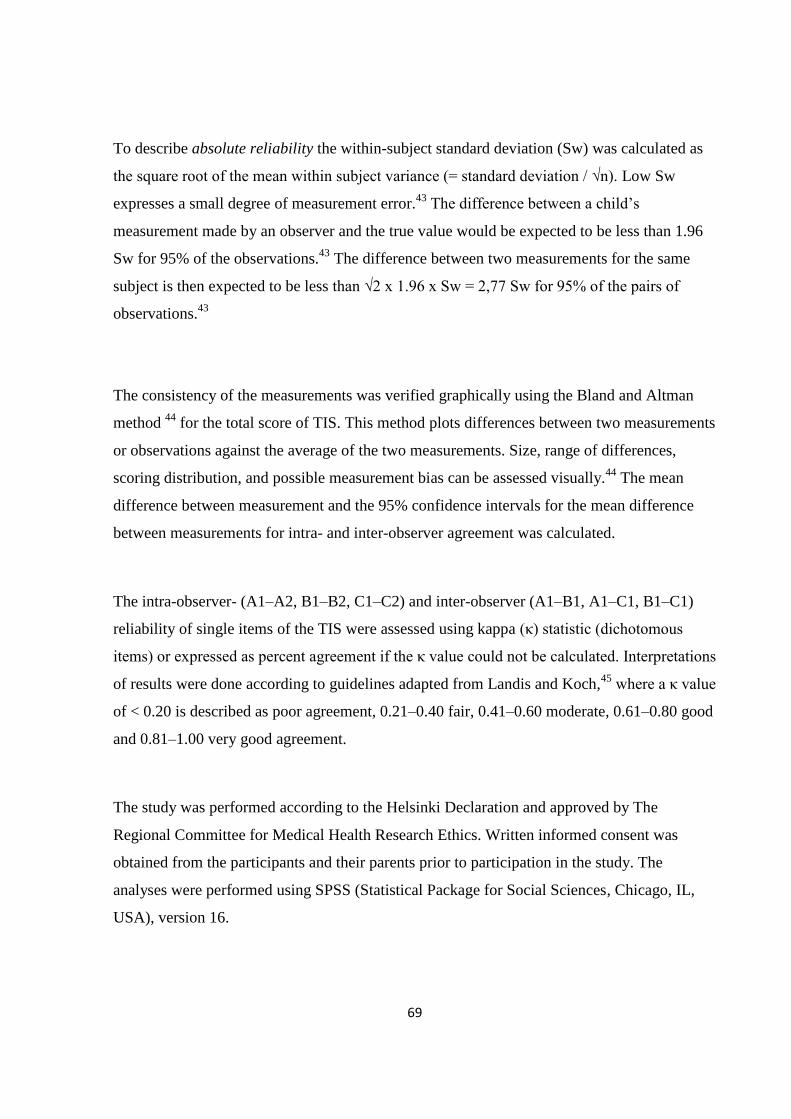
69
To describe absolute reliability the within-subject standard deviation (Sw) was calculated as
the square root of the mean within subject variance (= standard deviation / √n). Low Sw
expresses a small degree of measurement error.43
The difference between a child’s
measurement made by an observer and the true value would be expected to be less than 1.96
Sw for 95% of the observations.43
The difference between two measurements for the same
subject is then expected to be less than √2 x 1.96 x Sw = 2,77 Sw for 95% of the pairs of
observations.43
The consistency of the measurements was verified graphically using the Bland and Altman
method 44
for the total score of TIS. This method plots differences between two measurements
or observations against the average of the two measurements. Size, range of differences,
scoring distribution, and possible measurement bias can be assessed visually.44
The mean
difference between measurement and the 95% confidence intervals for the mean difference
between measurements for intra- and inter-observer agreement was calculated.
The intra-observer- (A1–A2, B1–B2, C1–C2) and inter-observer (A1–B1, A1–C1, B1–C1)
reliability of single items of the TIS were assessed using kappa (κ) statistic (dichotomous
items) or expressed as percent agreement if the κ value could not be calculated. Interpretations
of results were done according to guidelines adapted from Landis and Koch,45
where a κ value
of < 0.20 is described as poor agreement, 0.21–0.40 fair, 0.41–0.60 moderate, 0.61–0.80 good
and 0.81–1.00 very good agreement.
The study was performed according to the Helsinki Declaration and approved by The
Regional Committee for Medical Health Research Ethics. Written informed consent was
obtained from the participants and their parents prior to participation in the study. The
analyses were performed using SPSS (Statistical Package for Social Sciences, Chicago, IL,
USA), version 16.

70
Results
The participants
A total of 25 children participated in the study, with 5 children in each gross motor function
level. The children were in the age range 5–12 years, and the mean age for the gross motor
levels varied from 8.4 to 9.8 years (Table 1). Of the children with CP, 6 were classified as
unilateral and 14 as bilateral. Further, 6 of the children were classified as hemiplegic, 9 as
diplegic, 3 as tri-/tetraplegic and 2 as dyskinetic.
The TIS scale
The children included in the study scored 2–23 points of the total TIS score that ranges 0–23
points. Decreasing GMFCS levels were associated with an increasing total TIS score (Table
2). For all observers, the mean of the total TIS score for children with no motor impairment
was 22.8, for GMFCS level 1, 16.5, for GMFCS level 2, 14.1, GMFCS level 3, 10.6, and for
GMFCS level 4, 4.2.
Relative reliability, reliability of the total score and the dynamic sitting balance subscale of
the TIS
Intra-observer (A1–A2, B1–B2, C1–C2) (Table 3) and inter-observer (A1–B1–C1) (Table 4)
reliability was high. For intra- and inter-observer reliability of the total TIS score the ICC
varied between .96 and 1.00. For intra- and inter-observer reliability of the dynamic sitting
balance subscale of TIS the ICC varied between .94 and .99. Similar ICC values were
obtained when using ICC [1,1] and ICC [3,1].
Absolute reliability, measurement error
The Sw was in the range 0.73–1.70 for the intra-observer reliability and 0.71–1.26 for inter-
observer reliability for the total TIS score. The overall Sw between observers was 0.99. The
Sw ranged 0.57–1.26 for the intra-observer reliability and 0.42–0.87 for inter-observer
reliability for the dynamic sitting balance subscale of TIS.
Bland-Altman Plot

71
The Bland-Altman plots for intra-observer agreement of the total TIS score are shown in
Figure 1. A total of 24 participants (96%) fell within 2 standard deviations of the mean for all
observers. The mean difference of the total TIS scores for intra-observer agreement was −0.04
(95% CI of the mean difference was between 0.63 and 0.71) for observer A1–A2, 0.2 (95%
CI of the mean difference was between 0.61 and 0.21) for observer B1-B2, and 0.04 (95% CI
of the mean difference was between 1.0 and 0.92) for observer C1-C2.
The Bland-Altman plot for inter-observer agreement of the total score of TIS is shown in
Figure 1. A total of 25 participants (100%) fell within 2 standard deviations of the mean for
observers A1–B1 and A1–C1. In total, 24 participants (96%) fell within 2 standard deviations
of the mean for observers B1–C1. The mean difference of the total TIS scores for intra-
observer agreement was −0.4 (95% CI of the mean difference was between 0.11 and 0.91) for
observers A1–B1, −0.44 (95% CI of the mean difference was between 0.25 and 0.13) and for
observers A1–C1, and −0.04 (95% CI of the mean difference was between 0.72 and 0.80) for
observer B1-C1.
For intra- and inter-observer agreement the Bland-Altman plots show less consistency for
subjects in the middle range compared to subjects with high or low scores for the total TIS.
Closest to 0, we find children with no motor impairment and children in GMFCS level 4.
These are in the upper and lower parts of the scale. Of the 4 children whose scores fell outside
the limits of agreement, 3 were in GMFCS level 2 and 1 was in GMFCS level 1.
Agreement of scores on the items of the Trunk Impairment Scale
For inter-observer agreement of the subcategory static sitting balance, items 1 and 3 and for
the subcategory coordination, items 1 and 3, κ values could not be calculated. For intra-
observer agreement of the subcategory static sitting balance, item 1 and for the subcategory
coordination, item 1, κ values could not be calculated. In such cases a symmetrical 2-way
table could not be constructed because all of the scores were not used by all of the observers.
The reliability of these items is expressed as percent agreement.

72
For the other scores of the items, data from all 25 children could be included in the analysis,
as shown in Table 5. The κ values for intra-observer agreement relating to the individual test
items were in the range .47– 1.00 for the static sitting balance subscale, .57–1.00 for the
dynamic sitting balance subscale, and .70–1.00 for the coordination subscale. The κ values for
inter-observer agreement relating to the individual test items were in the range .78–1.00 for
the static sitting balance subscale, .66–1.00 for the dynamic sitting balance subscale, and .60–
1.00 for the coordination subscale.
A total of 94% of all observations showed κ values in the range .61–1.00. The highest
agreement was demonstrated for the static balance subscale, keep sitting balance, for the
dynamic balance subscale, touch seat with most affected and less affected elbow and for the
coordination subscale, rotate pelvic girdle.
The static sitting balance subscale showed the lowest κ value, .47, for the observation of keep
sitting balance with legs crossed. κ values of .57 were found for the dynamic sitting balance
subscale, for the observation of lift pelvis from seat, affected and non affected side.
κ values of .60 were found for the coordination subscale, for observation of rotation of the
shoulder girdle.

73
Discussion
The objective of the study was to investigate intra- and inter-observer reliability of the TIS for
children with CP in the age group 5–12 years, classified to GMFCS levels 1–4. Reliability
was found to be high, according to Munro’s descriptive terms for correlation coefficients.42
This is the first reliability study of trunk performance in children.
Relative reliability assessed by ICC is based on the idea that if a measurement is reliable,
individual measurements within a group will maintain their position within the group on
repeated measurement.42
There are no standard criteria for judging acceptability of ICC’s.46
ICC’s of intra- and inter-observer agreement for total TIS score were in the range .96–1.00.
The observers selected for this study had differing levels of experience, but all observers
showed high reliability. The values in this study are better than ICC values obtained when
using the TIS to evaluate people who have had a stroke.8 Rankin and Stokes
46 claim that
comparison of reliability results between studies is not possible unless the samples tested in
each case are virtually identical. While such studies can be compared, but one must take into
consideration that video is used as a method of observation in the study of children with CP.
By using video recording we have ensured that the variability is not due to variability in a
child’s performance and the instructions. There are no standard criteria regarding the time
interval between assessments. Enough time has to elapse to minimize the influence of
memory, yet too much time may require new training. In this study, 4 weeks elapsed between
the first and second observations. Studies comparable to our study describe intervals varying
between 10 days,47
2 weeks48
and 6 weeks.35
If the test is used in direct clinical observations
the variability might be caused by all of the aspects mentioned. No systematic shift in data
was demonstrated, as ICC [3,1] was not systematically lower or higher than ICC [1,1]. This
indicates that no learning effect took place for the observers between the observations. In this
study the observers were not randomly selected. We wanted therapists with different
experiences. This prohibits generalizability of the results, and is therefore a limitation of the
study.

74
Absolute reliability indicates the extent to which a score varies on repeated measurements. A
low Sw for inter- and intra-observer agreement indicates further consistency of the scores.42
In the study, the Sw for the inter-observer reliability of the total TIS score was 0.99. The
difference between a child’s measurement of the total TIS score and the true value would thus
be expected to be less than ± 1.96 x 0.99 for 95% of the observations. This equals 3.8 points,
and constitutes 16.5% of the scale 0–23. Sw for the intra-observer reliability of the total TIS
score was 1.19 (A1–A2), 0.73 (B1–B2) and 1.70 (C1–C2). The difference between two
measurements of the total TIS score for the same child is expected to be less than ±2.77 x
1.19 (A1–A2), ±2.77 x 0.73 (B1–B2), and ±2.77 x 1.70 (C1–C2) for 95% of pairs of
observations. This is equals 6.6, 4.0 and 9.4 points. There is a difference in Sw between the
observers, with the lowest Sw for observer B. This observer was the most experienced with
children with CP, and by taking responsibility for the editing of the video recordings she also
gained additional experience of the test. This observer also had an advantage in undertaking
the TIS assessment. In addition, through the interaction we all gained a lot of information
about each other.49
To make meaningful statements about whether a child’s condition has
changed, we must know how much variability in scores can be expected due to measurement
error.50
To achieve low Sw, which expresses a low measurement error, the observers’
experience of both children with CP and the TIS may have influenced the results. Neither the
extent to which these two factors might have affected the results or the potential benefit of
instructing the children in TIS can be determined from this study.
The method of Bland and Altman was used in addition to the ICC values because neither test
alone provides sufficiently reliable information. Another indication of good intra- and inter-
observer agreement is that the mean differences were close to 0.38
In this study only 3 subjects
fell outside the limits of agreement for intra-observer agreement and 1 subject fell outside the
limits for inter-observer agreement. The Bland-Altman plots show less consistency for
subjects in the middle range compared to subjects with high or low scores for the total TIS.
Closest to 0, in the upper and lower part of the scale we find the children with no motor
impairment and children in GMFCS level 4. The smaller differences found for the low and
high ranges of the total TIS score indicate higher agreement in people with severe or minimal
impairment in trunk performance. Similar results have been found for people with multiple
sclerosis.38
The larger differences in the middle range suggest that it is more difficult to

75
examine children with CP with a moderate trunk performance. The Bland-Altman Plot shows
that three of four children outside the limit of agreement were children in GMFCS level 2, in
the middle range of the scale. This means that the observers showed the lowest agreement in
observations of children in GMFCS level 2.
Cohen’s kappa statistics or percent agreement was used in this study to examine intra- and
inter-observer agreement of the single items. For intra-observer agreement most values were
above .60, corresponding to good or very good agreement. Only 4 had moderate agreement
(.41– .60) and none had poor or fair agreement. For inter-observer agreement, the results were
similar, with good or very good agreement for most items. Only 2 had moderate agreement
and none of the κ values were fair or poor. Very good agreement was demonstrated for static
balance, item 1, keep sitting balance, and item 3, keep sitting balance with legs crossed. This
may be due to the inclusion criteria that were independent sitting on a bench. For
coordination, very good agreement was demonstrated for item 4, rotate pelvic girdle 6 times
within 6 seconds. The item probably showed very good κ values because most of the children
with CP could not perform the task.
Two of the items with κ values below .60 assessed the ability to lift the pelvis from the seat
(items 7 and 9, dynamic sitting balance). The observer is asked to assess appropriate
shortening/lengthening. Perhaps another definition of the word “appropriate” might be
considered. The third item assessed keep sitting balance with crossed legs (item 2, static
sitting balance). This item was video recorded in the sagital plane. Video recording in frontal
plane might have made observation of the crossing of legs easier. Three items showed κ
values of .60. One item assessed compensation strategies of lifting pelvis from seat (item 8,
dynamic sitting balance). A better definition of the compensation strategies might also be
considered. The second and third items assessed rotation of the shoulder girdle (items 2 and 3,
coordination). The observer assesses whether the rotation is asymmetrical or symmetrical.
This item might be difficult to observe from video clips.
Measurement sensitivity includes ceiling and floor effects. Ceiling effect is a measurement
phenomenon in which an instrument cannot register gains in scores for participants of
interest.42
In this study there was a ceiling effect for the children with no motor impairment.
76
All of the participants had total TIS scores of 22 and 23 points on a scale 0–23. However, the
intention is to use the scale for children with CP and there is no ceiling or floor effect for such
children.
The TIS appears to discriminate children according to their gross motor function. In our
study, children with no motor impairment had the highest score and GMFCS level 4 had the
lowest score. This supports the findings of earlier studies showing a relationship between
trunk control and function.5,25
The trunk assessment tool appeared to be easy to administer. The TIS took no more than 10
minutes to complete, which was comparable to studies with people who had had a stroke.8
This makes the test applicable for clinical use. In this study the assessment was video
recorded. The recordings were edited, and the child’s best attempt was selected. This is a high
degree of standardization. A reliability study performed in the clinic might give different
results.
Conclusions
The present study of intra- and inter-observer agreement of the TIS demonstrated high
reliability of the subscales and the total score, and also moderate to very good κ values for the
items, for children with CP, GMFCS levels 1–4, in the age group 5–12 years of age.
Experience in physiotherapy and with the TIS may have influenced the Sw. The TIS appears
to discriminate children according to their gross motor function. It seems most demanding to
examine children at GMFCS level 2, with moderate trunk performance. Accordingly, further
studies are needed to examine the validity of the TIS.

77
References 1. Bax M, Goldstein M, Rosenbaum P, Leviton A, Paneth N. Proposed definition and
classification of cerebral palsy. Developmental Medicine & Child Neurology. 2005;47:571-
576.
2. Carlberg EB, Hadders-Algra M. Postural control in sitting children with cerebral palsy. In:
Carlberg EB, Hadders-Algra M (eds). Postural control: a key issue in developmental
disorders. 1 ed. London: Mac Keith Press, 2008:74-96.
3. Palisano R, Rosenbaum P, Bartlett D, Livingstone M. GMFCS-E&R. Gross Motor
Classification system. Expanded and revised. Accessed 2007.
http://motorgrowth.canchild.ca/en/GMFCS/resources/GMFCS-ER.pdf, Hamilton, 2007.
4. WHO. ICF. http://www.who.int/classifications/icf/en/, 2001.
5. Shumway-Cook A, Woollacott MH. A lifespan perspective of mobility. Motor Control:
Translating research into clinical practice. 3 ed. Baltimore: Lippincott Williams & Wilkins,
2007:330-358.
6. Brodal P. Det nevrobiologiske grunnlaget for balanse. Fysioterapeuten 2004;8:25-30.
7. Gjelsvik BE. Physiotherapy. The Bobath concept in adult neurology
Stuttgart: Georg Thieme Verlag, 2008:67-90.
8. Verheyden G, Martin J, Preger R, Kiekens C, Weerdt WD. The Trunk Impairment Scale: a
new tool to measure motor impairment of the trunk after stroke. Clinical Rehabilitation.
2004;18:326-334.
9. Verheyden G, Nieuwboer A, Wit LD, et al. Trunk performance after stroke: an eye catching
predictor of functional outcome. Journal of Neurology, Neurosurgery and Psychiatry.
2006;78:694-698.
10. Donker SF, Ledebt A, Roerdink M, Savelsbergh GJ, Beek PJ. Children with cerebral palsy
exhibit greater and more regular postural sway than typically developing children.
Experimental Brain Research. 2008;184:363-370.
11. Graaf-Peters VBd, Blauw-Hospers CH, Dirks T, Bakker H, Bos AF, Hadders-Algra M.
Development of postural control in typically developing children and children with cerebral
palsy: Possibilities for intervention? Neuroscience and Biobehavioral Rewievs 2007;31:1191-
1200.
12. Heide Vd, Hadders-Algra M. Postural muscle dyscoordination in children with cerebral palsy.
Neural Plasticity. 2005;12(2-3):197-203.
13. Roon Dv, Steenbergen B, Meulenbroek RGJ. Trunk use and co-contraction in cerebral palsy
as regulatory mechanisms for accuracy control. Neuropsychologia. 2005;43:497-508.
14. Wollacott MH, Shumway-Cook A. Postural dysfunction during standing and walking in
children with cerebral palsy: What are the underlying problems and what new therapies might
improve balance? Neural Plasticity. 2005;12(2-3):211-219.

78
15. Carlberg EB, Hadders-Algra M. Postural Dysfunction in Children with Cerebral Palsy: Some
implications for therapeutic guidance. Neural Plasticity. 2005;12(2-3):221-228.
16. Heide Vd, Fock J, Otten B, Stemmelaar E, Eykern L, Hadders-Algra M. Postural control
during reaching in preterm children with cerebral palsy. Developmental Medicine & Child
Neurology. 2004;2004(46):253-266.
17. Liao SF, Yang TF, Hsu TC, Chan RC, Wei TS. Differences in seated postural control in
children with spastic cerebral palsy and children who are typically developing. American
Journal Physical Medicine Rehabilitation. 2003;82(8):622-626.
18. Schumway-Cook A, Hutchinson S, Deborah K, Price R, Woollacott M. Effect of balance
training on recovery of stability in children with cerebral palsy. Developmental Medicine &
Child Neurology. 2003;45:591-602.
19. Roncevalles M, Wollacott M, Burtner P. Neural factors underlying reduced postural
adaptability in children with cerebral palsy. Clinical Neuroscience and neuropathology.
2002;13(18):2407-2410.
20. Ferdjallah M, Harris GF, Smith P, Wertsch JJ. Analysis of postural control synergies during
quite standing in healthy children and children with cerebral palsy. Clinical Biomechanics.
2002;17:203-210.
21. Rose J, Wolff DR, Jones VK, Bloch DA, Gamble JG. Postural balance in children with
cerebral palsy. Developmental Medicine & Child Neurology. 2002;44:58-63.
22. Brogren E, Forssberg H, Hadders-Algra M. Influence of two different sitting positions on
postural adjustment in children with spastic diplegia. Developmental Medicine & Child
Neurology. 2001;43:534-546.
23. Brogren E, Hadders-Algra M, Forssberg H. Postural control in sitting children with cerebral
palsy. Neuroscience and Biobehavioral Reviews. 1998;22(4):591-596.
24. Assaiante C, Malllau S, Viel S, Jover M, Schmitz C. Development of postural control in
healthy children: A functional approach. Neural Plasticity. 2005;2-3:109-117.
25. Verheyden G, Nieuwboer A, With Ld, et al. Trunk Performance after stroke and the
relationship with balance, gait and functional ability. Journal of Neurology Neurosurgery
Psychiatry. 2006;78:694-698.
26. Wu YW, Day SM, Strauss DJ, Shavelle RM. Prognosis for ambulation in cerebral palsy: a
population-based study. Pediatrics. 2004;114:1264-1271.
27. Moe-Nilssen R, Helbostad JL. Interstride trunk acceleration variability but not step width
variability can differentiate between fit and frail older adults. Gait & Posture. 2005;21:164-
170.
28. Patla A, Adkin A, Ballard T. Online steering: coordinate orientation. Experimental Brain
Research. 1999;129:629-634.
29. Thorstensson A. Trunk movements in human locomotion. Acta Pysiol Scand. 1984;121:9-22.

79
30. Capozzo A. Analysis of the linear displacement of the head and trunk during walking at
different speeds. Journal of Biomechanics. 1981;14:411-425.
31. Kavanagh JJ, Morrison S, Barret RS. Coordination of head and trunk acceleration during
walking. European Journal Appl Physiology. 2005;94:468-475.
32. Russell D, Rosenbaum P, Lane L. Gross motor function measure (GMFM-66& GMFM-88)
User's manual. London, England: Mac Keith Press; 2002.
33. Boyce W, Growland C, Hardy S, et al. Development of a quality of movement measure for
children with cerebral palsy. Physical Therapy. 1991;71:820-828.
34. DeMatteo C, Law M, Rusell D, Pollock N, Rosenbaum P, Walter S. QUEST: quality of upper
extremity skills test: Hamilton, ON: Mc Master University, Neurodevelopmental Clinical
Research Unit; 1992.
35. Sorsdahl A, Moe-Nilssen R, Strand LI. Observer reliability of the Gross Motor Performance
Measure and the Quality of Upper Extremitiy Skills Test, based on video recordings.
Develpmental Medicine & Child Neurology. 2008;50(2):146-151.
36. Franjoine MR, Gunther JS, Taylor MJ. Pediatric Balance Scale: A modified version of Berg
Balance Scale for the school-age child with mild to moderate impairment. Pediatric Physical
Therapy. 2003;15:114-128.
37. Barlett D, Birmingham T. Validity and reliability of a Pediatric Reach Test. Pediatric
Physical Therapy. 2003;15:84-92.
38. Verheyden G, Nuyens G, Nieuwboer A, Asch PV, Ketelar P, Weerdt WD. Reliability and
validity of trunk assessment for people with multiple sclerosis. Physical Therapy.
2006;86(1):66-76.
39. Verheyden G, Willems AN, Ooms L, Nieuwboer A. Validity of Trunk Impairment Scale as a
Measure of Trunk Performance in People with Parkinson’s Disease. Arch Phys Med Rehabil
2007;88:1304-1308.
40. Pallant J. SPSS survival manual. A step-by-step guide to data analysis. 3 ed. New Yourk: Mc
Graw Hill Open University Press; 2007.
41. Shrout PE, Fleiss JL. Intraclass correlations: Uses in assessing rater reliability. Psychological
Bulletein. 1979;86(2):420-428.
42. Domholdt E. Rehabilitation research: principles and applications. 3 ed. St. Louis (MO):
Elsevier Saunders; 2005.
43. Bland JM, Altman DG. Statistics notes: Measurement error. BMJ. 1996;313:744.
44. Bland JM, Altman DG. Statistical methods for assessing agreement between two methods of
clinical measurement. Lancet. 1986(1):307-310.
45. Landis JR, Koch GG. The measurement of observer agreement for categorical data.
Biometrics. 1977;33(1):159-174.
46. Rankin G, Stokes M. Reliability of assessment tools in rehabilitation: an illustration of
appropriate statistical analyses. Clinical Rehabilitation.1998;12:187-199.

80
47. Steffen T, Seney M. Test -retest reliability and minimal detectable change on balance and
ambulation tests, the 36 -item short-form health survey, and the unified Parkinson disease
rating scale in people with parkinsonism. Physical Therapy. 2008;88(6):733-746.
48. Randall M, Carlin JB, Chondros P, Reddihough D. Reliability of the Melbourne Assessment
of Unilateral Upper Limb Function. Developmental Medicine & Child Neurology.
2001;43:761-767.
49. Thornquist E. Fenomenologi. In: Thornquist E (ed). Vitenskapsteori. 2 ed. Bergen:
Fagbokforlaget, 2006:128-134.
50. Sorsdahl AB, Moe-Nilssen R, Strand LI. Test-retest reliability of spatial and temporal gait
parameters in children with cerebral palsy as measured by an electronic walkway. Gait &
Posture. 2008;27:43-50.

81
Table 1. Characteristics of the children included in the study according to Gross Motor Function Classification
System (GMFCS) level
Classification Frequency Mean Age Range Unilateral
Cerebral Palsy
Bilateral
Cerebral Palsy
Sex
yrs n n male female
Children with no motor impairment 5 8.4 5-11 0 0 1 4
GMFCS, level 1 5 9.6 7-12 4 1 3 2
GMFCS, level 2 5 9.8 8-12 1 4 1 4
GMFCS, level 3 5 8.0 5-11 0 5 2 3
GMFCS, level 4 5 9.0 7-10 0 5 3 2

82
Table 2. Total score of the Trunk Impairment Scale, observers A1, A2, B1, B2, C1, and C2, related to Gross Motor Classification System (GMFCS) levels
All observers
Children with no motor
impairment
Children with cerebral palsy
GMFCS 1
GMFCS 2
GMFCS 3
GMFCS 4
Observer Mean SD Total
range Mean SD
Total
range Mean SD
Total
range
Mean SD
Total
range
Mean SD
Total
range
Mean SD
Total
range
A1 13.8 6.7 2.0-23.0 22.8 0.5 22.0-23.0 16.6 3.6 13.0-21.0
14.4 2.7 11.0-17.0
11.0 1.6 9.0-13.0
4.0 2.9 2.0-9.0
A2 13.4 6.7 2.0-23.0 22.8 0.5 22.0-23.0 16.6 2.7 13.0-20.0
15.6 2.3 12.0-18.0
11.0 2.9 9.0-16.0
3.8 1.8 2.0-6.0
B1 13.3 6.6 2.0-23.0 22.8 0.5 22.0-23.0 16.4 3.1 13.0-20.0
13.8 0.8 13.0-15.0
9.8 1.6 8.0-12.0
4.0 2.1 2.0-7.0
B2 14.0 6.8 2.0-23.0 22.6 0.5 22.0-23.0 16.4 2.9 14.0-20.0
13.6 2.0 11.0-16.0
10.4 1.7 9.0-13.0
4.8 1.9 2.0-7.0
C1 13.6 6.3 2.0-23.0 23.0 0.0 23.0-23.0 15.8 3.0 12.0-20.0
13.2 1.1 12.0-14.0
10.6 2.4 8.0-14.0
4.0 2.1 2.0-7.0
C2 13.9 6.8 2.0-23.0 23.0 0.0 23.0-23.0 17.0 2.1 15.0-20.0
14.0 4.2 7.0-17.0
11.0 3.7 6.0-16.0
4.6 3.0 2.0-9.0
All observers
13.7 2.0-23.0 22.8 22.0-23.0 16.5 12.0-21.0
14.1 7.0-18.0
10.6 6.0-16.8
4.2 2.0-9.0
SD – standard deviation, A1 – the first observation of observer A, A2 – the second observation of observer A, B1 – the first observation of observer B, B2 – the second observation of observer B, C1 – the first
observation of observer C, C2 – the second observation of observer C
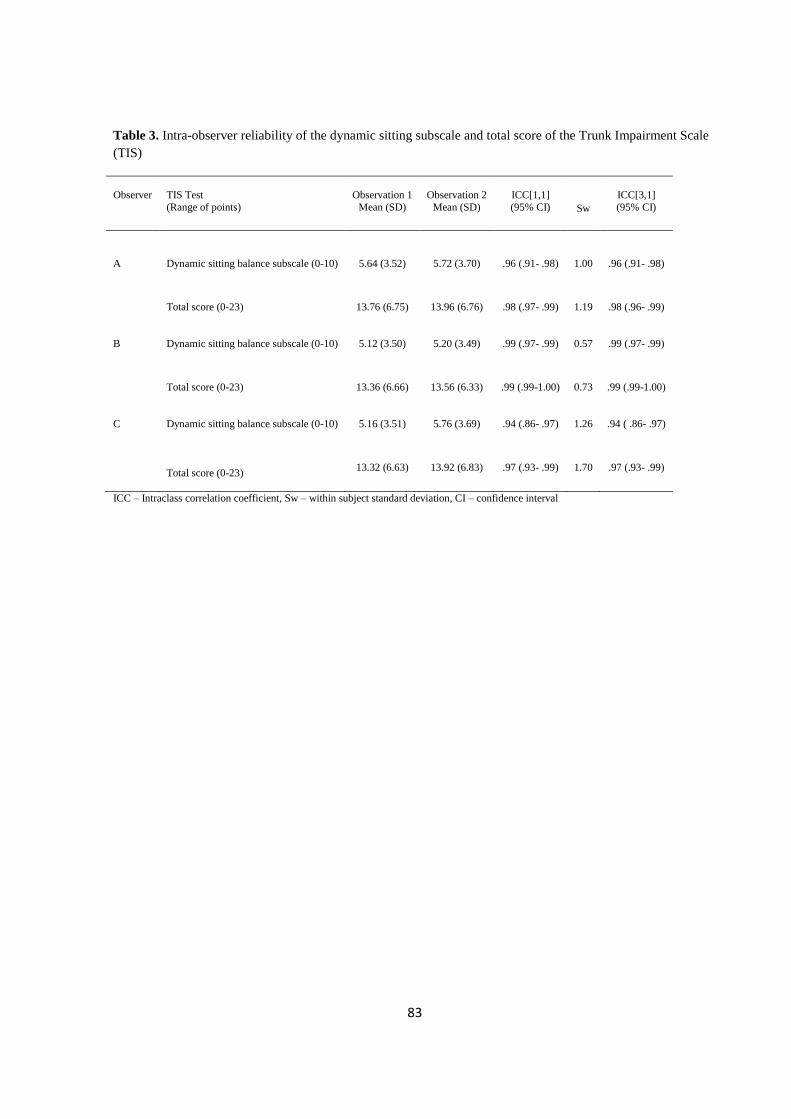
83
Table 3. Intra-observer reliability of the dynamic sitting subscale and total score of the Trunk Impairment Scale
(TIS)
Observer
TIS Test
(Range of points)
Observation 1
Mean (SD)
Observation 2
Mean (SD)
ICC[1,1]
(95% CI)
Sw
ICC[3,1]
(95% CI)
A Dynamic sitting balance subscale (0-10)
5.64 (3.52) 5.72 (3.70) .96 (.91- .98) 1.00 .96 (.91- .98)
Total score (0-23)
13.76 (6.75) 13.96 (6.76) .98 (.97- .99) 1.19 .98 (.96- .99)
B Dynamic sitting balance subscale (0-10)
5.12 (3.50) 5.20 (3.49) .99 (.97- .99) 0.57 .99 (.97- .99)
Total score (0-23)
13.36 (6.66) 13.56 (6.33) .99 (.99-1.00) 0.73 .99 (.99-1.00)
C Dynamic sitting balance subscale (0-10)
5.16 (3.51) 5.76 (3.69) .94 (.86- .97) 1.26 .94 ( .86- .97)
Total score (0-23)
13.32 (6.63) 13.92 (6.83) .97 (.93- .99) 1.70 .97 (.93- .99)
ICC – Intraclass correlation coefficient, Sw – within subject standard deviation, CI – confidence interval

84
Table 4. Inter-observer reliability of the dynamic sitting subscale and total score of the Trunk Impairment Scale
(TIS)
Observer
TIS Test
(Range of points)
ICC[1,1]
(95% CI) Sw
A-B Dynamic sitting balance subscale (0-10)
.98 (.95- .99) 0.71
Total score (0-23)
.99 (.95- .99) 0.94
A-C Dynamic sitting balance subscale (0-10)
.97 (.93- .99) 0.87
Total score (0-23) .98 (.93- .99) 1.26
B-C Dynamic sitting balance subscale (0-10)
.99 (.98-1.00) 1.26
Total score (0-23)
.97 (.93- .99) 1.70
A-B-C Dynamic sitting balance subscale (0-10)
.99 (.97-1.00) 0.69
Total score (0-23)
1.00 (.97-1.00) 0.99
ICC – Intraclass correlation coefficient, Sw – within subject standard deviation, CI – confidence interval

85
Table 5. Intra-observer and inter-observer agreement of the items on the Trunk Impairment Scale (TIS).
Pair wise analysis between the observers (A1-A2, B1-B2, C1-C2) and (A1-B1, A1-C1, B1-C1), expressed in kappa (κ) values with
standard error of κ (se κ) or percent (%) agreement
Observer A1-A2 Observer B1-B2 Observer C1-C2 Observer A1-B1 Observer A1-C1 Observer B1-C1 Item
κ (se κ) κ (se κ) κ (se κ) κ (se κ) κ (se κ) κ (se κ)
Static sitting balance
1. Keep sitting balance 100 % 100 % 100 % 100 % 100 % 100 % 2. Keep sitting balance with legs crossed .47 (.31) 1.00 (.00) 1.00 (.00) .78 (.21) .78 (.21) 1.00 (.00)
3. Keep sitting balance while crossing legs
1.00 (.00) 92 % 88 % 1.00 (.00) 88 % .94 (.06)
Dynamic sitting balance
1. Touch seat with elbow, most affected side (task achieved or not) .98 (.08) .92 (.08) .84 (.11) 1.00 (.00) .92 (.08) .92 (.08)
2. Touch seat with elbow, most affected side (trunk movement) .84 (.11) .76 (.13) .76 (.13) .76 (.13) .76 (.13) .68 (.14)
3. Touch seat with elbow (compensation strategies) .92 (.08) .74 (.14) .92 (.08) .82 (.12) .83 (.12) .82 (.12)
4. Touch seat with elbow, less affected side (task achieved or not) .91 (.09) .84 (.11) .68 (.14) .68 (.14) .68 (.14) .84 (.11)
5. Touch seat with elbow, less affected side (trunk movement) .68 (.15) .76 (.13) .76 (.13) .68 (.14) .76 (.12) .92 (.08)
6. Touch seat with elbow, less affected side (compensation strategies) 1.00 (.00) .92 (.08) .92 (.08) 1.00 (.00) 1.00 (.00) 1.00 (.00)
7. Lift pelvis from seat, most affected side (task achieved or not) .71 (.19) .66 (.17) .57 (.19) .87 (.13) .78 (.14) .66 (.17)
8. Lift pelvis from seat, most affected side (compensation strategies) .68 (.15) .92 (.08) .60 (.16) .84 (.11) .67 (.15) .84 (.11)
9. Lift pelvis from seat, less affected side (task achieved or not) .90 (.10) .88 (.11) .57 (.19) .78 (.15) .69 (.17) .69 (.17)
10. Lift pelvis from seat, less affected side (compensation strategies) .92 (.08) .92 (.08) .68 (.14) .84 (.11) .68 (.15) .68 (.14)
Coordination
1. Rotate shoulder girdle 6 times .80 (.11) .80 (.10) 84 % .60 (.13) .73 (.12) .86 (.09)
2. Rotate shoulder girdle 6 times within 6 seconds .76 (.13) .92 (.08) .76 (.13) .60 (.13) .76 (.13) .84 (.11) 3. Rotate pelvic girdle 6 times .90 (.10) .70 (.13) 1.00 (.00) 88 % .78 (.14) 88 %
4. Rotate pelvic girdle 6 times within 6 seconds .90 (.10) .90 (.10) 1.00 (.00) 1.00 (.00) .78 (.15) .78 (.15)

86
Figure 1. Bland-Altman plots of difference against the average of total TIS score of 25 children measured by the same observer (A1-A2, B1-B2, C1-C2) on two separate occasions and the two different observers (A1-
B1, A1-C1, B1-C1) on the same occasion, with mean difference (solid line) and ± 2SD (95% of agreement) (broken lines). The values next to each open circle indicate the number of subjects at this position. An open
circle with no value implies that only one subject is present at this position
Intra-observer agreement
Inter-observer agreement
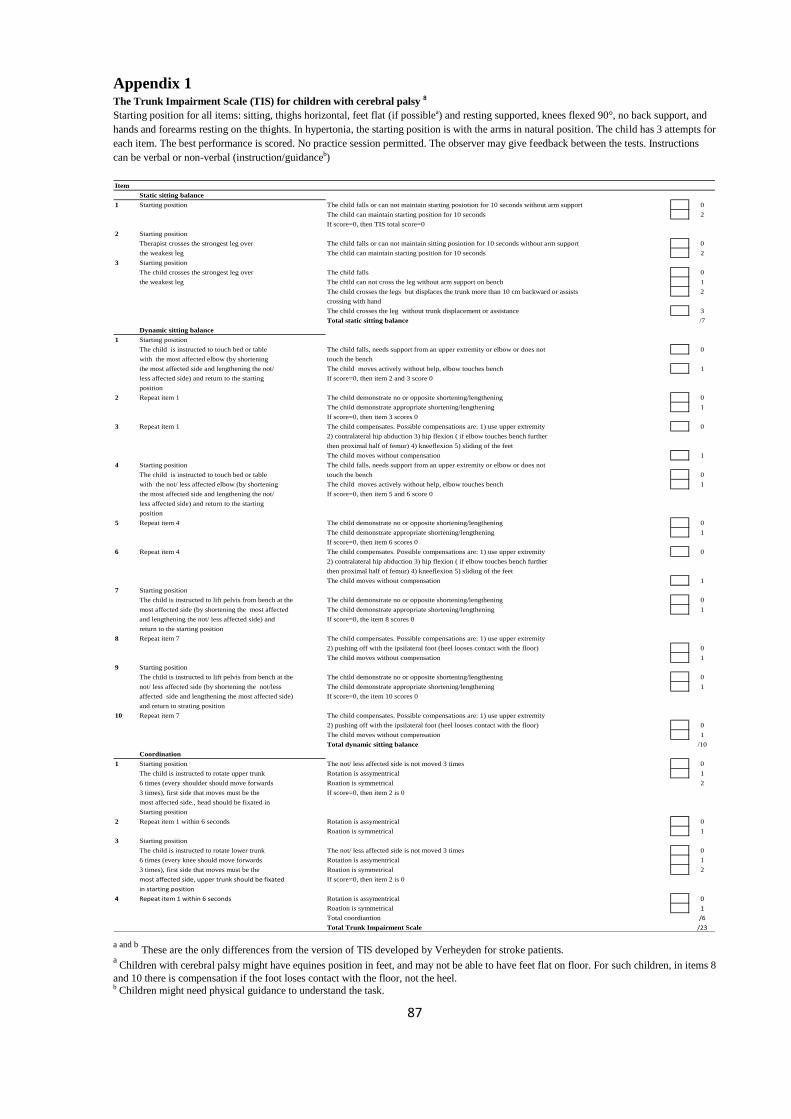
87
Appendix 1 The Trunk Impairment Scale (TIS) for children with cerebral palsy 8
Starting position for all items: sitting, thighs horizontal, feet flat (if possiblea) and resting supported, knees flexed 90°, no back support, and
hands and forearms resting on the thights. In hypertonia, the starting position is with the arms in natural position. The child has 3 attempts for
each item. The best performance is scored. No practice session permitted. The observer may give feedback between the tests. Instructions
can be verbal or non-verbal (instruction/guidanceb)
Item
Static sitting balance
1 Starting position 0
The child can maintain starting position for 10 seconds 2
If score=0, then TIS total score=0
2 Starting position
Therapist crosses the strongest leg over 0
the weakest leg The child can maintain starting position for 10 seconds 2
3 Starting position
The child crosses the strongest leg over The child falls 0
the weakest leg The child can not cross the leg without arm support on bench 1
The child crosses the legs but displaces the trunk more than 10 cm backward or assists 2
crossing with hand
The child crosses the leg without trunk displacement or assistance 3
Total static sitting balance /7
Dynamic sitting balance
1 Starting position
The child is instructed to touch bed or table The child falls, needs support from an upper extremity or elbow or does not 0
with the most affected elbow (by shortening touch the bench
the most affected side and lengthening the not/ The child moves actively without help, elbow touches bench 1
less affected side) and return to the starting If score=0, then item 2 and 3 score 0
position
2 Repeat item 1 The child demonstrate no or opposite shortening/lengthening 0
The child demonstrate appropriate shortening/lengthening 1
If score=0, then item 3 scores 0
3 Repeat item 1 The child compensates. Possible compensations are: 1) use upper extremity 0
2) contralateral hip abduction 3) hip flexion ( if elbow touches bench further
then proximal half of femur) 4) kneeflexion 5) sliding of the feet
The child moves without compensation 1
4 Starting position The child falls, needs support from an upper extremity or elbow or does not
The child is instructed to touch bed or table touch the bench 0
with the not/ less affected elbow (by shortening The child moves actively without help, elbow touches bench 1
the most affected side and lengthening the not/ If score=0, then item 5 and 6 score 0
less affected side) and return to the starting
position
5 Repeat item 4 The child demonstrate no or opposite shortening/lengthening 0
The child demonstrate appropriate shortening/lengthening 1
If score=0, then item 6 scores 0
6 Repeat item 4 The child compensates. Possible compensations are: 1) use upper extremity 0
2) contralateral hip abduction 3) hip flexion ( if elbow touches bench further
then proximal half of femur) 4) kneeflexion 5) sliding of the feet
The child moves without compensation 1
7 Starting position
The child is instructed to lift pelvis from bench at the The child demonstrate no or opposite shortening/lengthening 0
most affected side (by shortening the most affected The child demonstrate appropriate shortening/lengthening 1
and lengthening the not/ less affected side) and If score=0, the item 8 scores 0
return to the starting position
8 Repeat item 7 The child compensates. Possible compensations are: 1) use upper extremity
2) pushing off with the ipsilateral foot (heel looses contact with the floor) 0
The child moves without compensation 1
9 Starting position
The child is instructed to lift pelvis from bench at the The child demonstrate no or opposite shortening/lengthening 0
not/ less affected side (by shortening the not/less The child demonstrate appropriate shortening/lengthening 1
affected side and lengthening the most affected side) If score=0, the item 10 scores 0
and return to strating position
10 Repeat item 7 The child compensates. Possible compensations are: 1) use upper extremity
2) pushing off with the ipsilateral foot (heel looses contact with the floor) 0
The child moves without compensation 1
Total dynamic sitting balance /10
Coordination
1 Starting position The not/ less affected side is not moved 3 times 0
The child is instructed to rotate upper trunk Rotation is assymentrical 1
6 times (every shoulder should move forwards Roation is symmetrical 2
3 times), first side that moves must be the If score=0, then item 2 is 0
most affected side., head should be fixated in
Starting position
2 Repeat item 1 within 6 seconds Rotation is assymentrical 0
Roation is symmetrical 1
3 Starting position
The child is instructed to rotate lower trunk The not/ less affected side is not moved 3 times 0
6 times (every knee should move forwards Rotation is assymentrical 1
3 times), first side that moves must be the Roation is symmetrical 2
most affected side, upper trunk should be fixated If score=0, then item 2 is 0
in starting position
4 Repeat item 1 within 6 seconds Rotation is assymentrical 0
Roation is symmetrical 1
Total coordiantion /6
Total Trunk Impairment Scale /23
The child falls or can not maintain starting posiotion for 10 seconds without arm support
The child falls or can not maintain sitting posiotion for 10 seconds without arm support
a and b
These are the only differences from the version of TIS developed by Verheyden for stroke patients.
a Children with cerebral palsy might have equines position in feet, and may not be able to have feet flat on floor. For such children, in items 8
and 10 there is compensation if the foot loses contact with the floor, not the heel.
b Children might need physical guidance to understand the task.
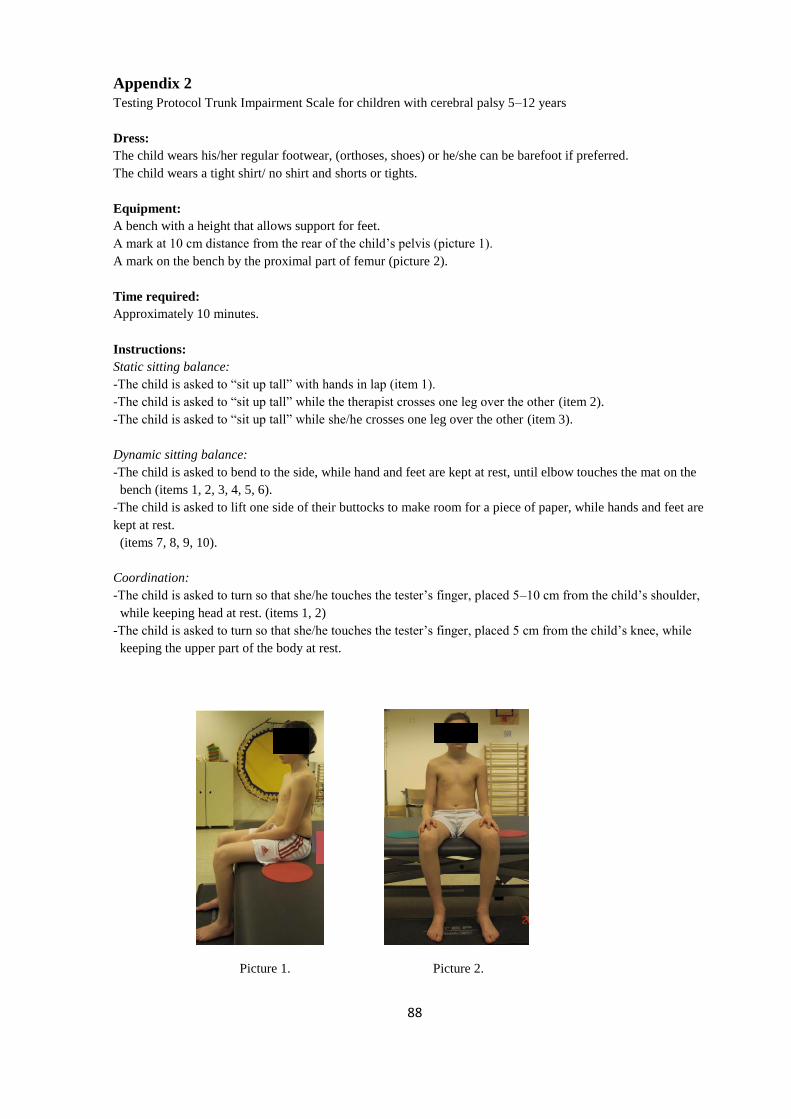
88
Appendix 2
Testing Protocol Trunk Impairment Scale for children with cerebral palsy 5–12 years
Dress:
The child wears his/her regular footwear, (orthoses, shoes) or he/she can be barefoot if preferred.
The child wears a tight shirt/ no shirt and shorts or tights.
Equipment:
A bench with a height that allows support for feet.
A mark at 10 cm distance from the rear of the child’s pelvis (picture 1).
A mark on the bench by the proximal part of femur (picture 2).
Time required:
Approximately 10 minutes.
Instructions:
Static sitting balance:
-The child is asked to “sit up tall” with hands in lap (item 1).
-The child is asked to “sit up tall” while the therapist crosses one leg over the other (item 2).
-The child is asked to “sit up tall” while she/he crosses one leg over the other (item 3).
Dynamic sitting balance:
-The child is asked to bend to the side, while hand and feet are kept at rest, until elbow touches the mat on the
bench (items 1, 2, 3, 4, 5, 6).
-The child is asked to lift one side of their buttocks to make room for a piece of paper, while hands and feet are
kept at rest.
(items 7, 8, 9, 10).
Coordination:
-The child is asked to turn so that she/he touches the tester’s finger, placed 5–10 cm from the child’s shoulder,
while keeping head at rest. (items 1, 2)
-The child is asked to turn so that she/he touches the tester’s finger, placed 5 cm from the child’s knee, while
keeping the upper part of the body at rest.
Picture 1. Picture 2.

89