Embed Size (px)
Citation preview
Tsetseand their Impact on Development.
Part 2: Spatial EpidemiologyG. Hendrickx Avia-GIS
Tsetse and development –Part 2 –Avia-GIS
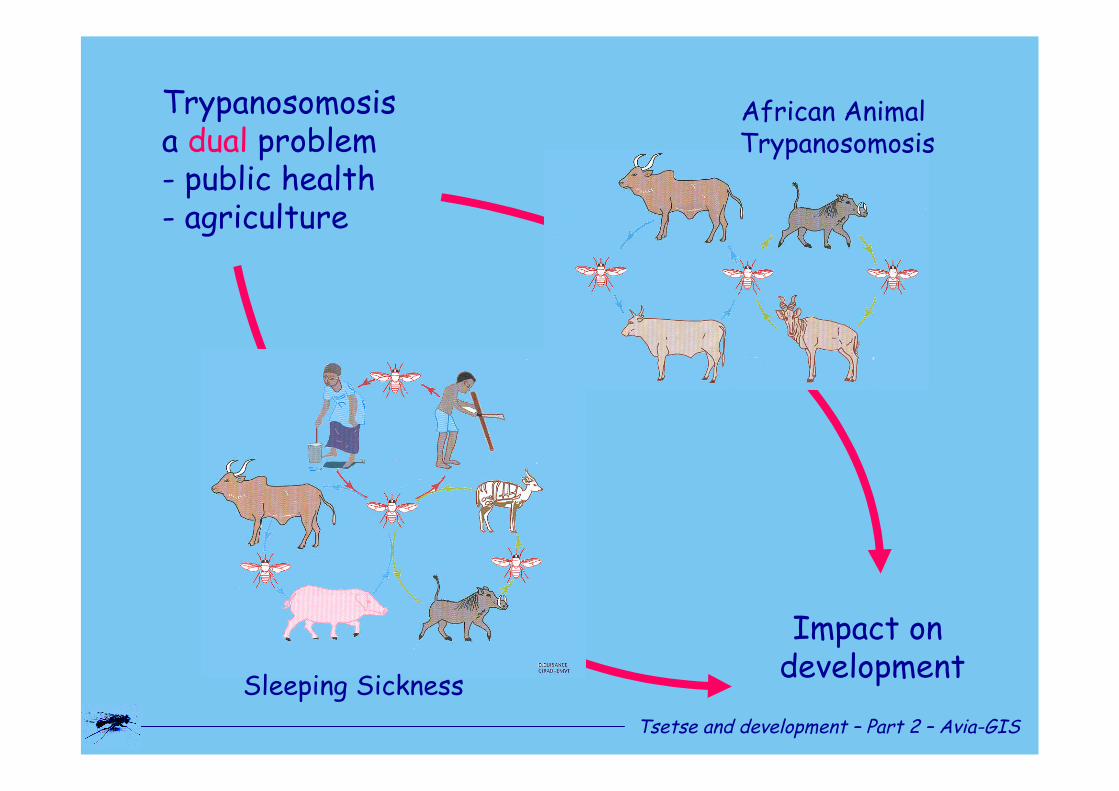
African AnimalTrypanosomosis
Impact ondevelopment
Trypanosomosisa dual problem- public health- agriculture
Sleeping SicknessTsetse and development –Part 2 –Avia-GIS
The Epidemiology ofAfrican Animal Trypanosomosis
(AAT)
Its Impact on HumanDevelopment and Poverty.
Tsetse and development –Part 2 –Avia-GIS
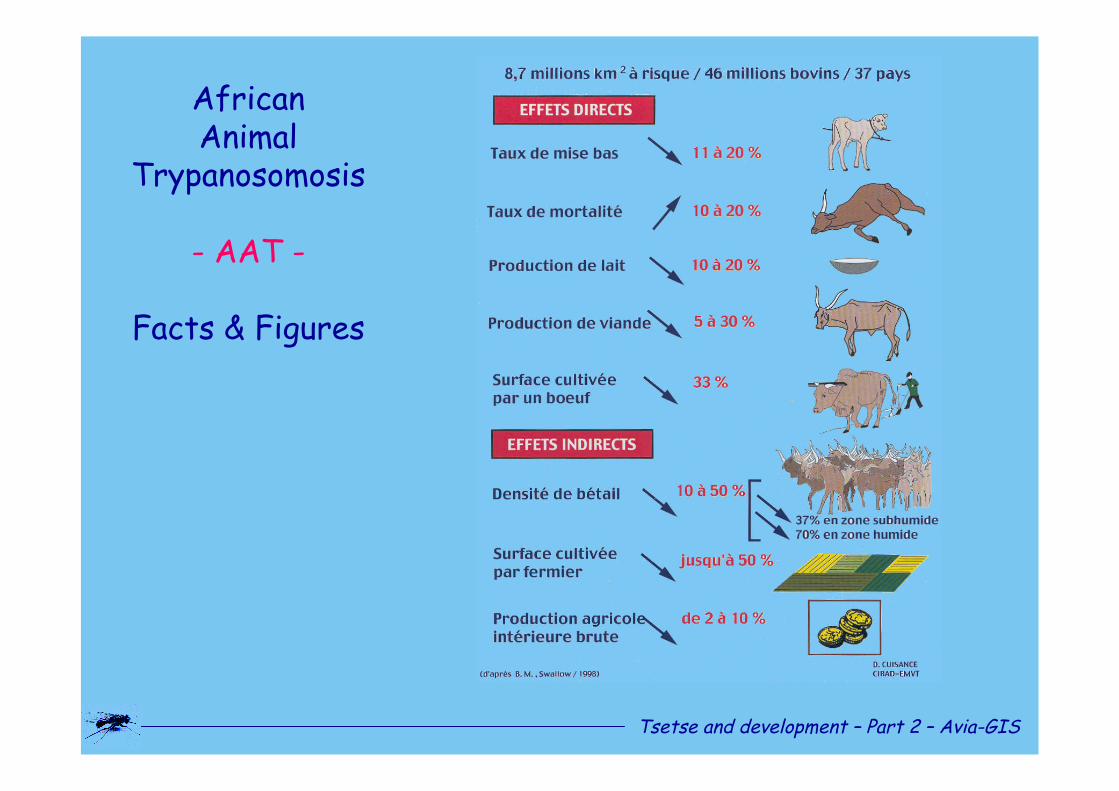
AfricanAnimal
Trypanosomosis
- AAT -
Facts & Figures
Tsetse and development –Part 2 –Avia-GIS
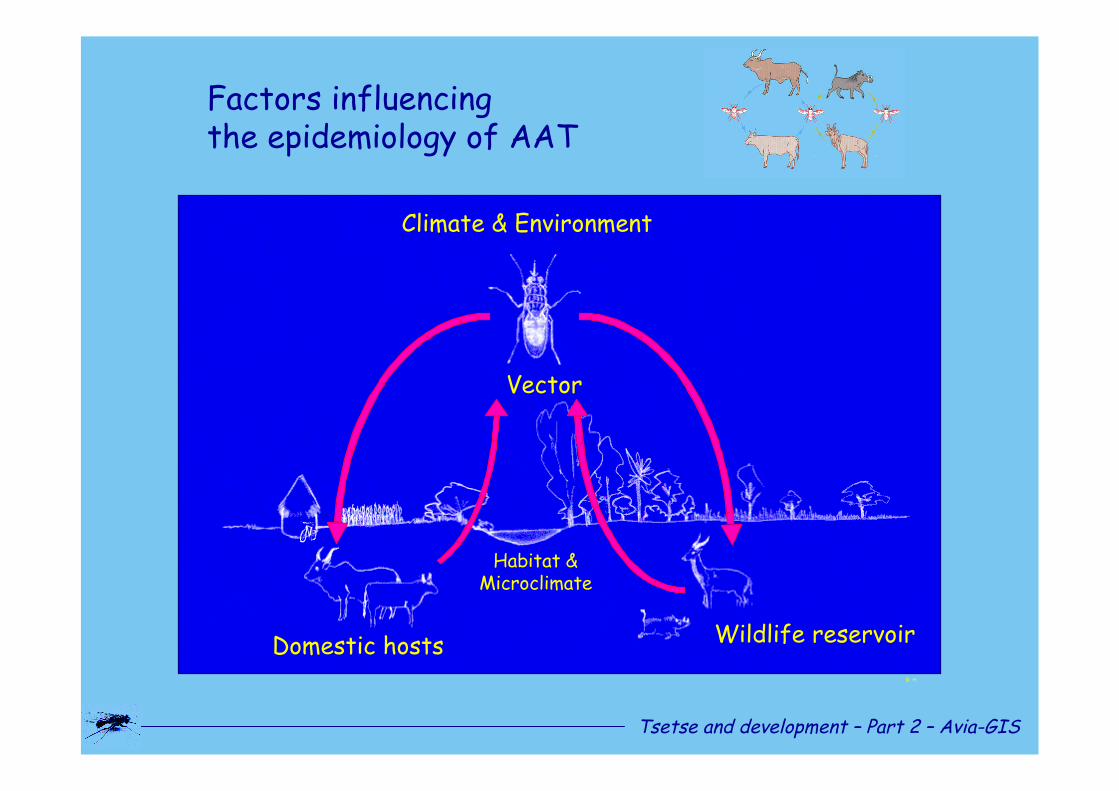
Habitat &Microclimate
Vector
Wildlife reservoirDomestic hosts
Climate & Environment
G. H.
Factors influencingthe epidemiology of AAT
Tsetse and development –Part 2 –Avia-GIS
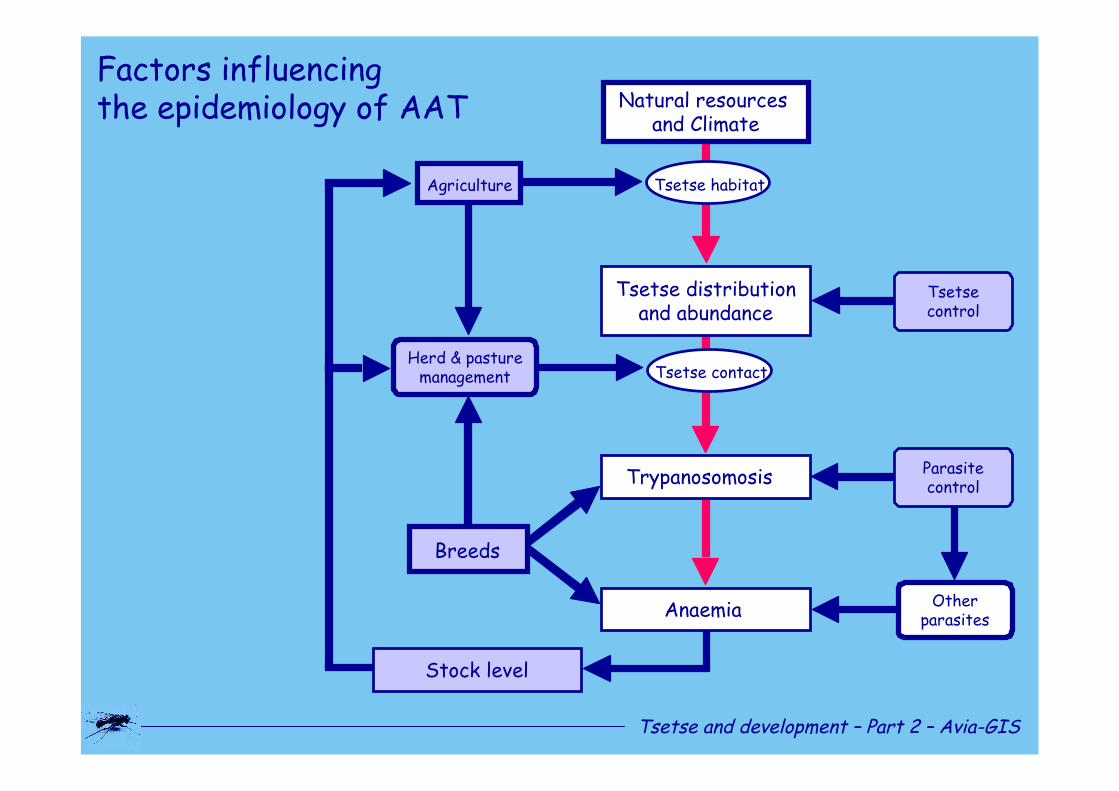
Tsetse distributionand abundance
Anaemia
Breeds
Agriculture
Natural resourcesand Climate
Tsetse habitat
Tsetse contact
Trypanosomosis
Tsetsecontrol
Otherparasites
Parasitecontrol
Herd & pasturemanagement
Stock level
Factors influencingthe epidemiology of AAT
Tsetse and development –Part 2 –Avia-GIS
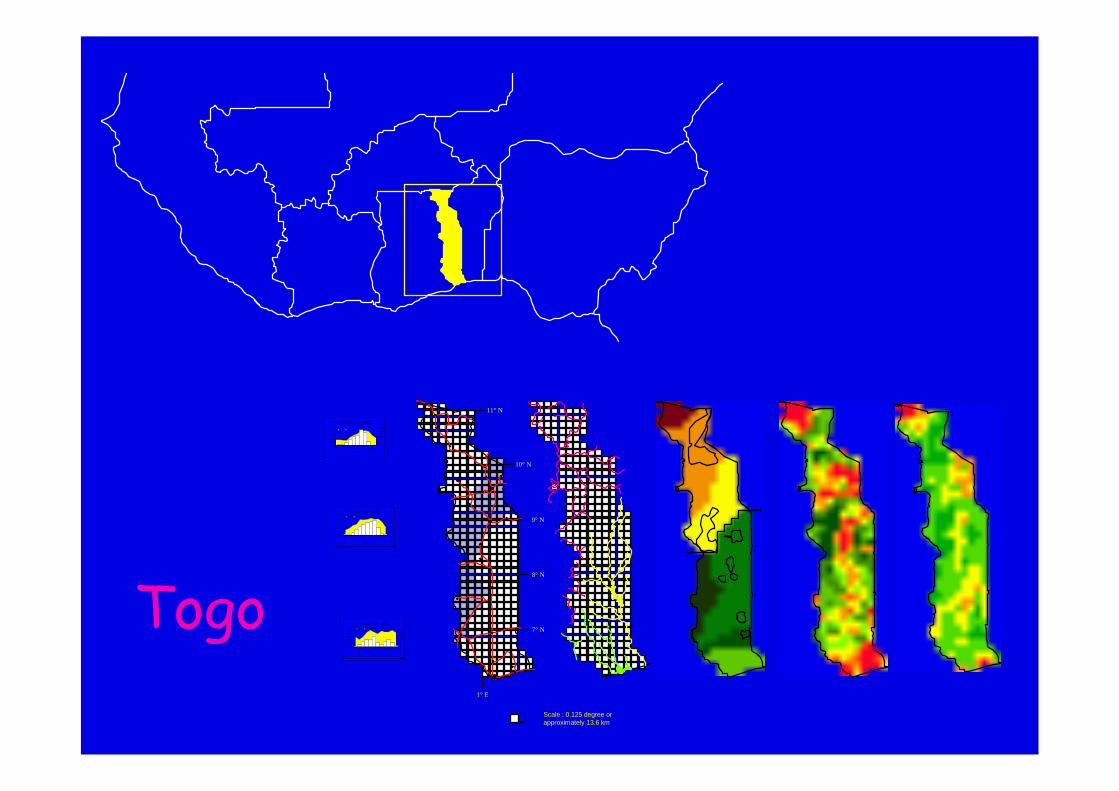
Togo
DAPAONG (0,275 - 1079)
0.000
0.100
0.200
0.300
0.400
0.500
1 2 3 4 5 6 7 8 9 10 11 12
Moi s
050100150200250300NDVI Pluviosité
SOKODE (0,368 - 1414)
0.000
0.100
0.200
0.300
0.400
0.500
1 2 3 4 5 6 7 8 9 10 11 12
Moi s
050100150200250300
NDVI Pluviosit é
TSEVIE (0,407 - 1043)
0.000
0.100
0.200
0.300
0.400
0.500
1 2 3 4 5 6 7 8 9 10 11 12
Moi s
050100150200250300
NDVI Pluviosit é
1° E
11° N
10° N
9° N
8° N
7° N
Scale : 0.125 degree orapproximately 13.6 km
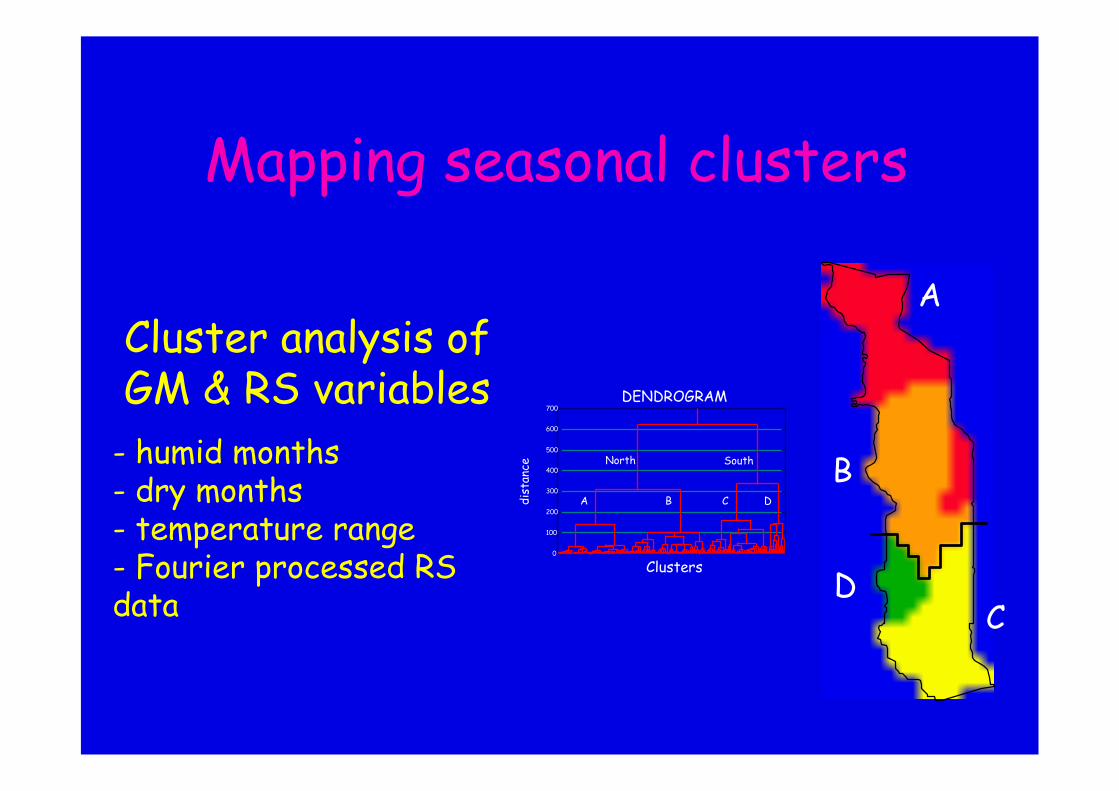
Mapping seasonal clusters
Clusters
DENDROGRAM
dist
ance
200
300
400
500
600
700
0
100
A B C D
North South
A
B
CD
Cluster analysis ofGM & RS variables
- humid months- dry months- temperature range- Fourier processed RSdata
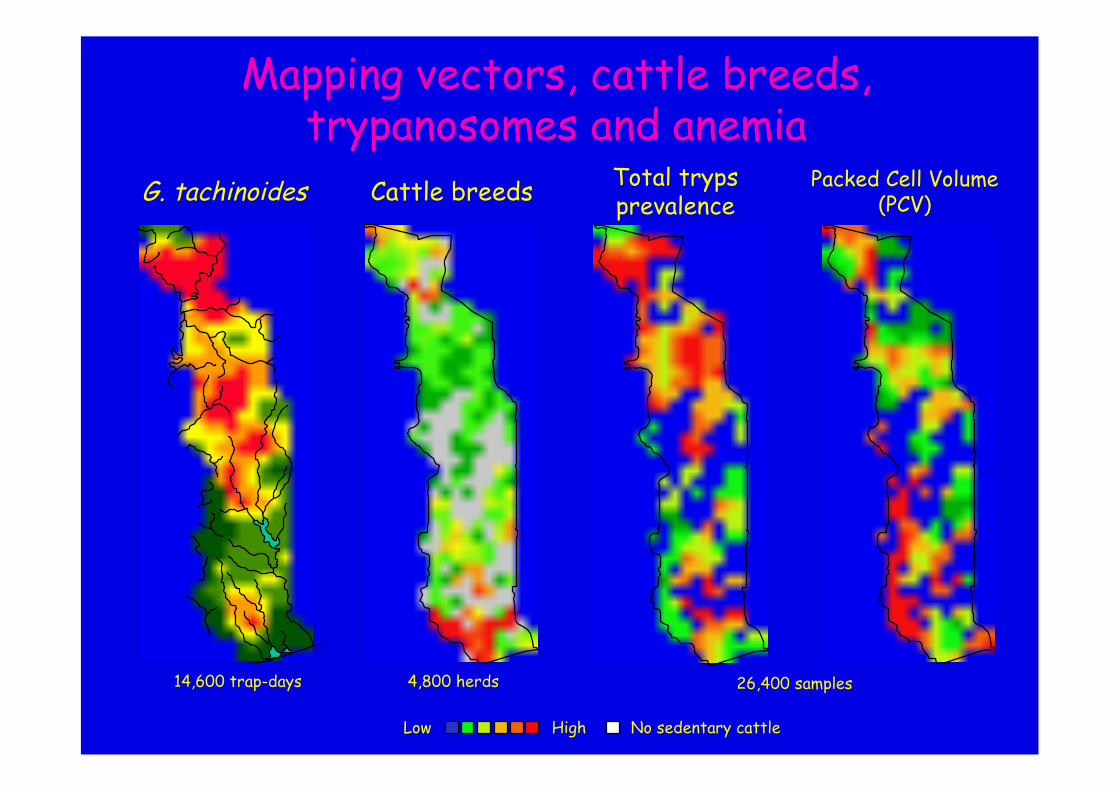
Mapping vectors, cattle breeds,trypanosomes and anemia
No sedentary cattleLow High
G. tachinoides Cattle breeds Total trypsprevalence
Packed Cell Volume(PCV)
14,600 trap-days 26,400 samples4,800 herds
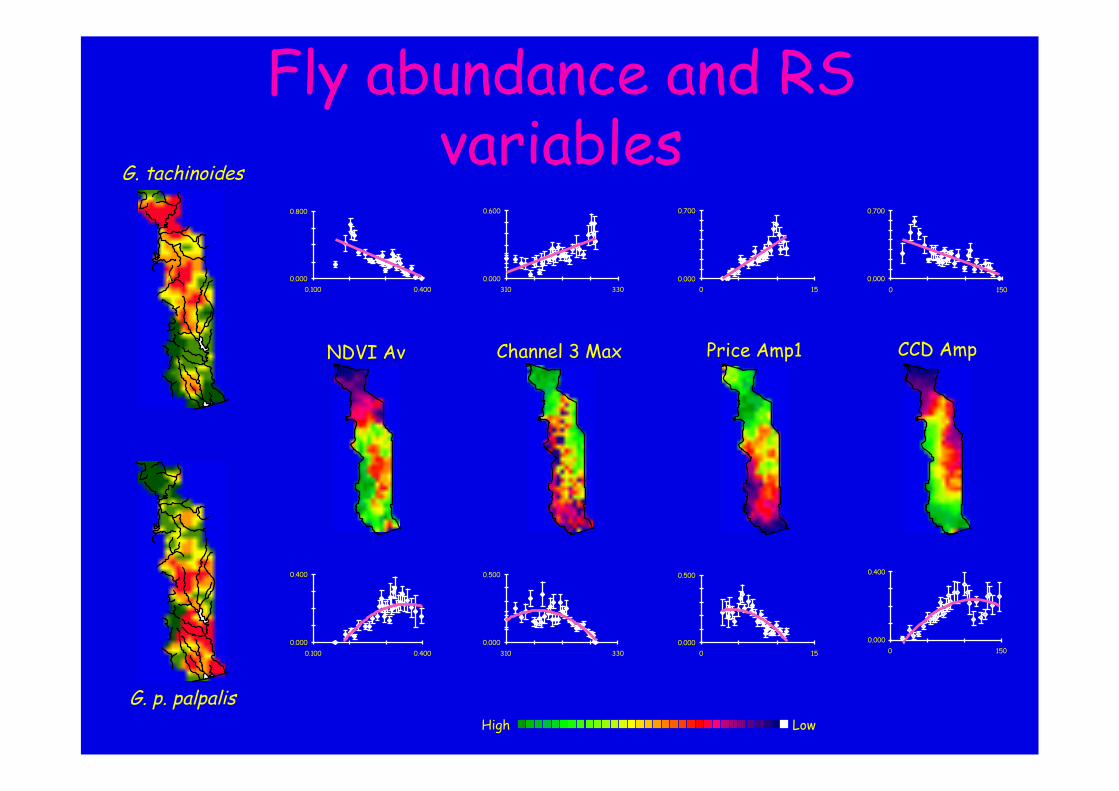
Fly abundance and RSvariables
0.000
0.800
0.100 0.400
NDVI Av
0.000
0.400
0.100 0.400
0.000
0.600
310 330
Channel 3 Max
0.000
0.500
310 3300.000
0.500
0 15
0.000
0.700
0 15
Price Amp1
0.000
0.700
0 150
CCD Amp
LowHigh
A.
G. tachinoides
G. p. palpalis
0.000
0.400
0 150
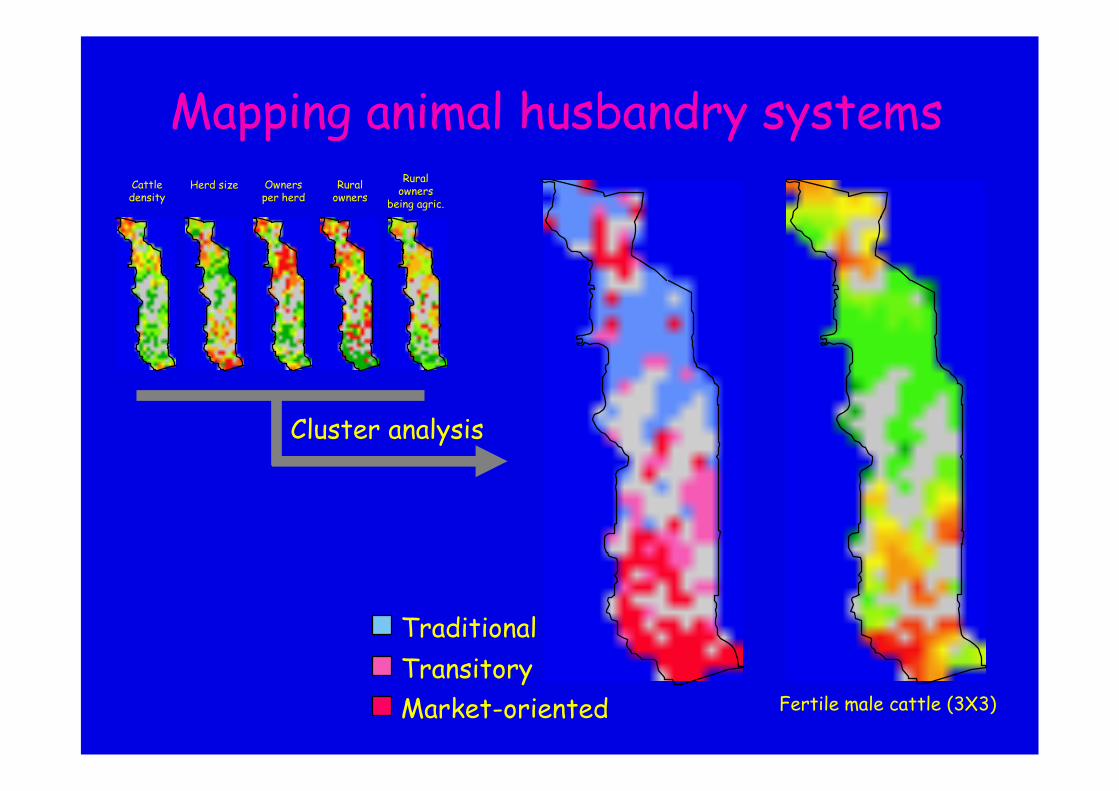
Mapping animal husbandry systemsCattledensity
Herd size Ownersper herd
Ruralowners
Ruralowners
being agric.
TraditionalTransitoryMarket-oriented Fertile male cattle (3X3)
Cluster analysis
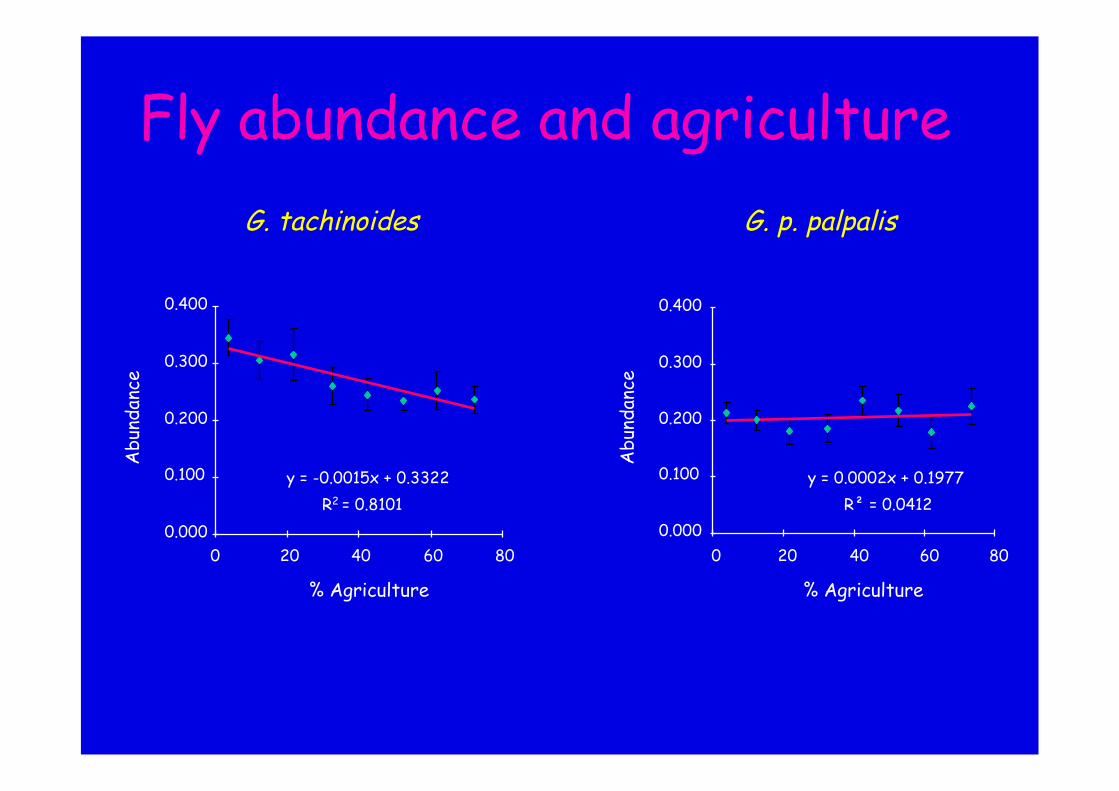
y = -0.0015x + 0.3322
R2 = 0.8101
0.000
0.100
0.200
0.300
0.400
0 20 40 60 80
% Agriculture
Abu
ndan
ce
y = 0.0002x + 0.1977
R² = 0.0412
0.000
0.100
0.200
0.300
0.400
% Agriculture
0 20 40 60 80
Abu
ndan
ce
Fly abundance and agricultureG. tachinoides G. p. palpalis
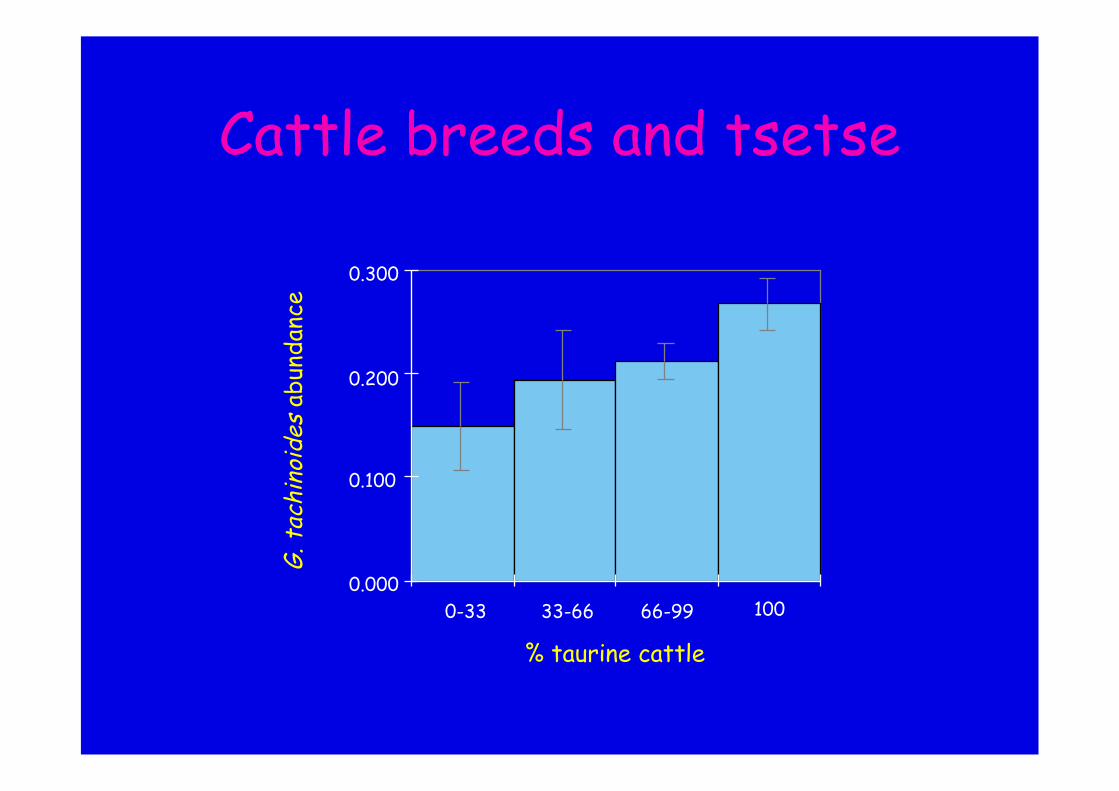
0.000
0.100
0.200
0.300
0-33 33-66 66-99 100
% taurine cattle
G.t
achi
noid
esab
unda
nce
Cattle breeds and tsetse
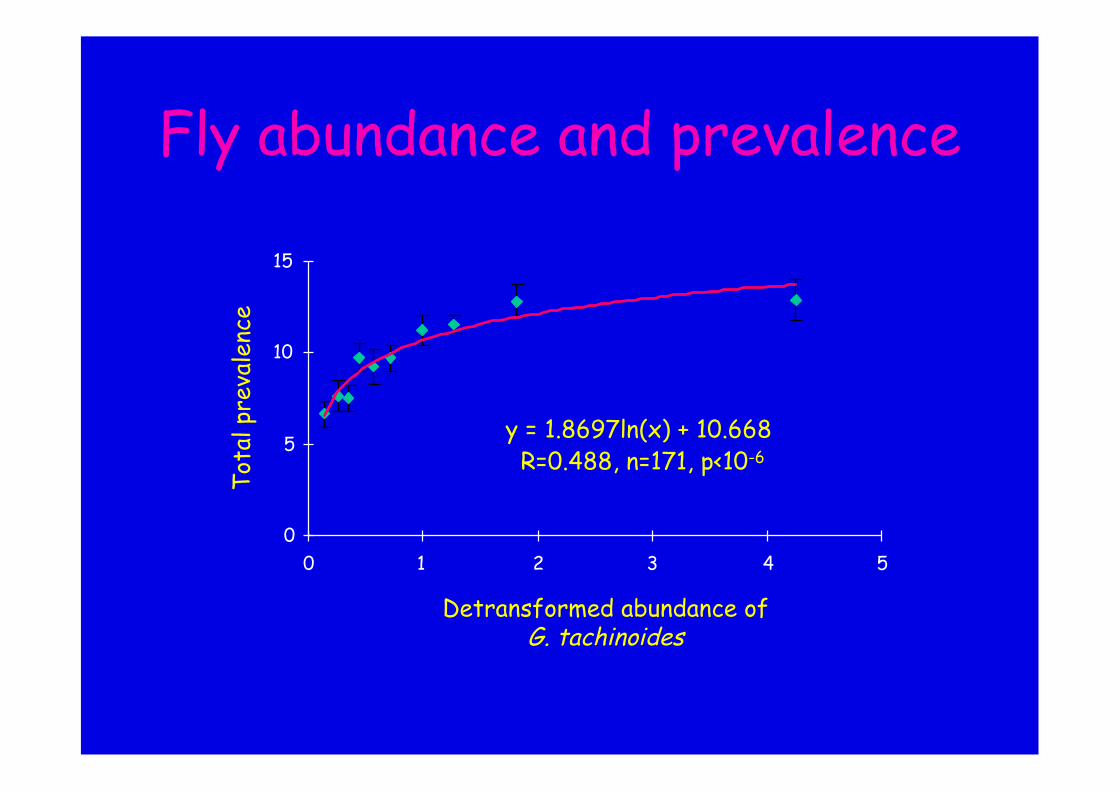
0
5
10
15
0 1 2 3 4 5
Detransformed abundance ofG. tachinoides
Tot
alpr
eval
ence
y = 1.8697ln(x) + 10.668R=0.488, n=171, p<10-6
Fly abundance and prevalence
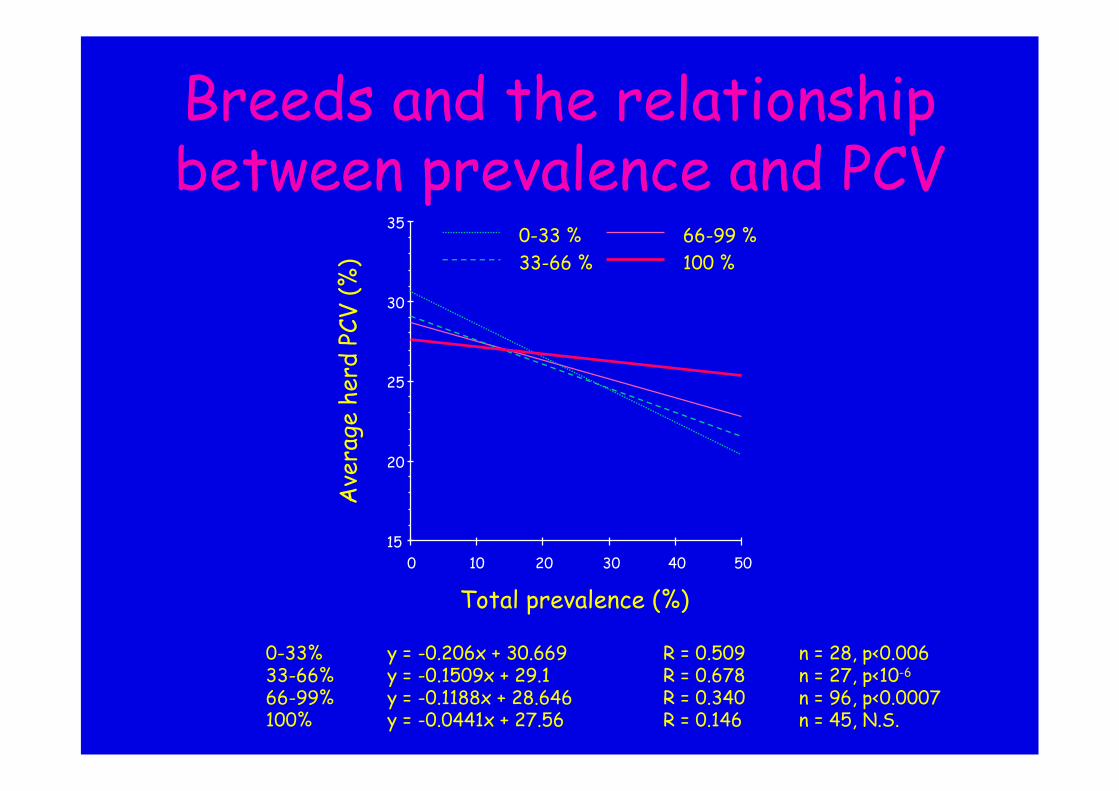
15
20
25
30
35
0 10 20 30 40 50
Total prevalence (%)
Ave
rage
herd
PCV
(%)
0-33 %33-66 %
66-99 %100 %
Breeds and the relationshipbetween prevalence and PCV
0-33%33-66%66-99%100%
y = -0.206x + 30.669y = -0.1509x + 29.1y = -0.1188x + 28.646y = -0.0441x + 27.56
R = 0.509R = 0.678R = 0.340R = 0.146
n = 28, p<0.006n = 27, p<10-6
n = 96, p<0.0007n = 45, N.S.
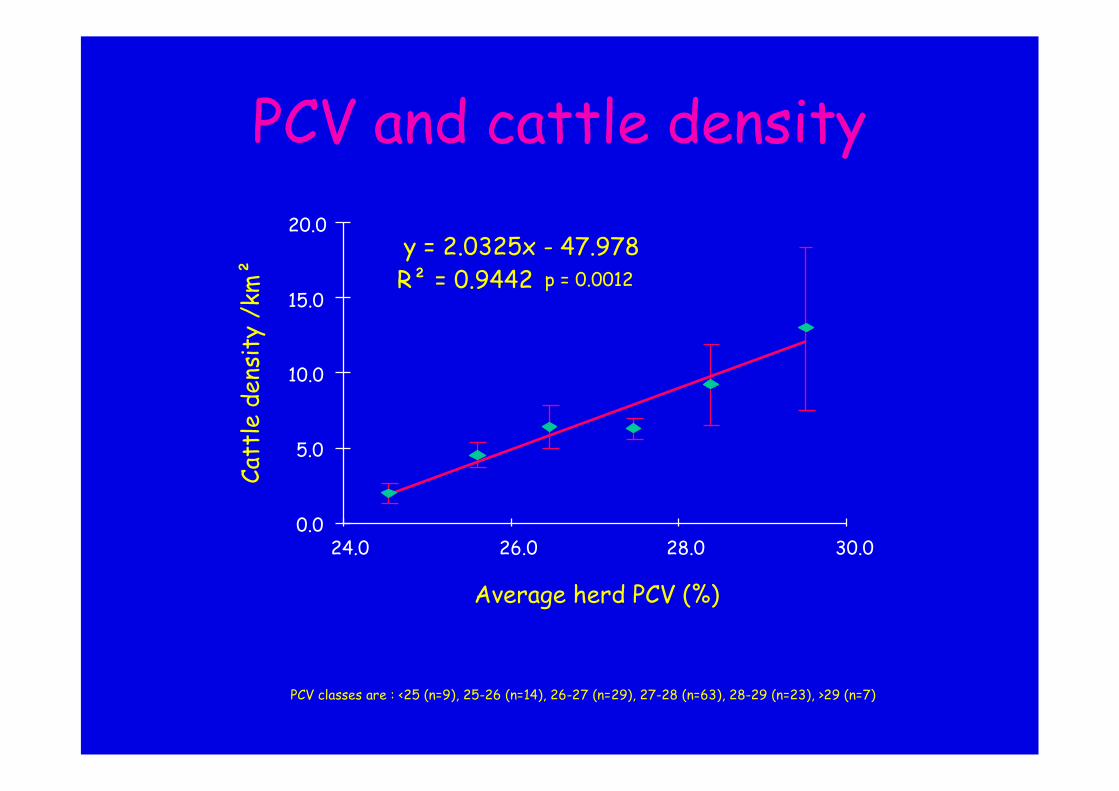
PCV classes are : <25 (n=9), 25-26 (n=14), 26-27 (n=29), 27-28 (n=63), 28-29 (n=23), >29 (n=7)
PCV and cattle density
0.0
5.0
10.0
15.0
20.0
24.0 26.0 28.0 30.0
Average herd PCV (%)
Catt
lede
nsit
y/k
m²
y = 2.0325x - 47.978R² = 0.9442 p = 0.0012
0
0.1
0.2
0.3
0.4
24 26 28 30
y = 2E-06e0.4028x
R² = 0.976
Average Packed Cell Volume (PCV)
Inte
grat
ion
Catt
le/
Crop
s
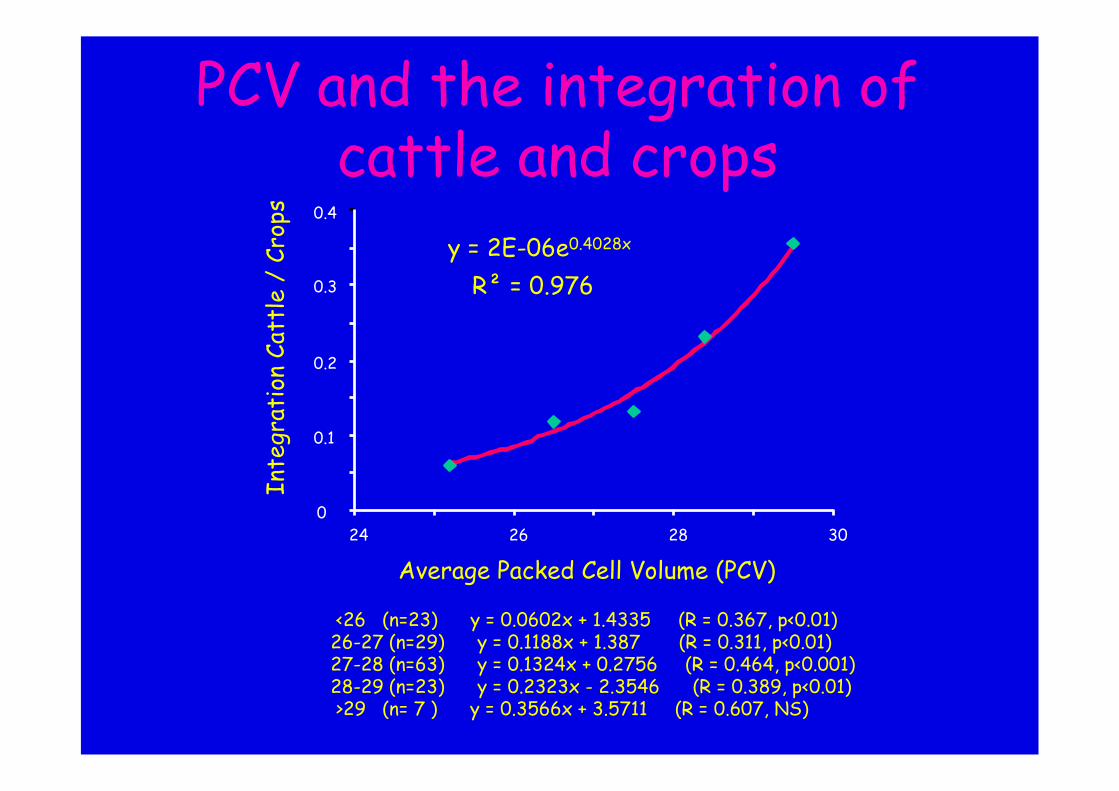
PCV and the integration ofcattle and crops
<26 (n=23) y = 0.0602x + 1.4335 (R = 0.367, p<0.01)26-27 (n=29) y = 0.1188x + 1.387 (R = 0.311, p<0.01)27-28 (n=63) y = 0.1324x + 0.2756 (R = 0.464, p<0.001)28-29 (n=23) y = 0.2323x - 2.3546 (R = 0.389, p<0.01)>29 (n= 7 ) y = 0.3566x + 3.5711 (R = 0.607, NS)
The epidemiology ofHuman Sleeping Sickness
(SS)
An intimate relationshipbetween vector and host.
Tsetse and development –Part 2 –Avia-GIS
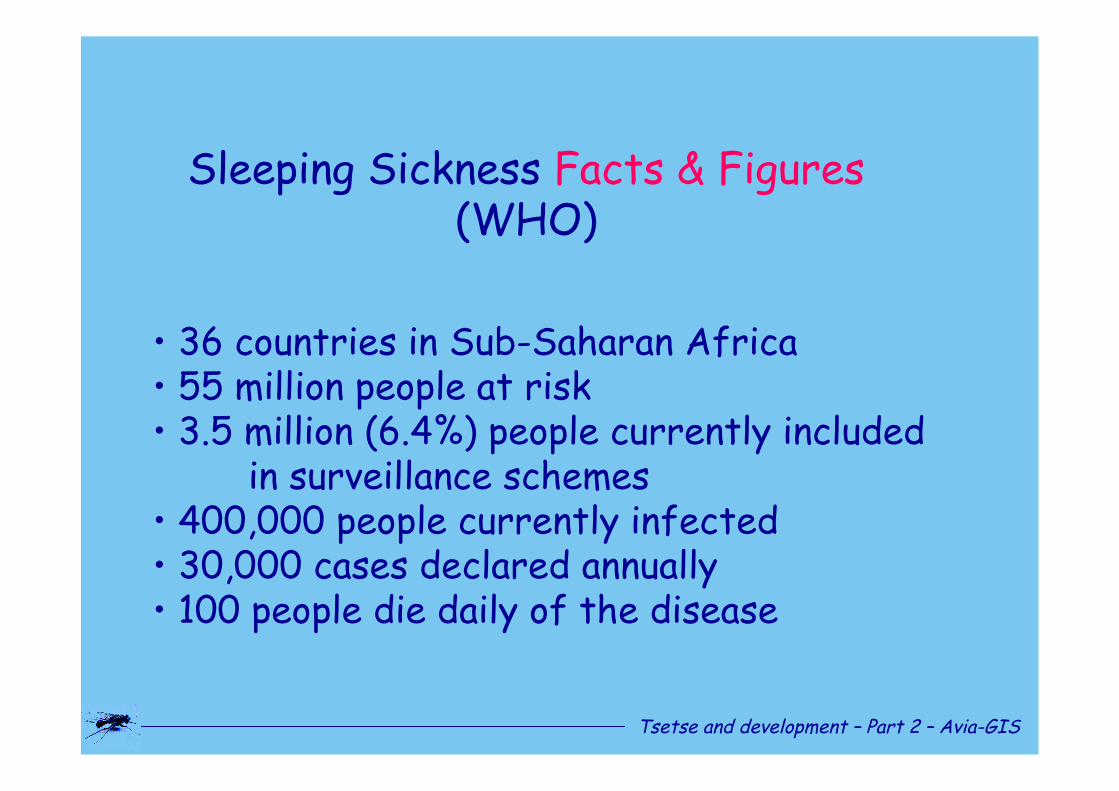
Sleeping Sickness Facts & Figures(WHO)
•36 countries in Sub-Saharan Africa•55 million people at risk•3.5 million (6.4%) people currently included
in surveillance schemes•400,000 people currently infected•30,000 cases declared annually•100 people die daily of the disease
Tsetse and development –Part 2 –Avia-GIS
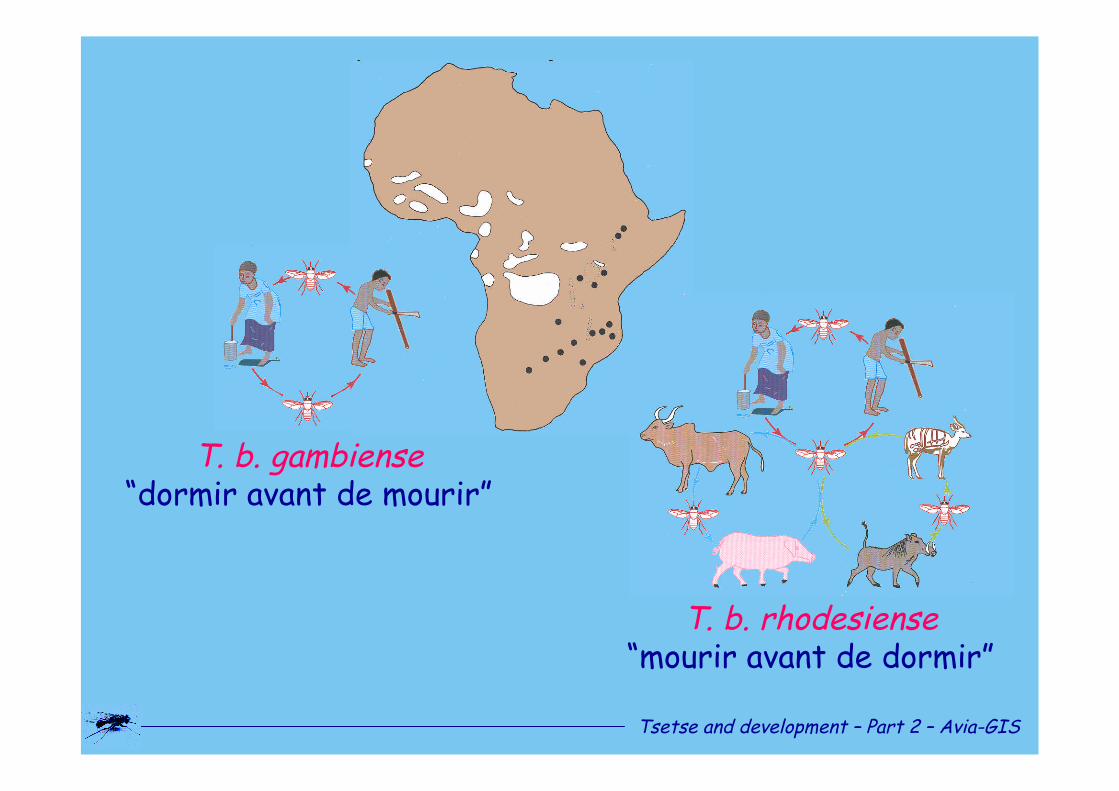
T. b. gambiense“dormir avant de mourir”
T. b. rhodesiense“mourir avant de dormir”
Tsetse and development –Part 2 –Avia-GIS
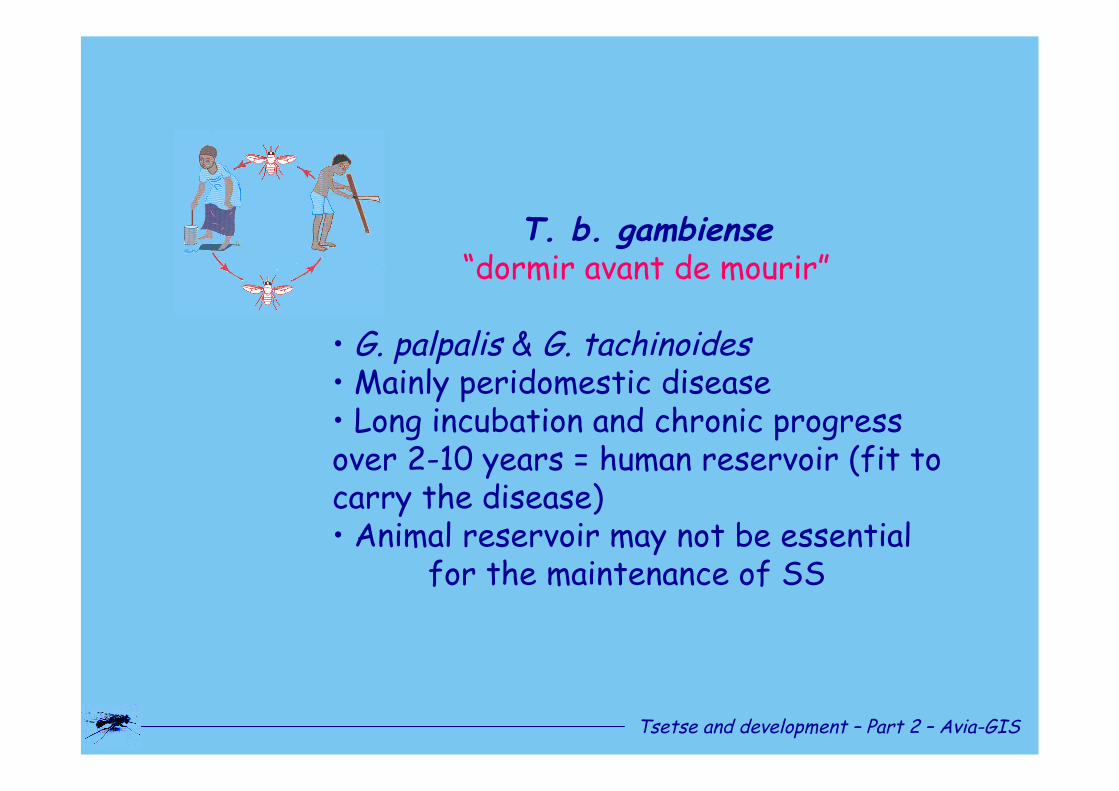
T. b. gambiense“dormir avant de mourir”
•G. palpalis & G. tachinoides•Mainly peridomestic disease•Long incubation and chronic progressover 2-10 years = human reservoir (fit tocarry the disease)•Animal reservoir may not be essential
for the maintenance of SS
Tsetse and development –Part 2 –Avia-GIS
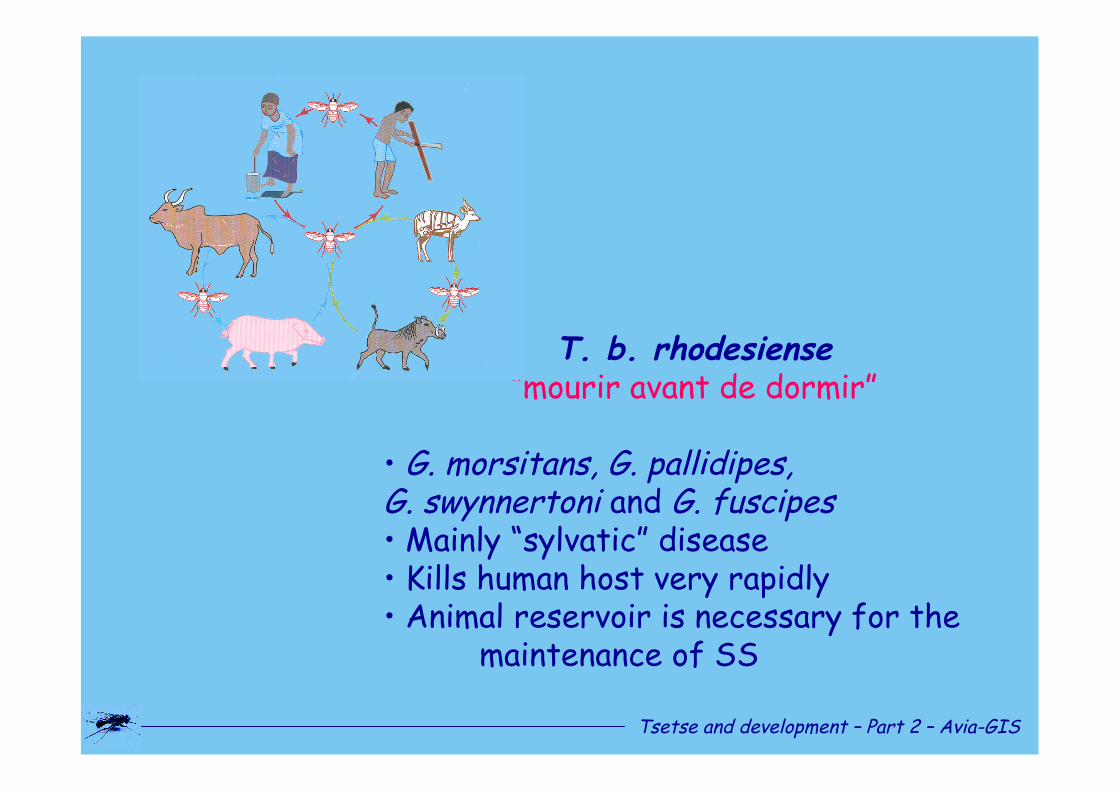
T. b. rhodesiense“mourir avant de dormir”
•G. morsitans, G. pallidipes,G. swynnertoni and G. fuscipes•Mainly “sylvatic”disease•Kills human host very rapidly•Animal reservoir is necessary for the
maintenance of SS
Tsetse and development –Part 2 –Avia-GIS
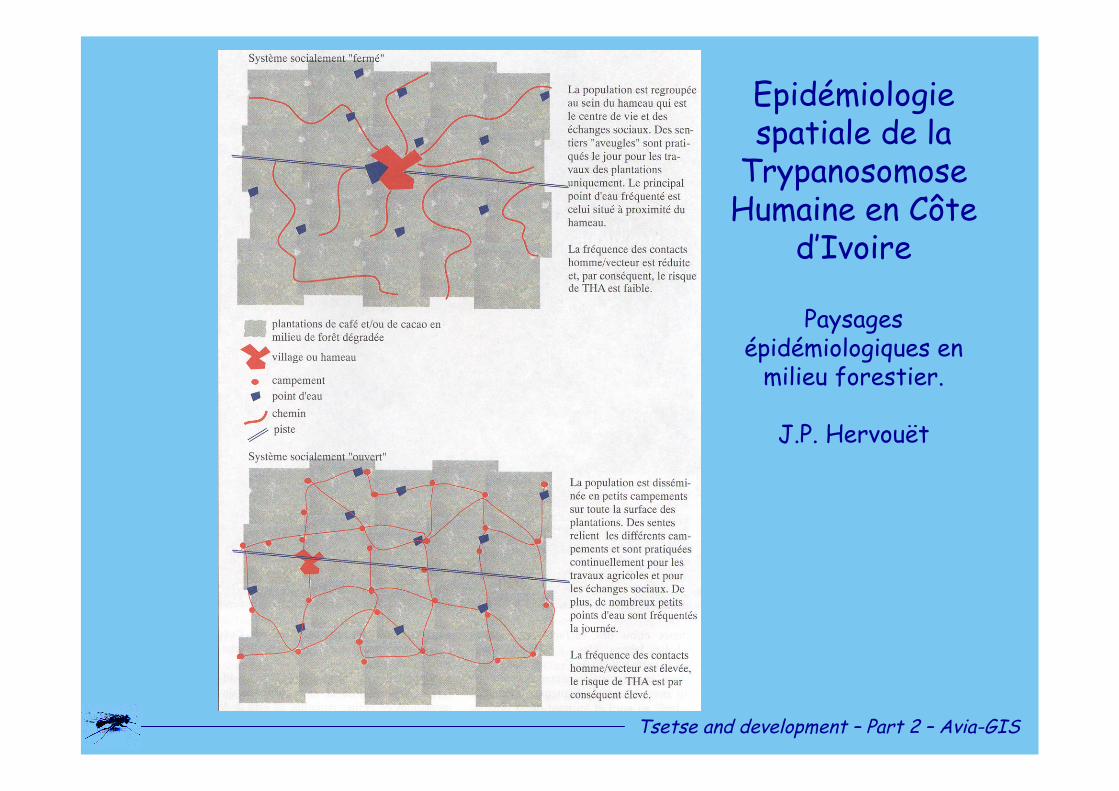
Epidémiologiespatiale de la
TrypanosomoseHumaine en Côte
d’Ivoire
Paysagesépidémiologiques en
milieu forestier.
J.P. Hervouët
Tsetse and development –Part 2 –Avia-GIS
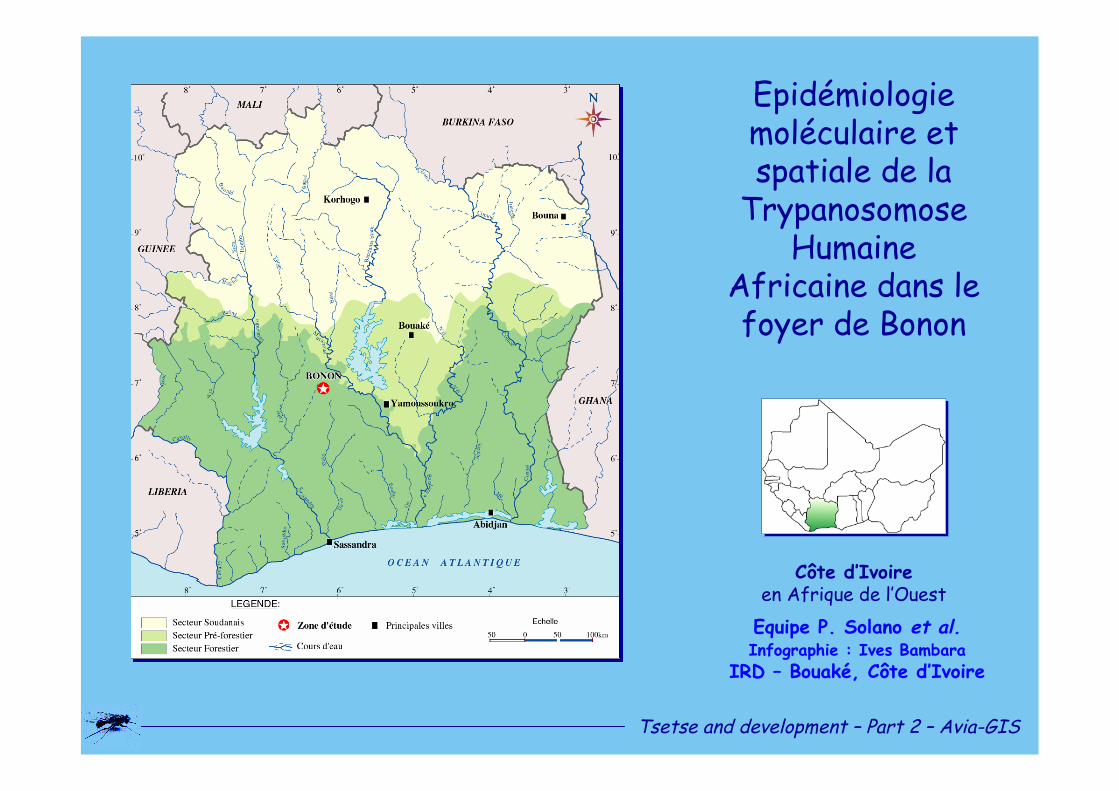
Côte d’Ivoireen Afrique de l’Ouest
Equipe P. Solano et al.Infographie : Ives Bambara
IRD –Bouaké, Côte d’Ivoire
Epidémiologiemoléculaire etspatiale de la
TrypanosomoseHumaine
Africaine dans lefoyer de Bonon
Tsetse and development –Part 2 –Avia-GIS
6°546°546°546°546°546°546°546°546°54
6°50
6°09 6°07
6°526°526°526°526°526°526°526°526°52
7°007°007°007°007°007°007°007°007°00
6°586°586°586°586°586°586°586°586°58
6°566°566°566°566°566°566°566°566°56
6°05 6°03 6°01 5°59 5°57 5°55
0 1
2 Km 3 Km
Echelle :
4 KmZegata
Ver
sD
aloa
Ver
sD
aloa
Ver
sD
aloa
Ver
sD
aloa
Ver
sD
aloa
Ver
sD
aloa
Ver
sD
aloa
Ver
sD
aloa
Ver
sD
aloa
BlanflaBlanflaBlanflaBlanflaBlanflaBlanflaBlanflaBlanflaBlanflaBiegonBiegonBiegonBiegonBiegonBiegonBiegonBiegonBiegon
KangretaKangretaKangretaKangretaKangretaKangretaKangretaKangretaKangreta
BONON VILLEBONON VILLEBONON VILLEBONON VILLEBONON VILLEBONON VILLEBONON VILLEBONON VILLEBONON VILLE BlablataBlablataBlablataBlablataBlablataBlablataBlablataBlablataBlablataGobazraGobazraGobazraGobazraGobazraGobazraGobazraGobazraGobazraDabouzraDabouzraDabouzraDabouzraDabouzraDabouzraDabouzraDabouzraDabouzra V
ers
Bou
aflé
Ver
sB
ouaf
léV
ers
Bou
aflé
Ver
sB
ouaf
léV
ers
Bou
aflé
Ver
sB
ouaf
léV
ers
Bou
aflé
Ver
sB
ouaf
léV
ers
Bou
aflé
Forêt classéeForêt classéeForêt classéeForêt classéeForêt classéeForêt classéeForêt classéeForêt classéeForêt classée
ParcParcParcParcParcParcParcParcParcNationalNationalNationalNationalNationalNationalNationalNationalNational
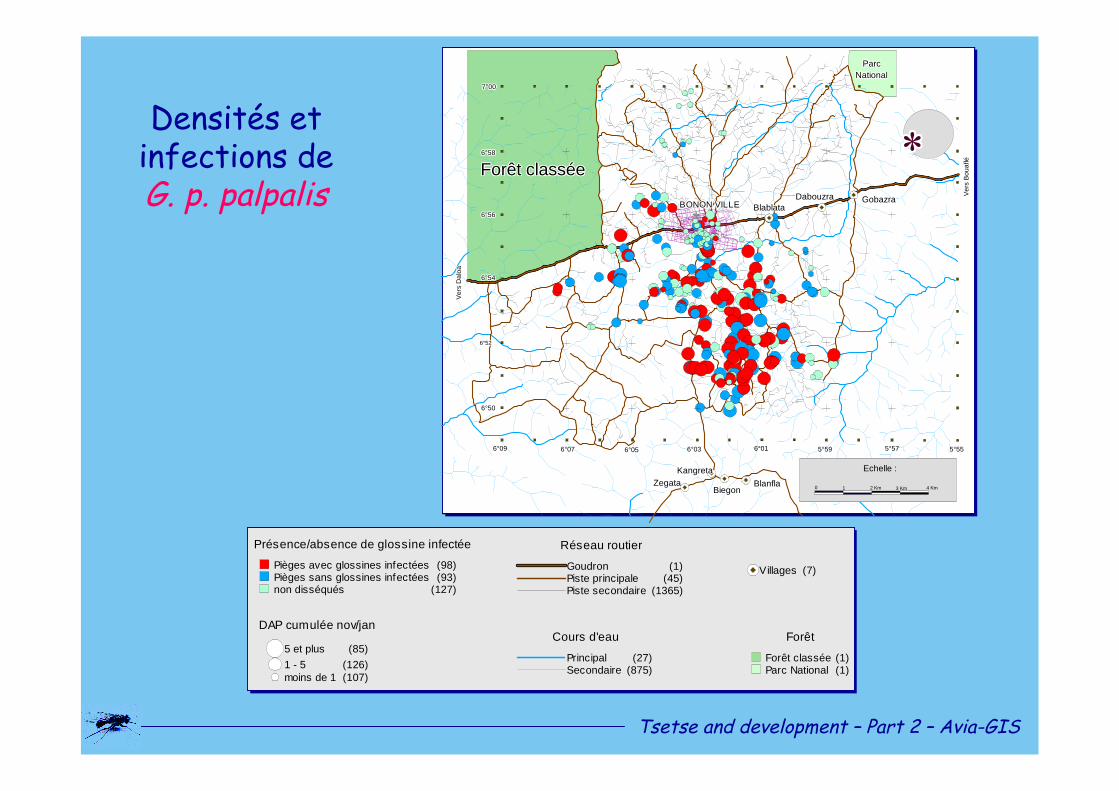
Densités etinfections deG. p. palpalis
Villages (7)
Forêt
Forêt classée (1)Parc National (1)
Cours d'eau
Principal (27)Secondaire (875)
Réseau routier
Goudron (1)Piste principale (45)Piste secondaire (1365)
DAP cumulée nov/jan
5 et plus (85)1 - 5 (126)moins de 1 (107)
Présence/absence de glossine infectée
Pièges avec glossines infectées (98)Pièges sans glossines infectées (93)non disséqués (127)
Tsetse and development –Part 2 –Avia-GIS
Ver
sD
aloa
Ver
sD
aloa
Ver
sD
aloa
Ver
sD
aloa
Ver
sD
aloa
Ver
sD
aloa
Ver
sD
aloa
Ver
sD
aloa
Ver
sD
aloa
Zegata
BONON VILLEBONON VILLEBONON VILLEBONON VILLEBONON VILLEBONON VILLEBONON VILLEBONON VILLEBONON VILLE
BlablataBlablataBlablataBlablataBlablataBlablataBlablataBlablataBlablata
DabouzraDabouzraDabouzraDabouzraDabouzraDabouzraDabouzraDabouzraDabouzra
BlanflaBlanflaBlanflaBlanflaBlanflaBlanflaBlanflaBlanflaBlanfla
KangretaKangretaKangretaKangretaKangretaKangretaKangretaKangretaKangreta
BiegonBiegonBiegonBiegonBiegonBiegonBiegonBiegonBiegon
GobazraGobazraGobazraGobazraGobazraGobazraGobazraGobazraGobazra Ver
sB
ouaf
léV
ers
Bou
aflé
Ver
sB
ouaf
léV
ers
Bou
aflé
Ver
sB
ouaf
léV
ers
Bou
aflé
Ver
sB
ouaf
léV
ers
Bou
aflé
Ver
sB
ouaf
lé
KouamekroSaakroSaakroSaakroSaakroSaakroSaakroSaakroSaakroSaakro
Ham.2 CôtesHam.2 CôtesHam.2 CôtesHam.2 CôtesHam.2 CôtesHam.2 CôtesHam.2 CôtesHam.2 CôtesHam.2 CôtesTiegbekroTiegbekroTiegbekroTiegbekroTiegbekroTiegbekroTiegbekroTiegbekroTiegbekro
6°566°566°566°566°566°566°566°566°56
6°586°586°586°586°586°586°586°586°58
7°007°007°007°007°007°007°007°007°00
6°506°506°506°506°506°506°506°506°50
6°546°546°546°546°546°546°546°546°54
6°526°526°526°526°526°526°526°526°52
6°096°096°096°096°096°096°096°096°09 6°076°076°076°076°076°076°076°076°07 6°056°056°056°056°056°056°056°056°05 6°036°036°036°036°036°036°036°036°03 6°016°016°016°016°016°016°016°016°01 5°595°595°595°595°595°595°595°595°59 5°575°575°575°575°575°575°575°575°57
Echelle :0 2 4 Km
Forêt classéeForêt classéeForêt classéeForêt classéeForêt classéeForêt classéeForêt classéeForêt classéeForêt classée
Parc NationalParc NationalParc NationalParc NationalParc NationalParc NationalParc NationalParc NationalParc National
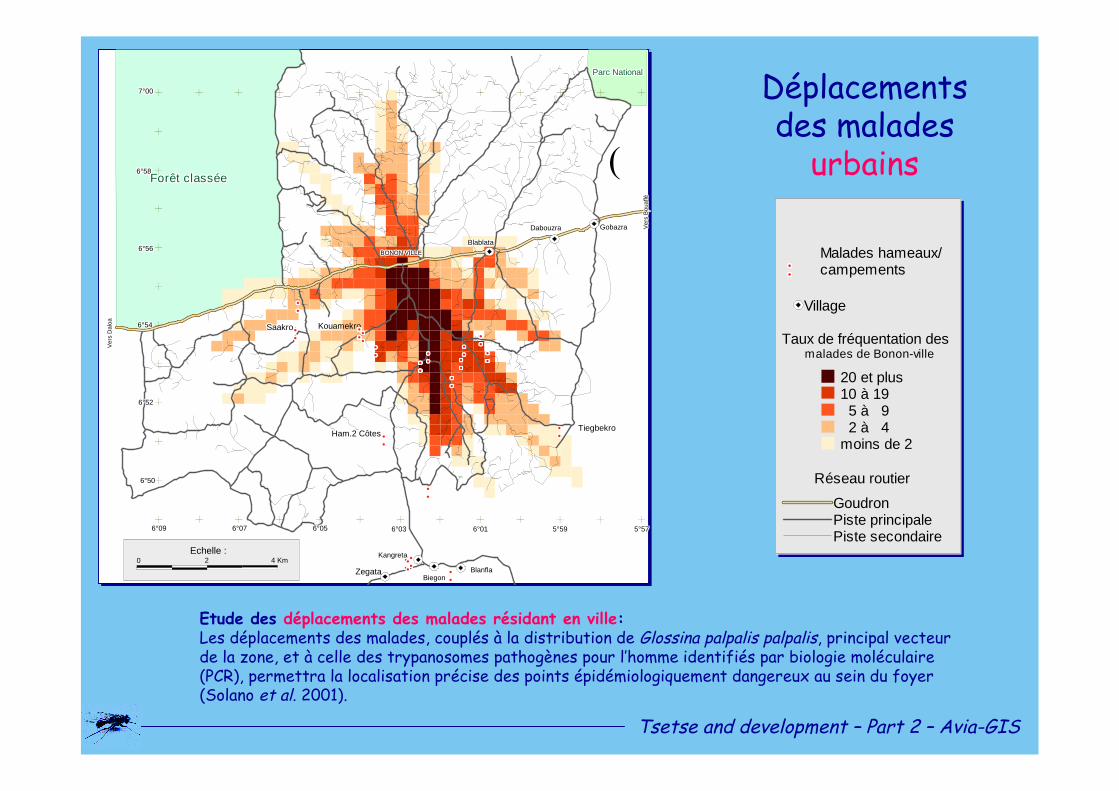
Taux de fréquentation desmalades de Bonon-ville
20 et plus10 à 19
5 à 92 à 4
moins de 2
Réseau routier
GoudronPiste principalePiste secondaire
Village
Malades hameaux/campements
Etude des déplacements des malades résidant en ville:Les déplacements des malades, couplés à la distribution de Glossina palpalis palpalis, principal vecteurde la zone, et à celle des trypanosomes pathogènes pour l’homme identifiés par biologie moléculaire(PCR), permettra la localisation précise des points épidémiologiquement dangereux au sein du foyer(Solano et al. 2001).
Déplacementsdes malades
urbains
Tsetse and development –Part 2 –Avia-GIS
Ham.2 Côtes
Kouamekro
Tiebekro
DabouzraDabouzraDabouzraDabouzraDabouzraDabouzraDabouzraDabouzraDabouzra
BONON VILLEBONON VILLEBONON VILLEBONON VILLEBONON VILLEBONON VILLEBONON VILLEBONON VILLEBONON VILLEBlablataBlablataBlablataBlablataBlablataBlablataBlablataBlablataBlablata
GobazraGobazraGobazraGobazraGobazraGobazraGobazraGobazraGobazra
BlanflaBlanflaBlanflaBlanflaBlanflaBlanflaBlanflaBlanflaBlanflaBiegonBiegonBiegonBiegonBiegonBiegonBiegonBiegonBiegon
KangretaKangretaKangretaKangretaKangretaKangretaKangretaKangretaKangreta
Zegata
0 2
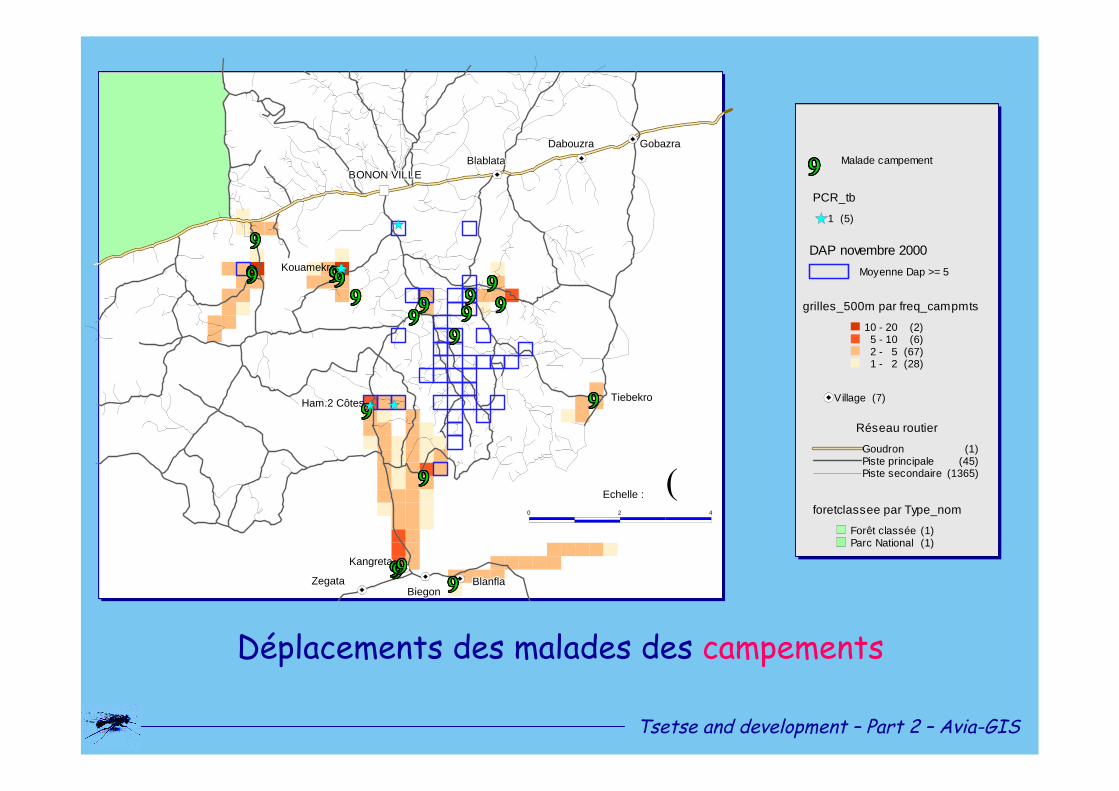
Echelle : 4 foretclassee par Type_nom
Forêt classée (1)Parc National (1)
Village (7)
Réseau routier
Goudron (1)Piste principale (45)Piste secondaire (1365)
grilles_500m par freq_campmts
10 - 20 (2)5 - 10 (6)2 - 5 (67)1 - 2 (28)
PCR_tb
1 (5)
DAP novembre 2000
Moyenne Dap >= 5
Malade campement
Déplacements des malades des campements
Tsetse and development –Part 2 –Avia-GIS
Selected references
de La Rocque, S. et al. (2001) Du satellite au microsatellite: Le risquetrypanosomien.
Hendrickx, G. (1999) Georeferenced decision support methodologytowards trypanosomosis management in West Africa.
Leak, G.A. (1999) Tsetse Biology and Ecology.
Molyneux, D.H. et Ashford R.W. (1983) The Biology of Trypanosomaand Leishmania.
Penchenier, L. et Laveissière, C. (2000) Manuels de lutte contre laMaladie du Sommeil en Afrique centrale et occidentale.
Rogers, D.J. & Williams, B.G. (1993) Monitoring trypanosomiasis inspace and time.
Solano, P. et al. (2001) Epidémiologie moléculaire et spatiale de laTrypanosomose Humaine Africaine dans le foyer de Bonon (Côted’Ivoire), résultats préliminaires.
Tsetse and development –Part 2 –Avia-GIS
Tsetseand their Impact on Development.
END Part 2G. Hendrickx Avia-GIS
Tsetse and development –Part 2 –Avia-GIS


![Starsin, Owners of cargo v Starsin, Owners &/or demise ... 2003.pdf · Starsin, Owners of cargo v Starsin, Owners &/or demise charterers [2003] APP.L.R. 03/13 ... owners under these](https://img.pdfslide.net/doc/110x75/5b34b4ba7f8b9aa0238e4fb6/starsin-owners-of-cargo-v-starsin-owners-or-demise-2003pdf-starsin.jpg)