Embed Size (px)
Citation preview

i
BC Timber Sales
Fort Nelson Timber Supply Area Timber Supply Review 3 Data Package July 9, 2004 Prepared for: Fort Nelson Timber Supply Area Defined Forest Area Management (DFAM) Group
A Project Forest Ecosystem Solutions Ltd. Submitted by: #210 – 275 Fell Avenue North Vancouver BC V7P 3R5 Contact: Chris Niziolomski R.P.F tel. (604) 998-2222 fax.(604) 986-0361 email: [email protected]
TS
R 3
Tim
be
r Su
pp
ly A
na
lysis
T
SR
3 T
imb
er S
up
ply
An
aly
sis
T
SR
3 T
imb
er S
up
ply
An
aly
sis
T
SR
3 T
imb
er S
up
ply
An
aly
sis
Da
ta P
ac
ka
ge
D
ata
Pa
ck
ag
e
Da
ta P
ac
ka
ge
D
ata
Pa
ck
ag
e
Fort Nelson DFAM TSR 3
i
Acknowledgements The development of this data package could not happen without the dedicated efforts and hard work of the people and organizations listed below. Special thanks to Kevin Kuhn, Darrell Regimbald, Ian Graeme, Albert Nussbaum, Qiong Su, Melanie Boyce, Ron Planden, Doug Beckett, Bob Krahn, Steve Lindsey, Bob Phipps, Steve Joyce, Rene Alfaro, Bob Hodgkinson and Lynn Blouw. Canfor Group – Fort Nelson Division Canfor Group – Head Office BCTS – Peace Liard Business Area BC Ministry of Forests – Fort Nelson Forest District and Northern Interior Forest Region BC Ministry of Sustainable Resource Management – Prince George BC Water Land and Air Protection BC MOF Forest Analysis Branch Canadian Forest Service – Pacific Forest Region

Fort Nelson DFAM TSR 3
iii
Table of Contents
Acknowledgements ................................................................................................................................ i Table of Contents.................................................................................................................................iii List of Tables ....................................................................................................................................... vi List of Acronyms................................................................................................................................... 1
1 Introduction.................................................................................................................................. 3 1.1 Purpose of the data package ........................................................................................................... 4 1.2 Process............................................................................................................................................... 4
2 Inventory and model files............................................................................................................. 6 2.1 Data Sources..................................................................................................................................... 6
2.1.1 Vegetation Resource Inventory ..................................................................................................... 8 2.1.2 PEM/TEM Mapping...................................................................................................................... 8 2.1.3 Karst Potential Inventory............................................................................................................... 8 2.1.4 Ownership Inventory ..................................................................................................................... 9 2.1.5 BC Parks and Protected Area Boundaries ..................................................................................... 9 2.1.6 Road data ....................................................................................................................................... 9 2.1.7 TRIM data ..................................................................................................................................... 9 2.1.8 Visual landscape inventory............................................................................................................ 9
3 Land base.................................................................................................................................... 10 3.1 Timber harvesting land base definition ....................................................................................... 10
3.1.1 Reasons for changes to the THLB since TSR 2 .......................................................................... 12 3.2 Exclusions from the TSA Land Base............................................................................................ 12
3.2.1 Administrative classes that do not contribute to TSA forest management objectives................. 12 3.3 Exclusions from the Crown Forest Land Base............................................................................ 13
3.3.1 Non-forest and non-productive forest.......................................................................................... 13 3.3.2 Alpine .......................................................................................................................................... 14 3.3.3 Non-commercial cover ................................................................................................................ 15 3.3.4 Existing roads, trails and landings............................................................................................... 15
3.4 Exclusions from the Timber Harvesting Land Base................................................................... 17 3.4.1 Parks, UREPs and Ecological Reserves ...................................................................................... 17 3.4.2 NSR from wildfire, non-productive or misclassified .................................................................. 17 3.4.3 Non-merchantable forest types.................................................................................................... 17 3.4.4 Sites with low growing potential ................................................................................................. 18 3.4.5 Riparian reserve and management zones..................................................................................... 19
3.4.5.1 Streams ............................................................................................................................................. 19 3.4.5.2 Lakes and wetlands........................................................................................................................... 20
3.4.6 Environmentally sensitive areas .................................................................................................. 20 3.4.7 Terrain Reconnaissance Mapping ............................................................................................... 21 3.4.8 Wildlife range burns .................................................................................................................... 22 3.4.9 Stand-level biodiversity – wildlife tree retention ........................................................................ 22 3.4.10 Oil and Gas and Transmission Lines ........................................................................................... 22

Fort Nelson DFAM TSR 3
iv
3.4.11 Inoperable/inaccessible/uneconomical areas ............................................................................... 24 3.4.12 Black spruce-leading stands ........................................................................................................ 25 3.4.13 Cultural heritage resources .......................................................................................................... 25 3.4.14 Future roads, trails and seismic ................................................................................................... 26 3.4.15 Future wildlife tree patches ......................................................................................................... 27
4 Management zones and analysis units ...................................................................................... 33 4.1 Management zones and objectives ............................................................................................... 33 4.2 Analysis units.................................................................................................................................. 33
5 Growth and Yield........................................................................................................................ 38 5.1 Site index......................................................................................................................................... 38
5.1.1 Site curves ................................................................................................................................... 38 5.1.2 Site index adjustments ................................................................................................................. 38
5.2 Utilization level............................................................................................................................... 39 5.3 Decay, waste and breakage for unmanaged stands .................................................................... 39 5.4 Operational adjustment factors for managed stands ................................................................. 39 5.5 Volume reductions ......................................................................................................................... 40 5.6 Other issues related to yield table development.......................................................................... 40
5.6.1 Yields for Natural (Unmanaged) Stands...................................................................................... 40 5.6.2 Yields for Existing Managed Stands ........................................................................................... 40 5.6.3 Yields for Current and Future Managed Stands .......................................................................... 41 5.6.4 Existing timber volume check ..................................................................................................... 41
6 Silviculture.................................................................................................................................. 42 6.1 Silviculture management regimes................................................................................................. 42
6.1.1 Unmanaged Stands ...................................................................................................................... 42 6.1.2 Managed Stands........................................................................................................................... 43
6.1.2.1 Existing managed stands................................................................................................................... 43 6.1.2.2 Current and future managed stands .................................................................................................. 44
6.2 Species conversion.......................................................................................................................... 45 6.3 Gene resources — use of select seed............................................................................................. 45 6.4 Backlog and current not satisfactorily restocked areas ............................................................. 47
7 Unsalvaged Losses...................................................................................................................... 48 7.1 Spruce budworm............................................................................................................................ 48 7.2 Spruce beetle .................................................................................................................................. 49 7.3 Fire .................................................................................................................................................. 50
8 Resource Management Emphasis ............................................................................................. 51 8.1 Adjacency cutblock green-up........................................................................................................ 52 8.2 Visual resources ............................................................................................................................. 52
8.2.1 Established Visual Quality Objectives ........................................................................................ 52 8.2.2 Recommended Visual Quality Classes........................................................................................ 53
8.3 Recreation resources...................................................................................................................... 53

Fort Nelson DFAM TSR 3
v
8.4 Wildlife............................................................................................................................................ 54 8.4.1 Wildlife habitat — identified wildlife ......................................................................................... 54 8.4.2 Caribou winter habitat ................................................................................................................. 56
8.5 Biodiversity..................................................................................................................................... 56 8.5.1 Landscape-level biodiversity....................................................................................................... 56
8.5.1.1 Policy framework ............................................................................................................................. 56 8.5.1.2 Landscape units ................................................................................................................................ 56 8.5.1.3 Biodiversity emphasis options and forest cover requirements.......................................................... 56
8.6 Domestic Water Resources............................................................................................................ 57 9 Timber harvesting....................................................................................................................... 59
9.1 Minimum harvestable age............................................................................................................. 59 9.2 Harvest systems.............................................................................................................................. 59 9.3 Initial harvest rate.......................................................................................................................... 59 9.4 Harvest rules .................................................................................................................................. 59 9.5 Disturbing the non-timber harvesting land base ........................................................................ 60 9.6 Timber supply model..................................................................................................................... 61
10 Timber Supply Forecast /Options /Sensitivity Analyses ....................................................... 62 10.1 Harvest flow objectives for the base case..................................................................................... 62 10.2 Sensitivity analyses......................................................................................................................... 62
11 References............................................................................................................................... 64
Appendix 1: Stream Riparian Classification Methodology .............................................................. 66
Appendix 2: Yield curves.................................................................................................................... 69
Appendix 3: Landscape Unit and Biodiversity Emphasis Options................................................... 75
Appendix 4: Minimum Harvest Ages ................................................................................................ 76
Fort Nelson DFAM TSR 3
vi
List of Tables Table 1: Timber supply review steps with roles and responsibilities ................................................... 5 Table 2: Inventory information for the Fort Nelson TSA ..................................................................... 7 Table 3: Timber harvesting land base determination for the Fort Nelson TSA.................................. 11 Table 4: Land that contributes to the TSA forest management or biodiversity objectives (i.e. Crown
forest land base) due to ownership.............................................................................................. 13 Table 5: Land that does not contribute to the TSA forest management or biodiversity objectives due
to ownership ................................................................................................................................ 13 Table 6: Areas in non-forest and non-productive forest ..................................................................... 14 Table 7: Reduction for alpine and sub alpine tundra .......................................................................... 14 Table 8: Non-commercial brush.......................................................................................................... 15 Table 9: Reductions for existing roads................................................................................................ 16 Table 10: Reductions for within block roads and trails ...................................................................... 16 Table 11: Park, UREPs and Ecological reserve reductions ................................................................ 17 Table 12: NSR from wildfire, non-productive or misclassified.......................................................... 17 Table 13: Non-merchantable forest types ........................................................................................... 18 Table 14: Criteria to identify stands with low growing potential ....................................................... 18 Table 15: Riparian reserve and management zone widths for streams ............................................... 19 Table 16: Riparian reserve and management zone widths for lakes and wetlands ............................. 20 Table 17: Environmentally sensitive areas.......................................................................................... 21 Table 18: Terrain reconnaissance reductions based on Level D mapping.......................................... 21 Table 19: Wildlife range burns............................................................................................................ 22 Table 20: Reductions for wildlife tree patch/retention........................................................................ 22 Table 21: Transmission lines, oil and gas activity reductions............................................................ 23 Table 22: Operable/inoperable classification...................................................................................... 24 Table 23: Reduction to black-spruce leading stands........................................................................... 25 Table 24: Future road reductions ........................................................................................................ 26 Table 25: Future wildlife tree retention required by landscape unit and BEC subzone...................... 28 Table 26: Resource emphasis zones in the Fort Nelson TSA ............................................................. 33 Table 27: Primary and secondary analysis units for the Fort Nelson TSA......................................... 34 Table 28: Existing natural stand primary analysis unit and site index................................................ 36 Table 29: Existing managed stand analysis unit and site index .......................................................... 37 Table 30: Current/future managed stand analysis unit and site index................................................. 37 Table 31: Source of site index equations ............................................................................................ 38 Table 32: Minimum utilization levels ................................................................................................. 39 Table 33: Non-merchantable species volume exclusions ................................................................... 40 Table 34: Existing timber volume check............................................................................................. 41 Table 35: Unmanaged stand regeneration assumptions for existing stands and all stands harvested
prior to 1990................................................................................................................................ 43 Table 36: Existing managed stand regeneration rules......................................................................... 44 Table 37: Current and future managed stand regeneration rules ........................................................ 45 Table 38: Historical use of seed source in the Fort Nelson TSA ........................................................ 46 Table 39: Future genetic worth by SPU and year with calculated net genetic gain............................ 46 Table 40: Backlog and current not satisfactorily restocked stands ..................................................... 47 Table 41: Area (ha) in NSR that contributes to the THLB by analysis unit ....................................... 47

Fort Nelson DFAM TSR 3
vii
Table 42: Unsalvaged losses ............................................................................................................... 48 Table 43: Forest cover rules for the Fort Nelson TSA........................................................................ 51 Table 44: Range of allowable percent alteration................................................................................. 53 Table 45: Proposed forest cover requirements for RVQC .................................................................. 53 Table 46: Table of Red and Blue listed species in the Fort Nelson TSA............................................ 54 Table 47: List of MWLAP priorities for developing ungulate winter range and IWMS.................... 55 Table 48: Recommended seral stage distribution for each biogeoclimatic unit and natural disturbance
type combination ......................................................................................................................... 57 Table 49: Seral stage definitions by biogeoclimatic unit and natural disturbance type...................... 57 Table 50: Domestic water licence intakes........................................................................................... 58 Table 51: Minimum target area to be disturbed annually in each BEC variant .................................. 60 Table 52: Proposed sensitivity analysis for the Fort Nelson TSA ...................................................... 63 Table 53: Calculations for S1 to S4 streams ...................................................................................... 67 Table 54: Calculations for S5 and S6 streams..................................................................................... 67 Table 55: Riparian reserve and management zone widths.................................................................. 67 Table 56: Secondary analysis unit yield tables (m3/hectare) for existing natural stands VRI Rolled
Over (enr) using VDYP............................................................................................................... 69 Table 57: Secondary analysis unit yield tables (m3/hectare) for existing natural stands VRI Phase II
(en2) using VDYP....................................................................................................................... 71 Table 58: Secondary analysis unit yield tables (m3/hectare) for existing managed stands VRI “roll
over” (emr) using TIPSY ............................................................................................................ 73 Table 59: Secondary analysis unit yield tables (m3/hectare) for current/future managed stands VRI
“roll over” (cfmr) and Phase 2 (cfm2) using TIPSY................................................................... 74 Table 60: Minimum harvest age based on minimum volume (140m3/ha) and 95% of maximum MAI
for existing natural stands ........................................................................................................... 76 Table 61: Minimum harvest age based on minimum harvest volume (140m3/ha) and 95% of
maximum MAI for Existing Managed Stands ............................................................................ 77 Pine 77 Table 62: Minimum harvest age based on minimum harvest volume (140m3/ha) and 95% of
maximum MAI for Future Managed Stands ............................................................................... 77

Fort Nelson DFAM TSR 3
1
List of Acronyms
Acronym Definition
AAC Allowable Annual Cut AU Analysis Unit BCTS BC Timber Sales BEC Biogeoclimatic Ecosystem Classification BEO Biodiversity Emphasis Option CFS Canadian Forest Service CFLB Crown forested land base DBH Diameter at Breast Height DIB Diameter Inside Bark DWB Decay, Waste, and breakage ECA Equivalent Clearcut Area ESA Environmentally Sensitive Area FDP Forest Development Plan FESL Forest Ecosystem Solutions Ltd. FIZ Forest Inventory Zone FPC Forest Practices Code FSOS Forest Simulation Optimization System GIS Geographic Information Systems GMZ/GRZ General Resource Zone ISIS Integrated Silviculture Information System ITG Inventory Type Group LRMP Land Resources Management Plan LU Landscape Unit LUPG Landscape Unit Planning Guide MAI Mean Annual Increment MHA Minimum Harvestable Age MOF British Columbia Ministry of Forests MSRM British Columbia Ministry of Sustainable Resource Management MSYT Managed Stand Yield Table NSR Not Satisfactorily Restocked NSYT Natural Stand Yield Table OAF Operational Adjustment Factor OGSI Old Growth Site Index RMZ Riparian Management Zone RRZ Riparian Reserve Zone RVQC Recommended Visual Quality Class SI50 Site Index for age 50 SIBEC Site index Biogeoclimatic Ecological Classification Canfor Canadian Forest Products Ltd.

Fort Nelson DFAM TSR 3
2
Acronym Definition
THLB Timber Harvesting Land Base TIPSY Table Interpolation Program for Stand Yields TSA Timber Supply Area TSR Timber Supply Review UWR Ungulate Winter Range VAC Visual Absorption Capacity VDYP Variable Density Yield Prediction VEG Visually Effective Green-up VRI Vegetation Resources Inventory WHA Wildlife Habitat Area WTP Wildlife Tree Patch WTR Wildlife Tree Retention

Fort Nelson DFAM TSR 3
3
1 Introduction The Timber Supply Review (TSR) process facilitates the public and First Nations’ review of the timber supply analysis, the incorporation of their inputs into the analysis, and the determination of allowable annual cuts (AAC) by the provincial Chief Forester. Timber supply analysis is the forecast of timber supply given the current management regime and associated sensitivity analyses. This document provides the information and management assumptions proposed for timber supply analysis for the Fort Nelson Timber Supply Area (TSA) Under the proposed Defined Forest Area Management (DFAM) legislation, timber supply analysis is the collective responsibility of the DFAM group. The DFAM group includes the holders of replaceable forest licenses (Canadian Forest Products Ltd is the only major licensee in the Fort Nelson TSA) and BC Timber Sales (BCTS). The DFAM group will complete the following steps for timber supply analysis: � Collect data and prepare a data package, which summarizes the data assumptions and
critical issues to be examined in the analysis; � Complete the timber supply analysis and report; and, � Provide for public and First Nations’ review.
TSR is conducted a minimum of every five years in order for new data, management assumptions and polices to be included. The last TSR (TSR 2) for the Fort Nelson TSA was completed in March 2000 and the AAC determination in September 2001. This TSR 3 data package review was completed on March 31, 2004 and the AAC determination will be completed at latest September 2006. Three primary documents will be provided through this process: 1) the data package (this document), 2) the analysis report and 3) the Chief Forester’s AAC determination report. The data package is a technical document that summarizes the data and inputs for the analysis. The analysis report summarizes the timber supply analysis results and serves as the focus for public discussion. For further information about the data package and timber supply analysis for the Fort Nelson TSA, please contact Chris Niziolomski: Mail: Chris Niziolomski, R.P.F. Forest Ecosystem Solutions Ltd. 210-275 Fell Avenue North Vancouver, BC V7P 3R5 Fax: 604-986-0361 Email: [email protected] Copies of the data package can be obtained on the following website: http://www.forestecosystem.ca/FortNelsonDFAMTSR3.html

Fort Nelson DFAM TSR 3
4
1.11.11.11.1 Purpose of the data package The purpose of this data package is to provide a clear description of information sources, assumptions, issues, and any relevant data processing or adjustments related to the land base, growth and yield, and management objectives and practices. Through its use, this package will: � Provide a detailed account of the factors related to timber supply that the Chief Forester
must consider under the Forest Act when determining an allowable annual cut (AAC) and how these factors will be applied in the timber supply analysis;
� Provide a means for communication between the staff from Canadian Forest Products Ltd
(henceforth referred to as Canfor), BCTS, Ministry of Forests, Ministry of Sustainable Resource Management, Ministry of Water, Land, and Air Protection, the public and First Nations in the TSA.
� Provide the public, First Nations, and staff of the different provincial natural resources
ministries with the opportunity to review data and information that will be used in the timber supply analysis before it is initiated;
� Ensure that all relevant information is accounted for in the analysis to an acceptable
standard; and � Reduce the risk of having analyses rejected because input assumptions and analysis
methods were not agreed upon in advance. During the analysis, various sensitivity analyses, harvest flow alternatives, and management options will be tested to determine the influence of various factors on harvest levels. All analyses and the final proposed option will be submitted to the Chief Forester for determination of the allowable annual cut (AAC).
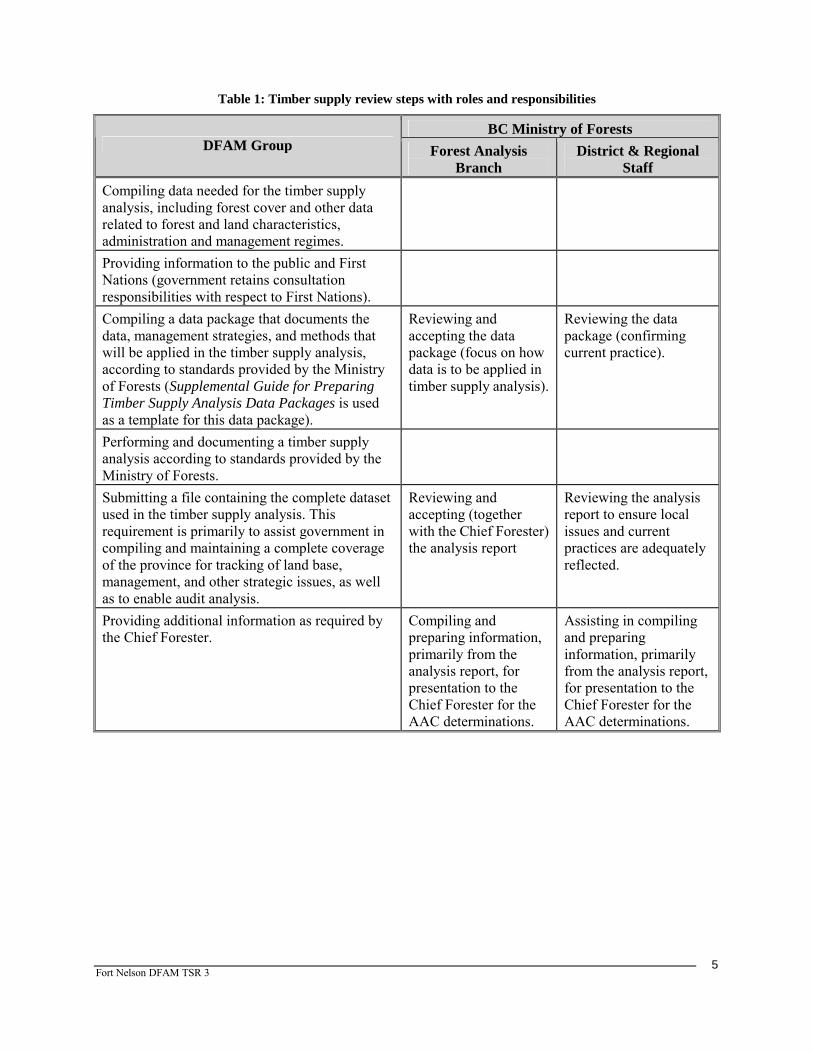
1.21.21.21.2 ProcessProcessProcessProcess The requirement to conduct timber supply analysis on a periodic basis (at least once every 5 years) is the collective responsibility of the DFAM group. The DFAM group includes BC Timber Sales (BCTS) and Canadian Forest Products Ltd. The timber supply analysis for the Fort Nelson TSA will follow the Interim Standards for Data Package Preparation and Timber Supply Analysis, DFAM Imitative. The roles and responsibilities for the specific timber supply review steps are outlined in Table 1. Following completion of these steps, the Chief Forester or designate will review the final timber supply analysis report, assess its acceptability for supporting the AAC determination, and if necessary request additional information. After acceptance of the analysis, the Chief Forester determines an AAC while considering all the factors as required in the Forest Act, section 8 (8).
Fort Nelson DFAM TSR 3
5
Table 1: Timber supply review steps with roles and responsibilities
BC Ministry of Forests DFAM Group Forest Analysis
Branch District & Regional
Staff Compiling data needed for the timber supply analysis, including forest cover and other data related to forest and land characteristics, administration and management regimes.
Providing information to the public and First Nations (government retains consultation responsibilities with respect to First Nations).
Compiling a data package that documents the data, management strategies, and methods that will be applied in the timber supply analysis, according to standards provided by the Ministry of Forests (Supplemental Guide for Preparing Timber Supply Analysis Data Packages is used as a template for this data package).
Reviewing and accepting the data package (focus on how data is to be applied in timber supply analysis).
Reviewing the data package (confirming current practice).
Performing and documenting a timber supply analysis according to standards provided by the Ministry of Forests.
Submitting a file containing the complete dataset used in the timber supply analysis. This requirement is primarily to assist government in compiling and maintaining a complete coverage of the province for tracking of land base, management, and other strategic issues, as well as to enable audit analysis.
Reviewing and accepting (together with the Chief Forester) the analysis report
Reviewing the analysis report to ensure local issues and current practices are adequately reflected.
Providing additional information as required by the Chief Forester.
Compiling and preparing information, primarily from the analysis report, for presentation to the Chief Forester for the AAC determinations.
Assisting in compiling and preparing information, primarily from the analysis report, for presentation to the Chief Forester for the AAC determinations.
Fort Nelson DFAM TSR 3
6
2 Inventory and model files This section outlines the inventories, data and spatial coverage used in the preparation of the data package that will be used for the timber supply analysis in the Fort Nelson TSA.
2.12.12.12.1 Data SourcesData SourcesData SourcesData Sources Most of the data were provided from the Ministry of Forests (MOF), the Ministry of Sustainable Resources Management (MSRM), Canadian Forest Products Ltd. and BC Timber Sales. The list of inventory information is shown in Table 2. Some of the data sources are also discussed in more detail in the sections below.

Fort Nelson DFAM TSR 3
7
Table 2: Inventory information for the Fort Nelson TSA
Data Source* Vintage Update Scale Comments Inventory Vegetation Resources Inventory MSRM 2002/2003 1:20,000 Total of 836 (1:20 000) mapsheets. Of which, 249
are Phase II VRI and 587 are “rolled over” VRI. Ecological Biogeoclimatic classification (version 5.0) MOF 1995 2003 1: 20,000 Natural Disturbance Units MSRM 2001 2002 1:20, 000 to
1:250,000
Karst potential map MOF 1999 1:250,000 Budworm incidence mapping CFS – Pacific Forest
Region 1998/2002 1:50,000
PEM/TEM coverage
Various sources – see description
1:50,000
Administrative Ownership MOF 2000 2002 1:20,000 From FC1. Woodlots codes are not included.
Woodlots MOF – Fort Nelson Forest District
2003 1:20,000
Operating Areas MOF – Fort Nelson Forest District
1:20,000
Landscape Units MSRM 1998 2003 1:250,000
Region and district boundary MOF – Fort Nelson Forest District
2000 2003 1:20,000
Agricultural Land Reserve LRC 2003 1:20,000 Forest region and compartment MOF – Fort Nelson
Forest District 2000 2002 1:20,000
Operational Forest Development Plan Canfor/ BCTS 2002-2007 1:20,000 Includes wildlife tree patches and other reserves - all
reserves have been coded as WTP; also includes roads
Depletions MSRM 2002 1:20,000 Terrain Stability Canfor (Kokanee
Forest Consulting, Klohn-Crippen, JM Ryder & Associates)
2000 1:20,000
ESA MSRM 2001 2002 1:20,000 Range Burns MOF – Fort Nelson
Forest District 1999 1:20,000
Water Domestic water licences MSRM - Water
licensing office 1997 2003 1:20,000 Point of Diversion
Wildlife Caribou Wildlife Winter Range WLAP 2000 Protected Area Strategy (PAS) MOF 2001 Recreation Visual landscape inventory (VLI) MSRM 1997 2002 1:250,000
1: 50,000 The inventory is 1:250,000 except for the inventory around the Alaska Hwy and Klua Lakes, which were done to an accuracy of 1:50,000.
Recreation feature inventory (RFI) MSRM 1991
Recreation opportunity spectrum (ROS) MSRM 1996 1:20,000?
Planning LRMP – RMZ, ERDZ, SMZ MSRM 1997 2002 1:250,000
Natural Disturbance Spruce budworm infestation CFS 1990 2002 1:20,000
Roads and Seismic TRIM I and II MSRM 1987, 1996 1:20,000 Used for roads, seismic lines, pipelines, streams. Compiled road coverage FESL 1:20,000 Variety of sources Seismic and oil and gas roads OGC 2000 -2003 1:20,000
* MOF= Ministry of Forests, MELP= Ministry of Environment, Land, and Parks, WLAP= Ministry of Water, Land and Air Protection, LRC = Land Reserve Commission, LUCO= Land Use Coordination Office, OGC=Oil and Gas Commission, FESL=Forest Ecosystem Solutions Ltd., CFS = Canadian Forest Service
Fort Nelson DFAM TSR 3
8
2.1.1 Vegetation Resource Inventory During 2002/2003, Fort Nelson Division of Canfor received funding from the Forest Investment Account to re-inventory approximately one third of the TSA according to Vegetation Resource Inventory (VRI) standards: the other two thirds contained old forest cover data that have been “rolled-over” into the new VRI format (mdb). It should be noted that the “roll over” process does not generate a true VRI database. It maintains the old FC1/FIP inventory information in a new database format. The new VRI attributes will remain as blank fields in the “rolled over” VRI database as no information is gathered or available from the traditional inventory databases. The completion of the VRI involved staff from BCTS and the Regional and District staff of MOF and MSRM. VRI Phase I photo-interpreted inventory has projected stand attributes to 2003 whereas VRI “rolled over” was projected to 2002. The “rolled over” VRI comprises a total of 6,863,581 ha of the TSA whereas 3,004,473 ha are in VRI Phase I. Adjustment factors derived from VRI Phase II ground sample data for age, height and net volume have been applied to the VRI Phase I area and are documented in Jahraus and Associates (2003). In TSR 2, the Chief Forester noted that the existing older forest inventory was a primary concern due to issues with broad polygon typing, incorrect species labelling, incorrect site productivity (site index) estimates, and under-representation of the understory component. The Phase I photo-interpreted VRI has addressed some of the issues and in particular, provided an improved distinction between white and black spruce leading stands. In addition, the VRI Phase II ground sample data has provided a measure of confidence of the VRI Phase I photo-interpreted data with a known level of confidence.
2.1.2 PEM/TEM Mapping Four TEM projects were completed in 1998 within the Fort Nelson TSA including the Smith/Vents River TEM, Labiche/Sandy TEM, Snake/Sahtaneh TEM and the Dunedin TEM. MSRM has also completed a PEM for the Muskwa-Kechika. No independent accuracy assessments have been completed for these projects.1 Canfor have initiated the Patry PEM project and the Sahtaneh TEM project, which are in the progress of completion. Accuracy assessments for this data are expected by April 2004.
2.1.3 Karst Potential Inventory The provincial karst potential inventory indicates areas of potential karst and areas of known karst. There are 8,289 ha of known karst areas. The known karst is located in the northwestern region of the TSA. A continuous north-south band of known karst exists in the Grayling, Scatter, and Redpott Landscape Units (5,331 ha, 59ha, and 2,206 ha, respectively). In addition, there are 676 ha of known karst in the Liard Hot Springs landscape unit. The DFAM group do not feel that there will be a major timber supply impact in these karst areas as there are no local guidelines for their operational management at this time. As such, these areas are noted but not taken out of the THLB at this time. 1 Email communication with Corey Erwin (March 9, 2004).
Fort Nelson DFAM TSR 3
9
2.1.4 Ownership Inventory There are two woodlots in the TSA; one is an active woodlot (W1817) comprising 588 ha and the other woodlot (W171), comprising 561 ha, is currently inactive. W1817 was not included in the original ownership file but has been added based on a spatial woodlot coverage provided by the Fort Nelson Forest District. W171 will be assigned to a miscellaneous reserve status, which may be harvested in the future.
2.1.5 BC Parks and Protected Area Boundaries The Ministry of Water, Land and Air Protection provided the boundaries for BC parks, protected areas and ecological reserves. This data is updated to 2001 and confirmed to be accurate on a 1:20, 000 scale2. The existing ownership coverage for parks (63N and 67N) and ecological reserves (60N) was outdated, as many parks and protected areas have been legally established since TSR2. The Land Resource Management Plan map was also outdated as the areas with “proposed protected” resource management type are now “existing established” RMZs.
2.1.6 Road data A spatial road coverage has been compiled from road features from TRIM I and II, existing and proposed roads from forest development plans provided by Canfor and BCTS, an in-house road coverage from Canfor, and petroleum development roads from the Oil and Gas Commission. The compiled road network illustrates that many of the logging roads identified in the above sources were only accessible from seismic lines. It was confirmed by the DFAM group that many seismic lines are actively used for timber access. It is, however, impossible to determine which seismic lines are being used for transportation, therefore, no seismic lines have been reclassified as roads. Seismic features will be included in determining future access requirements.
2.1.7 TRIM data Streams, roads, transmission lines, seismic lines and pipelines were extracted from TRIM I and II. A buffer width was applied to each feature to determine an appropriate area reduction for the land base netdown, which will be discussed in Section 3.3 and 0.
2.1.8 Visual landscape inventory Detailed (1:50,000) visual landscape inventories were completed for the Klua Lakes view shed in 1992, and for a portion of the Alaska Highway corridor from Beaver Creek to Summit Lake in 1995. In 1995, a broad mapping of all the visually sensitive areas in the district was completed at a scale of 1:250,000 and the district manager has declared these areas as ‘scenic areas’ for consideration in all forestry planning activities.
2 Phone correspondence with Steven Webb, Boundary Coordinator, Land & Permit Administration Section, WLAP. April 22, 2004.
Fort Nelson DFAM TSR 3
10
3 Land base This section describes how the timber harvesting land base (THLB), or the area that is available for harvest, is determined. The total land base initially contains a variety of land types including areas that are not Crown controlled. The TSA is defined as the total land base excluding private land, federal land, woodlots, and First Nations reserves. Once the TSA area is defined, areas not containing trees and considered non-productive are removed, such as bare ground/rock and water bodies, to identify the productive Crown forest land base (CFLB). Finally, those areas that are forested and contribute to non-timber values, but are not eligible for harvest are removed, resulting in the THLB.
3.13.13.13.1 TimbeTimbeTimbeTimber harvesting land base definitionr harvesting land base definitionr harvesting land base definitionr harvesting land base definition The THLB is determined by a netdown process, in which areas ineligible for harvest are sequentially removed from the total land base. Once an area has been removed, it cannot be deducted again further along in the netdown process to eliminate the potential for double counting. For this reason, the gross area of netdown factors is usually greater than the net area removed (a result of overlapping resource issues). Table 3 summarizes the netdown procedure where areas are removed in the order presented to define the total land base, TSA land base, Crown forested land base, current and future timber harvesting land base. The total area for the Fort Nelson TSA is larger than that of TSR 2. The Cassiar Addition (an area of approximately 1.5 million hectares was transferred from the Bulkley-Cassiar Forest district to the Fort Nelson TSA in 1999) is included in the total land base for this analysis.

Fort Nelson DFAM TSR 3
11
Table 3: Timber harvesting land base determination for the Fort Nelson TSA
Classification Total Area
(ha)
Net Area Removed
(ha)
Percent of Total TSA area (%)
Percent of CFLB (%)
Report Section
Total area on inventory file (Fort Nelson Forest District) 9,868,067 9,868,067 Land not managed by MOF (e.g.. private, woodlots, federal, Indian, military reserves) 29,927 29,927 3.2.1
Total TSA area 9,838,140 100.00 Reductions to TSA: Non-forest, non-productive, no typing 3,831,375 3,814,238 38.77 3.3.1 Alpine (not previously accounted for) 3,006 3,006 0.03 3.3.2 Non-commercial cover (brush) 350,671 350,671 3.56 3.3.3 Existing roads, trails and landings 46,686 35,945 0.37 3.3.4 Total productive Crown forest land base (CFLB) 5,634,280 57.27 100.00 Parks, UREPs and Ecological Reserves 1,059,861 369,785 3.76 6.56 3.2.1 NSR from wildfire, non-productive or misclassified 86,106 76,632 0.78 1.36 3.4.2 Non merchantable 301,193 236,424 2.40 4.20 3.4.2 Low timber productivity 4,416,007 2,662,085 27.06 47.25 3.4.3 Riparian reserve (stream, wetland and lake) 543,340 187,810 1.91 3.33 3.4.5 Environmentally sensitive areas 708,018 119,383 1.21 2.12 3.4.6 Unstable terrain 19,112 9,141 0.09 0.16 3.4.7 Wildlife range burn areas 354,999 26,728 0.27 0.47 3.4.8 Stand-level biodiversity (existing wildlife tree patches) 434 367 0.004 0.01 3.4.9 Seismic areas 111,957 25,598 0.26 0.45 3.4.10 Inoperable areas 7,379,194 344,811 3.50 6.12 3.4.11 Black spruce leading stands 1,215,896 143,259 1.46 2.54 3.4.12 Total Reductions to the CFLB: 4,202,023 42.71 74.58 Current Timber Harvesting Land Base 1,432,257 14.56 25.42 Future Reductions: Future roads, trails and landing 29,825 3.4.14 Future stand-level biodiversity (WTP) 6,272 3.4.15 Future Timber Harvesting Land Base 1,396,160

Fort Nelson DFAM TSR 3
12
3.1.1 Reasons for changes to the THLB since TSR 2 Since TSR 2 was completed for the Fort Nelson TSA, there have been numerous changes to input data and assumptions that will alter the individual land base reductions as well as the resulting timber harvesting land base area. Some of those changes include:
1) the Cassiar addition to the Fort Nelson TSA; 2) the new VRI Phase I photo interpreted inventory and adjustment factors derived from
VRI Phase II ground sample data for approximately one third of the Fort Nelson TSA; 3) the revised operability assessment; 4) revised WTP reductions; 5) replacement of some older environmentally sensitive area (ESA) soils features with more
recent terrain stability mapping (level D); 6) a new methodology to determine stream classification and riparian reserve reductions;
and, 7) revised existing roads, trails and landings and oil and gas related reductions.
3.23.23.23.2 Exclusions from the TSA Land BaseExclusions from the TSA Land BaseExclusions from the TSA Land BaseExclusions from the TSA Land Base The land base netdown will identify the numerous reductions applied to the total area within the Fort Nelson Forest District to identify the TSA land base, the productive Crown forest land base, and the timber harvesting land base. This section will describe those areas that are removed from the Fort Nelson Forest District to identify the TSA land base.
3.2.1 Administrative classes that do not contribute to TSA forest management objectives
Areas managed by the BC MOF and Parks are considered to contribute to landscape biodiversity and are therefore included in the Crown productive forest, whereas areas in the forest management unit area and miscellaneous reserves are available for timber harvesting (Table 4). Areas in private ownership, woodlots, and Indian, federal, and military reserves are not included in the TSA land base, as shown in Table 5.

Fort Nelson DFAM TSR 3
13
Table 4: Land that contributes to the TSA forest management or biodiversity objectives
(i.e. Crown forest land base) due to ownership
Ownership Code and Description Total
Area (ha) % Contribution
to CFLB % Contribution
to THLB 62-C Forest Management Unit 8,762,730 100 100 Parks, protected area and ecological reserves* 1,052,430 100 0 61-C Use, Public recreation, and enjoyment (UREP) reserves (>100 ha) 3,090 100 0 61-N UREP (≤100) 4,341 100 0 69-C Miscellaneous reserves (>100 ha)** 15,352 100 100 69-N Miscellaneous reserves (≤100)** 197 100 100 Total 9,838,140 *Parks, protected areas and ecological reserves were derived from the BC Parks coverage. It did not contain ownership code; however, it would have encompassed 60N, 63N and 67N. **Miscellaneous reserves include: forest service recreation reserve/corridor, watershed reserve, industrial reserve, islands reserve, map reserve, fish and wildlife management reserves and/or interpretive forests. Also included in category 69-C are 564 ha of what used to be woodlot W171.
Table 5: Land that does not contribute to the TSA forest management or biodiversity objectives due to ownership
Ownership Code and Description
Total Area (ha)
% Contribution to CFLB
% Contribution to THLB
40-N Private 16,102 0 0 50-N Federal Reserve 545 0 0 52-N Indian Reserve 8,126 0 0 53-N Military Reserve 4,552 0 0 77-N Woodlots 588 0 0 99-N Miscellaneous leases* 14 0 0 Total 29,927 * Miscellaneous leases include: fairgrounds, rod and gun club sites, recreational cottage site leases and/or community organization leases.
3.33.33.33.3 Exclusions from the Crown Forest Land Base Exclusions from the Crown Forest Land Base Exclusions from the Crown Forest Land Base Exclusions from the Crown Forest Land Base This section describes the reductions, which are applied to the TSA land base to define the Crown forest land base, and are summarized in Table 3.
3.3.1 Non-forest and non-productive forest VRI inventory attributes differ from the original FC1/FIP attributes in a number of important ways. While the FC1/FIP data standards provided a single attribute as far as the overall polygon classification is concerned, a polygon inventoried under VRI guidelines might contain several ‘land classification’ components (BCLCS). For example, a polygon might be classified as a

Fort Nelson DFAM TSR 3
14
Lake following FC1/FIP guidelines; however, the same polygon might be classified as 80% Lake and 20% productive forest land under VRI guidelines. Based on comparisons between area and land classification, it was decided that polygons with multiple ‘land classification’ components should be reclassified following a 50% rule. For example: if more than 50% of a polygon is classified as water or non-vegetated (e.g. rock or exposed soils), then the polygon would be reclassified as a water body or non-productive, respectively. Where only rolled-over VRI information is available, the non-forest and non-productive forest category is classified according to the projected type identity label (PRJ_TYPID) 6. Except for parks, ecological reserves, UREP and riparian areas, all areas that are classified as non-productive (or any of the land classification that will be removed from the Crown forest land base, as described in the following sections) but have been previously logged will remain in the Crown forest land base as well as the timber harvesting land base. The reductions for non-forest and non-productive areas within the Fort Nelson TSA are shown in Table 6.
Table 6: Areas in non-forest and non-productive forest
Description (NPD2) TSA Area
(ha) % Reduction Lake 85,027 100 River 80,542 100 Wetland 1,633,601 100 Non-Productive (NP) 2,027,644 100 No typing available (NTA) 4,561 100 Total 3,831,375 100
3.3.2 Alpine All area classified as alpine tundra and sub alpine parkland (AT) under the Biogeoclimatic classification (BEC) is considered non-harvestable and excluded from the Crown forest and timber harvesting land base. Where trees do occur in these areas their growth is usually stunted and they are very widely spaced. Individual trees rarely meet the minimum harvestable dimensions and, therefore, have no merchantable value. In the Fort Nelson TSA, there are 1,353,578 ha of alpine tundra of which, 3,006 ha have not been excluded under the unproductive/nonforest category (Section 3.3.1) as shown in Table 7.
Table 7: Reduction for alpine and sub alpine tundra
Description % Reduction Total Area (ha) Alpine and sub alpine tundra not previously accounted for 100 3,006
Fort Nelson DFAM TSR 3
15
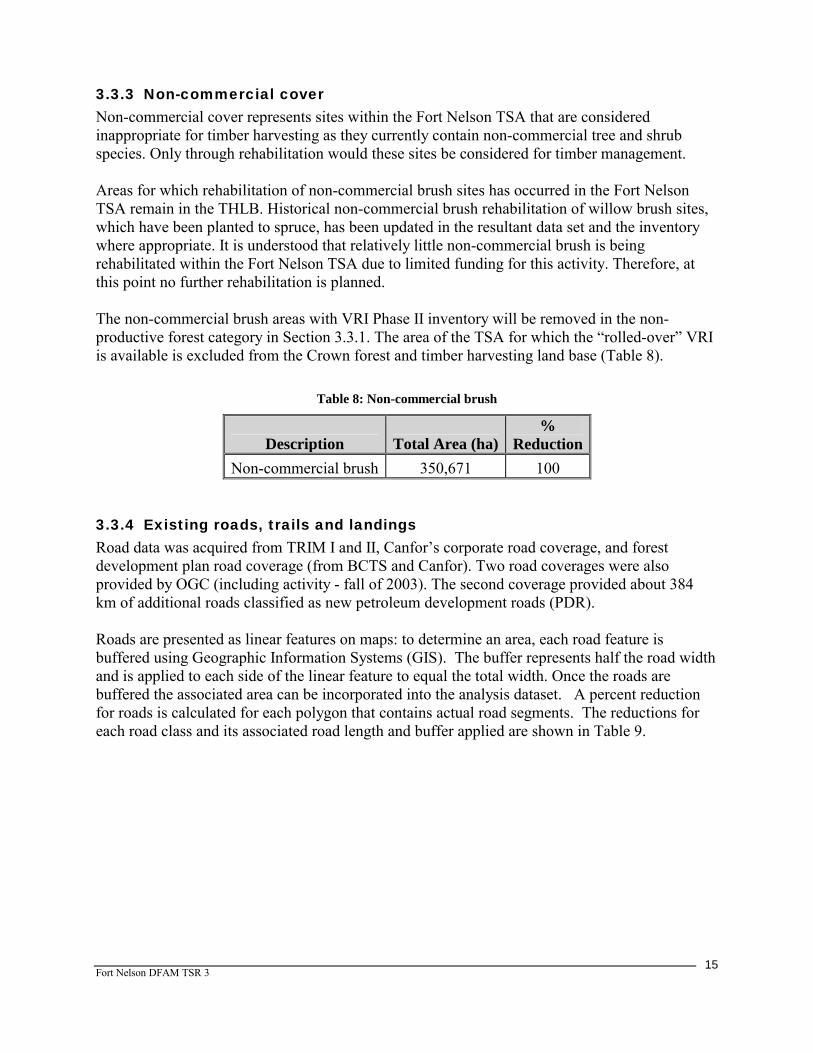
3.3.3 Non-commercial cover Non-commercial cover represents sites within the Fort Nelson TSA that are considered inappropriate for timber harvesting as they currently contain non-commercial tree and shrub species. Only through rehabilitation would these sites be considered for timber management. Areas for which rehabilitation of non-commercial brush sites has occurred in the Fort Nelson TSA remain in the THLB. Historical non-commercial brush rehabilitation of willow brush sites, which have been planted to spruce, has been updated in the resultant data set and the inventory where appropriate. It is understood that relatively little non-commercial brush is being rehabilitated within the Fort Nelson TSA due to limited funding for this activity. Therefore, at this point no further rehabilitation is planned. The non-commercial brush areas with VRI Phase II inventory will be removed in the non-productive forest category in Section 3.3.1. The area of the TSA for which the “rolled-over” VRI is available is excluded from the Crown forest and timber harvesting land base (Table 8).
Table 8: Non-commercial brush
Description Total Area (ha)%
Reduction Non-commercial brush 350,671 100
3.3.4 Existing roads, trails and landings Road data was acquired from TRIM I and II, Canfor’s corporate road coverage, and forest development plan road coverage (from BCTS and Canfor). Two road coverages were also provided by OGC (including activity - fall of 2003). The second coverage provided about 384 km of additional roads classified as new petroleum development roads (PDR). Roads are presented as linear features on maps: to determine an area, each road feature is buffered using Geographic Information Systems (GIS). The buffer represents half the road width and is applied to each side of the linear feature to equal the total width. Once the roads are buffered the associated area can be incorporated into the analysis dataset. A percent reduction for roads is calculated for each polygon that contains actual road segments. The reductions for each road class and its associated road length and buffer applied are shown in Table 9.

Fort Nelson DFAM TSR 3
16
Table 9: Reductions for existing roads
Road Feature Length
(km) Road
width (m)
Buffer used in GIS (m)
Total Area (ha)*
Net Area Excluded
(ha) BC Rail 111 20 10 223 123 Highway 824 30 15 2,473 795 Paved 1,820 30 15 5,420 2,892 Road 4,898 20 10 9,778 9,068 Mainline 2,069 20 10 4,079 3,366 Petroleum Development Road (PDR) 384 20 10 746 289 Gravel 1,094 20 10 2,039 1,171 Rough Road 12,965 15 7.5 19,406 15,862 Overgrown Road 258 15 7.5 390 380 Total 24,423 44,554 33,946 * Road area listed above is the area resulting from the road buffer exercise and takes into account overlapping roads in which reductions are made in the same order the road features is presented in the table (i.e. where a highway crosses a paved road, the overlap is removed under ‘net area excluded’ for highway). None of the road data provided contained landing features. However, it can be assumed that some road-related disturbances (landings and gravel pits) are captured in the vegetation resource inventory3. Where this is the case, they will have been removed as non-productive areas. Table 9 represents the area in main access roads: further road reductions are required for within block roads, trails and landings (RTL). The average percent area of permanent RTL in a cutblock is 2%, as determined by the amount of NP UNN (non-productive, unnatural) in ISIS (all data that was available between 1962 and 2003). Any area with a history of logging will receive an additional 2% reduction as shown in Table 10.
Table 10: Reductions for within block roads and trails
Description %
ReductionTotal Area
(ha) Net Area Excluded
(ha) Existing roads (Table 9) 100 44,554 33,946 In block roads – non-mapped roads (additional 2% to all polygons with a history of logging)
100 2,132 1,999
Total 100 46,686 35,945
3 Sixty hectares of gravel pits in the Fort Nelson TSA have been identified by the VRI and 1,846 ha have been identified as road or urban areas in VRI but it is unknown how much, if any, of the latter is in landings.
Fort Nelson DFAM TSR 3
17
3.43.43.43.4 Exclusions from the Timber HarvestingExclusions from the Timber HarvestingExclusions from the Timber HarvestingExclusions from the Timber Harvesting Land Base Land Base Land Base Land Base This section describes the exclusions to the crown forested land base to determine the timber harvesting land base.
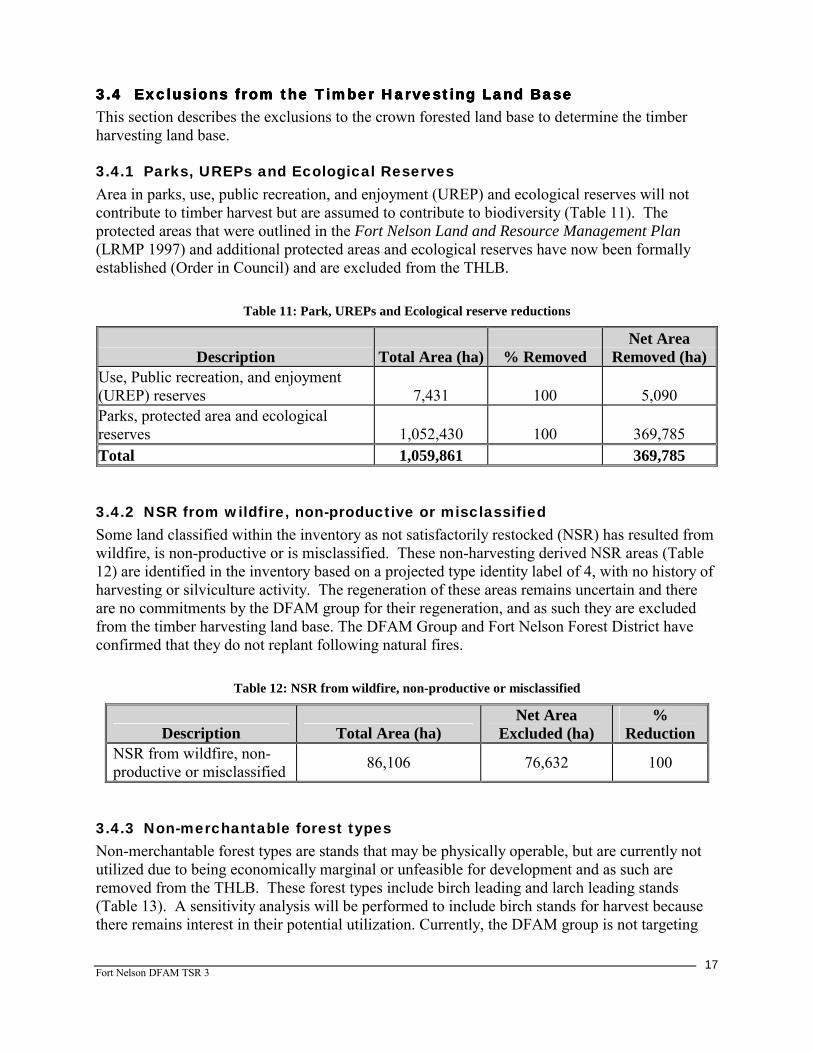
3.4.1 Parks, UREPs and Ecological Reserves Area in parks, use, public recreation, and enjoyment (UREP) and ecological reserves will not contribute to timber harvest but are assumed to contribute to biodiversity (Table 11). The protected areas that were outlined in the Fort Nelson Land and Resource Management Plan (LRMP 1997) and additional protected areas and ecological reserves have now been formally established (Order in Council) and are excluded from the THLB.
Table 11: Park, UREPs and Ecological reserve reductions
Description Total Area (ha) % Removed Net Area
Removed (ha) Use, Public recreation, and enjoyment (UREP) reserves 7,431 100 5,090 Parks, protected area and ecological reserves 1,052,430 100 369,785 Total 1,059,861 369,785
3.4.2 NSR from wildfire, non-productive or misclassified Some land classified within the inventory as not satisfactorily restocked (NSR) has resulted from wildfire, is non-productive or is misclassified. These non-harvesting derived NSR areas (Table 12) are identified in the inventory based on a projected type identity label of 4, with no history of harvesting or silviculture activity. The regeneration of these areas remains uncertain and there are no commitments by the DFAM group for their regeneration, and as such they are excluded from the timber harvesting land base. The DFAM Group and Fort Nelson Forest District have confirmed that they do not replant following natural fires.
Table 12: NSR from wildfire, non-productive or misclassified
Description Total Area (ha) Net Area
Excluded (ha) %
Reduction NSR from wildfire, non-productive or misclassified 86,106 76,632 100
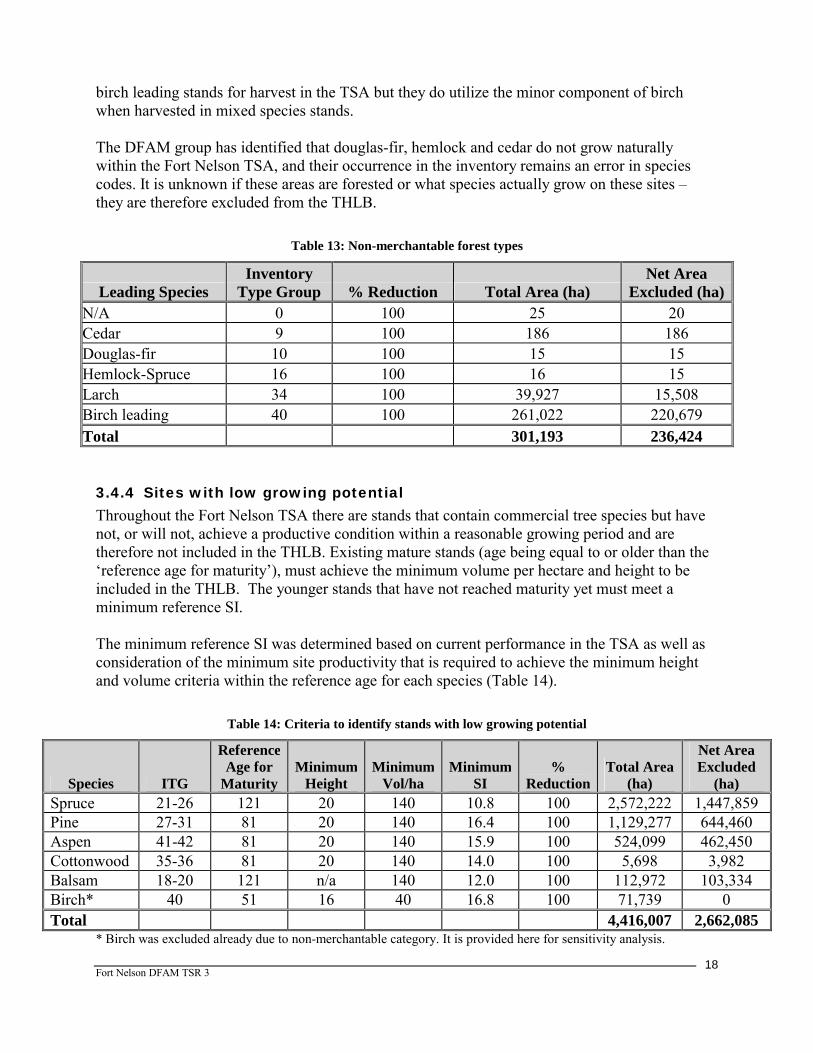
3.4.3 Non-merchantable forest types Non-merchantable forest types are stands that may be physically operable, but are currently not utilized due to being economically marginal or unfeasible for development and as such are removed from the THLB. These forest types include birch leading and larch leading stands (Table 13). A sensitivity analysis will be performed to include birch stands for harvest because there remains interest in their potential utilization. Currently, the DFAM group is not targeting
Fort Nelson DFAM TSR 3
18
birch leading stands for harvest in the TSA but they do utilize the minor component of birch when harvested in mixed species stands. The DFAM group has identified that douglas-fir, hemlock and cedar do not grow naturally within the Fort Nelson TSA, and their occurrence in the inventory remains an error in species codes. It is unknown if these areas are forested or what species actually grow on these sites – they are therefore excluded from the THLB.
Table 13: Non-merchantable forest types
Leading Species Inventory
Type Group % Reduction Total Area (ha) Net Area
Excluded (ha)N/A 0 100 25 20 Cedar 9 100 186 186 Douglas-fir 10 100 15 15 Hemlock-Spruce 16 100 16 15 Larch 34 100 39,927 15,508 Birch leading 40 100 261,022 220,679 Total 301,193 236,424
3.4.4 Sites with low growing potential Throughout the Fort Nelson TSA there are stands that contain commercial tree species but have not, or will not, achieve a productive condition within a reasonable growing period and are therefore not included in the THLB. Existing mature stands (age being equal to or older than the ‘reference age for maturity’), must achieve the minimum volume per hectare and height to be included in the THLB. The younger stands that have not reached maturity yet must meet a minimum reference SI. The minimum reference SI was determined based on current performance in the TSA as well as consideration of the minimum site productivity that is required to achieve the minimum height and volume criteria within the reference age for each species (Table 14).
Table 14: Criteria to identify stands with low growing potential
Species ITG
Reference Age for
Maturity Minimum
Height Minimum
Vol/ha Minimum
SI %
Reduction Total Area
(ha)
Net Area Excluded
(ha) Spruce 21-26 121 20 140 10.8 100 2,572,222 1,447,859 Pine 27-31 81 20 140 16.4 100 1,129,277 644,460 Aspen 41-42 81 20 140 15.9 100 524,099 462,450 Cottonwood 35-36 81 20 140 14.0 100 5,698 3,982 Balsam 18-20 121 n/a 140 12.0 100 112,972 103,334 Birch* 40 51 16 40 16.8 100 71,739 0 Total 4,416,007 2,662,085
* Birch was excluded already due to non-merchantable category. It is provided here for sensitivity analysis.

Fort Nelson DFAM TSR 3
19
3.4.5 Riparian reserve and management zones
3.4.5.1 Streams No complete stream classification exists for the Fort Nelson TSA. As a result, a methodology was required to approximate stream riparian reductions, which could be used in the land base netdown. Some rivers (S1 and S2 streams) are identified as polygons in VRI and as such their widths are available and can be buffered according to the Riparian Management Area Guidebook (Table 16 in Section 3.4.5.2). The remaining streams were translated from single line features in TRIM I4. With no complete field-based stream classification data for the remaining streams, a methodology was developed that combined the results of the Lower Dunedin Landscape Unit Riparian Analysis (Poulin and Associates, 2001) and information provided by MSRM, Aquatic Information Branch in Prince George. The results from Poulin and Associates and MSRM show a statistical relationship between stream order and stream class (e.g. a high correlation between stream order 1 and 2 with stream class 5 and 6 as well as steam order 3+ with stream class 1 to 4). An analysis was also completed for TSR 3 for the Lower Dunedin where the sample points of known stream classification from the Poulin and Associates study were compared to the stream order classified using GIS processing. Again the results showed a high correlation between the stream order and stream class. A GIS program was developed to assign all TRIM streams in the TSA the appropriate stream order. Assumptions were made on the percentage of streams in each stream class as well as the riparian buffer widths required for each class. The details of the methodology, the limitations of the approach, and comments provided by MSRM are documented in Appendix 1. The resulting stream classes and their ‘effective’ widths are illustrated in Table 15. The ‘effective width’ is the combined riparian reserve zone and riparian management zone weighted by stream class5. Although this approach may be satisfactory for use in TSR, the relationships should not be used for operational stream classification.
Table 15: Riparian reserve and management zone widths for streams
Riparian feature
Stream class
Stream Length (km)
Effective width (m)
Total Area (ha)
Net Area Removed
(ha) S1-S4* 73,841 33.50
Streams S5-S6** 194,105 2.31
2,203,435 85,919
* corresponds to streams of order 3 + ** corresponds to streams of order 1 or 2
4 Note that the streams from TRIM I and TRIM II are identical. 5 Please see Appendix 3 for the method of determining the effective width.

Fort Nelson DFAM TSR 3
20
3.4.5.2 Lakes and wetlands Both lakes and wetlands occur throughout the Fort Nelson TSA. Lake and wetland locations are identified explicitly in the “rolled over” VRI inventories while in the VRI Phase II they are identified based on a 50% rule as described earlier in this document (Section 3.3.1). Lake and wetland classes are categorized following the Riparian Management Area Guidebook. The appropriate buffer is applied to each wetland and lake class (Table 16) in order to calculate the appropriate reduction to the timber harvesting land base. As mentioned in the previous section, some large rivers are identified as polygons (or double line streams in TRIM II), as such their widths are known for stream classification and are given the appropriate Guidebook reductions (Table 16). Therefore, reductions for streams are completed in two steps, one based on polygon-features (Table 16) and another based on the stream order methodology (Table 15).
Table 16: Riparian reserve and management zone widths for lakes and wetlands
Riparian feature
Wetland and Lake
class Class Definition
Reserve zone width (meters)
100% reduction
Management zone width
(m)
Management zone
retention (%)
Combined RZ and RMZ buffer width
(m)* RMA Gross
area (ha)
Net Area Removed
(ha) Wetlands W1 5 - 1000 ha 10 40 25 20 W1 large > 1000 ha 0 0 0 0 W3 1 - 5 ha 0 30 25 7.5 W5 wetland complex 10 40 25 20 Lakes L1 5 - 1000 ha 10 0 0 10 L1 large > 1000 ha 0 0 0 0 L3 1 - 5 ha 0 30 25 7.5 Streams S1 20 - 100m wide 50 20 50 60 S1 large >100m wide 0 100 50 50 S2 5 - 20m wide 30 20 50 40
2,101,544 101,891
*the combined buffer width = reserve zone width + (management zone width x % management zone volume reduction)
3.4.6 Environmentally sensitive areas Some forested areas are considered environmentally sensitive and/or significantly valuable for other resources. Many of these areas are identified and delineated during a forest inventory and are designated environmentally sensitive areas (ESAs). The ESA system uses the following categories: soil (Es), forest regeneration problems (Ep), recreation (Er), and wildlife (Ew). Two ESA categories are recognized: high and moderately sensitive, yet some of the ESA categories may overlap.
A complete table of ESA categories is presented in Table 17. In the context of timber supply analysis, ESAs result in a reduction in the harvesting opportunity on these sites. As in the TSR 2, all ESA areas identified as sensitive and/or significantly sensitive have been 100% excluded from the THLB.

Fort Nelson DFAM TSR 3
21
Table 17: Environmentally sensitive areas
Feature* Description %
ReductionTotal Area
(ha)
Net Area Excluded
(ha) Ep1 High regeneration problems 100 408,953 40,809 Ep2 Moderate regeneration problems 100 807 43 Er1 High recreation sensitivity 100 105 7 Er2 Moderate recreation sensitivity 100 1,459 313 Es1 High soil sensitivity 100 263,257 38,541 Es2 Moderate soil sensitivity 100 1,896 1,467 Ew1** High wildlife sensitivity 100 3,744 825 Ew2c Significant caribou habitat 100 27,797 17,220 Ew2g*** Significant goat habitat 100 0 20,158 Total 708,018 119,383
*A polygon can contain more than one ESA category. In cases where such overlap exists, the polygon area is assigned to ESA category of primary significance (e.g. ESA SP will be assigned to Es1). ** Includes 1,145ha of significant caribou habitat *** There is a total of 183ha of significant goat habitat. However, goat habitat completely overlaps with the caribou habitat listed as Ew2c, and is reported there.
3.4.7 Terrain Reconnaissance Mapping Several terrain reconnaissance mapping (Level D6) study areas have been completed throughout the Fort Nelson TSA, mostly in areas where there is significant terrain related concerns. As the terrain reconnaissance mapping is considered best available information, it will replace the ESA soils mapping completed for the terrain study areas. The DFAM group currently does not operate in any area above terrain class III. Since the terrain reconnaissance mapping does not provide terrain class, an assumption was made that the reconnaissance class P (potentially unstable) and U (unstable) were equivalent to terrain class IV and V and Es2 and Es1 respectively, based on Appendix 1 in Mapping and Assessing Terrain Stability Guidebook. Areas identified as reconnaissance class P or U will be 100% removed from the THLB (Table 18).
Table 18: Terrain reconnaissance reductions based on Level D mapping
Description %
Reduction Total Area (ha) Net Area
Excluded (ha) Terrain Reconnaissance Class P 100 12,612 6,797 Terrain Reconnaissance Class U 100 6,500 2,344 Total 100 19,112 9,141
6 Level D refers to the Terrain Survey Intensity Level, where the scale ranges from A (most checked) to E (least checked). The level is a measure of the reliability of mapping, where 1 to 20% of the polygons are ground-checked (Mapping and Assessing Terrain Stability Guidebook, 1999)

Fort Nelson DFAM TSR 3
22
3.4.8 Wildlife range burns Range burns are a technique used by the Ministry of Water, Land and Air Protection (MWLAP) to create wildlife habitat (grassland forest complexes) which provide grazing opportunities for large ungulates. Most range burn areas are located in the western portion of the TSA. MWLAP have provided the GIS data for the range burn areas and these areas have been fully removed from the THLB, as they are not expected to contribute to timber production now or in the future. The associated reductions are shown in Table 19.
Table 19: Wildlife range burns
Description % Reduction Total Area (ha) Net Area Excluded
(ha) Range Burn Areas 100 354,999 26,728
3.4.9 Stand-level biodiversity – wildlife tree retention The management of stand level biodiversity is addressed through wildlife tree retention. In order to achieve landscape unit objectives, the establishment of wildlife trees by BEC variant is required. The Landscape Unit Planning Guide (March 17, 1999) provides direction for the management of wildlife trees, along with the approved changes to the Landscape Unit Planning Guide by the MOF and MELP (May 15, 2000), and the Provincial Wildlife Tree Management Recommendations (February 2000). The existing spatial WTPs do not represent the full requirements across the entire TSA; therefore, further WTPs are required which are modelled as future WTPs. The additional area of WTPs required is calculated as the WTP target minus the existing WTP contribution (Refer to Section 3.4.15 for more details). Spatial WTPs from Canfor and BCTS forest development plans (FDPs) have been identified and are also removed from the timber harvesting land base (Table 20).
Table 20: Reductions for wildlife tree patch/retention
Description % Reduction Total Area (ha) Net Area Excluded
(ha) Existing spatial WTP (from FDPs) 100 434 367
3.4.10 Oil and Gas and Transmission Lines There is an extensive oil and gas exploration and development program throughout the Fort Nelson TSA, though most activity is concentrated on the lowland areas. Both activities result in a depletion of forest cover, mainly as a result of the establishment of seismic lines for exploration. Quantifying the extent and location of oil and gas activities within the Fort Nelson TSA is a challenging undertaking given the amount of recent activity and the various types of seismic activity employed. Also, no one complete dataset currently exists which could provide a
Fort Nelson DFAM TSR 3
23
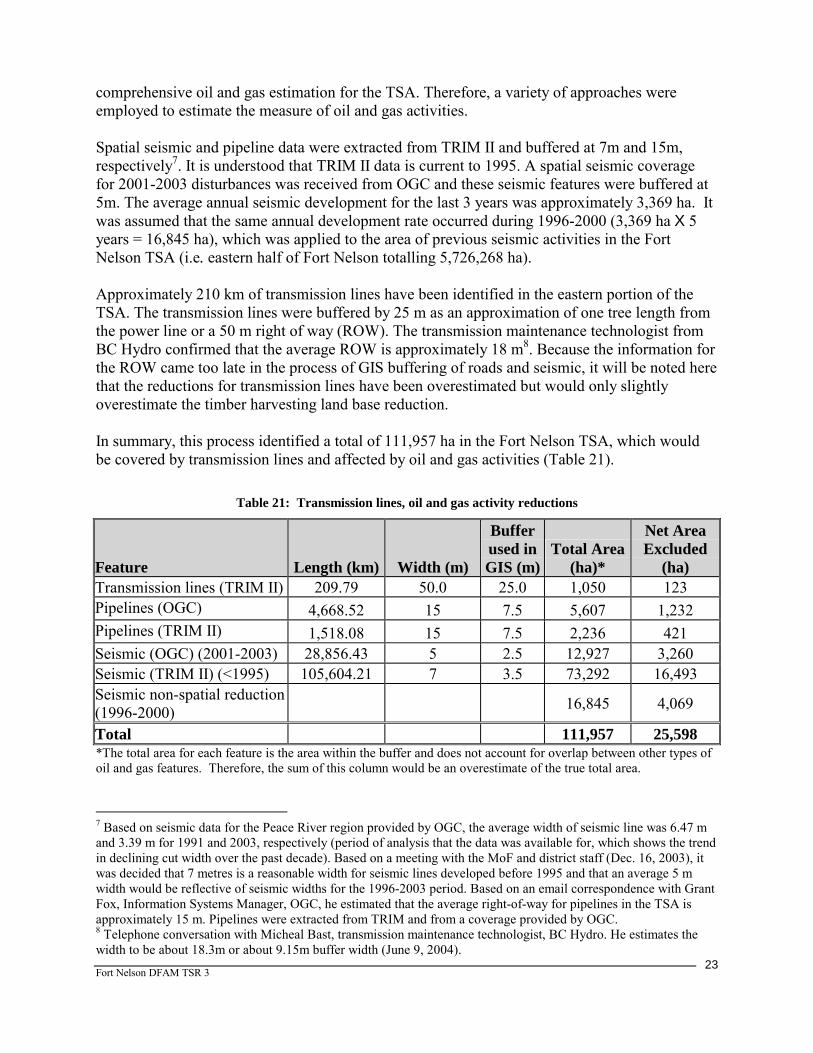
comprehensive oil and gas estimation for the TSA. Therefore, a variety of approaches were employed to estimate the measure of oil and gas activities. Spatial seismic and pipeline data were extracted from TRIM II and buffered at 7m and 15m, respectively7. It is understood that TRIM II data is current to 1995. A spatial seismic coverage for 2001-2003 disturbances was received from OGC and these seismic features were buffered at 5m. The average annual seismic development for the last 3 years was approximately 3,369 ha. It was assumed that the same annual development rate occurred during 1996-2000 (3,369 ha X 5 years = 16,845 ha), which was applied to the area of previous seismic activities in the Fort Nelson TSA (i.e. eastern half of Fort Nelson totalling 5,726,268 ha). Approximately 210 km of transmission lines have been identified in the eastern portion of the TSA. The transmission lines were buffered by 25 m as an approximation of one tree length from the power line or a 50 m right of way (ROW). The transmission maintenance technologist from BC Hydro confirmed that the average ROW is approximately 18 m8. Because the information for the ROW came too late in the process of GIS buffering of roads and seismic, it will be noted here that the reductions for transmission lines have been overestimated but would only slightly overestimate the timber harvesting land base reduction. In summary, this process identified a total of 111,957 ha in the Fort Nelson TSA, which would be covered by transmission lines and affected by oil and gas activities (Table 21).
Table 21: Transmission lines, oil and gas activity reductions
Feature Length (km) Width (m)
Buffer used in GIS (m)
Total Area (ha)*
Net Area Excluded
(ha) Transmission lines (TRIM II) 209.79 50.0 25.0 1,050 123 Pipelines (OGC) 4,668.52 15 7.5 5,607 1,232 Pipelines (TRIM II) 1,518.08 15 7.5 2,236 421 Seismic (OGC) (2001-2003) 28,856.43 5 2.5 12,927 3,260 Seismic (TRIM II) (<1995) 105,604.21 7 3.5 73,292 16,493 Seismic non-spatial reduction (1996-2000) 16,845 4,069
Total 111,957 25,598 *The total area for each feature is the area within the buffer and does not account for overlap between other types of oil and gas features. Therefore, the sum of this column would be an overestimate of the true total area.
7 Based on seismic data for the Peace River region provided by OGC, the average width of seismic line was 6.47 m and 3.39 m for 1991 and 2003, respectively (period of analysis that the data was available for, which shows the trend in declining cut width over the past decade). Based on a meeting with the MoF and district staff (Dec. 16, 2003), it was decided that 7 metres is a reasonable width for seismic lines developed before 1995 and that an average 5 m width would be reflective of seismic widths for the 1996-2003 period. Based on an email correspondence with Grant Fox, Information Systems Manager, OGC, he estimated that the average right-of-way for pipelines in the TSA is approximately 15 m. Pipelines were extracted from TRIM and from a coverage provided by OGC. 8 Telephone conversation with Micheal Bast, transmission maintenance technologist, BC Hydro. He estimates the width to be about 18.3m or about 9.15m buffer width (June 9, 2004).

Fort Nelson DFAM TSR 3
24
It has been noted by the DFAM group that the 16,845 ha estimated for seismic disturbance during 1996 – 2000 may be overestimated. Without explicit data to support the calculation of seismic activity over this period of time, for the exception of the rate of disturbance provided by the OGC data (2000-2003), it is difficult to determine an appropriate estimate. While this assumption might overestimate the reduction for seismic activity, the magnitude of the difference is likely too small to have a significant impact on the timber harvesting land base. A sensitivity analysis is proposed to address the uncertainty of the timber harvesting land base size.
3.4.11 Inoperable/inaccessible/uneconomical areas The assessment of operability is based on the anticipated extent to which a forested area within the Fort Nelson TSA will be harvested considering its physical and economical factors. Often, classifying operability includes a description of the timber quality, terrain conditions and cost and value of the timber. With the availability of new technologies harvesting is rarely impossible, but the related costs may be such that it is impractical.9 A revised operability analysis for the Fort Nelson TSA was developed based on the methodology from a 1997 harvest method mapping project undertaken in the Bulkley TSA10. The Fort Nelson operability analysis produced a spatial operability coverage for the entire TSA in which ‘operable’ polygons were identified through combinations of three derived attributes: stand quality codes, harvest method, and available land base. Queries were performed on the forest inventory to determine stand quality codes. Stand quality codes classified the stands into merchantability categories based on species, age, volume, diameter at breast height, and site index. Harvest method codes were defined by slope classes where ground based harvestable stands (< 35% slope) were considered to be available for harvest. The licensees are not pursuing cable or helicopter logging at this time. The available land base was defined as the available Crown forested land base. A combination of the merchantability criteria, harvest method and Crown productive forest was used to define the operability. Inoperable areas identified from this analysis are excluded from the timber harvesting land base (Table 22).
Table 22: Operable/inoperable classification
Operability Description Total Area (ha) % Reduction Net Area Excluded (ha) Operable 2,449,018 0 n/a Inoperable 7,419,049 100 344,811 Given that this operability analysis was completed in a short timeline, there was not significant opportunity for a thorough review and critique. Several iterations of operability assessments were completed and provided to the DFAM group. Numerous reviews and meetings were held but no formal approval was received prior to completing the analysis dataset. It is proposed that several sensitivity analyses be completed regarding operability including testing the uneconomic criteria from TSR 2 and applying a transportation appraisal to the revised operability assessment.
9 from: http://www.for.gov.bc.ca/hcp/fia/landbase/OperabilityStandards.pdf 10 from: http://www.for.gov.bc.ca/hcp/fia/landbase/HMM_OutlineBulkley.pdf

Fort Nelson DFAM TSR 3
25
If any further information becomes available regarding operability during the course of this analysis it will be incorporated as necessary.
3.4.12 Black spruce-leading stands Black spruce is typically harvested when occurring in mixed stands or in small pockets adjacent to other merchantable species; however, black spruce-leading stands are rarely targeted for timber harvesting in the Fort Nelson TSA. Black spruce-leading stands contain small stem sizes, which are currently not considered merchantable, and offer regeneration problems for future stands due to elevated water tables. For the base case, all black spruce-leading stands will be excluded from the THLB (Table 23). The minor component of black spruce that occurs in mixed species stands will remain as part of the merchantable stand volume.
Table 23: Reduction to black-spruce leading stands
Description % Reduction Total Area (ha) Net Area Excluded
(ha) Black spruce-leading stands 100 1,216,437* 143,259
* There are approximately 2,396,054 ha of black spruce leading stands in the Fort Nelson TSA from the inventory file. However, about 50% (1,179,617ha) have been assigned to the Non-Forest category for wetland and non-productive reductions based on attribute within the VRI.
3.4.13 Cultural heritage resources Three categories of cultural heritage resources are evident within the Fort Nelson TSA: archaeological sites containing physical remains of past human activity; historical sites often consisting of built structure or localities of events significant to living communities; and, traditional use sites which often lack the physical evidence of human-made artefacts or structures but maintain cultural significance for living communities. Natural heritage resources included in the Fort Nelson LRMP consist of all three types of cultural heritage resources.
An archaeological study, Archaeological Overview of the Fort Nelson Land and Resource Management Plan Area, Heritage, was completed in March 1996. The study was completed at a scale of 1:250 000 and classified the planning area into zones with a low, moderate or high potential to contain archaeological sites. This information has been refined to a scale of 1:50 000 or 1:20 000 to assist in operational decision-making.
The Muskwa-Kechika special management area (M-K SMA) covers approximately 6.4 million hectares, of which 2.3 million hectares overlap with the Fort Nelson TSA. The M-K SMA is composed of both special areas and protected areas. Protected areas, such as the historic Davie Trail, are removed from the THLB. Eleven new protected areas have been established, occupying more than 1 million hectares of land. Management in special areas is subject to the guidelines for management of special management zones as outlined in the Fort Nelson LRMP and will allow for logging activities that are sensitive to the wildlife, environmental and cultural values in the area. It is assumed that the wildlife and environmental rules and netdown provided in this data package will account for the Muskwa-Kechika special management requirements.

Fort Nelson DFAM TSR 3
26
Trapping is a highly valued activity within the Fort Nelson TSA, particularly among First Nations communities whose families often maintain traplines. The LRMP identifies that, where traplines are not located in protected areas, a major concern for trappers is the need for adequate notice of pending development that might interfere with their traplines. This requires that any plan must co-ordinate access management planning to include the opportunity for participation by the trapline holder. Commercial/ industrial operators must work with trappers to minimize the impacts of their activities on furbearer habitat and trapline operations.
Currently there are no additional exclusions from the THLB for traplines or other cultural heritage resources.
3.4.14 Future roads, trails and seismic A reduction for future roads, trails and seismic (RTS) activity is required to account for the resulting non-productive areas that will occur as access structures are built and logging and oil and gas activities occur. Future seismic activity is included in this reduction since seismic lines are often used for timber harvesting access. To determine future requirements for roads, trails and seismic, a buffer of 200 m (total width of 400 m), representing the average yarding distance in the Fort Nelson TSA, will be spatially applied to all existing roads and seismic lines to determine the area currently accessed. The area inside the buffer will be considered the roaded area. All areas outside the buffer will be considered part of the non-roaded area. The area in road and seismic activities was determined to be approximately 3.9% of the THLB within the roaded-area (area in existing roads and seismic lines are described in Section 3.3.4 and 3.4.10). Assuming that the road-seismic density in the roaded area will also apply to the non-roaded area, a future RTS reduction will be applied to the THLB in the non-roaded area (Table 24). Based on discussions with the DFAM group and confirmed by the MOF - Fort Nelson Forest District, roadside landings are used in the course of all current logging; additional reductions should therefore not be necessary since they would likely be incorporated into the future road widths. Any production landings within blocks are fully rehabilitated and regenerated and there is no further impact expected; therefore, no future in-block reductions will be made. The DFAM group expects that future road requirements will remain similar to existing requirements throughout the THLB. The only exception is that the future area of seismic may not be applicable to the total non-roaded land base, but this is thought to be a conservative estimate.
Table 24: Future road reductions
Description %
Reduction Reduction Applied to:
Net Area Excluded
(ha) Future between block structures (based on existing road density) 3.9 THLB in the
“non-roaded” area 29,825

Fort Nelson DFAM TSR 3
27
3.4.15 Future wildlife tree patches After all other removals are completed, additional reductions are required to account for the amount of timber retention required for wildlife trees and wildlife tree patches (WTPs). Section 3.2 and Appendix 3 of the Landscape Unit Planning Guide (LUPG, updated in March 2000) will be the basis for modeling wildlife tree retention in this timber supply analysis. Further direction regarding the management of wildlife tree retention relates to the updated Section 3.2 provided by the Assistant Deputy Ministers of Environment, Lands and Parks11 and Forests (May 2000) as well as the Provincial Wildlife Tree Management Recommendations (2002). Wildlife tree targets are determined using Table 3.1 of the LUPG. The required wildlife tree retention %, to be applied to the THLB, was calculated by subtracting the THLB area requiring WTR from the WTR target. The results for this analysis are provided in Table 25. The process of determining the targets and THLB required for WTPs is described below: Step 1 WTR requirements are calculated separately for each biogeoclimatic subzone within each landscape unit. Step 2 The Crown forested area for all polygons within the TSA is identified. The current timber harvesting land base (THLB) is the total area remaining from the netdown process, excluding future roads and WTP requirements. Step 3 The percentage of the BEC subzone within the landscape unit available for harvest is calculated as follows: (THLB/crown forested area)*100%. Step 4 Estimate the portion of the THLB where previous harvesting does not meet WTR objectives. For the purposes of estimating this area, it is assumed that harvesting activities before the introduction of the Biodiversity Guidebook in 1995 do not meet WTR objectives. Step 5 Based on the information derived from steps 1-3, total wildlife tree retention targets are determined from Table A3.2 in the revised Appendix 3 of the Landscape Unit Planning Guide. Step 6 Reserves such as riparian reserve zones contribute to wildlife tree retention targets. The Landscape Unit Planning Guide states that there should be no more than 500m between wildlife tree patches. To determine the proportion of the THLB requiring wildlife tree patches, a 250-meter GIS buffer is applied to existing non-harvestable contributing land base (defined as >80% retention). WTR targets are applied uniformly to the areas beyond the 250-meter buffer from existing reserves.
11 Now the Ministry of Sustainable Resource Management

Fort Nelson DFAM TSR 3
28
The results of the analysis show that an additional 6,272 ha of THLB will be required for future wildlife tree retention. Table 25: Future wildlife tree retention required by landscape unit and BEC subzone.
Landscape Unit BEC Zone
BEC Subzone
Crown forest (ha)
THLB (ha)
% THLB harvested without WTP
% subzone available
for harvest
WTP Target
(%)
THLB Requiring
WTP
Net Area Removed
(ha) July Lake BWBS mw 50,595 23,912 0.0 47.3 2 21,004 420Shekilie BWBS mw 127,601 38,130 0.2 29.9 0 19,404 0Timberwolf BWBS mw 66,769 37,748 0.0 56.5 3 25,326 760Kyklo BWBS mw 144,883 67,545 1.1 46.6 2 33,252 665Kwokullie BWBS mw 52,125 4,581 0.0 8.8 0 1,159 0Hossitl BWBS mw 41,280 8,230 0.0 19.9 0 5,971 0Ootta BWBS mw 46,551 7,824 0.0 16.8 0 2,702 0Dilly BWBS mw 34,382 7,166 0.0 20.8 0 5,164 0Sahtaneh BWBS mw 386,568 64,632 0.7 16.7 0 5,595 0Hoffard BWBS mw 120,002 24,629 0.4 20.5 0 511 0Elleh BWBS mw 77,393 25,505 0.2 33.0 0 4,428 0Eskai BWBS mw 143,604 26,210 1.4 18.3 0 2,156 0Klua BWBS mw 66,446 12,784 0.0 19.2 0 1,218 0Klua BWBS wk 5,068 784 0.0 15.5 0 61 0Big Beaver BWBS mw 93,481 20,567 0.7 22.0 0 1,847 0Big Beaver BWBS wk 1,513 243 0.0 16.1 0 0 0Snake BWBS mw 48,725 23,384 0.7 48.0 2 5,900 118Kiwigana BWBS mw 197,588 85,146 0.0 43.1 1 21,758 218D Easum BWBS mw 62,845 21,428 0.4 34.1 0 13,461 0Sandy BWBS mw 27,370 15,980 1.7 58.4 3 9,249 277Capot Blanc BWBS mw 38,661 22,800 5.7 59.0 4 10,314 413Patry BWBS mw 67,448 26,058 4.3 38.6 1 5,847 58Etane BWBS mw 46,370 24,574 3.4 53.0 2 2,704 54Etane BWBS wk 342 160 0.0 46.8 2 0 0Stanolind BWBS mw 93,763 36,395 0.9 38.8 1 5,129 51Stanolind BWBS wk 216 190 0.0 87.9 6 73 4Pouce BWBS mw 77,775 41,865 0.8 53.8 2 11,896 238Pouce BWBS wk 275 132 0.0 48.1 2 7 0Akue BWBS mw 59,735 28,347 0.7 47.5 2 5,720 114Akue BWBS wk 231 26 0.0 11.2 0 0 0Klowee BWBS mw 49,386 19,357 2.7 39.2 1 3,096 31Holden BWBS mw 94,592 21,091 0.0 22.3 0 1,709 0Holden BWBS wk 17,431 871 0.0 5.0 0 8 0Holden SWB mk 27,803 1,403 0.0 5.0 0 37 0Jackknife BWBS mw 35,276 6,812 0.0 19.3 0 150 0Minaker BWBS mw 66,377 15,559 0.0 23.4 0 1,733 0Minaker BWBS wk 1,959 208 0.0 10.6 0 3 0Minaker SWB mk 866 11 0.0 1.3 0 0 0Richards BWBS mw 1,947 194 0.0 9.9 0 0 0
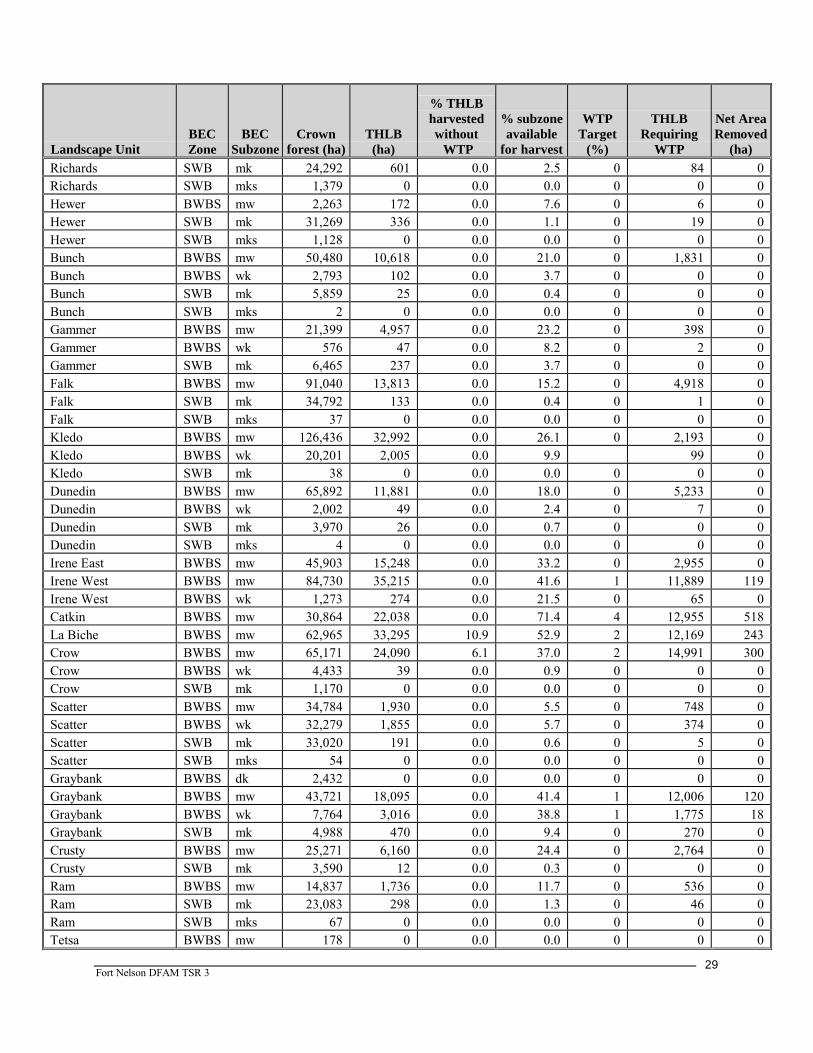
Fort Nelson DFAM TSR 3
29
Landscape Unit BEC Zone
BEC Subzone
Crown forest (ha)
THLB (ha)
% THLB harvested without WTP
% subzone available
for harvest
WTP Target
(%)
THLB Requiring
WTP
Net Area Removed
(ha) Richards SWB mk 24,292 601 0.0 2.5 0 84 0Richards SWB mks 1,379 0 0.0 0.0 0 0 0Hewer BWBS mw 2,263 172 0.0 7.6 0 6 0Hewer SWB mk 31,269 336 0.0 1.1 0 19 0Hewer SWB mks 1,128 0 0.0 0.0 0 0 0Bunch BWBS mw 50,480 10,618 0.0 21.0 0 1,831 0Bunch BWBS wk 2,793 102 0.0 3.7 0 0 0Bunch SWB mk 5,859 25 0.0 0.4 0 0 0Bunch SWB mks 2 0 0.0 0.0 0 0 0Gammer BWBS mw 21,399 4,957 0.0 23.2 0 398 0Gammer BWBS wk 576 47 0.0 8.2 0 2 0Gammer SWB mk 6,465 237 0.0 3.7 0 0 0Falk BWBS mw 91,040 13,813 0.0 15.2 0 4,918 0Falk SWB mk 34,792 133 0.0 0.4 0 1 0Falk SWB mks 37 0 0.0 0.0 0 0 0Kledo BWBS mw 126,436 32,992 0.0 26.1 0 2,193 0Kledo BWBS wk 20,201 2,005 0.0 9.9 99 0Kledo SWB mk 38 0 0.0 0.0 0 0 0Dunedin BWBS mw 65,892 11,881 0.0 18.0 0 5,233 0Dunedin BWBS wk 2,002 49 0.0 2.4 0 7 0Dunedin SWB mk 3,970 26 0.0 0.7 0 0 0Dunedin SWB mks 4 0 0.0 0.0 0 0 0Irene East BWBS mw 45,903 15,248 0.0 33.2 0 2,955 0Irene West BWBS mw 84,730 35,215 0.0 41.6 1 11,889 119Irene West BWBS wk 1,273 274 0.0 21.5 0 65 0Catkin BWBS mw 30,864 22,038 0.0 71.4 4 12,955 518La Biche BWBS mw 62,965 33,295 10.9 52.9 2 12,169 243Crow BWBS mw 65,171 24,090 6.1 37.0 2 14,991 300Crow BWBS wk 4,433 39 0.0 0.9 0 0 0Crow SWB mk 1,170 0 0.0 0.0 0 0 0Scatter BWBS mw 34,784 1,930 0.0 5.5 0 748 0Scatter BWBS wk 32,279 1,855 0.0 5.7 0 374 0Scatter SWB mk 33,020 191 0.0 0.6 0 5 0Scatter SWB mks 54 0 0.0 0.0 0 0 0Graybank BWBS dk 2,432 0 0.0 0.0 0 0 0Graybank BWBS mw 43,721 18,095 0.0 41.4 1 12,006 120Graybank BWBS wk 7,764 3,016 0.0 38.8 1 1,775 18Graybank SWB mk 4,988 470 0.0 9.4 0 270 0Crusty BWBS mw 25,271 6,160 0.0 24.4 0 2,764 0Crusty SWB mk 3,590 12 0.0 0.3 0 0 0Ram BWBS mw 14,837 1,736 0.0 11.7 0 536 0Ram SWB mk 23,083 298 0.0 1.3 0 46 0Ram SWB mks 67 0 0.0 0.0 0 0 0Tetsa BWBS mw 178 0 0.0 0.0 0 0 0

Fort Nelson DFAM TSR 3
30
Landscape Unit BEC Zone
BEC Subzone
Crown forest (ha)
THLB (ha)
% THLB harvested without WTP
% subzone available
for harvest
WTP Target
(%)
THLB Requiring
WTP
Net Area Removed
(ha) Tetsa SWB mk 19,925 15 0.0 0.1 0 0 0Tetsa SWB mks 640 0 0.0 0.0 0 0 0Tuchodi BWBS mw 4,272 0 0.0 0.0 0 0 0Tuchodi SWB mk 58,704 0 0.0 0.0 0 0 0Tuchodi SWB mks 2,718 0 0.0 0.0 0 0 0Gathto BWBS mw 553 0 0.0 0.0 0 0 0Gathto SWB mk 18,034 0 0.0 0.0 0 0 0Gathto SWB mks 739 0 0.0 0.0 0 0 0Crehan BWBS mw 6,369 55 0.0 0.9 0 0 0Crehan SWB mk 27,435 0 0.0 0.0 0 0 0Crehan SWB mks 564 0 0.0 0.0 0 0 0Racing SWB mk 13,712 44 0.0 0.3 0 10 0Racing SWB mks 588 0 0.0 0.0 0 0 0MacDonald BWBS mw 2,710 160 0.0 5.9 0 1 0MacDonald SWB mk 20,873 2,469 0.0 11.8 0 780 0MacDonald SWB mks 96 0 0.0 0.0 0 0 0Tentsi BWBS mw 6,219 788 0.0 12.7 0 175 0Tentsi SWB mk 19,781 4,083 0.0 20.6 0 2,742 0Tentsi SWB mks 3 0 0.0 0.0 0 0 0Moose SWB mk 15,051 2,634 0.0 17.5 0 1,523 0Moose SWB mks 84 0 0.0 0.0 0 0 0Otelsas BWBS mw 343 0 0.0 0.0 0 0 0Otelsas SWB mk 22,011 288 0.0 1.3 0 66 0Otelsas SWB mks 983 0 0.0 0.0 0 0 0Muncho BWBS dk 10,914 125 0.0 1.1 0 0 0Muncho SWB mk 29,799 140 0.0 0.5 0 61 0Muncho SWB mks 1,711 0 0.0 0.0 0 0 0Eight Mile BWBS mw 10,802 522 0.0 4.8 0 173 0Eight Mile SWB mk 33,947 911 0.0 2.7 0 254 0Eight Mile SWB mks 46 0 0.0 0.0 0 0 0Sulpher BWBS dk 32,954 637 0.0 1.9 0 113 0Sulpher BWBS mw 745 0 0.0 0.0 0 0 0Sulpher SWB mk 22,728 668 0.0 2.9 0 67 0Sulpher SWB mks 22 0 0.0 0.0 0 0 0Moule BWBS dk 32,240 531 0.0 1.6 0 22 0Moule BWBS wk 139 0 0.0 0.0 0 0 0Moule SWB mk 11,162 851 0.0 7.6 0 214 0Moule SWB mks 97 1 0.0 0.9 0 0 0Grayling BWBS dk 28 20 0.0 70.4 4 0 0Grayling BWBS mw 22,699 5,356 0.0 23.6 0 2,649 0Grayling BWBS wk 22,423 5,991 0.0 26.7 0 2,423 0Grayling SWB mk 72,604 9,150 0.0 12.6 0 4,316 0Grayling SWB mks 1,188 57 0.0 4.8 0 31 0Redpott BWBS mw 184 82 0.0 44.6 1 13 0

Fort Nelson DFAM TSR 3
31
Landscape Unit BEC Zone
BEC Subzone
Crown forest (ha)
THLB (ha)
% THLB harvested without WTP
% subzone available
for harvest
WTP Target
(%)
THLB Requiring
WTP
Net Area Removed
(ha) Redpott BWBS wk 6,473 1,902 0.0 29.4 0 823 0Redpott SWB mk 26,010 3,821 0.0 14.7 0 1,999 0Redpott SWB mks 9 1 0.0 11.5 0 1 0Smith BWBS dk 140,711 57,613 0.0 40.9 1 39,343 393Smith BWBS wk 994 594 0.0 59.8 3 511 15Smith SWB mk 23,164 3,580 0.0 15.5 0 1,783 0Liard Hot Springs BWBS dk 33,565 4,135 0.0 12.3 0 1,952 0Liard Hot Springs SWB mk 12,225 145 0.0 1.2 0 13 0Liard Hot Springs SWB mks 8 0 0.0 0.0 0 0 0Forcier BWBS dk 23,439 430 0.0 1.8 0 114 0Forcier SWB mk 14,640 373 0.0 2.5 0 96 0Forcier SWB mks 1,332 4 0.0 0.3 0 0 0Vents BWBS dk 61,415 17,724 0.0 28.9 0 11,125 0Vents SWB mk 29,459 2,839 0.0 9.6 0 1,545 0Vents SWB mks 392 0 0.0 0.0 0 0 0Liard River A BWBS dk 115,668 21,495 0.0 18.6 0 12,217 0Liard River A SWB mk 2,691 114 0.0 4.3 0 1 0Liard River B BWBS mw 31,650 7,870 0.0 24.9 0 2,060 0Liard River B BWBS wk 38 2 0.0 5.2 0 0 0Liard River C BWBS mw 67,086 42,647 5.5 63.6 3 15,498 465Fort Nelson River B BWBS mw 35,336 20,521 0.0 58.1 3 3,334 100Fort Nelson River A BWBS mw 20,364 10,061 0.1 49.4 2 1,289 26Muskwa River B BWBS mw 27,010 12,853 0.0 47.6 2 1,456 29Prophet River BWBS mw 27,092 15,279 0.2 56.4 3 2,193 66Muskwa River A BWBS mw 16,944 3,286 0.0 19.4 0 75 0Muskwa River A SWB mk 1,632 0 0.0 0.0 0 0 0Hay River BWBS mw 6,545 2,953 0.0 45.1 2 637 13Petitot River BWBS mw 13,392 2,739 0.0 20.5 0 528 0Kechika River BWBS dk 165,000 57,519 0.0 34.9 1 26,912 269Kechika River SWB mk 18,246 3,005 0.0 16.5 0 882 0Coal BWBS dk 60,587 13,954 0.0 23.0 0 8,621 0Coal SWB mk 3,051 278 0.0 9.1 0 121 0Kitza BWBS dk 19,700 9,973 0.0 50.6 2 6,752 135Kitza SWB mk 921 170 0.0 18.5 0 43 0Gemini BWBS dk 39,842 6,213 0.0 15.6 0 1,918 0Gemini SWB mk 926 37 0.0 4.0 0 8 0Rabbit BWBS dk 60,632 7,900 0.0 13.0 0 2,518 0Rabbit SWB mk 16,614 1,035 0.0 6.2 0 250 0Chee BWBS dk 17,220 490 0.0 2.8 0 38 0Chee SWB mk 33,423 3,073 0.0 9.2 0 1,577 0Chee SWB mks 145 71 0.0 48.6 2 71 1Gundahoo BWBS dk 3,875 941 0.0 24.3 0 333 0Gundahoo SWB mk 46,856 3,897 0.0 8.3 0 1,679 0Gundahoo SWB mks 5,064 25 0.0 0.5 0 0 0
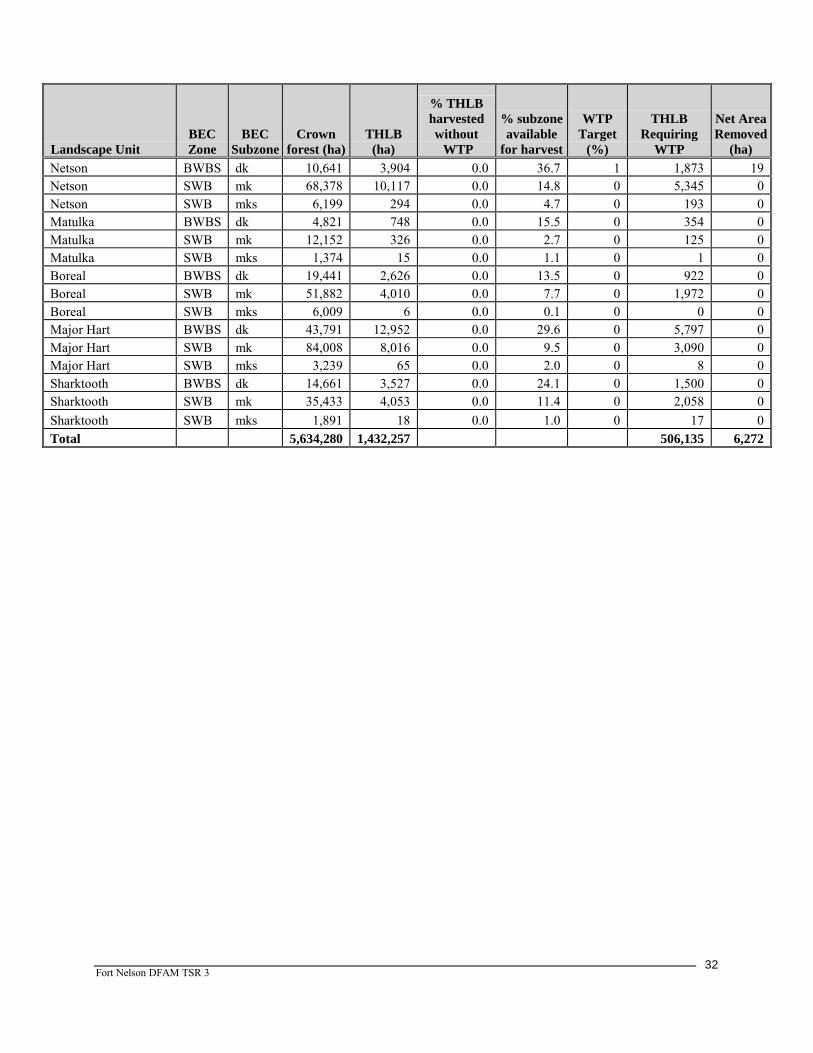
Fort Nelson DFAM TSR 3
32
Landscape Unit BEC Zone
BEC Subzone
Crown forest (ha)
THLB (ha)
% THLB harvested without WTP
% subzone available
for harvest
WTP Target
(%)
THLB Requiring
WTP
Net Area Removed
(ha) Netson BWBS dk 10,641 3,904 0.0 36.7 1 1,873 19Netson SWB mk 68,378 10,117 0.0 14.8 0 5,345 0Netson SWB mks 6,199 294 0.0 4.7 0 193 0Matulka BWBS dk 4,821 748 0.0 15.5 0 354 0Matulka SWB mk 12,152 326 0.0 2.7 0 125 0Matulka SWB mks 1,374 15 0.0 1.1 0 1 0Boreal BWBS dk 19,441 2,626 0.0 13.5 0 922 0Boreal SWB mk 51,882 4,010 0.0 7.7 0 1,972 0Boreal SWB mks 6,009 6 0.0 0.1 0 0 0Major Hart BWBS dk 43,791 12,952 0.0 29.6 0 5,797 0Major Hart SWB mk 84,008 8,016 0.0 9.5 0 3,090 0Major Hart SWB mks 3,239 65 0.0 2.0 0 8 0Sharktooth BWBS dk 14,661 3,527 0.0 24.1 0 1,500 0Sharktooth SWB mk 35,433 4,053 0.0 11.4 0 2,058 0Sharktooth SWB mks 1,891 18 0.0 1.0 0 17 0Total 5,634,280 1,432,257 506,135 6,272
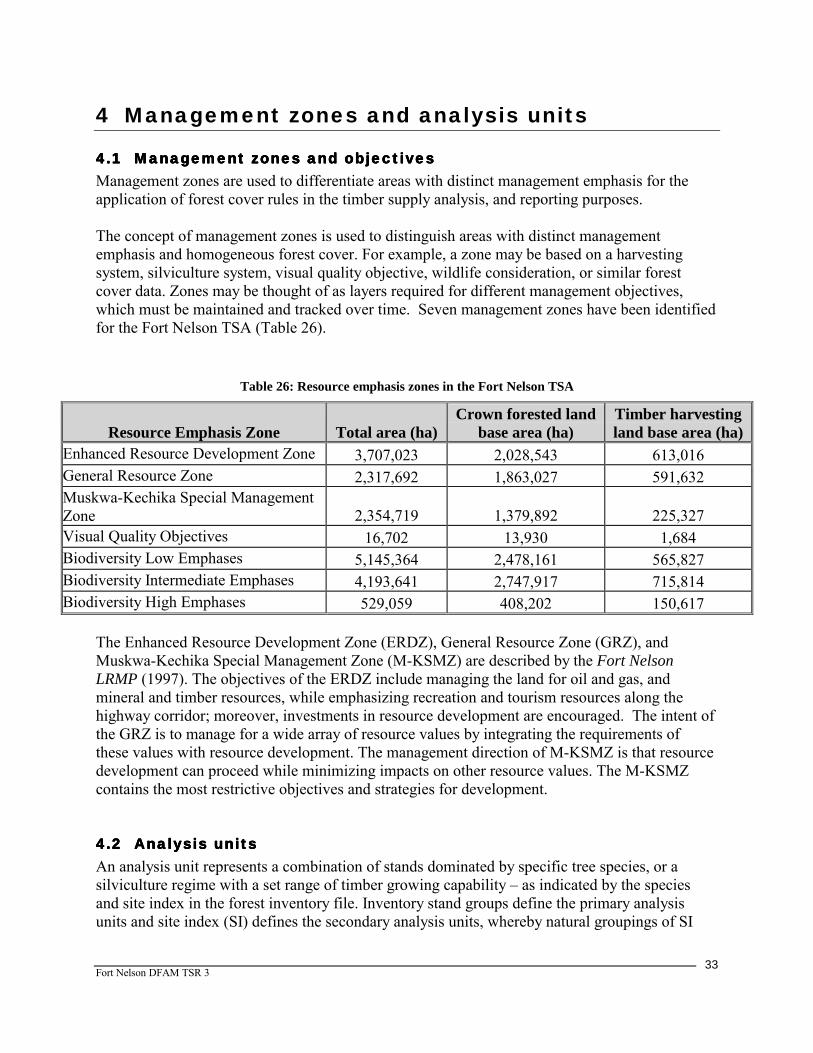
Fort Nelson DFAM TSR 3
33
4 Management zones and analysis units
4.14.14.14.1 Management zones and objectivesManagement zones and objectivesManagement zones and objectivesManagement zones and objectives Management zones are used to differentiate areas with distinct management emphasis for the application of forest cover rules in the timber supply analysis, and reporting purposes. The concept of management zones is used to distinguish areas with distinct management emphasis and homogeneous forest cover. For example, a zone may be based on a harvesting system, silviculture system, visual quality objective, wildlife consideration, or similar forest cover data. Zones may be thought of as layers required for different management objectives, which must be maintained and tracked over time. Seven management zones have been identified for the Fort Nelson TSA (Table 26).
Table 26: Resource emphasis zones in the Fort Nelson TSA
Resource Emphasis Zone Total area (ha) Crown forested land
base area (ha) Timber harvesting land base area (ha)
Enhanced Resource Development Zone 3,707,023 2,028,543 613,016 General Resource Zone 2,317,692 1,863,027 591,632 Muskwa-Kechika Special Management Zone 2,354,719 1,379,892 225,327 Visual Quality Objectives 16,702 13,930 1,684 Biodiversity Low Emphases 5,145,364 2,478,161 565,827 Biodiversity Intermediate Emphases 4,193,641 2,747,917 715,814 Biodiversity High Emphases 529,059 408,202 150,617
The Enhanced Resource Development Zone (ERDZ), General Resource Zone (GRZ), and Muskwa-Kechika Special Management Zone (M-KSMZ) are described by the Fort Nelson LRMP (1997). The objectives of the ERDZ include managing the land for oil and gas, and mineral and timber resources, while emphasizing recreation and tourism resources along the highway corridor; moreover, investments in resource development are encouraged. The intent of the GRZ is to manage for a wide array of resource values by integrating the requirements of these values with resource development. The management direction of M-KSMZ is that resource development can proceed while minimizing impacts on other resource values. The M-KSMZ contains the most restrictive objectives and strategies for development.
4.24.24.24.2 Analysis unitsAnalysis unitsAnalysis unitsAnalysis units An analysis unit represents a combination of stands dominated by specific tree species, or a silviculture regime with a set range of timber growing capability – as indicated by the species and site index in the forest inventory file. Inventory stand groups define the primary analysis units and site index (SI) defines the secondary analysis units, whereby natural groupings of SI
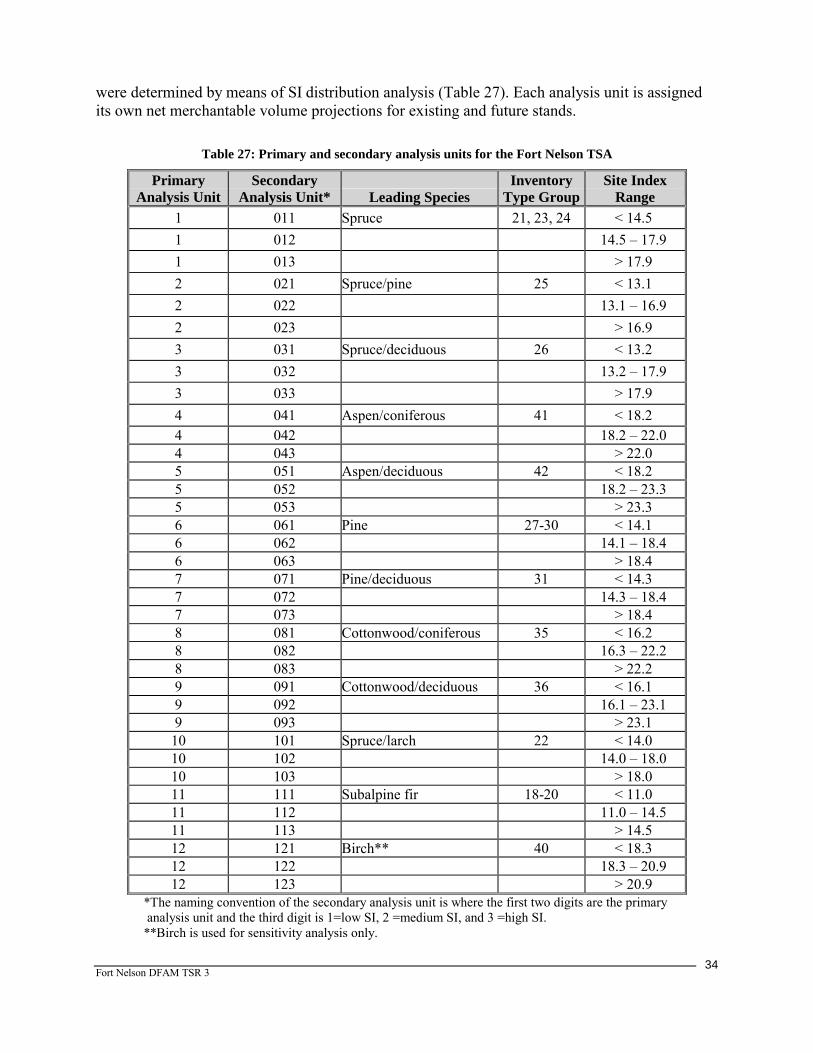
Fort Nelson DFAM TSR 3
34
were determined by means of SI distribution analysis (Table 27). Each analysis unit is assigned its own net merchantable volume projections for existing and future stands.
Table 27: Primary and secondary analysis units for the Fort Nelson TSA
Primary Analysis Unit
Secondary Analysis Unit* Leading Species
Inventory Type Group
Site Index Range
1 011 Spruce 21, 23, 24 < 14.5 1 012 14.5 – 17.9 1 013 > 17.9 2 021 Spruce/pine 25 < 13.1 2 022 13.1 – 16.9 2 023 > 16.9 3 031 Spruce/deciduous 26 < 13.2 3 032 13.2 – 17.9 3 033 > 17.9 4 041 Aspen/coniferous 41 < 18.2 4 042 18.2 – 22.0 4 043 > 22.0 5 051 Aspen/deciduous 42 < 18.2 5 052 18.2 – 23.3 5 053 > 23.3 6 061 Pine 27-30 < 14.1 6 062 14.1 – 18.4 6 063 > 18.4 7 071 Pine/deciduous 31 < 14.3 7 072 14.3 – 18.4 7 073 > 18.4 8 081 Cottonwood/coniferous 35 < 16.2 8 082 16.3 – 22.2 8 083 > 22.2 9 091 Cottonwood/deciduous 36 < 16.1 9 092 16.1 – 23.1 9 093 > 23.1 10 101 Spruce/larch 22 < 14.0 10 102 14.0 – 18.0 10 103 > 18.0 11 111 Subalpine fir 18-20 < 11.0 11 112 11.0 – 14.5 11 113 > 14.5 12 121 Birch** 40 < 18.3 12 122 18.3 – 20.9 12 123 > 20.9
*The naming convention of the secondary analysis unit is where the first two digits are the primary analysis unit and the third digit is 1=low SI, 2 =medium SI, and 3 =high SI. **Birch is used for sensitivity analysis only.

Fort Nelson DFAM TSR 3
35
The analysis units will be organized within the following management groups: Existing natural stands – stands that have not been logged yet or are not subject to forest management (planting/density control). This group will include current and future deciduous and naturally regenerating mixedwood spruce/larch and subalpine fir stands. Any stands logged pre-1990 are also considered ‘natural’. These stands will be modeled with VDYP, as agreed to by the DFAM/District, as they are problematic and of low productivity: there is difficulty regenerating these stands, as represented by their longer regeneration delay. Existing natural stand analysis units are presented in Table 28. Each analysis unit will also be split between VRI “rolled over” and VRI Phase II to recognize the differences between these inventory standards as well as for analysis comparison and modelling. Existing managed stands –stands that have been subject to forest management (planting and density control) to the degree that they would exhibit different growth characteristics and attributes as compared to existing natural stands. Existing managed stands include stands harvested between 1990 and 2002. Only pure spruce, spruce/pine and pure pine stands are planted so it is expected that they will form the majority of existing managed stands. These stands will be modelled using TIPSY. As the existing managed pure conifer stands are harvested they will regenerate to future managed stands. Current/future managed stands – stands that are currently being harvested and regenerated following current forest management (i.e. any stand logged or managed after 2003). Once the pure spruce, spruce/pine and pure pine existing natural and existing managed stands are harvested they will regenerate to pure conifer future managed stands. Future managed stands will be modelled using TIPSY. The difference between existing managed and current/future managed stands is that the latter will be modelled with genetic gain information applied to the yield curves. Analysis units for existing natural stands (Table 28), existing managed stands (Table 29), and future managed stands (Table 30) are split between VRI “rolled over” and Phase II to represent the differences between these inventory standards. The SI values provided represent area-weighted averages for these stands.
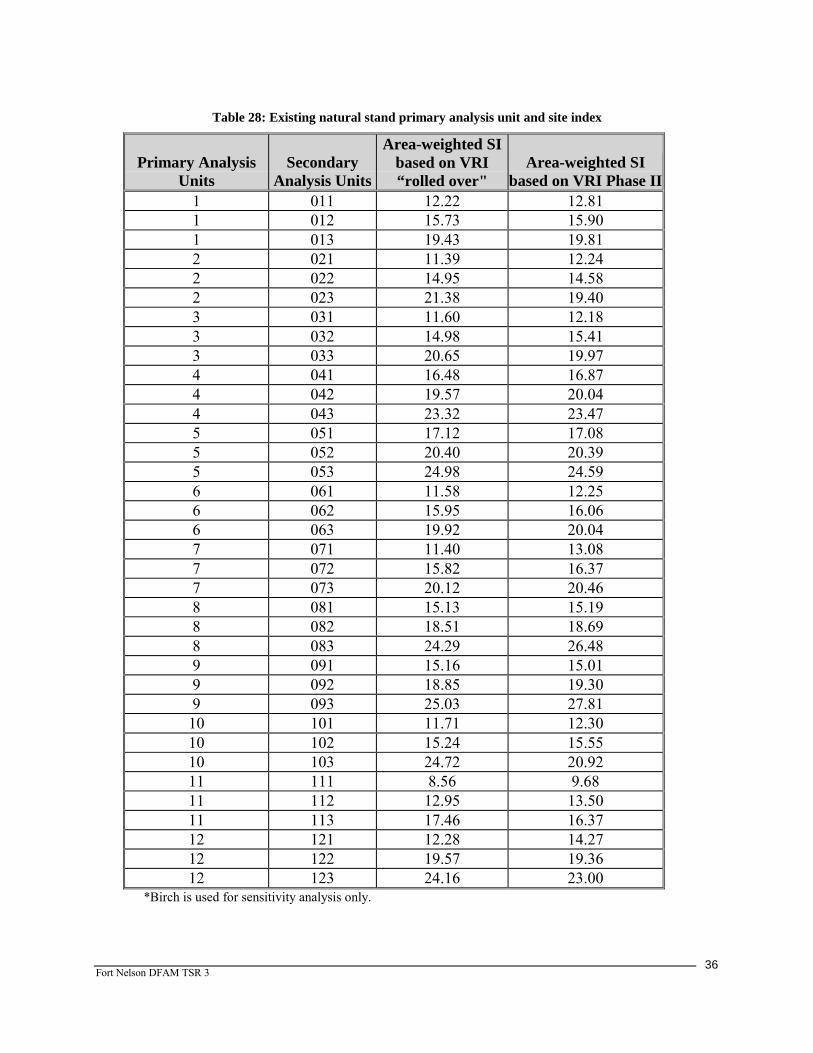
Fort Nelson DFAM TSR 3
36
Table 28: Existing natural stand primary analysis unit and site index
*Birch is used for sensitivity analysis only.
Primary Analysis Units
Secondary Analysis Units
Area-weighted SI based on VRI “rolled over"
Area-weighted SI based on VRI Phase II
1 011 12.22 12.81 1 012 15.73 15.90 1 013 19.43 19.81 2 021 11.39 12.24 2 022 14.95 14.58 2 023 21.38 19.40 3 031 11.60 12.18 3 032 14.98 15.41 3 033 20.65 19.97 4 041 16.48 16.87 4 042 19.57 20.04 4 043 23.32 23.47 5 051 17.12 17.08 5 052 20.40 20.39 5 053 24.98 24.59 6 061 11.58 12.25 6 062 15.95 16.06 6 063 19.92 20.04 7 071 11.40 13.08 7 072 15.82 16.37 7 073 20.12 20.46 8 081 15.13 15.19 8 082 18.51 18.69 8 083 24.29 26.48 9 091 15.16 15.01 9 092 18.85 19.30 9 093 25.03 27.81 10 101 11.71 12.30 10 102 15.24 15.55 10 103 24.72 20.92 11 111 8.56 9.68 11 112 12.95 13.50 11 113 17.46 16.37 12 121 12.28 14.27 12 122 19.57 19.36 12 123 24.16 23.00

Fort Nelson DFAM TSR 3
37
Table 29: Existing managed stand analysis unit and site index
Primary Analysis Units
Secondary Analysis Units
Area-weighted SI based on VRI “rolled over”
1 012 15.27 6 062 17.35 6 063 20.00
Note: Only existing managed stands in the THLB are shown.
Table 30: Current/future managed stand analysis unit and site index
Primary Analysis Units
Secondary Analysis Units
Area-weighted SI based on VRI “rolled over”
Area-weighted SI based on VRI Phase II
1 011 12.22 12.81 1 012 15.73 15.90 1 013 19.43 19.81 2 021 11.39 12.24 2 022 14.95 14.58 2 023 21.38 19.40 6 061 11.58 12.25 6 062 15.95 16.06 6 063 19.92 20.04
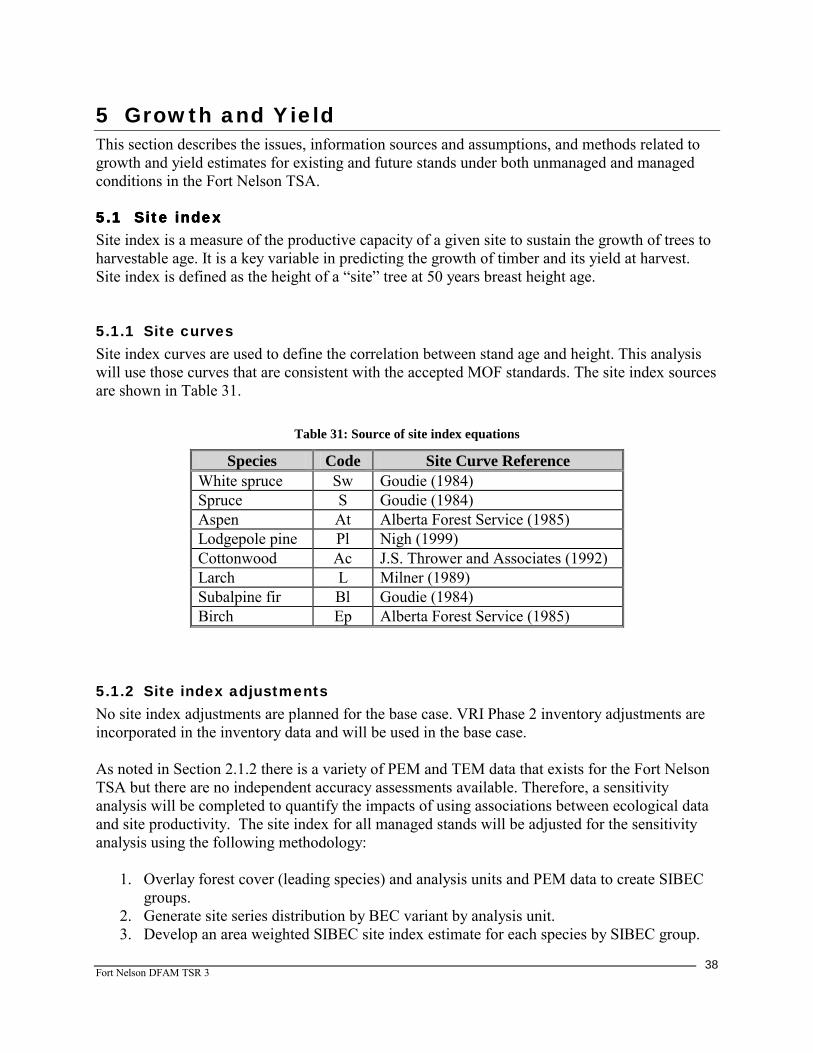
Fort Nelson DFAM TSR 3
38
5 Growth and Yield This section describes the issues, information sources and assumptions, and methods related to growth and yield estimates for existing and future stands under both unmanaged and managed conditions in the Fort Nelson TSA.
5.15.15.15.1 Site indexSite indexSite indexSite index Site index is a measure of the productive capacity of a given site to sustain the growth of trees to harvestable age. It is a key variable in predicting the growth of timber and its yield at harvest. Site index is defined as the height of a “site” tree at 50 years breast height age.
5.1.1 Site curves Site index curves are used to define the correlation between stand age and height. This analysis will use those curves that are consistent with the accepted MOF standards. The site index sources are shown in Table 31.
Table 31: Source of site index equations
Species Code Site Curve Reference White spruce Sw Goudie (1984) Spruce S Goudie (1984) Aspen At Alberta Forest Service (1985) Lodgepole pine Pl Nigh (1999) Cottonwood Ac J.S. Thrower and Associates (1992) Larch L Milner (1989) Subalpine fir Bl Goudie (1984) Birch Ep Alberta Forest Service (1985)
5.1.2 Site index adjustments No site index adjustments are planned for the base case. VRI Phase 2 inventory adjustments are incorporated in the inventory data and will be used in the base case. As noted in Section 2.1.2 there is a variety of PEM and TEM data that exists for the Fort Nelson TSA but there are no independent accuracy assessments available. Therefore, a sensitivity analysis will be completed to quantify the impacts of using associations between ecological data and site productivity. The site index for all managed stands will be adjusted for the sensitivity analysis using the following methodology:
1. Overlay forest cover (leading species) and analysis units and PEM data to create SIBEC groups.
2. Generate site series distribution by BEC variant by analysis unit. 3. Develop an area weighted SIBEC site index estimate for each species by SIBEC group.
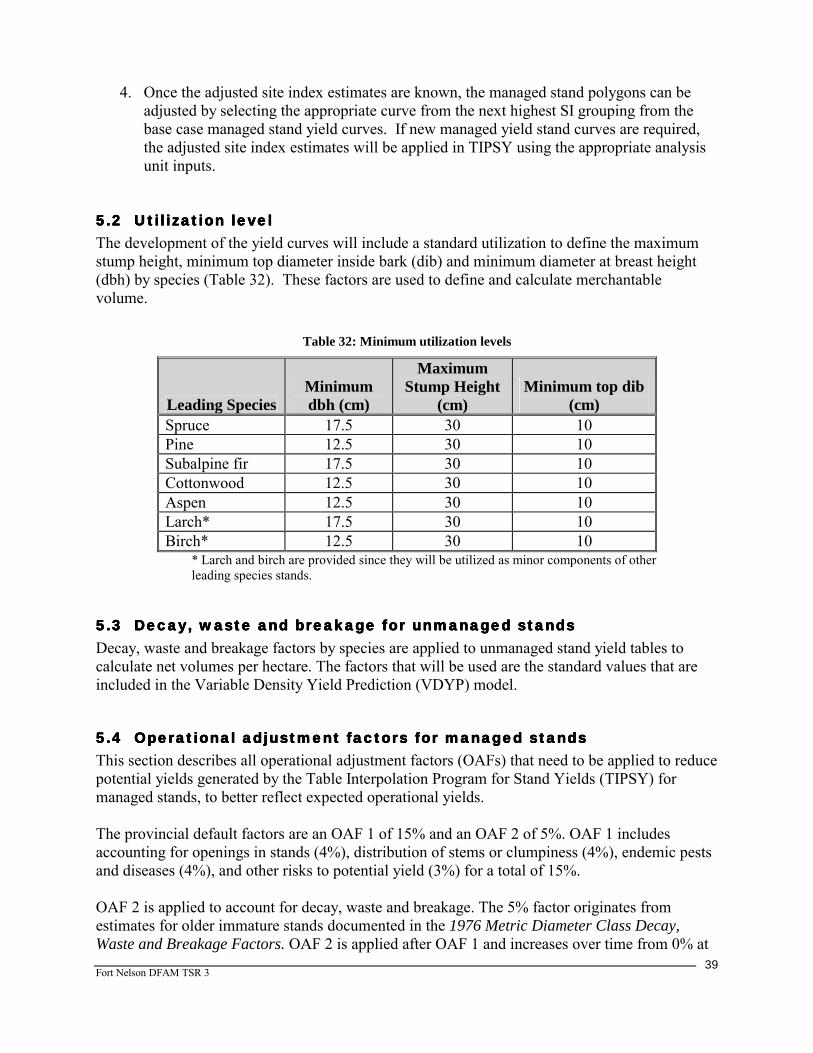
Fort Nelson DFAM TSR 3
39
4. Once the adjusted site index estimates are known, the managed stand polygons can be adjusted by selecting the appropriate curve from the next highest SI grouping from the base case managed stand yield curves. If new managed yield stand curves are required, the adjusted site index estimates will be applied in TIPSY using the appropriate analysis unit inputs.
5.25.25.25.2 Utilization levelUtilization levelUtilization levelUtilization level The development of the yield curves will include a standard utilization to define the maximum stump height, minimum top diameter inside bark (dib) and minimum diameter at breast height (dbh) by species (Table 32). These factors are used to define and calculate merchantable volume.
Table 32: Minimum utilization levels
Leading Species Minimum dbh (cm)
Maximum Stump Height
(cm) Minimum top dib
(cm) Spruce 17.5 30 10 Pine 12.5 30 10 Subalpine fir 17.5 30 10 Cottonwood 12.5 30 10 Aspen 12.5 30 10 Larch* 17.5 30 10 Birch* 12.5 30 10
* Larch and birch are provided since they will be utilized as minor components of other leading species stands.
5.35.35.35.3 Decay, waste and breakage for unmanaged standsDecay, waste and breakage for unmanaged standsDecay, waste and breakage for unmanaged standsDecay, waste and breakage for unmanaged stands Decay, waste and breakage factors by species are applied to unmanaged stand yield tables to calculate net volumes per hectare. The factors that will be used are the standard values that are included in the Variable Density Yield Prediction (VDYP) model.
5.45.45.45.4 Operational adjustment factors for managed standsOperational adjustment factors for managed standsOperational adjustment factors for managed standsOperational adjustment factors for managed stands This section describes all operational adjustment factors (OAFs) that need to be applied to reduce potential yields generated by the Table Interpolation Program for Stand Yields (TIPSY) for managed stands, to better reflect expected operational yields. The provincial default factors are an OAF 1 of 15% and an OAF 2 of 5%. OAF 1 includes accounting for openings in stands (4%), distribution of stems or clumpiness (4%), endemic pests and diseases (4%), and other risks to potential yield (3%) for a total of 15%. OAF 2 is applied to account for decay, waste and breakage. The 5% factor originates from estimates for older immature stands documented in the 1976 Metric Diameter Class Decay, Waste and Breakage Factors. OAF 2 is applied after OAF 1 and increases over time from 0% at
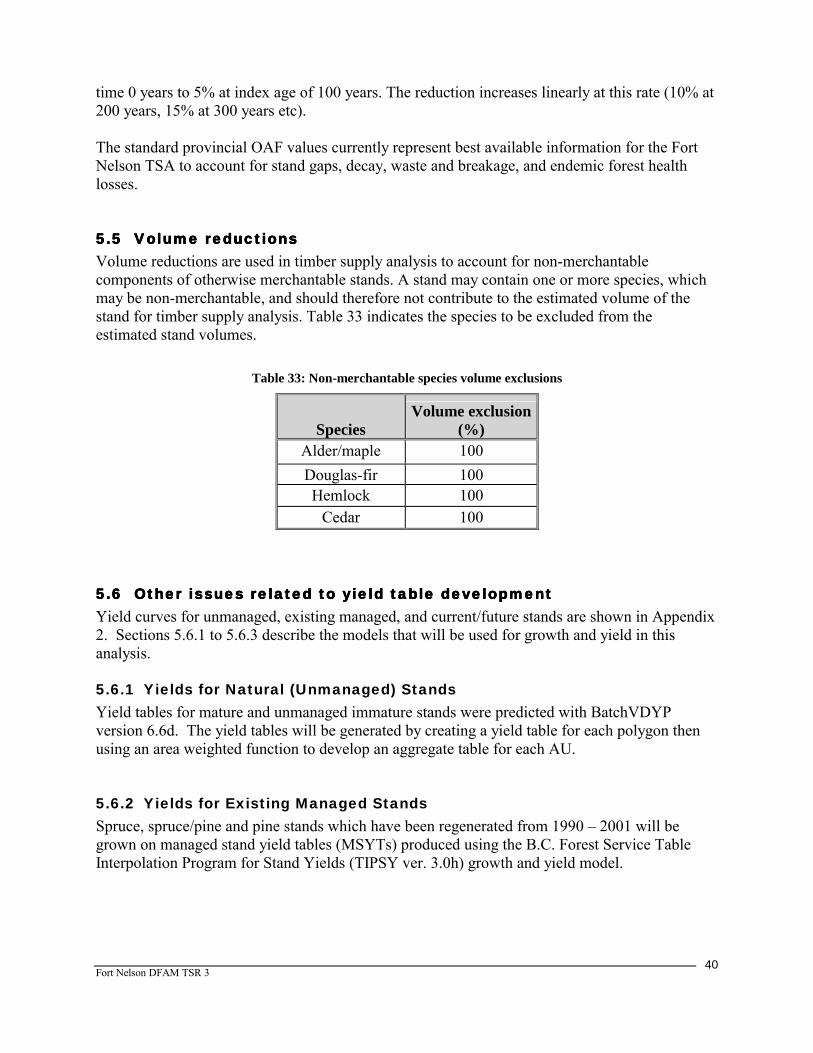
Fort Nelson DFAM TSR 3
40
time 0 years to 5% at index age of 100 years. The reduction increases linearly at this rate (10% at 200 years, 15% at 300 years etc). The standard provincial OAF values currently represent best available information for the Fort Nelson TSA to account for stand gaps, decay, waste and breakage, and endemic forest health losses.
5.55.55.55.5 Volume reductionsVolume reductionsVolume reductionsVolume reductions Volume reductions are used in timber supply analysis to account for non-merchantable components of otherwise merchantable stands. A stand may contain one or more species, which may be non-merchantable, and should therefore not contribute to the estimated volume of the stand for timber supply analysis. Table 33 indicates the species to be excluded from the estimated stand volumes.
Table 33: Non-merchantable species volume exclusions
Species Volume exclusion
(%) Alder/maple 100 Douglas-fir 100 Hemlock 100
Cedar 100
5.65.65.65.6 Other issues related to yield table developmentOther issues related to yield table developmentOther issues related to yield table developmentOther issues related to yield table development Yield curves for unmanaged, existing managed, and current/future stands are shown in Appendix 2. Sections 5.6.1 to 5.6.3 describe the models that will be used for growth and yield in this analysis.
5.6.1 Yields for Natural (Unmanaged) Stands Yield tables for mature and unmanaged immature stands were predicted with BatchVDYP version 6.6d. The yield tables will be generated by creating a yield table for each polygon then using an area weighted function to develop an aggregate table for each AU.
5.6.2 Yields for Existing Managed Stands Spruce, spruce/pine and pine stands which have been regenerated from 1990 – 2001 will be grown on managed stand yield tables (MSYTs) produced using the B.C. Forest Service Table Interpolation Program for Stand Yields (TIPSY ver. 3.0h) growth and yield model.

Fort Nelson DFAM TSR 3
41
5.6.3 Yields for Current and Future Managed Stands Spruce, spruce/pine and pine stands which have been regenerated from 2002 onwards will be grown on MSYTs produced using the B.C. Ministry of Forests TIPSY ver. 3.0h growth and yield model. Any current or future genetic gain benefits will be applicable to these stands.
5.6.4 Existing timber volume check To verify that no errors were made in aggregation and that no significant aggregation bias exists, the total volume of the current inventory using polygon-specific inventory volumes was compared to the total volume of the current inventory based on analysis unit volumes (Table 34). The difference of 2.29% is within an acceptable difference as dictated by the DFAM standards. No further analysis unit groupings are proposed at this time.
Table 34: Existing timber volume check
Polygon volume derived using:
Inventory volume Yield table (AU)
volume Percent (%) difference
Total Volume (m3) 276,716,585 283,201,838 2.29

Fort Nelson DFAM TSR 3
42
6 Silviculture
6.16.16.16.1 Silviculture management regimesSilviculture management regimesSilviculture management regimesSilviculture management regimes
6.1.1 Unmanaged Stands In the Fort Nelson TSA, unmanaged stands will be defined as all stands disturbed by fire and/or harvest prior to and including 1989, and all existing stands excluding pure pine, pure spruce and spruce/pine stands (i.e. analysis units 1, 2, and 6). Licensees and district staff felt that although some planting and density control was done between 1987 and 1989, it was not until 1990 and onwards that there was adequate planting and brush control in the TSA. Therefore, unmanaged stands (i.e. stands that have not been harvested or managed since 1990) will be grown on unmanaged stand (VDYP) yield curves for several reasons:
1) Although some stands may have been planted prior to 1990, it is assumed that the lower volumes produced by VDYP yield curves (as compared to TIPSY curves) will more accurately reflect the management regimes and expected yield of these stands.
2) Modelling natural regeneration of these stands also reflects the longer regeneration delays
compared to ‘managed’ stands and, in some cases, the lack of brush control in these stands.
3) Some of these stands have not been planted.
For the analysis, all stands harvested prior to 1990 will be naturally regenerated and will be grown on unmanaged stand yield tables, including pine, spruce, and pine/spruce. Existing stands of pure deciduous, spruce/deciduous, pine/deciduous, subalpine fir, spruce/larch, aspen/coniferous, aspen/deciduous, cottonwood/coniferous, cottonwood/deciduous and birch, whether harvested in the past or in the future, will be modelled using VDYP generated yield curves.
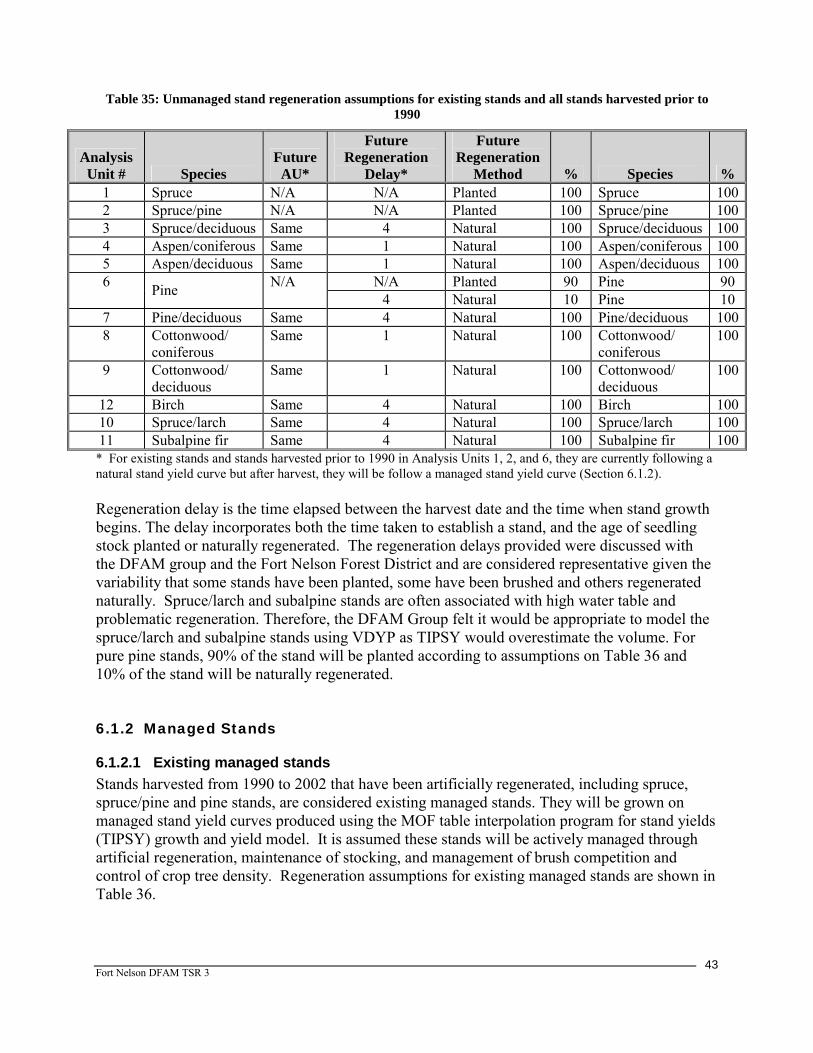
Fort Nelson DFAM TSR 3
43
Table 35: Unmanaged stand regeneration assumptions for existing stands and all stands harvested prior to 1990
Analysis Unit # Species
Future AU*
Future Regeneration
Delay*
Future Regeneration
Method % Species % 1 Spruce N/A N/A Planted 100 Spruce 1002 Spruce/pine N/A N/A Planted 100 Spruce/pine 1003 Spruce/deciduous Same 4 Natural 100 Spruce/deciduous 1004 Aspen/coniferous Same 1 Natural 100 Aspen/coniferous 1005 Aspen/deciduous Same 1 Natural 100 Aspen/deciduous 100
N/A Planted 90 Pine 90 6 Pine N/A 4 Natural 10 Pine 10
7 Pine/deciduous Same 4 Natural 100 Pine/deciduous 1008 Cottonwood/
coniferous Same 1 Natural 100 Cottonwood/
coniferous 100
9 Cottonwood/ deciduous
Same 1 Natural 100 Cottonwood/ deciduous
100
12 Birch Same 4 Natural 100 Birch 10010 Spruce/larch Same 4 Natural 100 Spruce/larch 10011 Subalpine fir Same 4 Natural 100 Subalpine fir 100* For existing stands and stands harvested prior to 1990 in Analysis Units 1, 2, and 6, they are currently following a natural stand yield curve but after harvest, they will be follow a managed stand yield curve (Section 6.1.2). Regeneration delay is the time elapsed between the harvest date and the time when stand growth begins. The delay incorporates both the time taken to establish a stand, and the age of seedling stock planted or naturally regenerated. The regeneration delays provided were discussed with the DFAM group and the Fort Nelson Forest District and are considered representative given the variability that some stands have been planted, some have been brushed and others regenerated naturally. Spruce/larch and subalpine stands are often associated with high water table and problematic regeneration. Therefore, the DFAM Group felt it would be appropriate to model the spruce/larch and subalpine stands using VDYP as TIPSY would overestimate the volume. For pure pine stands, 90% of the stand will be planted according to assumptions on Table 36 and 10% of the stand will be naturally regenerated.
6.1.2 Managed Stands
6.1.2.1 Existing managed stands Stands harvested from 1990 to 2002 that have been artificially regenerated, including spruce, spruce/pine and pine stands, are considered existing managed stands. They will be grown on managed stand yield curves produced using the MOF table interpolation program for stand yields (TIPSY) growth and yield model. It is assumed these stands will be actively managed through artificial regeneration, maintenance of stocking, and management of brush competition and control of crop tree density. Regeneration assumptions for existing managed stands are shown in Table 36.

Fort Nelson DFAM TSR 3
44
For managed stands, the average free growing target density is approximately 1,300 stems/ha (ranges from 1,200 to 1,400 stems/ha) based on operational information provided by the DFAM group supported by ISIS data. It is assumed that the planting densities of 1,400 stems/ha are implemented to achieve target free growing densities of 1,300 stems/ha because planting survival is less than 100% and ingress of crop trees is felt to be minimal. Ten percent of pure pine stands will regenerate naturally to their initial natural (VDYP) yield curves. These stands will be identified randomly within the timber supply model. The DFAM group and Fort Nelson Forest District staff consider a regeneration delay of 2 years to be a conservative assumption, given the variability of the regeneration delay between 1990 and 200212. The younger existing managed stands have a lower regeneration delay to reflect current management of prompt regeneration while some of the older existing managed stands have a regeneration delay greater than 2 years.
Table 36: Existing managed stand regeneration rules
Regeneration method Species
Planting Density
Primary Analysis
Units Leading species
Regeneration delay (years)
OAF 1
OAF 2 Type % Code % Stems/ha
01 Spruce 2 15 5 Planted 100 Spruce 100 1,400 02 Spruce/pine 2 15 5 Planted 100 Spruce 100 1,400
2 15 5 Planted 90 Pine 90 1,400 06 Pine* 4 15 5 Natural 10 Pine *10% of the pure pine stands will be regenerated naturally using the unmanaged yield curves.
6.1.2.2 Current and future managed stands Current managed stands represent those areas within the TSA that have been harvested and planted after 2002. They exhibit similar regeneration rules to existing managed stands except for a change in the regeneration delay (Table 37). A regeneration delay of 1 year for current future managed stands is assumed to be reasonable given current performance, which the DFAM group and the Fort Nelson Forest District affirm to be approaching 0. These regeneration assumptions will also apply to future managed stands. Survival and ingress on future managed stands is assumed to be similar to current managed stands. Current and future managed stands will be grown with a genetic gain assumption of 3% for pine as described in Section 6.3.
12 The effective regeneration delay of 2 years between the period 1990-2002 has been confirmed through an assessment of ISIS (using a query of Disturbance_Date – Planted_Date + Plant Stock Age).

Fort Nelson DFAM TSR 3
45
Table 37: Current and future managed stand regeneration rules
Regeneration method Species
Planting Density
Primary Analysis
Units Leading species
Regeneration delay (years)
OAF 1
OAF 2 Type % Code % Stems/ha
01 Spruce 1 15 5 Planted 100 Spruce 100 1,400 02 Spruce/pine 1 15 5 Planted 100 Spruce 100 1,400
1 15 5 Planted 90 Pine 90 1,400 06 Pine* 4 15 5 Natural 10 Pine *10% of the pure pine stands will be regenerated naturally using the unmanaged yield curves.
6.26.26.26.2 Species conversionSpecies conversionSpecies conversionSpecies conversion No species conversion will be modeled in this analysis. All mixedwood stands are expected to regenerate to the same mixedwood types following harvest.
6.36.36.36.3 Gene resources Gene resources Gene resources Gene resources ———— use of select seed use of select seed use of select seed use of select seed The Forest Practices Code requires the use of best available genetic seed and vegetative material for regeneration treatments within management units in BC. Specific yield adjustments that recognize the use of select seed (orchard and superior provenance seed with a known Genetic Worth) must be described for use in the base case and sensitivity analysis. This information is typically managed by seed planning unit (SPU) for genetic worth and seedlot information. Historic use of select seed was provided by Tree Improvement Branch13 from SeedMap (Seed Use: Report 1 – Seedlings Requested by Species and Genetic Class) summary reports and illustrates that predominately Class B seedlings have been used for most regeneration in the Fort Nelson TSA. Class B seedlings have no effective genetic gain. Class B+ seed has been used in the Fort Nelson TSA since 2000 for all planted Pine types, exhibiting a genetic worth of 3% (Table 38). This information will be used to derive the appropriate genetic gain estimates for current/future managed pine stands in the Fort Nelson TSA. All other existing and future managed stands will be modelled with no genetic gains in the base case.
13 personal communication and correspondence with Ron Planden (Tree Improvement Branch)
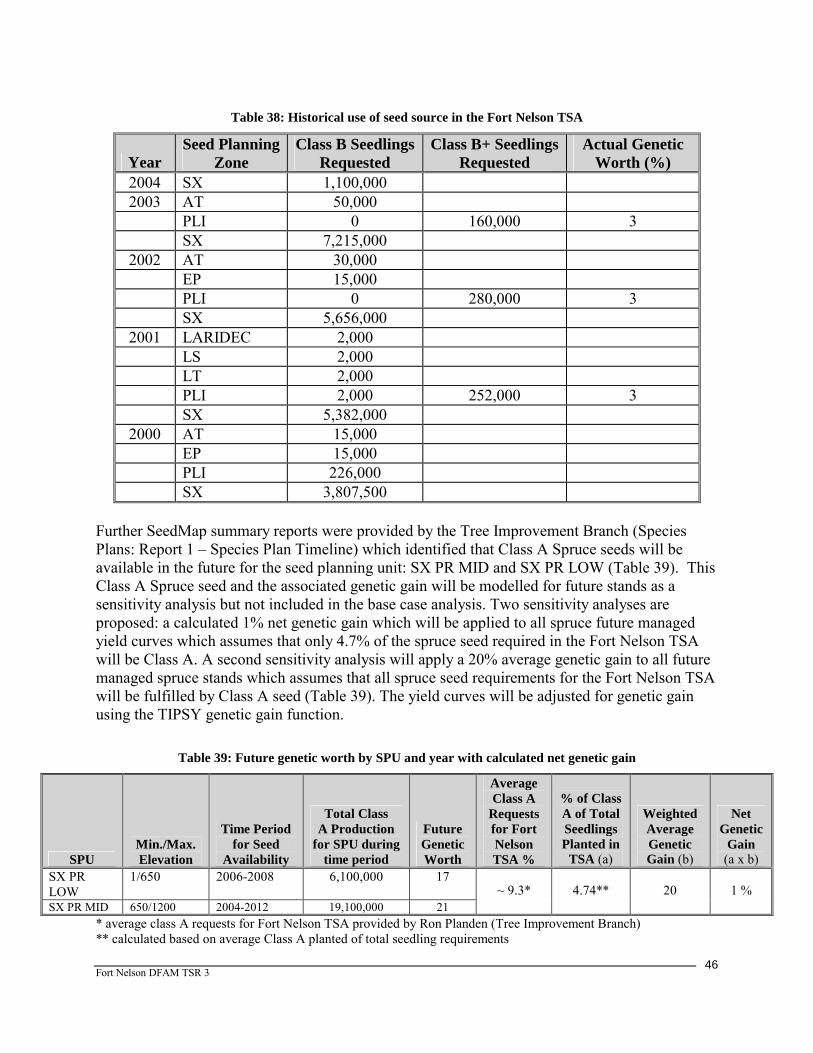
Fort Nelson DFAM TSR 3
46
Table 38: Historical use of seed source in the Fort Nelson TSA
Year Seed Planning
Zone Class B Seedlings
Requested Class B+ Seedlings
Requested Actual Genetic
Worth (%) 2004 SX 1,100,000 2003 AT 50,000
PLI 0 160,000 3 SX 7,215,000
2002 AT 30,000 EP 15,000 PLI 0 280,000 3 SX 5,656,000
2001 LARIDEC 2,000 LS 2,000 LT 2,000 PLI 2,000 252,000 3 SX 5,382,000
2000 AT 15,000 EP 15,000 PLI 226,000 SX 3,807,500
Further SeedMap summary reports were provided by the Tree Improvement Branch (Species Plans: Report 1 – Species Plan Timeline) which identified that Class A Spruce seeds will be available in the future for the seed planning unit: SX PR MID and SX PR LOW (Table 39). This Class A Spruce seed and the associated genetic gain will be modelled for future stands as a sensitivity analysis but not included in the base case analysis. Two sensitivity analyses are proposed: a calculated 1% net genetic gain which will be applied to all spruce future managed yield curves which assumes that only 4.7% of the spruce seed required in the Fort Nelson TSA will be Class A. A second sensitivity analysis will apply a 20% average genetic gain to all future managed spruce stands which assumes that all spruce seed requirements for the Fort Nelson TSA will be fulfilled by Class A seed (Table 39). The yield curves will be adjusted for genetic gain using the TIPSY genetic gain function.
Table 39: Future genetic worth by SPU and year with calculated net genetic gain
SPU Min./Max. Elevation
Time Period for Seed
Availability
Total Class A Production
for SPU during time period
Future Genetic Worth
Average Class A
Requests for Fort Nelson TSA %
% of Class A of Total Seedlings Planted in
TSA (a)
Weighted Average Genetic Gain (b)
Net Genetic
Gain (a x b)
SX PR LOW
1/650 2006-2008 6,100,000 17
SX PR MID 650/1200 2004-2012 19,100,000 21 ~ 9.3* 4.74** 20 1 %
* average class A requests for Fort Nelson TSA provided by Ron Planden (Tree Improvement Branch) ** calculated based on average Class A planted of total seedling requirements
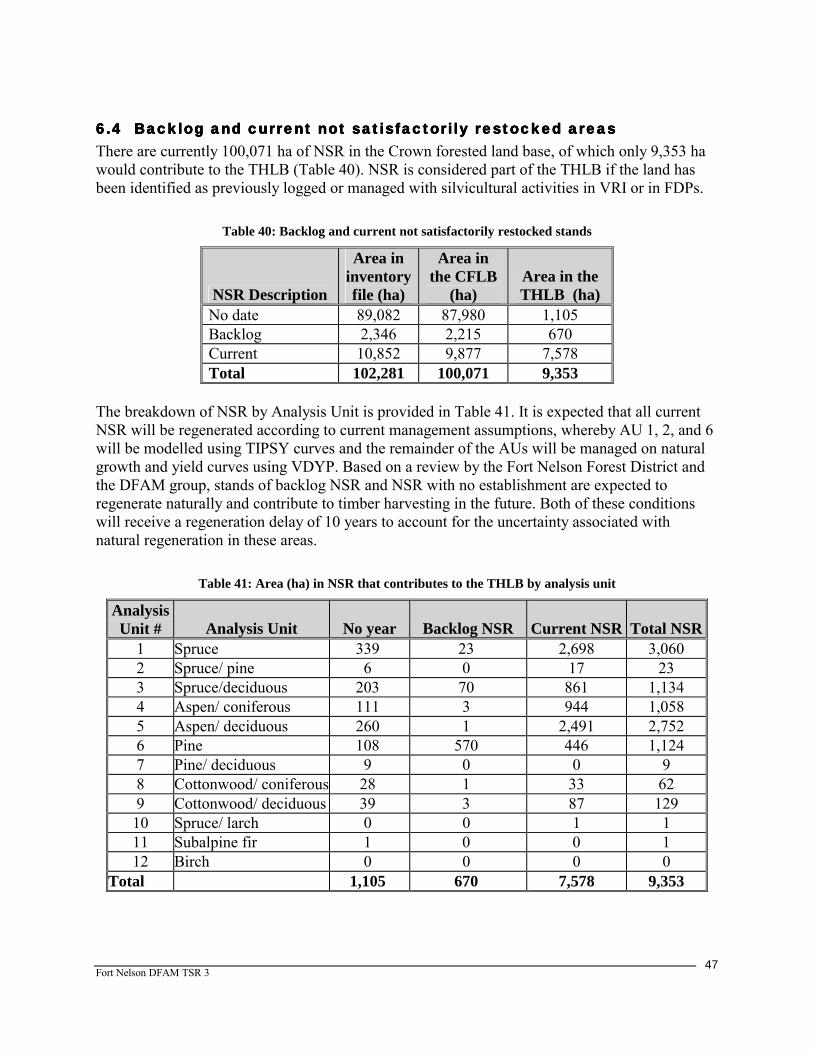
Fort Nelson DFAM TSR 3
47
6.46.46.46.4 Backlog and currenBacklog and currenBacklog and currenBacklog and current not satisfactorily restocked areast not satisfactorily restocked areast not satisfactorily restocked areast not satisfactorily restocked areas There are currently 100,071 ha of NSR in the Crown forested land base, of which only 9,353 ha would contribute to the THLB (Table 40). NSR is considered part of the THLB if the land has been identified as previously logged or managed with silvicultural activities in VRI or in FDPs.
Table 40: Backlog and current not satisfactorily restocked stands
NSR Description
Area in inventory file (ha)
Area in the CFLB
(ha) Area in the THLB (ha)
No date 89,082 87,980 1,105 Backlog 2,346 2,215 670 Current 10,852 9,877 7,578 Total 102,281 100,071 9,353
The breakdown of NSR by Analysis Unit is provided in Table 41. It is expected that all current NSR will be regenerated according to current management assumptions, whereby AU 1, 2, and 6 will be modelled using TIPSY curves and the remainder of the AUs will be managed on natural growth and yield curves using VDYP. Based on a review by the Fort Nelson Forest District and the DFAM group, stands of backlog NSR and NSR with no establishment are expected to regenerate naturally and contribute to timber harvesting in the future. Both of these conditions will receive a regeneration delay of 10 years to account for the uncertainty associated with natural regeneration in these areas.
Table 41: Area (ha) in NSR that contributes to the THLB by analysis unit
Analysis Unit # Analysis Unit No year Backlog NSR Current NSR Total NSR
1 Spruce 339 23 2,698 3,060 2 Spruce/ pine 6 0 17 23 3 Spruce/deciduous 203 70 861 1,134 4 Aspen/ coniferous 111 3 944 1,058 5 Aspen/ deciduous 260 1 2,491 2,752 6 Pine 108 570 446 1,124 7 Pine/ deciduous 9 0 0 9 8 Cottonwood/ coniferous 28 1 33 62 9 Cottonwood/ deciduous 39 3 87 129 10 Spruce/ larch 0 0 1 1 11 Subalpine fir 1 0 0 1 12 Birch 0 0 0 0
Total 1,105 670 7,578 9,353
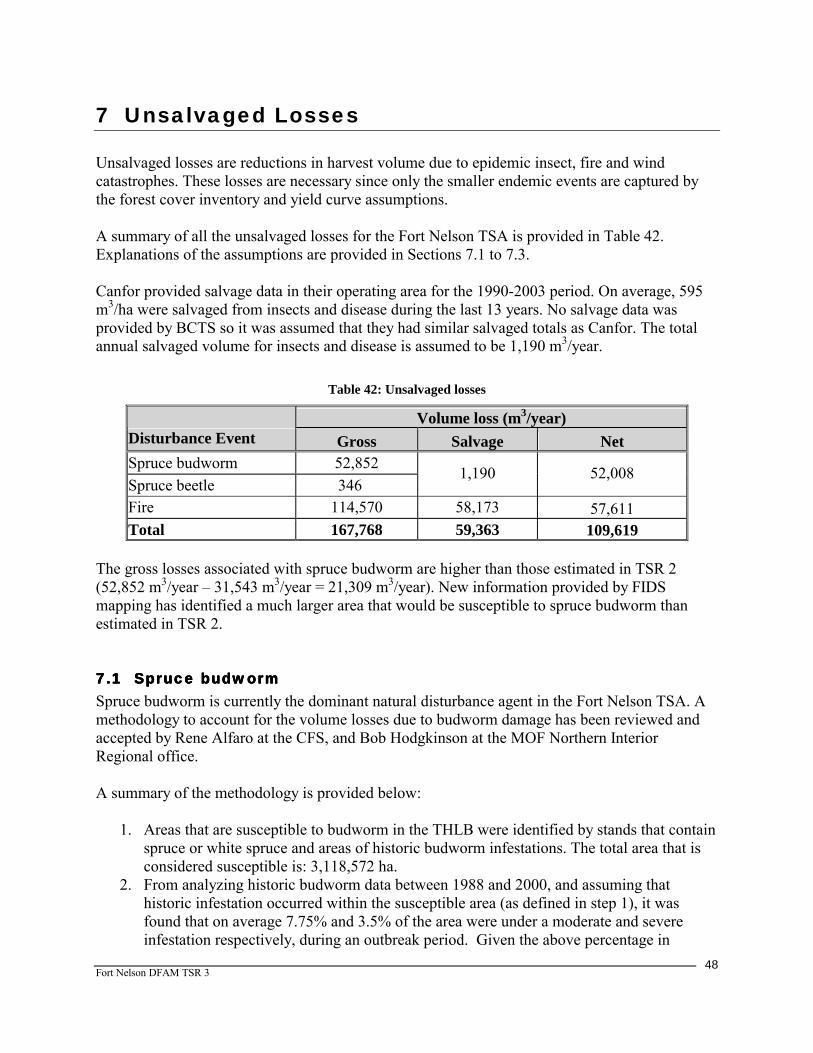
Fort Nelson DFAM TSR 3
48
7 Unsalvaged Losses Unsalvaged losses are reductions in harvest volume due to epidemic insect, fire and wind catastrophes. These losses are necessary since only the smaller endemic events are captured by the forest cover inventory and yield curve assumptions. A summary of all the unsalvaged losses for the Fort Nelson TSA is provided in Table 42. Explanations of the assumptions are provided in Sections 7.1 to 7.3. Canfor provided salvage data in their operating area for the 1990-2003 period. On average, 595 m3/ha were salvaged from insects and disease during the last 13 years. No salvage data was provided by BCTS so it was assumed that they had similar salvaged totals as Canfor. The total annual salvaged volume for insects and disease is assumed to be 1,190 m3/year.
Table 42: Unsalvaged losses
Volume loss (m3/year) Disturbance Event Gross Salvage Net Spruce budworm 52,852 Spruce beetle 346
1,190 52,008
Fire 114,570 58,173 57,611 Total 167,768 59,363 109,619
The gross losses associated with spruce budworm are higher than those estimated in TSR 2 (52,852 m3/year – 31,543 m3/year = 21,309 m3/year). New information provided by FIDS mapping has identified a much larger area that would be susceptible to spruce budworm than estimated in TSR 2.
7.17.17.17.1 SpruSpruSpruSpruce budwormce budwormce budwormce budworm Spruce budworm is currently the dominant natural disturbance agent in the Fort Nelson TSA. A methodology to account for the volume losses due to budworm damage has been reviewed and accepted by Rene Alfaro at the CFS, and Bob Hodgkinson at the MOF Northern Interior Regional office. A summary of the methodology is provided below:
1. Areas that are susceptible to budworm in the THLB were identified by stands that contain spruce or white spruce and areas of historic budworm infestations. The total area that is considered susceptible is: 3,118,572 ha.
2. From analyzing historic budworm data between 1988 and 2000, and assuming that historic infestation occurred within the susceptible area (as defined in step 1), it was found that on average 7.75% and 3.5% of the area were under a moderate and severe infestation respectively, during an outbreak period. Given the above percentage in
Fort Nelson DFAM TSR 3
49
moderate and severe infestation and the area of susceptible stands, the area of severe susceptible stands is 109,150 ha and the area of moderate susceptible stands is 241,689 ha.
3. To represent potential volume loss, the area-weighted average volume for the susceptible stands was found to be 115.77 m3/ha.
4. It was assumed that the duration of attack is 13 years. It was also assumed that stand mortality was 16% for moderate and 32% for severe stands14.
5. Annual unsalvaged mortality during an outbreak = area susceptible to budworm (ha) * stand volume loss/ha ÷ duration of attack (years) * stand mortality. Annual unsalvaged mortality (severe) during an outbreak = 311,047 m3/year Annual unsalvaged mortality (moderate) during an outbreak = 344,373 m3/year Total for the entire TSA during an outbreak15: 655,420 m3/year
6. Assume outbreak duration is 13 years and 37 years between outbreaks16. Assume there
are no losses between outbreaks. Therefore, the “period of analysis”, or the time between which an outbreak begins and ends and the second outbreak is about to begin, is about 50 years. Therefore, to quantify the annual unsalvaged losses due to spruce budworm during our “period of analysis” (i.e. when there are outbreaks and when there are no outbreaks): Annual unsalvaged mortality during the period of analysis = (Annual loss for the TSA during outbreaks * the duration of attack)/ period of analysis. Annual unsalvaged mortality during the period of analysis = (655,420 m3/year *13 years)/ 50 years = 170,409 m3/year.
7. Determine unsalvaged volume that is associated with the THLB. Of the 3,118,572 ha of susceptible stands, 980,691 ha (31%) are within the THLB. Therefore, the unsalvaged volume loss within the THLB is 52,852 m3/year (170,490 m3/year*.31).
7.27.27.27.2 Spruce beetleSpruce beetleSpruce beetleSpruce beetle Spruce beetles are known to target and attack large diameter, mature spruce (Engelmann, white, Sitka and, sometimes black spruce) when populations reach epidemic levels.17 Since no new data was available for spruce beetle losses in the Fort Nelson TSA, a methodology similar to that of TSR 2 was used. 14 Assumption provided by Rene Alfaro, Research Scientist, Canadian Forest Service. 15 This represents total mortality loss (i.e. tree is dead) and not growth losses. 16 Assumption provided by Rene Alfaro, Research Scientist, Canadian Forest Service. 17 Source: Field Guide to Forest Damage in British Columbia

Fort Nelson DFAM TSR 3
50
The volume losses from spruce beetle are estimated to be 95 205 m3 over the attack cycle from 1947 to 1994, resulting in an annual loss of 2,026 m3/year (95 205 m3/47 years) 18. The calculated unsalvaged loss for spruce beetle on the timber harvesting land base would equal 346 m3/year [2 026 m3/year * (463,460 ha/2,715,448 ha)].
7.37.37.37.3 FireFireFireFire A similar assumption to TSR 2 will be used to account for unsalvaged losses due to fire. No new fire data was assembled; therefore the methodology applied in TSR 2 was felt to be the best available information. Unsalvaged losses due to extreme fire events on the timber harvesting land base are calculated as follows:
Total annual losses * (timber harvesting land base/total forested land base)
Annual losses on timber harvesting land base from fire = 451 000 m3/year * (1,432,257 ha /5,638,018 ha) = 114,570 m3/year. The majority of the unsalvaged loss (95%) would be attributed to coniferous stands and the remainder from deciduous (5%).19 Since current salvage numbers for the TSA were not available for the entire TSA it is assumed that, similar to TSR 2, approximately 58,173 m3 were salvaged annually from fires. Salvage from fires varies annually in the Fort Nelson TSA and historically there have been two significant salvage programs dominated by two large fires in 1985 and 1996. Similar to TSR 2, the total volume salvaged (698,077 m3) for these events are averaged over the 12-year period equaling 58,173 m3/year.
18 Forest Susceptibility to Spruce Budworm Defoliation in the Forest Nelson Area of British Columbia, J.S. Clowater. 19 Based on Fire Unsalvaged Losses from Fort Nelson Timber Supply Area - Analysis Report (MOF), March 2000
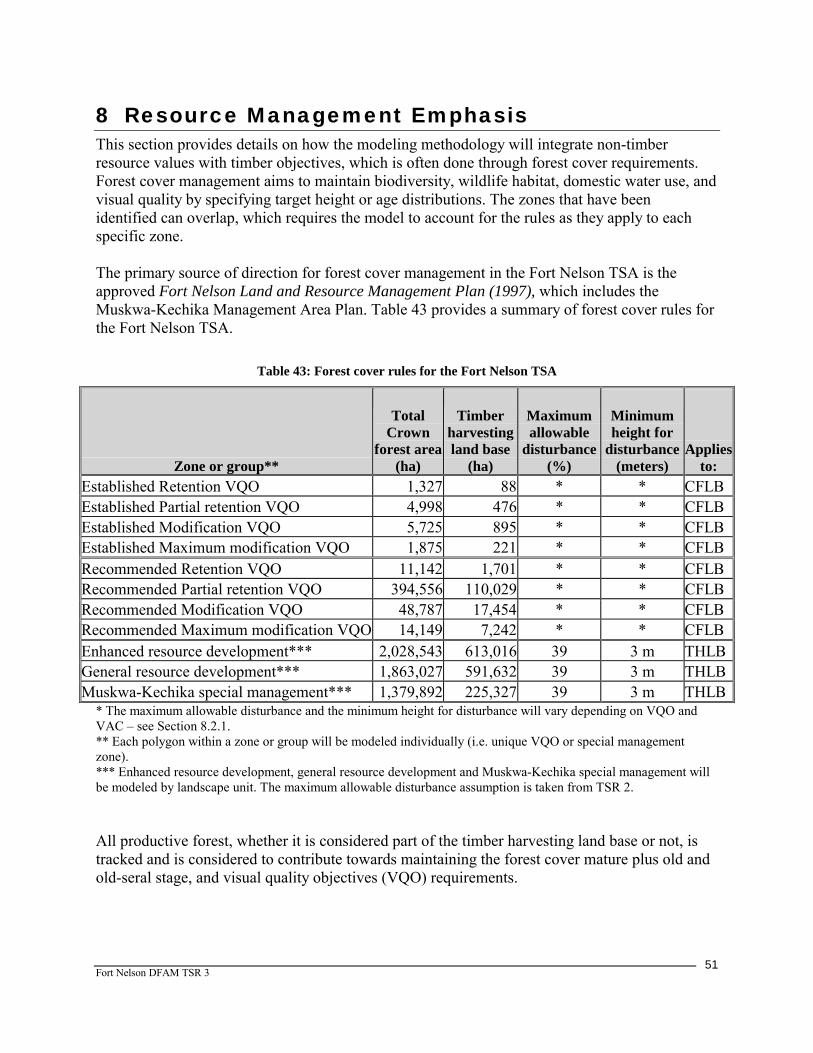
Fort Nelson DFAM TSR 3
51
8 Resource Management Emphasis This section provides details on how the modeling methodology will integrate non-timber resource values with timber objectives, which is often done through forest cover requirements. Forest cover management aims to maintain biodiversity, wildlife habitat, domestic water use, and visual quality by specifying target height or age distributions. The zones that have been identified can overlap, which requires the model to account for the rules as they apply to each specific zone. The primary source of direction for forest cover management in the Fort Nelson TSA is the approved Fort Nelson Land and Resource Management Plan (1997), which includes the Muskwa-Kechika Management Area Plan. Table 43 provides a summary of forest cover rules for the Fort Nelson TSA.
Table 43: Forest cover rules for the Fort Nelson TSA
Zone or group**
Total Crown
forest area (ha)
Timber harvesting land base
(ha)
Maximum allowable
disturbance (%)
Minimum height for
disturbance (meters)
Applies to:
Established Retention VQO 1,327 88 * * CFLB Established Partial retention VQO 4,998 476 * * CFLB Established Modification VQO 5,725 895 * * CFLB Established Maximum modification VQO 1,875 221 * * CFLB Recommended Retention VQO 11,142 1,701 * * CFLB Recommended Partial retention VQO 394,556 110,029 * * CFLB Recommended Modification VQO 48,787 17,454 * * CFLB Recommended Maximum modification VQO 14,149 7,242 * * CFLB Enhanced resource development*** 2,028,543 613,016 39 3 m THLBGeneral resource development*** 1,863,027 591,632 39 3 m THLBMuskwa-Kechika special management*** 1,379,892 225,327 39 3 m THLB
* The maximum allowable disturbance and the minimum height for disturbance will vary depending on VQO and VAC – see Section 8.2.1. ** Each polygon within a zone or group will be modeled individually (i.e. unique VQO or special management zone). *** Enhanced resource development, general resource development and Muskwa-Kechika special management will be modeled by landscape unit. The maximum allowable disturbance assumption is taken from TSR 2. All productive forest, whether it is considered part of the timber harvesting land base or not, is tracked and is considered to contribute towards maintaining the forest cover mature plus old and old-seral stage, and visual quality objectives (VQO) requirements.
Fort Nelson DFAM TSR 3
52
Only the productive forest within the timber harvesting land base is tracked and is considered to contribute towards maintaining the forest cover adjacency requirements within the enhanced, general and special management zones.
8.1 Adjacency cutblock green-up The forest cover rules for enhanced, general resource development and special management provided in Table 43 approximate the operational block adjacency rules for the Fort Nelson TSA. Operationally, adjacency requires a logged block to reach a certain height target (green-up) before a neighbouring area can be harvested. Based on direction provided in the Landscape Unit Planning Guide 1999 and by the Fort Nelson Forest District, licensees are able to alter adjacency rules to achieve target patch sizes. It is understood that this is current management in the Fort Nelson TSA. No specific patch size targets will be modelled in the base case and adjacency green-up will be modelled using forest cover rules for each management zone (Table 43).
8.2 Visual resources The broad Visual Landscape Inventory was made known in 1997, which identifies the visual sensitivity ratings and the recommended visual quality classes (RVQCs) for all visually sensitive conditions. A partial update of this broad mapping was completed in 2002 to reflect the Cassiar addition to the district land base. Also released in 1997 were detailed visual landscape inventories for the Alaska Highway and Klua Lakes20, for which visual quality objectives (VQOs) were established. The visual quality modelling for the Fort Nelson TSA will follow closely the recommendations outlined in Procedures for Factoring Visual Resources into Timber Supply Analyses (the Procedures). Polygons with established VQOs also contain a visual absorption capacity (VAC) rating in the visual landscape inventory. There are an additional 662,017 ha of areas with recommended visual quality classes (RVQCs). According to the established VQOs and VAC, the forest cover requirement based on percent denudation and visually effective green-up will be determined separately for each visual quality polygon.
8.2.1 Established Visual Quality Objectives To achieve the VQOs, a percent denudation is usually modelled. Percent denudation is the permissible alteration in plan view, and it refers to the proportion of a visual polygon that can be less than the visually effective green-up (VEG) height. The VEG height will be determined for each VQO polygon based on slope (Table 6 in the Procedures). A range of percent denudation is provided for each VQO category based on the Procedures: the percent to be applied in the Fort Nelson TSA will be modified by the visual absorption capability (VAC21), whereby the low, medium and high VAC will correspond to the mid-point of the lower third, middle, and upper
20 The Klua watershed has been established as a protected area after it was designated as an established VQO area. Therefore, this area is removed from the THLB and no undue impact is created by the VQOs per se. 21 Visual absorption capability is a component of the visual landscape inventory that rates the relative capacity of a landscape to absorb visual alterations and still maintain its visual integrity. The VAC is based on an estimate of physical characteristics, including slope, vegetation-pattern diversity, soil/vegetation color contrast and aspect.
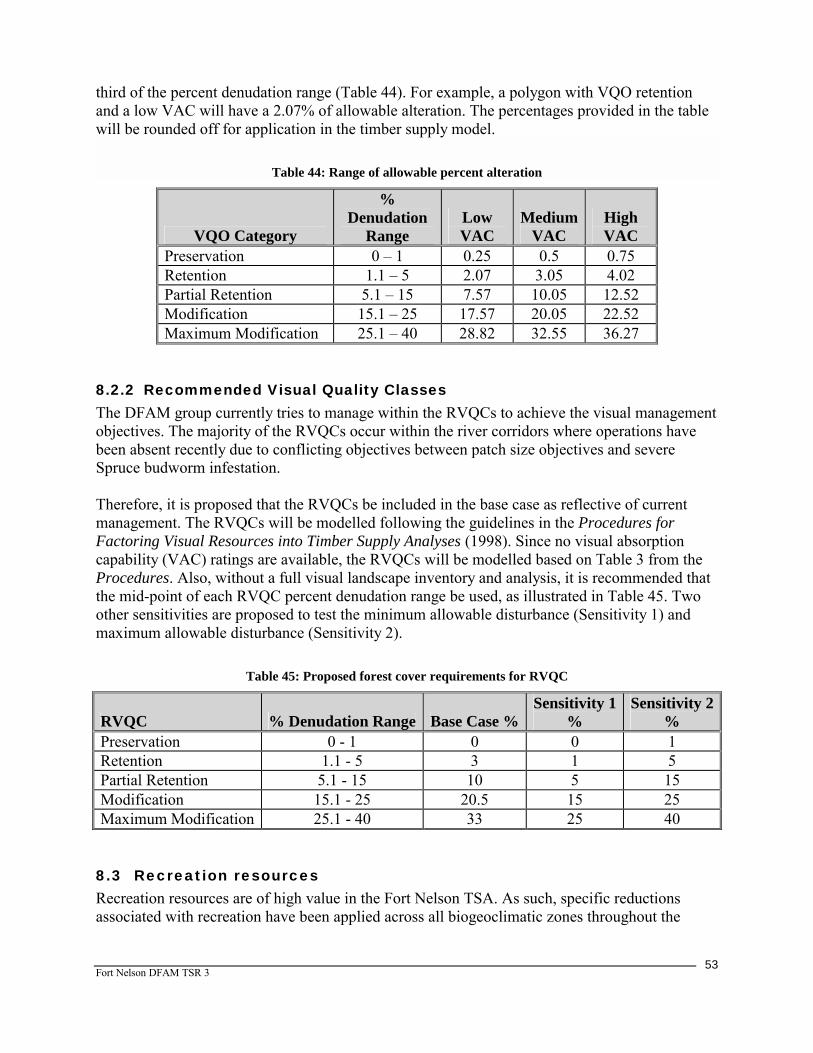
Fort Nelson DFAM TSR 3
53
third of the percent denudation range (Table 44). For example, a polygon with VQO retention and a low VAC will have a 2.07% of allowable alteration. The percentages provided in the table will be rounded off for application in the timber supply model.
Table 44: Range of allowable percent alteration
VQO Category
% Denudation
Range Low VAC
Medium VAC
High VAC
Preservation 0 – 1 0.25 0.5 0.75 Retention 1.1 – 5 2.07 3.05 4.02 Partial Retention 5.1 – 15 7.57 10.05 12.52 Modification 15.1 – 25 17.57 20.05 22.52 Maximum Modification 25.1 – 40 28.82 32.55 36.27
8.2.2 Recommended Visual Quality Classes The DFAM group currently tries to manage within the RVQCs to achieve the visual management objectives. The majority of the RVQCs occur within the river corridors where operations have been absent recently due to conflicting objectives between patch size objectives and severe Spruce budworm infestation. Therefore, it is proposed that the RVQCs be included in the base case as reflective of current management. The RVQCs will be modelled following the guidelines in the Procedures for Factoring Visual Resources into Timber Supply Analyses (1998). Since no visual absorption capability (VAC) ratings are available, the RVQCs will be modelled based on Table 3 from the Procedures. Also, without a full visual landscape inventory and analysis, it is recommended that the mid-point of each RVQC percent denudation range be used, as illustrated in Table 45. Two other sensitivities are proposed to test the minimum allowable disturbance (Sensitivity 1) and maximum allowable disturbance (Sensitivity 2).
Table 45: Proposed forest cover requirements for RVQC
RVQC % Denudation Range Base Case %Sensitivity 1
% Sensitivity 2
% Preservation 0 - 1 0 0 1 Retention 1.1 - 5 3 1 5 Partial Retention 5.1 - 15 10 5 15 Modification 15.1 - 25 20.5 15 25 Maximum Modification 25.1 - 40 33 25 40
8.3 Recreation resources Recreation resources are of high value in the Fort Nelson TSA. As such, specific reductions associated with recreation have been applied across all biogeoclimatic zones throughout the

Fort Nelson DFAM TSR 3
54
management unit. Refer to Section 3.4.6 for these “Environmentally Sensitive Areas” that have been accounted for in the netdown.
8.48.48.48.4 WildlifeWildlifeWildlifeWildlife
8.4.1 Wildlife habitat — identified wildlife
There is significant wildlife presence within the Fort Nelson TSA, as well as numerous species that are threatened or are of concern. It is understood that those red and blue listed species (Table 46) are affected by forest and range practices and may require detailed habitat management prescriptions to sustain regional populations.22
Table 46: Table of Red and Blue listed species in the Fort Nelson TSA.
Endangered or Threatened (Red-listed) Vulnerable (Blue-listed) Scientific Name Common Name Scientific Name Common Name
Martes pennanti Fisher Botaurus lentiginosus American Bittern Ammodramus nelsoni Nelson's Sharp-tailed
Sparrow Grus canadensis Sandhill Crane
Bison bison athabascae Wood Bison Salvelinus confluentus Bull Trout Coregonus artedi Cisco Ursus arctos Grizzly Bear Coregonus autumnalis Arctic Cisco Asio flammeus Short-eared Owl Dendroica castanea Bay-breasted Warbler Dendroica virens Black-throated Green
Warbler Dendroica tigrina Cape May Warbler Gulo gulo luscus Wolverine, luscus
subspecies Notropis atherinoides Emerald Shiner Hiodon alosoides Goldeye Notropis hudsonius Spottail Shiner Melanitta perspicillata Surf Scoter Oporornis agilis Connecticut Warbler Myotis septentrionalis Northern Long-eared
Myotis Pungitius pungitius Ninespine Stickleback Rangifer tarandus pop. 14 Caribou (boreal
population) Rangifer tarandus pop. 15 Caribou (northern
mountain population) Salvelinus malma Dolly Varden Stenodus leucichthys Inconnu Vireo philadelphicus Philadelphia Vireo Wilsonia canadensis Canada Warbler
It is also understood that currently MWLAP is producing a list of Regionally Important Wildlife for the Peace Region which will include: arctic grayling, lake trout, walleye, mountain goat, Stone's sheep, trumpeter swan, northern goshawk, and the American bittern. The MWLAP feels
22 Information provide by email communication Joelle Scheck, RP Bio, Ecosystem Biologist with the Ministry of Water, Land and Air Protection
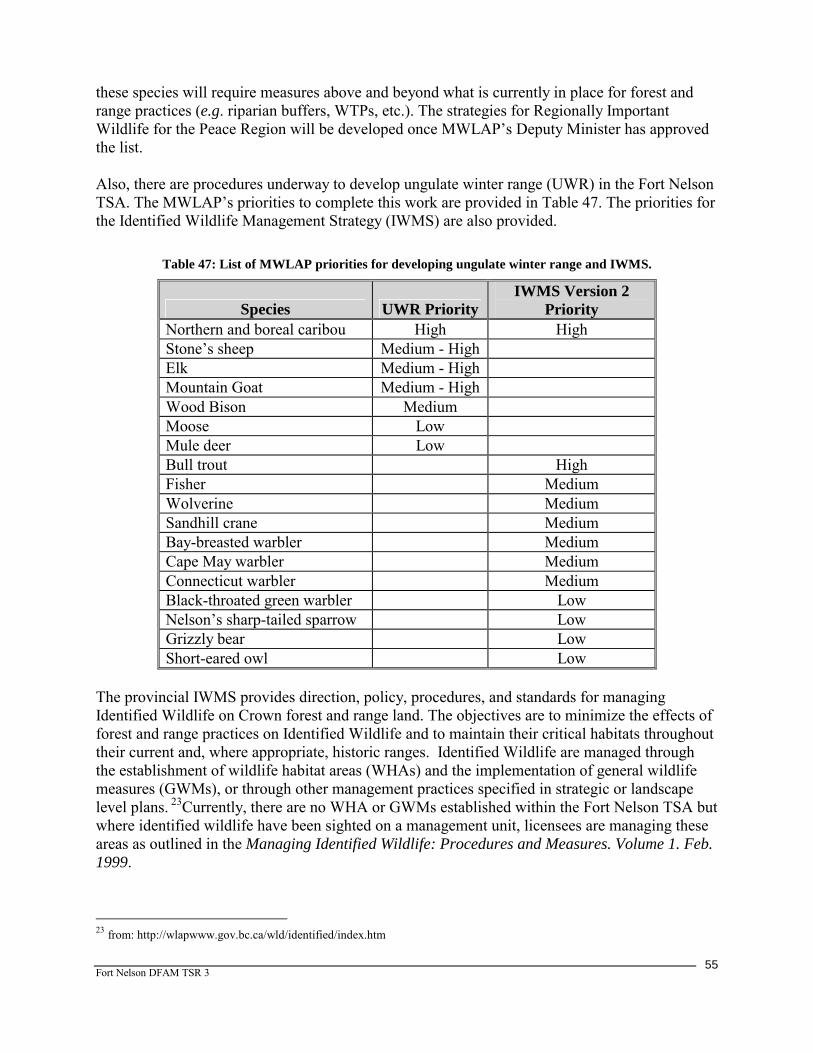
Fort Nelson DFAM TSR 3
55
these species will require measures above and beyond what is currently in place for forest and range practices (e.g. riparian buffers, WTPs, etc.). The strategies for Regionally Important Wildlife for the Peace Region will be developed once MWLAP’s Deputy Minister has approved the list. Also, there are procedures underway to develop ungulate winter range (UWR) in the Fort Nelson TSA. The MWLAP’s priorities to complete this work are provided in Table 47. The priorities for the Identified Wildlife Management Strategy (IWMS) are also provided.
Table 47: List of MWLAP priorities for developing ungulate winter range and IWMS.
Species UWR Priority IWMS Version 2
Priority Northern and boreal caribou High High Stone’s sheep Medium - High Elk Medium - High Mountain Goat Medium - High Wood Bison Medium Moose Low Mule deer Low Bull trout High Fisher Medium Wolverine Medium Sandhill crane Medium Bay-breasted warbler Medium Cape May warbler Medium Connecticut warbler Medium Black-throated green warbler Low Nelson’s sharp-tailed sparrow Low Grizzly bear Low Short-eared owl Low
The provincial IWMS provides direction, policy, procedures, and standards for managing Identified Wildlife on Crown forest and range land. The objectives are to minimize the effects of forest and range practices on Identified Wildlife and to maintain their critical habitats throughout their current and, where appropriate, historic ranges. Identified Wildlife are managed through the establishment of wildlife habitat areas (WHAs) and the implementation of general wildlife measures (GWMs), or through other management practices specified in strategic or landscape level plans. 23Currently, there are no WHA or GWMs established within the Fort Nelson TSA but where identified wildlife have been sighted on a management unit, licensees are managing these areas as outlined in the Managing Identified Wildlife: Procedures and Measures. Volume 1. Feb. 1999.
23 from: http://wlapwww.gov.bc.ca/wld/identified/index.htm

Fort Nelson DFAM TSR 3
56
8.4.2 Caribou winter habitat The caribou populations found within the Fort Nelson TSA are currently federally listed as Vulnerable or Not at Risk24. Caribou winter habitat area in the western portion of the Fort Nelson TSA (Cassiar addition) has been identified but currently there are no developed management plans or strategies: they will be developed after plans are complete for Endangered and Threatened population elsewhere in the province. There are also recovery strategies being developed for specific boreal caribou populations in the central/eastern portion of the district, which are not expected to cause an impact on future timber supply25. Since forest management practices for caribou winter habitat have not been formally established in the TSA, no net reductions to the THLB or forest cover requirements are necessary.
8.5 Biodiversity
8.5.1 Landscape-level biodiversity
8.5.1.1 Policy framework The Landscape Unit Planning Guide provides direction regarding the establishment of old seral cover and wildlife tree retention as the current priorities for landscape and stand level biodiversity management in BC. Objectives for coarse woody debris and patch size distribution will not be modeled in the base case.
8.5.1.2 Landscape units The Fort Nelson TSA contains 85 landscape units (LU) that have been established by the Chief Forester but the biodiversity emphasis options remain draft. Of the 85 LUs, there are 4 high, 45 intermediate and 36 low emphasis units. Current management is to follow the biodiversity emphasis options within the TSA.
8.5.1.3 Biodiversity emphasis options and forest cover requirements Mature and old and old forest seral rules will be applied in the base case following the specific BEO that applies to each landscape unit (Appendix 3). The recommended seral stage distribution for each BEC unit/NDT (% of forest area within the landscape unit) is shown in Table 48.
24 Information provided by email communication Joelle Scheck, RP Bio, Ecosystem Biologist with the Ministry of Water, Land and Air Protection. 25 Telephone correspondence with Rod Backmeyer, Wildlife Biologist, Fisth and Wildlife Science And Allocation Section, in the Ministry of Water, Land and Air Protection. March 2, 2004.
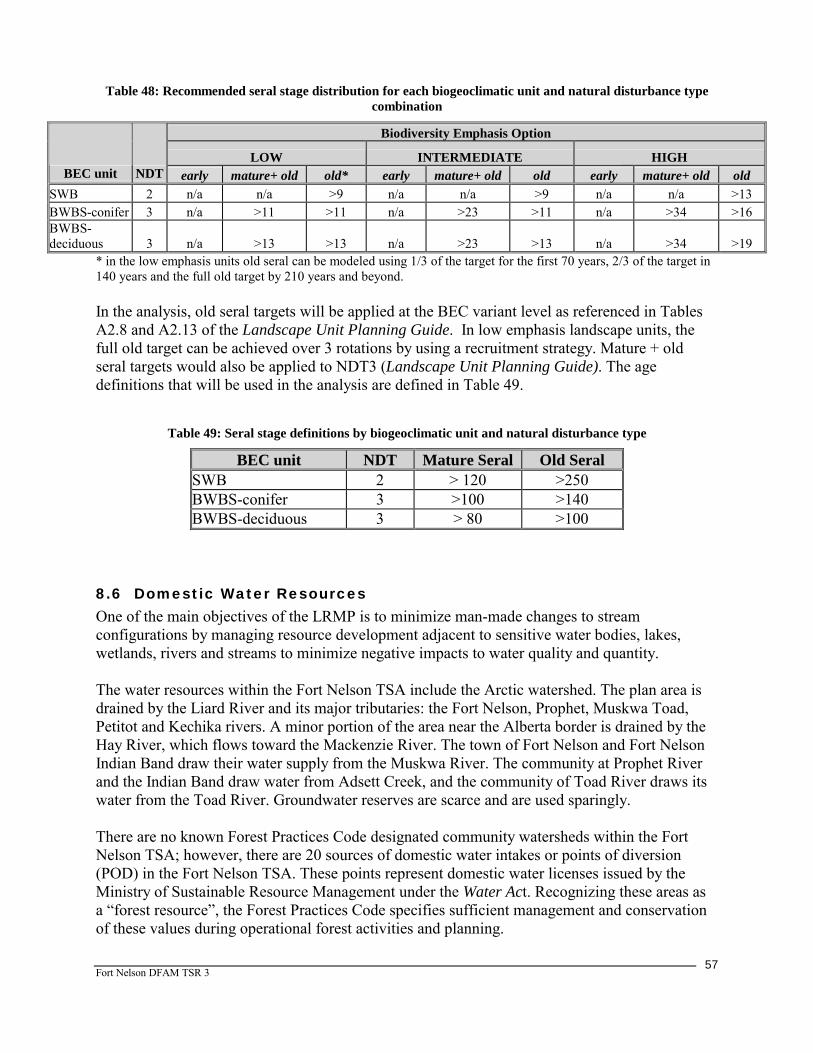
Fort Nelson DFAM TSR 3
57
Table 48: Recommended seral stage distribution for each biogeoclimatic unit and natural disturbance type combination
Biodiversity Emphasis Option
LOW INTERMEDIATE HIGH BEC unit NDT early mature+ old old* early mature+ old old early mature+ old old
SWB 2 n/a n/a >9 n/a n/a >9 n/a n/a >13 BWBS-conifer 3 n/a >11 >11 n/a >23 >11 n/a >34 >16 BWBS-deciduous 3 n/a >13 >13 n/a >23 >13 n/a >34 >19
* in the low emphasis units old seral can be modeled using 1/3 of the target for the first 70 years, 2/3 of the target in 140 years and the full old target by 210 years and beyond. In the analysis, old seral targets will be applied at the BEC variant level as referenced in Tables A2.8 and A2.13 of the Landscape Unit Planning Guide. In low emphasis landscape units, the full old target can be achieved over 3 rotations by using a recruitment strategy. Mature + old seral targets would also be applied to NDT3 (Landscape Unit Planning Guide). The age definitions that will be used in the analysis are defined in Table 49.
Table 49: Seral stage definitions by biogeoclimatic unit and natural disturbance type
BEC unit NDT Mature Seral Old Seral SWB 2 > 120 >250 BWBS-conifer 3 >100 >140 BWBS-deciduous 3 > 80 >100
8.6 Domestic Water Resources One of the main objectives of the LRMP is to minimize man-made changes to stream configurations by managing resource development adjacent to sensitive water bodies, lakes, wetlands, rivers and streams to minimize negative impacts to water quality and quantity. The water resources within the Fort Nelson TSA include the Arctic watershed. The plan area is drained by the Liard River and its major tributaries: the Fort Nelson, Prophet, Muskwa Toad, Petitot and Kechika rivers. A minor portion of the area near the Alberta border is drained by the Hay River, which flows toward the Mackenzie River. The town of Fort Nelson and Fort Nelson Indian Band draw their water supply from the Muskwa River. The community at Prophet River and the Indian Band draw water from Adsett Creek, and the community of Toad River draws its water from the Toad River. Groundwater reserves are scarce and are used sparingly. There are no known Forest Practices Code designated community watersheds within the Fort Nelson TSA; however, there are 20 sources of domestic water intakes or points of diversion (POD) in the Fort Nelson TSA. These points represent domestic water licenses issued by the Ministry of Sustainable Resource Management under the Water Act. Recognizing these areas as a “forest resource”, the Forest Practices Code specifies sufficient management and conservation of these values during operational forest activities and planning.
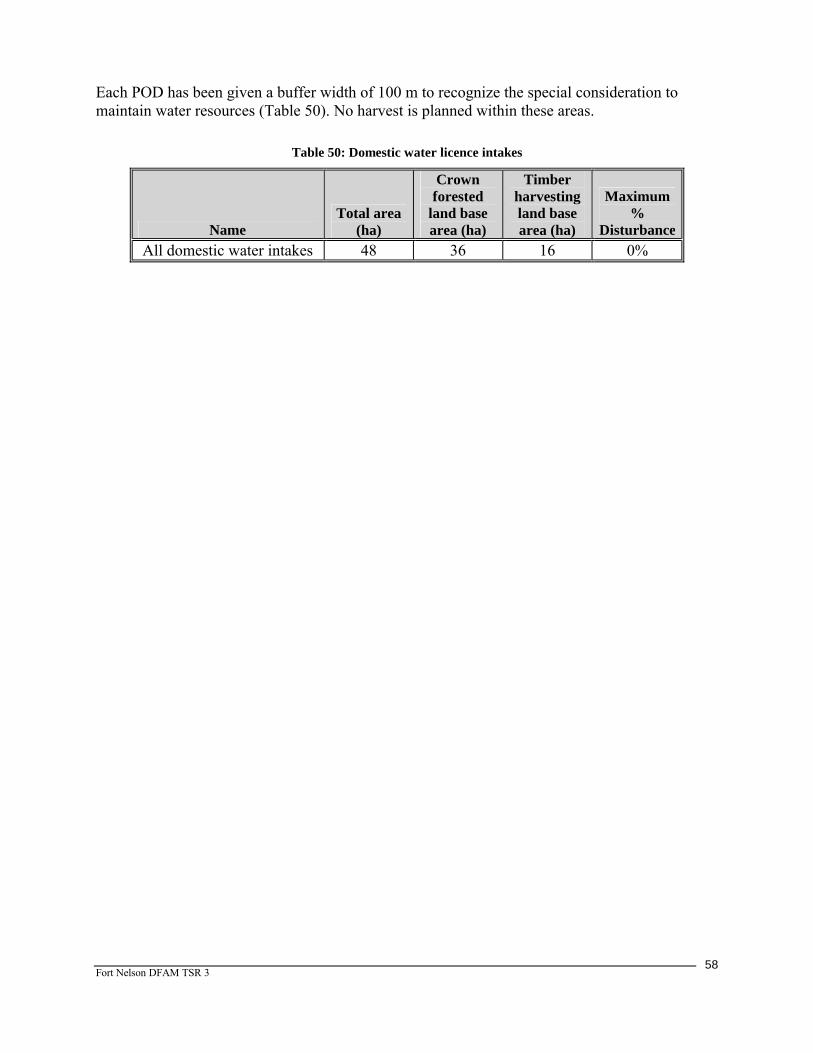
Fort Nelson DFAM TSR 3
58
Each POD has been given a buffer width of 100 m to recognize the special consideration to maintain water resources (Table 50). No harvest is planned within these areas.
Table 50: Domestic water licence intakes
Name Total area
(ha)
Crown forested
land base area (ha)
Timber harvesting land base area (ha)
Maximum %
DisturbanceAll domestic water intakes 48 36 16 0%
Fort Nelson DFAM TSR 3
59
9 Timber harvesting
9.19.19.19.1 Minimum harvestable ageMinimum harvestable ageMinimum harvestable ageMinimum harvestable age The minimum harvestable age (MHA) is an estimate of when immature or future managed stands will become available for harvest. It is not expected that all stands will be harvested at this age but harvesting may occur at the MHA to meet a harvest target for a relatively short period of time or to avoid large and abrupt changes in harvest levels. Within some areas, stands may not be harvested until they are much older than the minimum harvestable age due to extended rotations for forest cover requirements such as landscape biodiversity old forest objectives. Based on discussions with the DFAM group, the minimum harvest criterion for the Fort Nelson TSA is 140 m3/ha for natural stands. The resulting minimum harvest age will be compared with the age at which 95% of the maximum MAI is realized which will be tested in a sensitivity analysis. The minimum harvestable age was determined for each analysis unit/yield curve groups and is provided in Appendix 4. Polygons within the analysis unit/yield curve groups will be considered eligible for harvest within the timber supply model when they achieve the minimum criteria described above.
9.29.29.29.2 Harvest systemsHarvest systemsHarvest systemsHarvest systems Harvesting in the Fort Nelson TSA is dominated by conventional ground-based systems. There is some operable cable and helicopter ground around the Muskwa-Kechika special management area, but these systems are not being used at this time.
9.39.39.39.3 Initial harvest rateInitial harvest rateInitial harvest rateInitial harvest rate The initial harvest rate for the base case analysis will be set to 1,389,880 m3/year (the current AAC of 1,500,000 m3/year plus the calculated unsalvaged losses minus 500m3/year for woodlot W1817). There may be a need to increase or decrease the harvest level from this starting point but this will not be determined until the base case analysis is initiated. If such a change is required it will be discussed with the DFAM group and Forest Analysis Branch.
9.49.49.49.4 Harvest rulesHarvest rulesHarvest rulesHarvest rules Harvest rules define current management for the analyst to use in the forest level model. This will be accomplished by following the spatial forest development plan. By including the FDP, the approved and proposed blocks can be established as a fixed harvest schedule for the initial period. Following the FDP, priority harvest can be dictated by an established harvest rule. Relative oldest first will be used, as this rule best represents harvest priority within the TSA. It is also proposed that different harvest rules will be tested to determine the effect on the harvest level.
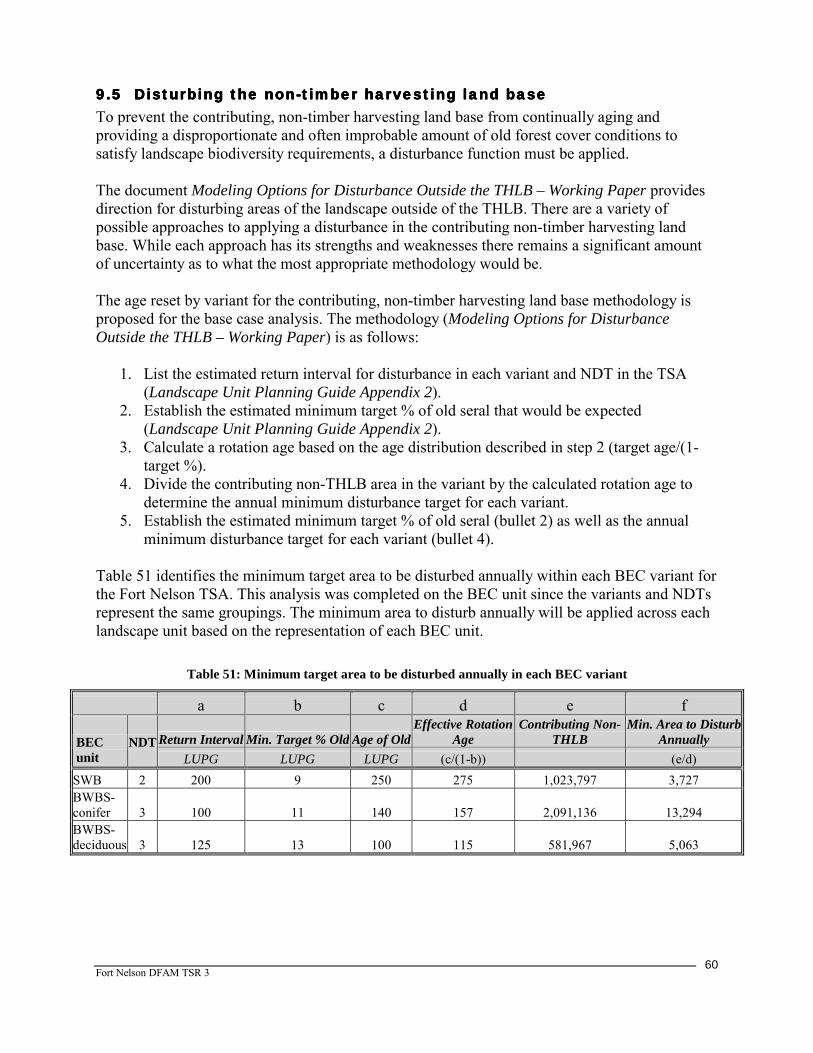
Fort Nelson DFAM TSR 3
60
9.59.59.59.5 Disturbing the nonDisturbing the nonDisturbing the nonDisturbing the non----timber harvesting land basetimber harvesting land basetimber harvesting land basetimber harvesting land base To prevent the contributing, non-timber harvesting land base from continually aging and providing a disproportionate and often improbable amount of old forest cover conditions to satisfy landscape biodiversity requirements, a disturbance function must be applied. The document Modeling Options for Disturbance Outside the THLB – Working Paper provides direction for disturbing areas of the landscape outside of the THLB. There are a variety of possible approaches to applying a disturbance in the contributing non-timber harvesting land base. While each approach has its strengths and weaknesses there remains a significant amount of uncertainty as to what the most appropriate methodology would be. The age reset by variant for the contributing, non-timber harvesting land base methodology is proposed for the base case analysis. The methodology (Modeling Options for Disturbance Outside the THLB – Working Paper) is as follows:
1. List the estimated return interval for disturbance in each variant and NDT in the TSA (Landscape Unit Planning Guide Appendix 2).
2. Establish the estimated minimum target % of old seral that would be expected (Landscape Unit Planning Guide Appendix 2).
3. Calculate a rotation age based on the age distribution described in step 2 (target age/(1-target %).
4. Divide the contributing non-THLB area in the variant by the calculated rotation age to determine the annual minimum disturbance target for each variant.
5. Establish the estimated minimum target % of old seral (bullet 2) as well as the annual minimum disturbance target for each variant (bullet 4).
Table 51 identifies the minimum target area to be disturbed annually within each BEC variant for the Fort Nelson TSA. This analysis was completed on the BEC unit since the variants and NDTs represent the same groupings. The minimum area to disturb annually will be applied across each landscape unit based on the representation of each BEC unit.
Table 51: Minimum target area to be disturbed annually in each BEC variant
a b c d e f
Return Interval Min. Target % Old Age of OldEffective Rotation
Age Contributing Non-
THLB Min. Area to Disturb
Annually BEC unit
NDT LUPG LUPG LUPG (c/(1-b)) (e/d)
SWB 2 200 9 250 275 1,023,797 3,727 BWBS-conifer 3 100 11 140 157 2,091,136 13,294 BWBS-deciduous 3 125 13 100 115 581,967 5,063
Fort Nelson DFAM TSR 3
61
9.69.69.69.6 Timber supply modelTimber supply modelTimber supply modelTimber supply model The model that will be used for this analysis will be:
Model Name: FSOS Model Developer: Dr. Guoliang Liu Model Development: UBC, Hugh Hamilton Limited, Forest Ecosystem Solutions Ltd. Model Type: Forest and Landscape, Spatial/Non-spatial, Simulation and Optimization Model
FSOS has been used on over 24 management units (TFLs and TSAs) from small (<15,000 ha) to very large (> 4 million ha) forest areas throughout BC, Alberta, Manitoba and Ontario. Some of the management units that FSOS have been applied include: TFL 3, TFL 18, TFL 26, TFL 37, TFL 53, Soo TSA, Sunshine Coast TSA, Queen Charlotte TSA, Kingcome TSA and Kalum TSA. FSOS has been accepted for use in timber supply analysis by the chief forester in British Columbia and is currently being applied to 3 management units in Ontario. .
Fort Nelson DFAM TSR 3
62
10 Timber Supply Forecast /Options /Sensitivity Analyses
10.110.110.110.1 Harvest flow objectives for the base case Harvest flow objectives for the base case Harvest flow objectives for the base case Harvest flow objectives for the base case The base case is the reference timber supply forecast by which timber supply implications of different management assumptions and uncertainty in data and assumptions may be measured. The base case should represent current management or a reasonable extrapolation of current management. The harvest flow objectives for the base case and other sensitivity scenarios will follow standard provincial polices which are outlined in Harvest flow Considerations for Timber Supply Draft Working Paper, 2003. In general the harvest flow objectives are:
• Sustain the current harvest level until reductions are necessary for long-term sustainability;
• Control the mid-term harvest level so that it does not drop below the sustainable long-term harvest.
• Where decreases in the harvest rate are necessary, volume harvested will decrease by no more than 10% per ten-year period; and
• Maintain even flow in the long term while ensuring a non-declining growing stock.
10.2 Sensitivity analyses Sensitivity analysis provides a measure of the timber supply impact if uncertainty in management assumptions and/or data integrity exists. The magnitude of the increase or decrease in a particular variable should reflect the degree of uncertainty surrounding the assumption. By developing and testing a number of sensitivity analyses, it is possible to determine which variables most affect results. Sensitivity analysis specific to the Fort Nelson TSA: � Inclusion of birch leading stands (SI >17), � Landscape level biodiversity (model NDU and appropriate seral constraints), � Remove requirement for a reasonable harvest flow from both the coniferous and
deciduous stands (i.e. allow fluctuations in the amount of coniferous or deciduous volume removed in any decade),
� Remove VRI Phase 2 adjustments, � A 1% net genetic gain to all spruce future managed yield curves and a 20% average
genetic gain to all future managed spruce stands using the genetic gain function in TIPSY.
� Impact of changing the minimum low productivity volume requirement for deciduous by +/- 10 cubic metres, and minimum harvest age of 60 years for deciduous.
Other sensitivity analyses proposed for the Fort Nelson TSA are shown in Table 52.

Fort Nelson DFAM TSR 3
63
Table 52: Proposed sensitivity analysis for the Fort Nelson TSA
Issue to be tested Sensitivity levels Existing stand yields +/- 10% Regenerated stand yields +/- 10% Minimum harvestable age +/- 10 years
95% at maximum MAI Site index adjustments SIBEC (see Section 5.1.2) Land base changes +/- 10% changing the low site criteria Visual quality objectives Top and bottom of range % denudation. Harvest rules Oldest first, and random. Harvest flow alternatives 1. Maintain present harvest level for 15 to 20 years.
2. Maintain present harvest level as long as possible. 3. Maximum short-term.
Green-up periods +/- 5 years These sensitivity analyses may be refined, reduced or added to during the data package review and analysis phase.

Fort Nelson DFAM TSR 3
64
11 References Alberta Forest Service. 1985. Alberta phase 3 forest inventory: yield tables for unmanaged stands. ENR Rep. No. Dep. 60a. BC Ministry of Forests, Forest Analysis Branch. 2004. Interim Standards for Data Package Preparation and Timber Supply Analysis: Defined Forest Area Management Initiative. Victoria: Province of British Columbia. BC Ministry of Forests, Forest Analysis Branch. 2003. Modelling Options for Disturbance Outside the THLB (Draft Working Paper, June 2003). Victoria: Province of British Columbia. BC Ministry of Forests. 2003. Modelling Visuals in TSR III Bulletin. Victoria: Province of British Columbia. BC Ministry of Forests. 2003. Riparian Buffers in the Prince George Forest Region. Internal document. BC Ministry of Forests, Forest Analysis Branch. 2003. Supplemental Guide for Preparing Timber Supply Analysis Data Packages. Victoria: Province of British Columbia. BC Ministry of Forests. 2002. Provincial Wildlife Tree Management Recommendations. Victoria: Province of British Columbia. BC Ministry of Forests and Ministry of Environment, Lands and Parks 2000. Landscape Unit Planning Guide. Forest Practices Code of British Columbia. Victoria: Province of British Columbia. BC Ministry of Forests. 1999. Mapping and Assessing Terrain Stability Guidebook 2nd edition. Victoria: Province of British Columbia. BC Ministry of Forests and Ministry of Environment, Lands and Parks 1999. Green-up Guidebook, 2nd edition. Forest Practices Code of British Columbia. Victoria: Province of British Columbia. BC Ministry of Forests. 1999. Managing Identified Wildlife: Procedures and Measures. Volume 1. Victoria: Province of British Columbia. BC Ministry of Forests. 1998. Northern Interior Region Timber Tenure Administrative Guideline. Victoria: Province of British Columbia. BC Ministry of Sustainable Resource Management. 1997. Fort Nelson Land and Resource Management Plan. Victoria: Province of British Columbia.

Fort Nelson DFAM TSR 3
65
BC Ministry of Forests and Ministry of Environment, Lands and Parks 1995. Riparian Management Area Guidebook. Forest Practices Code of British Columbia. Victoria: Province of British Columbia. BC Ministry of Forests. 1976 Metric Diameter Class Decay, Waste and Breakage Factors. Victoria: Province of British Columbia. Goudie, James W. 1984. Height growth and site index curves for lodgepole pine and white spruce and interim managed stand yield tables for lodgepole pine in British Columbia. B.C. Min. For., Res. Br. Unpubl. Rep. 75 p. Jahraus and Associates Consulting Inc. 2003. Fort Nelson TSA: Documentation of Analysis for Vegetation Resources Inventory Statistical Adjustment and Net Volume Adjustment Factor Development. Addendum. Prepared for Canadian Forest Products Ltd. Available at: http://srmwww.gov.bc.ca/tib/vri/vri/reports&pub/adjustment/tsa/FtNelson_VRI_Adjustment_Addendum_final.pdf J. S. Thrower and Associates Ltd. 1992. Height-age/site-index curves for Black Cottonwood in British Columbia. Ministry of Forests, Inventory Branch. Project 92-07-IB, 21p. Milner, Kelsey S. 1992. Site index and height growth curves for Ponderosa pine, Western larch, Lodgepole pine, and Douglas-fir in Western Montana. West. J. Appl. For. 7(1):914. Nigh, G.D. 1999. Smoothing top height estimates from two lodgepole pine height models. B.C. Min. For., Res. Br., Victoria, B.C. Ext. Note 30. North et. al. 1996. Archaeological Overview of the Fort Nelson Land and Resource Management Plan Area, Heritage. Prepared for the Ministry of Sustainable Resource Management.
Fort Nelson DFAM TSR 3
66
Appendix 1: Stream Riparian Classification Methodology Studies were available that allowed for the development of relationships between stream order and stream classes, and though limited in scope, this method provided an immediate opportunity to assign stream classes to stream features based on stream order and statistics. TRIM I stream features were GIS processed, using a custom Arc/Info AML, to determine a (simplified) stream order attribute that was appended to the Arc/Info Arc Attribute Table. Having determined stream order, the following assumptions were made (Table 53 and Table 54):
1) Streams assigned to stream orders 3 and higher correspond to stream classes 1 to 4 (Table 53), while stream order 1 and 2 correspond to stream classes 5 and 6 (Table 54). This relationship was found in a watershed study done in the Fort Nelson TSA (Lower Dunedin Landscape Unit) and also from information provided by MSRM in Prince George. Using GIS utilities, the total lengths of streams were summed for the two stream order classes (i.e. 73, 841 km for S1-S4 and 194,105 km for S5-S6).
2) The percentages of each stream class within the two stream order classes (column A in Tables) were determined from a GIS analysis for TSR 3 (using the Lower Dunedin study) and from data in the Kamloops TSA.
3) The lengths of streams in each stream class were determined by multiplying the total length of the stream order class (determined in step 1) with the percentages in step 2 (Column B). e.g. for S4, 73,841km X 0.20 = 14, 768 km.
4) Each stream class was assumed to have a combined riparian buffer width (RZ and RMZ) as suggested by the Riparian Management Area Guidebook (Table 55). The combined riparian width is also shown in Column C in the Tables.
5) The Riparian Management Areas (RMA) for each stream class (Column D in Tables) is calculated from the lengths and widths in Column B and C. For example, for S1, RMA = [14, 768 km X 1000 m/km X (60m X 2)] ÷ 10 000 ha/m2 = 177, 219 ha. Note that the combined riparian buffer width (Column C) is the buffer width for one side of the stream.
6) The effective riparian width is the width that needs to be applied to the stream order class to represent the combined RMA for all the corresponding stream classes. For example, for S1-S4 (Table 53), the effective riparian buffer width is: [(494, 737 ha X 10,000 m2/ha) ÷ (73,841 km X 1,000m/ km)] ÷ 2 = 33.5m (buffer width for one side of the stream).
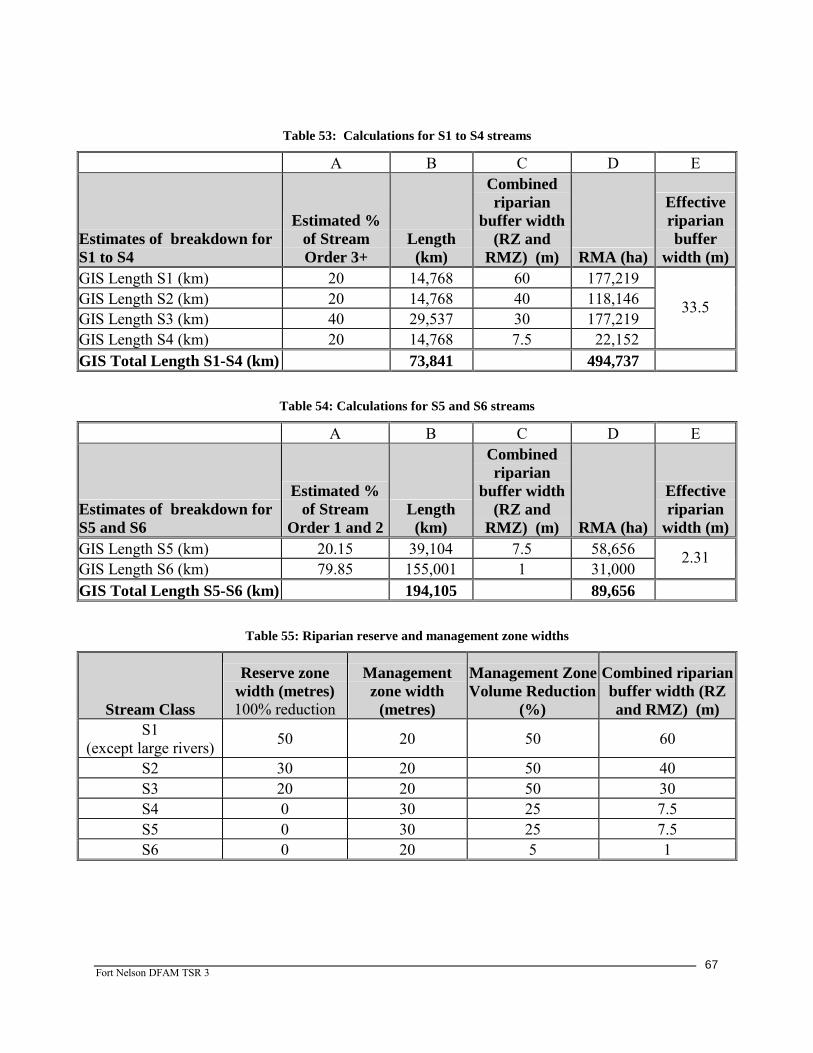
Fort Nelson DFAM TSR 3
67
Table 53: Calculations for S1 to S4 streams
A B C D E
Estimates of breakdown for S1 to S4
Estimated % of Stream Order 3+
Length (km)
Combined riparian
buffer width (RZ and
RMZ) (m) RMA (ha)
Effective riparian buffer
width (m)GIS Length S1 (km) 20 14,768 60 177,219 GIS Length S2 (km) 20 14,768 40 118,146 GIS Length S3 (km) 40 29,537 30 177,219 GIS Length S4 (km) 20 14,768 7.5 22,152
33.5
GIS Total Length S1-S4 (km) 73,841 494,737
Table 54: Calculations for S5 and S6 streams
A B C D E
Estimates of breakdown for S5 and S6
Estimated % of Stream
Order 1 and 2Length
(km)
Combined riparian
buffer width (RZ and
RMZ) (m) RMA (ha)
Effective riparian
width (m)GIS Length S5 (km) 20.15 39,104 7.5 58,656 GIS Length S6 (km) 79.85 155,001 1 31,000
2.31
GIS Total Length S5-S6 (km) 194,105 89,656
Table 55: Riparian reserve and management zone widths
Stream Class
Reserve zone width (metres) 100% reduction
Management zone width
(metres)
Management Zone Volume Reduction
(%)
Combined riparianbuffer width (RZ and RMZ) (m)
S1 (except large rivers) 50 20 50 60
S2 30 20 50 40 S3 20 20 50 30 S4 0 30 25 7.5 S5 0 30 25 7.5 S6 0 20 5 1
Fort Nelson DFAM TSR 3
68
The proposed methodology was recently reviewed by MSRM, Resource Information Branch in Prince George and Victoria Service Centre26. The review document notes that the methodology used for the TSA presents a generalized approximation of stream classification and calculated reduction, which contains inherent risks and biases, which must be understood. The risks identified are:
1. The Lower Dunedin analysis (Poulin and Associates) results used in the riparian methodology was limited mostly to the BWBS zones, but was extrapolated to the entire TSA. In particular, data from the SWB zone, which contains major rivers and streams, was not available. It is understood that there are sport and regionally important fish species in several 2nd order sampled streams.
2. Only fish that are managed for under the Forest Practices Code were included in the analysis. Since no regionally important species are currently designated for the Peace Region, they were not included in the study. If these species are identified in the future as species at risk or regionally significant under the Forest and Range Practices Act, they will obviously change the management assumptions.
3. The adjusted percentage of 1st and 2nd order streams calculated for the Fort Nelson TSA was different than those for the Lower Dunedin. The Lower Dunedin exhibited a higher percentage, which if applied to the Fort Nelson TSA would require a higher RMA.
4. The number of reaches in the Lower Dunedin was not sampled in the same proportion as the occurrence of reaches in the watershed nor in the same proportion as the number of reaches selected by the stratified random sample design.
5. The methodology used had documented that 18% of the observation points contained stream classification data but in fact only about 10% do.
6. The assumption correlating stream class to stream order does not recognize the variation in stream class associated with different stream reaches.
7. The fish occurrence point coverage does not match to specific streams for all points and can only be used to determine fish presence on a broad scale. It cannot be used to determine absence of a specific fish species.
8. The data for the Lower Dunedin study was collected and mapped to the TRIM 1 base.
26 Review of stream riparian classification and reduction for Fort Nelson TSR analysis by Lynn Blouw and David Tesch received by email March 9, 2004.
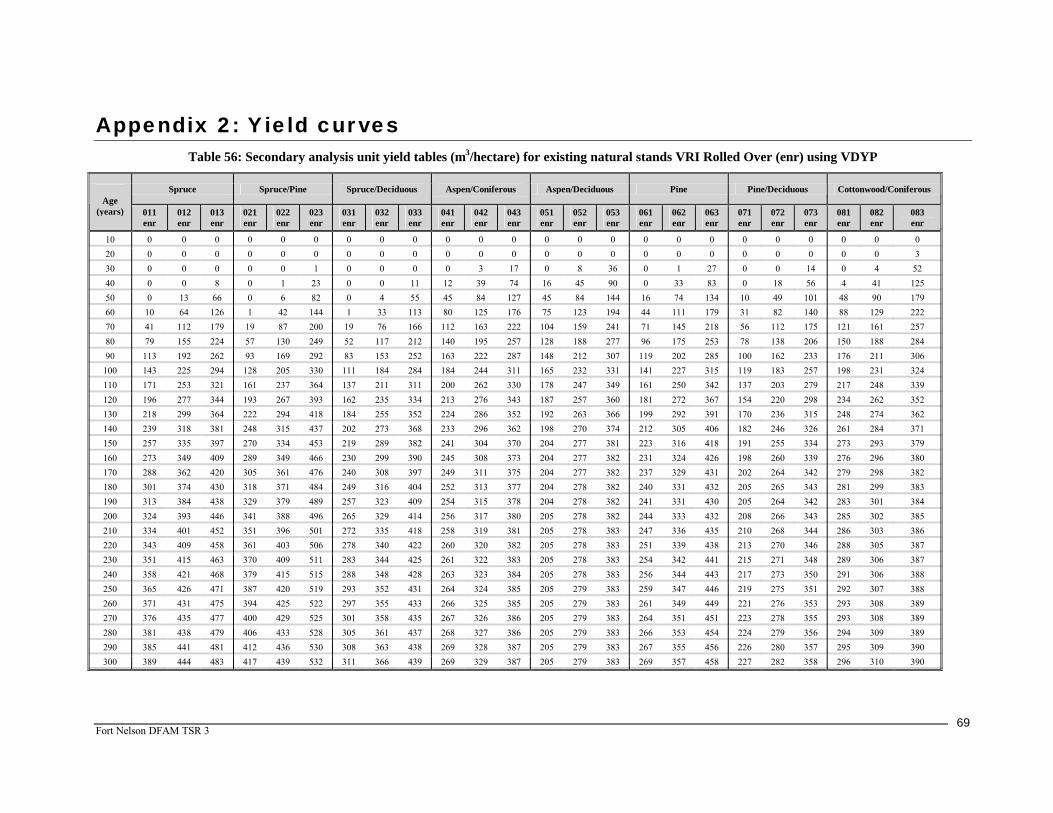
Fort Nelson DFAM TSR 3
69
Appendix 2: Yield curves Table 56: Secondary analysis unit yield tables (m3/hectare) for existing natural stands VRI Rolled Over (enr) using VDYP
Spruce Spruce/Pine Spruce/Deciduous Aspen/Coniferous Aspen/Deciduous Pine Pine/Deciduous Cottonwood/Coniferous Age
(years) 011 enr
012 enr
013 enr
021 enr
022 enr
023 enr
031 enr
032 enr
033 enr
041 enr
042 enr
043 enr
051 enr
052 enr
053 enr
061 enr
062 enr
063 enr
071 enr
072 enr
073 enr
081 enr
082 enr
083 enr
10 0 0 0 0 0 0 0 0 0 0 0 0 0 0 0 0 0 0 0 0 0 0 0 0 20 0 0 0 0 0 0 0 0 0 0 0 0 0 0 0 0 0 0 0 0 0 0 0 3 30 0 0 0 0 0 1 0 0 0 0 3 17 0 8 36 0 1 27 0 0 14 0 4 52 40 0 0 8 0 1 23 0 0 11 12 39 74 16 45 90 0 33 83 0 18 56 4 41 125 50 0 13 66 0 6 82 0 4 55 45 84 127 45 84 144 16 74 134 10 49 101 48 90 179 60 10 64 126 1 42 144 1 33 113 80 125 176 75 123 194 44 111 179 31 82 140 88 129 222 70 41 112 179 19 87 200 19 76 166 112 163 222 104 159 241 71 145 218 56 112 175 121 161 257 80 79 155 224 57 130 249 52 117 212 140 195 257 128 188 277 96 175 253 78 138 206 150 188 284 90 113 192 262 93 169 292 83 153 252 163 222 287 148 212 307 119 202 285 100 162 233 176 211 306
100 143 225 294 128 205 330 111 184 284 184 244 311 165 232 331 141 227 315 119 183 257 198 231 324 110 171 253 321 161 237 364 137 211 311 200 262 330 178 247 349 161 250 342 137 203 279 217 248 339 120 196 277 344 193 267 393 162 235 334 213 276 343 187 257 360 181 272 367 154 220 298 234 262 352 130 218 299 364 222 294 418 184 255 352 224 286 352 192 263 366 199 292 391 170 236 315 248 274 362 140 239 318 381 248 315 437 202 273 368 233 296 362 198 270 374 212 305 406 182 246 326 261 284 371 150 257 335 397 270 334 453 219 289 382 241 304 370 204 277 381 223 316 418 191 255 334 273 293 379 160 273 349 409 289 349 466 230 299 390 245 308 373 204 277 382 231 324 426 198 260 339 276 296 380 170 288 362 420 305 361 476 240 308 397 249 311 375 204 277 382 237 329 431 202 264 342 279 298 382 180 301 374 430 318 371 484 249 316 404 252 313 377 204 278 382 240 331 432 205 265 343 281 299 383 190 313 384 438 329 379 489 257 323 409 254 315 378 204 278 382 241 331 430 205 264 342 283 301 384 200 324 393 446 341 388 496 265 329 414 256 317 380 205 278 382 244 333 432 208 266 343 285 302 385 210 334 401 452 351 396 501 272 335 418 258 319 381 205 278 383 247 336 435 210 268 344 286 303 386 220 343 409 458 361 403 506 278 340 422 260 320 382 205 278 383 251 339 438 213 270 346 288 305 387 230 351 415 463 370 409 511 283 344 425 261 322 383 205 278 383 254 342 441 215 271 348 289 306 387 240 358 421 468 379 415 515 288 348 428 263 323 384 205 278 383 256 344 443 217 273 350 291 306 388 250 365 426 471 387 420 519 293 352 431 264 324 385 205 279 383 259 347 446 219 275 351 292 307 388 260 371 431 475 394 425 522 297 355 433 266 325 385 205 279 383 261 349 449 221 276 353 293 308 389 270 376 435 477 400 429 525 301 358 435 267 326 386 205 279 383 264 351 451 223 278 355 293 308 389 280 381 438 479 406 433 528 305 361 437 268 327 386 205 279 383 266 353 454 224 279 356 294 309 389 290 385 441 481 412 436 530 308 363 438 269 328 387 205 279 383 267 355 456 226 280 357 295 309 390 300 389 444 483 417 439 532 311 366 439 269 329 387 205 279 383 269 357 458 227 282 358 296 310 390

Fort Nelson DFAM TSR 3
70
Table 56 continued: Secondary analysis unit yield tables (m3/hectare) for existing natural stands VRI Rolled
Over (enr) using VDYP
Cottonwood/Deciduous Spruce/Larch Subalpine Fir Birch Age
(years) 091 enr
092 enr
093 enr
101 enr
102 enr
103 enr
111 enr
112 enr
113 enr
121 enr
122 enr
123 enr
10 0 0 0 0 0 0 0 0 0 0 0 0 20 0 0 0 0 0 0 0 0 0 0 0 0 30 0 1 39 0 0 1 0 0 4 0 3 22 40 0 28 107 0 0 65 0 9 29 1 39 73 50 29 74 158 0 7 139 2 28 69 10 78 118 60 68 116 198 8 42 204 6 54 108 28 112 158 70 103 151 230 31 77 259 19 85 147 47 142 193 80 134 180 254 61 109 305 35 110 181 65 169 222 90 161 205 274 90 138 344 47 131 211 80 192 247 100 185 226 290 118 164 376 61 150 238 95 213 270 110 205 244 303 144 187 404 74 168 262 108 232 289 120 223 259 313 168 208 427 85 184 285 121 248 305 130 238 272 322 190 225 447 97 201 308 129 258 315 140 251 283 329 210 241 463 109 217 327 133 263 319 150 263 292 335 226 253 476 120 232 345 136 268 323 160 263 292 335 239 264 485 130 247 360 139 270 325 170 264 293 336 250 272 492 140 260 374 141 272 327 180 264 293 336 259 280 498 150 273 387 142 274 329 190 264 293 336 267 286 503 159 286 398 144 275 330 200 265 293 336 274 292 508 168 297 410 145 276 331 210 265 294 336 281 297 512 176 308 421 146 278 332 220 265 294 336 287 302 516 185 319 431 147 279 333 230 266 294 336 292 306 519 193 329 442 149 280 334 240 266 294 336 297 310 522 200 339 451 150 281 334 250 266 294 336 302 313 524 208 349 461 151 282 335 260 266 294 336 306 316 526 209 350 464 151 282 335 270 266 294 337 309 319 528 211 352 467 152 283 336 280 267 295 337 312 321 529 212 353 469 153 283 336 290 267 295 337 315 323 531 214 355 472 154 284 336 300 267 295 337 318 325 532 215 356 474 154 284 337
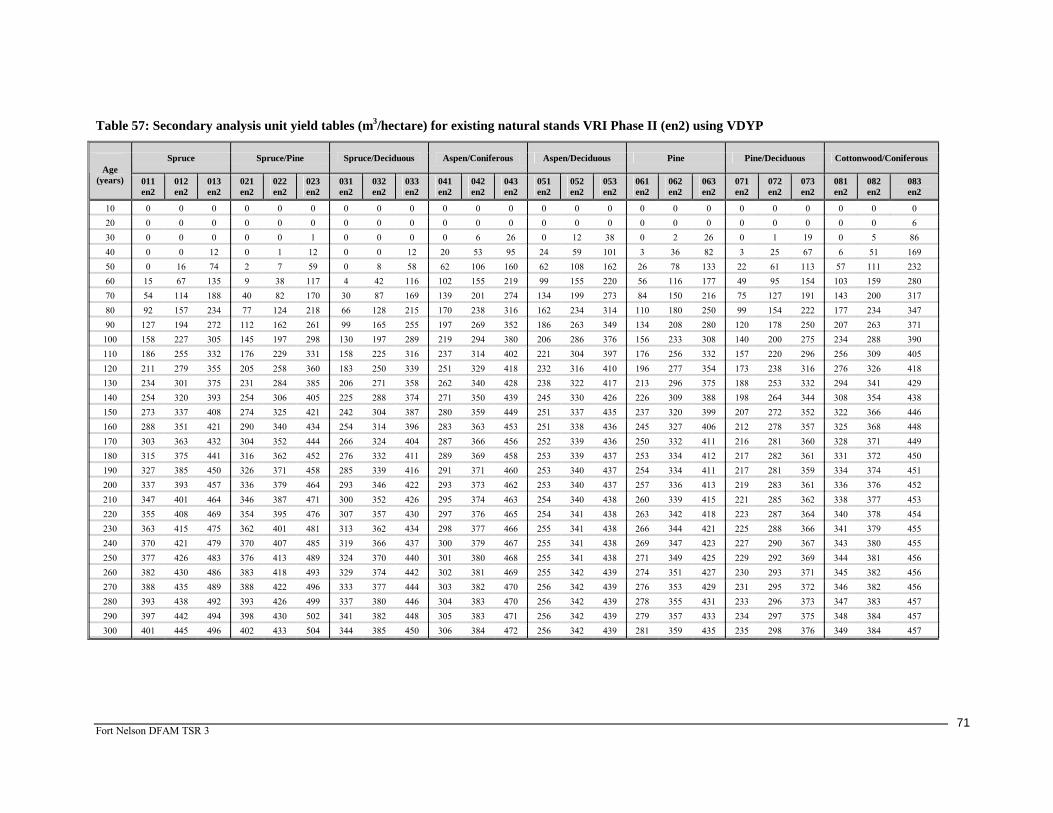
Fort Nelson DFAM TSR 3
71
Table 57: Secondary analysis unit yield tables (m3/hectare) for existing natural stands VRI Phase II (en2) using VDYP
Spruce Spruce/Pine Spruce/Deciduous Aspen/Coniferous Aspen/Deciduous Pine Pine/Deciduous Cottonwood/Coniferous Age
(years) 011 en2
012 en2
013 en2
021 en2
022 en2
023 en2
031 en2
032 en2
033 en2
041 en2
042 en2
043 en2
051 en2
052 en2
053 en2
061 en2
062 en2
063 en2
071 en2
072 en2
073 en2
081 en2
082 en2
083 en2
10 0 0 0 0 0 0 0 0 0 0 0 0 0 0 0 0 0 0 0 0 0 0 0 0 20 0 0 0 0 0 0 0 0 0 0 0 0 0 0 0 0 0 0 0 0 0 0 0 6 30 0 0 0 0 0 1 0 0 0 0 6 26 0 12 38 0 2 26 0 1 19 0 5 86 40 0 0 12 0 1 12 0 0 12 20 53 95 24 59 101 3 36 82 3 25 67 6 51 169 50 0 16 74 2 7 59 0 8 58 62 106 160 62 108 162 26 78 133 22 61 113 57 111 232 60 15 67 135 9 38 117 4 42 116 102 155 219 99 155 220 56 116 177 49 95 154 103 159 280 70 54 114 188 40 82 170 30 87 169 139 201 274 134 199 273 84 150 216 75 127 191 143 200 317 80 92 157 234 77 124 218 66 128 215 170 238 316 162 234 314 110 180 250 99 154 222 177 234 347 90 127 194 272 112 162 261 99 165 255 197 269 352 186 263 349 134 208 280 120 178 250 207 263 371
100 158 227 305 145 197 298 130 197 289 219 294 380 206 286 376 156 233 308 140 200 275 234 288 390 110 186 255 332 176 229 331 158 225 316 237 314 402 221 304 397 176 256 332 157 220 296 256 309 405 120 211 279 355 205 258 360 183 250 339 251 329 418 232 316 410 196 277 354 173 238 316 276 326 418 130 234 301 375 231 284 385 206 271 358 262 340 428 238 322 417 213 296 375 188 253 332 294 341 429 140 254 320 393 254 306 405 225 288 374 271 350 439 245 330 426 226 309 388 198 264 344 308 354 438 150 273 337 408 274 325 421 242 304 387 280 359 449 251 337 435 237 320 399 207 272 352 322 366 446 160 288 351 421 290 340 434 254 314 396 283 363 453 251 338 436 245 327 406 212 278 357 325 368 448 170 303 363 432 304 352 444 266 324 404 287 366 456 252 339 436 250 332 411 216 281 360 328 371 449 180 315 375 441 316 362 452 276 332 411 289 369 458 253 339 437 253 334 412 217 282 361 331 372 450 190 327 385 450 326 371 458 285 339 416 291 371 460 253 340 437 254 334 411 217 281 359 334 374 451 200 337 393 457 336 379 464 293 346 422 293 373 462 253 340 437 257 336 413 219 283 361 336 376 452 210 347 401 464 346 387 471 300 352 426 295 374 463 254 340 438 260 339 415 221 285 362 338 377 453 220 355 408 469 354 395 476 307 357 430 297 376 465 254 341 438 263 342 418 223 287 364 340 378 454 230 363 415 475 362 401 481 313 362 434 298 377 466 255 341 438 266 344 421 225 288 366 341 379 455 240 370 421 479 370 407 485 319 366 437 300 379 467 255 341 438 269 347 423 227 290 367 343 380 455 250 377 426 483 376 413 489 324 370 440 301 380 468 255 341 438 271 349 425 229 292 369 344 381 456 260 382 430 486 383 418 493 329 374 442 302 381 469 255 342 439 274 351 427 230 293 371 345 382 456 270 388 435 489 388 422 496 333 377 444 303 382 470 256 342 439 276 353 429 231 295 372 346 382 456 280 393 438 492 393 426 499 337 380 446 304 383 470 256 342 439 278 355 431 233 296 373 347 383 457 290 397 442 494 398 430 502 341 382 448 305 383 471 256 342 439 279 357 433 234 297 375 348 384 457 300 401 445 496 402 433 504 344 385 450 306 384 472 256 342 439 281 359 435 235 298 376 349 384 457

Fort Nelson DFAM TSR 3
72
Table 57 continued: Secondary analysis unit yield tables (m3/hectare) for existing natural stands
VRI Phase II (en2) using VDYP
Cottonwood/Deciduous Spruce/Larch Subalpine Fir Birch Age
(years) 091 en2
092 en2
093 en2
101 en2
102 en2
103 en2
111 en2
112 en2
113 en2
121 en2
122 en2
123 en2
10 0 0 0 0 0 0 0 0 0 20 0 0 6 0 0 0 0 0 0 0 0 0 30 0 2 94 0 0 0 0 0 6 0 3 25 40 0 36 180 0 0 24 0 5 32 9 48 88 50 25 88 244 0 13 85 2 19 73 34 97 145 60 65 136 292 10 57 143 12 46 112 62 140 195 70 103 176 329 42 99 194 33 76 150 90 179 239 80 136 211 357 76 137 239 52 101 182 115 212 276 90 166 240 379 107 171 277 70 124 210 138 242 310
100 192 264 397 136 202 310 86 146 234 159 269 339 110 215 285 411 163 229 339 101 165 256 177 292 365 120 235 303 423 187 253 363 114 183 275 194 313 388 130 252 317 432 209 274 385 128 199 297 205 325 400 140 265 329 440 228 292 403 141 212 317 210 330 405 150 278 340 446 244 307 416 154 226 337 214 335 410 160 279 340 446 257 319 426 166 236 355 217 338 412 170 280 341 447 267 328 434 178 246 372 219 340 414 180 281 342 447 276 336 440 189 255 389 221 341 415 190 282 342 447 285 344 446 199 264 405 223 343 417 200 282 343 447 292 350 451 210 273 419 225 344 418 210 283 343 447 299 356 455 220 281 434 226 346 419 220 284 343 447 304 361 459 229 289 447 227 347 420 230 284 344 448 310 366 463 238 297 460 229 348 421 240 285 344 448 315 370 466 247 304 473 230 349 422 250 285 344 448 319 373 469 256 311 485 231 350 422 260 286 345 448 323 377 471 258 312 487 232 350 423 270 286 345 448 327 380 473 260 313 488 233 351 424 280 286 345 448 330 382 475 262 314 490 234 352 424 290 287 345 448 333 384 476 264 315 492 234 352 424 300 287 345 448 335 386 478 266 315 493 235 353 425

Fort Nelson DFAM TSR 3
73
Table 58: Secondary analysis unit yield tables (m3/hectare) for existing managed stands VRI “roll over” (emr) using TIPSY
Spruce Pine Age (years) 012 emr 062 emr 063 emr
10 0 0 0
20 0 0 1
30 0 15 43
40 0 67 123
50 14 129 197
60 64 182 255
70 131 226 304
80 191 262 339
90 246 292 369
100 303 314 394
110 350 333 416
120 385 349 434
130 412 363 446
140 431 374 453
150 449 384 459
160 460 393 465
170 473 397 470
180 480 405 472
190 488 407 471
200 495 413 472
210 499 416 472
220 499 419 472
230 497 417 472
240 494 417 473
250 493 414 473
260 493 413 473
270 488 411 474
280 484 411 474
290 484 411 474
300 485 410 474 Note: there are no existing managed stands in the THLB that contained VRI Phase II inventory.

Fort Nelson DFAM TSR 3
74
Table 59: Secondary analysis unit yield tables (m3/hectare) for current/future managed stands VRI “roll over” (cfmr) and Phase 2 (cfm2) using TIPSY
VRI "roll over" VRI Phase 2
Spruce Spruce/Pine Pine Spruce Spruce/Pine Pine Age
(years) 011
cfmr 012
cfmr 013
cfmr 021
cfmr 022
cfmr 023
cfmr 061
cfmr 062
cfmr 063
cfmr 011
cfm2 012
cfm2 013
cfm2 021
cfm2 022
cfm2 023
cfm2 061
cfm2 062
cfm2 063
cfm2
10 0 0 0 0 0 0 0 0 0 0 0 0 0 0 0 0 0 0
20 0 0 0 0 0 0 0 0 2 0 0 0 0 0 0 0 0 2
30 0 0 0 0 0 1 0 11 52 0 0 0 0 0 0 0 11 54
40 0 1 20 0 0 48 4 54 136 0 1 24 0 0 19 9 55 138
50 1 22 98 0 14 151 23 109 208 1 25 107 1 11 97 34 112 212
60 13 82 189 5 63 244 51 158 267 18 86 198 13 53 188 66 161 270
70 47 151 265 29 126 337 81 198 313 63 157 281 47 114 265 97 200 316
80 94 211 344 69 187 402 108 232 346 114 218 354 94 175 344 127 236 350
90 146 269 398 114 240 446 132 261 376 167 274 407 146 227 399 152 265 378
100 190 328 433 161 294 476 153 286 401 211 333 445 191 278 434 174 290 403
110 232 370 462 200 343 500 171 302 420 254 377 470 233 329 461 191 307 423
120 272 400 483 238 380 517 185 319 439 300 404 489 273 367 483 206 321 440
130 314 425 497 276 404 525 200 332 449 339 430 506 315 395 498 220 335 450
140 346 443 511 313 426 524 211 341 456 368 446 517 347 417 511 231 344 458
150 374 458 519 341 442 524 220 350 463 391 462 521 374 435 517 241 353 463
160 392 471 517 368 456 525 229 357 467 409 475 519 392 447 516 249 360 467
170 409 481 518 385 467 523 236 365 471 424 485 516 409 460 516 256 367 469
180 423 491 514 401 478 520 241 370 472 434 492 518 422 471 515 262 372 470
190 433 496 514 414 484 519 245 374 471 445 499 515 433 478 514 268 377 469
200 440 500 514 424 491 515 249 376 472 452 502 515 442 484 512 273 378 470
210 450 502 513 433 495 513 255 378 472 461 502 513 450 490 513 278 380 470
220 456 500 509 440 497 512 259 380 472 468 500 507 457 494 510 280 383 470
230 461 498 506 447 497 512 261 382 472 472 500 507 463 493 507 281 384 470
240 468 498 503 454 494 512 265 382 473 475 496 502 468 493 503 282 386 471
250 471 493 500 456 493 512 268 383 473 479 493 499 471 490 500 282 387 471
260 474 491 498 463 492 512 270 384 473 482 490 496 474 490 498 284 387 471
270 476 488 497 466 489 512 271 385 474 482 491 496 476 489 495 284 388 471
280 478 490 493 467 487 512 270 385 474 479 490 496 479 486 493 283 390 472
290 476 488 493 469 481 512 270 385 474 478 487 496 476 483 493 286 391 472
300 476 484 493 471 480 512 267 387 474 478 484 496 475 480 493 285 392 472

Fort Nelson DFAM TSR 3
75
Appendix 3: Landscape Unit and Biodiversity Emphasis Options
Landscape Unit BEO AT % BWBS % SWB % Landscape Unit BEO AT % BWBS % SWB %
Akue I 0 100 0 Klua I 0 100 0
Big Beaver I 0 100 0 Kwokullie I 0 100 0
Boreal I 26 16 58 Kyklo L 0 100 0
Bunch L 0 88 12 La Biche I 0 100 0
Capot Blanc I 0 100 0 Liard Hot Springs I 0 70 30
Catkin I 0 100 0 Liard River A I 0 98 2
Chee I 0 34 66 Liard River B I 0 100 0
Coal L 0 94 6 Liard River C H 0 100 0
Crehan I 33 8 59 MacDonald I 25 6 68
Crow I 0 99 1 Major Hart I 19 23 58
Crusty I 0 71 29 Matulka I 9 18 73
D Easum L 0 100 0 Minaker I 0 95 5
Dilly L 0 100 0 Moose I 58 0 42
Dunedin I 0 94 6 Moule L 0 75 25
Eight Mile L 9 13 78 Muncho L 28 10 62
Elleh L 0 100 0 Muskwa River A L 0 89 11
Eskai L 0 100 0 Muskwa River B L 0 100 0
Etane I 0 100 0 Netson I 32 8 60
Falk I 0 71 29 Ootta I 0 100 0
Forcier L 4 43 53 Otelsas I 54 0 46
Fort Nelson River A L 0 100 0 Patry I 0 100 0
Fort Nelson River B L 0 100 0 Petitot River I 0 100 0
Gammer I 0 76 24 Pouce L 0 100 0
Gathto L 50 2 48 Prophet River L 0 100 0
Gemini I 0 98 2 Rabbit L 0 76 24
Graybank L 0 91 9 Racing L 67 0 33
Grayling L 4 33 63 Ram L 6 31 64
Gundahoo I 20 5 75 Redpott I 4 18 78
Hay River I 0 100 0 Richards L 14 6 80
Hewer I 28 6 66 Sahtaneh L 0 100 0
Hoffard I 0 100 0 Sandy I 0 100 0
Holden L 0 79 21 Scatter I 4 60 36
Hossitl L 0 100 0 Sharktooth L 46 9 45
Irene East I 0 100 0 Shekilie L 0 100 0
Irene West H 0 100 0 Smith I 0 85 15
Jackknife L 0 100 0 Snake I 0 100 0
July Lake L 0 100 0 Stanolind L 0 100 0
Kechika River H 0 91 9 Sulpher L 7 44 49
Kitza I 0 96 4 Tentsi I 34 12 54
Kiwigana I 0 100 0 Tetsa L 40 0 60
Kledo I 0 100 0 Timberwolf I 0 100 0
Klowee I 0 100 0 Tuchodi L 42 3 55
Klua I 0 100 0 Vents L 0 64 36
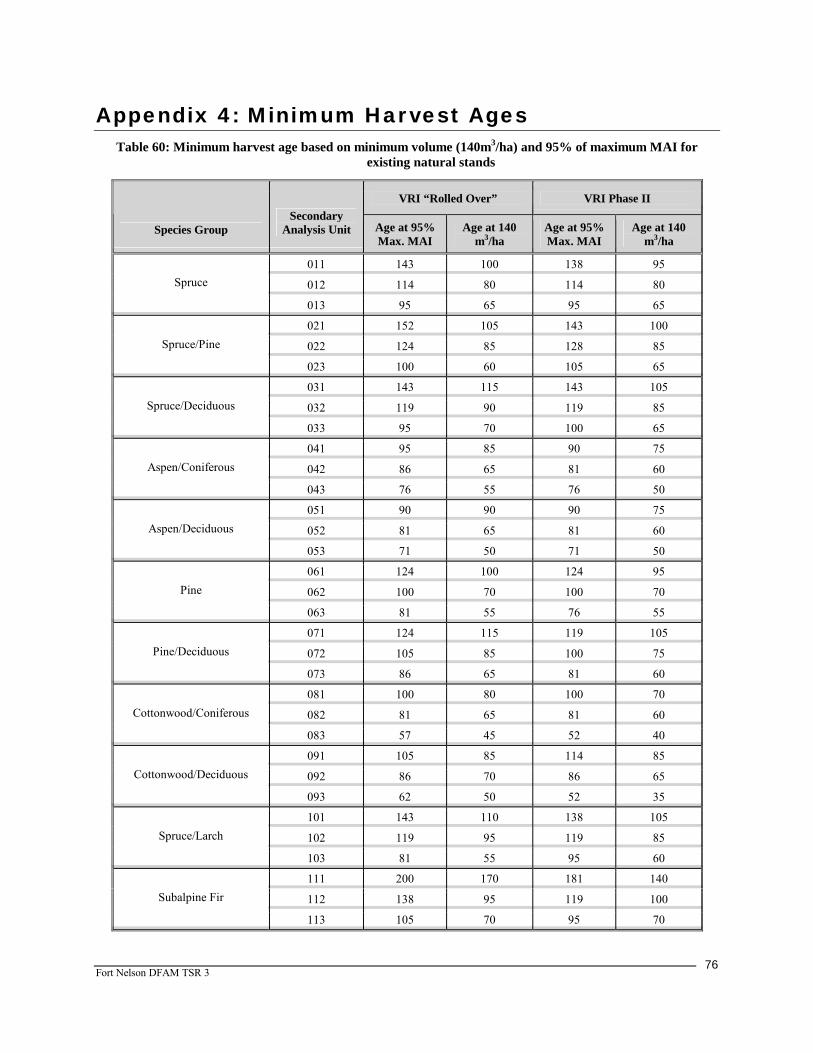
Fort Nelson DFAM TSR 3
76
Appendix 4: Minimum Harvest Ages Table 60: Minimum harvest age based on minimum volume (140m3/ha) and 95% of maximum MAI for
existing natural stands
VRI “Rolled Over” VRI Phase II
Species Group Secondary
Analysis Unit Age at 95% Max. MAI
Age at 140 m3/ha
Age at 95% Max. MAI
Age at 140 m3/ha
011 143 100 138 95
012 114 80 114 80 Spruce
013 95 65 95 65
021 152 105 143 100
022 124 85 128 85 Spruce/Pine
023 100 60 105 65
031 143 115 143 105
032 119 90 119 85 Spruce/Deciduous
033 95 70 100 65
041 95 85 90 75
042 86 65 81 60 Aspen/Coniferous
043 76 55 76 50
051 90 90 90 75
052 81 65 81 60 Aspen/Deciduous
053 71 50 71 50
061 124 100 124 95
062 100 70 100 70 Pine
063 81 55 76 55
071 124 115 119 105
072 105 85 100 75 Pine/Deciduous
073 86 65 81 60
081 100 80 100 70
082 81 65 81 60 Cottonwood/Coniferous
083 57 45 52 40
091 105 85 114 85
092 86 70 86 65 Cottonwood/Deciduous
093 62 50 52 35
101 143 110 138 105
102 119 95 119 85 Spruce/Larch
103 81 55 95 60
111 200 170 181 140
112 138 95 119 100 Subalpine Fir
113 105 70 95 70
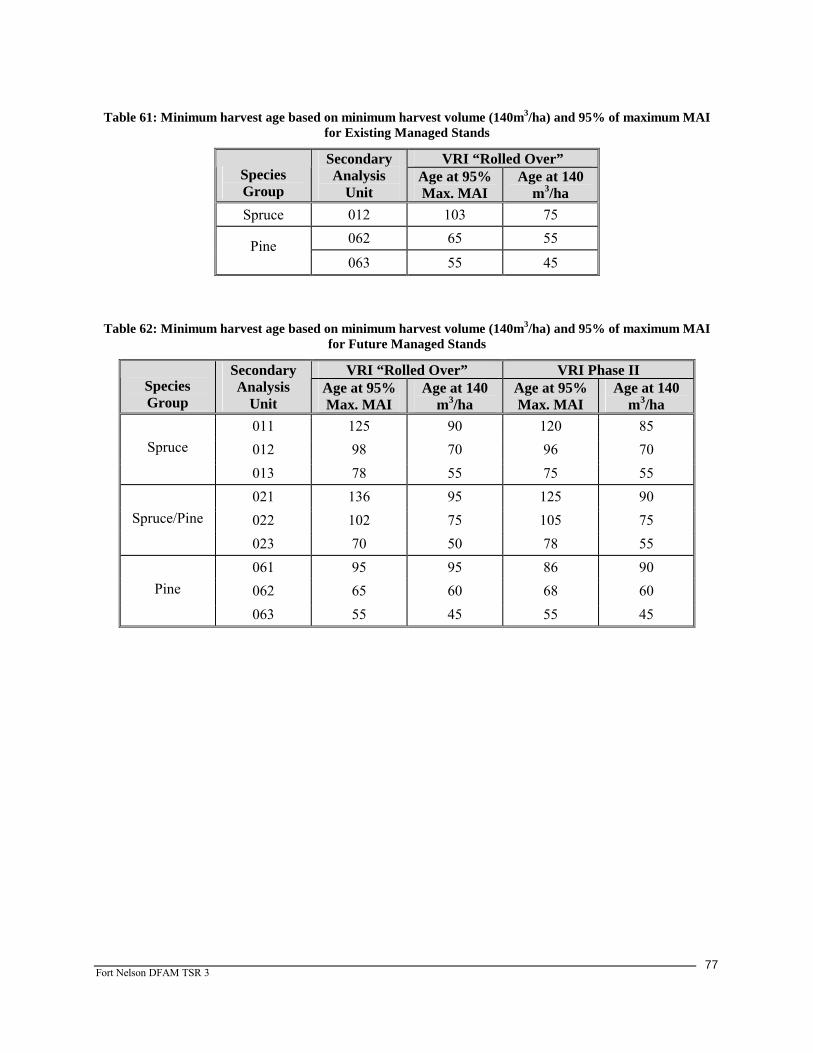
Fort Nelson DFAM TSR 3
77
Table 61: Minimum harvest age based on minimum harvest volume (140m3/ha) and 95% of maximum MAI
for Existing Managed Stands
VRI “Rolled Over” Species Group
Secondary Analysis
Unit Age at 95% Max. MAI
Age at 140 m3/ha
Spruce 012 103 75 062 65 55 Pine 063 55 45
Table 62: Minimum harvest age based on minimum harvest volume (140m3/ha) and 95% of maximum MAI for Future Managed Stands
VRI “Rolled Over” VRI Phase II Species Group
Secondary Analysis
Unit Age at 95% Max. MAI
Age at 140 m3/ha
Age at 95% Max. MAI
Age at 140 m3/ha
011 125 90 120 85 012 98 70 96 70 Spruce
013 78 55 75 55 021 136 95 125 90 022 102 75 105 75 Spruce/Pine
023 70 50 78 55 061 95 95 86 90 062 65 60 68 60 Pine
063 55 45 55 45