Embed Size (px)
Citation preview

A
trSWiWbstt©
P
K
sasl
0
Physics of the Earth and Planetary Interiors 163 (2007) 233–244
Tsunami hazards along Chinese coast from potentialearthquakes in South China Sea
Yingchun Liu a,b,∗, Angela Santos d, Shuo M. Wang c,Yaolin Shi b, Hailing Liu a, David A. Yuen c
a South China Sea Institute of Oceanology, Chinese Academy of Sciences, Guangzhou, Chinab Graduate University of Chinese Academy of Sciences, Beijing, China
c Department of Geology & Geophysics and Minnesota Supercomputing Institute,University of Minnesota at Twin Cities, Minneapolis, MN, USA
d Tsunami Engineering Laboratory Disaster Control Research Center School of Engineering,Tohoku University, Sendai, Japan
Received 19 January 2007; accepted 23 February 2007
bstract
The pair of earthquakes off Taiwan on December 26, 2006 and the subsequent disruption of the Internet traffic have called attentiono the potential destructive hazards along the Chinese coast from tsunamis. Historical records show past tsunami earthquakes in thisegion. Using GPS, earthquake focal mechanisms and geological evolution, we have delineated the dangerous zones in the Philippineea plate where major earthquakes may occur. The Manila Trench is identified as being most susceptible to future major earthquakes.e have obtained the local Gutenberg–Richter relationship for five sections along the Philippine Sea plate boundary and use this
nformation for determining the probability distribution for tsunami waves of various heights to impinge on various Chinese cities.e devise a new method called the probabilistic forecast of tsunami hazard (PFTH), which determines this probability distribution
y direct numerical simulation of the waves excited by hypothetical earthquakes in these zones. We have employed the linearhallow-water equations over the South China Sea. We have also compared them with results from the nonlinear version and found
hat the linear treatment serves our purpose sufficiently well. In the next century the probability of a wave with a height of over 2.0 mo hit near-coast ocean of Hong Kong and Macau is about 10%. Cities in Taiwan are less vulnerable than those on the mainland coast.2007 Elsevier B.V. All rights reserved.
ACS: 07.05.Rm; 91.30.P; 91.30.Nw; *92.10.hl; *91.30.P; 91.30.Px; 91.30.Zz
eywords: Tsunami hazard; Numerical simulation; Earthquake probability; S
∗ Corresponding author at: Digital Technology Center, Room 413,Walter Library, 117 Pleasant St. SE, Minneapolis, MN 55455, USA.Tel.: +1 612 624 6730.
E-mail addresses: [email protected],[email protected] (Y. Liu),[email protected] (A. Santos),[email protected] (S.M. Wang), [email protected] (Y. Shi),[email protected] (H. Liu), [email protected] (D.A. Yuen).
031-9201/$ – see front matter © 2007 Elsevier B.V. All rights reserved.doi:10.1016/j.pepi.2007.02.012
hallow-water equation; South China Sea
1. Introduction
Tsunamis occur around the world from variouscauses, principally from shallow earthquakes in sub-duction zones. Around 90% of the global undersea
earthquakes take place around the circum-Pacific belt.Once again on December 26, 2006 we were alerted tothe danger of tsunami hazards along the East China coastby the Pingtung earthquakes off southern Taiwan. This
d Plan
234 Y. Liu et al. / Physics of the Earth anarea is prone to large subduction related tsunamogenicearthquakes because of the nature of the complex plateboundary, ranging from Taiwan in the north to the ManilaTrench in the south. Until the end of 2004, there was lit-tle awareness about the potential tsunami danger fromshallow large earthquakes in this region with great eco-nomic importance. We must now be prepared to set upa suitable system for broadcasting tsunami warnings inthe South China Sea area.
Tsunami earthquakes take place most likely in trenchregions with a large tectonic movement and young foldedcrustal belts (Fukao, 1979). The South China Sea withthe adjacent Philippine Sea plate bordered by the ManilaTrench is an excellent candidate for such devastatingwaves to occur. Moreover, the coastal heights alongthe South China Sea are generally low, thus making itextremely vulnerable to incoming tsunami waves with aheight of only a couple meters. In particular, many eco-nomically important coastal cities, such as Hong Kongand Macau, are only a couple of meters above the sealevel, and would suffer a large-scale disaster, even if theheight of the tsunami wave were moderate.
Scientists have provided long records of pasttsunamis, going back for the past two thousand yearsalong the Chinese coast (Table 1) that clearly portendsthe potential danger of impending tsunami damages. Themost devastating tsunami in this region occurred 140years ago (in 1867) in Keelung at the northern tip ofTaiwan. Both the northeast and southwest coasts of theTaiwan Island have higher possibility from impendingtsunamis because of their closeness to plate boundaries.
In this work we will employ the probabilistic forecast
of tsunami hazard (PFTH) to analyze the probabilityfor tsunami waves of various heights to hit the citiesalong the Chinese coast in this century. These waves areassumed to be caused by large earthquakes originatingTable 1Historical records of the tsunamis along China coast (Wang and Zhang, 2005
Wave incidence Time
Gulf of Penglai, Bohai April 4, 171Gulf of Laizhou, Bohai July, 173Jiangsu and Zhejiang July 9, 1496Quanzhou, Fujian December 29, 1604Qiantangjiang, Zhejiang October 28, 1707Tainan, Taiwan August 9, 1792Keelong, Taiwan December 18, 1867Keelong, Taiwan July 4, 1917Huangzhou, Fujian February 13, 1918Yantan, Shandong July 13, 1923Huanlien, Ilan, Taiwan November 15, 1986
a Wave height 7.5 m.b Wave height 3.7 m.
etary Interiors 163 (2007) 233–244
from the dangerous Manila Trench. This analysisbecomes evermore crucial because of the sharp increasein the coastal population density in China, and the inten-sive growth of harbors and the exploration of mineralresources in the coastal areas, ranging from Xiamenin the north to Hainan in the south. In this paper wereport our results on tsunami hazards prediction alongthe South China Sea bordering regions from potentialearthquakes coming from the Manila Trench. We hopethis paper will spur greater interest from countriesaround the Pacific Ocean in fundamental research inearthquakes, tectonics and geodetics in this area.
2. Geological and geophysical analysis
The South China Sea (Fig. 1), which lies on thewestern part of the Pacific Ocean, is one of the largestmarginal sea along the continental margin of East Asia,covering an area around 3,500,000 km2, almost as largeas three times that of the Bohai Sea, Yellow Sea andEast China Sea combined together. The South China Sea,along with Taiwan and the Philippines island arc-trenchto its east, constitute a very complex channel-basin struc-tural system. Bordered by the Eurasia continent, Pacificand Indian Ocean, the South China Sea belongs to thetransitional crust between the oceanic and continen-tal crust tectonic zone. Complex geological structuresare reflected in the large-scale mass movement alongthe horizontal directions in this region, which is oftenaccompanied with extensive vertical movement. TheSouth China Sea spreads from the center and subductsalong the Manila Trench (Liu et al., 1988).
The crust of this region is under tremendous tectonicstresses from many directions due to the complex interac-tions among three plates mentioned earlier. As illustratedin Fig. 1, a few deep faults surrounding the South China
)
Epicenter Magnitude
South Sea of Japan ≥8(24.7◦N, 119.0◦E) 7(33.2◦N, 135.9◦E) 8.4(23.6◦N, 120.6◦E) 7(25.25◦N, 122.2◦E) a
(25.0◦N, 123.0◦E) 7.3b
(23.6◦N, 117.3◦E) 7.3(31.0◦N, 130.5◦E) 7.2(24.1◦N, 121.7◦E) 7.6

Y. Liu et al. / Physics of the Earth and Planetary Interiors 163 (2007) 233–244 235
Fig. 1. Major deep faults of the South China Sea and its adjacentregions. (a) North margin fault of the Central Basin of SCS. (b) West-ern margin fault of the Central Basin of SCS. (c) Manila Trench. (d)Nansha trough fault. Figure is adapted from Liu et al. (1988). LT,Luzon trough. Green stars represent the historical seismic tsunamiscct
Stss
tsCTCdsS(ifMoocTotf
this block (Becker et al., 2000). We note that the Manila
atalog from NGDC/NOAA. (For interpretation of the references toolor in this figure legend, the reader is referred to the web version ofhe article.)
ea, including the northern margin of the Central Basin,he western edge fault, the Manila Trench, and the Nan-ha Trough fault (Liu et al., 1988), dominate the crustaltructure and depth distribution.
All these faults divide the region with two differentypes of crusts, continental and oceanic. At the inneride of these faults is the Central Basin of the Southhina Sea, which belongs to oceanic tectonic plate.he northern margin fault (Fig. 1(a)) of the Southhina Sea extends along Northern-East East (NEE)irection. It consists by the northern continental and theouthern transitional crust. The western edge fault of theouth China Sea is located at the east of Pratas IslandsFig. 1(b)). To the west of the fault is Zhongsha, Xishasland slope, which belongs to a transitional crust. Thisault belongs to a class of normal expansion faults. The
anila Trench (Fig. 1(c)) is located at the east boundaryf the Central Basin of South China Sea, in the directionf South–North (SN). The fault is formed by theompressive fault structure with reverse fault motion.o the Northeast of the trench is a transitional crust
f Luzon trough. Along the NE direction, the Nansharough fault (Fig. 1(d)) is formed by the compressiveault structure. Its northern part has a tensile edge, whileFig. 2. Site motions in ITRF96 reference frame derived using GPSobservation campaigns in 1996 (GEODYSSEA) together with thoseextracted with NNR-NU-VEL-1A model.
the western part has a shear edge and the eastern partand southern part are boundaries being compressed.
Based on the history of geological evolution andthe present tectonics of the South China Sea, theManila Trench and the north fault system have been incompression for long time with the Eurasian plate andPhilippines plate.
In order to comprehend the modern stress field of theSouth China Sea, we have pooled various data resourcestogether by including the seismotectonic informationfrom the literature, seismic records (Harvard CMTsolutions), information from global plate reconstructionmodels (NUVEL-1A) and geodetic data (Fig. 2). Thegeodetic data come from the GEODYSSEA (Geody-namics of South and South-East Asia) project, whichhas the working title of the project “Plate motionsand crust deformations deduced from space geodeticmeasurements for the assessment of related naturalhazards in South-East Asia,” with the aim of studyingthe plate motions and long-term crustal deformationin Southeast Asia using a GPS network coveringarea of 4000 km × 4000 km (Wilson et al., 1998). Inthe GEODYSSEA campaign the inferred motion ofthe Sundaland block (Simons et al., 1999), it wascharacterized by using site motions on the stable core of
Trench is predicted in a convergent direction by therelative NUVEL-1A model and/or GEODYSSEA mea-surements motions of the adjoining blocks. According

236 Y. Liu et al. / Physics of the Earth and Plan
Fig. 3. The distribution of seismic focal mechanism of the South ChinaSea and its adjacent regions. The magnitude is ≥6.0. Data derived fromHarvard CMT solutions (1976–2006).
to GEODYSSEA data, the Eurasia plate moves towardthe northwest at nearly 10 mm/year in this region. Whilethe Philippine Sea plate moves from east to west at aspeed of 50 mm/year. These activities indicate that thisis a region with highly active plate motion. As suggestedby Michel et al. (2001), the greatest accumulated defor-mations have been accommodated by seismic faultingalong the Manila Trench according to the geodetic studyby assuming that the geodetic deformation representsthe tectonic loading in the brittle part of the crust.
The analysis of the focal mechanism solutions (Fig. 3)(Harvard CMT solutions) reveals that the stress statesof the Manila Trench and its adjacent region are differ-ent. In the northern part of the Manila Trench, and theadjacent Philippine faults, the focal mechanism solutionsshow the evidence of the compressive-thrusting. On theother hand, in the southern region of the Manila Trench,the stress distribution becomes very complex. Along thetwo sides of western Luzon trough close to the trench,the focal mechanism solutions show an oblique-strikewith normal faulting, and in front of the diving zoneaway from the trench they show a thrusting character.Local seismic focal mechanism solutions also indicatehigh cumulative moment rates from data taken over last30 years in the Manila subduction segments.
According to Zang and Ning (2002)’s research, theeastern boundary of Philippine Sea plate is a con-vergence zone dominated by subduction, where theearthquakes are concentrated. The principal stress field
etary Interiors 163 (2007) 233–244
tensor of this region is nearly along the North-West West(NWW) direction. Subduction of the oceanic crust ofthe Central Basin of South China Sea is reduced in theTaiwan–Philippine island arc region. The majority of theearthquakes are distributed around South Taiwan and thePhilippines, especially along Manila Trench fault andLuzon trough, which is arranged into striped patterns.
However, the present-day earthquakes are not dis-tributed evenly along the plate boundaries and historicalseismic records indicate that the Manila Trench hasbeen highly affected by major earthquakes in the north-western part of Philippines (shown in Fig. 5(a)). Further-more, major earthquakes along the Manila Trench witha higher frequency have also influenced the stress stateof southern Taiwan. Thus the geological evolution, theGPS velocity field, CMT background and seismic distri-bution provide sufficient evidence that is a focussing ofthe potential seismic energy along the Manila Trench.
3. Probabilistic forecast of tsunami and seismichazards
We devise a method called Probabilistic Forecast ofTsunami Hazard (PFTH), which determines this proba-bility distribution by direct numerical simulation of thewaves excited by the earthquakes. Our probabilistic fore-cast of tsunami hazard (PFTH) consists of the followingthree steps:
(1) Probabilistic Forecast of Seismic Hazard (PFSH).The probability and locations of earthquakes areestimated.
(2) Tsunami modeling. For each earthquake predicted,its hydrodynamical influence of the waves reach-ing each coastal location is computed based on theresults of our tsunami wave height simulation withthe Shallow-water equation.
(3) Probabilistic forecast of tsunami hazard (PFTH).The sum of tsunami risks of all possible large earth-quakes provides the statistical risk distribution. Thisanalysis will be discussed in detail in Section 5.
In contrast to the work of Geist and Parsons (2006),which estimated tsunami probability only from earth-quake magnitudes, we have determined the tsunamiprobability by using the wave height at each station bynumerically solving the shallow-water equations. Ourmethod, based on simulations, is different from empir-
ical methods (Geist and Parsons, 2006) and is valuablein areas where these are not to many historical records.In our method, PFSH is conducted by using severalsources. First, the major earthquake occurrence proba-
d Plan
boaqtoPrbisreltcpa
P
wq
r2tqttpiivwt(epbht(
l
wwrl(Nsc
Y. Liu et al. / Physics of the Earth an
ility Pe,i of an earthquake i is estimated on the basisf the Gutenberg–Richter (GR) relationship (Gutenbergnd Richter, 1949), which relates the frequency of earth-uakes with a given magnitude range. Second, to arrive athe probability of the forecast of seismic hazard PPFSH,i,ne needs to multiply the major earthquake probabilitye,i by Poc,i, the probability of these earthquakes occur-
ing in the oceanic area. Third, PPFSH,i is further reducedy probability Psh,i of the oceanic earthquakes occurredn shallow depth (≤10 km) in all of events. And finally,ince the tsunami wave modeling is based on the effect ofupture length being equal to the entire seismic zone, thepicenter decided randomly, the influence of the ruptureength as compare to the whole seismic zone will needo be further reduced by a factor Pf,i. This computationan be expressed by the following Eq. (1) for the jointrobability, which, for the first time, has taken all thebove four sources into account.
PFSH,i = Pe,iPoc,iPsh,iPf,i (1)
here i is the sequential number of the forecasted earth-uakes.
At this point a few words are needed to explain ourationale based on the law of total probability (e.g. Wilks,006) in deducing the joint probability. According to theheory of plate tectonics, large-scale interplated earth-uakes occur near the global subduction zone wherehe potential energy of elastic strains accumulated overens to hundreds of years is released over a very shorteriod of time. In this work, estimated the probabil-ty of the major earthquake with PFSH, we also takento account together the tectonic evolution, the GPSelocity field, and present-day geophysical stress field,hich were analyzed above. For predicting possibility of
he earthquake occurrence, the most common treatmentReiter, 1990) assumes that the frequency of seismicvents follow the Gutenberg–Richter relationship. As ahenomenological tool based for estimating the proba-ilistic analysis of seismic hazrad, the GR relationshipas been widely applied for decades since its introduc-ion in late forties. This relationship can be written asLomnitz, 1974):
ogN = a − bM (2)
here N is the cumulative total number of earthquakeithin a certain period of time for a given magnitude
ang and M is the magnitude of the earthquake in anyinear or intensity scale or the log of seismic moment
Krinitzsky, 1993). The GR relationship also holds whenis the earthquake number for particular regions orpecific time intervals. Parameters a and b are empiricalonstants derived for each region. Determined from the
etary Interiors 163 (2007) 233–244 237
slope of a frequency–magnitude plot, b depends on therelative proportions of small, medium, and large shocks.
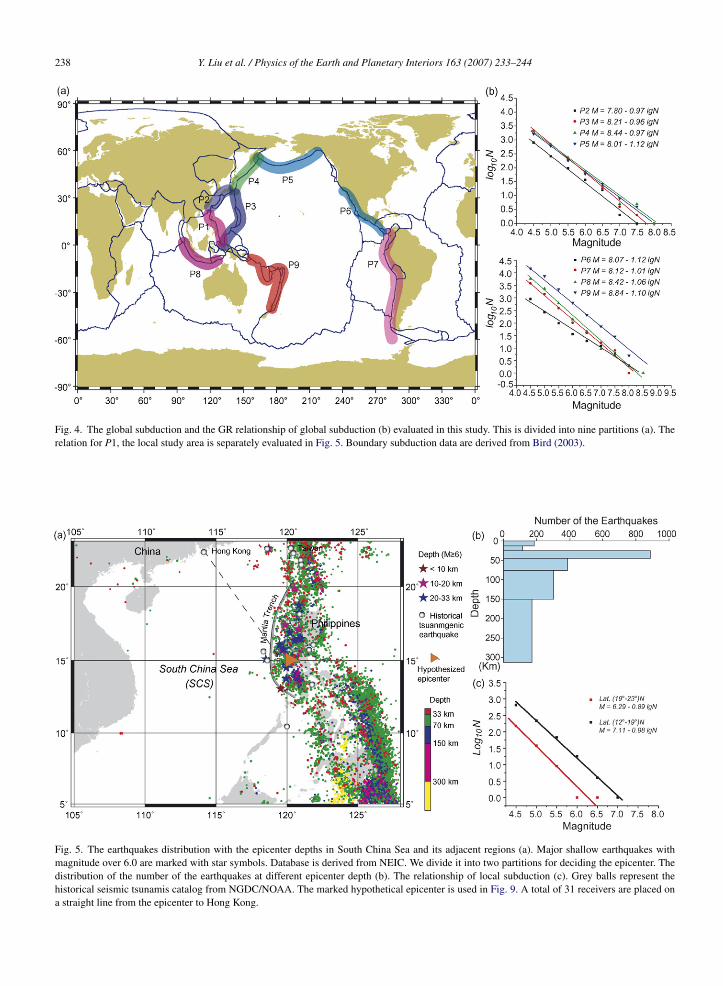
The seismic magnitude frequency data can alsobe well described, as one or more populations, eachof which is normally distributed with respect to themagnitude. This holds true for large earthquakes, whenit is sorted out by global subduction zone with thegeneral USGS, NEIC catalog (Speidel and Mattson,1997). For the PFSH method building, we first studythe GR relationship along the global subduction zone.We have divided the global subduction boundaries intonine regions (Fig. 4(a)). Here we have also employedNEIC database. The GR relationship computation ofeach region verifies the log-linear relationship betweenthe magnitude and the number of events in the history(Fig. 4(b)). Furthermore, our prediction of the earth-quake occurrence probability Pe,i is based on the aboveapproach.
We estimate sequently the probability Pe,i of eachparticular earthquake magnitude, from 6.5 to 8.0, ofthe South China Sea and the adjacent areas based onthe seismic record of the past 30 years in this region.Database is also derived from NEIC. We only considerthe contribution from shallow earthquakes (Psh,i)(Fig. 5(b)) with a depth less than 10 km. Only large-scale shallow earthquake can produce large verticaldisplacement of the seabed and trigger the subsequenttsunami. Here we only consider the major earthquakeswith magnitudes larger than 6.0. According to theearthquake distribution, focal mechanism solutions andthe tectonic structure of these regions, we partitionthe South China Sea and its adjacent regions into twoparts in order to locate the position of the epicenter ofearthquakes used for tsunami modeling. Earthquakesin each part all satisfy the local statistical distributionof the GR relationship (Fig. 5(c)). Because we cannotaccurately decide the epicenter for tsunami modeling,we must take account that every fault takes a portion ofeach seismic zone. This probability is expressed as Pf,i.The fault size or the surface rupture length is linearlyrelated to earthquake magnitude distribution (Wells andCoppersmith, 1994; Bonilla et al., 1984).
4. Numerical modeling potential tsunami sources
To estimate the near-field tsunami potential hazard forthe South China Sea, the linear shallow water equation isapplied to describe tsunami generation and subsequent
wave propagation. Our model does not include the run-up stage.The initial wave of the linear shallow-water waveequation is computed according to Okada’s elastic solu-
238 Y. Liu et al. / Physics of the Earth and Planetary Interiors 163 (2007) 233–244
Fig. 4. The global subduction and the GR relationship of global subduction (b) evaluated in this study. This is divided into nine partitions (a). Therelation for P1, the local study area is separately evaluated in Fig. 5. Boundary subduction data are derived from Bird (2003).
Fig. 5. The earthquakes distribution with the epicenter depths in South China Sea and its adjacent regions (a). Major shallow earthquakes withmagnitude over 6.0 are marked with star symbols. Database is derived from NEIC. We divide it into two partitions for deciding the epicenter. Thedistribution of the number of the earthquakes at different epicenter depth (b). The relationship of local subduction (c). Grey balls represent thehistorical seismic tsunamis catalog from NGDC/NOAA. The marked hypothetical epicenter is used in Fig. 9. A total of 31 receivers are placed ona straight line from the epicenter to Hong Kong.
d Plan
tcfrfn
ddiofdSoetdma
(arbadaaes
f4SrCCtie
whdht
pU
Y. Liu et al. / Physics of the Earth an
ion (Okada, 1985), which predicts the water levelhanges with numerical integration. A model with a 2Dault embedded in an elastic half-space was adopted toepresent major faults of the seismic origin to be usedor the tsunami waves induced by an earthquake. Theumber of earthquakes is computed according to PFSH.
Taken the historical seismic records into account, weivide the computation area into five zones (Fig. 3). Asiscussed in the previous Section 2, the Manila Trenchs the region with the highest possibility for the tsunamiccurrence of tsunamogenic earthquakes. We establishour earthquake regions in this area. Since there are alsoeep faults in the northwestern part of the South Chinaea Basin with a history of tsunamogenic earthquakes,ne earthquake region is also placed in this area. Withinach of the five zones, the earthquakes are sampled withhe epicenter randomized according to a modified GRistribution. For the characteristic model, the earthquakeagnitudes are defined between the magnitudes of 6.5
nd 8.0, with an interval of 0.5.In the seismic rupture models, source parameters
rupture length L, width W, and the average slip D)re derived from both the theoretical and empiricalelationship (Wells and Coppersmith, 1994) which haseen widely applied. The fault planes were chosen inccordance with the seismotectonic situation. The faultips and strikes from the composite fault plane solutionsre used as the average dip of the fault segmentsccording to the HCMT catalog. The rupture area ofach earthquake does not extend outside individualeismic zone in our modeling.
The average depth of the South China Sea field isrom 4 to 5 km. The depth of Manila Trench is around.8–4.9 km and reaches the deepest point of 5.4 km.ince the shallow water region is relatively narrow in thisegion, we employ the linear shallow-water theory in theartesian system. Due to the lower latitude of the Southhina Sea, and the short distance involved, we neglect
he Coriolis effect. We have ignored the bottom frictionn the computation. The following linear shallow-waterquations are applied in our modeling (Goto et al., 1997):
∂η
∂t+ ∂M
∂x+ ∂N
∂y= 0,
∂M
∂t+ gh
∂η
∂x= 0 (3)
here η is sea level displacement, t time, x and y areorizontal coordinates along the zonal and meridionalirections, respectively, M and N discharge fluxes in theorizontal plane along x and y coordinates, h(x,y) unper-
urbed basin depth, and g is the gravity acceleration.In our numerical simulations, we use the tsunamiropagation model Tunami-N1, developed in Tohokuniversity (Japan) and which is provided through the
etary Interiors 163 (2007) 233–244 239
Tsunami Inundation Modeling Exchange (TIME) pro-gram (Goto et al., 1997). The model solves the governingequations by a finite difference technique with the leap-frog scheme (Goto et al., 1997). We use open boundarycondition in the model, which permits free outwardpassage of the wave at the open sea boundaries. Thebathymetry of the South China Sea was obtained fromthe Smith and Sandwell’s model of global seafloor topog-raphy (Etopo2) with a grid resolution of around 3.8 km.The total number of grid points in the computationaldomain is 361,201, which is 601 × 601 points. The timestep is selected as 1.0 s to satisfy the temporal stabilitycondition. The duration time of wave propagation is 6 hin our simulations.
5. Probabilistic forecast of tsunami hazard
We use computational methods similar to PFSH todevelop our probabilistic forecast of the tsunami hazard(PFTH). The probabilistic risk of tsunami is estimatedby a combination of large earthquake occurrence proba-bility and the numerical simulation results from tsunamiwave propagation:
PPFTH(x, y, h) =m∑
i=1
PPFSH,i{max(f (x, y), t)} (4)
where PPFTH is the probability of a particular wave height(h) of tsunami in the position x,y along the coast. x,y arethe latitude and longitude of the receivers. PPFSH,i is theprobability of attaining a maximum wave height fromeach tsunamogenic earthquake. It is derived from PFSH,which is Eq. (1). i is the index of the earthquakes. Herem, the number of earthquakes, is 13. f(x,y) is the waveheight of tsunami. t is the time of wave propagation.In this work, the range of t is from 0.0 to 6.0 h. Thiscase provides an method of how the cumulative or jointprobability can be calculated for the spatial variability inthe probability pattern.
For local tsunamis hazard analysis, we first exam-ine a scenario in which the inter-plate thrust along theManila subduction zone and the north-western part faultsof the South China Sea (Fig. 3). To estimate preciselythe probability of tsunami hazards around the SouthChina Sea, 13 seismic tsunami models with magni-tudes ranging from 6.5 to 8.0 are computed in fivehypothetical epicenters (Fig. 3). Snapshots of a singlesimulated tsunami wave propagation are shown in Fig. 6.
This hypothetical seismic event occurs southwest to thePhilippines (14.5◦N, 119.2◦E), with a magnitude of 7.5.Tsunamis occurring at this location are furthest from themainland Chinese coast. Due to the relatively long prop-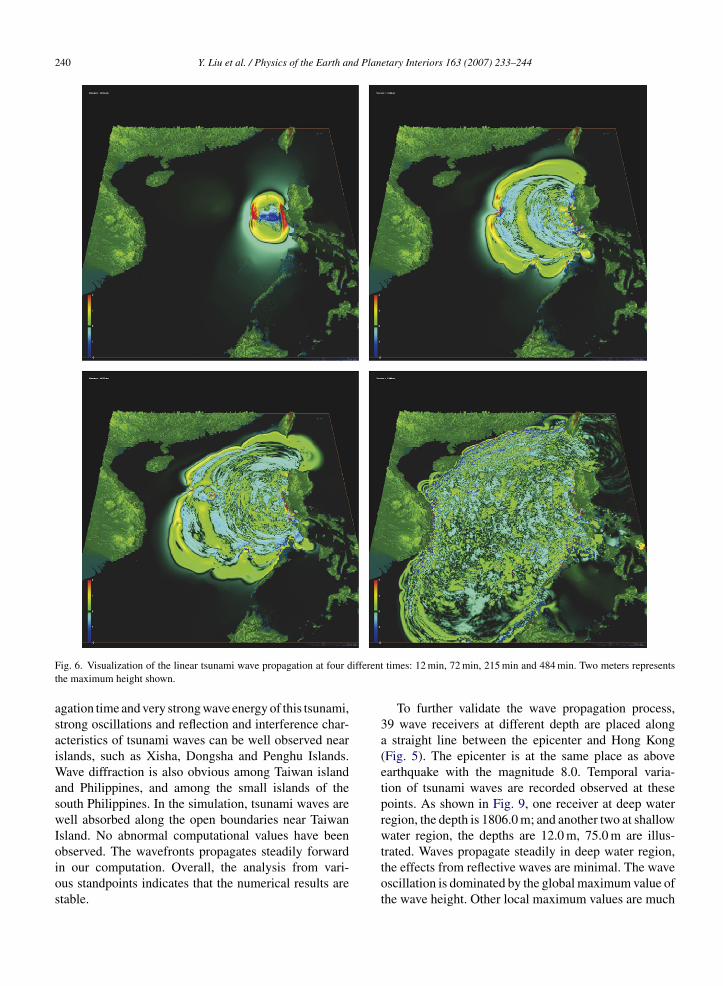
240 Y. Liu et al. / Physics of the Earth and Planetary Interiors 163 (2007) 233–244
ifferen
Fig. 6. Visualization of the linear tsunami wave propagation at four dthe maximum height shown.agation time and very strong wave energy of this tsunami,strong oscillations and reflection and interference char-acteristics of tsunami waves can be well observed nearislands, such as Xisha, Dongsha and Penghu Islands.Wave diffraction is also obvious among Taiwan islandand Philippines, and among the small islands of thesouth Philippines. In the simulation, tsunami waves arewell absorbed along the open boundaries near TaiwanIsland. No abnormal computational values have been
observed. The wavefronts propagates steadily forwardin our computation. Overall, the analysis from vari-ous standpoints indicates that the numerical results arestable.t times: 12 min, 72 min, 215 min and 484 min. Two meters represents
To further validate the wave propagation process,39 wave receivers at different depth are placed alonga straight line between the epicenter and Hong Kong(Fig. 5). The epicenter is at the same place as aboveearthquake with the magnitude 8.0. Temporal varia-tion of tsunami waves are recorded observed at thesepoints. As shown in Fig. 9, one receiver at deep waterregion, the depth is 1806.0 m; and another two at shallowwater region, the depths are 12.0 m, 75.0 m are illus-
trated. Waves propagate steadily in deep water region,the effects from reflective waves are minimal. The waveoscillation is dominated by the global maximum value ofthe wave height. Other local maximum values are much
d Planetary Interiors 163 (2007) 233–244 241
sfmg
tTmfiitso(dStiTttcTKqCpat
Table 2The tsunami hazard probabilities of major cities along China Coast inthe next 100 years (the cumulative column comes from the sum of thefirst two columns)
City Probability in this century
Wave height Cumulative probability(≥1 m (%))
>2 m (%) 1–2 m (%)
Shantou 13.34 30.65 43.99Xiamen 0.00 0.00 0.00Hong Kong 10.12 17.19 27.31Macau 10.12 17.19 27.31Haikou 0.00 0.00 0.00Sanya 0.00 3.44 3.44Taitung 0.00 0.00 0.00
Y. Liu et al. / Physics of the Earth an
maller. In the shallow water regions, due to the inter-erence with reflected waves, the magnitudes of all localaximum wave height values are comparable with the
lobal maximum value.Altogether 56 coastal receiver points are placed along
he mainland coast of the South China Sea, Hainan, andaiwan Island. For each coastal receiver, the tsunamiaximum positive amplitudes are recorded over a suf-ciently long amount of time. Our PPFTH computation
s based on the maximum wave height of all seismicsunami together with the occurrence probability of eachynthesized tsunami. Two tsunami wave height regionf [1.0 m, 2.0 m] (Fig. 8(b)) and heights over 2.0 mFig. 8(a)) are considered for our tsunami hazard pre-iction. Along the south-eastern coast of mainland andouthwestern Taiwan, in Fig. 8(a), we show the distribu-
ion for above 2.0 m high tsunami wave hitting. Shownn Fig. 8(b), the same place, together with south-easternaiwan, also have a potential chance be beaten with
sunami hazard for 1.0–2.0 m. The computed results ofsunami hazard probability in the next 100 years of majorities along the coast of mainland China are shown in theable 2. The cities (Fig. 7) of Shantou, Xiamen and Hongong are under direct impact from the tsunami earth-uakes originated from the central basin of the South
hina Sea, the southwest and northwest of the Philip-ines. The tsunami-risk probabilities of these three citiesre high, around 10%. Tainan, Kaoxiong and Nawan,hree major cities of Taiwan Island are directly affectedFig. 7. Major cities along the S
Tainan 3.44 17.19 20.63Kaoxiong 3.44 17.19 20.63Nanwan 3.44 17.19 20.63
by the tsunami occurred in the western part of the cen-tral basin of the South China Sea and the north ManilaTrench. However, the historical seismic records showthat the earthquake with a magnitude higher than 7.0 arerare in the oceanic area close to Taiwan, the probabilityof tsunami wave height higher than 2.0 m in this century(3.44%) in these regions are lower than that in the Hong
Kong region (≥10%).The tsunami hazard probability along the Coast ofthe South China Sea is plotted in Fig. 8. As shown inthis figures, from Shantou to Hong Kong, Macau, the
outh China Sea coast.

242 Y. Liu et al. / Physics of the Earth and Planetary Interiors 163 (2007) 233–244
he Chin
Fig. 8. The spatial distribution of tsunami wave height impinging on tfor the wave height lies between 1.0 and 2.0 m.southwest portion of Taiwan island, the east Hainanisland are all in harm’s way from tsunamis with waveheights more than 2.0 m tall.
6. Discussion and summary
In this section, we discuss first the validity of thelinear model. The relationship of our simplified simu-lation resulting from a single shock and probability ofdisaster occurrence in complex realistic scenarios is alsoexplained. In addition, effects of specific characteristicsof various regions on tsunami hazards are considered.
The South China Sea is an ideal area for conductingsimulations of tsunami, waves with a linear model. Whilethe water depth in this area varies from 7000 m to around10 m, over three-fourth of this area is deeper than 500 m,and the shallow water region is narrow. To further val-idate the linear model, a simulation based on nonlinearmodel is conducted in a region in South China Sea. Theepicenter selected is near the southwest of Manila Trenchwith a magnitude of 8.0. Receivers are also placed alongthe line (Fig. 5) between Hong Kong and the epicenterto validate the wave propagation. In Fig. 9, we comparethe wave propagation computed between the linear andnonlinear models. We consider the seabed friction in thenonlinear model. For estimating bottom friction easily,the Manning roughness n replaces the friction with therelationship between f and n (Goto et al., 1997). In ournonlinear model, the value n = 0.025 is suitable for thenatural channels in good condition which is valid forthe South China Sea regions. It has been found in our
simulation that there is one critical region between 400and 500 m depth (Liu et al., 2007). For the deeper seas,both linear and nonlinear models generate similar waveshapes and wave magnitudes. With the ratio of waveese coast. (a) The case where the wave height is taller than 2.0 m; (b)
height to water depth smaller than 0.01, wave propaga-tion can be modeled by linear theory with reasonableaccuracy. Otherwise, the nonlinear model is necessaryfor shallow depths (see top two panels in Fig. 9). Weselect four receivers (Fig. 9) at different water depths.At the water depth of 1806 m, the temporal variationsof the wave recorded are almost identical between boththe linear and nonlinear variations. The maximum waveheights at depth of 12 and 75 m are also identical for bothcases. However, differences can be observed for otherlocal maximum values in the sequential wave propaga-tion. Due to the prevalence of deep regions in the SouthChina Sea, we expect the linear model to perform well.
To make sure the results from our linear model arevalid, numerical simulations have been conducted withnonlinear model in all 13 tsunami events. With the non-linear model, the probability is the same for the sametsunami wave height at near-coast ocean at Hong Kongand Macau, and Kaoxiong, is 10.12%, while a lowerprobability at near-coast ocean at Shantou of 10.12% isfound with more than 2.0 m to hit within the next 100years, compares to 13.34% in the linear model. In gen-eral, the PFTH for most coastal cities would not changewith the usage of nonlinear theory.
Our simulation considers the consequent result fromthe coseismic generation of the wave by a single shock.Thus a single large wave in the epicentral zone is selectedas the initial input for the wave simulation. In reality, therupture of an earthquake is not simple. The actual gen-erated waves do not come from the wave due to onesingle shock. During the earthquake occurrence, waves
are propagated outwards in the form of wavelets by thecontinuous rupture dynamics. The constructive combi-nation of the original waves and the following waves ofa tsunami could generate even more dangerous hazard.
Y. Liu et al. / Physics of the Earth and Planetary Interiors 163 (2007) 233–244 243
F l at h =p
Bo
SctrwtcpC
iiscMttvic
ig. 9. The temporal variation of the wave height of the linear modelotted).
ased on these facts, our modeling provides an estimatef the lower bound of the hazard possibilities.
The geological and geophysical backgrounds ofouth China Sea and its adjacent areas are extremelyomplex. Much effort has been devoted to the research ofhis region. Literature of historical seismic records of thisegion is also abundant. Tsunamis occurring at the south-est of Taiwan and Hong Kong have been recorded in
he ancient Chinese literature and modern global tsunamiatalogues, the largest earthquake occurred at the northart of Manila Trench and the northeast part of the Southhina Sea has the magnitude around 7.0.
Although the magnitude of this recorded earthquakes only moderately high, considering its proximity to thesland of Taiwan, and the coast of Fujian and Guangdong,uch a earthquake would very likely cause a tsunamiatastrophe. The region between the north part of theanila Trench near Taiwan is also the boundary between
he Eurasia plate and the Philippine Plate with a plate
ransitional boundary belt. This region is likely to have aery large earthquake in the future. In addition the regions a volcanic belt. If volcano and earthquake occur inoncert, a much larger tsunami disaster would develop.12 m, 75 m, 534 m, and 1806 m (Only the results of the first 4 h are
Although the southern part of the Manila Trench isfar away from the coast of China, the local historicalrecords of this region have many tsunami earthquakesup to the magnitude of around 8.0. Since the oceanicportion of the South China Sea is mostly deep, tsunamicwave generated in the Manila Trench region can reach thecoast of China with little loss in energy. The wave energycan then be released in the shallow water region, andcan impose a tremendous tsunami hazard to the coastalregions.
7. Conclusion
The recent pair of earthquakes off the coast of south-ern Taiwan has forced us to consider more deeply aboutthe possibilities of tsunamis impinging on the coast-line of the South China Sea and to develop a simplifiedprobabilistic forecast model. The USGS working group(Kirby et al., 2005) have already met and characterized
the western Pacific subduction zones relevant to poten-tial tsunami sources. They also recognized the potentialdanger coming from the Manila Trench, i.e., the Luzontrough, facing the South China Sea, which might have
d Plan
244 Y. Liu et al. / Physics of the Earth anbeen overlooked in the past. More systematic work isneeded in collecting more historical records, seismo-logical and geodetic data, which will allow a betterassessment of the stress build-up in this region and thepotential occurrence of a large-scale earthquake exceed-ing magnitude 8.5. We have carried out a comparisonof linear and nonlinear predictions of tsunami wavepropagation across the South China Sea. Our analysisshows that we can apply linear theory to a adequateaccuracy in this region. This finding would allow amuch quicker earlier warning to be issued, since thelinear calculations can be done on laptop computers innearly real time. The same usage of linear theory forthe probabilistic forecast may not hold for the YellowSea region because of its much shallower depth andwe are carrying out work with the nonlinear model.Finally, this work will hopefully alert people in HongKong, Macau and other coastal cities around the SouthChina Sea to the potential hazard of tsunamis comingfrom the Manila Trench. The probability for this devas-tating scenario of a 2.0 m wave hitting Hong Kong orMacau is around 10% for this century. This probabilityestimate may increase with a recent rise in the earth-quake activities, which started with the 1999 Chi-Chiearthquake, because the Taiwan region has a earth-quake cycle time of around 80–100 years (Lee et al.,2003).
Acknowledgments
We would like to thank Professor Fumihiko Imamurafor his providing computational codes TUNAMI N1 andTUNAMI N2, and his kind guidance on tsunami numer-ical method. We would also like to thank Motoyuki Kidoand Xiaoru Yuan for their help in preparing this paper.We also thank Willie Lee for discussions. This researchis supported by National Natural Science Foundationof China (NSFC-40574021, 40676039, kzcx2-yw-203-01) and the EAR program of the U.S. National ScienceFoundation.
References
Becker, M., Reinhart, E., Nordin, S.B., Angermann, D., Michel, G.,
Reigber, C., 2000. Improving the velocity field in South and South-East Asia: the third round of GEODYSSEA. Earth Planets Space52, 721–726.Bird, P., 2003. An updated digital model of plate boundaries. Geochem.Geophys. Geosyst. 4 (3), 1027.
etary Interiors 163 (2007) 233–244
Bonilla, M., Mark, R., Lienkaemper, J., 1984. Statistical relationsamong earthquake magnitude, surface rupture, and surface faultdisplacement. Bull. Seismol. Soc. Am. 69, 2003–2024.
Fukao, Y., 1979. Tsunami earthquakes and subduction processes neardeep-sea trenches. J. Geophys. Res. 84, 2303–2314.
Geist, E.L., Parsons, T., 2006. Probabilistic analysis of tsunami haz-ards. Natural Hazards 37, 277–314.
Goto, C., Ogawa, Y., Shuto, N., Imamura, N. 1997. Numerical methodof tsunami simulation with the leap-frog scheme. IUGG/IOC TimeProject. IOC Manual, UNESCO 35.
Gutenberg, B., Richter, C.F., 1949. Seismicity of the Earth and Asso-ciated Phenomena. Princeton University Press, Princeton.
Kirby, S., Geist, E., Lee, W.H., Scholl, D., Blakely, R., October 2005.Tsunami source characterization for western Pacific subductionzones: a perliminary report. Report, USGS Tsunami SubductionSource Working Group.
Krinitzsky, E., 1993. Earthquake probability in engineering—Part 2:Earthquake recurrence and limitations of Gutenberg Richter b val-ues for the engineering of critical structures. Eng. Geol. 36, 1–52.
Lee, W., Kanamori, H., Jenning, P., Kisslinger, C., 2003. InternationalHandbook of Earthquake and Engineering Seismology, Part A.Elsevier, Amsteram.
Liu, Y., Shi, Y., Liu, H., Wang, S.M., Yuen, D.A., May, Xing, H.L.,2007. Can tsunami waves in the South China Sea be modeled withlinear theory? In: Submitted to The International Conference onComputational Science (ICCS), Beijing.
Liu, Z., Yang, S., Chen, S., Liu, Y. (Eds.), 1988. South China Sea Geol-ogy Tectonic and Continental Margin Extension. Science Press,Beijing (in Chinese).
Lomnitz, C., 1974. Global Tectonics and Earthquake Risk. Elsevier,Amsterdam.
Michel, G.W., Becker, M., Reigber, C., Tibi, R., Yu, Y.Q., Zhu, S.Y.,2001. Regional GPS data confirm high strain accumulation prior to2000 June 4 Mw = 7.8 earthquake at south east Sumatra. Geophys.J. Int. 146, 71–582.
Okada, Y., 1985. Surface deformation due to shear and tensile faultsin a half-space. Bull. Seism. Soc. Am. 75, 1135–1154.
Reiter, L., 1990. Earthquake Hazard Analysis: Issues and Insights.Columbia University Press, New York.
Simons, W.J.F., Ambrosius, B.A.C., Nomen, R., 1999. Plate motionsin South-East Asia: results of the GEODYSSEA project. Geophys.Res. Lett. 26, 2081–2084.
Speidel, D.H., Mattson, P.H., 1997. Problems for probabilistic seismichazard analysis. Natural Hazards 16, 165–179.
Wang, F., Zhang, Z.-Q., 2005. Earthquake tsunami record in Chineseancient books. Chin. Earthquakes 21 (3), p. 09.
Wells, D., Coppersmith, K., 1994. New empirical relationships amongmagnitude, rupture length, rupture area, and surface displacement.Bull. Seismol. Soc. Am. 84, 974–1002.
Wilks, D.S., 2006. Statistical Methods in the Atmospheric Sciences,second ed. Academic Press, Amsterdam.
Wilson, P., Rais, J., Reigber, C., et al., 1998. The GEODYSSEA project:
an investigation of the geology and geodynamics of South andSouth-East Asia. EOS Trans. Am. Geophys. Union 79, 548–549.Zang, S., Ning, J., 2002. Interaction between Philippine Sea Plate (PH)and Eurasia (EU) Plate and its influence on the movment easternAsia. Chin. J. Geophys. 45 (01), 188–197.


![Resilience to natural hazards: a geographic perspectivegeogother.bnu.edu.cn/teacherweb/wangjingai/chinese/dbz/[1][1... · Resilience to natural hazards: a geographic perspective](https://img.pdfslide.net/doc/110x75/5b151e2f7f8b9a201a8d9918/resilience-to-natural-hazards-a-geographic-11-resilience-to-natural-hazards.jpg)