Embed Size (px)
Citation preview
DRAFT REPORT
SEA LEVEL AND EXTREME WATER LEVEL ANALYSIS
BERNARDO SHORES, IMPERIAL BEACH, CALIFORNIA
by
Hany Elwany, Ph.D. Coastal Environments, Inc.
for
Integral Communities
2235 Encinitas Blvd., Suite 216 Encinitas, California 92024
COASTAL ENVIRONMENTS, INC. 2166 Avenida de la Playa, Suite E
La Jolla, CA 92037
Updated 3 September 2014 CE Reference No. 13-07
Sea Level and Extreme Water Level Analysis Bernardo Shores, Imperial Beach, California
Coastal Environments i Technical Report CE Reference No. 13-07
TABLE OF CONTENTS
1.0 INTRODUCTION .............................................................................................................. 1
2.0 TIDES AND CURRENT SEA LEVEL RISE IN SAN DIEGO ...................................... 10
3.0 PROJECTION OF SEA LEVEL RISE............................................................................. 15 3.1 SEA LEVEL RISE PROJECTION METHODS .................................................. 15 3.2 PROJECTED GLOBAL SEA LEVEL RISE (IPCC, 2007) ................................. 16 3.3 PROJECTED SEA LEVEL RISE AT SAN DIEGO ............................................ 17
3.3.1 National Research Council ....................................................................... 17 3.3.2 California Energy Commission’s California Climate Change Center ...... 18 3.3.3 Sea Level Rise Adaption Study for San Diego Bay ................................. 18 3.3.4 Published Papers ....................................................................................... 19
3.3.4 SLR Projections Utilized by State and Federal Agencies ......................... 19 3.4 SUMMARY .......................................................................................................... 20
4.0 WATER LEVEL MEASUREMENTS AT PONDS 10A AND 11 .................................. 24 4.1 THE MEASUREMENTS ..................................................................................... 24
5.0 DESIGN WATER LEVEL ............................................................................................... 28
6.0 SUMMARY AND CONCLUSIONS ............................................................................... 29
7.0 REFERENCES ................................................................................................................. 30
LIST OF FIGURES
Figure 1-1. Map showing the location of the Bernardo Shores project area ..............................3 Figure 1-2. Topography of the Bernardo Shores project area and Pond 10A ............................4 Figure 1-3. Aerial view of the Western Salt Ponds post restoration and breaching of
levees........................................................................................................................5 Figure 1-4. Map showing Pond 10A with respect to the Bernardo Shores project area.............6 Figure 1-5. Habitat classifications at Pond 10A .........................................................................7 Figure 2-1. Comparison between yearly mean sea level measurements (ft) at La Jolla
and San Diego Bay.................................................................................................12 Figure 2-2. Yearly highest water level (ft) at San Diego Bay ..................................................13 Figure 2-3. Yearly mean of sea level (ft) at San Diego Bay from 1906 to 2012 ......................14 Figure 2-4. Yearly highest water of sea level (ft) at San Diego Bay from 1906 to 2012 .........14 Figure 4-1. Location of pressure sensors at Pond 10A .............................................................25 Figure 4-2. Time-series plot of water level elevations at Stations S1 and S2 and tidal
station 9410170 located near the entrance to San Diego Bay ................................26 Figure 4-3. Best-fit line between high water at Station S2 vs. tidal station 9410170 ..............27
LIST OF TABLES Table 3-1. IPCC global projections of sea level rise by 2090-2099 for various
scenarios .................................................................................................................21
Sea Level and Extreme Water Level Analysis Bernardo Shores, Imperial Beach, California
Coastal Environments ii Technical Report CE Reference No. 13-07
Table 3-2. NRC Committee’s sea level rise projections for the U.S. Pacific Coast ...............21 Table 3-3. Sea level rise projections utilized by California State and federal agencies..........22 Table 3-4. Summary of sea level rise projections ...................................................................23
LIST OF PHOTOGRAPHS
Photo 1-1 Photograph showing the headwall, the culverts, and the bike path at Pond
10A, looking east .....................................................................................................8 Photo 1-2 Photograph showing the 2 ft concrete wall that separates the project area
from Pond 10A .........................................................................................................9

Sea Level and Extreme Water Level Analysis Bernardo Shores, Imperial Beach, California
Coastal Environments 1 Technical Report CE Reference No. 13-07
BERNARDO SHORES, IMPERIAL BEACH, CALIFORNIA SEA LEVEL AND EXTREME WATER LEVEL ANALYSIS
1.0 INTRODUCTION
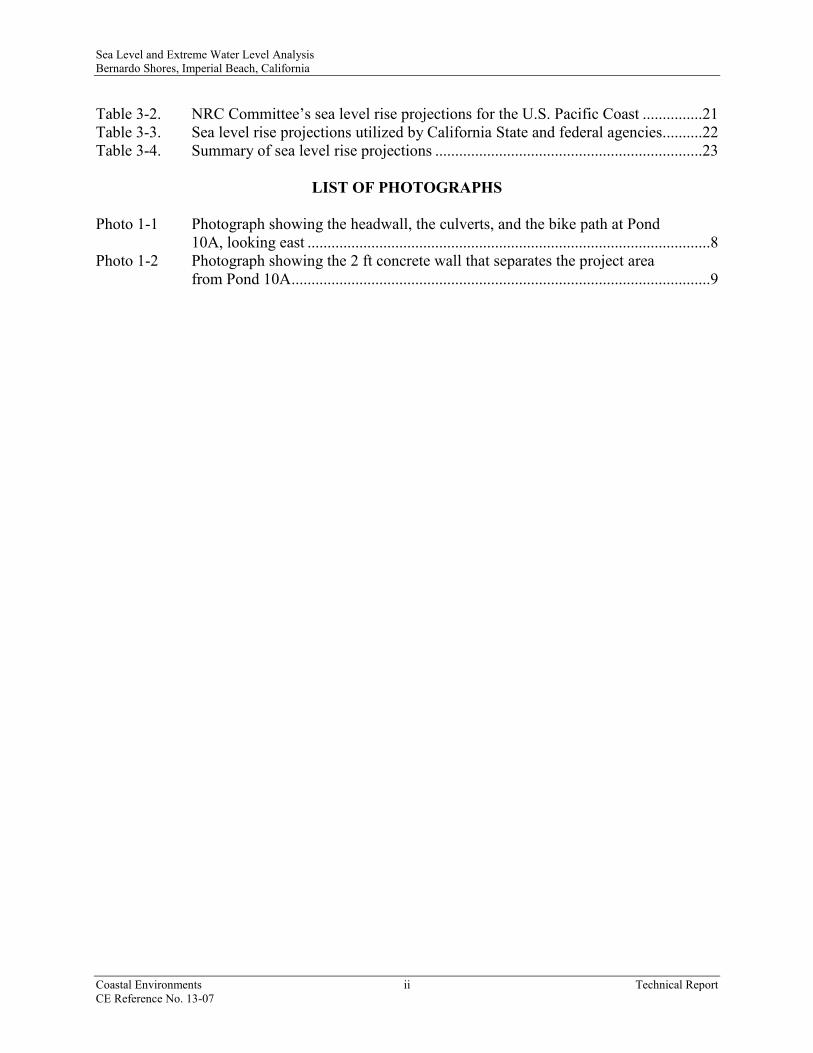
The purpose of this study is to evaluate the Bernardo Shores project site with regard to
seawater inundation from rising sea level in the near and far future (50 to 100 years). Figure 1-1
shows the location of the project area.
The approach to the study was: 1) to examine the historical sea level records for
San Diego that date back to 1906; 2) to review the latest publications regarding future sea level
rise rates (SLR); and 3) to carry out water level measurements near the property to estimate tidal
muting at the project site. Tidal records at San Diego were useful because they cover a long
period of time, and they integrate factors such as storm surge that may cause inundation into a
single measurement, referred to as sea level elevation. These data were used to estimate current
SLR. The topographic data for the project site was utilized to make site-specific conclusions
regarding inundation.
The Bernardo Shores project site is located on the northern edge of Imperial Beach on the
shore of the most southwesterly portion of San Diego Bay (Figure 1-1). The project is located
within a triangular piece of property bounded by State Route 75 (Silver Strand Blvd) to the west,
7th Street to the east, and south San Diego Bay to the north. The property is currently occupied
by a RV park, and the proposed development involves clearing the 8.9-acre property of all
structures, grading, and then constructing 175 condominium units and amenities. The project
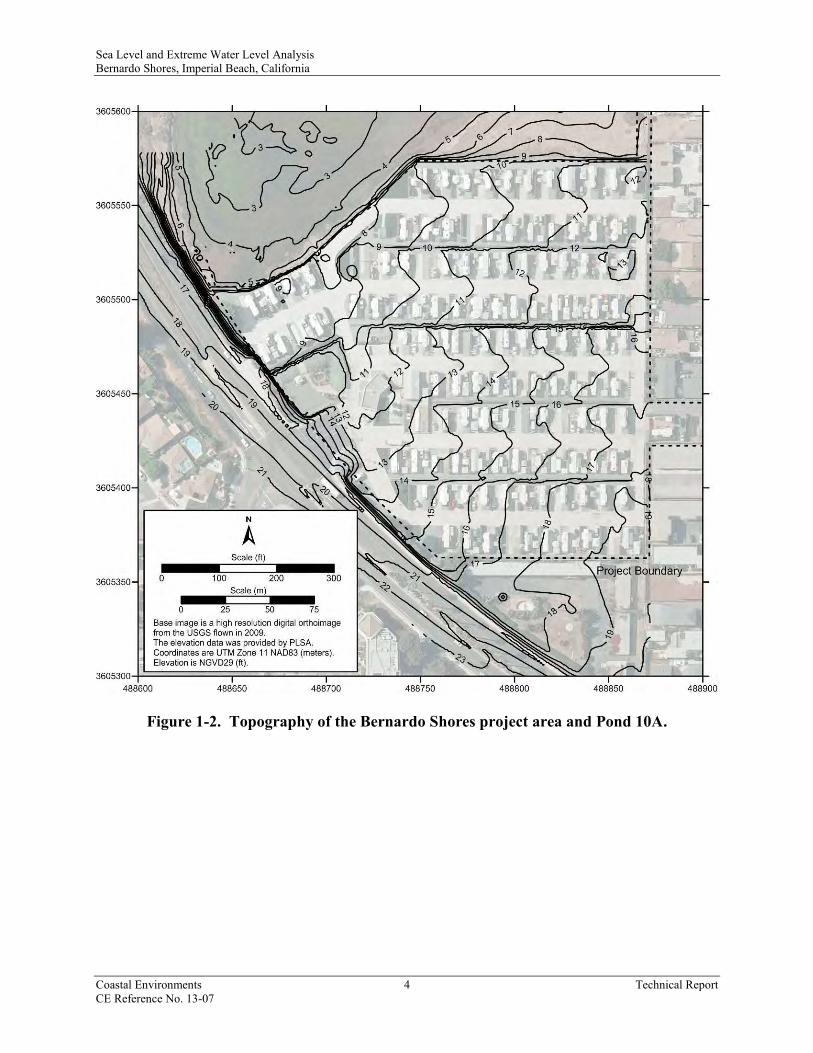
site slopes down to the bay from an elevation of 19 feet at the southeastern corner of the property
to 7 feet at the northwestern portion of the property. State Route 75., which bounds the
southwestern side of the property, is elevated from the low end of the property by about 10 ft to
the north at about 17 ft, NGVD, and by about 4 ft to the south (Figure 1-2).
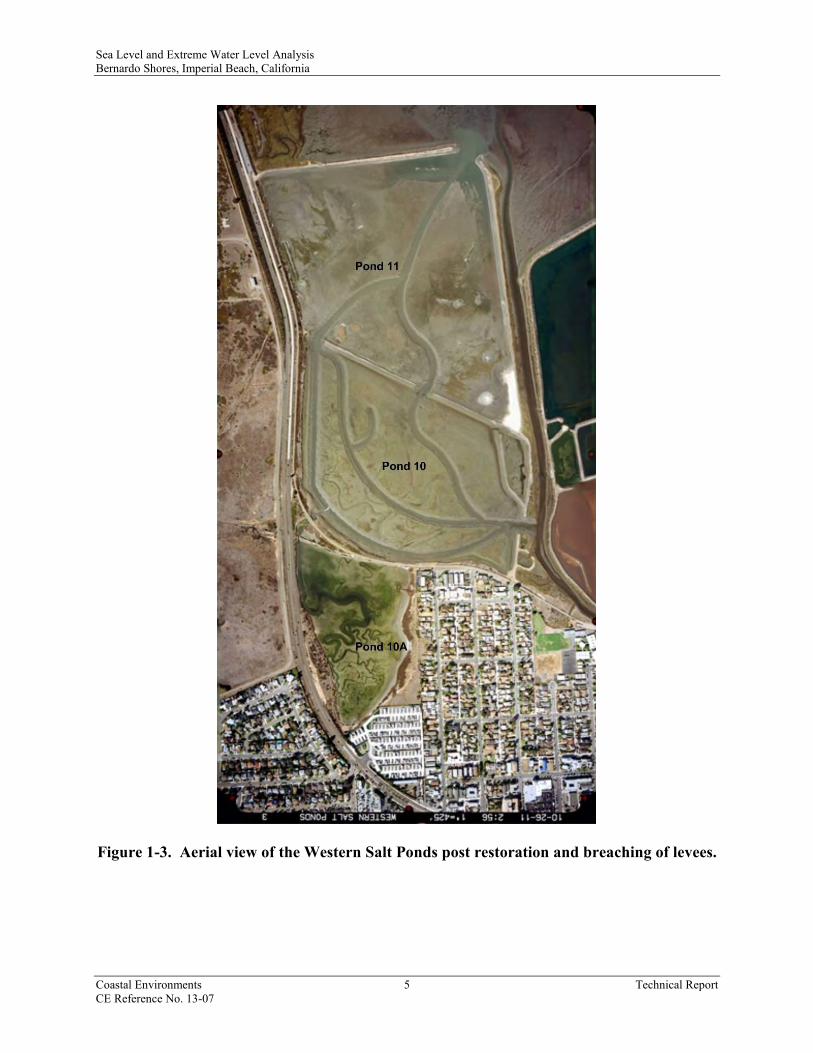
The shoreline of this property is located in a portion of south San Diego Bay that have
been utilized as salt ponds (Ponds 10A, 10, and 11) for over 50 years (Figure 1-3). These salt

Sea Level and Extreme Water Level Analysis Bernardo Shores, Imperial Beach, California
Coastal Environments 2 Technical Report CE Reference No. 13-07
ponds were shut off from tidal flows by a series of levies, and water flow was controlled via
channels and gates. In 2011, the South San Diego Bay Coastal Wetlands Restoration and
Enhancement Project, in particular, the Western Salt Pond Restoration Project, opened up 223
acres (USFWS, 2009), including the pond adjacent to the property (Pond 10A), to tidal flow
(Figure 1-4). Pond 10A is approximately 32 acres, and consists of open water, tidal, and high,
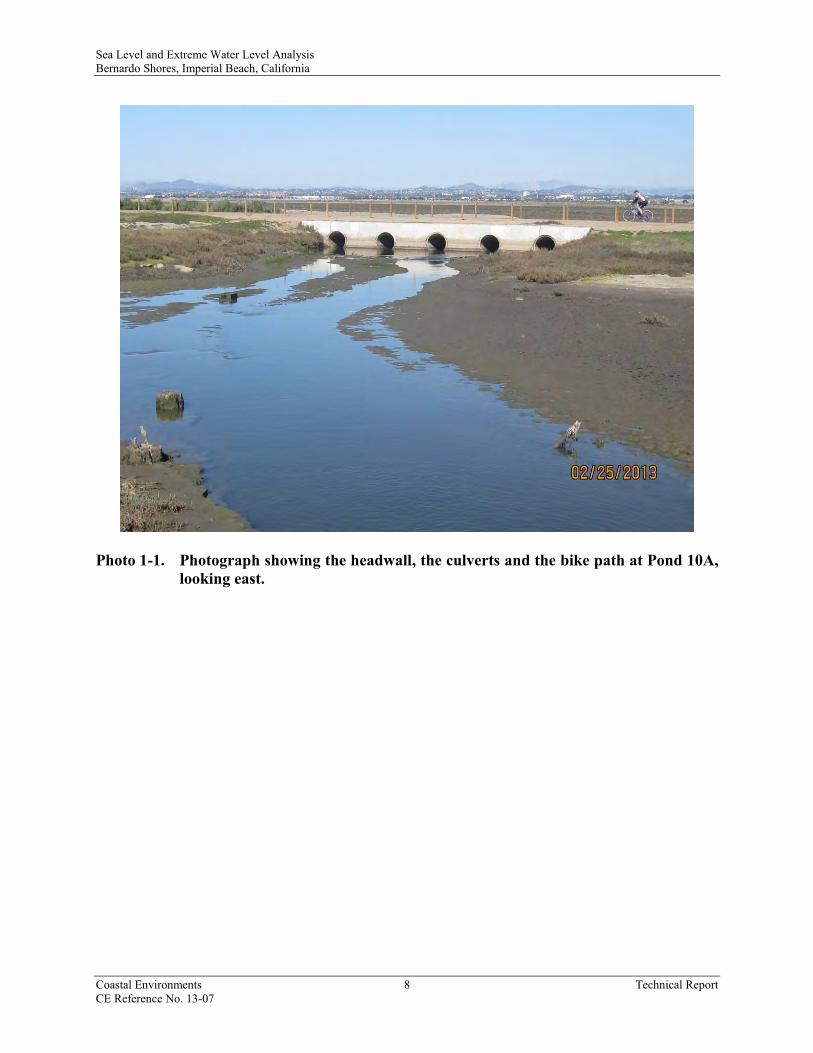
medium, and low marsh habitats (Figure 1-5). This Pond is bounded to the north by Bayshore
Bikeway (which was constructed on top of the historic levee that separated Pond 10A from Pond
10). Tidal exchange is restricted to five 3.5-ft diameter culverts that pass through the bikeway
(Photo 1-1). The water level measurements taken during this study also show tidal muting from
the open bay to Pond 10A during both high and low tides (Chapter 4).
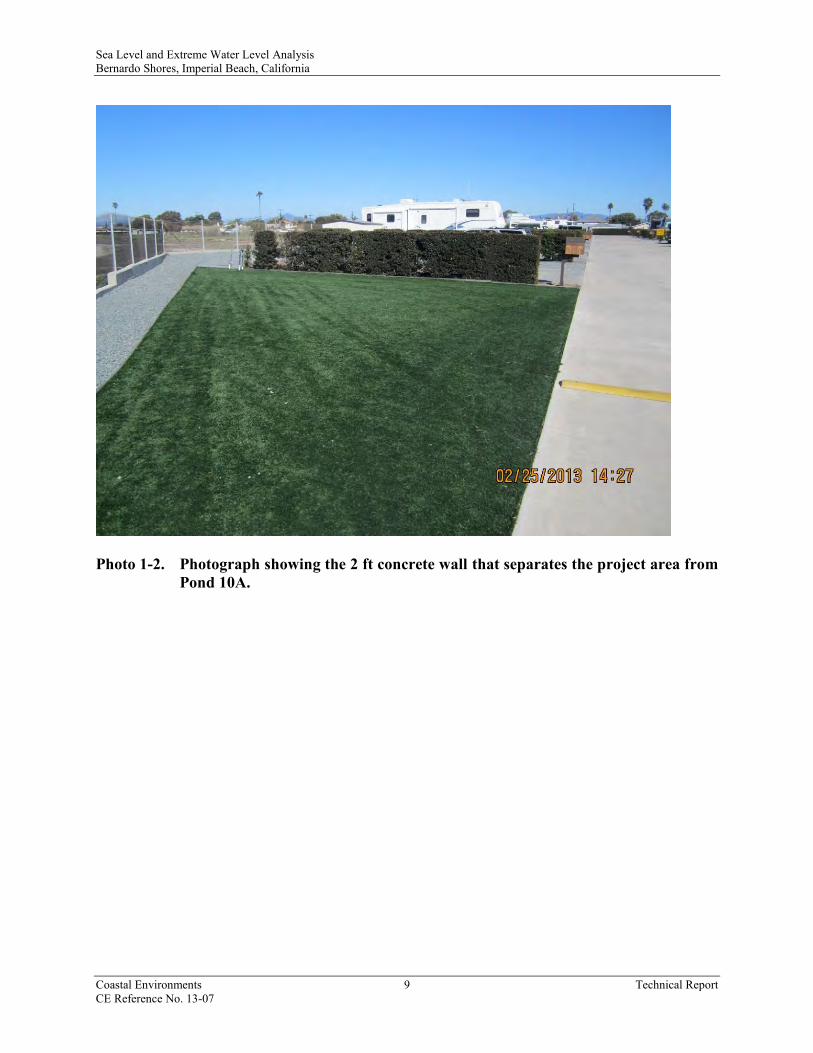
The bayside portion of the existing property is separated from the Salt Pond Basin by a
wall that varies in height, but at the highest point is about 2 feet tall. The wall is made of cement
for the most part; however, the western portion was constructed of railroad ties. On top of the
wall is a chain-link fence with either railroad ties or metal posts as vertical supports (Photo 1-2).
Sea Level and Extreme Water Level Analysis Bernardo Shores, Imperial Beach, California
Coastal Environments 3 Technical Report CE Reference No. 13-07
Figure 1-1. Map showing the location of the Bernardo Shores project area.
Sea Level and Extreme Water Level Analysis Bernardo Shores, Imperial Beach, California
Coastal Environments 4 Technical Report CE Reference No. 13-07
Figure 1-2. Topography of the Bernardo Shores project area and Pond 10A.
Sea Level and Extreme Water Level Analysis Bernardo Shores, Imperial Beach, California
Coastal Environments 5 Technical Report CE Reference No. 13-07
Figure 1-3. Aerial view of the Western Salt Ponds post restoration and breaching of levees.

Sea Level and Extreme Water Level Analysis Bernardo Shores, Imperial Beach, California
Coastal Environments 6 Technical Report CE Reference No. 13-07
Figure 1-4. Map showing Pond 10A with respect to the Bernardo Shores project area.

Sea Level and Extreme Water Level Analysis Bernardo Shores, Imperial Beach, California
Coastal Environments 7 Technical Report CE Reference No. 13-07
.
Figure 1-5. Habitat classifications at Pond 10A.
Sea Level and Extreme Water Level Analysis Bernardo Shores, Imperial Beach, California
Coastal Environments 8 Technical Report CE Reference No. 13-07
Photo 1-1. Photograph showing the headwall, the culverts and the bike path at Pond 10A, looking east.
Sea Level and Extreme Water Level Analysis Bernardo Shores, Imperial Beach, California
Coastal Environments 9 Technical Report CE Reference No. 13-07
Photo 1-2. Photograph showing the 2 ft concrete wall that separates the project area from Pond 10A.
Sea Level and Extreme Water Level Analysis Bernardo Shores, Imperial Beach, California
Coastal Environments 10 Technical Report CE Reference No. 13-07
2.0 TIDES AND CURRENT SEA LEVEL RISE IN SAN DIEGO
2.1 TIDES
The tide is the change of ocean water level caused by the astronomical forces of the moon
and sun. Tidal fluctuations are superposed on sea level. The tide is predictable and can be
decomposed into a set of constituent frequencies near 1 and 2 cycles per day, each having a
given amplitude and phase at any location. Substantial fluctuations in the range of the tide occur
at 2 cycles per month, 2 cycles per year, every 4.4 years, and every 18.6 years. On the San Diego
coast, the tide is mixed with nearly equal semi-daily and daily components (Zetler and Flick,
1985). The highest monthly tides in the winter and summer are higher than those tides in the
spring and fall as a result of lunar and solar declination effects. The extreme monthly higher-high
tides in the winter tend to occur in the morning.
Seasonal sea level, as determined from monthly mean values, in the San Diego area tend
to be highest in the fall and lowest in the spring, with differences of about 0.5 ft. Local warming
or cooling resulting from offshore shifts in water masses can alter the average sea level by
several tenths of a foot over periods of several months (e.g., during El Niño years; Reid and
Mantyla, 1976). Tidal elevations are referenced to Mean Lower Low Water (MLLW), which is
defined as the elevation of the lowest water level readings of each day averaged over a specified
19-year interval, currently 1960-1978 (National Tidal Datum Epoch). In the study area, the
maximum tide range is about 9 ft (7.2 ft above MLLW to 1.8 ft below MLLW).
Storm surges are increases in water level above the tide that result from the effects of
lower atmospheric pressure and higher winds during storms. Together, tides, storm surges, and
sea level changes determine design water levels. The design water level is important for beach
processes and engineering, since it determines how high and how far shoreward the effect of
breaking waves can reach. For example, if sea levels are unusually high because of a
combination of factors, including high tides, storms, and elevated sea levels from El Niño
conditions (such as during the winters of 1982-83 and 1997-98), large waves can be far more
effective in causing flooding, structural damage, beach erosion, and cliff failure than under

Sea Level and Extreme Water Level Analysis Bernardo Shores, Imperial Beach, California
Coastal Environments 11 Technical Report CE Reference No. 13-07
normal conditions. The storm-surge component of sea level is a maximum of 1 ft. This estimate
is based on measurements of sea level elevations during the cluster of wave storms of 1982-1983
(USACOE, 1989).
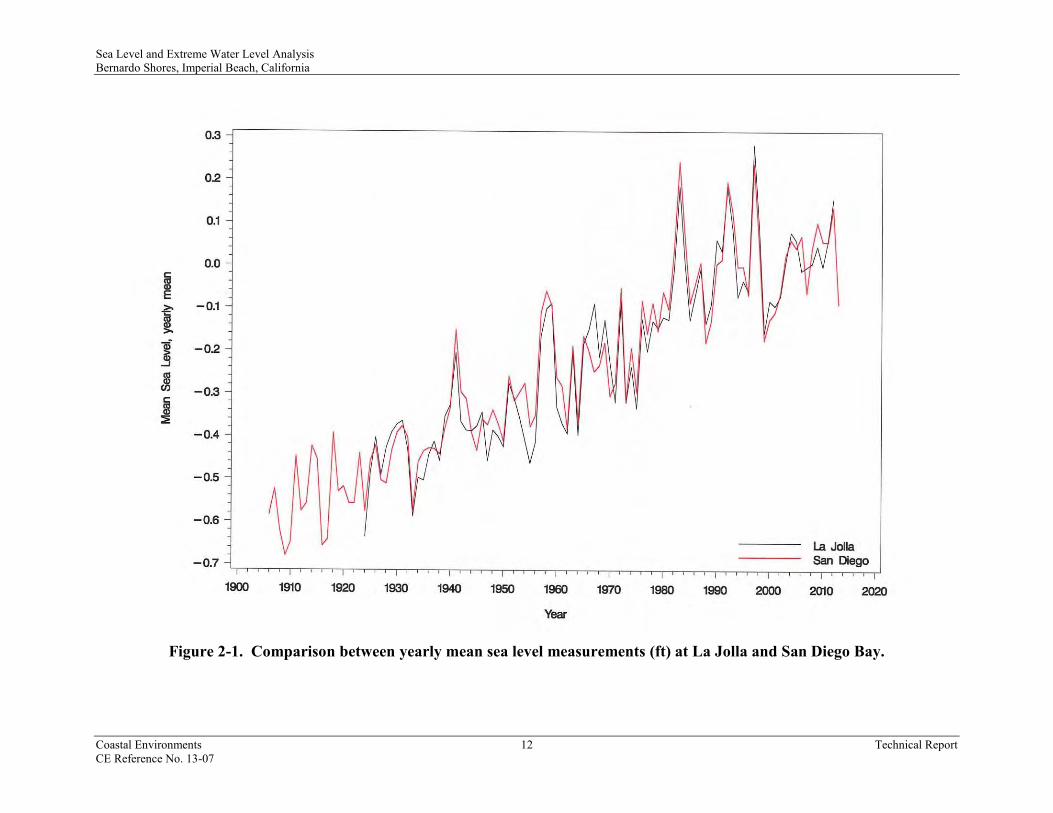
Tidal measurements are carried out continuously in San Diego at La Jolla off the Scripps
Institution of Oceanography Pier and also at San Diego Bay. Measurements of the tides at La
Jolla extend from 1926 to the present and at San Diego Bay from 1906 to the present. A
comparison between yearly mean sea level elevation at La Jolla and San Diego Bay is presented
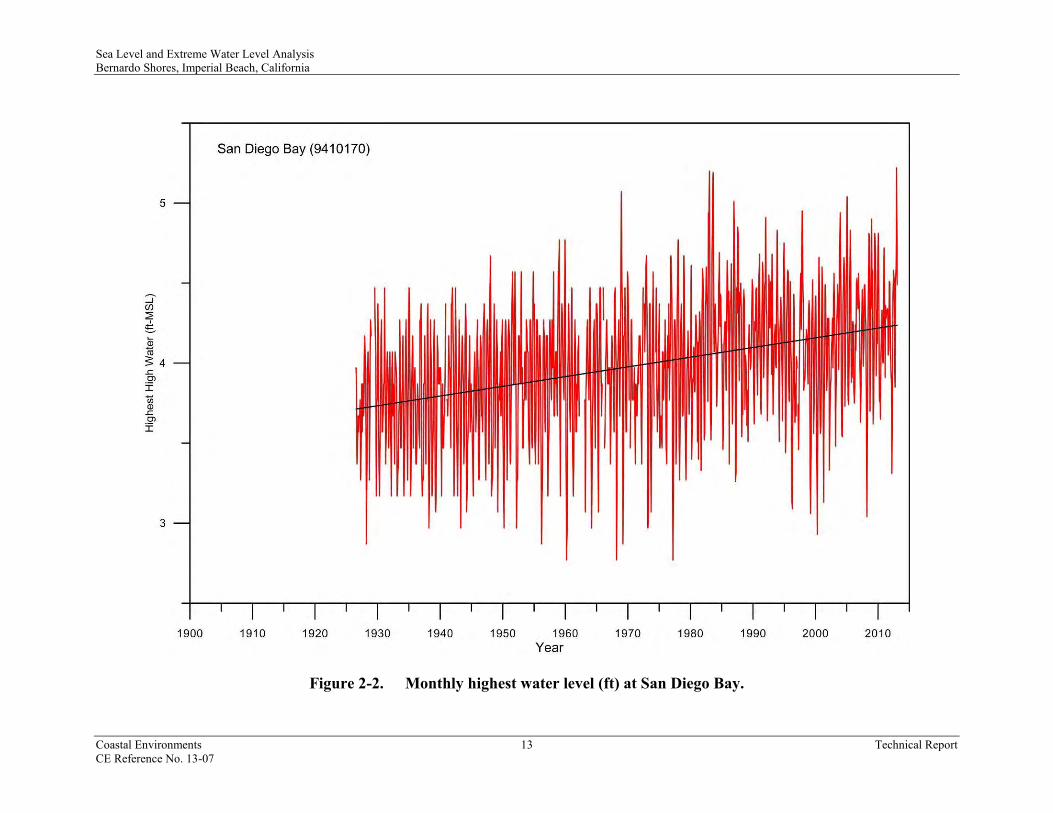
in Figure 2-1. Figure 2-2 shows the highest monthly water level measured in San Diego Bay
from 1920 to 2012. The highest tide during this time period was 5.23 ft, MSL and occurred on 13
December 2012.
2.2 CURRENT SEA LEVEL RISE AT SAN DIEGO BAY
Sea level is rising in most places around the world, with an average global SLR for the
20th Century ranging from 0.18 to 0.31 cm/yr (Church et al., 2004; Houston and Dean, 2011;
IPCC, 2007; Merrifield et al., 2009; Tsimplis et al., 2006). In Southern California, SLR averages
around 0.67 ft/century (20 cm/century) (Cayan et al., 2008; Flick et al., 2003; Gersberg, 2009;
Merrifield, 2011) (Table 2-1).
Yearly tidal data from 1906 to 2013 at San Diego Bay (Tidal Station 9410170) are
plotted in Figure 2-3. The mean sea level has gradually increased at a rate of about 0.67
ft/century (20 cm/century). Similarly, Figure 2-4 show a time series plot of the yearly highest
water elevation at San Diego Bay. The rate of the highest water elevation rise was also 0.67
ft/century (20 cm/century).
Sea Level and Extreme Water Level Analysis Bernardo Shores, Imperial Beach, California
Coastal Environments 12 Technical Report CE Reference No. 13-07
Figure 2-1. Comparison between yearly mean sea level measurements (ft) at La Jolla and San Diego Bay.
Sea Level and Extreme Water Level Analysis Bernardo Shores, Imperial Beach, California
Coastal Environments 13 Technical Report CE Reference No. 13-07
Figure 2-2. Monthly highest water level (ft) at San Diego Bay.

Sea Level and Extreme Water Level Analysis Bernardo Shores, Imperial Beach, California
Coastal Environments 14 Technical Report CE Reference No. 13-07
Figure 2-3. Yearly mean of sea level (ft) at San Diego Bay from 1906 to 2012.
Figure 2-4. Yearly highest water of sea level (ft) at San Diego Bay from 1906 to 2012.

Sea Level and Extreme Water Level Analysis Bernardo Shores, Imperial Beach, California
Coastal Environments 15 Technical Report CE Reference No. 13-07
3.0 PROJECTION OF SEA LEVEL RISE
3.1 SEA LEVEL RISE PROJECTION METHODS
Sea level rise can be attributed to two main factors: thermal expansion of the oceans and
global ice melt. Greenhouse gas emissions (GHGs), especially carbon dioxide, are believed by
many climatologists to increase ocean and air temperatures, which led to thermal expansion of
the oceans and global ice melt.
Global projections for SLR range from 18 cm to 140 cm by 2100, depending on the
methodology used. Projecting SLR is determined by using two different methods: 1) physical
models, and 2) semi-empirical models.
Physical models quantitatively describe the main physical processes that contribute to sea
level rise (thermal expansion and ice melt). These utilize climate models, which use well-
established physical processes in the atmosphere, ocean, cryosphere, and land surface to
reproduce observed features of climate and past climate changes. These models simulate how the
global climate system will respond to various GHG emission scenarios based on future
demographic development, socio-economic development, and technological change. The GHG
emission scenarios were developed by the Intergovernmental Panel on Climate Change (IPCC)
and can be broadly categorized by high, medium-high, medium-low, and low emission scenarios.
The six GHG emission scenarios (in order of high to low emissions) are: 1) A1FI, 2) A2, 3)
A1B, 4) B2, 5) A1T, and 6) B1. The IPCC is the world’s leading climate change organization,
consisting of 35 international scientists who are distinguished in their respective fields. Their
study describes global sea level rise, and their results are discussed in detail in Section 3.2 of this
report.
Semi-empirical models exploit the link between observed SLR and observed global
temperature changes in the past to predict future SLR. This method measures how much the rate
of SLR accelerates for a unit change in global temperature. The semi-empirical model was
developed by Rhamstorf (2007) and results in larger SLR projections than the physical models.
Rhamstorf (2007) projected global SLR of 50 to 140 cm by 2100, with the range dependent upon
Sea Level and Extreme Water Level Analysis Bernardo Shores, Imperial Beach, California
Coastal Environments 16 Technical Report CE Reference No. 13-07
the GHG emission scenario. This method has been utilized by researchers in California,
including Cayan et al. (2009) and Tebaldi et al. (2012), as an alternate approach to the IPCC’s
(2007) projections.
3.2 PROJECTED GLOBAL SEA LEVEL RISE (IPCC, 2007)
The GHG emission scenarios were developed by the IPCC (Intergovernmental Panel on
Climate Change). The six GHG emission scenarios are A1FI, AIT, A1B, A2, B1, and B2.
Scenario A1FI results in the highest estimate for SLR, while Scenario B1 gives the lowest
estimate for SLR. Short descriptions of these scenarios are given below:
1. The A1 family of scenarios is marked by rapid economic growth, global populations
that peak mid-century and decline thereafter, and the rapid introduction of new, more
efficient technologies. The A1 scenario contains three sub-scenarios (A1FI, AIT, and
AIB), which each describe alternative directions of technological change in the
energy system.
a) A1FI is a fossil-fuel-intensive future,
b) A1T is predominantly non-fossil-fuel-based, and
c) A1B is balanced across energy sources.
2. The A2 scenario describes a heterogeneous world with a continuously increasing
global population, regional economic growth, and fragmented economic development
and technological change.
3. The B1 scenario describes a convergent world with the same global population that
peaks in midcentury and declines thereafter as in the A1 scenario, but with rapid
changes in economic structures toward a service and information economy, with
reductions in material intensity and the introduction of clean and resource-efficient
technologies. The emphasis is on global solutions to issues of economic, social, and
environmental sustainability, including improved equity, but without additional
climate initiatives.
4. The B2 storyline and scenario family describes a world in which the emphasis is on
local solutions to economic, social, and environmental sustainability. It is a world

Sea Level and Extreme Water Level Analysis Bernardo Shores, Imperial Beach, California
Coastal Environments 17 Technical Report CE Reference No. 13-07
with continuously increasing global population at a rate lower than A2, intermediate
levels of economic development, and less rapid and more diverse technological
change than in the B1 andA1 storylines. While the scenario is also oriented toward
environmental protection and social equity, it focuses on local and regional levels.
The SLR ranges for these various scenarios are summarized in Table 3-1. Scenario B1
gives the lower SLR ranges at 18-38 cm, while the A1FI scenario gives the highest SLR ranges
at 26- 59 cm by 2099.
3.3 PROJECTED SEA LEVEL RISE AT SAN DIEGO
In California, there are three main reports that are utilized by state and federal agencies
when determining the impacts of projected SLR. These include:
1. “Sea-Level Rise for the Coasts of California, Oregon, and Washington: Past, Present,
and Future” by the National Research Council (2012)
2. “Climate Change Scenarios and Sea Level Rise Estimates for the California Climate
Change Scenarios Assessment” by Cayan et al. (2009)
3. “Climate Change and Sea Level Rise Scenarios for California Vulnerability and
Adaptation Assessment” by Cayan et al. (2012).
Specific to the San Diego area is the Sea Level Rise Adaption Study for San Diego
Bay (ICLEI, 2012). This study addressed adaptation strategies for seal level rise in San Diego
Bay (Section 3.3.3). Additionally, there are research papers that give SLR projections for
California. These include: Tebaldi et al. (2012) and Cayan et al. (2008). These studies are
summarized below.
3.3.1 National Research Council
The National Research Council (NRC) in 2012 created a report that documented past,
present, and projected future SLR’s for California, Oregon, and Washington. In this report,
regional information extracted from global models, GPS data from along the coast, and the ice
loss rates of large or nearby glaciers were used for SLR projections. The report uses both model
Sea Level and Extreme Water Level Analysis Bernardo Shores, Imperial Beach, California
Coastal Environments 18 Technical Report CE Reference No. 13-07
and extrapolation approaches to make projections. The local thermal expansion and wind-driven
contribution was estimated using climate models; the ice melt contribution, adjusted for
gravitational and deformational effects, was extrapolated; and the contribution from vertical land
movement was estimated using GPS data. Their SLR projections are based on thermal
expansion, ice melt from glaciers and ice caps, and the Greenland and Antarctic ice sheets. The
SLR projections for this study are summarized in Table 3-2.
3.3.2 California Energy Commission’s California Climate Change Center
The California Energy Commission’s California Climate Change Center has two reports
that specifically focus on sea level rise. These are the “Climate Change Scenarios and Sea Level
Rise Estimates for the California 2008 Climate Change Scenarios Assessment” (Cayan et al.,
2009) and the “Climate Change and Sea Level Rise Scenarios for California Vulnerability and
Adaptation Assessment” (Cayan et al., 2012). The 2009 report was prepared by Scripps
Institution of Oceanography, the U.S. Geological Survey Water Resources Division, Texas Tech
University’s Department of Geosciences, and the California Department of Boating and
Waterways, while the 2012 report was prepared by Scripps Institution of Oceanography only.
The semi-empirical approaches developed by Rhamstorf (2007) (which estimates global sea
level using surface air temperatures) and Chao et al. (2009) (which accounts for the global
growth of dams and reservoirs) were utilized. Six climate models were used to predict changes in
surface air temperature under the A2 (higher-emission scenario) and B1 (lower-emission
scenario). In this study, SLR in 2050 (relative to the 2000 level) ranges from 30-45 cm. In the
2012 report, essentially the same data as that found in the 2009 report were used when estimating
SLR for California, with the exception of a projection of 90-140 cm by 2100 (Cayan et al.,
2012).
3.3.3 Sea Level Rise Adaption Study for San Diego Bay
This study utilized sea level projections of 20 inches (50 cm) by 2050 and 59 inches (150
cm) by 2100. The upland habitats south of the salt ponds may not experience inundation in either
2050 or 2100. However, these areas could experience significant periodic flooding during both
scenario years, depending on the functioning and height of the salt pond levees. Inundation maps

Sea Level and Extreme Water Level Analysis Bernardo Shores, Imperial Beach, California
Coastal Environments 19 Technical Report CE Reference No. 13-07
from this report show that the Bernardo Shores area would only be inundated by an extreme
flooding event in 2100, which includes the mean high tide in 2100 with a 1.5 meter sea level rise.
However, this report does not take into account the presence of coastal protection structures,
such as seawalls or levees, which are both present at the project site, that could influence the
occurrence of water inundation at Bernardo Shores (see Appendix D – Response to Comments
dated 12 July 2013).
3.3.4 Published Papers
Tebaldi et al., 2012
This study used model output for global temperature changes, a semi-empirical model of
global sea level rise, and long-term records from 55 nationally distributed tidal gauges to develop
sea level rise projections at 11 gauge locations along the coasts of California, Oregon, and
Washington. Based on this information and output from an ensemble of GCM simulations, they
obtained sea-level rise estimates of 3–12 cm by 2030 and 11–30 cm by 2050, relative to 2008,
for the 11 locations.
Cayan et al., 2008
In this study, projected sea level rise in California during the next century is estimated
using thermal expansion (from the IPCC Global Climate Models) and ice melt (from the
MAGICC simple climate model). Three emission scenarios (A1FI, A2, and B1) were utilized to
estimate a range of future SLR for the California coast. By mid-century (2035-2064), projections
of global SLR range from ~6.32 cm above 1990 levels, with no discernible inter-scenario
differences. By the end of the century (2070-2100), SLR projections range from 10-54 cm under
B1, 14-61 cm under A2, and 17-72 cm under A1FI.
3.3.4 SLR Projections Utilized by State and Federal Agencies
The State of California has implemented a number of policies and created research
institutions to address the impacts of climate change and to project regional SLR’s. These
include Executive Orders S-3-05 (2005) and S-13-08 (2008), which set greenhouse gas emission
targets, called for the establishment of a Climate Adaptation Strategy, and asked the National

Sea Level and Extreme Water Level Analysis Bernardo Shores, Imperial Beach, California
Coastal Environments 20 Technical Report CE Reference No. 13-07
Academy of Sciences to convene an independent panel to complete a Sea Level Rise Assessment
Report; the establishment of the California Energy Commission’s Public Interest Energy
Research (PIER) program in 2001 to research potential impacts of climate change; and the
establishment of the California Climate Change Center (CCCC) in 2003, which is devoted to
climate change research. The creation of these organizations and regulatory policies resulted in a
number of reports designed to provide projections of SLR and to address the implications of SLR
and climate change from a policy standpoint.
Table 3-3 presents an overview of the recognized SLR projections by various federal and
state agencies involved in policies regarding SLR in California.
3.4 SUMMARY
It is apparent from these studies that a large amount of variability exists with SLR
projections, ranging from 5.5 to 61 cm (0.18-2.0 ft) by 2050 and from 10 to 167 cm (0.33-5.5 ft)
by 2100. This is especially apparent in California, where numerous regional studies have been
implemented to address SLR. Table 3-4 summarizes all the SLR projections reviewed in this
report.

Sea Level and Extreme Water Level Analysis Bernardo Shores, Imperial Beach, California
Coastal Environments 21 Technical Report CE Reference No. 13-07
Table 3-1. IPCC global projections of sea level rise by 2090-2099 for various scenarios1.
Scenario Range (cm) Range (ft)
B1 Scenario 18-38 0.6-1.25
A1T Scenario 20-45 0.66-1.48
B2 Scenario 20-43 0.66-1.41
A1B Scenario 21-48 0.69-1.57
A2 Scenario 23-51 0.75-1.67
A1FI Scenario 26-59 0.85-1.94
1 SLR ranges relative to 1980-1999 levels.
Table 3-2. NRC committee’s sea level rise projections for the U.S. Pacific Coast.1
Contributor 2030 Range 2050 Range 2100 Range
cm ft cm ft cm Ft
Steric 1.7-11.0 0.06-0.36 4.0-18.9 0.13-0.62 9.6-46.2 0.31-1.51
Glaciers and
Ice Caps 2.7-3.6 0.09-0.12 5.1-7.3 0.17-0.24 12.9-19.4 0.42-0.64
Greenland 1.8-4.0 0.06-0.13 4.3-10.2 0.14-0.03 14.8-33.8 0.48-1.11
Antarctica 1.5-5.1 0.05-0.17 3.0-13.3 0.10-0.44 7.7-46.2 0.25-1.51
Total
Cryosphere 6.6-12.2 0.22-0.40 13.7-29.4 0.45-0.96 40.9-94.1 1.34-3.09
Sum 8.3-23.2 0.27-0.76 17.6-48.2 0.58-1.58 50.4-140.2 1.65-4.60
1 SLR ranges relative to 2000 levels.
Sea Level and Extreme Water Level Analysis Bernardo Shores, Imperial Beach, California
Coastal Environments 22 Technical Report CE Reference No. 13-07
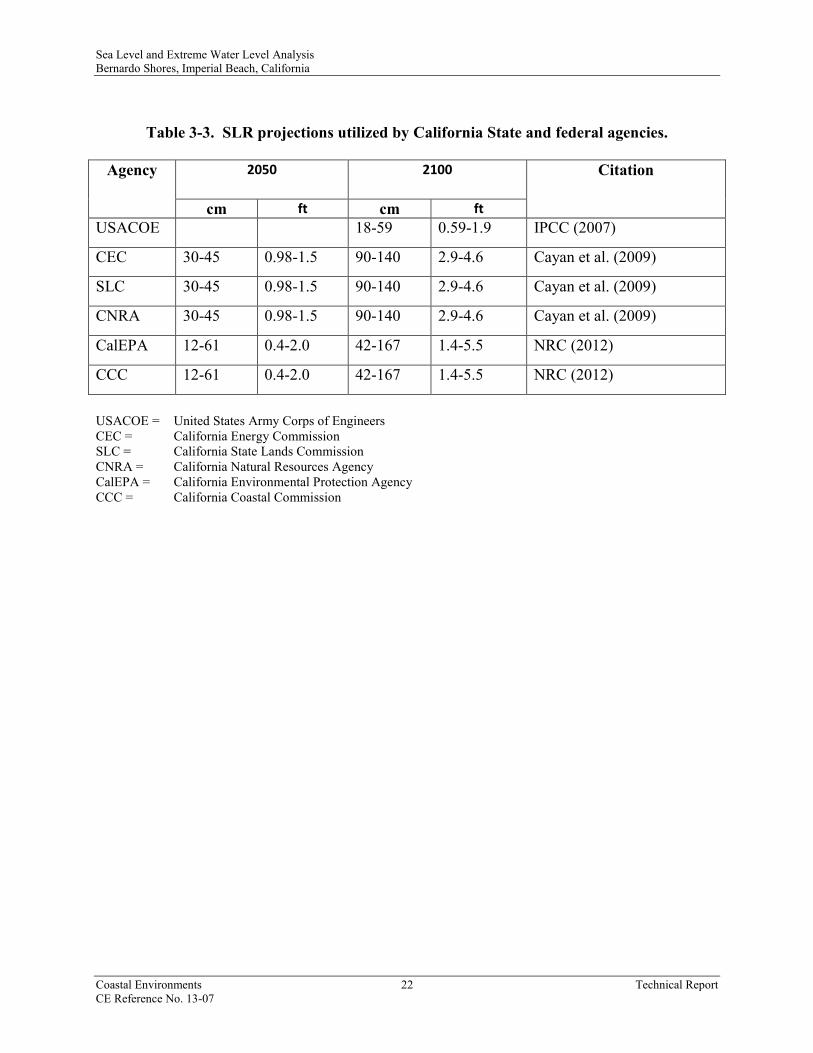
Table 3-3. SLR projections utilized by California State and federal agencies.
Agency 2050 2100 Citation
cm ft cm ft
USACOE 18-59 0.59-1.9 IPCC (2007)
CEC 30-45 0.98-1.5 90-140 2.9-4.6 Cayan et al. (2009)
SLC 30-45 0.98-1.5 90-140 2.9-4.6 Cayan et al. (2009)
CNRA 30-45 0.98-1.5 90-140 2.9-4.6 Cayan et al. (2009)
CalEPA 12-61 0.4-2.0 42-167 1.4-5.5 NRC (2012)
CCC 12-61 0.4-2.0 42-167 1.4-5.5 NRC (2012)
USACOE = United States Army Corps of Engineers CEC = California Energy Commission SLC = California State Lands Commission CNRA = California Natural Resources Agency CalEPA = California Environmental Protection Agency CCC = California Coastal Commission
Sea Level and Extreme Water Level Analysis Bernardo Shores, Imperial Beach, California
Coastal Environments 23 Technical Report CE Reference No. 13-07
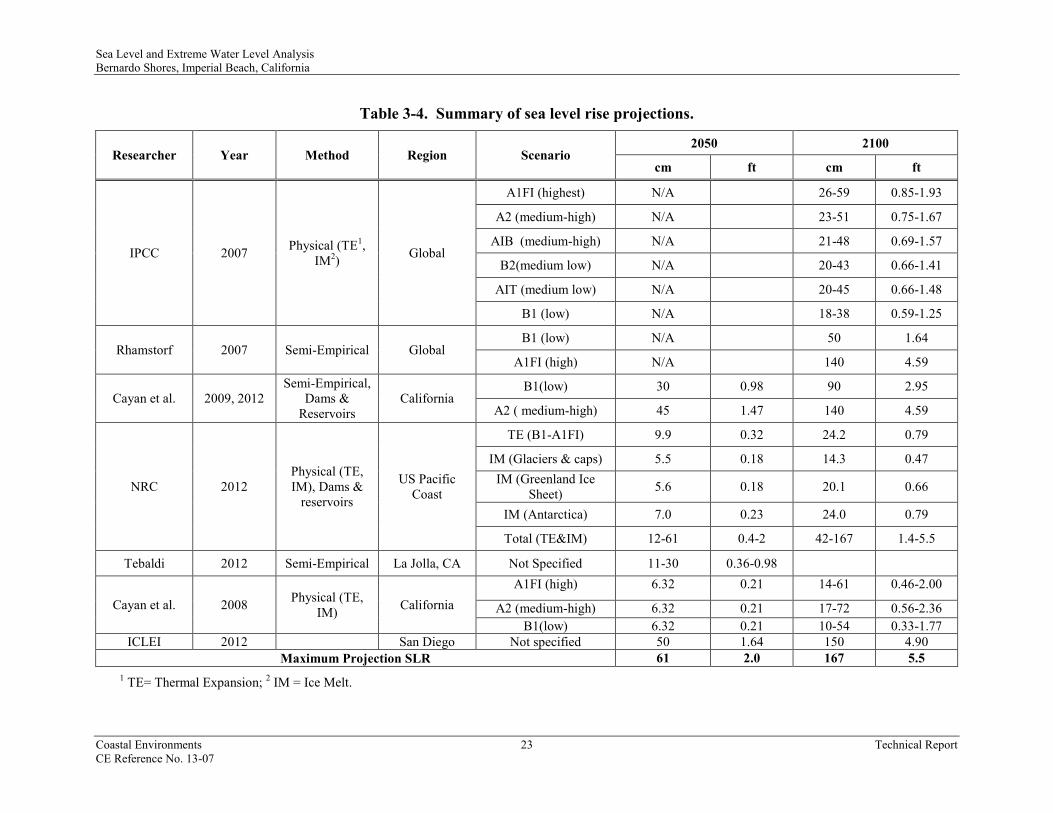
Table 3-4. Summary of sea level rise projections.
Researcher Year Method Region Scenario 2050 2100
cm ft cm ft
IPCC 2007 Physical (TE1, IM2) Global
A1FI (highest) N/A 26-59 0.85-1.93
A2 (medium-high) N/A 23-51 0.75-1.67
AIB (medium-high) N/A 21-48 0.69-1.57
B2(medium low) N/A 20-43 0.66-1.41
AIT (medium low) N/A 20-45 0.66-1.48
B1 (low) N/A 18-38 0.59-1.25
Rhamstorf 2007 Semi-Empirical Global B1 (low) N/A 50 1.64
A1FI (high) N/A 140 4.59
Cayan et al. 2009, 2012 Semi-Empirical,
Dams & Reservoirs
California B1(low) 30 0.98 90 2.95
A2 ( medium-high) 45 1.47 140 4.59
NRC 2012 Physical (TE, IM), Dams &
reservoirs
US Pacific Coast
TE (B1-A1FI) 9.9 0.32 24.2 0.79
IM (Glaciers & caps) 5.5 0.18 14.3 0.47 IM (Greenland Ice
Sheet) 5.6 0.18 20.1 0.66
IM (Antarctica) 7.0 0.23 24.0 0.79
Total (TE&IM) 12-61 0.4-2 42-167 1.4-5.5
Tebaldi 2012 Semi-Empirical La Jolla, CA Not Specified 11-30 0.36-0.98
Cayan et al. 2008 Physical (TE, IM) California
A1FI (high) 6.32 0.21 14-61 0.46-2.00
A2 (medium-high) 6.32 0.21 17-72 0.56-2.36 B1(low) 6.32 0.21 10-54 0.33-1.77
ICLEI 2012 San Diego Not specified 50 1.64 150 4.90 Maximum Projection SLR 61 2.0 167 5.5
1 TE= Thermal Expansion; 2 IM = Ice Melt.
Sea Level and Extreme Water Level Analysis Bernardo Shores, Imperial Beach, California
Coastal Environments 24 Technical Report CE Reference No. 13-07
4.0 WATER LEVEL MEASUREMENTS AT PONDS 10A AND 11
4.1 THE MEASUREMENTS
Water level measurements were carried out at two locations, S1 and S2 (Figure 4-1) by
using pressure sensors to monitor the variations in the water level. Stations S1 and S2 are located
north and south of the Headwall that separates Pond 11 from Pond 10A. Tidal exchange is
through five 3.5-ft diameter culverts installed at the Headwall that pass under the bikeway (Photo
1-1). The bottom and top elevations of the culverts are 1.7 and 5.2 ft, NGVD, respectively.
Measurements were carried out between 27 February 2013 and 21 March 2013 (22 days)
in order to cover at least one period of spring and neap tidal cycles. Data were collected
continuously for one minute out of every five minutes at a sampling rate of 1 sample/sec. The
one-minute measurements were averaged internally inside of the instrument and provided single
measurements every five minutes. Two tide staffs were placed near the pressure sensors (one at
each instrument). These tide staffs were surveyed using a total station in order to calibrate the
measurements from the instruments and convert the pressure data (psi) of the sensors to water
elevations (ft, NGVD).
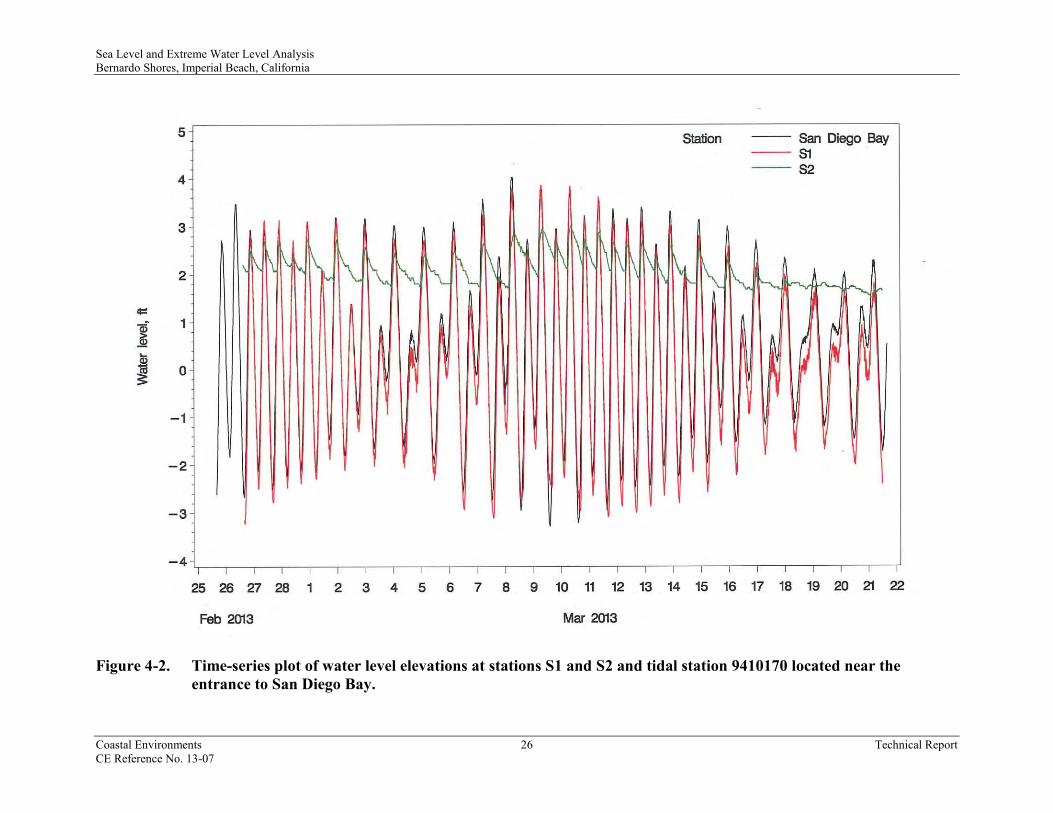
Figure 4-2 shows the measurements from stations S1 and S2 and the tides as measured
from tidal station 9410170. The data from the S1 station (Pond 11) tracks the measurements from
tidal station 9410170 and shows a small tidal muting for high water elevations. The data from
Station S2 (Pond 10A) shows a considerable muting of the high tide elevation during a tidal
cycle. Also, the water from Pond 10A did not drain below the lower culvert elevation, which is
1.7 ft, NGVD.
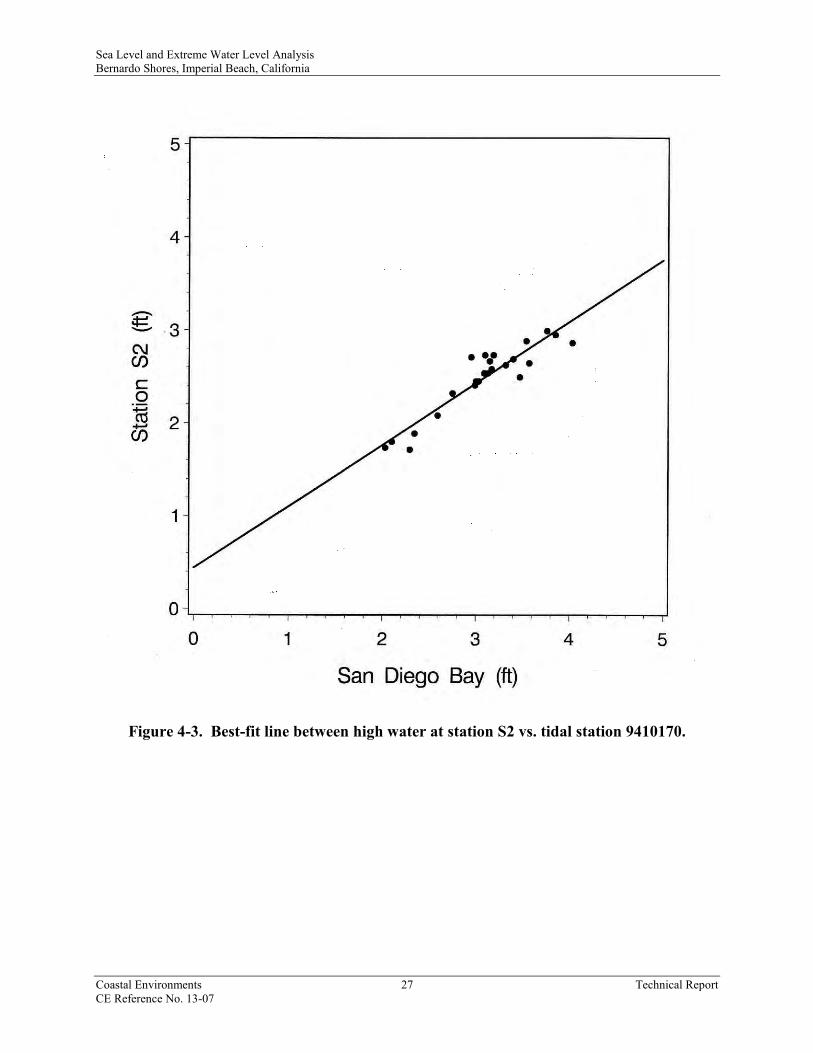
Figure 4-3 shows a scatter plot of the highest measured water at station S2 and tidal
station 9410170. In order to determine how much the muting of the tide occurred inside Pond
10A, a best-fit line was calculated. The slope of the line determines the percent reduction of the
highest water elevation during a tidal cycle at Pond 10A. The result shows that high water
elevations in Pond 10A are about 67% of the elevation at the entrance of San Diego Bay.

Sea Level and Extreme Water Level Analysis Bernardo Shores, Imperial Beach, California
Coastal Environments 25 Technical Report CE Reference No. 13-07
Figure 4-1. Location of pressure sensors at Pond 10A.
Sea Level and Extreme Water Level Analysis Bernardo Shores, Imperial Beach, California
Coastal Environments 26 Technical Report CE Reference No. 13-07
Figure 4-2. Time-series plot of water level elevations at stations S1 and S2 and tidal station 9410170 located near the entrance to San Diego Bay.
Sea Level and Extreme Water Level Analysis Bernardo Shores, Imperial Beach, California
Coastal Environments 27 Technical Report CE Reference No. 13-07
Figure 4-3. Best-fit line between high water at station S2 vs. tidal station 9410170.

Sea Level and Extreme Water Level Analysis Bernardo Shores, Imperial Beach, California
Coastal Environments 28 Technical Report CE Reference No. 13-07
5.0 DESIGN WATER LEVEL
Data from tidal station 9410170 between 1906 and 2012 were used to estimate the current
rate of sea level rise at San Diego Bay and determine the highest measured water during this
period. The results show that the current rate of sea level rise is 0.67 ft/century (0.2 mm/year),
and the highest measured water was 5.23 ft, NGVD (13 Dec 2012). Figure 4-2 shows that the
lower water elevation in Pond 10A is controlled by the presence of the culverts, and the water
cannot drain below 1.7 ft. Figure 4-3 shows that the high water at Pond 10A is muted and is
about 67 percent of the high water level in the rest of San Diego Bay.
In order to determine the design water level expected off the Bernardo Shores project
area, we considered projected SLR rates from the ICLEI (2012), which include 50 cm (1.6 ft) by
2050 and 150 cm (4.9 ft) by 2100, the highest historical measured water levels in the area from
1920-2012 (5.23 ft), and tidal muting at Pond 10A (67 % of the water level of San Diego Bay),
which fronts the Bernardo Shores properties. The SLR projections from the ICLEI (2012) were
utilized because 1) they represent the most recent data set available for sea level rise projections
for San Diego Bay, and 2) they represent a higher-end estimate that will be beneficial for
estimating worst-case water levels at Bernardo Shores.
Based on the information presented in the paragraphs above, the highest expected water
level in front of Bernardo Shores for the next 50 years would be 1.6 ft + (0.67 x 5.23 ft) = 5.1 ft,
MSL; for the next 100 years, it would be 4.9 ft + (0.67 x 5.23) = 8.4 ft, MSL. It should be
pointed out that these estimates for 50 years and 100 years present the worst-case scenario,
which includes the highest regional sea level rise projections from the ICLEI (2012) and the
highest reported tides in this area from 1920-2012 (5.23 ft) as reported in a study by ICLEI
(2012) . Other events, such as storm surges and higher tide elevations events during El Niño
periods, that may temporarily raise the water level to higher levels than the values indicated in
this study(USACOE, 1989). The likelihood of large wave storms occur during extreme high tide
is low.
Projected SLR varies from study to study due to uncertainties in the estimation values for
Sea Level and Extreme Water Level Analysis Bernardo Shores, Imperial Beach, California
Coastal Environments 29 Technical Report CE Reference No. 13-07
some of the model parameters used in the emission models, especially those for glacier and ice
sheet melt, as well as the overall short time period since sea level rise models have been
developed. There are many other studies that give much lower predictions of sea level rise than
used in the calculations in this report. For example, Houston (2013) projected a sea level rise by
2100 of 2.7 ft (82 cm) with a 95% confidence-level projection. More recent projections from the
IPCC (Church et al., 2013) predict 98 cm (3.21 ft) as the maximum global sea level rise by 2100.
Differences largely occur due to the methodology used to predict sea level rise.
Semi-empirical models were partially used in the NRC (2012) predictions, which
generally result in larger predictions. However, this methodology has been shown to have a low
degree of confidence due to a lack of census in the scientific community regarding their
reliability (Church et al., 2013).
6.0 SUMMARY AND CONCLUSIONS
This report presents a study to assess the impacts of sea level rise on the Bernardo Shores
project area and whether there is a need to elevate the ground higher before developing the area.
The existing topography of the property presented in Figure 1-2. Most of the area is above 10 ft,
NGVD, except for one small area located in the northwestern section of the property.
Our water level analysis is for the front of the property shows that the highest water level
expected through 2050 is about 5.1 ft, MSL (5.5 ft, NGVD), and through 2100, about 8.4 ft,
MSL (8.8 ft, NGVD).
In conclusion, future sea level up to 2100 is lower than the elevation of the ground of
most of the project area, with the exception of a small area in the northwestern section of the
property (Figure 2-1). There is no need to elevate the ground of the property, especially since
there will be a 100-ft buffer between the shoreline of Pond 10A and the developed area of the
property. Water inundation during extreme events not considered in this study (i.e. far-distance
tsunamis, unprecedented El Niño events, unexpected large storm surges, etc.) could cause some
damages to the project area that would require minimal repairs (Coastal Environments, 2002).
Sea Level and Extreme Water Level Analysis Bernardo Shores, Imperial Beach, California
Coastal Environments 30 Technical Report CE Reference No. 13-07
7.0 REFERENCES
Cayan, D.R., Bromirski, P.D., Hayhoe, K., Tyree, M., Dettinger, M., and Flick, R., 2008.
Climate change projections of sea level extremes along the California coast. Climate
Change, 87, S57-S73.
Cayan, D., Tyree, M., Dettinger, M., Hidalgo, H., Das, T., Maurer, E., Bromirski, P., Graham,
N., Flick, R. 2009. Climate change scenarios and sea level rise estimates for the
California 2008 Climate change scenarios assessment, Prepared for the the California
Climate Change Center, Prepared by Scripps Institution of Oceanography, the U.S.
Geological Survey Water Resources Division, Texas Tech University’s Department of
Geosciences, and the California Department of Boating and Waterways.
Cayan, D., Tyree, M., Pierce, D., Das, T., 2012. Climate change and sea level rise scenarios for
California vulnerability and adaptation assessment, A White Paper from the California
Energy Commission’s California Climate Change Center, Prepared for: California
Energy Commission, Prepared by: Scripps Institution of Oceanography.
http://www.energy.ca.gov/2012publications/CEC-500-2012-008/CEC-500-2012-008.pdf
Chao, B.F., Wu, Y.H., Li, Y.S. 2008. Impact of artificial reservoir impoundment on global sea
level. Science, 320 (5873). 212-214.
Church, J.A.; Coleman, R.; Lambeck, K.; and J Mitrovica, J., 2004. Estimates of the regional
distribution of sea level rise over the 1950-2000 period. Journal of Climate 17, 2609-
2625.
Church, J.A., P.U. Clark, A. Cazenave, J.M. Gregory, S. Jevrejeva, A. Levermann, M.A.
Merrifield, G.A. Milne, R.S. Nerem, P.D. Nunn, A.J. Payne, W.T. Pfeffer, D. Stammer
and A.S. Unnikrishnan, 2013: Sea Level Change. In: Climate Change 2013: The Physical
Science Basis. Contribution of Working Group I to the Fifth Assessment Report of the
Sea Level and Extreme Water Level Analysis Bernardo Shores, Imperial Beach, California
Coastal Environments 31 Technical Report CE Reference No. 13-07
Intergovernmental Panel on Climate Change [Stocker, T.F., D. Qin, G.-K. Plattner, M.
Tignor, S.K. Allen, J. Boschung, A. Nauels, Y. Xia, V. Bex and P.M. Midgley (eds.)].
Cambridge University Press, Cambridge, United Kingdom and New York, NY, USA.
Coastal Environments, 2002. Coastal processes and hydraulic/hydrology study for Crystal Cove
State Park Historic District, Volume II, Risk Analysis. CE Reference No. 02-09.
Submitted to the State of California, Department of Parks and Recreation, Southern
Service Center, on 8 October 2002. 19 pp. + 1 appendix.
Flick, R.E.; Murray, J.F., and Ewing, L.C., 2003. Trends in United States tidal datum statistics
and tide range. Journal of Waterway, Port, Coastal, and Ocean Engineering, 129(4),
155-164.
Gersberg, R., 2009. Application of SLAMM 5.1 to San Diego County, CA. Division of
Environmental Health, Graduate School of Public Health, San Diego State University.
http://www.sdcoastkeeper.org/images/stories/docs/SLAMMREPORT.pdf
Houston, J.R., 2013. Global sea level projections to 2100 using methodology of the
Intergovernmental Panel on Climate Change. Journal of Waterway, Port, Coastal, and
Ocean Engineering (March-April), 129(2), 82-87.
Houston, J.R., Dean, R.G., 2011. Sea level acceleration based on U.S. tide gauges and extensions
of previous global gauge analyses. Journal of Coastal Research, 27(3), 409-417.
ICLEI, 2012. Sea level rise adaption study for San Diego Bay. 69 pp, 3 appendices.
IPCC (Intergovernmental Panel on Climate Change), 2007. Fourth Assessment Report (AR4).
Merrifield, M.A., 2011. A shift in Western tropical Pacific sea-level trends during the 1990’s.
Journal of Climate, 24(15), 4126-4138.
Sea Level and Extreme Water Level Analysis Bernardo Shores, Imperial Beach, California
Coastal Environments 32 Technical Report CE Reference No. 13-07
Merrifield, M.A.; Merrifield, S.T., and Mitchum, G.T., 2009. An anomalous recent acceleration
of global sea level rise. Journal of Climate, 22(21), 5772-5781.
NRC (National Research Council), 2012. Sea level rise for the coasts of California, Oregon, and
Washington: past, present, and future, National Academic Press, ISBN: 978-0-309-
25594-3, 201 pp.
Reid, J.L.,and Mantyla, A.W., 1976. The effect of the geostrophic flow upon coastal sea
elevations in the northern North Pacific Ocean, Journal of. Geophysical
Research, 81(18), 3100–3110.
Rhamstorf, S, 2007. A semi-empirical approach to projecting future sea level rise. Science,
315(5810), 368-370
Tebaldi, C., B.H. Strauss, and C.E. Zervas, 2012. Modelling sea level rise impacts on storm
surges along US coasts, Environmental Research Letters, 7, doi:10.1088/1748-
9326/7/01432.
Tsimplis, M.N.; Shaw, A.; Flather, R.A., and Woolf, D.K., 2006. The influence of the North
Atlantic Oscillation on the sea-level around the Northern European coasts reconsidered:
the thermosteric effects. Philosophical Transactions of the Royal Society A, 364(1841),
845-856.
U.S. Army Corps of Engineers. 2011. Sea level change considerations for civil works programs.
Circular No. 1165-2-212.
U.S. Army Corps of Engineers, 1989. Historic wave and sea level data report: San Diego region. Ref. No. CCSTWS 88-6.
U.S. Fish and Wildlife Service. 2009. Final Environmental Assessment, South San Diego Bay
Coastal Wetland Restoration and Enhancement Project, San Diego County, California.
Sea Level and Extreme Water Level Analysis Bernardo Shores, Imperial Beach, California
Coastal Environments 33 Technical Report CE Reference No. 13-07
Zedler, B. D. and R.E. Flick, 1985: Predicted Extreme High Tides for Mixed-Tide Regimes.
Journal of Physical Oceanography, 15, 357–359.
Sea Level and Extreme Water Level Analysis Bernardo Shores, Imperial Beach, California
Coastal Environments A-1 Technical Report CE Reference No. 13-07
APPENDIX A
RESPONSE TO THE CITY OF IMPERIAL BEACH ON 12 JULY 2013
Sea Level and Extreme Water Level Analysis Bernardo Shores, Imperial Beach, California
Coastal Environments Technical Report CE Reference No. 13-07
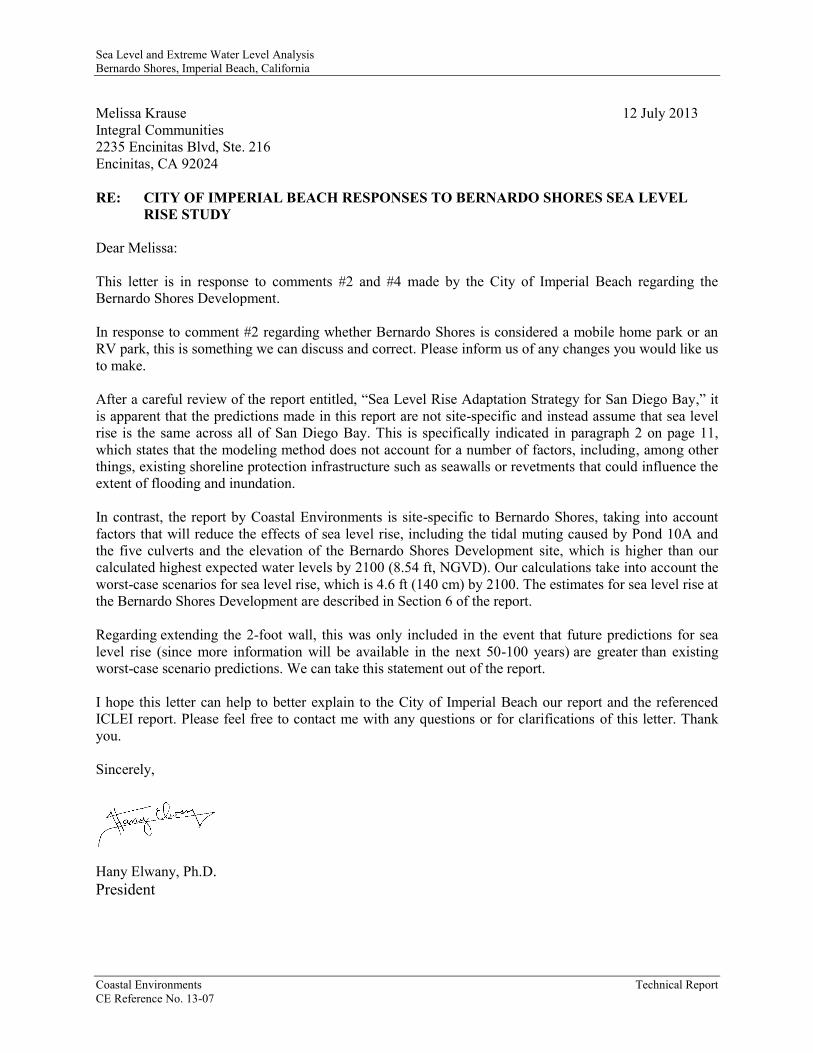
Melissa Krause 12 July 2013 Integral Communities 2235 Encinitas Blvd, Ste. 216 Encinitas, CA 92024 RE: CITY OF IMPERIAL BEACH RESPONSES TO BERNARDO SHORES SEA LEVEL RISE STUDY Dear Melissa: This letter is in response to comments #2 and #4 made by the City of Imperial Beach regarding the Bernardo Shores Development. In response to comment #2 regarding whether Bernardo Shores is considered a mobile home park or an RV park, this is something we can discuss and correct. Please inform us of any changes you would like us to make. After a careful review of the report entitled, “Sea Level Rise Adaptation Strategy for San Diego Bay,” it is apparent that the predictions made in this report are not site-specific and instead assume that sea level rise is the same across all of San Diego Bay. This is specifically indicated in paragraph 2 on page 11, which states that the modeling method does not account for a number of factors, including, among other things, existing shoreline protection infrastructure such as seawalls or revetments that could influence the extent of flooding and inundation. In contrast, the report by Coastal Environments is site-specific to Bernardo Shores, taking into account factors that will reduce the effects of sea level rise, including the tidal muting caused by Pond 10A and the five culverts and the elevation of the Bernardo Shores Development site, which is higher than our calculated highest expected water levels by 2100 (8.54 ft, NGVD). Our calculations take into account the worst-case scenarios for sea level rise, which is 4.6 ft (140 cm) by 2100. The estimates for sea level rise at the Bernardo Shores Development are described in Section 6 of the report. Regarding extending the 2-foot wall, this was only included in the event that future predictions for sea level rise (since more information will be available in the next 50-100 years) are greater than existing worst-case scenario predictions. We can take this statement out of the report. I hope this letter can help to better explain to the City of Imperial Beach our report and the referenced ICLEI report. Please feel free to contact me with any questions or for clarifications of this letter. Thank you. Sincerely,
Hany Elwany, Ph.D. President


![Farmakogenetyka gemetyka medyczna [tryb zgodno [ci]biochemia.umed.pl/data/accounts/16fed1c5-1935-4Dfa... · 2011-09-26 2 Polimorfizm genetyczny – to regularne i jednoczesne wyst](https://img.pdfslide.net/doc/110x75/5d1ec46288c9934c378c2fdf/farmakogenetyka-gemetyka-medyczna-tryb-zgodno-ci-2011-09-26-2-polimorfizm.jpg)