Embed Size (px)
Citation preview

TTTTTTTTHHHHHHHHEEEEEEEE SSSSSSSSUUUUUUUUPPPPPPPPPPPPPPPPLLLLLLLLYYYYYYYY AAAAAAAANNNNNNNNDDDDDDDD DDDDDDDDEEEEEEEEMMMMMMMMAAAAAAAANNNNNNNNDDDDDDDD OOOOOOOOFFFFFFFF EEEEEEEE--------SSSSSSSSKKKKKKKKIIIIIIIILLLLLLLLLLLLLLLLSSSSSSSS IIIIIIIINNNNNNNN EEEEEEEEUUUUUUUURRRRRRRROOOOOOOOPPPPPPPPEEEEEEEE
SSSSSSSSeeeeeeeepppppppptttttttteeeeeeeemmmmmmmmbbbbbbbbeeeeeeeerrrrrrrr 22222222000000000000000055555555
RESEARCH TEAM:RESEARCH TEAM:RESEARCH TEAM:RESEARCH TEAM: ERIK FRINKING ANDREAS LIGTVOET PERNILLA LUNDIN WIJA OORTWIJN Prepared for the European Commission
And the European e-Skills Forum
EUROPE


iii
Preface
As Information and Communication Technologies (ICT) have become such a crucial element in the working lives of many European citizens and for the competitiveness of enterprises, so has the demand for e-skills. Consequently, concerns about the supply of these skills have become an important element of policy – a smoothly operating ICT jobs market is expected to increase industrial efficiency and economic gains. In its synthesis report “e-Skills for Europe: Towards 2010 and Beyond” (September 2004) the European e-Skills Forum called for the development of a long-term strategy and the improvement of data availability about the ICT labour market.
In this context, the European Commission selected RAND Europe in December 2004 after an open call for tenders to conduct analysis of the situation of demand and supply of e-skills in Europe. Our contact point was André Richier (Principal Administrator, Enterprise and Industry Directorate-General, Innovation Policy Directorate, Technology for Innovation, ICT industries and e-Business). This report covers work performed between January and September 2005. It considers different approaches used when studying supply and demand of e-skills; it describes and analyses the current situation relating to the supply and demand of practitioner skills in the European Union and its Member States and provides data on the position in the United States for comparative purposes. The RAND Europe team was supported by a large number of experts. First of all, Matthew Dixon (Labour Market Adviser to CEPIS and SEMTA Visiting Research Fellow, SKOPE, University of Oxford), Hanne Shapiro (Danish Technology Institute) and Cathy Stasz (Research Leader at RAND) provided extensive comments and suggestions during the different phases of our research. In addition, an ad hoc steering group consisting of representatives of the European e-Skills Forum commented on the deliverables that were produced. These experts are mentioned in Appendix C.
The primary audience for this report are policymakers in the field of ICT industry and ICT skills at the European Commission and the EU Member States. The report may also be of interest to a wide variety of stakeholders, such as major European employers, ICT Professionals’ Associations, social partners and national policy makers in the field of social, employment and education policy. For more information about RAND Europe or the work reported in this document, please contact Erik Frinking.
RAND Europe Tel: +31 71 524 51 51 Email: [email protected]

The supply and demand of e-skills in Europe RAND Europe
iv
Disclaimer:Disclaimer:Disclaimer:Disclaimer:
RAND’s publications do not necessarily reflect the opinions of its research clients and sponsors. The views expressed in this report are thus the sole responsibility of the authors and do not necessarily represent the views of the European Commission or its services.

v
Contents
Preface .......................................................................................................................iii
Glossary ................................................................................................................... xiii
Executive Summary....................................................................................................xv
CHAPTER 1 Introduction .................................................................................... 1 1.1 The role of ICT skills in the economy................................................................1
1.2 Objectives of the study.......................................................................................2
1.3 Outline of the report..........................................................................................2
CHAPTER 2 Scope and methodology of the study................................................ 3 2.1 Definitions of e-skills .........................................................................................3
2.2 Focus of our study..............................................................................................6
2.3 Data sources used for analysis.............................................................................6
2.3.1 Studies and reports................................................................................6
2.3.2 Statistical sources...................................................................................7
2.3.3 Interviews..............................................................................................8
2.3.4 Meetings and workshops .......................................................................8
2.4 Framework for classification / taxonomy ............................................................9
CHAPTER 3 Review of current e-skills studies ................................................... 11 3.1 Focus or purpose of studies ..............................................................................11
3.2 Tracking and measuring ICT Practitioner skills ...............................................14
3.2.1 Occupational classifications.................................................................14
3.2.2 Skill-based classifications .....................................................................17
3.2.3 Formal education and additional training............................................18
3.3 Measuring e-skills.............................................................................................19
3.3.1 Stock...................................................................................................19
3.3.2 Supply.................................................................................................20
3.3.3 Demand..............................................................................................22
3.4 Conclusions and recommendations..................................................................23
3.4.1 Definition of e-skills............................................................................24
3.4.2 Data gathering implementation and indicators ....................................24

The supply and demand of e-skills in Europe RAND Europe
vi
CHAPTER 4 Current situation of supply and demand of e-skills ....................... 27 4.1 Our data collection approach .......................................................................... 27
4.2 On data availability ......................................................................................... 28
4.3 Current situation at the EU level and in the US .............................................. 33
4.4 National situations .......................................................................................... 46
4.4.1 EU Labour Force Survey data ............................................................. 46
4.4.2 Country specific data sources.............................................................. 49
4.5 Concluding remarks ........................................................................................ 55
4.6 Future improvements of existing statistical data collection............................... 56
CHAPTER 5 Anticipating e-skills ....................................................................... 61 5.1 Systematic review of conducted future studies on e-skills................................. 61
5.1.1 Approach............................................................................................ 61
5.1.2 General observations from these studies.............................................. 62
5.1.3 Economic growth approach................................................................ 63
5.1.4 Scenarios approach ............................................................................. 63
5.1.5 Lessons to be learned .......................................................................... 64
5.2 Background of future studies and foresight...................................................... 65
5.3 Observation of foresight elements in conducted studies ................................... 67
5.3.1 Stakeholder presence .......................................................................... 67
5.3.2 Topic design/relevance ....................................................................... 68
5.3.3 Technical design/validity .................................................................... 69
5.3.4 Process design/credibility.................................................................... 69
5.3.5 Evaluation design/feedback................................................................. 70
5.3.6 Conclusion......................................................................................... 70
5.4 Structure for a foresight study on e-skills ......................................................... 70
5.4.1 Framing the issue................................................................................ 71
5.4.2 Developing scenarios and structural changes....................................... 71
5.4.3 Finding the right stakeholders ............................................................ 72
5.4.4 Developing visions and formulating strategies..................................... 73
5.4.5 Engaging in policy making ................................................................. 73
5.4.6 Process Issues...................................................................................... 74
5.5 Setting-up a foresight scenario mechanism at the European level ..................... 74
5.5.1 Providing overall objectives and context ............................................. 74
5.5.2 Choosing the focus of the foresight..................................................... 75
5.5.3 Determining the scope of a foresight .................................................. 77
5.5.4 Setting the time horizon ..................................................................... 78
5.5.5 Developing the foresight study ........................................................... 78
5.5.6 Ensuring commitment of stakeholders................................................ 79
5.6 Establishment of a network of experts ............................................................. 80
REFERENCES.......................................................................................................... 83 Reference List ............................................................................................................ 85

RAND Europe
vii
APPENDICES .......................................................................................................... 89 Appendix A: OECD definitions of skilled employment ..............................................91
Appendix B: e-Skills reference framework...................................................................92
Appendix C: Persons contacted ..................................................................................93
Appendix E: Defining Professional E-skills by 2000 SOC ........................................101
Appendix F: E-skilled Employment Data on the EU-level in 2004...........................103
Appendix G: National e-skilled employment............................................................105
Appendix H: Overview of country specific data sources............................................108
Appendix I: Framework of reviewed studies..............................................................112
Appendix J: Future-oriented studies on demand and/or supply of e-skills .................119
Appendix K: Terms of reference ...............................................................................127


ix
Table of figures
Figure 1. Shortage, gap and mismatch in the ICT labour market............................................... 5
Figure 2. EU employment of “IT practitioners”, 1998-2004 ................................................... 35
Figure 3. EU employment of “ICT practitioners”, 1998-2004................................................. 35
Figure 4. EU employment in four ISCO 3-digit level e-skilled occupations, 1998-2004................................................................................................................................... 36
Figure 5. EU employment of “IT practitioners” by industry division, 1998-2004.................... 37
Figure 6. EU employment of “ICT practitioners” by industry division, 1998-2004................. 37
Figure 7. Total EU unemployment of “IT practitioners” and “ICT practitioners (in 1,000s) and as share of total number of “IT practitioners” and “ICT practitioners, 1998-2004 .................................................................................................... 39
Figure 8. Number of tertiary graduates in the field of computing, EF480, 1998-2003................................................................................................................................... 40
Figure 9. Number of tertiary education students in the field of computing, EF480, 1999-2003 ......................................................................................................................... 41
Figure 10. Education level of “IT practitioners” workforce, 1999-2004................................... 42
Figure 11. Education level of “ICT Specialists” workforce, 1999-2004.................................... 42
Figure 12. US employment (absolute and relative) of ICT practitioners, 1999-2003 ............... 44
Figure 13. Share of tertiary graduates in the field of computing, EF480, to total tertiary graduates EU and US, 1998-2003.......................................................................... 45
Figure 14. “IT practitioners” share of total employment, by EU country ................................. 46
Figure 15. “ICT practitioners” share of total employment, by EU country .............................. 46
Figure 16. “ICT practitioners” share of national employment, EU15 ...................................... 47
Figure 17. “ICT practitioners” share of national employment, Member States since 2004................................................................................................................................... 48
Figure 18. “IT practitioners” share of national employment, EU15 ......................................... 48
Figure 19. “IT practitioners” share of national employment, Member States since 2004................................................................................................................................... 49

The supply and demand of e-skills in Europe RAND Europe
x

xi
Table of tables
Table 1. Supply and demand indicators................................................................................... 29
Table 2. Industry divisions with highest stock (demand currently met) of ICT practitioner skills ................................................................................................................ 34
Table 3. ICT practitioner employment by occupation (2000 SOC) in the US......................... 44
Table 4. Jobs for which there is a perceived scarcity in Latvia................................................... 53


xiii
Glossary
APO German Advanced IT Training System
BISER Benchmarking the Information Society: e-Europe Indicators for European Regions (EU funded project)
CEDEFOP European Centre for the Development of Vocational Training
CEPIS Council of European Professional Informatics Societies
CompTIA Computing Technology Industry Association
EF Field of education classification (ISCED)
EITO European Information Technology Observatory
EUCIP European Certification of Informatics Professionals
EUQuaSIT European Qualification Strategies in Information and Communications Technology
FISTERA Foresight on Information Society Technologies in the European Research Area
ICT Information and Communication Technologies
IPTS Institute for Prospective Technological Studies
ISCED International Standard Classification of Education
ISCO International Standard Classification of Occupations
ITAA Information Technology Association of America
LFS Labour Force Survey
NACE Nomenclature generale des Activites economiques dans la Communaute Europeenne (Nomenclature of economic activities in the EC)
NeDAP Northern eDimension Action Plan
NSO National Statistical Office
OECD Organisation for Economic Cooperation and Development
SFIA Skills For the Information Age
SOC Standard Occupational Classification


RAND Europe Executive Summary
xv
Executive Summary
The report documents an in-depth study into the supply and demand of e-skills within the European Union, summarises current understanding of the state-of-play within 2004, in particular in relation to ICT Practitioner skills, and presents an analysis and proposed framework for building Foresight Scenarios in this area. The study’s approach is presented through the following steps:
- A review of existing supply and demand studies, expert interviews, and the development of a taxonomy of e-skills research;
- A presentation of different approaches to estimating e-skills supply and demand, and their advantages and disadvantages;
- An analysis of the situation in 2004 relating to the supply and the demand of e-skills in Europe, based on the most recent statistical data available; and
- An overview of recent future-oriented studies on e-skills on the basis of which a framework for conducting e-skills foresight studies is proposed.
The study has found that there is comparatively very little consistent, reliable quantitative evidence available in relation to clarifying the factual situation of the supply and demand of e-skills at the European level. However, for the best understanding of supply and demand within these constraints, the report recommends combined use of the seven following complementary indicators, in particular in relation to ICT Practitioner skills:
(1) Unemployment in e-skilled occupations;
(2) Number of graduates in educational fields of relevance to e-skills;
(3) Number of issued training certificates for training of more than a minimum amount of days;
(4) Current employment in e-skilled occupations;
(5) Unfilled or hard-to-fill job vacancies in e-skilled occupations;
(6) Replacement demand; and
(7) Replacement of jobs by off-shoring activities.

The supply and demand of e-skills in Europe RAND Europe
xvi
Detailed recommendations are made of ways in which data gathering for these key indicators might be strengthened and improved, together with information on any current work being undertaken in that direction.
A wide range of data is shown for the development over recent years of key relevant employment and education indicators for all Member States, both types of data provided by Eurostat, and these results allow a considerable amount of interpretation and comparison in support of e-skills policy analysis. The employment data, based on the occupation proxy for skills, is differentiated into IT Practitioner and the broader ICT Practitioner areas.
- The best evidence available confirms that there were, in 2004, no widespread significant shortages of ICT (or IT) Practitioner skills within the EU, although the growth in demand for skills for certain ICT Practitioner occupations (both computing professionals and optical and equipment operators showed considerable increase in 2004) was greater than for others (for example continuous decline since 1998 in the group of electrical and electronic equipment mechanics and fitters), and it also appears that employment was comparatively high in some of the new Member States (such as the Czech Republic, Latvia, and Malta)
- The under-representation of women in ICT Practitioner occupations (compared to men as well as to women in other occupations) continues to be an issue.
- There are some indications that this situation has changed in 2005, during which overall employment has begun to grow (Belgium, Spain), and notably in some Member States (Latvia, Lithuania, Malta, and Slovak Republic)
In considering how best to undertake the estimating of future e-skill needs in Europe, the report lays the foundations for a consistent EU-level approach to the development of Foresight Scenarios.
In particular, it explains how a foresight process can facilitate multi-actor policy analysis and policymaking: foresight brings together a range of relevant stakeholders each of whom can provide different and valuable insights on the future development of e-skills. Instead of attempting to “squeeze” these viewpoints into the same framework, a foresight process recognises differences of opinion and aims to find a common ground for decision making.
To achieve adequately robust understanding, the possibility of structural changes needs to be addressed with the use of a set of scenarios. This analysis and discussion would need to be an ongoing process, with reviews increasingly possible of differences between previous forecasts and actual developments.
Overall, the report provides a significant amount of important information on which future EU e-skills analysis and foresight development can be built.

RAND Europe Introduction
1
CHAPTER 1 Introduction
1.1 The role of ICT skills in the economy
Over the last two decades, the rapid and continuous uptake of new information and communication technologies (ICT) has resulted in many changes in the way we work. It is generally acknowledged that, when effectively implemented, the introduction of new ICT contributes to economic productivity and growth. As such, European policy makers see innovation in the ICT sector, and increased take-up of ICT in other sectors, as an important means of attaining the Lisbon goals1 and have addressed this in detail in the eEurope action plans and the recent i2010 initiative. 2
As ICT has become such an important element in the working lives of many European citizens, so has the demand for ICT-related skills, both in terms of the “ICT practitioners (or professionals)” who design, build and maintain products and systems, and of the (very much larger numbers of) “ICT users”. Consequently, concerns about the supply of these skills have become of considerable interest to policy makers – a smoothly operating ICT jobs market is felt likely to increase effective ICT use and so to increase industrial efficiency and economic gains. In hindsight, we see that around the year 2000 the expected need for skilled ICT workers was overestimated3 and partly exacerbated by the anticipated problems of the millennium transition. Despite the economic problems in the ICT sector, expectations about future gaps, shortages, and mismatches remain high, as the supply of properly qualified personnel has been perceived as lagging behind the demand.
To get a grip on the extent of the e-skills gap, several approaches have been undertaken to measure demand, supply or both. These efforts have run into methodological difficulties, definition questions and incomparable results. Furthermore, the ICT ‘bubble’ – the period of inflated expectations about the growth of the ICT market – still influenced forecasts based on projections made in the first years of this decade. As we now know that these expectations were exaggerated, it is time for an objective effort to measure the current and future demand for e-skills in the European Union (EU) and compare the outcomes to
1 The EU’s aim “to become the most competitive and dynamic knowledge-based economy in the world, capable of sustainable growth with more jobs and greater social cohesion”, as formulated in March 2000.
2 See http://europa.eu.int/information_society/eeurope/i2010/i2010/index_en.htm
3 A good example of this was the IDC/EITO 2001 study expecting millions of unfilled vacancies.

The supply and demand of e-skills in Europe RAND Europe
2
developments in the United States (US), which remains a crucial point of reference for ICT developments. This effort will provide an important base on which foresight scenarios can be built at the European level – something of growing interest to policymakers and experts.
1.2 Objectives of the study
Based on the growing interest in this field, RAND Europe was commissioned by DG Enterprise and Industry of the European Commission to undertake a study of the supply and demand of e-skills in Europe. The study had a two-faceted character.
First, the study aimed to provide an in-depth analysis and assessment of the situation of e-skills in 2004 based on various published studies, collected data, and interviews with experts and relevant stakeholders. This analysis also led to recommendations on definitions, use of indicators, and improvements for (statistical) data collection.
Second, the project examined existing forecasting activities and foresight scenarios in the Member States. Based on this, concrete proposals for the establishment of foresight mechanisms and the establishment of a European network of experts were developed.
For the exact terms of reference, please see Appendix K.
1.3 Outline of the report
This report covers work performed between January and September 2005. It considers different approaches used when studying supply and demand of e-skills; it describes and analyses the current situation relating to the supply and demand of ICT practitioner skills in the European Union and its Member States, together with comparable information from the US as contrasting nation.
The steps in our analysis are presented as follows:
� Selection of existing supply and demand studies, expert interviews, and developing a taxonomy of e-skills research publications (Chapter 2).
� A presentation of different approaches and their advantages and disadvantages (Chapter 3).
� An analysis of the situation in 2004 relating to the supply and the demand of e-skills in Europe based on the most recent statistical data available (Chapter 4).
� An overview of future-oriented studies on e-skills on the basis of which a framework for conducting a foresight study on the future of the ICT skills market is proposed (Chapter 5).

3
CHAPTER 2 Scope and methodology of the study
2.1 Definitions of e-skills
The term “e-skills” is often used as the encompassing concept of all skills related to ICT-activities. This concept, however, is not uniformly applied or understood. E-Skills are defined in different ways across different studies. Most often, e-skills are interpreted more directly as (synonymous with) ICT skills.
The European e-Skills Forum (2004) discussion on e-skills has resulted in definitions for three different types of skill.
• ICT user skillsICT user skillsICT user skillsICT user skills: the capabilities required for effective application of ICT systems and devices by the individual. ICT users apply systems as tools in support of their own work, which is, in most cases, not ICT. User skills cover the utilisation of common generic software tools and the use of specialised tools supporting business functions within industries other than the ICT industry;
• ICT practitioner skillsICT practitioner skillsICT practitioner skillsICT practitioner skills: the capabilities required for researching, developing and designing, managing, the producing, consulting, marketing and selling, the integrating, installing and administrating, the maintaining, supporting and service of ICT systems.
• eeee----Business skillsBusiness skillsBusiness skillsBusiness skills: the capabilities needed to exploit opportunities provided by ICT, notably the Internet, to ensure more efficient and effective performance of different types of organisations, to explore possibilities for new ways of conducting business and organisational processes, and to establish new businesses.
Although there are a considerable number of different definitions and types of skills distinguished (e.g. the OECD (2002; 2004) differentiates three types of ICT skills4 that cover different domains of e-skills although some of these overlap), this study has taken the European e-Skills Forum definitions as the starting point for its analysis.
4 The OECD (2002; 2004) distinguishes: 1) basic skills (using generic tools like word processors, internet browsers and email clients); 2) advanced skills (using advanced and often sector-specific tools for the administration and manipulation of data and digital media); and 3) specialist skills (developing, maintaining and operating ICT systems). Thus, compared to the European e-Skills Forum definitions, ICT user skills have been separated out into basic and advanced, while “specialist” is preferred to “practitioner” for those whose work is fully dedicated to ICT activity for the benefit of others.
The supply and demand of e-skills in Europe RAND Europe
4
To avoid any misunderstanding, we point out that ICT practitioners do not only work in the ICT sector. Furthermore, more than half of ICT practitioners work in different types of ICT-support functions in all sectors of the economy (both private and public). In addition, it should be recognised that ICT practitioners also require ICT user skills in carrying out their work and ICT users can “progress” into ICT practitioner work (and very many do).
E-Business skills are said to play an increasingly important role in a company’s competitiveness; they are strategic in nature and are related to innovation management. It should be noted, however, that these skills are not the same as ICT skills but represent an intersection between ICT skills and (other) business skills.5 Basically, ICT skills focus on the question of how to deploy (practitioner) and use (user) ICT, whereas e-business skills focus on the question of what to do with ICT (for an organisation).
The distinctions between these three types of e-skills are important in a number of ways, and especially in relation to the attempts to track and measure their supply and demand that will be the focus of the report in following sections. In particular, many aspects of ICT Practitioner skills can be tracked through (the proxy of) ICT Practitioner occupationsoccupationsoccupationsoccupations, while this is not possible for ICT User or e-Business skills (because there are no “ICT user” or - currently – “e-Business” occupations). Tracking occupations brings considerable advantages, since there is a comparative wealth of continuing data (publicly) available on occupations in official statistics from “general” – regular – surveys (both household and enterprise). Where analysis cannot benefit from such databases, specific primary research is required – (new) surveys involving questions specifically about (different aspects of) e-skills. This study reports on a number of these, although there have been very few at the European level (or even beyond the national level). Eurostat has been working to increase the coverage of e-skills within its annual enterprise and household surveys, and this data will become increasingly valuable in supporting objective analysis of e-skills at the European level.
Shortage, mismatch, gap As indicated in the introduction of this report, a smoothly operating labour market requires a balance between the supply and demand of these various sets of skills. The expectations are, however, that the supply will not be able to keep up with the demand for a variety of reasons. An important element in this discussion is to describe what problem(s) lie(s) at the heart of any discrepancy between supply and demand for an e-skilled workforce. This discrepancy may carry qualitative or quantitative characteristics. The European e-Skills Forum (2004) has defined the various deficiencies as follows:
• ShortageShortageShortageShortage: a quantitative lack of skilled people in the labour market; in other words: there are not enough people in the workforce that can perform ICT jobs;
• GapGapGapGap: a competence shortfall between current and needed competence levels of (employed) personnel; in other words: the ICT practitioners do not (as perceived by their employer) have the complete set of required competences to an adequate
5 In practice, this could either be a person with predominantly business skills and some ICT skills, or an ICT practitioner with some business skills.

RAND Europe Scope and methodology
5
level. This shortfall would require one of the following responses: retraining, on- or outsourcing, or work reorganisation;
• Mismatch: Mismatch: Mismatch: Mismatch: a difference between the competence of the trainee or graduate and employers’ expected competence needs. Mismatches are assumed to arise from ‘inappropriate’ training or “mis-aligned” course curricula, ‘unrealistic’ requirements of employers or rapid technological advances (and learning providers’ required time to adapt to these changes)
These definitions can help clarify problems of the labour market, but can lead to semantic misunderstanding: discrepancies between demand and supply could either be due to a quantitative lack of skilled people (shortage) or to the qualitative discrepancies gap and mismatch. Figure 1 attempts to clarify the differences. If there are not enough people with ICT skills available when employers attempt to recruit, it is called shortage (1), if the ICT workforce has skills that are not adequate, it is characterised as a gap (2) and if education (and training – the term is less used in relation to training, although it is indeed possible that some training is felt not to have been very well aligned with employer skill needs) provision does not lead to an adequately skilled set of new recruits to the ICT practitioner workforce this is a mismatch (3).
Figure 1. Shortage, gap and mismatch in the ICT labour market
Dynamics play an important role in workforce requirements: new developments in ICT require new skills and may also lead to the devaluation of older skills (and lead to gaps). Furthermore, periodical updates of learning provision are required in order to mitigate mismatches; for the individual, life-long learning is required to mitigate skill gaps.

The supply and demand of e-skills in Europe RAND Europe
6
2.2 Focus of our study
The potential scope of a study considering all e-skills can be very large and may interest various groups of stakeholders. An increasing number of studies focus on (basic and advanced) user skills, as participation of citizens in the knowledge society is an important policy issue.6 There are implications for productivity here, and this is obviously an important element in the goals that are formulated under the Lisbon agenda.
At the same time, the competitive and innovative positions of various economic sectors remain dependent on the supply of practitioner skills and the rapid development of e-business skills. Thus, without neglecting the importance of user skills and the social inclusion objectives, this study focuses onthis study focuses onthis study focuses onthis study focuses on ICT practitioner an ICT practitioner an ICT practitioner an ICT practitioner and ed ed ed e----business skillsbusiness skillsbusiness skillsbusiness skills....
As indicated before, many aspects of ICT Practitioner skills can be tracked through (the proxy of) ICT Practitioner occupations, while this is not possible for ICT User or e-Business skills (because there are no “ICT user” or - currently – “e-Business” occupations). Therefore, when discussing e-skilled occupations, in the context of this report, we primarily target those occupations that require practitioner skills. Where available, we include findings that focus specifically on e-Business skills as well.
As we have emphasised in the previous section, ICT practitioners do not only work in the ICT sector. Therefore, in this study we focus not only on the ICT sector specifically, but Therefore, in this study we focus not only on the ICT sector specifically, but Therefore, in this study we focus not only on the ICT sector specifically, but Therefore, in this study we focus not only on the ICT sector specifically, but also consider other economic sectors with considerable also consider other economic sectors with considerable also consider other economic sectors with considerable also consider other economic sectors with considerable needs for ICT practitioner skills.needs for ICT practitioner skills.needs for ICT practitioner skills.needs for ICT practitioner skills.
2.3 Data sources used for analysis
The study was not intended to conduct primary data collection. As a result, two different types of secondary data sources were used.
First, the most recent studies on the supply and demand of e-skills – with a focus on ICT practitioners and e-business skills – were an important basis for the analysis. We identified a large number of studies describing the ICT practitioner job market that were undertaken just before or just after the millennium change. Some of these reports were considered, but the focus was particularly on studies from 2002 to 2005, as these are likely to shed light on the newest developments and issues. Second, large data sets on ICT and IT practitioner employment and education (as collected in large, regular, general surveys by statistical agencies primarily) were analysed. The next sections provide a more detailed breakdown of these information sources.
2.3.1 Studies and reports In addition to purely official statistical sources, there are a number of organisations that collect and analyse information concerning e-skills. On the national level these include ministries of information or economic affairs, national planning offices, organisations of ICT practitioners, organisations of ICT (service) suppliers, job agencies (public and private), business associations or academics in the field of information technology or
6 This has recently been reinforced by the i2010 initiative, with ‘inclusion’ as one of its three pillars. (See http://europa.eu.int/information_society/eeurope/i2010/index_en.htm)

RAND Europe Scope and methodology
7
labour studies. In order to identify all these potential sources, we contacted the members of the European e-Skills Forum and the Northern eDimension Action Plan (NeDAP) e-skills working group and asked them for pointers to national studies.
At the European and trans-national level, we looked at the work of major (ICT) technology, education and practitioners’ organisations: the Career-Space project (an industry consortium aimed at describing the roles, skills and competencies required by the ICT industry in Europe), Cedefop (European Centre for the Development of Vocational Training), CEPIS (Council of European Professional Informatics Societies), CompTIA (Computing Technology Industry Association), EITO (European Information Technology Observatory), the EUCIP programme (European Certification of Informatics Professionals), and IPTS (Institute for Prospective Technological Studies).
In order to address the second, future-oriented perspective of the study, we performed a systematic review of recently conducted future-oriented studies on e-skills, including some of the reports identified in the first phase. In addition, we searched the literature using the search terms “foresight”, “forecast”, and “e-skills” and examined databases containing foresight related data such as the Dynamo system (a

The supply and demand of e-skills in Europe RAND Europe
8
2.3.3 Interviews In addition to the literature search, we contacted more than 30 experts in the field of ICT (skills), mainly from the previously mentioned organisations, to further identify data and sources. With some 15 experts we had extensive contact to clarify a number of questions, including:
• What is the current state of the art concerning studies on the demand and supply of e-skills?
• Which areas are most problematic concerning the skills match? Where do gaps occur and in which areas does demand exceed supply?
• Which type of studies do policy makers use?
• Which definitions of e-skills are currently used?
• Which indicators have proven to be feasible, valid and reliable?
• In which direction are e-skills studies currently developing?
2.3.4 Meetings and workshops Finally, a number of meetings and workshops were organised to reflect on intermediary findings of this study and to collect ideas about, among others, improvement of data collection.
First of all, we met with representatives of Eurostat (12 April 2005) to address ongoing initiatives with respect to the possibilities of the various surveys (Labour Force Survey, Household Survey on ICT usage, Enterprise Survey, CVTS, Job vacancies survey) that Eurostat has set up, and improvements or changes that were foreseen with respect to these surveys, in particular the development of new indicators. Eurostat officials present were: Ana Franco (Labour Force Survey), Christophe Demunter (Household Survey), Birgitta Andrén (Education and Culture), and Fernando Reis (Enterprise Survey).
Second, on 13 April 2005, we talked with two OECD officials, Graham Vickery and Desirée van Welsum, both of the Information, Computer and Communications Policy Division within the Directorate for Science, Technology and Industry. During this meeting several issues were discussed:
• focus of analysis of OECD activities,
• projections of ICT employment
• composition of the ICT skill requirement within the workforce
• definitional issues related to e-business skills
• feasibility of data analysis at a more detailed level
In addition to these meetings, two workshops were convened to discuss the interim and draft final report. The first meeting was organised in Brussels (4 April 2005) and focused on the intermediary findings of the study. The second meeting took place at Cedefop in

RAND Europe Scope and methodology
9
Thessalonica (23-24 June 2005)8. This workshop resulted in a very useful exchange of views and an extensive list of comments and suggestions that were subsequently incorporated in the final report. The list of participants in both workshops is incorporated in Appendix C.
2.4 Framework for classification / taxonomy
The body of research and literature on e-skills is vast and varied. In order to structure the material, we applied a taxonomy that could provide a quick overview of the key issues while preserving the empirical richness of the different sources. This taxonomy was used to summarise the following factors:
• Definition of e-skills: one general definition of e-skills, or several definitions of different levels of e-skills.
• Purpose of the study: assessments of current supply and/or demand versus foresights, assessment of e-skills among other skills or topics.
• Measurement instrument: performance tests, analysis of existing labour market statistics (job profiles), self-report survey, qualitative assessments of skills matches.
• Indicators: performance levels, amount of training, ICT usage, work experience or job profiles.
• Sample: geographical reach, economic sector, target population, sample size.
• Methodological quality of the study: validity, feasibility, and reliability.
• Organisation of the study: national or international statistical offices, one organisation or consortia, private or public sector.
• Policy context: clients, targeted users.
To ease presentation we summarised the information in a table that addresses the following questions:
• Who/what is assessed?
• By whom?
• By which methods?
• Using what data?
• When?
• Other remarks about geographic reach and status of the report?
The overview of the survey of existing sources structured in this way can be found in Appendix I. It is used as an information source for Chapter 3, to analyse different approaches in Europe and the US.
8 See http://eskills.cedefop.eu.int/em_june2005/

The supply and demand of e-skills in Europe RAND Europe
10
On the basis of an additional systematic literature review, we were able to identify a number of futures studies on e-skills that were described in relation to:
• Principles for foresight - developed for improving the science/policy relationship with the help of foresight (RAND Europe, 2005).
• Specific e-skills issues related to foresight assessments as identified in phase 1 of the study.
On the basis of reviews of futures studies, limitations were identified that relate to the way futures studies on demand and/or supply of e-skills are currently undertaken. This analysis was then used as an input to develop a framework for conducting futures research on the future of the ICT skill market (Chapter 5).

11
CHAPTER 3 Review of current e-skills studies
An analysis of the current situation related to the supply and demand of e-skills in Europe must consider the results of recent and ongoing activities. Not only do these studies inform the analysis of the current situation, they provide insight into the various perspectives that need to be considered. In addition, the various data collection and analysis methods used in the studies shed light on where future efforts can be strengthened and supported. This chapter reviews the studies, highlighting issues that will require further attention. In particular, this review is used to provide recommendations on definitions, indicators and approaches that could be used in order to provide more meaningful future analysis of the supply and demand of e-skills in Europe.
Our literature review yielded recent studies addressing e-skills stock, supply, demand, and shortages (see Appendix I). These studies can be analysed in a number of different ways. For example, the focus or purpose of the studies is an important factor, as it generally determines the methods used and the level of detail of the data collection. Another important factor is the framework in which e-skills are defined, and the ways in which e-skills are tracked and measured (these two elements are closely connected).
3.1 Focus or purpose of studies
A range of organisations have addressed the issue of e-skills: ministries, agencies, industrial consortia, practitioners’ associations, social partners, and research organisations. These organisations focus on the topic for different reasons and, as would be expected, skills are addressed at a level of detail that is most relevant for the purposes of each study. Although attempts are being made to integrate different approaches to skills and skills definitions (e.g. Cedefop 2004), it is necessary to first describe the various foci that can be taken when addressing the issue.
Topical focus Several studies go beyond an analysis of e-skills only. These studies try to capture the function of ICT in society and how it is not only affecting work, but life more generally, and government and business as well. The reports that specifically focus on e-skills in relation to training, education or employment can be roughly divided into two main categories: those studies that focus on assessing the specific e-skills profiles required for specific jobs (e-skills requirementsrequirementsrequirementsrequirements) and those that are aimed at estimating the presence of (specific) e-skills in occupations within the total labour force or segments thereof (e-skills estimatesestimatesestimatesestimates).

The supply and demand of e-skills in Europe RAND Europe
12
EEEE----skills skills skills skills requirementsrequirementsrequirementsrequirements are of interest to ICT practitioner organisations and organisations

RAND Europe Review of current e-skills studies
13
1. People exercising jobs where they are likely to make intensive use of ICT in order to produce their output.
2. The job output can be traded/transmitted with the help of ICT (ICT-enabled trade in services).
3. The work has a high explicit information or “codified knowledge” content (and no or little tacit or implicit knowledge).
4. The work does not necessarily require face-to-face contact.
Although this list of criteria leads to the potentially worrying conclusion that some 20% of total employment in the EU15 could be affected by international outsourcing, Shapiro and Millard (2004) as well as OECD itself point out that jobs lost to offshoring are relatively small in comparison to general job turnover. With the exception of the UK, the question of offshoring on a national scale is less well researched and reported (O’Sullivan, 2004).
Finally, migration migration migration migration issues come into play when immigrants are recruited to fill job vacancies. Until recently, it was believed that the predicted shortages in the ICT labour market in Europe would create a brain drain in poorer countries. However, the recent slowdown in the ICT sector has changed this outlook to some extent (and the return of some ICT practitioners after periods of experience in higher wage economies has undoubtedly enriched the “home skills-base”). A number of countries, such as the UK, Denmark, US, Germany and France have added IT specialists to their lists of “favoured immigrants”. The first three countries have already removed the special status for immigrants with ICT skills. Germany’s much-acclaimed Green Card scheme never reached the required maximum, and the number of ICT-skilled permit holders in France fell sharply, both absolutely and as a percentage of all foreign workers (OECD 2004). The feasibility of such schemes in the future will depend on a number of political factors as well as the shortages experienced in the labour market.
National focus About half of the surveyed studies focus on the national level.9 The prime example here is the UK, where e-skills UK10 has recently commissioned and finalised a series of reports on demand, supply and forecast of the e-skilled workforce in Great Britain. The year before, the UK’s Learning and Skills Council issued a report on skill shortages – although broader than e-skills only.
In Spain, the ICT industry associations AETIC (formerly ANIEL) and COIT committed themselves to annually report on developments in ICT education and professions, which has resulted in a series of reports that are of varying quantitative and qualitative nature (PAFET 1, 2, 3).
The Information Technology Association of America (ITAA) has performed an annual survey over the last 7 years concerning IT practitioner employment and skills shortage in
9 As will be shown in Chapter 4, more data is available, but not as reports
10 E-skills UK is an organisation dedicated ‘to ensure that the skills employers need are the skills employers get’

The supply and demand of e-skills in Europe RAND Europe
14
the US. Although this effort is based on a relatively small sample size (500 organisations), it provides a consistent, evolving overview of the situation in the US.
Other national efforts that we identified either cover a much broader range of ICT aspects, devoting relatively little direct attention to e-skills, or do not seem to have the consistent attention to e-skills as the examples provided above. Furthermore, definitions of e-skills may differ at the national level, making detailed EU comparisons difficult. The existing data on supply and demand of ICT and IT practitioner skills at the national levels is presented in the following chapter. A cross-country comparison of the outcomes cannot be conducted without caution.
3.2 Tracking and measuring ICT Practitioner skills
The fact that varying definitions and foci of e-skills exist inevitably influences what different studies report - and at what level of detail. This has serious adverse consequences for efforts to compare between studies and produce EU level estimates. The purpose of any study strongly influences the level of detail chosen. Looking at e-skills in order to streamline requirements or frameworks for national ICT education curricula needs different approaches and types of indicators than an analysis of general trends in the job market.
When considering the supply and demand of ICT practitioners, there are a number of ways in which e-skills can be measured. The following sections of this report examine and discuss three main approaches to tracking and measuring skills, using data relating to 11:
• Occupational profiles;
• Skills profiles (which according to some includes the occupational approach);
• Formal education and additional training.
3.2.1 Occupational classifications
ISCO General employment statistics based on occupational classifications or profiles provide a picture of the stock of ICT-skilled employees and the fluctuations in that stock over time. In the EU, Eurostat collects information, in cooperation with NSOs, on employment according to occupational profiles for its holdings of Member State Labour Force Survey (LFS) data using the so-called ISCO-codes (International Standard Classification of
11 The amount of quantitative data available for all Member States in the EU that is both statistically valid and directly comparable between countries is very limited. The relevant data that does exist is of two main kinds: 1) data from specific (“one-off”) surveys (both of employers – “enterprise surveys” and of individuals – “household surveys”) that are carried out from time to time for specific purposes, and 2) Data from general surveys (both enterprise and household) that are carried out regularly by National Statistical Offices (NSOs). While data from specific (skills-related) surveys is often more precise and informative, meaningful comparison and assembling of meaningful EU-level estimates on a regular basis is only possible from general surveys. For a more detailed description of data availability and sources, see 4.2.

RAND Europe Review of current e-skills studies
15
Occupations).12 The OECD also uses these codes (which were developed and defined under the auspices of the ILO) in its analyses (OECD 2002; 2004).
However, these ICT occupational profiles are only an approximation of ICT skills, since they specify (what is agreed to be) what people in the occupation do (rather than what skills the individual working in that occupation possesses in order to be able to perform competently). A number of sources (OECD 2004, CEPIS 2002, WANE 2003, Cedefop 2004, STILE 2004) point out that there are some significant drawbacks in using ISCO88:
• The level of detail practically available is quite low: although ISCO-codes are defined at a reasonably detailed 4-digit level, gathering enough survey data for there to be meaningful results at that level would require very large data sets across European countries. The most important source for this data is the Eurostat LFS datasets for which Member State NSOs are only required to submit 3-digit level ISCO data.
• The classification system was designed prior to the ICT developments in the nineties and therefore does not include many modern ICT job categories.
• Furthermore, the STILE (2004) research point out that different countries apply the codes differently. As a result, using a range of ISCO88 codes to “track” ICT practitioners leads to wrong inclusions and/or wrong exclusions.
The most precise definitions of “IT practitioners” in ISCO are codes 213 (Computing professionals13) and 312 (Computer associate professionals14); these are the codes used in, for instance, CEPIS (2002) and by Eurostat in the Household Survey on ICT Usage to assess the skills applied in “ICT jobs”. It is argued that the practitioners that fall under the two categories - predominantly software engineers and technicians, systems analysts and software development specialists - represent the core of IT technical staff. However, just focusing on these codes will excludeexcludeexcludeexclude a number of occupations that require e-business skills, such as IT managers, computer operators, computer engineers, computer sales staff, IT workers in education, telecom practitioners and electronics engineers. Furthermore, they only represent IT practitionersIT practitionersIT practitionersIT practitioners and do not include professions in communications technology.
Others criticise the use of these professional and associate professional occupational categories because of their assumed primary focus on those with higher education with the consequent risk of exclusion of those who came via vocational routes (EUQuasit 2004).15 Therefore, some broaden the definition by including codes 313 (optical and equipment
12 The 1988 version is abbreviated as ISCO88
13 Computing professionals conduct research, plan, develop and improve computer based information systems, software and related concepts, develop principles and operational methods as well as to maintain…systems…ensuring integrity and security of data.
14 Computer associate professionals provide assistance to users…, control and operate computers and peripheral equipment and carry out limited programming tasks connected with the installation and maintenance of computer hardware and software.
15 The term ‘professional’ would imply that the person in question has enjoyed higher education (there is an explicit link between ISCO code and educational level as defined in ISCED) and thus excludes practitioners with lower education level, but still high skill level.

The supply and demand of e-skills in Europe RAND Europe
16
operators) and 724 (electrical and electronic mechanics and fitters) (OECD 2002; 2004) and even 311 (physical and engineering science technicians) and 214 (architects, engineers and related professionals) (STAR 2001). The OECD (2004) study goes one step further by introducing a broad definition of ICT-skilled employment, which aims to include all those who can be considered “sector-specific ICT users” and “generic ICT users” (see Appendix A for OECD’s definition). Although the assumption that most of these occupations involve the use of computers is plausible, it blurs the picture of ICT practitioners to ‘those occupations that may be involved in computer use’ as it includesincludesincludesincludes practitioners that may or may not be knowledgeable about ICT practitioner skills and e-business skills.16 The theoretical solution is to describe the professions at a more detailed level. Within the structure of ISCO, the 4-digit level descriptions generally allow a much more precise inclusion and exclusion of occupations. This approach is applied in EUQuasit (2004), which classifies ICT practitioners in 16 ICSO88 (4-digit) unit groups17. The authors argue that this classification is subject to interpretation of what occupations require ICT practitioner skills and in that sense may be considered imperfect. However, by covering communications, ICT management, marketing and sales practitioners, it provides a more comprehensive coverage of e-skilled occupations compared to the narrow view on IT- or Computer professionals often used. The important question when dealing with detailed definitions is:
1. to what extent data is available for these “finer grain” occupations;
2. what is the sample size of the survey used; and, so
3. whether using that data would lead to reliable results.
Also, as pointed out by the STILE project (2004a, 2004b) and EUQuasit (2004), the translation of national occupational classifications to ISCO-codes is problematic. There are efforts underway to revise ISCO88 that would make it more compatible with other ICT occupational frameworks and to incorporate new occupational profiles (related to types of ICT practitioner). However, this revision is not expected before 2008.18
Other occupational classifications LFS data held internationally using ISCO88 has been translated from (official) national occupational classifications. Generally these classifications have more than two categories for ICT practitioners, and are therefore generally more useful than ISCO for assessing ICT practitioner employment. The UK’s Labour Force Survey and the US Bureau of Labour
16 For example, ISCO 313 harbours photographers and image & sound recording equipment operators, medical equipment operators; ISCO 724 e.g. harbours electrical cable installers, repairers and cable jointers.
17 Sales and marketing managers (1233), Computing services manager (1236), Production and operation managers in communications (1226), Managers of small enterprises in transport, storage and communications (1316), Computer systems designers, analysts and programmers (2131), Computing professionals not elsewhere classified (2139), Electronic and telecommunications engineers (2144), Electronics and telecommunications engineering technicians (3114), Computer assistants (3121), Computer equipment operators (3122), Broadcasting and telecommunications equipment operators (3132), Data entry operators (4113), Calculating-machine operators (4114), Salespersons for ICT (5221), Electronics mechanics, fitters and services (7242) and Telegraph and telephone installers and services (7244).
18 This timeline is based on conversations with Eurostat.

RAND Europe Review of current e-skills studies
17
Statistics each use their own Standard Occupational Classification systems (SOC90, revised to SOC2000 and currently again in revision in the United Kingdom, and 2000 SOC in the United States); the Australian Bureau of Statistics uses ANSIC; and Canada uses its own New Occupational Classification. Although these classifications may be more useful for coding ICT occupations, the fact that they are all different means that they are not very useful for purposes of international comparison, nor do international statistical organisations support them. Therefore, we do not provide further detail for these classifications.
Sectoral data Labour Force Survey datasets not only have data on the occupational profile of the respondent, but also on the “main business activity” of his/her employer. This requires a framework for classifying different sectors in which the employment takes place. The accepted European framework is the NACE (Nomenclature générale des Activités economiques dans la Communauté Européenne), which is based on the International Standard Industrial Classification. As with the occupational data, national variations exist and practices differ in the codification of sectors (STILE 2004a; 2004b). This can result, as for occupational data, in errors occurring in the translating of data from national frameworks to NACE.
The US, Canada and Australia/New Zealand have different and sometimes more specific sectoral codes, which are better equipped for measuring the ICT sector because they account for the development of new industries and technological innovations (WANE 2003). As is explained in EUQuaSIT (2004), the ICT sector covers a broad range of NACE codes and care must be taken when addressing different specific sub-sectors.19 However, for comparison within the EU the NACE codes are useful. In the coming years the current NACE system will be revised and updated to include a specific section on the ICT sector.
3.2.2 Skill-based classifications Standard occupational classification systems tend to be too static to capture the changing landscape of ICT and the ongoing creation of new ICT tasks. As such, they are generally felt to be inadequate for the task of charting ICT jobs. For example, the IT National Training Organisation in the UK has estimated that labour force survey estimates (based on SOC90) may underestimate IT Practitioner jobs by up to 40 percent, because a number of IT Practitioner occupations are excluded (WANE, 2003, and paragraph 3.2.1 above).
An alternative is to attempt to track skills directly rather than assume them to be present in certain occupations. A number of skill-based classification systems – such as the UK’s Skills For the Information Age (SFIA), German Advanced IT Training System (APO), or the NWCET IT Skill Standards in the US – have been recently compared and analysed for
19 It should be noted that errors occur when LFS respondents attempt to classify the “main business activity” of their employer. This results in a recognised limitation of the validity of sectoral distribution of LFS data, which should where possible be cross-checked against employment data from employer (enterprise) surveys. Such errors are generally restricted to some 10-20%.

The supply and demand of e-skills in Europe RAND Europe
18
development into an encompassing framework for ICT Practitioner skills in Europe. Cedefop (2004) reports that “there is really not a work and skill level system, classification or framework which has a national or European wide recognition and which is easy to use for the split of employment”. Hence, the number of studies using these skill-based classification systems for quantifying supply and demand of skilled workers remains low. They are therefore of limited use in quantitative comparisons.
e-Business skills Many reports refer to e-business skills: there seems to be wide agreement that ICT skills need to go beyond the pure technical matters. However, in the literature that we have reviewed there are few attempts to qualify let alone quantify this specific set of skills. It seems that e-business skills are by definition plural: they are a (unspecified) combination of business and ICT skills and as such very difficult to capture.
The Irish Expert Group on future skills needs (2000) defines e-business skills as a mix of business, creative and technical skills, that are partially learnt in disciplines such as: business studies, commerce, multimedia, information systems (combinations of business science and computing), design, communication studies, fine art, and also librarianship, journalism, film/TV/video studies, and photography. Although many of these disciplines nowadays involve computing, this broad and unspecified description would lead to wrong inclusions if an attempt at quantification were made.
IDC/EITO (2001) take the occupational approach in defining e-business skills as those skills needed by internet business strategists (e.g. online marketing professionals, CIOs, internet economy architects) and internet-dependent professionals (e.g. e-commerce project managers, editor-content managers, web banner designers, product information brokers). It is not completely clear what occupations fall under these headings, but it is clear that this approach has not been followed by other initiatives; it thus provides very little opportunity for international comparison or validation.
As it is acknowledged that e-business skills are an important element in the discussion about future skills needs, these skills are considered as falling within an integrated (albeit not clearly definable part of) general e-skills framework. Until e-business skills emerge or distil into clear occupations, the only way that internationally quantitative data will be available would be from (new) primary research (survey work).
3.2.3 Formal education and additional training A third way to take stock of skills is to use indicators of formal educational qualifications or training episodes as a proxy measure of skill development and/or supply. However, the assumption that formal education in computing is directly related to a set of relevant e-skills (even just for ICT Practitioners) is not sustainable. Achievement at higher education levels or qualifications as defined by the ISCED97 (International Standard Classification of Education – 1997 version) categories does not automatically translate to higher ICT practitioner skills (although, of course, they do relate to an extent) and the knowledge delivered through higher education provision may be mismatched with employers’ needs.20 20 Indeed this is often reported, and many new graduates recruited for ICT Practitioner work have graduated in non-ICT subjects

RAND Europe Review of current e-skills studies
19
This is a core issue for educators and trainers, but also employers and employees, especially with regard to the ‘interchangeability’ of qualifications in an international (European) context. Cedefop (2004) identifies the main problems:
• There is a lack of common definitions of ICT skills and skill levels relevant for ICT employment;
• There is a lack of qualification (learning output) definitions and qualification levels relevant for ICT education;
• There are few common approaches to skill and training standards and their assessment and certification across the European Union;
• There is no way to validate the training, independent of when, where or how it has been achieved.
Attempts to elaborate an overarching framework for qualifications in a European Higher Education Area are being made as well as for vocational education. The US-based joint Taskforce for Computing Curricula (2004) recently drafted a reference framework for future use, comparing different types of computer curricula: computer engineering, computer science, information systems, information technology and software engineering, and proposing the kind of content that should be in each. The approach is of a qualitative nature. Also Cedefop (2004) attempts to integrate different qualification and education frameworks with skills frameworks (see Appendix B). However, until an agreed meta-framework is implemented at the international level, it requires estimates to quantify and compare formal education and training activities.21
3.3 Measuring e-skills
Attempts to track the demand and supply of e-skills are being made through a broad variety of methods. Most studies on e-skills address stock, the demand or the supply side, while the studies that assess both sides of the labour market often address each side with a different method. This complicates any effort to assess and compare supply and demand.
3.3.1 Stock The stock of employees, as measured by statistical offices through household survey data using occupational frameworks, provides information on the number of ICT Practitioners in employment accumulated over time by inflows (hiring) and/or depleted by outflows (retirement, replacement, job shift). This method gives information on the demand currently met and/or acceptable supply; however, it does not provide information on unmet demand or surplus supply.
The idea is that if the skills required for any “job” defined by its occupational title could be measured reliably and precisely, and if such data were available for all relevant occupations,
21 Under the assumption that university education in Europe is reasonably comparable (which is a bold assumption), a limited measure of e-skills supply would be the number of informatics students (ISC/EF code 480). For (on-the-job) training such a measure that specifies training content does not exist.

The supply and demand of e-skills in Europe RAND Europe
20
then the skills of the employed part of the population could be assessed through a simple count of occupational employment, as obtained through censuses or labour force surveys. Unfortunately, neither of the two conditions in the previous statement proves to be satisfied. Often, experts’ judgements of skills specified in terms of qualification requirements are simply made from the achievements of incumbents, which is not necessarily a good guide to the present and future requirements for new recruits to the occupation.
In addition, there can also be variation in the skills requirements even within fairly narrowly defined occupations: this derives from how individual jobs are configured. Ergo, even if a satisfactory (quantitative) measurement is conducted, a qualitative interpretation thereof is bound to be of limited value.
3.3.2 Supply There are, in principle, a number of ways to measure the skills present in a population as a whole or within the labour market more specifically. The most precise method is conducted at the level of the individual possessing the skills. Based on the recent studies on e-skills, we have made a classification of the various methods.
Direct testing There is a general presumption that the most valid way to assess the supply of (e-)skills is through direct testing, as this provides “objective” outcomes with regard to the quality of skills (against an agreed yardstick) – and thus also with regard to mismatches between employer needs and the capabilities of newly trained employees and/or skills gaps of the existing workforce. Examples of such tests are the UK Skills for Life Survey and use of the European Computer Drivers Licence (ECDL). However, these standards relate to user skills. When addressing ICT practitioner skills, the number of possible skills tests increases considerably, which makes it particularly difficult to establish an agreed set of generalised tests.
The Danish Technological Institute - DTI (2003) expects that testing beyond a narrow set of well-defined skills would either be too costly or would not successfully pass the tests of validity, reliability and transferability in a European context. Furthermore, as most computer environments and work processes are changing quite rapidly, it is unlikely that the same test could be applied in successive assessments separated across, for example, five years; measurement of progress is therefore difficult and gaps and mismatches would not be recognised. A further consideration is that any test of ICT skills would need a substantial amount of time (and corresponding scale of resources).
Self-assessment and self-report surveys Skills are often assessed through indirect measures, such as self-assessment or “peer” or “supervisor” assessment (e.g., asking how skilled someone is). The advantage is that a broad range of skills can be addressed. The disadvantage is that respondents are either biased about their own capabilities (social-esteem bias), or that they may have unreliable knowledge of their own skills.

RAND Europe Review of current e-skills studies
21
Self-reporting is not necessarily restricted to asking people directly about their skills, but could also require them to report on their job activities and ICT usage.22 As an indication of the skills of individuals, this method gives us only approximate measures. Job-holders may have too many or too few skills for the job and they could be asked to indicate whether this is the case. Also, it should be recognised that any national-level measures of skills obtained in this way would be strictly measures of the skills utilised in workplaces of each nation. Additional items asking respondents about skills gaps between the individual jobholder and the job requirements could add to our knowledge of over- and under-utilisation of skills. Nevertheless, the reliability of such responses in an international context would need to be evaluated. A third disadvantage is that the job analysis method cannot be applied to the economically inactive population (who - by definition - do not have jobs), although other approaches (in particular employer surveys) would have the same limitation.
Educational qualifications The (future) supply of skilled people can be estimated by measuring the number of (students enrolled and) graduates of each education/training institution that offers specific e-skills learning and qualifications. For schools and universities, national statistical offices collect this information. However, there is not a uniform framework for assessing the coverage and ‘value’ of specific educational profiles and thus the capacity of educational systems to generate the skills for work and life in general. If qualifications could be made internationally more comparable in a reliable and accepted manner, particularly for the fields that we are interested in, measurements of the number of qualified adults would be a useful indicator (DTI et al., 2003). In order to prevent the risk of mismatches, the curricula would have to be re-assessed regularly (e.g. every 3-4 years). In addition, it is important to recognise that many “new recruit” ICT Practitioners are graduates of non-Computing disciplines.
Training and certifications There is a wide range of professional training available that is offered by private training organisations (sometimes supported by professional or sectoral associations), and software or hardware vendors. Research has found that employers say the skills they require are not directly related to formal education (as such, educational provision can represent a mismatch of skills to what employers need, see CompTIA, 2004a and 2004b) and thus additional training is required.
Theoretically, it would be possible to amass the numbers of certificates documenting each successful completion of commercial IT (practitioner) training issued in every (European) country. However, such an effort would lead to a long list of specific courses and certificates that would be difficult to compare. In their study on e-skills certification systems, Weiss et al. (2005) also indicate that the majority of stakeholders and experts in this field are of the opinion that fewer, but more relevant, e-skills certification schemes would be desirable, and that Europe is confronted with too many systems and schemes.
22 It is clear that self-reporting could also be used in another context, such as in a household survey in which ICT usage is reported.

The supply and demand of e-skills in Europe RAND Europe
22
Furthermore, it seems that private training organisations do not make such data public, as it generally constitutes commercially confidential information. Nor are statistics on on-the-job training publicised by corporations. Therefore, interviews or surveys are the most often used method for gathering this information. CompTIA (2004a and 2004b) offers overviews and opinions (together with subjective market trends), but not numbers of certifications.
Number of unemployed A final measure of (potential) supply would be the number of unemployed within a specific occupation (as related to a specific occupational code). The larger the pool of unemployed, the higher is the (apparent) “untapped” supply of workers. On the one hand, this number informs us about the tightness of the skills/jobs market; on the other hand, it gives little qualitative information as the issue of the skills possessed by such people (which may be the reason why these individuals are unemployed)23.
3.3.3 Demand
Job vacancies Demand is often estimated by an analysis of the number of job vacancies for relevant occupations in a specific period for a specific country (e.g., by systematically reviewing and counting newspaper articles or analysing web-based job databases). Job vacancies can provide a crude measure of new demand, but may not take into account labour market dynamics. A more informative measurement would be unfilled or hard-to-fill vacancies (over a period of time), as this reveals real labour market supply shortages. Thus, unfilled vacancies is an indicator of unmet demand. To the extent that real skill shortages are a significant factor in determining the need for policy response, hard-to-fill vacancies is a very important indicator.
Employer surveys Often, the demand for skills is established through employer surveys or interviews, which ask for the number of people needed with a certain job profile or set of specified technical skills (for different economic sectors). This way of measuring is informative for finding shortages, as well as gaps and mismatches.
However, as discussed above, there is little uniformity in what set of skills are required for specific jobs. Also, it could be argued that these surveys are subject to bias as employers
23 It must be recognised what the data on numbers of unemployed “whose occupation is ICT Practitioner” -- that is derived from Member State LFS responses – actually represents. Clearly, no unemployed person can be viewed as having a (current) occupation, but in the same way that a Lawyer moving between practices does not cease to be a lawyer, it is not unreasonable for ICT Practitioners not currently in employment to view themselves as ICT Practitioners. Of course, lawyers may (and sometimes do) decide to quit and start some other kind of work. Likewise, not all “unemployed ICT Practitioners” will necessarily be seeking further work in this occupation. It is also true that some of this group might have lost their jobs because they were felt by the previous employer not to be performing adequately, and the skills of others in this group may be in need of updating. The key point, in terms of this group of people’s role as being one potential source of supply of ICT Practitioner skills (in addition to the others listed), is that they are a source of these skills precisely because they have direct experience in this work, and that (perhaps at the right price) they could (often very quickly) form part of the response to new demand.

RAND Europe Review of current e-skills studies
23
have an interest in boosting estimations of demand for e-skills so that governments will invest in this section of the labour market. Employer surveys are even more suspect when carried out by the ICT sector itself.
Nevertheless, certain specific issues can only be directly addressed by employer surveys: outsourcing/offshoring of jobs to non-EU countries is most directly measured by asking the employers what their plans are and to what extent they are already using offshored services: this clearly influences the demand for skilled professionals within the EU. As long as e-business skills are not captured in a specific occupational code, educational qualification or training profile, employer questioning remains the only option to find out about these specific skills.
Replacement demand Replacement demand is a specific qualification of the demand-side: although employment levels within an occupation may not grow over time, there will nevertheless be a net demand arising from the “attrition” of people leaving that occupation. The most obvious reasons for replacement demand are retirement of an older workforce, resignations, leave-of-absence, contract expiration and other categories such as deaths, dismissals and shifts to other functions. The replacement demand can either be estimated with an expected fraction of the stock that will need to be replaced (based on workforce characteristics such as age distribution or recent statistical evidence) or be estimated from employer survey questions.
3.4 Conclusions and recommendations
Based on this study’s analysis of current reports and discussions with experts, it emerges that recent approaches in addressing supply and demand of e-skills provide a mosaic picture of their current status in Europe. To some extent, this can be attributed to the different foci that the different stakeholder organisations and their researchers have: either targeting skills requirements and detailed qualitative descriptions of professions and skills (including skills gaps and mismatches), or targeting estimates of numbers of skilled employees and shortages in a quantitative sense.
The different definitions of skills and skill levels are closely related to the focus of the study. A detailed study on skills requirements would use a skills framework but would also have to cope with the differences that exist between different frameworks applied. It would have to rely heavily on 'translation tables' until such time as a single agreed European framework is available. Studies focused on estimating numbers of people have to cope with the limitations of existing international occupational and educational classification schemes. As indicated before, occupational codes from ISCO88 can lead to wrong exclusions and inclusions - avoiding such pitfalls would require more in-depth research at national level. While there are examples of this, they do not help for an analysis covering the EU-25 area.
Educational achievement statistics lack detail and are difficult to compare internationally on highly aggregated levels. In addition, tertiary education statistics for computing courses are only a limited indicator of skills required. Industry certification schemes are plentiful

The supply and demand of e-skills in Europe RAND Europe
24
and such certifications are used for employment purposes. However, data on numbers of certifications is generally not publicly available, and in addition the certifications prove difficult to compare.
A common feature of most methodologies used for measuring supply and demand of ICT practitioner skills is the discrepancy between what is subject to measurement (the possible indicators) and what is actually measured. This is due to data availability constraints and limitations of classifications (such as ISCO) and curricula. While the methodologies are useful for providing indications, care should be taken that they are not used to represent correct and detailed estimates.
The use of labour market estimates for describing the stock of ICT practitioner skills is a good example. Measuring skills in terms of occupational employment levels is relatively easy when using internationally accepted occupational codes. Although occupational codes have methodological constraints, they provide a stable base for the measurement of the development over time of (a subset of) ICT practitioners even although the e-skills required for certain professions might change over time. As an indication of trends they are informative, but they need to be backed up with more detailed data if they are to provide meaningful information on future developments. The issue of transparent and clearly delimited definitions is essential in the absence of a methodology able to exhaustively capture and measure ICT practitioner skills.
3.4.1 Definition of e-skills As already indicated in Chapter 2, a general definition of e-skills in terms of three “component” skill-sets is given by the European e-Skills Forum; this definition is useful as it broadly specifies and delimits the issues at stake. If a short-hand definition should be required to effectively communicate the topic of our research to a broader policy audience, e-skills beyond user skills could be formulated as follows:
Skills to design, develop, maintain and operate ICT systems and/or to exploit business opportunities and organisational improvements provided by ICT systems.
A general definition would be represented by an agreed framework against which data could be gathered to permit analysis of specific e-skills requirements and estimates, often expressed in terms of different classification systems (occupational, skill-based, sectoral, education or training). Depending on the need for qualitative and/or quantitative results, as well as the level of detail requested, different classification systems could be used for this. The main requirement for this is transparency of the underlying assumptions.
3.4.2 Data gathering implementation and indicators In choosing between a requirements and estimates approach, the level of detail needed should be considered carefully, since combining breadth with depth requires significant (primary) research investment and may defeat the purpose of the study: it may take too long to deliver results on the basis of which policy decisions can be made. We therefore strongly recommend an approach that reflects the purpose(s) of measuring supply and demand for ICT practitioner skills. What (policy) question is the measurement supposed to address and what level of detail should the data supply? Depending on the answers to these questions, different methods of measurement are likely to be appropriate. For different purposes we propose one of the following measuring methods.

RAND Europe Review of current e-skills studies
25
1. Trend analysis of employment in e-skilled occupations
2. A complementary indicator approach that distinguishes between supply and demand
3. Survey of employer perceptions
4. Qualitative skills profile identification and development of situation-specific indicators
1. If the objective is to provide a general estimate of the number of ICT practitioner needed in the EU, we propose a trend analysis of employment where ICT-skills are tracked by occupational codes. Given current available classification systems and data, we recommend that until the system is updated, ISCO codes 213, 312, 313 and 724 be used for the measurement of ICT practitioner skills. This definition is subject to over-inclusion and exclusion of skills in relation to the general definition, but provides the basis for an indicative general understanding.
2. If the objective is to come up with more precise estimates of the current general supply and demand for ICT practitioner skills, we propose to measure this using the following additional indicators:
• Unemployment in e-skilled occupations (for now: ISCO 213, 312, 313, 724) - total and per occupation separately, split by gender and age - as an estimate of the supply of skilled workers and an indication of the tightness of the labour market, bearing in mind that the qualitative issue of skills gaps is not addressed;
• Number of graduates in e-skilled educational fields, split by main fields (e.g. computer science, information science and telecommunications/electronics engineering; the most relevant ISCED97 codes are EF481 (computer science), EF482 (computer use) and EF523 (Electronics and automation)) as an estimate of the new supply of skilled workers, bearing in mind that the qualitative issue of mismatch is not addressed; furthermore it would be informative to know in what sector and what occupation these graduates will start working;
• Number of issued training certificates for training of more than a minimum amount of days (e.g. one week) and of the appropriate level (practitioner/advanced, to be determined by an intermediary organisation), which would give an indication of increase in skills in general and when split into fields (such as network administrator, web professional, database administrator or security expert) would indicate rise or fall of demand for specific fields;
• Current employment in e-skilled occupations (as defined through occupational codes), to understand the size and development over time of the labour force, but also split into male/female ratios, age, company size and nationality, to be able to support more qualitative assessments with regard to gender, age distribution, relevance of small, medium or large enterprises, migration;

The supply and demand of e-skills in Europe RAND Europe
26
• Unfilled or hard-to-fill job vacancies in e-skilled occupations (as defined through occupational codes), split by industrial sector and firm-size, as quantification of unmet demand with possibly an indication in which types of organisation this problem is largest;
• Replacement demand (due to retirement or other structural reasons) of current employees, per occupational code, which contributes to a more precise estimate of the net demand for skilled practitioners, not only based on the growth (or decline) of stock;
• Replacement of jobs by offshoring activities, as a quantification of the decline of demand due to offshoring, if possible by country to which the activities are offshored.
Thus, the first three indicators inform about the supply-side, the fourth indicator about the stock and the fifth, sixth and seventh about demand. This approach requires that assumptions be made considering how different specific definitions relate, since for example defining e-skills in terms of educational classifications does not directly translate to other classification systems such as occupational classification systems. Furthermore, the use of these indicators does not enable clear monitoring of e-business skills; for which new primary research (e.g. with the help of employer surveys) would be required.
3. If the objective is to find out in detail about supply and demand for specific skills and an assessment of skills gaps and mismatches, we recommend surveying employers and learning providers, either on predefined skills profiles or by asking them to define specific skills. (as remarked above, this may be the way to focus on e-business skills)
4. If the objective is to identify potential problem areas in terms of shortages, gaps or mismatches as well as to estimate the scope of the problem, we recommend stakeholder consultation to identify, for each policy question being considered, specific skills (required) and thereafter develop suitable quantitative indicators that can measure the supply and demand for these skills. No further recommendations on indicators can be given at this point before such a consultation has been undertaken.


The supply and demand of e-skills in Europe RAND Europe
28
were selected based on the analysis of classifications of e-skills and ways to measure their supply and demand as presented in the previous chapter.
To retrieve information at the national level, we contacted e-skills networks and national statistical offices. Two e-skills networks were approached:
1. The European e-Skills Forum;
2. The Northern eDimension Action Plan (NeDAP) e-skills working group.
National representatives in each network were contacted in order to collect information about studies and data collection initiatives and sources within the domain of supply and demand of ICT practitioner skills in their countries. The national statistical offices of the EU member states were contacted via their IT/ICT departments or via general data provision departments. The priority has been to assess what data is readily available within the statistical domain about supply and demand of ICT practitioner skills, rather than to provide an exhaustive account of the current situation in each country, which is not feasible given the size of the project.
Useful EU Member State data was also collected from Eurostat, which has recent national Labour Force Survey statistics. Data of interest not covered by the EU Labour Force Survey database and not collected or used by an e-skills initiative is generally not collected by the national statistical offices but by other government agencies, such as Public Employment Services. Data available at the national statistical offices collected by these agencies are generally not comparable across EU Member States. Hence, the only way to present that level of data would be to look at each Member State separately for each indicator - an in-depth analysis that goes beyond the scope of this study. Therefore, we have not specifically focused our attention on collecting this type of data.
4.2 On data availability
EU level and the US An assessment of the current situation of e-skills is obviously dependent on the ways that supply and demand of ICT practitioner skills are classified and measured. Given the discussion in the previous chapter, our analysis would require information about a number of key indicators. These indicators are listed in Table 1and elaborated on after the table.

RAND Europe Current situation of supply and demand of e-skills
29
Table 1. Supply and demand indicators.
Feature Indicators
Demand � Job vacancies or unfilled job vacancies for e-skilled occupations
� Replacement demand � Offshoring activities � Stock of e-skilled employment
Supply � Training (on the job or external) � Formal Education � Stock of e-skilled employment � E-skilled unemployment
Demand
The indicator “unfilled vacanciesunfilled vacanciesunfilled vacanciesunfilled vacancies” provides valuable information on the imbalances of ICT practitioner skills in the labour market, since it captures – as closely as is possible -unmet demand. Unfortunately, our review of available data indicates that recent data on unfilled vacancies for e-skilled occupations is not available at the EU level. The only currently available source identified is a BISER report published in 2004. This report provides some, if limited, survey data on unfilled vacancies. From 2006 on, similar data will be collected regularly by the ICT Enterprise Survey carried out by Eurostat. The BISER report provides information on the fraction of companies having unfilled vacancies for computer specialists and the ICT Enterprise Survey will offer data on the fraction of companies experiencing problems hiring people with ICT practitioner skills. Neither survey directly collects data for the number of unfilled vacancies but for a related indicator, which captures the fraction of the business population having unmet demand. The ICT Enterprise Survey is currently looking at including more EU-benchmarking indicators for e-skills. The effort might consider developing an indicator that does measure the number of unfilled vacancies.
“Job vacancies for eJob vacancies for eJob vacancies for eJob vacancies for e----skskskskilled occupationsilled occupationsilled occupationsilled occupations” is a second indicator that can give information about demand for e-skills. The indicator provides evidence on new demand, whether it is met or unmet in the end. Eurostat collects data on job vacancies but currently only by economic activity, not by occupation. Moreover, the data on job vacancies by economic activity are at a level of aggregation that makes it impossible to analyse job vacancies in the ICT sector and ICT practitioner skills intense sectors. The Eurostat Job Vacancies Survey is currently undergoing improvement. The improved survey might possibly produce better data for analysis of job vacancies for ICT practitioners.
Rather than try to recruit more ICT staff, companies may decide to outsource and/or offshore their work, leading to a reduction of local (/national) demand. We did not find clear (quantitative) data on “offshoring activitiesoffshoring activitiesoffshoring activitiesoffshoring activities” at the EU-level, although it is considered an important issue. OECD (2004) presents mixed anecdotal evidence and OECD (2005) examines indirect sources, such as trade data on exports of business services and occupational data showing that close to 20% of total European employment is potentially affected. An enterprise survey could pose the question what number of workers are “employed” or “contracted abroad” to determine the local decline in demand. Total demand consists of unmet demand and the stock of e-skilled employment (demand currently met). However, information on “replacement demandreplacement demandreplacement demandreplacement demand” provides an important additional element with regard to the difference between supply and demand. In

The supply and demand of e-skills in Europe RAND Europe
30
combination with growth in employment, replacement demand constitutes net demand. This replacement demand has been estimated by CEPIS (2002) as 3% of stock, by EUQuasit (2004) as 2.5%, and by E-skills UK (2004) as 9% (of ICT professionals). The basis for these estimates is not fully transparent, but more valid estimates of demand would require a more precise measurement of this number, which could be investigated within an enterprise survey.
Data on the indicator “(stock of) eeee----skilled employmentskilled employmentskilled employmentskilled employment” can be retrieved from the EU Labour Force Survey database, which uses ISCO88 occupational codes. As discussed in section 3.2.1, the use of these codes results in limits of how well they represent ICT practitioner skills. We chose to look at two definitions that would measure the supply and demand of ICT practitioners. The first one includes occupations (ISCO 213, 312, 313 and 724) according to OECD’s definition of “ICT specialists.” The second one, used by among others CEPIS (2002), is more narrow and restricted to “IT practitioners” (ISCO codes 213 and 312). The lack of more general statistically significant and internationally comparable data prevents us from choosing a more detailed definition that would allow the measurement of supply and demand of ICT practitioners more precisely. The only source of employment data directly comparable at the EU level is the Eurostat Labour Force Survey database, which only contains data for 3-digit occupational codes. As discussed in the previous chapter more detailed analysis requires data at the 4-digit level. Additional research efforts would be needed at the national level as fewer than half of the Member States deliver ISCO data at 4-digit level to Eurostat. The current efforts result in statistically non-reliable data once an analysis at the 4-digit level is attempted because too few data points are available per occupational code. A pragmatic way to tackle the problem of wrong inclusions in ISCO 313 and 724 would be to examine employment levels in a small sample of member states at a higher level of detail in order to assess what percentage of those two occupational groups should not be considered e-skilled. If this percentage were relatively comparable across the “sub-set”, then it could, in principle, be applied to the EU data as a whole.
Supply
Organisations such as IDC, that previously collected data on trainingtrainingtrainingtraining for certain ICT practitioner skills, indicate that the most feasible way to get this kind of data is to directly contact product vendors which operate their own certifications and ask them how many people they train for different skills. CompTIA (2004b) surveyed IT training providers in Europe in 2004. The data collected through this survey was the respondents’ (senior management) perception about the development of demand for IT-training in their country. This kind of data is a (secondary) indicati
RAND Europe Current situation of supply and demand of e-skills
31
not be valid for an overview of the current situation. However, a new survey will be conducted in 2006 and these results would be useful for future purposes.
The supply of ICT practitioner skills via formal educationformal educationformal educationformal education can be estimated to some extent. Data on number of students enrolled and graduated in certain educational fields is readily available from both Eurostat and OECD. In our analysis, we examined the number of enrolled and graduated tertiary students within the field of EF48(0) “Computing” as the indicators for new supply to estimate recent developments in the supply of e-skills. We have omitted the aggregate EF52(0) as this would have included too many graduates in addition to EF523 (Electronics and automation). In future, a more detailed split would be advisable.
The Eurostat ICT Household Survey collects data on supply of e-skills. Unfortunately, this survey currently focuses on basic user skills, and as such the results do not provide data on the type of e-skills examined in depth in this study. Inclusion of questions regarding ICT practitioner skills would be required for this source to be useful for the key area of ICT Practitioner skills. The feasibility of such an extension is, however, questionable as it would require a doubling of the sample size (communication with Eurostat, 2005).
The stock of estock of estock of estock of e----skilled employmentskilled employmentskilled employmentskilled employment is, as previously mentioned, not only an indication of demand currently met, but also of accepted supply. Hence, the EU LFS data will also be used to indicate the current state of accepted supply of ICT practitioner skills. Moreover, LFS data is also useful for estimating unaccepted supply, measured as unemplunemplunemplunemployment in oyment in oyment in oyment in eeee----skilled occupationsskilled occupationsskilled occupationsskilled occupations. We have used the LFS data for this purpose to the extent that it is reliable.26
The in-depth review of available data sources carried out in this study for indicators measuring supply and demand of e-skills has shown that the desired data is mostly lacking. Because of the limited data availability the analysis in the next section of this chapter relies heavily on data from the EU LFS database. There are, as previously mentioned in chapter 3, a number of drawbacks to this considerable dependency on LFS data, relating to the quality of the data and its level of detail. The fact that the EU LFS data is based on self-reporting27 and that occupational data has to be translated into an international classification system (ISCO) from national classification systems affects its reliability negatively. Moreover, the purpose for collecting the data is not to address e-skills, and therefore the data is limited and does not have all the necessary features for an in-depth analysis of the demand and supply of specific e-skills. The occupational classification systems used for Labour Force Surveys provide insufficient detail to single out detailed skills profiles. Also, the data essentially provides information on the stock of ICT Practitioner employment. We know that the stock of e-skilled employment does not, on its own, inform us about possible discrepancies between supply and demand in the marketplace. The only information LFS data provides on such discrepancies is unemployment figures. However, the unemployment data is limited and cannot inform a
26 The samples of unemployment are inevitably smaller
27 As this is a household survey

The supply and demand of e-skills in Europe RAND Europe
32
more qualitative analysis of the underlying reasons for observed divergences, such as shortages, mismatch and gaps.
Given the data availability the analysis in the next section will focus on development in the labour market for fairly highly aggregated IT and ICT practitioner occupations. The LFS data is complemented by limited data on additional indicators – in particular on unfilled vacancies from a BISER report (2004) as well as Eurostat data on formal education within the field of computing.
US data To compare the situation of supply and demand of ICT practitioner skills between the EU and the US, we examined the availability of US data. The data for the US should ideally be directly comparable to the European data available.
There are two major data sources for US employment statistics, the Occupational Employment Statistics (OES) program at the Bureau of Labor Statistics and the Current Population Survey (CPS). Both the OES and the CPS currently use the 2000 Standard Occupation Classification (SOC) system. Comparability between this system and ISCO-88 is essential for comparability between EU Labour Force survey data and US employment data. Unfortunately, there is no official “mapping” scheme between these two systems, making a direct comparative analysis not possible.
OECD (2004) made an effort to match ICT-related occupations from the ISCO-88 system with CPS occupation classes, enabling an EU-US comparison of ICT-skilled employment trends. Unfortunately, it was not possible to use that definition of US e-skilled occupations, since it is based on 1990 Census occupation codes instead of 2000 SOC codes. However, correspondence schemes between 1999 Census codes, 2000 Census codes and 2000 SOC codes enable us to define e-skilled occupations for the US according to 2000 SOC codes.28 It should be noticed that this method for selecting e-skilled occupations in the 2000 SOC system is imperfect, since it most certainly fails to identify all ICT-skilled occupations of the 2000 SOC system and includes occupations that are actually not “e-skills intense”.
OES employment data is used for describing the current situation in the US, in order to maximise the length of the time series. The CPS has only used the 2000 SOC system since 2003 while the OES has data using this system since 1999. The OES datasets only include data for 25 of the 39 identified e-skilled occupations presented in Appendix E. This of course affects the validity of the analysis negatively, since the size of the e-skilled workforce will be underestimated.
The OES data has been complemented with data from the ITAA29 2004 Annual Workforce Survey and data on formal education within the field of computing. Eurostat collects comparable data on number of tertiary graduates in the filed of computing for the EU level and the US.
28 Appendix E gives an account for the translation from 1990 Census occupation codes into the 2000 SOC codes of the ICT-skilled occupations identified by the OECD (2004).
29 Information Technology Association of America

RAND Europe Current situation of supply and demand of e-skills
33
National EU Member State level The domain of ICT practitioner and e-business skills is broad in terms of actors involved within a nation, which makes it difficult to cover all perspectives and potential data sources. Ministries, statistical offices, business associations, professional associations, educational institutions, training providers, information society associations and research institutes and unions may all collect certain relevant data. The national EU Member State data made available to us depends on the national representatives’ perspectives and knowledge about work in the domain, and their willingness to share their knowledge and provide us with information.
The assessment of the current situation with regard to supply and demand of ICT practitioner skills at the EU Member State level includes figures from the EU Labour Force Survey database (submitted by national statistical offices), complemented by the data made available to us via our contacts in each country. The Labour Force Survey data presented for each country will be less detailed compared to the data presented for the EU level since the size of the national samples in many cases is so small that disaggregated data is below the threshold level for which figures can be considered statistically reliable.
4.3 Current situation at the EU level and in the US
EU level
Stock of ICT practitioner employment
In the year 2004, an estimated 3.2 million people worked as “IT practitioners” (ISCO 213 and 312) and 5.9 million worked in “ICT practitioners” occupations (ISCO 213, 312, 313 and 724) in the EU. The numbers account respectively for 1.6 percent and 3.0 percent of estimated total employment in the EU in 2004. 30
The didididistribution of this estribution of this estribution of this estribution of this e----skilled employmentskilled employmentskilled employmentskilled employment in the economy can be examined by looking at the estimated number of “IT practitioners” and “ICT practitioners” by economic sector. Many studies on ICT distinguish between the ICT sector and ICT user sectors. Most studies base their definition of the ICT sector on the use of NACE 3- and 4-digit codes.31 Unfortunately, the EU LFS database does not include data coded on these detailed levels, thus, making it impossible to apply available definitions to our dataset. The available dataset only permits analysis of e-skilled employment by “industry division” i.e. NACE 2-digit codes. In Europe, the industry division with the highest estimated stock of “IT practitioners” and “ICT practitioners” is the core IT services industry, classified as NACE code 72 (“Computer and related activities”). This economic sector employs the largest number (in absolute and relative terms) of “IT practitioners” and “ICT practitioners”. Other economic sectors that employ large numbers of I(C)T practitioners are: “Other business activities” (NACE 74) and “Post and telecommunications” (NACE 64). Table 2 presents the broad economic sectors in Europe with the highest estimated
30 The figures in this paragraph are based on data presented in Appendix F.
31 See for example OECD (2004) and EUQuaSIT (2004)

The supply and demand of e-skills in Europe RAND Europe
34
stock of “IT practitioners” and “ICT practitioners” respectively, and shows for each sector estimated numbers of people employed in these occupations.
The seven economic sectors that are major employers of “IT practitioners” are estimated to account for about 68 percent of the total employment in those occupations. This indicates that the “IT practitioner” workforce is fairly concentrated in a limited number of industries. Comparing employment in the core IT services industry to that in all other industries shows that about 58 percent of the “IT practitioners” and 77 percent of the “ICT practitioners” workforce are estimated to be employed outside the core IT services industry (NACE 72).
Table 2. Industry divisions with highest stock (demand currently met) of ICT practitioner skills
IT practitioners (ISCO 213 and 312) ICT practitioners (ISCO 213, 312, 313 and 724)
Industry division Number of people employed
Industry division Number of people employed
72 Computer and related activities
1,303,139 72 Computer and related activities
1,360,834
74 Other business activities
189,584 45 Construction 385,639
75 Public administration, printing, and reproduction of recorded material
186,614 74 Other business activities
364,688
65 Financial intermediation, except insurance and pension funding
149,699 64 Post and telecommunications
341,979
64 Post and telecommunications
144,404 52 Retail trade, except of motor vehicles and motorcycles; repair of personal and household goods
273,659
80 Education 93,858 75 Public administration, printing, and reproduction of recorded material
251,368
51 Wholesale trade and commission trade, except of motor vehicles and motor cycles
92,982 40 Electricity, gas, steam and hot water supply
222,480
Source: Computations based on EU LFS 2004
Note: The figures are considered statistically reliable since they all exceed Eurostat’s threshold level of 92,000 for EU25 in 2004, see appendix D. The figures for the Netherlands in the data set are provisional.
Figure 2 and Figure 3 illustrate trendstrendstrendstrends for the stock of ICT practitioners from 1998 to 1998 to 1998 to 1998 to 2004200420042004. The figures show the fraction of I(C)T employment as part of total employment. Between 1998 and 2001 the estimated number of employed “ICT practitioners” increased by around 18.4 percent and thereafter, between 2001 and 2004, the number declined by about 3 percent. This development is not surprising and probably related to the overall development of the ICT industry where rapid growth was followed by a considerable downturn. The labour market for “IT practitioners” also experienced a strong positive trend until 2001, but instead of a slight negative trend in the most recent years the trend stabilised. During the whole period between 1998 and 2004, there has been an overall increase in estimated number of employed “ICT practitioners” of about 14.9 percent and of about 48.2 percent for “IT practitioners”.

RAND Europe Current situation of supply and demand of e-skills
35
Figure 2 and Figure 3 also show that the fraction of female IT and ICT pfraction of female IT and ICT pfraction of female IT and ICT pfraction of female IT and ICT practitioners as ractitioners as ractitioners as ractitioners as part of total female labour forcepart of total female labour forcepart of total female labour forcepart of total female labour force at the EU-level was low in 1998 and remains so today. This is most probably due to a supply shortage of women with the skills required or wanting to work in these occupations. Historical figures from Eurostat on number of female graduates from computing educations support this assumption. However, supply is slowly increasing.
Figure 2. EU employment of “IT practitioners”, 1998-2004
0.0%
0.5%
1.0%
1.5%
2.0%
2.5%
3.0%
1998 1999 2000 2001 2002 2003 2004
Year
Sh
are
of
tota
l em
plo
ym
en
t
(%)
0
500
1000
1500
2000
2500
3000
3500
Nu
mb
er
of
em
plo
yed
(in
tho
usan
ds)
IT practitioner employment, total IT practitioner employment, men
IT practitioner employment, w omen IT practitioner employment rate, men
IT practitioner employment rate, total IT practitioner employment rate, w omen
Source: EU LFS Q2 for 1998-2004
Note: Malta is not included in the data set as data is missing for 1998-2001. The figures for the Netherlands in 2004 are provisional. The aggregated EU24 figures are statistically reliable since they all exceed the Eurostat’s limits applicable each year for EU25 figures, see Appendix D.
Figure 3. EU employment of “ICT practitioners”, 1998-2004
0.0%
0.5%
1.0%
1.5%
2.0%
2.5%
3.0%
3.5%
4.0%
4.5%
5.0%
1998 1999 2000 2001 2002 2003 2004
Year
Sh
are
of
tota
l em
plo
ym
en
t
(%)
0
1000
2000
3000
4000
5000
6000
7000
Nu
mb
er
of
em
plo
yed
(in
tho
usan
ds)
IT practitioner employment, total IT practitioner employment, men
IT practitioner employment, w omen ICT practitioner employment rate, total
ICT practitioner employment rate, men ICT practitioner employment rate, w omen
Source: EU LFS Q2 for 1998-2004
Note: Malta is not included in the data set for any year since data is missing for 1998-2001. The figures for the Netherlands in 2004 are provisional. The aggregated EU24 figures are statistically reliable since they all exceed the Eurostat’s limits applicable each year for EU25 figures, see Appendix D.

The supply and demand of e-skills in Europe RAND Europe
36
Analysing the development of the ICT practitioner employment in indiviindiviindiviindividual dual dual dual occupationsoccupationsoccupationsoccupations under study, Figure 4 shows that ISCO 724 (Electrical and electronic equipment mechanics and fitters), which requires the least advanced skills, does not follow the same pattern as the two core e-skilled occupations (ISCO 213 and 312). A possible explanation is that demand for electrical and electronic equipment mechanics and fitters is less affected by the development in the ICT sector than is demand for “IT practitioners”. The explanation is reasonable given that electrical and electronic equipment mechanics and fitters only account for about 2.2 percent of total employment in the core IT services industry (NACE 72)32
The employment in “IT practitioners” and “ICT practitioners” occupations appears to have followed a fairly similar trend within the core IT services industry compared to other industries between 1998-2004, see Figure 5 and Figure 6. However, the overall positive trends during the period are relatively stronger in the core IT services industry as compared with other industries. Between 1998-2004, the employment of “IT practitioners” increased by about 74.3 percent in the core IT services industry compared to about 33.9 percent in the other industries.
32 Figures from EU LFS Q2 2004.
Figure 4. EU employment in four ISCO 3-digit level e-skilled occupations, 1998-2004
0.00%
0.20%
0.40%
0.60%
0.80%
1.00%
1.20%
1.40%
1.60%
1998 1999 2000 2001 2002 2003 2004
Year
Sh
are
of
tota
l em
plo
ym
en
t (%
)
0
500
1000
1500
2000
2500
3000
Nu
mb
er
of
em
plo
yed
(in
th
ou
san
ds)
ISCO 213 ISCO 312 ISCO 313 ISCO 724
ISCO 213 (share) ISCO 312 (share) ISCO 313 (share) ISCO 724 (share)
Source: EU LFS Q2 for1998-2004
Note: Malta is not included in the data set for any year since data is missing for 1998-2001. The figures for the Netherlands in 2004 are provisional. The aggregated EU24 figures are statistically reliable since they all exceed the Eurostat’s limits applicable each year for EU25 figures, see Appendix D.

RAND Europe Current situation of supply and demand of e-skills
37
Figure 5. EU employment of “IT practitioners” by industry division, 1998-2004
0.0%
10.0%
20.0%
30.0%
40.0%
50.0%
60.0%
1998 1999 2000 2001 2002 2003 2004
Year
Sh
are
of
ind
ustr
y e
mp
loym
en
t (%
)
0
500
1000
1500
2000
2500
Nu
mb
er
of
em
plo
ye
d (
in t
ho
us
an
ds)
IT services (NACE 72) Other industry divisions
IT services (NACE 72) (share) Other industry divisions (share)
Source: EU LFS Q2 for1998-2004
Note: Malta is not included in the data set for any year since data is missing for 1998-2001. The figures for the Netherlands in 2004 are provisional. The aggregated EU24 figures are statistically reliable since they all exceed the Eurostat’s limits applicable each year for EU25 figures, see Appendix D.
Figure 6. EU employment of “ICT practitioners” by industry division, 1998-2004
0.0%
10.0%
20.0%
30.0%
40.0%
50.0%
60.0%
1998 1999 2000 2001 2002 2003 2004
Year
Sh
are
of
ind
us
try e
mp
loym
en
t (%
)
0
500
1000
1500
2000
2500
3000
3500
4000
4500
5000N
um
be
r o
f em
plo
ye
d (
in t
ho
usa
nd
s)
IT services (NACE 72) Other industry divisions
IT services (NACE 72) (share) Other industry divisions (share)
Source: EU LFS Q2 for1998-2004
Note: Malta is not included in the data set for any year since data is missing for 1998-2001. The figures for the Netherlands in 2004 are provisional. The aggregated EU24 figures are statistically reliable since they all exceed the Eurostat’s limits applicable each year for EU25 figures, see Appendix D

The supply and demand of e-skills in Europe RAND Europe
38
Demand, unfilled vacancies for computer specialists
The 2003 BISER survey on unfilled vacancies for computer specialists is the only currently available source with recent EU-level data relating to unfilled vacancies for ICT practitioners. The data is too limited to support any strong conclusion; nevertheless, it provides an indication of the average situation in the EU with regard to unfilled vacancies for computer specialists. The survey results show that only 2.7 percent of the 8,579 establishments that participated in the BISER (2004) survey reported that they had unfilled vacancies for computer specialists. The survey also found that demand is low: only 11.6 percent of the responding establishments had been searching for computer specialists. The results indicate no evidence of a large ICT practitioner skills shortage at the EU-level at that time.
Demand, replacement demand
As indicated, we have only found estimates of replacement demand in three different sources. When we apply these to the stock of practitioners, the following picture emerges:
Table . (EU LFS) Estimates of replacement demand in 2004 of "IT practitioners" and "ICT practitioners" according to three different estimates of attrition rate
CEPISCEPISCEPISCEPIS EUQuaSITEUQuaSITEUQuaSITEUQuaSIT eeee----skills UKskills UKskills UKskills UK
IT practitioners 96,000 80,000 288,000
ICT practitioners 177,000 147,500 531,000
Table indicates that the range of replacement demand becomes quite large depending on what estimate of replacement rate is taken and that – should the value be closer to that shown in the e-skills UK study – shortages in the near future are still foreseeable.
Supply, ICT practitioner unemployment
Unemployment indicators by occupation are useful for tracing possible excess supply of skills that could either be due to skills mismatches or a general supply surplus. EU level unemployment figures for “ICT practitioners” occupations suggest that there are e-skills available in the EU for which there is no demand in the job market. Error! Reference Error! Reference Error! Reference Error! Reference source not found.source not found.source not found.source not found. illustrates the development over time of unemployment for “IT practitioners” and “ICT practitioners” in absolute numbers and relative to the total labour force. Even though the trend is negative in the sense that unemployment has increased of late, the level of unemployment is still not very high. In 2004, the estimated numbers of unemployed “ICT practitioners” and “IT practitioners” were 259,778 and 114,467 respectively, which account for 4.2 and 3.5 percent of the total labour force of each group of occupations.

RAND Europe Current situation of supply and demand of e-skills
39
Figure 7. Total EU unemployment of “IT practitioners” and “ICT practitioners (in 1,000s) and as share of total number of “IT practitioners” and “ICT practitioners, 1998-2004
0
50
100
150
200
250
300
1998 1999 2000 2001 2002 2003 20040.0%
0.5%
1.0%
1.5%
2.0%
2.5%
3.0%
3.5%
4.0%
4.5%
Total ICT practitioner unemployment Total IT practitioner unemployment
% of unemployed ICT % of unemployed IT
Source: EU LFS Q2 for1998-2004
Note: Data is missing for France and the Netherlands for all years. Data is missing for Sweden in 1998-1999 and 2001-2002. The 1998 and 1999 datasets lacks data for Cyprus and Malta. The aggregated available EU figures are statistically reliable since they all exceed the Eurostat’s limits applicable each year for EU25 figures, see Appendix D.
Supply, formal education
The levelling-out trend observed in the stock of ICT practitioners does not appear to be due to supply side conditions, as the supply from the tertiary education system has steadily increased between 1998 and 2003. Figure 8 shows that the increase in the number of tertiary graduates in the field of computing, EF480 during this period was about 102 percent. The positive trend for supply will probably continue for a few more years since the number of enrolled students also increased during most of the period, see Figure 9. But the fact that the number of students has remained flat between 2002 and 2003 is an indication that the trend might change in the future. In general, it can be stated that there is a strong connection between the overall state of the labour market and new entry, and subsequent enrolment and graduation. That is, increased labour market opportunities can provide a fairly immediate pull effect on enrolment figures.
It should be pointed out that the “formal education supply” figures capture only a small share of total supply. The proportions of “IT practitioners” and “ICT practitioners” that have acquired their skills through higher education within the field of computing are low.33 In 2004, only 18 percent of the “IT practitioners” and 10.1 percent of the “ICT practitioners” workforce were estimated to have a higher-level degree in computing
33 Note that this is not the same as the proportions of these workforces that have achieved higher education in any field. This discussion specifically addresses higher education in the field of computing (EF480).

The supply and demand of e-skills in Europe RAND Europe
40
(EF480).34 Formal higher education completion data in the field of computing represents, as expected, only a small proportion of skills supply and would need to be complemented by training data to give a fuller picture of the supply side conditions.
Figure 8. Number of tertiary graduates in the field of computing, EF480, 1998-2003
0%
1%
2%
3%
4%
1998 1999 2000 2001 2003
Year
Sh
are
of
tota
l n
um
ber
of
gra
du
ate
s (
%)
0
20000
40000
60000
80000
100000
120000
140000
Nu
mb
er
of
gra
du
ate
s in
co
mp
uti
ng
Source: Eurostat, Education and lifelong learning data (Population and Social Conditions)
Note: EU data is missing for 2002. For all other years the EU data excludes Greece due to missing data. Estimates based on historical data have been calculated for all other cases of missing data for individual countries.
34 The LFS database includes data on the number of people employed in e-skilled occupations (ISCO 213,312 (“IT practitioner”), 313, and 724 “ICT practitioners”) with a higher education degree in computing (EF480). The figures reported are calculated ratios between this data and LFS data on the total “IT practitioners” and “ICT practitioners” workforces. “IT practitioners”: 570,026/3160,462 ≅ 0.18, “ICT practitioners”: 592,317/5869,004 ≅ 0.101. The figures might be slightly underestimated since educational field is not reported for Czech Republic in 2004.

RAND Europe Current situation of supply and demand of e-skills
41
Figure 9. Number of tertiary education students in the field of computing, EF480, 1999-2003
0
100000
200000
300000
400000
500000
600000
700000
1999 2000 2001 2002 2003
Year
Nu
mb
er
of
stu
den
ts
Source: Eurostat, Education and lifelong learning data (Population and Social Conditions)
Generally, it is assumed that work in “IT practitioner” occupations (ISCO 213 and 312) requires tertiary or secondary education since they belong to skill levels 2 and 3 within the ISCO88 system (ILO, 1990). Figure 10 shows the distribution between different levels of education achieved by the people in the “IT practitioner” workforce over time. The figure shows the estimated share of the workforce that has achieved Lower secondary, Upper secondary and Third level education respectively.35 In recent years almost 60% of the “IT practitioners” workforce have third level education (ISCED 5-6) in any field. The corresponding figure for “ICT practitioners” is lower, only 38%. The reason for this is easily explainable given the skill level system according to which the ISCO88 system is structured. As mentioned “IT practitioners” by definition in the ISCO88 system only involve higher and medium skill levels, whereas “ICT practitioners” - including also ISCO 313 and 724 - involve a larger proportion of medium level skills and the lower skill level 2. This analysis shows that depending on which occupations that are included in an aggregated measure of ICT practitioner skills the levels of e-skills involved can differ substantially.
35 Lower, Upper secondary and Third level correspond to ISCED 0-2,3-4 and 5-6 respectively.

The supply and demand of e-skills in Europe RAND Europe
42
Figure 11. Education level of “ICT Specialists” workforce, 1999-2004
0%
10%
20%
30%
40%
50%
60%
1999 2000 2001 2002 2003 2004
Year
% o
f IC
T p
racti
tio
nerw
ork
forc
e w
ith
cert
ain
level
of
ed
ucati
on
Low er secondary Upper secondary Tertiary level
Source: EU LFS Q2 for 1998-2004 Note: Malta is not included in the data set for any year since data is missing for 1998-2001. The figures for the Netherlands in 2004 are provisional. The aggregated EU24 figures are statistically reliable since the absolute number that the shares are based on all exceed the Eurostat’s limits applicable each year for EU25 figures, see Appendix D.
Figure 10. Education level of “IT practitioners” workforce, 1999-2004
0%
10%
20%
30%
40%
50%
60%
1999 2000 2001 2002 2003 2004
Year
% o
f IT
pra
cti
tio
ner
wo
rkfo
rce w
ith
cert
ain
level
of
ed
ucati
on
Low er secondary Upper secondary Tertiary level
Source: EU LFS Q2 for 1998-2004 Note: Malta is not included in the data set for any year since data is missing for 1998-2001. The figures for the Netherlands in 2004 are provisional. The aggregated EU24 figures are statistically reliable since the absolute number that the shares are based on all exceed the Eurostat’s limits applicable each year for EU25 figures, see Appendix D.

RAND Europe Current situation of supply and demand of e-skills
43
Summary EU level
The analysis of the current situation of supply and demand of IT and ICT practitioner skills shows that growth in employment in the labour market has recently slowed down, and that there are no indications of a general practitioner skills shortage at the EU level. However, it should be stressed that due to inadequacies of available data the analysis is limited. The occupational codes used to capture ICT practitioner skills are at such an aggregated level that some occupations that are not e-skilled intense are captured while others that in fact are e-skills intense are not. It would be possible for there to be no skill shortage in the overall broad/aggregate set of ICT practitioner occupations but shortages in one or more specific occupations within this (the question would then arise as to the relevance of any policy response). Moreover, it is not possible to explore more detailed issues, such as skills mismatches and skills gaps, with the available data. In order to do this, other types of research approaches are required.
A reasonable explanation for the observed slowdown in the labour market for IT and (particularly) ICT practitioners is the downturn in the economic activity of the ICT industry. The underlying factors for that development are numerous and fall outside the scope of this report. Another possible explanation to the slowdown could be user maturation. ICT user organisations could be expected to involve more practitioners the first time they implement and use an ICT application compared the second time. If this is true, the slowdown is – as with the ICT industry slowdown - due to reduced demand, which in turn can be explained by decreasing need for practitioner involvement as users develop their own e-skills. Finally, there is the argument that offshoring ICT activities might result or might have resulted in a recovery of the ICT industry without an increase (or actually a decrease) in the ICT practitioner employment.
US situation ICT practitioner employment has, as shown in Figure 12, followed a similar trend in the US compared to the EU, although the peak was reached already in 2000 compared to 2001 in the EU.

The supply and demand of e-skills in Europe RAND Europe
44
Figure 12. US employment (absolute and relative) of ICT practitioners, 1999-2003
540000054500005500000555000056000005650000570000057500005800000585000059000005950000
1999 2000 2001 2002 2003
Nu
mb
er
of
em
plo
yed
4.3
4.35
4.4
4.45
4.5
4.55
4.6
As p
erc
en
tag
e o
f to
tal
em
plo
ym
en
t
Absolute Percentage
Source: Bureau of Labour Statistics OES program
Note: The occupations associated with ICT practitioners in this figure refer to the occupations presented in . The selection is based on the OECD (2004) definition of US e-skilled occupations, but subject to a number of classification translations wherefore the levels presented in the figures should be interpreted with caution.
Table 3. ICT practitioner employment by occupation (2000 SOC) in the US
Occupation Number of employed
11-3021 Computer and Information Systems Managers 257,860 11-9041 Engineering Managers 188,350 13-1111 Management Analysts 433,830 15-1011 Computer and Information Scientists, Research 23,770 15-1021 Computer Programmers 403,220 15-1041 Computer Support Specialists 480,520 15-1051 Computer Systems Analysts 485,720 15-1061 Database Administrators 97,540 15-1071 Network and Computer Systems Administrators 244,610 15-1081 Network Systems and Data Communication Analysts 156,270 15-2031 Operations Research Analysts 53,620 17-2061 Computer Hardware Engineers 70,110 43-1011 First-Line Supervisors/Managers of Office and Administrative Support Workers 1,402,290 43-9011 Computer Operators 150,030 43-9071 Office Machine Operators, Except Computer 92,880 47-2111 Electricians 575,980 49-2011 Computer, Automated Teller, and Office Machine Repairers 142,910 49-2091 Avionics Technicians 21,020 49-2095 Electrical and Electronics Repairers, Powerhouse, Substation, and Relay 20,310 49-2096 Electronic Equipment Installers and Repairers, Motor Vehicles 15,070 49-2097 Electronic Home Entertainment Equipment Installers and Repairers 34,700 49-2098 Security and Fire Alarm Systems Installers 47,690 49-9051 Electrical Power-Line Installers and Repairers 99,290 49-9052 Telecommunications Line Installers and Repairers 146,410 51-2031 Engine and Other Machine Assemblers 47,520 Total 5,691,520 Source: Bureau of Labour Statistics OES program, 2003.

RAND Europe Current situation of supply and demand of e-skills
45
Table 3 shows the 25 e-skilled occupations in 2000 SOC, for which employment data is available in 2003. In total an estimated 5.7 million people worked in these e-skilled occupations in the US in 2003, which is 4.46% of the total workforce. The figure underestimates e-skilled employment in the US, since the 25 occupations do not cover the whole e-skilled practitioner workforce. According to the ITAA 2004 workforce survey the IT workforce was in 2004 made up of approximately 10.3 million workers.
OES data is not suitable for analysing which industries in the US are major employers of ICT practitioner skills. But the ITAA 2004 workforce survey indicates that non-IT companies represent 79 percent of employment for IT workers. Moreover, the ITAA workforce survey confirms that the demand for IT workers has dropped of late. In 2003 there were approximately 500,000 vacancies compared to an expected 230,000 in 2004.
The US has experienced similar positive trends to the EU in terms of the supply from the education system of ICT practitioner skills, measured as the number of graduates emerging from tertiary education in the field of computing. Figure 13 compares the development in number of graduates from tertiary education courses in the field of computing as a share of total number of tertiary graduates, both in the US and the EU. It shows that the relative number of graduates in the US is more than 25% higher than that of the EU.
Figure 13. Share of tertiary graduates in the field of computing, EF480, to total tertiary graduates EU and US, 1998-2003
0%
1%
2%
3%
4%
5%
6%
1997 1998 1999 2000 2001 2002 2003 2004
Year
% t
eri
tary
gra
du
ate
s i
n t
he f
eil
d o
f
co
mp
uti
ng
EU USA
Source: Eurostat, Eduation and lifelong learning data (Population and Social Conditions)
Note: EU data is missing for 2002. For all other years the EU data excludes Greece due to missing data. Estimates based on historical data have been calculated for all other cases of missing data for individual countries.

The supply and demand of e-skills in Europe RAND Europe
46
4.4 National situations
4.4.1 EU Labour Force Survey data EU Labour Force Survey data shows that the Scandinavian countries together with the UK and the Netherlands have the highest proportion of “IT practitioners” in the EU as compared to their total employment, see Figure 14 (and as shows, these Member States have been ‘in the lead’ since 1998). Figure 15 shows, as compared to the previous figure, that there are larger differences between countries in terms of “IT practitioners” share of total employment than in terms of “ICT practitioners” share of total employment. This suggests that the employment distribution between the four occupational groups (ISCO 213, 312, 313 and 724) included in “ICT practitioners” vary substantially between countries.
Figure 14. “IT practitioners” share of total employment, by EU country
0.00%
0.50%
1.00%
1.50%
2.00%
2.50%
3.00%
3.50%
Austria
Belgium
Cyprus
Czech
Rep
ublic
Denm
ark
Eston
ia
Finlan
d
Franc
e
German
y
Gre
ece
Hunga
ry
Irelan
dIta
ly
Latvia
Lithu
ania
Luxe
mbourg
Malt
a
Nether
land
s
Polan
d
Portug
a l
Slova
kia
Slov
enia
Spain
Sweden UK
Source: EU LFS Q2 for 2004
Note: The shares are statistically reliable since the absolute numbers that the shares are based on all exceed the Eurostat’s limits applicable for each country, see Appendix D. The figures for the Netherlands are provisional.
Figure 15. “ICT practitioners” share of total employment, by EU country
0.00%
0.50%
1.00%
1.50%
2.00%
2.50%
3.00%
3.50%
4.00%
4.50%
5.00%
Austria
Belgium
Cyprus
Czech
Rep
ublic
Denm
ark
Eston
ia
Finlan
d
Franc
e
Germ
any
Gree
ce
Hungary
Irelan
dIta
ly
Latvia
Lithu
ania
Luxe
mbourg
Malt
a
Nethe
rland
s
Polan
d
Portug
al
Slovakia
Slove
niaSpa
in
Sweden UK
Source: EU Q2 LFS 2004
Note: The shares are statistically reliable since the absolute numbers that the shares are based on all exceed the Eurostat’s limits applicable for each country, see Appendix D. The figures for the Netherlands are provisional.
Figure 16 to Figure 19 illustrate the variation in recent national trends for the e-skilled workforce as a share of the total workforce (Absolute numbers are shown in Appendix G).

RAND Europe Current situation of supply and demand of e-skills
47
Most countries do not seem to have experienced a decline, but rather a ‘plateau’, as a response to the recent economic downturn. A relative peak followed by a decline is only visible in Sweden (for both narrow and broad definition) and in the Czech Republic for the narrow definition. Austria apparently recently experienced a sharp decline in the number of “ICT practitioners” whereas Denmark experienced a jump in “ICT practitioners” from 2002-2003.
The countries joining the EU in 2004 seem to have overcome the downturn in demand experienced in the EU as a whole and appear to have outperformed the EU-15 in terms of “ICT practitioner” share of total employment.
Figure 16. “ICT practitioners” share of national employment, EU15
0.0%
1.0%
2.0%
3.0%
4.0%
5.0%
1998 1999 2000 2001 2002 2003 2004
Year
Sha
re o
f nat
iona
l of e
mpl
oym
ent
Austria
Belgium
Denmark
Finland
France
Germany
Greece
Ireland
Italy
Luxembourg
Netherlands
Portugal
Spain
Sw eden
UK
Source: EU LFS Q2 for1998-2004
Note: The shares are statistically reliable since the absolute numbers that the shares are based on all exceed the Eurostat’s limits applicable for each country, see Appendix D. The figures for the Netherlands in 2004 are provisional.

The supply and demand of e-skills in Europe RAND Europe
48
Figure 17. “ICT practitioners” share of national employment, Member States since 2004
0.0%
1.0%
2.0%
3.0%
4.0%
5.0%
1998 1999 2000 2001 2002 2003 2004
Year
Sha
re o
f nat
iona
l em
ploy
men
t
Cyprus
Czech Republic
Estonia
Hungary
Latvia
Lithuania
Malta
Poland
Slovakia
Slovenia
Source: EU LFS Q2 for1998-2004
Note: The shares are statistically reliable since the absolute numbers that the shares are based on all exceed the Eurostat’s limits applicable for each country, see Appendix D.
Figure 18. “IT practitioners” share of national employment, EU15
0.0%
1.0%
2.0%
3.0%
4.0%
1998 1999 2000 2001 2002 2003 2004
Year
Sha
re o
f nat
iona
l em
ploy
men
t
Austria
Belgium
Denmark
Finland
France
Germany
Greece
Ireland
Italy
Luxemburg
Netherlands
Portugal
Spain
Sw eden
UK
Source: EU LFS Q2 for1998-2004
Note: The shares are statistically reliable since the absolute numbers that the shares are based on all exceed the Eurostat’s limits applicable for each country, see Appendix D. The figures for the Netherlands in 2004 are provisional.

RAND Europe Current situation of supply and demand of e-skills
49
Figure 19. “IT practitioners” share of national employment, Member States since 2004
0.0%
1.0%
2.0%
3.0%
1998 1999 2000 2001 2002 2003 2004
Year
Sha
re o
f em
plo
ymen
t
Cyprus
Czech Republic
Estonia
Hungary
Latvia
Lithuania
Malta
Poland
Slovakia
Slovenia
Source: EU LFS Q2 for1998-2004
Note: Most shares are statistically reliable since the absolute numbers that the shares are based on all exceed the Eurostat’s limits applicable for each country, see Appendix D. However, the figures for Estonia in 1998,1999, 2002 and 2003, Latvia in 1998, 1999 and 2001 and Slovenia in 1998-2001, should be interpreted with caution.
The path followed by each Member State is a function of many different factors and should be examined in closer detail if country-specific remarks are required, particularly in view of the problems of “translation” from national occupational frameworks to ISCO. Below we have shown additional data from country-specific sources, where available.
4.4.2 Country specific data sources An analysis of the current situation in different Member States is presented in Appendix H36. The table summarises national initiatives and evaluates the usefulness of specific data for giving an overview of the current situation of supply and demand for ICT practitioner skills in individual Member States. The data provided is only considered useful for this study if it reflects the current situation. Data from before 2002 is considered too old and such estimates have not been used. The table in the appendix shows that eight countries provided useful data. These are Denmark, Estonia, Germany, Latvia, Luxembourg, the Netherlands and the UK. The following sections present information from these countries. Few of these sources use the same terminology and precise definitions for e-skills as applied in the rest of the report. We have not attempted to synchronize the outputs from the national sources. The general definition of ICT practitioner skills and e-business skills has guided the inclusion of material. We feel that all the various ways of naming and defining e-skills presented below fall within that definition.
36 This analysis is based on information that is additional to the data provided through the EU Labour Force Survey.

The supply and demand of e-skills in Europe RAND Europe
50
Denmark The Danish report “Information Society Denmark – Status 2004” presents survey data on the ICT labour market situation in 2003. Error! Not a valid booError! Not a valid booError! Not a valid booError! Not a valid bookmark selfkmark selfkmark selfkmark self----reference.reference.reference.reference. Figure 22 shows the relationship between ICT degrees, occupations and employment. Some 44 percent of ICT graduates had an ICT occupation and 35 percent of them were employed in the ICT sector. These figures indicate either there is a supply surplus, a skills mismatch or that ICT graduates for some reason prefer working in non-ICT occupations. Moreover, non-ICT sectors employ together more ICT practitioners than the ICT sector. About 40 percent of the people with ICT practitioner occupations work within the ICT sector.
Figure 20. Danish ICT practitioner skills labour market 2004.
Source: Information Society Denmark – Status 2004
The Confederation of Danish Unions has commissioned a scenario exercise on future demands of ICT qualifications at upper-secondary level/ short cycle higher education for the year 2015. It is expected that demands for people with ICT profiles at upper secondary level will be limited as the supply of graduates at tertiary level has been gradually increasing. (Danish Technological Institute with the Confederation of Danish Unions, 2004)
Estonia Figure 21 shows that the new supply of e-skills, measured as computing graduates in higher education per year, is increasing in Estonia. The Estonian Labour Force Survey data indicates that, except for last year, Estonia has experienced increased demand for e-skills in general since 2001.
28,648
14,223
14,665
8,014
41,859 22,058
61,302 ICT Occupations
92,832
ICT Graduates
65,543
ICT Sector
106,006

RAND Europe Current situation of supply and demand of e-skills
51
Figure 21. Development of Estonian computing graduates in higher education 1994-2004
0
100
200
300
400
500
1994 1995 1996 1997 1998 1999 2000 2001 2002 2003 2004 Year Number of graduates
Source: Statistical Office of Estonia
Germany The available data for Germany focuses on the supply side and formal education. Supply of ICT practitioner skills, measured as number of graduates in informatics, increased in Germany a few years ago (see Figure 23). However, according to data in BITKOM (2005), this development might not continue in the future. Figure 23 shows that the number of students starting Informatics studies has been decreasing between 2000 and 2004.
Figure 22. Number of graduates in informatics in Germany, 1998-2002
6.66.4
5.86.1
6.6
-
2.0
4.0
6.0
8.0
1998 1999 2000 2001 2002
Year
Nu
mb
er
of
gra
du
ate
s (
in t
ho
usan
ds)
Source: Federal Statistical Office Germany

The supply and demand of e-skills in Europe RAND Europe
52
Figure 23. Students starting Informatics studies in Germany, 2000-2004
3836
33 33.6
28.6
0
10
20
30
40
50
2000 2001 2002 2003 2004
Year
Nu
mb
er
of
stu
den
ts (
in t
ho
usan
ds)
Source: BITKOM based on Federal Statistical Office Germany
Latvia According to the reviewed reports, the Latvian Government has prioritised education in ICT since 2001. In 2005, the University of Latvia will open a Faculty of Computer Science that will offer study programmes in line with Career-Space skills classifications. The supply of e-skills is already increasing. During the last four years enrolment for ICT students has on average increased about 7 percent annually.
Figure 24. Increase of ICT students in Latvia, 2000-2003
0
500
1000
1500
2000
2500
3000
2000 2001 2002 2003
Enrolled with private financing
Enrolled with government financing
Graduated with diploma
Source: LITTA, 2004
The reports also address the supply of skills developed through training. In 2003, IS companies reported spending €1,2M on training – an average of € 890 per employee. That is twice as much as was spent for this purpose among all IS companies in 2002. The Baltic

RAND Europe Current situation of supply and demand of e-skills
53
Computer Academy delivers an average of some 700 (industry) certification examinations per year to IT specialists who take tests in IT solutions.
Figure 25. Certification exams split by IT vendors, Latvia
3%3%3%
7%
8%
10%
59%7%
Microsoft
HP
Oracle
Cisco
IBM
Novell
SUN
Others
Source: The Baltic Computer Academy, 2003
LITTA (2004) reports findings from a survey carried out by the Hay Group in 2004, which indicates e-skills shortages or mismatches in Latvia. According to the survey, 88 percent of Latvian ICT companies reported that they encounter scarcity on the market for certain types of jobs or degrees specific for the ICT sector. Table 4 shows that e-business skills are perceived as the scarcest skills. Latvian companies lack qualified IT consultants with management and communication skills and of business developers and sales representatives. These results suggests strong need for finding ways to increase the monitoring of the demand and supply for these e-business skills. The survey by the The Hay Group study is the only data source this study has found, either at the international or national level, that explicitly measures demand for e-business skills.
Table 4. Jobs for which there is a perceived scarcity in Latvia
Source: Hay Group, 2004
Jobs % of companies that perceive scarcity
Qualified IT consultants with management and communication skills
88%
Business developer / sales representative 75% IT architect 75% Project manager 50% Programmer 50% ERP specialist 43% SAP specialist 38% Data communications specialists 25% IS security specialist 25% Voice service specialists 17% Marketing specialist 12% UNIX specialist 12% Help desk operator 12%

The supply and demand of e-skills in Europe RAND Europe
54
Luxembourg A survey of 265 enterprises, representing a total of 41,023 staff, suggests that the demand for ICT practitioner skills has decreased during recent years. illustrates that replacement demand is becoming more important for employment in the ICT sector compared to creation of new positions. The data includes all occupations within the ICT sector, so it is not possible to identify the demand for ICT practitioner skills.
Figure 26. Creation versus replacement of positions in Luxembourg
2001
23%
77%
Replacement
Creation
2003
43%
57%
Replacement
Creation
Source: ABBL, clc, FEDIL 2004
The Netherlands The “ICT Marktmonitor 2004-2005” estimates that the ICT practitioner skilled workforce in the Netherlands in 2004 was made up of 117000 professionals. Furthermore, the report argues that there has been an excess supply of e-skills in recent years but that this situation is changing. In 2003, there was a surplus of 4600 highly educated ICT practitioners in the labour market. In 2004 the surplus had decreased to around 1000 practitioners and projections for 2005 show expected shortage.
Sweden According to the report “Arbetskraftsbarometer 2004”, the share of Swedish companies recruiting ICT practitioners increased in 2004 for the first time since the year 2000. This indicates that less favourable market conditions for ICT practitioners in the Swedish labour market of previous years might be changing. However, the report suggests that there still is a surplus of e-skills in Sweden. The report looks at quite broadly defined groups of skills, and classifies them according to educational background. Given this classification it is not possible to determine if the increased demand is actually for ICT practitioner skills or for closely related skills.
On the supply side, the trend is reversed. Between 1996 and 2001 the number of students accepted for ICT educations increased, but has since sharply declined. This trend is illustrated in , which is likely to decrease the future new supply of ICT practitioner skills, probably due to the fact that students have become reluctant to follow ICT higher education due to the unattractive situation in the labour market in recent years. If the situation in the labour market is currently changing as suggested in the “Arbetskraftsbarometer 2004”, this trend might well change again.
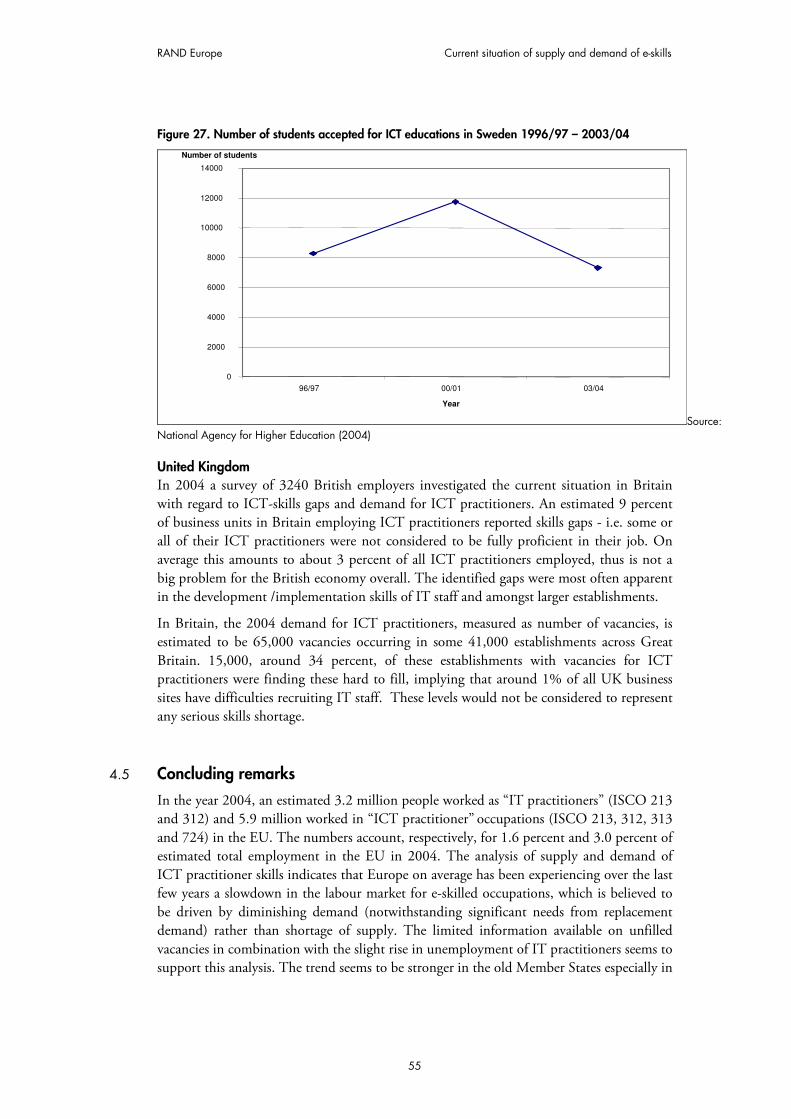
RAND Europe Current situation of supply and demand of e-skills
55
Figure 27. Number of students accepted for ICT educations in Sweden 1996/97 – 2003/04
0
2000
4000
6000
8000
10000
12000
14000
96/97 00/01 03/04 Year
Number of students
Source: National Agency for Higher Education (2004)
United Kingdom In 2004 a survey of 3240 British employers investigated the current situation in Britain with regard to ICT-skills gaps and demand for ICT practitioners. An estimated 9 percent of business units in Britain employing ICT practitioners reported skills gaps - i.e. some or all of their ICT practitioners were not considered to be fully proficient in their job. On average this amounts to about 3 percent of all ICT practitioners employed, thus is not a big problem for the British economy overall. The identified gaps were most often apparent in the development /implementation skills of IT staff and amongst larger establishments.
In Britain, the 2004 demand for ICT practitioners, measured as number of vacancies, is estimated to be 65,000 vacancies occurring in some 41,000 establishments across Great Britain. 15,000, around 34 percent, of these establishments with vacancies for ICT practitioners were finding these hard to fill, implying that around 1% of all UK business sites have difficulties recruiting IT staff. These levels would not be considered to represent any serious skills shortage.
4.5 Concluding remarks
In the year 2004, an estimated 3.2 million people worked as “IT practitioners” (ISCO 213 and 312) and 5.9 million worked in “ICT practitioner” occupations (ISCO 213, 312, 313 and 724) in the EU. The numbers account, respectively, for 1.6 percent and 3.0 percent of estimated total employment in the EU in 2004. The analysis of supply and demand of ICT practitioner skills indicates that Europe on average has been experiencing over the last few years a slowdown in the labour market for e-skilled occupations, which is believed to be driven by diminishing demand (notwithstanding significant needs from replacement demand) rather than shortage of supply. The limited information available on unfilled vacancies in combination with the slight rise in unemployment of IT practitioners seems to support this analysis. The trend seems to be stronger in the old Member States especially in

The supply and demand of e-skills in Europe RAND Europe
56
comparison to the new ones. There is some evidence that several new Member States currently experience certain ICT practitioner skills shortages.
The supply of “new” e-skills, measured in terms of graduates from tertiary education in the field of computing, is increasing at the EU level. However, both EU level data and data at the national level indicate that the trend might well change in a few years time. The number of tertiary students in the field of computing remained flat on average in the EU between 2002 and 2003, after growth in the years before. Moreover, data from Sweden and Germany shows that the number of students starting ICT/Informatics educations is decreasing, implying a future decrease in new supply from the formal education system in these countries. A further drop in the number of computing students would increase the gap between the US and EU in this respect.
Clear quantitative information on the supply of skills through training is lacking. However, the types of skills that are in demand in the commercial training market are given by some sources.
The currently available data is very limited regarding e-business skills. The review has only come across one source that explicitly estimated the demand for this kind of skill. The source was a survey among Latvian ICT companies conducted by the Hay Group. A review of national data collection showed that Member States collect data suggested by Eurostat, even when it is voluntary to do so. Almost all Member States collect ICT data through standardised household and enterprise surveys. These surveys could potentially be a useful vehicle for the collection of additional data on supply and demand for ICT practitioner skills.
Another poorly measured item is outsourcing and off-shoring of jobs. We were unable to find clear data on this aspect save a selection of articles cited in OECD (2004) and indirect calculations using trade data and occupational employment data (OECD 2005), and found nothing at all on the skills implications of outsourcing and off-shoring. Further development of indicators would be called for – a minimum being including questions regarding this topic in employer surveys, and there are likely to be significant problems with companies disclosing much of the relevant data. Furthermore, the occupations and the corresponding sectors that according to OECD are affected could be studied in greater depth.
4.6 Future improvements of existing statistical data collection
Table below provides an overview of the indicators that were proposed in chapter three, the current sources used for this report, and an indication of improvements to data collection activities. Unless an encompassing data collection effort is to be performed at the EU level over a range of years, employing the same frameworks and indicators, the options for improvement are severely limited.
In our discussions with Eurostat, we have identified some possibilities for improvement of current and expected data collection activities; the main possibilities are within the ICT enterprise survey, the ICT household survey, the job vacancies survey, and the CVTS survey. It would also be possible for Eurostat to work with National Statistical Offices to

RAND Europe Current situation of supply and demand of e-skills
57
improve the quality of national data submissions to Eurostat databases. In particular improvements could be made in the “translation” coding across LFS data from national occupational frameworks to ISCO. Should more detailed information be required beyond the range of Eurostat’s regular activities, other data collection activities by, for instance, the OECD should be stimulated. This would include counting (online) job vacancies, interviewing/surveying training institutes and further statistical analysis of national level data.
Clear holes in available data are related to the offshoring field, training and certificates, and replacement demand. At this point, we do not have a clear recommendation for the offshoring data except for adding questions to employer surveys. The same surveys may also be helpful in acquiring a more precise estimate of replacement demand than the range that we have found in three reports. Data on training volumes and certificates awarded may, in principle, be obtained from training providers, probably with the help of appropriate intermediary organisations such as CompTIA/eSCC.
Table . Overview of indicators, existing data sources and potential improvements to data collection
IndicatorIndicatorIndicatorIndicator SourcesSourcesSourcesSources Potential improvementPotential improvementPotential improvementPotential improvement
Unfilled vacancies BISER (2004) collected information on number of establishments that experience unfilled vacancies for selected European regions
ICT Enterprise Survey (or another employer-based survey) shouldshouldshouldshould include questions on unfilled practitioner vacancies – a quantification of number of vacancies would be appropriate
Job vacancies At EU level no data was found. 1) Eurostat collects data on job vacancies but currently only by economic activity, not by occupation - Eurostat Job Vacancies Survey shouldshouldshouldshould include e-skilled practitioner occupations
2) Regularly counting (online) job vacancies in different media. This methodology has been used in Germany, by industry sources to track the supply and demand situation in the ICT practitioner field. An extension to the EU would be interesting but requires investment for set-up and piloting
3) Incorporate expertise of national employment offices

The supply and demand of e-skills in Europe RAND Europe
58
IndicatorIndicatorIndicatorIndicator SourcesSourcesSourcesSources Potential improvementPotential improvementPotential improvementPotential improvement
Replacement demand Estimates of 2.5%, 3% and 9% of stock are used
ICT Enterprise Survey (or another employer-based survey) maymaymaymay include question on replacement demand
Estimates could be improved from further analysis from LFS (in combination with other – demographic) data.
Offshoring activities No data sources were found ICT Enterprise Survey (or another employer-based survey) maymaymaymay include question on offshoring activities
Unemployment EU LFS data provides information on unemployment in occupational profiles, but low sample size makes outcomes less reliable
Get Member States NSO’s to agree to increase sample size of LFS
Number of graduates 2-digit ISCED EF numbers are readily available
1) In future, data on graduates should be collected and submitted to Eurostat at 3-digit level (EF481, EF482 and EF523) – changes to the classification are not foreseen
2) Following the example of Denmark and the UK, graduates’ “First Destination” industry and occupation should be recorded
Training and certifications
ITAA and CompTIA provide information on what types of courses are taken, which indicates relative importance of topics
Eurostat CVTS shows number of hours spent on computer courses (all levels)
1) Directly interview training providers to ask how many people they train for different practitioner skills
2) The 2006 CVTS survey shouldshouldshouldshould include questions on practitioner courses

RAND Europe Current situation of supply and demand of e-skills
59
IndicatorIndicatorIndicatorIndicator SourcesSourcesSourcesSources Potential improvementPotential improvementPotential improvementPotential improvement
Stock of ICT practitioner occupations
Eurostat LFS data is readily available for 3 digit ISCO codes and provides information on industry, gender, age distribution and nationality of labour force
1) The problem of wrong in- and exclusions of occupations can be addressed by going into the 4 digit level, for which research at the national level would be necessary and current sample sizes may not be sufficient. The updating of ISCO (due 2008) should help in addressing this issue Commission/Eurostat/OCED should press for new, more realistic categories for ICT Practitioners at the 4-digit level
2) A pragmatic way to tackle wrong inclusions in ISCO 313 and 724 would be to examine employment levels in a small sample of member states at a higher level of detail in order to assess what percentage of those two occupations should not be considered ICT-skilled occupations
Other skills measurements
ICT household survey focuses on basic user skills.
ICT Household Survey could include questions regarding practitioner skills, but would require (significant) increase of sample size


61
CHAPTER 5 Anticipating e-skills
The assessment and analysis of the current situation relating to the supply and demand of e-skills has been a challenging exercise given the variety of definitions, the rapidly changing environment within which e-skills are being applied, and the extensive data needs that a detailed review across countries, sectors, and skills levels requires. In addition to the focus on the current situation, this study considered existing forecasting and foresight activities that are aimed to anticipate the future developments related to e-skills. Obviously, given the additional uncertainty involved, anticipating the future situation of e-skills provides even further challenges.
In the second stage of our research, we identified, documented, and reviewed future oriented studies, which explicitly aimed to assess the future demand and supply of e-skills. This chapter provides an overview of the outcome of these studies, in particular how they deal with e-skills related issues and what can be learned from their assessments. Subsequently, we offer foresight as an alternative approach to forecasting the supply and demand of e-skills in the mid-term future, presenting what a foresight study should contain, and what the future-oriented studies that were reviewed contained. Finally, we present a detailed approach for setting up a European e-skills foresight mechanism and a foresight-oriented network of experts, indicating elements of a business plan.
5.1 Systematic review of conducted future studies on e-skills
5.1.1 Approach Based on the method described in section 2.3.1, we analysed a further 15 future-oriented studies examining how these studies deal with specific e-skills issues related to foresight assessments as identified in phase 1 of the study37:
• What is (attempted to be) measured: I(C)T skills, e-business skills?
o What levels of skills are addressed: practitioner, advanced, basic?
• In what terms are skills assessed: future occupational requirements, overall skill requirements, etc.?
37 We also reviewed ten additional reports that contained predictions of the future situation of e-skills. However, in these cases, the predictions were solely based on expert judgement and were not substantiated by any transparent or verifiable method.

The supply and demand of e-skills in Europe RAND Europe
62
• Does the future-oriented assessment look at demand, supply, or both?
• What indicators have been used for the measurement/assessment of future e-skills (stock of employment, qualitative assessment of needs, job vacancies, etc.)?
• Are attempts made to assess mismatches, shortages, gaps in e-skills?
• Are attempts made to distinguish across sectors, countries? What is the basis for the various distinctions?
• Does the future-oriented assessment consider specific issues: gender distribution, offshoring, and the like?
• What data collection techniques have been used (large, small-scale surveys, interviews, etc)?
5.1.2 General observations from these studies In Appendix J, we present the full descriptions of the future studies on e-skills. The table below gives an overview of the frequencies with which certain features appeared in the reviewed studies.
Table . Feature frequency table for future studies on e-skills
Feature Number % of reviewed studies
5-10 year time horizon 7 47% 2-5 year time horizon 6 40% International 9 60% Focus on demand and supply 6 40% Focus on demand only 6 40% Focus on e-business skills 1 7% Employment indicators 8 53% Trend analysis 3 20% Scenario approach 5 33% Survey approach 9 60% Economic model 5 33%
We found that all studies have a 10-year time horizon or less; this is probably an attempt to strike a balance between aiming for predictability of technological developments and requirements (which would favour a shorter time horizon) and considering a horizon that could include societal, organisational and educational responses to skills requirements. Furthermore, only about half of the studies places skills in an international perspective. The focus on demand, supply and employment indicators is mixed – in other words: the studies focus on a limited set of issues at stake. About half of the studies had some form of stakeholder involvement through a survey, questionnaire or interview and only one study specifically mentioned e-business skills.
The studies reviewed have applied different methods for estimating or forecasting future supply and demand. We have distinguished two main categories: the first comprises those studies that are using economic growth models or analyses; the second group consists of studies that are based on scenario approaches. Some studies apply scenarios to an economic growth model and thus fall in a ‘hybrid’ category.

RAND Europe Anticipating e-skills
63
5.1.3 Economic growth approach CEPIS (2002) suggests that the prevailing approach is to estimate skills demand levels from a productivity factor applied to business activity levels arising from assumed economic growth in a sector. The most well known example of a forecast approach is the IDC/EITO 2001 analysis, which predicted a sizeable increase in e-skill shortages. However, this approach suffers from a number of shortcomings: (1) the chosen skills categories are uniquely based on IDC’s own classification and thus cannot be tested against other approaches using different skills frameworks; (2) all kinds of ICT users are included in their estimates although the IT-component of their job may be very small; and (3) the supply estimate relied heavily on formal education only.
The second example is the European Economic Research Consortium (ERECO) approach, which is based on employment growth rates derived from a European-wide econometric model (E3ME)38. According to the authors, the appeal of this approach is that it can be encompassed within a coherent forecast of growth and jobs (Career-Space 2001). However, European developments were predicted based on the sector employment levels within the UK (as UK SOC90 data was used and comparable data for Europe was not considered detailed enough), which does not take into consideration differences in sectors per country. Also, only IT employment was forecasted and no shortage figures were estimated.
5.1.4 Scenarios approach The approaches discussed above present their outcome as a single number. However, as Career-Space (2001) points out, the rapid and at times discontinuous pace of innovation of ICT technologies can mean that point projections of skill-demands quickly become obsolete. In addition, presenting just one number could give a false impression of certainty (CEPIS 2002). The scenarios approach partly accounts for the uncertainty in forecasts by providing a range of potential future developments.
Based on current stock CEPIS (2002) chose to base its scenario predictions on the relatively constant measure of the EU LFS data (of ISCO 213 and 312). An initial ‘trough’ in the demand (reflecting expectations about lay-offs in the high-tech sector) is superimposed over 4 scenarios of annual employment growth (2%, 5%, 10% and 15%). It is argued that employment development curves do not change significantly in the short run (several years) and that this approach is more robust than the IDC and Career-Space approaches due to the use of EU LFS data. However, the reservations about the data gathering of EU LFS data remain and the ‘trough’ in the data is based on the author’s assumptions about the future. In essence, one could argue that the predictions are still based on a single scenario, but with four variants.
Based on expert opinion As with the measurement of the current status of skills, future developments can also be based on the opinion of experts or stakeholders gathered through questionnaires or
38 This is the Energy-Environment-Economy Model for Europe, developed by Cambridge Econometrics.

The supply and demand of e-skills in Europe RAND Europe
64
interviews. Biat (Cedefop/biat 2003, EUQuaSIT 2004) took this approach and concluded that close to 30% of companies in the ICT sector and ICT user sectors expect short-term growth in ICT employment. They also found that most European companies rate the supply of ICT practitioners as fair (40-50%) or even very good (30-40%). However, their conversion of this information to an annual European need of 230,000 ICT practitioners and supply of 220,000 is somewhat unclear.
Instead of coupling employment to GDP growth, they determine ICT employment growth in the next years at no more than 5% per annum;39 they apply three variants (‘scenarios’): 2 %, 3.5% and 5% linear growth between 2000 and 2010. When starting with an initial population of ICT practitioners of 3,7 million in 2000 the middle variant leads to a stock of approx. 5,1 million practitioners in 2010.
Based on economic indicators/hybrid The Federation of Finnish Electrical and Electronics Industry commissioned a scenario study based on economic indicators (Åbo Akademi, 2001; this approach could also be considered based on economic growth). The model calculated the ICT employment (total and in manufacturing, telecommunications, and services) based on the relationship between ICT employment and 8 indicators: GDP growth, ICT expenditure growth, R&D in ICT growth, ICT export growth, Total employment growth, Value added in manufacturing growth, Value added in ICT services growth and an opinions multiplier. Although from a data-gathering point of view it is an impressive exercise, there are some drawbacks to this approach. The approach assumes the same economic structure in the 10 years after 2000 as in the six years before it (the multiplier factors are based on 1994-1999 data and kept constant afterwards, and the weight of each of the multipliers in the model is fixed (65% for GDP and 5% for the other seven factors)). In addition, Finland, The Netherlands, France and Spain are used as representative of the EU-15. It is also not clear how ICT employment is defined and whether this definition is similar in the four countries.
5.1.5 Lessons to be learned The field of ICT and ICT-related skills is still very dynamic and many studies admit that capturing skills in a static framework is bound to display only a limited picture. Such a picture still yields valuable information, but it should at least be augmented by a more comprehensive discussion of issues at stake, including policy issues.
However, the question arises to what extent policy makers in the field of e-skills – notably the European Commission – would benefit from yet another prediction in a range of predictions that seem to address slightly different topics with slightly different definitions. Based on the current knowledge base on e-skills, and the studies and reports that we have identified in this project, we can conclude that the topic is still defined in a multitude of different ways and that as a consequence the debate remains blurred.
39 Based on the data from company surveys as well as assumptions of the economic development, specifications on the demand of ICT practitioners and the overall development until 2010 are given.
RAND Europe Anticipating e-skills
65
There are a number of major uncertainties that have to be taken into account when addressing the future of e-skills:
1. ICT developments are rapid and uncertain: over the past decade, technology has developed at a tremendous speed and as a consequence ICT skills constantly need to be reviewed or refreshed (or even discarded) in most professions today; moreover, in what direction the developments are moving is unclear: the effects of convergence of technologies and the rise of alternative ones such as ambient technology cannot be clearly foreseen thus making it risky to prepare for a specific technology that might not catch on;
2. The education system takes time to change: knowledge needs to be synthesised, assimilated, and formalised before it can be incorporated into any more or less formal education system; we have seen that elements of computer literacy have taken a long time to percolate into primary level education and still many teachers are lacking the computer skills to educate their pupils;
3. A great variety of stakeholders are involved with different interests in the topic: from a policy perspective there are different elements to consider such as competition in a global market, upgrading the educational system, developing a strong R&D base, free flow of labour, IT-induced innovation, equal access to services, and equal opportunities for developing skills, to name but a few.
These conditions severely limit the strength and usability of the currently applied approaches. Instead of proposing a ‘better approach’ to predictions (disguised as scenarios), we would like to forward a process-oriented approach that incorporates some of the data gathering methods and outcomes described in the previous chapters, but also includes notions of discussion, networks, opinions and interests: a process known as foresight. However, this may entail accepting the fact that quantification of skills demand and supply (and therefore not focusing on occupations) beyond the near-term future (less than 5 years) is a wrong approach.
5.2 Background of future studies and foresight
Within the European Union, foresight is used as one of the major instruments to inform policymaking. The work programme “Strengthening the foundations of the European research area”40 stated that the coherent development of research and innovation policies should be supported by “the development and dissemination of Science & Technology indicators, economic analyses, studies and the exploitation and synthesis of the results of foresight activitiesforesight activitiesforesight activitiesforesight activities carried out at regional, national, European and international levels.” The same approach can be used in streamlining the discussion on e-skills policies as well as coming up with policy recommendations.
Studies concerning the future generally come in two distinct flavours that are based on one of the following premises:
40 ftp://ftp.cordis.lu/pub/fp6/docs/wp/sp1/p_wp_200201_en.pdf

The supply and demand of e-skills in Europe RAND Europe
66
1. Predicting the future (extrapolation, forecasting), which is based on the idea that the system under scrutiny can be described and understood in detail and that the system’s future states can be known;
2. Creating a future to work towards or to avoid (visioning, backcasting), which is based on the thought that present-day action can change the future outcome of a system – however, that some aspects of the future state are not yet known.
Over the past decades, we have seen the emphasis change from the ‘type 1’ future studies to the ‘type 2’ studies. Also, future-oriented studies shifted from activities performed by a select group of experts who were barely involved in the actual field to an exercise in which stakeholders play a more pertinent role in describing and shaping their future. 41
A process called ‘foresight’ was developed that encompasses a wide range of approaches also used in planning, management of group processes, and organisational learning. Foresight studies formulate and explore visions of the future, exploring developments in science, technology and society. While there are a variety of ways of conducting foresight exercises, they do share some common features, namely:
• Systematic thinking about the medium to long term future;
• Broad scope, including social and natural sciences;
• The formulation of actions and/or priorities; and
• The creation of new networks of actors.
In a foresight process, elements of systems analysis and ‘prediction’ are still present but play a limited role; an equal role is given to clarification of perceptions and values and identifying networks of power and influence. A foresight exercise that includes both forecasting and backcasting is useful for policymakers as it can provide them with a better understanding of the strategic context in which they have to make decisions and possible outcomes of activities planned. Thus, analysing the future can enable:42
• An improved understanding of trends, drivers, uncertainties, issues, influences and technologies;
• The identification of pertinent risks and also opportunities within these contexts;
• The formulation of relevant strategies, policies and plans, which are robust (which means that they work in different futures imaginable).
Given the current state of knowledge about e-skills, we believe policymakers (and other stakeholders) can benefit from a foresight exercise, because it could lead to the clarification of this topic that still contains uncertain technological and societal issues (which we will describe below).
41 Hjelt Mari, Paivi Luoma, Erik van de Linde, Andreas Ligtvoet, Janneke Vader, James Kahan: Kokemuksia kansallisista teknologia-ennakoinneista (Experiences with national technology foresight studies), Sitra report 4, Helsinki, 2001.
42 Ibid.

RAND Europe Anticipating e-skills
67
5.3 Observation of foresight elements in conducted studies
On the basis of interviews with key informants and a scan of European foresight exercises (RAND Europe, 2005), the following defining qualities for connecting foresight to the policy process could be formulated:
• Stakeholder presence
o Identify the right stakeholders of relevance to the topic
o Give each stakeholder reason to participate
o Involve different groups at different stages
o Ensure that the topic is defined narrowly enough to allow a representative group of stakeholders to be selected given the available resources
o Build political support
• Topic design/relevance
o Identify the specific objectives of the foresight exercise
• Technical design/validity
o Allocate responsibility and resources for conducting foresight to dedicated professionals
o Select appropriate foresight techniques
o Focus on disagreement as well as consensus
• Process design
o Think in time
o Communicate actionable recommendations tailored to their audiences
• Evaluation design/feedback
o Evaluate
These qualities should also apply to a scenario-based foresight of e-skills. As a next step we analysed how the studies that we have reviewed deal with a set of foresight characteristics. As none of the studies under review were specifically set up as a foresight process, we did not expect them to score very well in terms of these ‘principles’, as indeed they did not. But, they do provide a starting point for identifying an appropriate direction for e-skills foresight.
5.3.1 Stakeholder presence
Involving the right stakeholders (multi-stakeholder participation) One of the key points of a foresight process is that the involvement of all relevant stakeholders is necessary to ensure that the results of the exercise are comprehensive. Further, the involvement of all stakeholders lends the exercise the legitimacy it requires to contribute to policy development.

The supply and demand of e-skills in Europe RAND Europe
68
In the studies that we have reviewed, the main method of involving stakeholders was through interviews and surveys in the ICT industry, with area experts and foresight specialists. The fact that some studies were conducted by or on behalf of consortia of stakeholder groups (such as the Career Space Consortium) only partially satisfies the need to involve a broad range of viewpoints. Ideally, stakeholders would be involved in both the problem definition phase as well as a solution-seeking phase.
Building political support There must be sufficient political support for the objectives set for the foresight exercise. In addition, there has to be sufficient political support for the foresight exercise itself. High-level political support is needed before the start of the project. This is necessary to ensure that sufficient resources are devoted to the foresight exercise, and to encourage other stakeholders to participate.
In the exercises reviewed, support from policymakers before and during the project is often not reported. Two reports mention some support: in the Forfás report (2003) an Expert Group is mentioned that work in commission from the Irish Minister for Enterprise, Trade and Employment and the Minister for Education and Science; the government is also mentioned in the report of e-skills UK (2004) - the government licenses the remit of e-skills UK as the Sector skills Council for IT, Telecoms and Contact Centres.
5.3.2 Topic design/relevance
Identifying specific objectives The objectives of the selected studies focus mainly on highlighting a selection of recent developments and future directions in the field of e-skills and education. The overall aim is often to inform or influence policy decisions and only few studies aim to develop a coherent strategy to prevent future lack of ICT people (i.e. strengthen education and training of I(C)T practitioners). Two reports focus on measuring the needs required by industry (Career Space, 2001; Qualifications de demain, 2004).
Depending on the objective, the focus of the studies differs: demand only, supply only, both supply and demand, or employment. In some cases outsourcing (to low wage countries) and skill shortages were explicitly addressed. The type of skills that are mainly addressed are practitioner I(C)T skills and in only one publication (EMCC, 2003 - Shaping the future of financial services) we found an explicit focus on e-business skills. Often the future-oriented studies measure occupational requirements at the practitioner level.
As already indicated in previous chapters, the area of research is potentially vast. The formulation of the policy objectives to be addressed by foresight defines to a large extent the orientation of the subsequent foresight exercise – for example, whether it is primarily technology or society driven – and to some extent also the most appropriate methodology and techniques: e.g. a formulation of skills supply in terms of employment using ISCO codes will leave out a whole range of practitioners – notably those with e-business skills.

RAND Europe Anticipating e-skills
69
5.3.3 Technical design/validity
Selecting the appropriate techniques The background data to the studies is mainly collected by means of surveys or interviews, secondary data analysis that mainly focus on LFS data, and literature review. These techniques are all appropriate for specific goals: surveys and interviews to gauge opinions and expectations, statistical data to provide the quantitative, historical context and literature review to provide a broad background of policies and studies.
However, on the basis of the review we can conclude that the different future-oriented studies focus on (quantitative) forecasting and very few studies use backcasting. Almost all studies use some form of trend analysis or economic growth approach, but do not take into consideration structural changesstructural changesstructural changesstructural changes in the demand and supply of e-skills (as caused by technology breakthroughs, new innovations, paradigm shifts). Therefore, these analyses project a future market for ICT practitioners under the assumption that everything remains the same for the years to come. Some studies refer to the term ‘scenario’, but actually these scenarios constitute a sensitivity analysis based on the variation of one (or two) variable(s).
Allocating responsibility It should be clear that a broad foresight exercise encompassing both quantitative and qualitative elements as well as backcasting and forecasting, should involve the right mix of professionals for the job.
Focusing on disagreement as well as on consensus Whereas the studies that focus at providing an overview (such as OECD, 2004) do indicate divergence in outcomes of studies, the future-focused studies seem to provide little discussion regarding diverging opinions. As said above, some scenarios present different employment numbers based on the variation of a few variables. The basic premise of the forecast is however not challenged.
Although the presentation of disagreement complicates the discussion of outcomes, it would provide a broader picture of the issues under scrutiny.
5.3.4 Process design/credibility
Thinking in time A study is most effective if it is delivered at the point at which a decision is taken. Furthermore, repetition and continuity ensure that the outcomes of an exercise can be compared to previous outcomes.
In most of the e-skills reports no specific connect

The supply and demand of e-skills in Europe RAND Europe
70
changing educational practices as a response to a foresight-study would require several years.
Communicating actionable recommendations Many of the studies are mainly focused at providing information. This is a perfectly valid goal, but it does decouple the information provision process from the policy making process. As such, the main recommendations of the studies reviewed concern information provision. If a future study is aimed to help policy makers,
5.3.5 Evaluation design/feedback
Evaluating This element is also underdeveloped in the studies – this is probably due to the fact that the studies are mainly focused at providing information (see above). A more action-focused project would include an evaluation section. This would periodically review whether the actual developments in the field match the foresighted developments. If this is not the case, the basic assumptions of the foresight may be wrong and policy recommendations should be reviewed. Once again this emphasises a process approach instead of a one-time study.
5.3.6 Conclusion From this analysis we conclude that the conducted future-oriented studies on e-skills do not address the bigger picture of e-skills (i.e. ICT skills and e-business skills in the context of changes in technology, education and society) and that most studies are based on different assumptions, making comparisons difficult. Furthermore, stakeholder involvement could be improved and the outcomes of the studies have an unidentified effect on the policy making process. The challenge is to address these limitations in upcoming foresight studies.
5.4 Structure for a foresight study on e-skills
Based on our research, we find that most future-oriented studies that focused on e-skills supply and/or demand:
1. frame the issue of e-skills in different ways;
2. depend heavily on forecasting skills demand and supply by trend extrapolation or an economic-growth approach whereas structural changes are not accounted for (even although the term ‘scenario’ is sometimes used);
3. seem to be geared towards providing information, but not engaging in the policy process and disregarding political realities;
4. lack sufficient inclusion of the variety of stakeholders that is involved in the various topics related to e-skills.
In the paragraphs below we indicate how a new foresight exercise may be structured to provide the required input for the field of e-skills.

RAND Europe Anticipating e-skills
71
5.4.1 Framing the issue One of the prime problems with recent studies of e-skills demand and supply is the incoherence between the definitions of what skills are included and what skills are excluded, at what level of education the practitioners should be considered ‘practitioners’, what skills correspond to what job title, and which type of skills a study should focus on. This issue is clearly visible for the e-business skills, for which a clear definition that can be operationalised is lacking.
The first task of the foresight exercise would be to reframe the issue, which may initially even broaden the question to: “what skills are needed under what circumstances as a result of the production and application of ICT in business processes?” In all studies concerning the topic, e-skills (however framed) were already the answer before the question was asked. In coordination with a steering group of stakeholders, an approach should be chosen that sufficiently captures the most important issues.
The first step is to expand as much as possible the evidence base that will be used for the foresight exercise (which has partially been done in this report). In this step, it is better to capture something that will later be abandoned than to miss something that would have been useful – in foresight terms: looking for weak signals. The next step is structuring the evidence according to the major analytic dimensions that will be needed, including substantive content, geographical and temporal scope, issues addressed, societal factors influenced, and the nature and quality of the evidence. Given the breadth of the topic, we expect this structured evidence to not require the highest degree of detail imaginable in terms of quantification. Additional research in the shape of surveys may still be required – not to find out what the status quo is, but what expectations are for the coming years.
5.4.2 Developing scenarios and structural changes One of the reasons for going beyond forecasts is that they rarely encompass structural or systemic changes – i.e. planning as if things will remain the same in the future. Although this assumption may hold in some fields, the field of ICT has been notorious for its quick and unforeseen changes over the last decades, and the e-skills domain includes many facets of education, training, organisational needs and other job market developments.
A scenario approach is therefore more appropriate: this enables the combination of quantitative and qualitative elements as a basis for discussion in foresight panels. Scenarios thus form an analytic tool to illuminate the underlying uncertainties of a policy decision, and to enable decision makers to make more rational decisions taking fuller account of the unpredictability of the future. By discussing possible futures, discussions do not have to focus on whether a prediction is true, but on what actions have to be undertaken to promote such a future (if it is positive) or to mitigate it (if it is negative). There are various approaches to scenario development, but most focus around a core set of steps to be taken:
• Step 1: Identify the scope of the scenario and develop a system diagram
• Step 2: Identify drivers of change
• Step 3: Categorize drivers based on their level of impact and uncertainty
• Step 4: Develop scenarios

The supply and demand of e-skills in Europe RAND Europe
72
Finally, a scenario or a set of scenarios has to fulfil the criterion that it should be plausible, but it does not have to be probable. Indeed, given the uncertainty of the future, we explicitly state that a scenario is not a prediction, but only a possibility, as likely as many other possibilities.
5.4.3 Finding the right stakeholders What flows from the logic of the sections above is that it is important to engage with the right type of stakeholders. The European e-Skills Forum already engages a number of different national experts and/or policy makers. Whereas this set-up may suffice as a discussion forum, the Forum does not cover all stakeholders from EU member states and thus is too limited a selection for a full-fledged foresight exercise. A broad European foresight exercise requires the identification of additional panellists (researchers, policy makers, business representatives). In the course of this project, we have identified a number of additional researchers and policy makers that are involved in e-skills as well as organisations that have worked on e-skills futures (these are all mentioned in Appendix C). Nevertheless, that list may be considered a starting point; when expanding the scope of the project, these types of stakeholders should be included in a foresight:
• Representatives of trade unions, as they would have a broad view of market developments and problems related to shortages of skilled workers;
• Representatives of enterprises (ICT users), as they depend on a skilled workforce and have a stake in ensuring that new personnel is properly trained and that the skills of existing personnel are updated to be more effective;
• Representatives of ICT industry, who depend on skilled workers like the other industries, but also are responsible for implementing new technologies and are better aware what type of skills are required;
• ICT researchers and developers, as the developers of new technologies have insight in what technology has to offer and can (partially) influence to what extent these technologies are skill-friendly and would require basic user skills or more advanced practitioner skills;
• E-skills researchers, who have researched both quantitative and qualitative aspects of the issue of e-skills, are aware of historical developments and methodological issues;
• Policymakers in the field of education, research, enterprise, innovation, information society, as they are the ones that can influence policies and initiate changes should they be convinced of their importance;
• Foresight specialists, who have a broad view on changes in society and the interaction between society and technology.
All the issues conceivable in the realm of e-skills cover a very broad spectrum and could significantly expand this list of stakeholders. What is important to note is that the social and political framework in each country is different and that therefore the type of stakeholder per country may differ too. An EU-encompassing exercise may require a too diverse group of stakeholders to interact, so that either a very narrow selection of topics is

RAND Europe Anticipating e-skills
73
required or a more regional focus – the task of a European project would then be to prepare a generic framework and scenarios for a discussion on e-skills topics that could be used at regional or national level.
5.4.4 Developing visions and formulating strategies The final outcome of foresights goes beyond the development of scenarios. Based on various ways of interactive discussions, the function of a foresight is to identifying areas of consensus. Following from this is the crucial element of the elaboration of a guiding strategic vision, to which there can be a shared sense of commitment (achieved, in part, through the networking processes). The shared vision is not a utopia. There has to be explicit recognition and explication of the implications for present day decisions and actions.
At the same time, foresight can make an important contribution by increasing understanding of the differences between participants’ views. Identifying such areas of disagreement can be an important policy contribution since it identifies areas where joint action is impossible. This is relevant for exercises at the European level since policy development requires a threshold of support from Member states.
In short, the output of foresights should provide insights into the consequences of alternative courses of action in the context different possible futures.
5.4.5 Engaging in policy making The involvement of policy makers as well as other stakeholders in a foresight and scenario exercise will enable a more direct way of engaging all parties in policy making. This notion stems from the recent development of policy-making as a single-actor top-down (i.e. the policy maker) activity to policy-making as a multi-actor activity.43
Stakeholder involvement in the development phase has three important functions:
• Integration and analysis from different points of view and can lead to results that never could have been arrived at if the stakeholders had not been involved. The danger here is that the focus can become too broad and therefore a careful consideration of issues is necessary.
• Learning.... It contributes to learning by participants. The foresight exercise is focused on future developments that are potentially very important to the stakeholders. They are exposed to developments, some of which they may not have considered before.
• Mobilisation.... It draws people into an ongoing discussion in an active and creative way. It provides the venue for drawing participants into a vision development process. This can generate support for the process.
Identification and interaction with the stakeholders has an additional purpose: the information from the stakeholders regarding their interests, their points of view and the
43 Cf. Riet, O.A.W.T. van de: Policy analysis in multi-actor policy settings, Eburon, Delft, 2003; It has now become customary to involve representatives of the major stakeholders in the policy preparation process, where a stakeholder is defined as an actor who is affected by the policy issue or can affect the direction of policy.

The supply and demand of e-skills in Europe RAND Europe
74
interactions thereof, will be included in the impact assessment of the developments. This is useful in the next step of foresight, which is to construct potential levers for policy action in order to try to steer the course of history towards desirable aspects of the future and away from undesirable aspects.
• A final important element is dissemination.... Anything worth saying should be said well. To say it well requires multiple ways of presenting, including a scientifically acceptable report of the work performed. However, presenting only to other scientists is far from sufficient; in addition, dissemination must include presentations of a general nature acceptable to policy makers, and specialised documents and presentations that provide lessons learnt and potential action recommendations to specific audiences.
5.4.6 Process Issues In designing a foresight exercise, there are process issues that need to be addressed concerning the ambition level, which translates into scale and sustainability. As we have repeated throughout this chapter, foresight is a process that encompasses ‘continuous’ engagement of stakeholders in shaping policy. Assuming a high ambition level, the involvement of as many stakeholders as necessary to achieve the required breadth of interests should be pursued. Given the different types of stakeholders mentioned above and the broad geographical scope of Europe, the required amount may well be above several hundred individuals. Before committing to such an exercise, it may be wise to start off with what could be called a ‘pilot study’: to see whether a foresight exercise would be feasible and interesting to the different stakeholders and whether the parties involved would remain interested.
5.5 Setting-up a foresight scenario mechanism at the European level
The previous section provided a number of general technical issues that should be addressed in order to conduct a foresight on e-skills. This section proposes a number of steps for the setting up and implementation of a foresight mechanism.
These steps are:
• Providing overall objectives and context
• Choosing the focus of the foresight
• Determining the scope of the foresight
• Setting a time horizon
• Developing the foresight
• Ensuring commitment of stakeholders
5.5.1 Providing overall objectives and context While there have been a number of foresight exercises focused on future developments related to information society technologies, the specific focus on e-skills development has mostly been lacking or undervalued. The overall objective of this foresight exercise should

RAND Europe Anticipating e-skills
75
be to develop a vision or visions on the development of IST and the implications for future skills requirements for e-business and ICT practitioners in Europe. Therefore, it will address e-skills related issues that will be affected by broader developments in the domain of IST.
A foresight on e-skills in Europe would bring together stakeholders in order to develop insights in the future of e-skills requirements, in a systematic manner. It would provide a broad forum for identifying future visions for e-skills, compare national approaches and viewpoints, and make concrete suggestions to policymakers at both national and EU level.
The outcome of the foresight should be directed to:
• facilitating the planning and developing of skills required by business;
• providing priorities in the investment in education and training;
• improving the cooperation between public and private actors, at international, national, and regional levels, and across domains of employment, education, and business.
Emphasise the European dimension in this exercise
Slightly less than half of the studies that we identified had a focus that crossed national boundaries. Most often these studies had a much broader focus than just e-skills development. A European foresight exercise will have to demonstrate its value added to more nationally oriented foresights by stressing the European dimension of the skills issues and by focusing the exercise on how policy actions at the EU-level can be initiated (and perhaps adopted by national member states subsequently). A European foresight can also help to provide overviews of the relative strengths and weaknesses of individual countries in meeting demand or (benchmark progress in European e-skills development in a global context.
5.5.2 Choosing the focus of the foresight Need for focus
One of the first steps in the process of setting up a foresight on e-skills is to determine what its focus should be. A foresight exercise on e-skills development will have to face the challenges created by the complexity of the types of stakeholders associated to it. The levels of governance involved (from local to international), the various domains to which the issues are related (e.g., business, education, employment), and the mix of public and private sector actors that have an interest, create this complexity. In the assessment of the current situation presented in the earlier sections of this report, a large set of issues was already addressed that affect the needs of the various stakeholders mentioned (e.g., differences between developments in various industry sectors, the potential of increasing the share of women with e-skills in the labour force, the effects of offshoring on the demand and supply of e-skills, etc.). To decrease the complexity, a specific focus should be provided for this initial foresight exercise.

The supply and demand of e-skills in Europe RAND Europe
76
Selection criteria
The criteria that should be applied for the selection of this focus are:
• There is a current lack of understanding of certain broader developments related to e-skills;
• There is a considerable level of uncertainty about what factors are affecting developments in the future;
• There is a value added to conduct the issues at a European level, for instance, by providing an opportunity to benchmark various strategic and policy directions and to create transnational learning potential for policymakers.
Offshoring or a broader development such as the internationalisation of ICT may be good examples of these issues. Also, the significance of e-business and the required skills to conduct e-business is a topic that seems to meet the selection criteria.
The definitions of e-skills and the occupations (e.g., ICT practitioners) that will be affected in the future are at the same time too narrow and too broad to become a topic of a foresight. They are too narrow in the sense that they may be such fundamental changes related to ICT that a focus on e-skills specifically may not capture these (e.g., internationalisation of ICT, or convergence of technology). At the same time, scenarios focused on ICT practitioners may miss important underlying issues of certain target groups (such as women, older professionals, certain skills groups).
Nature of the effort
Foresight efforts can be potentially expansive and expensive. In addition to the thoroughness of the analysis and the developments considered (most likely expressed in the duration of the foresight), the geographical scope and the potential recurrence of a foresight activity will strongly determine the nature of the effort. There are a number of directions that can be considered:
• A unique Pan European foresight study focused on potential policy interventions;
• Tailored approaches to regional and specific countries but with an overarching architecture that provides consistent definitions and methodologies enabling broader analysis;
• An approach stressing the overall European position in comparison to other major countries or regions.
Additionally, specific sectoral approaches can be applied to all these directions.
We would propose an initial pilot-oriented approach covering a limited number of countries. The foresight should start out as a moderate effort that could be upscaled and repeated once successful, e.g. a pilot foresight study in four countries (where the issue of e-skills is prominent). These countries do not necessarily have to be representative of the entire EU but should take account of differences in size, location and political system (involvement of stakeholders) to provide sufficient flavour of potential intervening factors. The benefit of a smaller scale effort is to create familiarity with the foresight mechanism for

RAND Europe Anticipating e-skills
77
the larger e-skills community and insight in the possibility to link outcomes to the policy process.
5.5.3 Determining the scope of a foresight An outside-in approach
Despite the need for a focus on an e-skill related issue, a foresight exercise has to be broad in scope almost by definition. More importantly, the emphasis of the entire exercise would have to take a much broader perspective than solely anticipating what future (demand of) e-skills would be based on economic, social, or technological developments. Such an inside-out approach will undoubtedly fail to capture all the factors that affect the demand for e-skills in the future.
In principle, the main starting point should be: what e-skills should be available or will likely be demanded in the mid to long-term future. An outside-in approach like this would provide much more valuable insight by identifying all factors that are related to e-skills developments in that future.
A foresight study on e-skill developments is to expand on the knowledge that has been developed by other related studies and, subsequently, should apply this knowledge in the context of ICT & work and ICT & society. In the first instance, this may not be directly addressing (e-)skills development but broadens the issue so that this may lead to additional insights that may not be found when focusing narrowly on skills.
Factors/dimensions to be considered
As indicated, a number of broader scenario and foresight studies have already identified the driving elements of the developments of IST, albeit not often with the focus on how that will affect the future demand of skills. These driving elements can be classified in a number of groups:
• Science & technology factors: the convergence of technology, the rise of ambient technology, developments of hardware and middleware, infrastructure, improved human-machine interfaces, and new applications or work methods evolving from this;
• Economic factors: internationalisation of ICT and globalisation of the economy, emergence of countries such as India, Russia, Brazil, and China affecting the competitive position of Europe, overall economic growth, changing business models;
• Demographic factors: growth of world populations, decline and diversification of European working populations (e.g., flexibility of workforce, ageing of workforce, composition of workforce, female share of the workforce);
• Social factors: acceptance of the use of new technologies (privacy and security related), need for new products and services, increasing mobility of people, increasing importance of life-long learning (LLL);
• Political factors: governance, e-democracy/demands for transparency of public decision-making processes; public resources available, new possibilities of raising revenues on a consumption basis through the use of ICT.

The supply and demand of e-skills in Europe RAND Europe
78
Subsequently, these broad developments should be analysed to determine the following set of questions:
• What consequences do these developments have on jobs that depend on ICT?
• What are consequences for skill requirements?
5.5.4 Setting the time horizon While foresight exercises could possibly consider developments in a 50-year time period, the heavy emphasis on ICT developments and the expectations of the continuous dynamics in that domain requires a relatively shorter time horizon, perhaps even between five and ten years. However, a longer-term vision facilitates the departure of thinking about e-skills in terms of current problems, technologies, and possible solutions. Taking these two possibilities in consideration, we propose a time horizon of ten years.
5.5.5 Developing the foresight study The foresight study should make use of scenario development that builds on existing scenario exercises (such as ISTAG, foresights documented by FISTERA). In preparation of the scenario developments, insights in additional IST-related developments and potential effects on skills development would need to be further investigated. Thus, in developing the foresight study, there need to be two types of workshops: preparatory workshops and scenario workshops.
Preparatory workshops
Workshops should be held at different locations in Europe to identify drivers of change for ICT-skills and e-business skills (such as technological progress, economic growth linked to growth of the ICT industry, uptake of ICT in industry, skills lifecycles, industry requirements, education system, applications in the market), answering questions such as:
• What developments determine the direction of e-skills requirements?
• How certain are these developments?
• Which skills will become more important in the future?
The outcomes of the workshops can then be utilised for scenario building.
Scenario development & scenario workshops
Next is the development of scenarios that combine quantitative information (forecasts that may be based on a trend analysis or economic growth approach augmented with findings based on (stakeholders’) survey) with qualitative information (possible changes in driving factors, selection of specific focal points based on the main topics).
Scenario workshops should be organised at different locations in Europe to engage with stakeholders and address the main topics of interest or issues of concern. Such scenario workshops allow targeting certain groups such as women or older professionals. The aim of the scenario workshops would be to articulate policy responses that could be implemented at both European and national level.

RAND Europe Anticipating e-skills
79
5.5.6 Ensuring commitment of stakeholders A large and possibly continuous exercise would not only entail a significant amount of funding, but it would also be challenging in terms of keeping the required stakeholders involved in the process. Therefore, apart from a ‘looking into the future’ exercise, a community should be built and fed with incentives to stay involved.
Formulate the problems, objectives, scope of the exercise and the anticipated results (and timing thereof)
In general terms, this would consist of the following steps.
• Define problems in quantifiable terms
• What are current policy objectives that will be addressed by the foresight?
• Connect objectives to positions and expectation
• Formulate a single-sentence missions statement to guide the formulation of objectives to ensure what the importance of the foresight exercise is
• Formulate outcome objectives in relation to a specific (high-priority) policy area
• Ensure the added value of a EuropeanEuropeanEuropeanEuropean initiative
A possible mission statement could be formulated as follows:
To assist European policy makers and professionals to identify future needs with regard to changing professional skills and new job profiles (due to impact of broader social, technological, economic and political developments) by providing a roadmap that will help anticipate upon the required response in terms of changes to the education system, training practices and human resource strategies.
The outcome objectives are very much dependent by the group of stakeholders that is involved. From an employment perspective, a foresight exercise should create understanding about issues in order to improve and plan for the development of career paths, employability, the mobility of labour, and in education and training. From a more specific business perspective, the exercise should shed light on future market requirements for e-business and ICT practitioners, the role of certifications, ways to facilitate the continuous improvement and adapting of (e-)skills of the workforce. Finally, the implications for the education system need to be laid out and should focus on the structural changes that would need to occur to adapt the system to changing skills and knowledge requirements and to provide appropriate ICT training.
Identify a core group of industry, policymakers, civil society, foresight planners
• Use national, regional, and sectoral brokers to cover geographical, functional differences
• Identify positions and expectations of these groups
Based on activities with comparable methods or aims (e.g., the UK Foresight, which is clearly much broader in scope, or a European activity that is more focused, such as the

The supply and demand of e-skills in Europe RAND Europe
80
TrendChart on Innovation) it is necessary to balance the different interests of ambition, scale and sustainability.
In order to establish this balance, one should differentiate between a ‘core group’ of experts and the broader interested stakeholders: the core group should consist of a highly dedicated group of strategic thinkers who set out the direction of the foresight in terms of content, it should also include the project team that does the actual work; the broader group would not necessarily be involved in all activities, but may attend periodic, regional meetings or scenario workshops, based on a special interest.
In addition, a basis should be provided for building a network, such as a who-is-who directory, a common repository of data and reports, regular news provision, periodic activities that focus around topics of interest (the workshops of the Trendchart on Innovation provide good examples of such topical workshops).
Finally, a knowledge base to support the network can be established by commissioning research activities that are targeted to specific topics such as ICT skills requirements in a specific sector or educational activities at a certain level of training.
Assess at what stage of the foresight stakeholders should be involved and how
There are various mechanisms to involve stakeholders and experts. The next section will focus on the establishment of a sizable and sustainable network of experts. There are additional ways of soliciting the input of these stakeholders, which could be brought together through workshops and focus groups, Delphi studies, interviews. These will be dependent on the operational design of the foresight exercise.
A foresight would be sustainablesustainablesustainablesustainable in the case that stakeholders are and remain involved in the activity. This can be achieved through regular information provision and holding events/workshops.
5.6 Establishment of a network of experts
The European e-Skills Forum 2004 conference declaration reached consensus that the European Commission should support the development of e-skills foresight scenarios in cooperation notably with industry, OECD and Cedefop, as well as the establishment of a European network of experts. This section of the report provides a concrete proposal for the establishment of such a network including the elements of a business plan indicating how such a network could be sustainable and scalable. This network of experts would serve as a knowledge base for the foresight activities as described above (which also involves a much larger set of stakeholders) and for e-skills related developments in general.
Purpose The establishment of a more or less permanent network of experts attempts to systematically structure the activities in the field of e-skills and the continuous interaction about the results of these activities and to raise awareness of these findings in a broader environment. The purpose of a network of experts in the field of e-skills would be twofold.
1. The network would provide direct substantive support and guidance to the process of the foresight on e-skills and to provide expertise and credibility to the

RAND Europe Anticipating e-skills
81
activities to be conducted, and the resulting outcomes. In addition, it should reflect on the (substantive) progress of the foresight exercise.
2. The network would have to build capacity for the identification, evaluation and development of e-skills related research, studies and plans by exchanging information, sharing of analysis of ongoing research, and the facilitation of cooperation with other countries (e.g., the US) and other experts in related areas (such as e-business, e-learning). The exchange of information should be conducted among the members, with representatives of the European Commission, and the wider research and policy community. In addition, it should contribute to identifying main areas for research and training.
As such, it would have both a longer-term perspective as well as serve a direct feedback function for the ongoing foresight developments. The perspective on the latter function would be dependent on the feasibility of setting up a structural foresight mechanism.
Scope The network of experts should focus on e-skills development and all related issues (varying from such issues as skills training and certification to gender to offshoring) as they affect competitiveness, employment, and education from a quantitative and qualitative point of view. In addition to the foresight activities, it should cover work in the private and public sector.
These experts should be very familiar with or represent different communities involved in the setting up and conduct of foresight on e-skills development in Europe. They should be able to recognise the importance of the issues addressed by the project, and keen to take the recommendations forward. At the same time, the network should be responsive to requests for support and effective in its contributions to further the development of the foresight activities. As such, it should be scalable and sustainable.
Size and composition The network should consist of a maximum of 12-15 people. Such a size enables the most effective exchange of information while at the same time covering the variety of issues for which expertise may be required. Alternatively, a smaller group may be formed which would engage with additional experts based on the need for additional knowledge and expertise in a committee structure (under the leadership of one permanent network member). This configuration could enhance the dynamics and responsiveness of the network as a whole while at the same time being able to tap into sufficient knowledge bases. A disadvantage may be the lack of committed availability of the additional experts.
Researchers and academics specialising in the field of e-skills should constitute the large majority of the experts in the network. These researchers should have various disciplinary backgrounds (economics, sociology, science & engineering, statistics, public administration) and focus on the various dimensions related to e-skills (such as skills and work, skills and education, skills and innovation, skills and society). In addition, analysts with an experience base in relevant economic sectors as well as public administration should also be part of the network, albeit limited to less than one third to avoid potential overlap with the function of the European e-Skills Forum. Finally, the members should represent various geographic regions within the European Union.

The supply and demand of e-skills in Europe RAND Europe
82
In addition to these direct members of the networks, the nomination of various points of contacts in international governmental and non-governmental organisations and industry associations should be stimulated to liaise with this network.
Operations The network of experts should formally meet in person approximately once every four months. Such a frequency will give enough opportunities to interact and will provide sufficient continuity to make the effort sustainable. Undoubtedly, there will be additional occasion where parts of the network come together, for instance related to the conduct of the foresight.
In addition to the physical meetings, there should be a digital platform for communication that could develop into a virtual community. This could be tied to similar initiatives, for instance, Cedefop’s European Training Village. The web site should contain a discussion space for the members.
On an annual basis, the network should develop a plan of activity as well as a financial plan. This plan of activity should consist of priority fields to be examined, specific actions to be carried out to meet the objectives set, and should contain a dissemination plan. This dissemination plan should include the structure of the web site.
Support The activities of the network of experts should be supported by a secretariat. The secretariat should have both a preparatory role (drafting of plans, agenda, website) as well as a pure organising role (convening meetings, organising conferences, collation of information
Costs We foresee the following categories for which resources are required:
Remuneration of experts Based on a average membership of 15, involvement of 10 days per year @ 600
€ 90.000
Additional expenses of experts Travel Per diem
€ 45.000 €36.000
€9.000 Infrastructural and operational costs (web site, communication s, facilities)
€ 30.000
Organisation of events € 50.000 Costs of secretariat (2 x 0.2 FTE, including overhead) € 80.000
Evaluation The network of experts should be evaluated at a regular basis on how it is meeting its objectives. In order to conduct a proper evaluation, the network in collaboration with its client and financier should develop indicators (e.g., identification of studies, progress in indicator development, number of interactions) along which it can be effectively and efficiently evaluated. For an adequate evaluation such a list should be developed at the start of the operations of the network). A first interim evaluation should take place after two years of operation.

83
REFERENCES

84

85
Reference List
BISER (Lassnig Markus, Mark Markus, Andreas Strasser): Education, Training and Skills in the Information Society – the Regional Dimension, Empirica, June 2004
BITKOM: Daten zur Informationsgesellschaft 2005, Berlin, 2005
Career-Space: Curriculum Development Guidelines - New ICT curricula for the 21st century, Luxembourg, 2001
Career-Space: Determining the future demand for ICT skills in Europe, 2001
Cedefop / Petersen A. Willi, Peter Revill, Tony Ward and Carsten Wehmeyer: Towards a comprehensive European e-skills reference framework: ICT and e-business skills and training in Europe, Cedefop 2004
CEPIS (Council of European Practitioner Informatics Society): Information Technology Practitioner Skills in Europe - Study of the Labour Market position, in particular for Germany, Ireland, Sweden, and the United Kingdom, May 2002
Cochrane Library: Self training guide and notes. Issue 4. York: University of York, Centre for Reviews and Dissemination, 2003
CompTIA: The situation and the role of e-skills industry certification in Europe, discussion paper for the workshop on e-skills industry certification, Brussels, March 2004a
CompTIA: The second annual survey into the state of the IT training industry in EMEA, October 2004b
Computer Associates: Managing eBusiness Development, White paper, 11 April 2002
DTI (Danish Technological Institute): Benchmarking Education in the Information Society in Europe and the US, SIBIS/DTI, Brussels, 2003
DTI (Danish Technological Institute), RAND Europe, SKOPE: Summary Report Defining a Strategy for the Direct Assessment of Skills, 2003
e-skills UK/Experian Business Strategies: IT Insights: Employer Skills Needs, November 2004
e-skills UK/Experian Business Strategies: IT Insights: Employment Forecasts, November 2004
e-skills UK/MRM Solutions: IT Insights: Drivers for Skills Demand, November 2004

The supply and demand of e-skills in Europe RAND Europe
86
Educational Testing Service, Digital Transformation: A Framework for ICT Literacy, Princeton, May 2002
EUQuaSIT: European Qualification Strategies in Information and Communications Technology (ICT), Recommendations on European ICT Qualifications, biat - Universität Flensburg, August 2004
European e-Skills Forum, E-skills for Europe: towards 2010 and beyond, Synthesis report, September 2004
EICTA (European Information and Communications Technology Industry Association): EICTA Position on Skills Shortage in European ICT Industry, Brussels, 2001
European Information Technology Observatory: EITO report 2001, Frankfurt, 2001
European Information Technology Observatory: EITO report 2002, Frankfurt, 2002
European Information Technology Observatory: EITO report 2003, Frankfurt, 2003
European Information Technology Observatory: EITO report 2004, Frankfurt, 2004
Expert Group on Future Skills Needs, Report on e-Business Skills, Ireland, August 2000
Government of Ireland, E-work: Report of the e-work action forum 2002, 2003
Haan Jos de: ICT en Arbeid - Een onderzoek naar het gebruik van ICT op het werk [ICT and work – research into the use of ICT], Sociaal en Cultureel Planbureau, May 2004
Hamer Rebecca, Erik Frinking, Edwin Horlings: Stimulating Science and Technology in Higher Education, MG-270-OCW, RAND Europe, August 2004
ICT skills monitoring group: E-business and ICT skills in Europe, Benchmarking member state policy initiatives, December 2002
ICT skills monitoring group: E-business and ICT skills in Europe, Synthesis report, June 2002
ILO (International Labour Office): ISCO-88: International Standard Classification of Occupations, Geneva, 1990
Intel Information Technology: Addressing the ICT skills shortage in Europe (white paper), November 2002
Information Technology Association of America: 2004 IT Workforce Survey, September 2004
Information Technology Association of America: 2003 IT Workforce Survey, May 2003
Joint taskforce for Computing Curricula: Computing Curricula 2004, 22 November 2004
Mahroum Sami: The Human Resource Factor in the Information Society Future, FISTERA Human Resources Workshop, Sevilla, June 2004
Ministry of Science, Technology and Innovation: A Framework for Qualifications of the European Higher Education Area, Bologna Working Group on Qualifications Frameworks, Copenhagen, February 2005

RAND Europe References
87
OECD (Vladimir Lopez-Bassols): ICT skills and employment - STI working papers, July 2002
OECD: Information Technology Outlook 2004 - Chapter 6 ICT Skills and Employment, Paris, 2004
OECD (Working Party on the Information Economy): Potential offshoring of ICT-intensive using occupations, Paris, 5 April 2005
OECD (Working Party on the Information Economy): New perspectives on ICT skills and employment, Paris, 22 April 2005
O’Sullivan John and Nigel Lloyd: European e-skills conference 2004 Background Papers, Cambridge Professional Development, Thessalonica, Greece, September 2004
Peltola Päivi, Mari Tammi, Sami Leppimäki and Tarja Meristö: ICT Employment Scenarios 2010 - The Future Scenarios of the Employment in the European ICT Sector, IAMSR/Åbo Akademi, 2001
Petersen A. Willi and Carsten Wehmeyer: ICT practitioner skills and training solutions at sub-degree vocational level in Europe, Cedefop/biat, 2003
Petersen A. Willi, Carsten Wehmeyer: Bestand sowie Bedarf und Angebot an IT-Fachkräften, Bundesinstitut für erufsbildung BiBB/biat Berufsbildungsinstitut Arbeit und Technik Universität Flensburg, 2001
RAND Europe: Improving the science/policy relationship with the help of Foresight: a European perspective, 2005 forthcoming
Shapiro Hanne: Skills frameworks and certifications in Europe- A Desk Study, November 2003
STAR: ITEC Skills and Employment – assessing the supply and demand: an empirical analysis, Issue Report N. 11, Sussex, June 2001
STILE (An Bollen & Monique Ramioul (eds.)): Profiling occupations in the eEconomy, a challenging international initiative, D.71, 2004a
STILE (An Bollen & Monique Ramioul (eds.)): International comparison of occupational profiles in the eEconomy, D7.2, 2004b
Symons Craig: IT Skills shortages on the horizon, Forrester, 25 January 2005
Stucky W. and P. Weiss (eds.): eEurope – IT skills: challenging Europe’s Economic Future, CEPIS, 2003
Tijdens Kea and Bram Steijn: Competenties van werknemers in de Informatiemaatschappij [Competencies of employees in the Information Society], Amsterdam institute for advanced labour studies, June 2002
US Department of Commerce: Digital Economy – Chapter 2: Information Technology Workers in the Digital Economy, Economics and Statistics Administration, 2003
US Department of Commerce: Education and Training for the Information Technology Workforce - Report to Congress From the Secretary of Commerce, April 2003

The supply and demand of e-skills in Europe RAND Europe
88
WANE (Tammy Duerden Cameau): Information Technology (IT) employment: what is IT?, Workforce Ageing in the New Economy, August 2003
Van Welsum, D., and Vickery, G. (2005), ‘New perspectives on ICT Skills and Employment’, DSTI Information Economy Working Paper, DSTI/ICCP/IE(2004)10/FINAL, OECD, Paris
Weiss Peter, Dudley Dolan, Wolffried Stucky, Peter Bumann: ICT-skills certification in Europe, Cedefop/CEPIS, March 2005
For references on national reports see Appendix H.

89
APPENDICES


91
Appendix A: OECD definitions of skilled employment
Narrow definitionNarrow definitionNarrow definitionNarrow definition: IT specialists or practitioners group, using the occupations previously used in OECD publications (ISCO88 categories)
213: Computing professionals
312: Computer associate professionals
313: Optical and electronic equipment operators
724: Electrical and electronic equipment mechanics and fitters
Broad definitionBroad definitionBroad definitionBroad definition: attempt to capture those classified as IT specialists, as well as those who can be considered as sector specific users and generic users (ISCO88 categories)
121: Directors and chief executives
122: Production and operations managers
123: Other specialist managers
211: Physicists, chemists, and related professionals
212: Mathematicians, statisticians and related professionals
214: Architects, engineers, and related professionals
241: Business professionals
242: Legal professionals
243: Archivists, librarians, and related information professionals
341: Finance and sales associate professionals
342: Business services agents and trade brokers
343: Administrative associate professionals
411: Secretaries and keyboard-operating clerks
412: Numerical clerks

92
Appendix B: e-Skills reference framework
The framework suggested by Cedefop (2004) attempts to correspond the ISCO 88 skill levels and ISCED 97 education levels as well as the latest level definition of the ‘Directive of the European Parliament and of the Council on the recognition of professional qualifications’ (EC 2004, Article 11).

93
Appendix C: Persons contacted
The following personspersonspersonspersons were helpful in providing statistics, reports, suggestions for contacts, or information concerning the lack of data:
Person Person Person Person InstituteInstituteInstituteInstitute CountryCountryCountryCountry Burkart Sellin Cedefop
Franz Gramlinger Cedefop
Katja Nestler Cedefop
Filip Van Bel Cisco
Ana Franco Eurostat - Labour Force Survey
Birgitta Andrén Eurostat - Education and Culture
Christophe Demunter Eurostat - ICT Household Survey
Hartmut Buchow Eurostat - ICT Enterprise Survey
Heidi Seybert Eurostat - ICT Enterprise Survey
Jonny Johansson Eurostat - Labour Force Survey
Spyridon Pilos Eurostat - Education and Culture
Paul Lefrere Microsoft EMEA
Desiree Van Welsum OECD
Graham Vickery OECD
Karsten Gareis Empirica
Andreas Schiefer Statistics Austria AT
Els Somers Statbel BE
Hugo Lueders CompTIA BE
Jitka Krcilova Directorate of eGovernment Projects CZ
Zdenka Strnadlova Czech Statistical Office CZ
A. Willi Petersen Universität Flensburg DE
Susanne Schnorr-Baecker Destatis DE
The supply and demand of e-skills in Europe RAND Europe
94
Jens Storm Ministry of Science, Technology and Innovation DK
Aime Lauk Statistical Office of Estonia EE
Jaan Oruaas NeDap EE
Jimena Acedo Batalla Ministry of Industry, Tourism and Commerce ES
Jean-Claude Burgelman IPTS EU
Anneli Manninen Technology Industries of Finland FI
Jouni Kangasniemi Finnish ministry of Education FI
Parjo Lea Statistics Finland FI
Veli-pekka Niitamo Nokia FI
Roula Salappa National Statistical Service of Greece GR
Thomas Carroll Central Statistics Office IE
Franco Patini Federcomin IT
Valentina Samiene Statistics Lithuania LT
Linda Szelest Centre de Recherche Public Henri Tudor LU
Tilly Mathieu National Statistics Office LU
Iveta Straume CSB of Latvia LV
Juris Borzovs Riga Information Technology Institute LV
Mara Jakobsone LITTA LV
Maris Treimanis University of Latvia LV
Robert Mizzi NSO MT
Anneke Hacquebard Hacquebard Informatics and Education NL
Arjan van Dijk NGI NL
Jos de Haan Sociaal Cultureel Planbureau (SCP) NL
Raymond Creemers Forrester Research NL
V. A. Fructuoso van der Veen Centraal Bureau voor de Statistiek (CBS) NL
Jacek Tchorzewski/Artur Satora GUS (Polish Statistical Office) PL
Sandra Lameira Institute for Quality in Training PT
Max Kesselberg Ministry of Education SE
Peter Skatt Statistics Sweden - R&D and IT statistics SE
Vladimir Cicmanec Statistics Slovakia SK
Jonathan Cook Statistics UK UK
Marianne Kolding IDC UK

RAND Europe Appendices
95
Terry Watts e-skills UK UK
Bob Cohen ITAA US
Catherine Freeman U.S. Department of Education US
Craig Symons Forrester Research US
Diane Morello Gartner US
Kimberly Riley Bureau of Labour Statistics US
Janeka Sanders Bureau of Labour Statistics US
The following organisations organisations organisations organisations have performed future-oriented studies:
Organisation Country Career-Space
CEPIS
EMCC European Monitoring Centre on Change
IPTS – Fistera
biat - Berufsbildungsinstitut Arbeit und Technik DE
IAMSR/Åbo Akademi FI
Forfás IE
ABBL LU
clc LU
FEDIL LU
Nederland~ICT NL
e-skills UK UK
ITAA US

The supply and demand of e-skills in Europe RAND Europe
96
RAND EUROPE STUDY RAND EUROPE STUDY RAND EUROPE STUDY RAND EUROPE STUDY
ON ‘DEMAND AND SUPPLY FOR EON ‘DEMAND AND SUPPLY FOR EON ‘DEMAND AND SUPPLY FOR EON ‘DEMAND AND SUPPLY FOR E----SKILLS IN EUROPE‘SKILLS IN EUROPE‘SKILLS IN EUROPE‘SKILLS IN EUROPE‘
PRESENTATION AND DISCUSSION OF THE INTERIM REPORTPRESENTATION AND DISCUSSION OF THE INTERIM REPORTPRESENTATION AND DISCUSSION OF THE INTERIM REPORTPRESENTATION AND DISCUSSION OF THE INTERIM REPORT
5 April 20055 April 20055 April 20055 April 2005
List of ParticiList of ParticiList of ParticiList of Participantspantspantspants
LUEDERS, Hugo; CompTIA / Belgium; [email protected]
ORUAAS, Jaan; Estonian Information Technology Society / Estonia; [email protected]
PETERSEN, Willi; BIAT / Germany; [email protected]
HACQUEBARD, Anneke; Hacquebard Informatics and education, the Netherlands; [email protected]
LEFRERE, Paul Microsoft EMEA; [email protected]
VAN BEL, Filip, Cisco Systems EMEA; [email protected]
European Commission / BrusselsEuropean Commission / BrusselsEuropean Commission / BrusselsEuropean Commission / Brussels
RICHIER, André; DG Entr; [email protected]
Eurostat, LuxembourgEurostat, LuxembourgEurostat, LuxembourgEurostat, Luxembourg
SEYBERT, Heidi, Eurostat; [email protected]
Cedefop / ThessalonikiCedefop / ThessalonikiCedefop / ThessalonikiCedefop / Thessaloniki
GRAMLINGER, Franz; [email protected]
NESTLER, Katja; [email protected]
SELLIN, Burkart; [email protected]
RAND Europe RAND Europe RAND Europe RAND Europe
FRINKING, Erik J.; [email protected]
LIGTVOET, Andreas; [email protected]
LUNDIN, Pernilla; [email protected]

RAND Europe Appendices
97
eeee----SKILLS: FACTS, FIGURES AND FOSKILLS: FACTS, FIGURES AND FOSKILLS: FACTS, FIGURES AND FOSKILLS: FACTS, FIGURES AND FORESIGHT SCENARIOSRESIGHT SCENARIOSRESIGHT SCENARIOSRESIGHT SCENARIOS
EXPERTS WORKSHOP / TESSALONIKIEXPERTS WORKSHOP / TESSALONIKIEXPERTS WORKSHOP / TESSALONIKIEXPERTS WORKSHOP / TESSALONIKI
23 23 23 23 ---- 24 June 2005 24 June 2005 24 June 2005 24 June 2005
List of ParticipantsList of ParticipantsList of ParticipantsList of Participants
AMANATIDOU, Effie; ATLANTIS Consulting S.A./Greece; [email protected]
BLUCK, Emma; EMEA Cisco Systems / France; [email protected]
DIXON, Matthew; CEPIS / United Kingdom; [email protected]
GAREIS, Karsten; empirica / Germany; [email protected]
HOOK, Terry; IT. Telecoms Contact Centres / United Kingdom; [email protected]
LUEDERS, Hugo; CompTIA / Belgium; [email protected]
ORUAAS, Jaan; Estonian Information Technology Society / Estonia; [email protected]
PETERSEN, Willi; BIAT / Germany; [email protected]
PFISTERER, Stephan; BITKOM / Germany; [email protected]
REIN, Volker; BIBB / Germany; [email protected]
ROHDE, Gerhard; UNI-Europa / Switzerland; [email protected]
SCHGÖR, Paolo; EUCIP/AICA / Italy; [email protected]
THIEL, Gerald; Dekra Academy / Germany; [email protected]
WEISS, Peter; Institute AIFB / Germany; [email protected]
European CommissiEuropean CommissiEuropean CommissiEuropean Commission / Brusselson / Brusselson / Brusselson / Brussels
LAOPODIS, Vassilios; DG INFSO; [email protected]
LEHOFER, Wolfgang; DG INFSO; [email protected]
RICHIER, André; DG Entr; [email protected]
RAND Europe RAND Europe RAND Europe RAND Europe
FRINKING, Erik J.; [email protected]
LIGTVOET, Andreas; [email protected]
LUNDIN, Pernilla; [email protected]
Cedefop / ThessalonikiCedefop / ThessalonikiCedefop / ThessalonikiCedefop / Thessaloniki
GRAMLINGER, Franz; [email protected]
NESTLER, Katja; [email protected]
SELLIN, Burkart; [email protected]
TESSARING, Manfred; [email protected]
VAN RENS, Johan; [email protected]
ZUKERSTEINOVA, Alena; [email protected]

The supply and demand of e-skills in Europe RAND Europe
98

RAND Europe Appendices
99
Appendix D: Statistical Reliability Limits for EU LFS data EU 25 Aggregates (1)
Year A
1998 89500
1999 89500
2000 93000
2001 86500
2002 86500
2003 90000
2004 92000
(1) For 1998-2003 the EU 25 aggregates ‘A’ limits are computed as the sum of the country ‘A’ limits applicable each year.
Member States A B
Belgium 2500 4500
Czech Republic 1000 -
Denmark (5) 3500 7500
Germany 8000 -
Estonia (4) 5000 10000
Greece 2500 4500
Spain 2500 5000
France (6) 7000 21000
Ireland 2500 4500
Italy 3500 7500
Cyprus 500 1500
Latvia (4) 4500 7500
Lithuania 5000 -
Luxembourg 500 1500
Hungary 2500 4500
Malta 1500 3000
Netherlands (2) 4500 10000
Austria (8) 4000 8000
Poland 5000 20000
Portugal 7500 15000
Slovenia 1000 10500
Slovak Republic 2500 4500
Finland 2500 4500
Sweden (3) 2500 -
United Kingdom 10000 -
(2) Restrictions for wave specific variables: A:10000 & B:20000.
(3) The Limits applicable to 1995-2000 data are: for Sweden, A:9000 & B:- / for EU-15, A:63500 & B:-.

The supply and demand of e-skills in Europe RAND Europe
100
(4) The Limits applicable to 1997-1999 data for Estonia are: A:4000 & B:8000 (1997), A:1500 & B:3000 (1998-1999). The Limits applicable to data prior to 1998-2001 for Latvia are: A:2500 B:4500.
(5) The limits applicable to 1983-1993 data for Denmark are: A:2500 B:4500.
(6) The limits applicable to 1983-2002 data for France are: A:3500 B:8500.
(7) The limits applicable to 1996-2001 data for Switzerland are: A:3000 B:10000.
(8) The limits applicable to 1995-2003 data for Austria are: A:2000 (no B limit).
Figures less than those in column A above, should not be published; By convention, a dot or full stop is used instead. When applicable, figures less than those given in column B but greater than those in column A, should be printed only with a warning concerning their reliability.

101
Appendix E: Defining Professional E-skills by 2000 SOC
The table below illustrates how OECD’s (2004) definition of professional e-skilled occupations by 1990 Census codes was translated into 2000 SOC codes.
1990 Census codes crosswalk to 2000 SOC codes, via 2000 Census codes
1990 Census codes 2000 Census codes 2000 SOC codes
55 030 102 111 140 141 153 290
11-9041 15-1030 15-1081 17-2061 17-2070 17-2199 27-4010
64 011 071 100 101 102 104 106 110 111 140
11-3021 13-1111 15-1011, 15-1051, 15-1099 15-1021 15-1030 15-1041 15-1061 15-1071 15-1081 17-2061
65 070 100 122
13-1081 15-1011, 15-1051, 15-1099 15-2031
213 100 155 286 743
15-1011, 15-1051, 15-1099 17-3020 27-3090 49-9060
229 101 15-1021 233 790 51-4010 304 500 43-1011 308 580 43-9011 309 580
590 43-9011 43-9071
523 290 635 701 702 703 710 711 712 713 742
27-4010 47-2111 49-2011 49-2020 49-2091 49-2094, 49-2095 49-2096 49-2097 49-2098 49-9052
525 701 49-2011 527 741
742 49-9051 49-9052
529 702 742
49-2020 49-9052
683 772 773 775
51-2020 51-2031 51-2090
Source: U.S. Census Bureau, http://www.census.gov/hhes/www/ioindex/crosswalks.html

The supply and demand of e-skills in Europe RAND Europe
102
The table below presents the definition used in this study for ICT practitioner skills by the 2000 Standard Occupation Classification system.
Professional e-skills by 2000 SOC
1 2 3 4 5 6 7 8 9 10 11 12 13 14 15 16 17 18 19 20 21 22 23 24 25 26 27 28 29 30 31 32 33 34 35 36 37 38 39
Occupation 11-3021 Computer and Information Systems Managers 11-9041 Engineering Managers 13-1081 Logisticians 13-1111 Management Analysts 15-1011 Computer and Information Scientists, Research 15-1021 Computer Programmers 15-1030 Computer Software Engineers 15-1041 Computer Support Specialists 15-1051 Computer Systems Analysts 15-1061 Database Administrators 15-1071 Network and computer Systems Administrators 15-1081 Network Systems and Data Communication Analysts 15-1099 Computer Specialists, All Other 15-2031 Operations Research Analysts 17-2061 Computer Hardware Engineers 17-2070 Electrical and Electronics Engineers 17-2199 Engineers, All Other 17-3020 Engineering Technicians, Except Drafters 27-3090 Miscellaneous Media and Communication Workers 27-4010 Broadcast and Sound Engineering Technicians and Radio Operators 43-1011 First-Line Supervisors/Managers of Office and Administrative Support Workers 43-9011 Computer Operators 43-9071 Office Machine Operators, Except Computer 47-2111 Electricians 49-2011 Computer, Automated Teller, and Office Machine Repairers 49-2020 Radio and Telecommunications Equipment Installers and Repairers 49-2091 Avionics Technicians 49-2094 Electrical and Electronics Repairers, Commercial and Industrial Equipment 49-2095 Electrical and Electronics Repairers, Powerhouse, Substation, and Relay 49-2096 Electronic Equipment Installers and Repairers, Motor Vehicles 49-2097 Electronic Home Entertainment Equipment Installers and Repairers 49-2098 Security and Fire Alarm Systems Installers 49-9051 Electrical Power-Line Installers and Repairers 49-9052 Telecommunications Line Installers and Repairers 49-9060 Precision Instrument and Equipment Repairers 51-2020 Electrical, Electronics, and Electromechanical Assemblers 51-2031 Engine and Other Machine Assemblers 51-2090 Miscellaneous Assemblers and Fabricators 51-4010 Computer Control Programmers and Operators

103
Appendix F: E-skilled Employment Data on the EU-level in 2004
Employment of “IT practitioners” (CEPIS 2002) and “ICT practitioners” (OECD 2004) by industry
Sector NACE 72 NACE 74 NACE 75 NACE 65 NACE 64 NACE 80 NACE 51 Total major e-skills sectors Other sectors All Setors
Occupation
ISCO 213 853.00804 118.29326 92.52767 99.47225 93.8187 38.92057 49.27911 1345.3196 537.74561 1883.06521
ISCO312 450.13086 71.29093 94.08615 50.22655 50.58561 54.93757 43.70306 814.96073 468.57201 1283.53274
Total e-skilled employment 1303.1389 189.58419 186.61382 149.6988 144.40431 93.85814 92.98217 2160.28033 1006.31762 3166.59795
Other employment 1122.32507 12322.044 13799.6855 2538.56978 3088.03433 11248.0483 5117.47476 49236.18173 125686.9854 189425.789Total employment 2425.46397 12511.6281 13986.2993 2688.26858 3232.43864 11341.9065 5210.45693 51396.46206 126693.303 192592.387
Sector NACE 72 NACE 45 NACE 74 NACE 64 NACE 52 NACE 75 NACE 40 Total major e-skills sectors Other sectors All Sectors
Occupation
ISCO 213 853.00804 19.46592 118.29326 93.8187 34.68078 92.52767 18.03324 1229.82761 653.2376 1883.06521
ISCO 312 450.13086 16.06664 71.29093 50.58561 43.15676 94.08615 16.48495 741.8019 541.73084 1283.53274
ISCO 313 4.81412 2.16178 132.59129 27.77271 15.20392 12.27408 0.1159 194.9338 314.66493 509.59873
ISCO 724 52.88097 347.9442 42.51267 169.80195 180.61791 52.48042 187.84628 1034.0844 1164.67596 2198.76036
Total e-skilled employment 1360.83399 385.63854 364.68815 341.97897 273.65937 251.36832 222.48037 3200.64771 2674.30933 5874.95704
Other employment 1064.62998 14506.8845 12146.94 2890.45967 17271.0591 13734.931 1083.53239 62698.43662 124018.9937 186717.43Total employment 2425.46397 14892.523 12511.6281 3232.43864 17544.7185 13986.2993 1306.01276 65899.08433 126693.303 192592.387


105
Appendix G: National e-skilled employment
The figures in this appendix show the trends in e-skilled employment by country between 1998 and 2004. The Member States are divided into two groups defined by the number of people employed in “ICT-specialists” occupations. Countries with more than 150 000 people employed in “ICT practitioners” occupation belong to the first group and countries with less than that to the second group. The division is made due to layout purposes.
National employment of “ICT practitioners”, Group 1
0
200
400
600
800
1000
1200
1998 1999 2000 2001 2002 2003 2004
Year
France Germany Italy Netherlands Spain Sweden UK Poland Czech Republic
Source: EU LFS Q2 for1998-2004
Note: The numbers are statistically reliable according to the Eurostat’s limits applicable for each country, see Appendix D. The figures for the Netherlands in 2004 are provisional.

The supply and demand of e-skills in Europe RAND Europe
106
National employment of “ICT practitioners”, Group 2
0
50
100
150
1998 1999 2000 2001 2002 2003 2004
Year
Nu
mb
er
of
em
plo
yed
(in
th
ou
san
ds)
Cyprus
Estonia
Hungary
Latvia
Lithuania
Malta
Slovakia
Slovenia
Austria
Belgium
Denmark
Finland
Greece
Ireland
Luxemburg
Portugal
Source: EU LFS Q2 for1998-2004 Note: The numbers are statistically reliable according to the Eurostat’s limits applicable for each country, see Appendix D.
National employment of “IT practitioners”, Group 1
0
200
400
600
800
1998 1999 2000 2001 2002 2003 2004
Year
Nu
mb
er
of
em
plo
yed
(in
th
ou
san
ds)
France
Germany
Italy
Netherlands
Spain
Sw eden
UK
Poland
Czech Republic
Source: EU LFS Q2 for1998-2004 Note: The numbers are statistically reliable according to the Eurostat’s limits applicable for each country, see Appendix D. The figures for the Netherlands in 2004 are provisional.

RAND Europe Appendices
107
National employment of “IT practitioners”, Group 2
0
20
40
60
80
100
1998 1999 2000 2001 2002 2003 2004 Year
Cyprus Estonia Hungary Latvia Lithuania Malta Slovakia Slovenia Austria Belgium Denmark Finland Greece Ireland Luxemburg Portugal
Source: EU LFS Q2 for1998-2004
Note: Most numbers are statistically reliable according to the Eurostat’s limits applicable for each country, see Appendix D. The figures for Estonia in 1998,1999, 2002 and 2003, Latvia in 1998, 1999 and 2001 and Slovenia in 1998-2001, should be interpreted with caution.

108
Appendix H: Overview of country specific data sources
Data by Member State
Country Data Source Year Usefulness Remarks
Austria “IKT-Einsatz in Haushaluten” Statistic Austria 2003 Does not contain relevant data, focuses on basic user skills
-
Belgium “ICT-bevraging 2003-2004 “ Ministry of the Flemish Community Education Department – Information and communication technology in Education
2005 Does not contain relevant data, focuses on ICT-skills in schools.
The national statistical office has informed us that they have not done any work in the domain of ICT practitioner skills.
Cyprus No information - - - - Czech Republic “Závěrečná zpráva o pokroku
eEurope+2003 – únor 2004” “Information Society Statistics”
Czech Statistical Office Czech Statistical Office
2004 2003
Does not contain relevant data, focuses on usage and diffusion of ICT, not on skills. Does not contain any statistical data, gives an overview of what IS statistics is collected by the national statistical office.
The data used in this report has been sent to us in raw form from the statistical office. Ministry of informatics is conducting research of e-skills in the Czech Republic. The new report, considering the research and development of e-skills in the last year, will be available in April.
Denmark “Information Society Denmark – Status 2004”
Ministry of Science, Technology and Innovation together with Statistics Denmark
2004 Useful -

RAND Europe Appendices
109
cont. Data by Member State
Country Data Source Year Usefulness Remarks
Estonia “The survey on ICT in enterprises” Dataset - Computer science admittance in higher education Dataset – Computing graduates in higher education
Statistical Office of Estonia Statistical Office of Estonia Statistical Office of Estonia
2003 1994-2004 1994-2004
Does not contain relevant data, focuses on usage and diffusion. Useful Useful
Sources indicate that not much have been done in the domain lately. A report from political research centre PRAXIS on IT high and vocational education situation will be published in April.
Finland “Tekniikan Alan Korkeakoulutuksen Kehitysnäkymät” “Teknillistieteellisen koulutuksen mahdollinen laajentaminen Keksi-Suomessa ja Pohjois-Savossa”
Ministry of Education Ministry of Education
2002 2004
Does not contain any statistical data, focuses on how to develop IT education system. Information only available in Finish.
The national statistical office collects data on basic ICT skills and user-skills in enterprises in line with Eurostat model survey by the IS unit.
France No info - - - - Germany “IKT in Deutschland, Informations-
und Kommunikationstechnologien 1995- 2003” “Bestand sowie Bedarf und Angebot an IT-Fachkräften” “Daten zur Informations-gesellschaft 2005”
Federal Statistical Office Germany Biat and BIBB BITKOM
2004 2001 2005
Useful Does not reflect current status, data to old. Useful
The statistical office does only collect education data and no data on ICT professions due to lack of a generally accepted definition in terms of statistics for the latter.
Greece No info - - - The National Statistical Service of Greece referred to Eurostat
Hungary No info - - - - Ireland “Information Society Statisitcs –
Ireland 2004” “The 4th report of the Expert Group of Future Skills Needs”
Central Statistics Office Expert Group on Future Skills Needs, Forfás
2004 2003
Does not contain relevant information, focuses on usage and ICT industry contribution. To the point in terms of domain, however, does not reflect current situation but presents forecast estimates.
-

The supply and demand of e-skills in Europe RAND Europe
110
cont. Data by Member State
Country Data Source Year Usefulness Remarks
Italy “ICT un mondo di competenze ” An@sin and Federcomin 2003 Information only available in Italian - Latvia “What kind of ICT Education do we
need?” “Information and communication technology – Country profile Latvia” “The Baltics as a Business Location for Information Technology and Electronics Industries” “Competencies Potential in the ICT Sector of Latvia”
Riga Information Technology Institute, published in Baltic IT&T review #34 ITC VTT Technology Studies Latvian Information Technology and Telecommunication Association - LITTA
2004 2003 2002 2004
Useful Useful Does not reflect current situation, data too old. Useful
-
Lithuania No info - - - - Luxembourg “Les qualifications de demain dans
les domaine des technologies de l’information et de la communication”
clc, ABBL and Fedil 2004 Useful -
Malta No info - - - - Netherlands “ICT Marktmonitor 2002-2003” Nederland-ICT 2003 Useful - Poland No info - - - - Portugal Report on Portuguese ICT
professional profiles Instituto para a Qualidade na Formação
Information only available in Portuguese
-
Slovakia Dataset – ICT in Enterprises Dataset – ICT in Households
Statistical Office of Slovakia Statistical Office of Slovakia
2002-2003 2002-2003
Does not contain relevant data, focuses on usage and diffusion Does not contain relevant data, focuses on usage and diffusion
-
Slovenia No info - - - -

RAND Europe Appendices
111
cont. Data by Member State
Country Data Source Year Usefulness Remarks
Spain “Propuesta de Acciones para la Formacion de Profesionales de Electronica, Informatica y Telecomunicaciones para las empresas del Sector” PAFET 1 “Evolución de los perfiles tic en la sociedad del conocimiento” PAFET 2 “Nuevos perfiles profesionales TIC en los sectors usuarios” PAFET 3
2001 2002 2004
Does not reflect current situation, data too old. Does not reflect current situation, data too old. Focuses on the content of the work of ICT professionals and not demand /supply aspects.
-
Sweden “Arbetskraftsbarometer 2004” “IKT Utbildning efter bubblan – tillgång, tillskott, efterfrågan och behov”
Statistics Sweden National Agency for Higher Education
2004 2004
Useful Useful
-
UK “National Employers Skills Survey 2003: Key Findings” “IT Insights: Employment Forecasts” “IT Insight: Employer Skills Needs” “IT Insight: Trends an UK skills Implications”
Learning and Skills Council e-skills UK e-skills UK e-skills UK
2003 2004 2004 2004
Does not contain relevant data, has a too general approach Does not reflect current situation, forecast oriented Useful Does not reflect current situation, forecast oriented
-
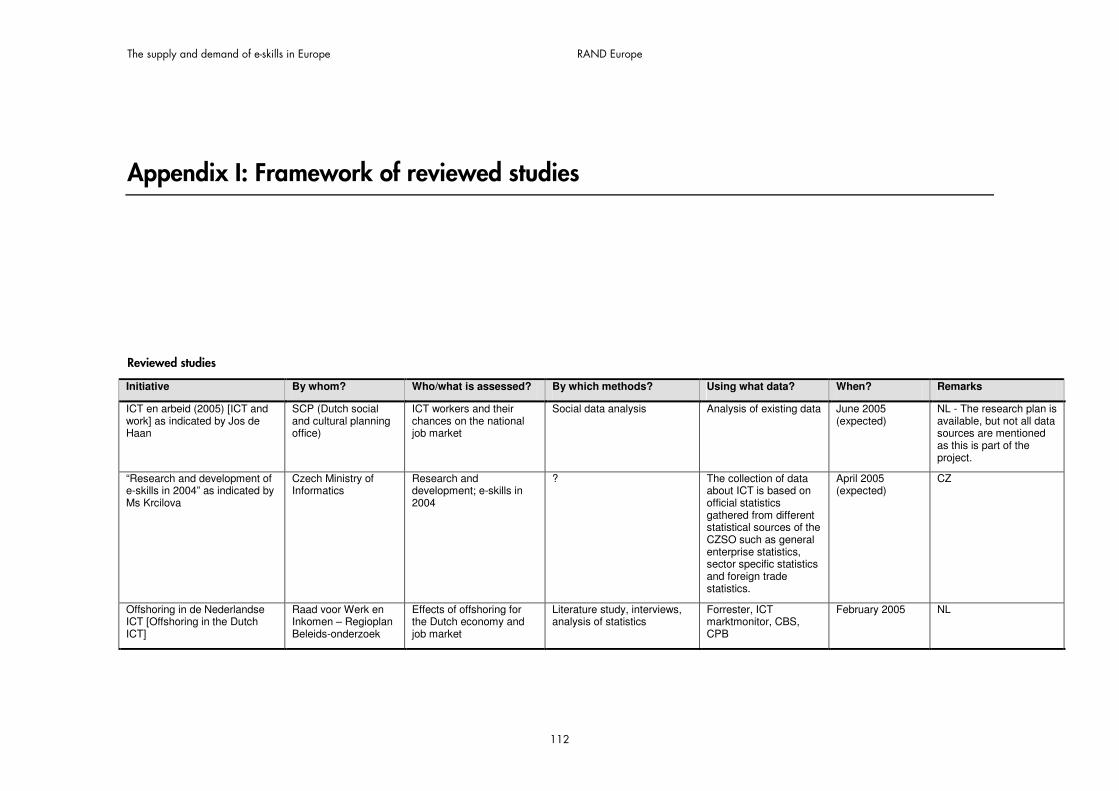
The supply and demand of e-skills in Europe RAND Europe
112
Appendix I: Framework of reviewed studies
Reviewed studies
Initiative By whom? Who/what is assessed? By which methods? Using what data? When? Remarks
ICT en arbeid (2005) [ICT and work] as indicated by Jos de Haan
SCP (Dutch social and cultural planning office)
ICT workers and their chances on the national job market
Social data analysis Analysis of existing data June 2005 (expected)
NL - The research plan is available, but not all data sources are mentioned as this is part of the project.
“Research and development of e-skills in 2004” as indicated by Ms Krcilova
Czech Ministry of Informatics
Research and development; e-skills in 2004
? The collection of data about ICT is based on official statistics gathered from different statistical sources of the CZSO such as general enterprise statistics, sector specific statistics and foreign trade statistics.
April 2005 (expected)
CZ
Offshoring in de Nederlandse ICT [Offshoring in the Dutch ICT]
Raad voor Werk en Inkomen – Regioplan Beleids-onderzoek
Effects of offshoring for the Dutch economy and job market
Literature study, interviews, analysis of statistics
Forrester, ICT marktmonitor, CBS, CPB
February 2005 NL

RAND Europe Appendices
113
cont. Reviewed studies
Initiative By whom? Who/what is assessed? By which methods? Using what data? When? Remarks
Daten zur Informations-gesellschaft 2005
BITKOM Range of IT indicators including number of first-year students and employees in ICT sector
Analysis of statistics EITO, Eurostat and Statistisches Bundesamt (Destatis) as well as other sources
2005
Samenvatting Marktmonitor 2004-2005 [Summary of the Marktmonitor]
ICT Office Number of statistics concerning IT including number of ICT professionals
Survey Survey 2005 NL
IT Insights: employment forecasts (2004)
E-skills UK / Experian IT industry employment, ICT professional employment forecasts
Analysis of several UK sources and modelling/forecasting on the basis of this data
National employers skills survey 2003, UK labour force survey, Annual Business Inquiry
November 2004 UK - Extensive research activity in UK consisting of 4 reports; this one is most relevant for supply/demand, others for future focus.
IKT in Deutschland 1995-2003 [ICT in Germany] – chapter 3
Statistisches Bundesamt
Students in ICT subjects
Foreign ICT workers
ICT patents
ICT expenditure for education
Analysis of Destatis data Eurostat and German statistical data
September 2004 DE
International comparison of occupational profiles in the eEconomy
STILE – Bollen, Huys & Ramioul
Practices of coding occupation in several European countries - assessment
Coding exercise n/a July 2004 Methodological research
FISTERA - The human resource factor in the information society future (2004)
Systems Research/Sami Mahroum
IT skill shortage, Employer satisfaction with ICT skills, Origin of S&T immigrants, Offshore attractiveness
Literature review IDC 2002, Booz Allen Hamilton, European report on S&T indicators 2003, AT Kearney offshore attractiveness index 2004, OEDC, Eurostat
April 2004 Generally a summary of existing data

The supply and demand of e-skills in Europe RAND Europe
114
cont. Reviewed studies
Initiative By whom? Who/what is assessed? By which methods? Using what data? When? Remarks
Nuevos perfiles profesionales TIC en los sectores usuarios (2004) [New professional ICT profiles in the industrial sectors]
PAFET 3
AETIC Identification of professional ICT qualifications needed in the industrial sector as well as training needs
Survey among 646 ICT professionals and companies, 8 interviews with ICT professionals and panel discussion.
Own data with several other sources
March 2004 ES - This report is mainly focused on the content of the work of ICT professionals and not demand /supply aspects
Profiling occupations in the eEconomy
STILE – Bollen & Ramioul (eds.)
Practices of coding occupation in several European countries – project description
Coding exercise n/a February 2004 Methodological research
OECD – ICT skills and employment (2004)
OECD ICT-skilled employment, per sector (ICT professionals narrow definition ISCO 213, 312, 313 and 724).
Measuring shortages: education (ICT equipment in schools), training, vocational training.
Outsourcing and foreign workers. Recruitment via internet.
Analysis of Eurostat and other data.
Eurostat LFS 2003, ISCO-88 and NACE (and sources for non-EU OECD countries).
2004 Overview of data available on ICT-skilled employment, based primarily on Eurostat LFS data and other non-OECD sources.
Les qualifications de demain [The qualitifications of tomorrow]
FEDIL – ABBL - CLC Growth of employment per sector
Outsourcing
Number of ICT professionals per company per sector
Required staff by function, education
Interviews with 265 enterprises on their future expectations for 2-3 years
Chambre de Commerce data
2004 LU – needs projections are approx 1/3 of the numbers from 2001

RAND Europe Appendices
115
cont. Reviewed studies
Initiative By whom? Who/what is assessed? By which methods? Using what data? When? Remarks
Measuring the pulse of the IT industry (2004)
CompTIA IT training market Senior management survey of 200 organisations in 46 countries
Survey 2004 Training providers predict steady market growth in 2004; most important topics are: security, project management and soft skills/business skills
Adding value…growing careers (2004)
ITAA IT employment and skills gap in USA
Survey among 500 IT managers of companies representative for the USA economy based on size, location, IT/non-IT company
ITAA survey 2004 2004 USA - Although the representativeness of the 500 informants is questionable, this exercise is consistently held over 7 years. NWCET job categories.
Towards a comprehensive European e-skills reference framework: ICT and e-business skills and training in Europe (2004)
Cedefop / Flensburg and York universities
Industry’s ICT skills needs, Computer professionals and Associates (ISCO 213 and 312), comprehensive European skills framework, European framework of ICT qualifications, ICT curriculum development, policy recommendations
Analysis of data and comparison of different skills frameworks (SFIA, ISCO-88, Career Space and GAHFA)
With focus on three industries: automotive, banking and graphic arts
Biat 2001, EUQuaSIT 2002, CEPIS 2002
2004 Supply and demand are not main focus, but a reason for addressing the differences in skills frameworks.
What kind of ICT education do we need? (Baltic IT&T Review)
Riga Information Technology Institute – Juris Borzovs
Number of ICT students enrolled and graduated
ICT professional standards
Analysis of existing data with national statistics?
National statistics? 2004 LT - NeDap

The supply and demand of e-skills in Europe RAND Europe
116
cont. Reviewed studies
Initiative By whom? Who/what is assessed? By which methods? Using what data? When? Remarks
National Employers Skills Survey 2003: Key Findings
Learning and Skills Council - Institute for Employment Research and
IFF Research Ltd
Hard-to-fill vacancies and skill-shortage vacancies in the UK for all sectors
Survey Own data 2003-2004 UK - Computing sector has significantly less HtFV and SSV than other sectors
ICT practitioner skills and training solutions at sub-degree vocational level in Europe
Cedefop/biat - A. Willi Petersen and Carsten Wehmeyer
Qualitative and quantitative approach to skills needs
Analysis of existing data with additional questionnaires
CEPIS, EUQuasIT, biat 2001
July 2003 EU – though based on Germany, Netherlands and Portugal
Education and training for the Information Technology Workforce (2003)
US Department of Commerce
Identification of employers’ needs, the IT education and training landscape, and the role of IT employers and workers to meet the skills needs
Analysis of data US Dept of Commerce, US Dept of Labor, Bureau of Labor Statistics
June 2003 USA
Information Technology (IT) Employment: What is it? (2003)
WANE (Workforce Ageing in the New Economy)
Analysis of different classification schemes, with focus on IT industry (NAIC 54151) and highly skilled IT workers
Comparison of classifications NACE, SIC, ISIC, NAICS
(Appendix B8)
ISCO, SOC90, SOC2000, ANSIC, NSOCS, NOC
SFIA
n/a 2003 CA – National Occupation Code has two advantages:
1)focus on high-skilled ICT professionals
2) possible use for international benchmarks
Determining the future demand for ICT skills in Europe – workshop proceedings (2003)
CEPIS Provides an overview of different eSkills issues, initiatives etc.
Analysis of data, literature review and overview of initiatives
CEPIS 2002 and other data
2003 Stucky: different initiatives for different skill levels
Dixon: Longitudinal LFS is very useful combined with forecasting

RAND Europe Appendices
117
cont. Reviewed studies
Initiative By whom? Who/what is assessed? By which methods? Using what data? When? Remarks
2003 Workforce Survey (2003) ITAA IT employment and skills gap in USA
Survey among 500 IT managers of companies representative for the USA economy based on size, location, IT/non-IT company
ITAA survey 2003 2003 USA - Although the representativeness of the 500 informants is questionable, this exercise is consistently held over 7 years. NWCET job categories.
Evolución de los perfiles tic en la sociedad del conocimiento (2002) [Evolution of ICT profiles in the knowledge society] PAFET 2
AETIC Qualitative assessment of changes in ICT profiles and future requirements
Interviews? ? 2002 ES
Competenties van werknemers in de Informatiemaatschappij (2002) [Competencies of employees in the Information Society]
Amsterdam Institute for Advanced labour Studies
Qualitative assessments of employees of their ICT use and skills
Computer-mediated questionnaire of 2000 households in NL
Own data June 2002 NL - Content knowledge and social skills are more important
ICT skills and employment (2002) STI working paper
OECD/Vladimir Lopez-Bassols
Employment growth in knowledge workers, Employment in IT-related occupations, IT-workers as percentage of total, IT-worker gap, tertiary education, IT degrees and gender, IT certifications, foreign workers, attracting IT workers
Analysis of different sources of ICT statistics and policy reports
US BLS, Occupational Employment Statistics, LFS, EITO 2001, ITAA 2001
July 2002 Analysis and overview of ICT skills related reports and statistics.
Digital Transformation – a framework for ICT literacy (2002)
Educational Testing Service
Framework for ICT literacy, digital divide, ICT literacy measurements
Theoretical approach to measuring ICT literacy and policy recommendations for doing so
n/a May 2002 Conceptual piece, not specifically focused at professional skills.

The supply and demand of e-skills in Europe RAND Europe
118
cont. Reviewed studies
Initiative By whom? Who/what is assessed? By which methods? Using what data? When? Remarks
Information Technology Practitioner Skills in Europe (2002)
CEPIS/Dixon IT Practitioners (ISCO-88 213 and 312).
Other data dependent on national information: e.g. remuneration, immigrants, large companies, education level, migration.
Analysis of Eurostat and other data.
Special focus on Germany, Ireland, Sweden and UK.
Eurostat LFS 2001 and a number of reports from the 4 countries mentioned.
May 2002 General overview of LFS data in EU-15 and specific summary of research in 4 countries said to be representative for EU-15.
Addressing the ICT skills shortage in Europe (2002)
Intel e-business group IT workers skills gap Review of literature EITO 2002 and other references
November 2002 Summary of other work and position of Intel.

119
Appendix J: Future-oriented studies on demand and/or supply of e-skills
Author Future Horizon
Focus44
Skills45
Indicators46
Identified stakeholders47
Objectives48
Political support
49
Timing50
Professional involvement
51
Techniques used
52
Outputs53
Evaluation54
ABBL, clc, Fedil 2004
2004-2007? Employment, recruitment, outsourcing IT tasks
Different types of ICT professionals + education level
Types of jobs created and replaced in 9 professions and sub-professions
Enterprises Guide youngsters towards a study choice
Clarify needs of enterprises toward government and professionals
Supported by ministry of Education and EU
- Interviewees Survey Report of number of ICT jobs foreseen, dissemination probably through networks that commissioned the study
Small survey
44 1) Focus on demand, supply, both?; 2) Focus on specific issues e.g. gender distribution, offshoring, and the like?; 3) Assessed mismatches, shortages, gaps in e-skills?; 4) Made distinction across sectors, countries? 45 1) Which skills?: I(C)Tskills; e-business skills; 2) What was measured?: future occupational requirements; overall requirements; 3) What level was assessed?: advanced, professional, basic 46 Which indicators were used?: stock of employment, qualitative assessment of needs job vacancies, etc. 47 1) What expertise have the stakeholders involved?; 2) What is the level of participation?; 3) What is the division of different stakeholders?; 4) Are stakeholders involved in implementing results? 48 1) What is the mission statement for the foresight team and the outside world?; 2) What is the connection of objectives with policy action?; 3) What are the measurable objectives? 49 1) What is the level of support from politicians/key civil servants before project started? 2) What is the level of support from politicians/key civil servants during the project 50 Is a timetable used for decisions to be taken?; 2) Is there a regularly delivery of outputs? 51 What range of skills involved? eg. project management; area experts; foresight specialists 52 What kind of data collection was used: large, small-scale surveys, interviews 53 1) What are the outputs?; 2) What are the consequences (use and impact) of implementing the outputs?; 3) What is the dissemination strategy - targeted to different stakeholders? 54 1) What is the scientific quality of the foresight process?; 2) What are the effects on structures networks among stakeholders; 3) What is the quality and quantity of outputs

The supply and demand of e-skills in Europe RAND Europe
120
Author Future Horizon
Focus44
Skills45
Indicators46
Identified stakeholders47
Objectives48
Political support
49
Timing50
Professional involvement
51
Techniques used
52
Outputs53
Evaluation54
Biat/Cedefop 2003
2010 Employment, supply & demand, training profiles, VET
Different skills classifications at various educational levels
# of IT practitioners at different levels, # of IT students at different levels
Not specifically – SMEs and employers of sub-degree IT specialists
Analysing industry’s needs of ICT skills and practitioners at sub-degree levels in the ICT and user sectors
EU-funded – no specific political support
Study builds on previous work, but no continuity guaranteed
Social scientists?
Literature review, secondary analysis, questionnaires and case studies
Report Very detailed study on the subject of sub-degree level IT specialists, but based on limited number of countries
Career-Space 2001
2000-2004 Demand Western Europe, occupations and industries ICT sub-industries vs. rest of economy
ICT skills Occupational requirements Professional (generic skills profiles mapped on SOC)
Stock of employment
- Develop a methodology, which would lead to a better quantification of the resources required by the industry in Europe. If the future required resources can be better monitored then the possibility to implement adequate policy measures to hinder shortage of ICT skilled personnel
- No timetable and no regularly delivery of outputs
Area and foresight experts
Secondary data collection from OECD 1997 on employment by sector. Employment growth rate projections from ERECOs E3ME model.
Employment in ICT skilled occupations in 2000 and annual growth rate of employment in ICT skilled occupations till 2004
Combining forecasts of employment by sector with an extrapolation of the trends towards increasing share of ICT skills within those employment totals.

RAND Europe Appendices
121
Author Future Horizon
Focus44
Skills45
Indicators46
Identified stakeholders47
Objectives48
Political support
49
Timing50
Professional involvement
51
Techniques used
52
Outputs53
Evaluation54
CEPIS 2002 2000-2005 Demand
Discussion of skills shortage methods
EU 15, Germany, Ireland, Sweden and UK
IT skills Occupational requirements Professional ISCO 213 and 312
Stock of employment
No stakeholder involvement
Improve validity of estimates and forecast in relations to previous studies.
Provide factual basis on which plans can be developed to strengthen education and training of It professionals
Support from CEPIS which is a stakeholder group before and during the project
No timetable and no regularly delivery of outputs
Area expert EU LFS data Forecasted annual new demand and the growth trend of the stock of employment. Initially there is a decline in demand followed by steady growth.
Scenarios
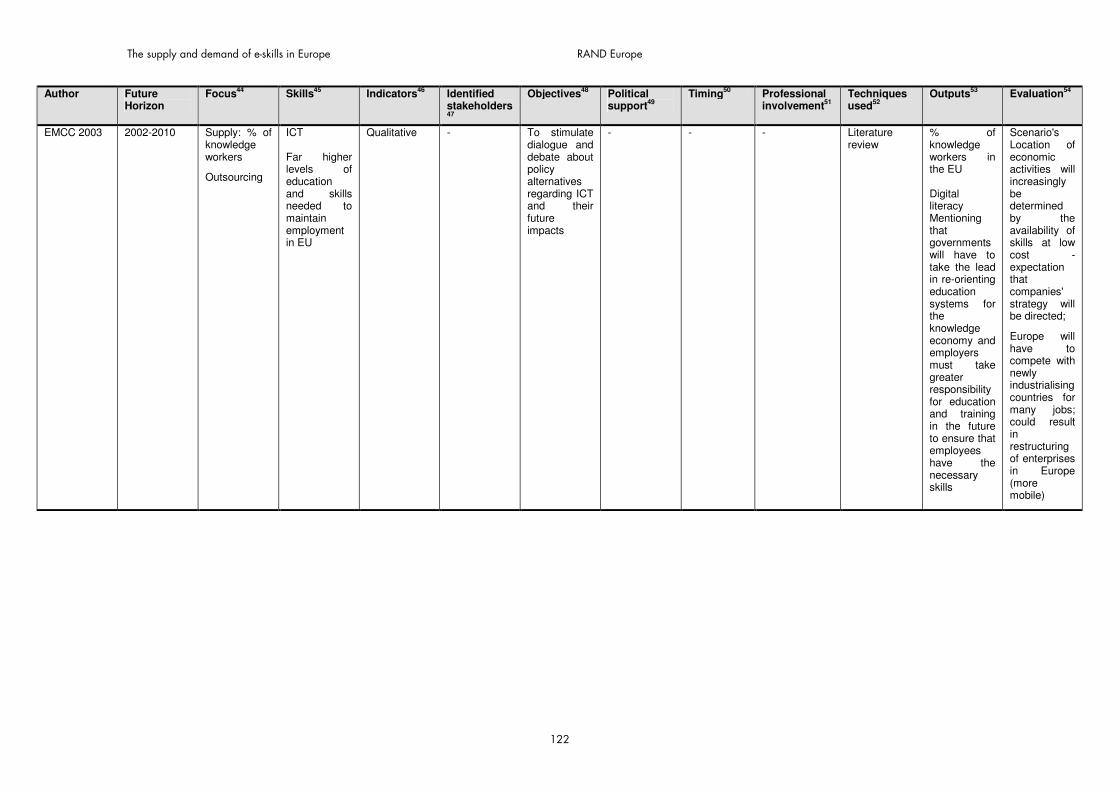
The supply and demand of e-skills in Europe RAND Europe
122
Author Future Horizon
Focus44
Skills45
Indicators46
Identified stakeholders47
Objectives48
Political support
49
Timing50
Professional involvement
51
Techniques used
52
Outputs53
Evaluation54
EMCC 2003 2002-2010 Supply: % of knowledge workers
Outsourcing
ICT Far higher levels of education and skills needed to maintain employment in EU
Qualitative - To stimulate dialogue and debate about policy alternatives regarding ICT and their future impacts
- - - Literature review
% of knowledge workers in the EU Digital literacy Mentioning that governments will have to take the lead in re-orienting education systems for the knowledge economy and employers must take greater responsibility for education and training in the future to ensure that employees have the necessary skills
Scenario's Location of economic activities will increasingly be determined by the availability of skills at low cost - expectation that companies' strategy will be directed;
Europe will have to compete with newly industrialising countries for many jobs; could result in restructuring of enterprises in Europe (more mobile)

RAND Europe Appendices
123
Author Future Horizon
Focus44
Skills45
Indicators46
Identified stakeholders47
Objectives48
Political support
49
Timing50
Professional involvement
51
Techniques used
52
Outputs53
Evaluation54
EMCC 2003 2002-2013 Supply and demand
Migration of jobs from EU to developing countries
Other jobs that emerged to fill the gaps that were created in the European labour market - less skilled than the jobs lost
E-business skills - well qualified English speaking graduates; MBA's
Qualitative - Exploring the driving forces likely to shape development in the financial services sector
- - - Literature review
Policymakers might be advised to monitor drivers (FSAP, USbased large scale mergers in the financial services sector, digital currencies and global eBanking), to consider ways in which they could be avoided and to prepare contingency plans in case they occur
Scenario's
It is not possible to predict the path things will take with any certainty
e-skills UK 2004
2003-2014 Demand Distinctions made across industry, occupations and regions
IT Skills Occupational requirements IT industry employment (4-digit SIC), IT occupational employment (4-digit SOC) (professional) and IT user skills
Stock of employment And share of employed required to have specific skill
Regional and sector expertise Inspect and comment forecasts, scenario selection, survey.
The foresight is one of a suite of publications that underpins the development of a coherent strategy for IT-skills for the UK. The forecasts form part of evidence base for trends and UK skills implications
Government licenses the remit of e-skills UK as the Sector skills Council for IT, Telecoms and Contact Centres
No timetable and no regularly delivery of outputs
Foresight specialists from Experian Business Strategies, area experts, project managers
Secondary data collection from Annual Business Inquiry, LFS Northern Ireland, UK LFS and 2001 census data, National Employers skills Survey 2003.
Total gross jobs in IT industry and IT occupations and the growth trend for these stocks of employment (2003-2014) and share of employed required by employer to have a certain degree of IT user skills (2003-2006)
Relationships between key macroeconomic variables, SIC/SOC matrix and scenarios

The supply and demand of e-skills in Europe RAND Europe
124
Author Future Horizon
Focus44
Skills45
Indicators46
Identified stakeholders47
Objectives48
Political support
49
Timing50
Professional involvement
51
Techniques used
52
Outputs53
Evaluation54
EUQuaSIT 2004
2010 Work and employment; education and training
Vocational and higher education, continued training
IT and CT skills
Workforce based on an adaptation of ISCO-88, Students based on ISCED-97
Regional and sector expertise
Contributing to more transparency of ICT employment and qualifications
in Europe, both quantitatively (statistical data) and qualitatively
No direct political support (EU-project)
3.5 year study not specifically targeted to policy timetable
Researchers from 5 investigated countries, ICT training professionals surveyed, companies surveyed
Survey, review of skills frameworks, analysis of national labour force data and LFS and OECD
Reports, database, suggested framework of skills
Broad quantitative and qualitative study
Fistera 2004 - Demand, supply, shortages, life long learning, immigration, ageing workforce, outsourcing
ICT skills in general, nothing measured
AT Kearney offshore attractiveness, % foreigners in tertiary education, non-native S&T employees, BAH satisfaction with ICT skills, IDC IT skill shortage
Workshop stakeholders unknown
Provide overview – inform policy makers?
- - - Report review Report Workshop outcomes are unknown
Overview study, no analysis of scientific validity
Forfás 2003 2003-2010 Supply and demand Skill gaps (skills shortage) analysis Ireland and four different categories of graduates
ICT skills Occupational requirements Professional
Demand: Stock of employment Supply: Numbers of graduates
Interviews Industrial development agencies, companies and academia
Study the skills needs for the ICT sector up to 2010 The study shall inform policy decisions in the field of skills and education
The Expert Group work in commission from the Minister for Enterprise, Trade and Employment and the Minister for Education and Science
No timetable and no regularly delivery of outputs
McIver consulting and PA Consulting carried out the foresight exercise
- Figures on demand and supply, as well as the balance between the two, (skills gap). Supply and demand relatively well balanced up to 2006, thereafter demand overtakes supply
Investigation of relationship between economic conditions and the ICT sector employment growth. Interviews, literature review and scenarios.

RAND Europe Appendices
125
Author Future Horizon
Focus44
Skills45
Indicators46
Identified stakeholders47
Objectives48
Political support
49
Timing50
Professional involvement
51
Techniques used
52
Outputs53
Evaluation54
ITAA 2004 2004-2007? Employment size, IT workforce supply, background requirements, retention, growth areas, background for employment
7 different types of IT employees – technical and soft skills
Opinions of 500 HR managers in USA
Enterprise HR managers – stratified sample of small, medium, large enterprises
To monitor, assess and communicate market conditions for IT employers and employees
- No policy linked Annual survey
Interviewees Survey Annual report Limited set of surveys but regular (annual)measurement provides valuable trend evidence
Nederland - ICT 2003
2002-2003 supply and demand
Outsourcing was measured
Netherlands
ICT Education/detachment activity, consultancy professional – tertiary education
Stock of employment (1997-2003) Job vacancies (1997-2003) Job increase
FENIT members Survey
Insight in recent developments and future direction
Prevent future lack of ICT people
- Since 1997 a Marktmonitor is published
- Survey EITO (2002) data CPB prognosis economic growth
Supply and demand of eskills Insight in developments and future direction of supply and demand of eskills in the Netherlands
Economic growth approach
TIDE 2002 2010? Shortages, employment, demand – skills required in Finland in the future
Skills in general; Future occupational requirements for all levels
Number of employees; qualitative indicators
Businesses as interviewees
Anticipating knowledge and skills needs
Define the ICT industry and concepts
Proposed and financed by ministry of Education + organisations in the sector
- - Survey, Delphi, scenarios
Reports – impact unknown
Limited set of respondents but may have brought different stakeholders together – in Finnish
Vries 2003 Not specified Demand
ICT skills Overall requirements
Qualitative assessment of needs
- Provide a future view from the industry on ICT skills requirements
- There is a list of actions needed from the industry
Industry expert Description of market and technology trends, data sources are not reported.
View on ICT skills needed to anticipate the future, such as a skill set combining creative, technical and commercial skills.
10 Base the qualitative forecasts on reference scenarios driven by technology waves and market growth

The supply and demand of e-skills in Europe RAND Europe
126
Author Future Horizon
Focus44
Skills45
Indicators46
Identified stakeholders47
Objectives48
Political support
49
Timing50
Professional involvement
51
Techniques used
52
Outputs53
Evaluation54
Åbo 2001 2000-2010 Employment – 3 sectors ICT manufacture, services, telecoms – FI, NL, FR, ES as exemplars for European countries
No skills specified
Overall employment
No stakeholders
Explain ICT sector employment based on econometric model
- - Econometricians
National-level indicators for 4 countries which are extrapolated to rest of EU-15
2000-2010 employment predictions for 4 countries + EU not connected to policy dissemination unknown
Rigorous econometrics, no stakeholder involvement

RAND Europe Appendices
127
Appendix K: Terms of reference
The Contractor shall study the supply and demand for e-skills in the 25 Member States of the European Union. Because of the nature of the tasks and of the domain which is related to new information and communication technologies, the working language for this operation will be English.
The tasks to be performed by the Contractor are the following:
- To collect the most recent information and statistical data available concerning ICT and e-business
skills in the European Union and to interview the main stakeholders (ICT companies, associations and
trade unions) and public policy makers, notably members of the European eSkills Forum;
- To analyse these materials in order to provide an overview of the situation in 2004 relating to the
supply and demand of e-skills in the European Union.
- To deliver to the Commission an interim report presenting this overview no later than three months
after the signature of the contract;
- To undertake an in-depth analysis and assessment of the situation in 2004 relating to the supply and
demand of e-skills in the European Union;
- To identify and document existing forecasting activities and foresight scenarios actions in the
Member States as well as existing network of experts in this domain at the international level;
- To propose a common definition and methodological framework for the measurement and the
forecast of the demand and supply for e-skills in the European Union;
- To make proposals for the improvement of existing statistical data collection, including
recommendations relating the future possible activities of EUROSTAT and the OECD and other
international organisations in this field;
- To propose five main indicators for the monitoring of supply and demand of e-skills in the European
Union;
- To make concrete proposals for the setting-up of foresights scenarios mechanisms at the European
level, based on similar existing approaches in the Member States (notably in Finland for example),
together with the establishment of a European network of experts;
- To deliver to the Commission a final report shall present a detailed analysis of the situation in 2004
relating to the supply and the demand of e-skills in Europe and present concrete proposals for the setting-
up of foresights scenarios mechanisms at the European level and the establishment of a European network
of experts. It is also requested to include a short business plan indicating how such a network could be
both scalable and sustainable.