Embed Size (px)
Citation preview

1
Analyst Presentation
TUBACEX Analyst Presentation

2
Analyst Presentation
1 2 3 4
Strategic Plan 2013 – 2017
Table of Contents
Goals achieved in 2013
Tubacex Group
Growth Strategy
3
Analyst Presentation
Tubacex Group
Tubacex Group is an industrial group specializad in the production & distribution of high added value seamless stainless products, with presence in over 100 countries. The Tubacex Group is listing on the Spanish Stock Market
Pipes & tubes fittings
Master distribution
Commercial network
Steel billets & bars Extrusion Cold finishing
A strong Group to Your Service
A fully integrated player
4
Analyst Presentation
Tubacex Group
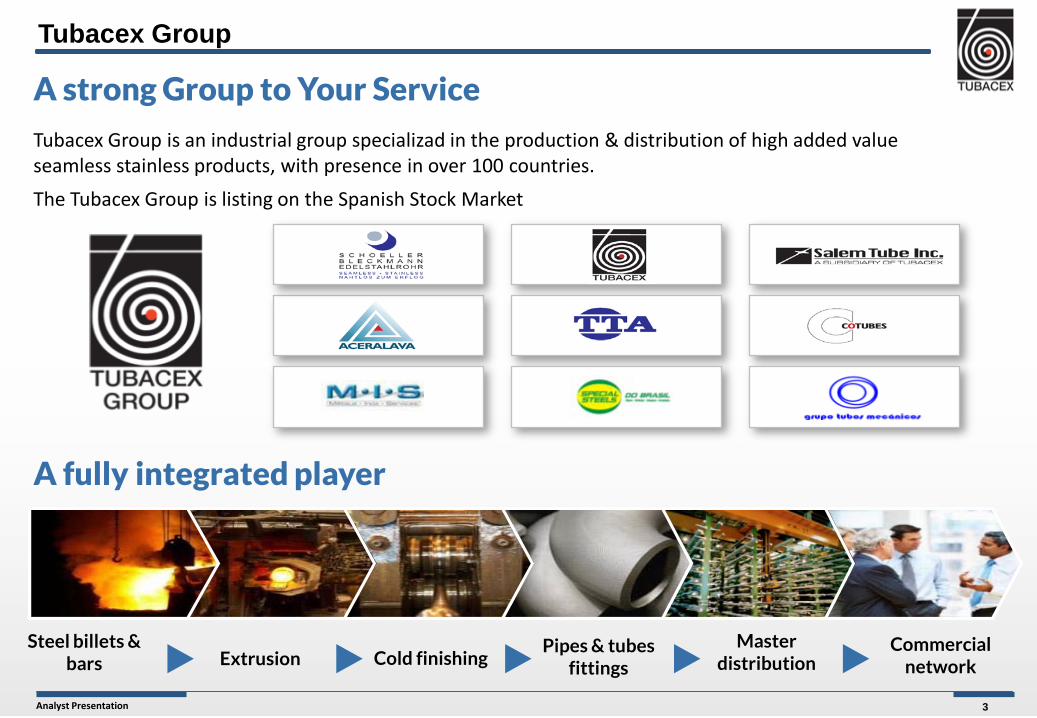
A Group with a strong global presence

5
Analyst Presentation
Worldwide 2nd largest supplier of seamless stainless steel tubes
Sales of 600 million EUR
Investment of 152.2 million EUR in the last 5 years
Commercial presence in over 100 countries
More than 300 customers
2000 professionals
Management system redefinition
Worlwide 2nd largest supplier of SSST
Tubacex Group

6
Analyst Presentation
Sales Breakdown by Sector*
*Sales in the Project market 2013
Oil&Gas sector represents 2/3 of the Group sales
E&P Oil&Gas
34%
Refino 33%
PowerGen 15%
Chem. & Petrochem.
14%
Others 4%
Good market behavior for investment in Oil&Gas sector projects
High oil price favors investment throughout the entire Gas&Oil value chain
In extraction: major OCTG orders and increased umbilical offshore tubes
In refining: orders based in the US and Europe
Tubacex Group

7
Analyst Presentation
Geographical Sales Breakdown 2013
Europe Asia
RoW
US and Canada
Geographical Sales Breakdown
Final tube destination in project market
Products sold in more than 100 countries
20%
18% 60%
45%
7%
20%
15%
15%
Tubacex Group
8
Analyst Presentation
Nota: cifras 2012 estimadas.
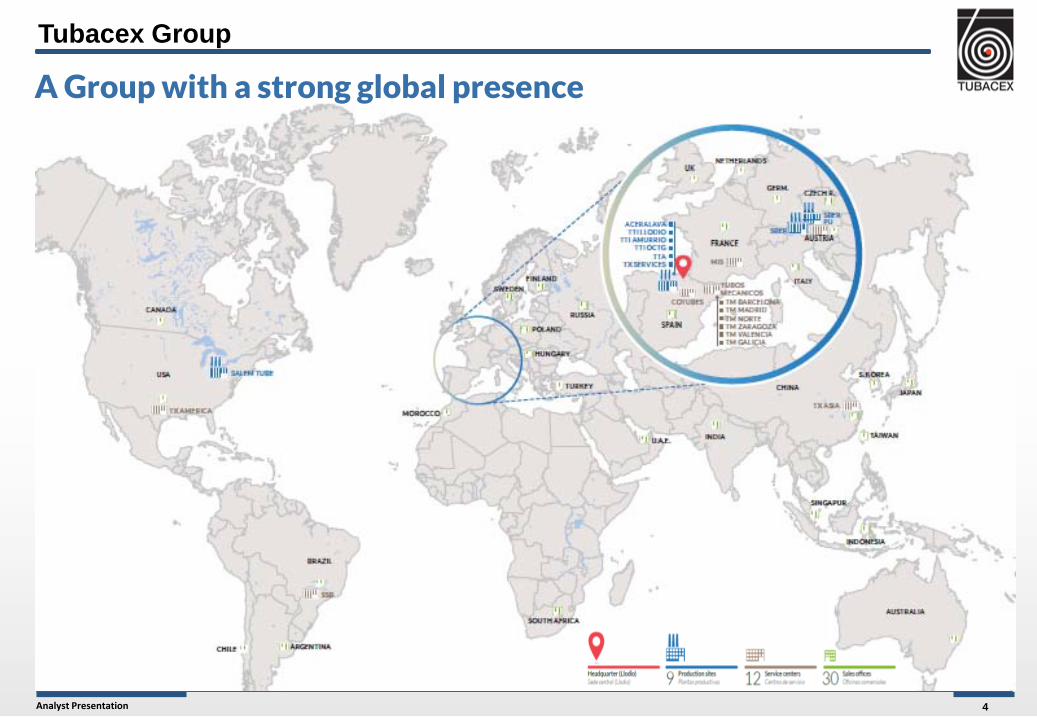
Seamless Stainles Steel Tube Sector
Production: 0,3 million tons per year vs. 1.300
million tons of crude steel production
Highest value added steel market niche
Constant 3-4% annual growth after 2009-2010 crisis
High consolidation level with only a few mayor player
Strong know-how and CAPEX entry barriers
OIL&GAS E&P
On shore Off shore
PETROCHEM INDUSTRIES
Refineries
TRANSPORTATION Light oil Heavy oil LNG
POWER GENERATION Thermal Ocgt Co-generation
Nuclear
OTHER PROCESS INDUSTRIES Water desalting plants Chemical Pharmaceutical Paper Mining & metals Food
METAL-MECHANICAL INDUSTRY
Main Customers Main Characteristics
Tubacex Group
9
Analyst Presentation
TUBACEX STORY
Tubacex Group

10
Analyst Presentation
1 2 3 4
Strategic Plan 2013 – 2017
Table of Contents
Goals achieved in 2013
Tubacex Group
Growth Strategy

11
Analyst Presentation
Launch a new Strategic Plan that enables us to align key collaborators throughout the entire strategic process.
Objective
Process
Involvement of sales, technical, production teams, etc. Analyze Tubacex level of competitiveness
External situation Internal situation Diagnosis: participation of over 50 people
Definition of Vision, Mission and Values (participation of over 100 people) Definition of 5-year goals Results in :
Customers Shareholders People Society
Strategic Decisions
Strategic lines and targets by areas Analysis of resources and responsible persons Focus on:
1. Business Strategy 2. Management Strategy
3. Operational Strategy 4. Growth Strategy
February 2013
March 2013
May 2013
Corporate
Targets Declaration
Analysis
Phase
Strategic Plan 2013 - 2017
12
Analyst Presentation
Strategic Plan 2013 - 2017
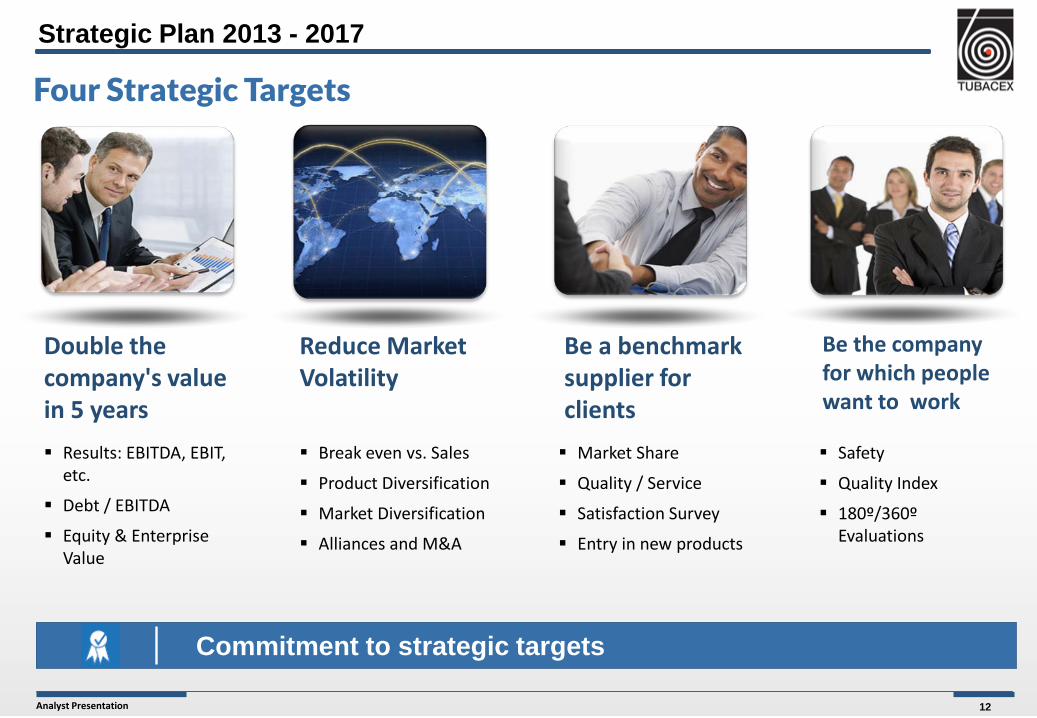
Four Strategic Targets
Double the company's value in 5 years
Reduce Market Volatility
Be a benchmark supplier for clients
Be the company for which people want to work
Results: EBITDA, EBIT, etc.
Debt / EBITDA
Equity & Enterprise Value
Break even vs. Sales
Product Diversification
Market Diversification
Alliances and M&A
Market Share
Quality / Service
Satisfaction Survey
Entry in new products
Safety
Quality Index
180º/360º Evaluations
Commitment to strategic targets
13
Analyst Presentation
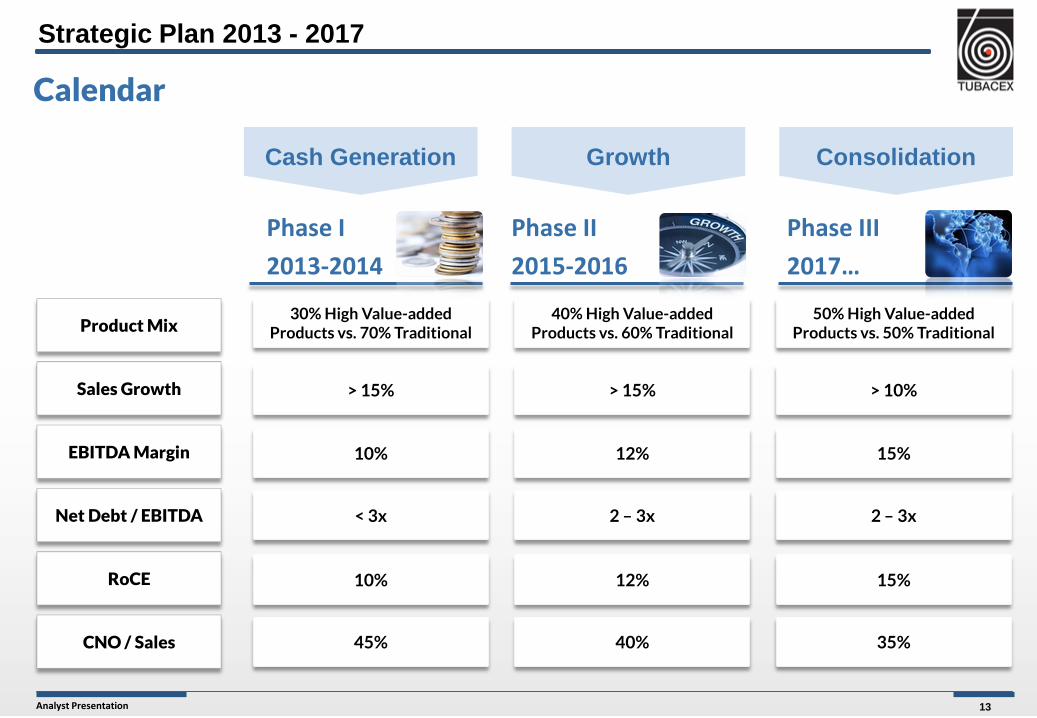
Phase I 2013-2014
Sales Growth
EBITDA Margin
Net Debt / EBITDA
RoCE
CNO / Sales
30% High Value-added Products vs. 70% Traditional
40% High Value-added Products vs. 60% Traditional
50% High Value-added Products vs. 50% Traditional
> 15% > 15% > 10%
10% 12% 15%
< 3x 2 – 3x 2 – 3x
10% 12% 15%
45% 40% 35%
Product Mix
Strategic Plan 2013 - 2017
Calendar
Phase II 2015-2016
Phase III 2017…
Cash Generation Growth Consolidation

14
Analyst Presentation
Management Plan and Focus
Strategic Plan 2013 - 2017
Product
Management: CEO
Organization
Strategic
Corporate Culture
Illusion and passion for the project
Alignment of the functions
Organization aimed at Objectives and Results
Rigor and Methodology
Process Management
Double the company's value in 5 years
Reduce Market Volatility
Be a benchmark supplier for our clients
Be the company for which people want to work
The key to success lies in people
Organization / Management Model
Change Management Commitment
Take advantage of the moment of change to create a new cycle of excellence which offers us profitable growth throughout the 2013-2017 period, positioning Tubacex as a benchmark in the
manufacture and distribution of tubular solutions.
Create a new paradigm
Eff
ect
Co
nse
qu
ence
s

15
Analyst Presentation
Strategic Roadmap
Strategic Plan 2013 - 2017
An
nu
al M
anag
emen
t P
lan
Marketing
Plant Strategy
Innovation
Growth
Industrial Plan
Support Functions
Business Strategy
SWOT
&
Conclusions
Objectives 5 years
Market
Research
Board
HR Purchasing Systems Finances

16
Analyst Presentation
Strategic Axes
Strategic Plan 2013 - 2017
Management focus based on four axes
Business Strategy Market
Customer
Product
Operational Strategy TxPS
Participation
PDCA Cycle
Growth Strategy To be developed
in Phase II
Management Strategy Operational Excellence Process Management Target alignment and
deployment

17
Analyst Presentation
Business Strategy. Tubacex Positioning
Strategic Plan 2013 - 2017
Product Portfolio
Market value
Margin
D C B A
Focus on strategic markets
Move to Premium Products
Commodity to optimize capacity
and/or LCC
R&D&I New commercial profiles Excellent service M&A
Key condition: Reinforce R&D and industrialization process and refocusing of commercial organization

18
Analyst Presentation
Heat Exchangers
High Alloys
Nuclear
Urea
Umbilicals
Off-shore
Std Boilers
CRA OCTG
Precision
Std Downstream
linepipe
Hollow Bar
Furnaces
SC Boilers
Mar
ket
Gro
wth
-
+ Strong Tubacex presence Tubacex Growing presence
Focus on customer service and delivery excellence
Continue our technological development with new products and services
The size indicates the volume of each segment, measured in Euros (not in tonnes)
Business Strategy. Tubacex Positioning
Strategic Plan 2013 - 2017
19
Analyst Presentation
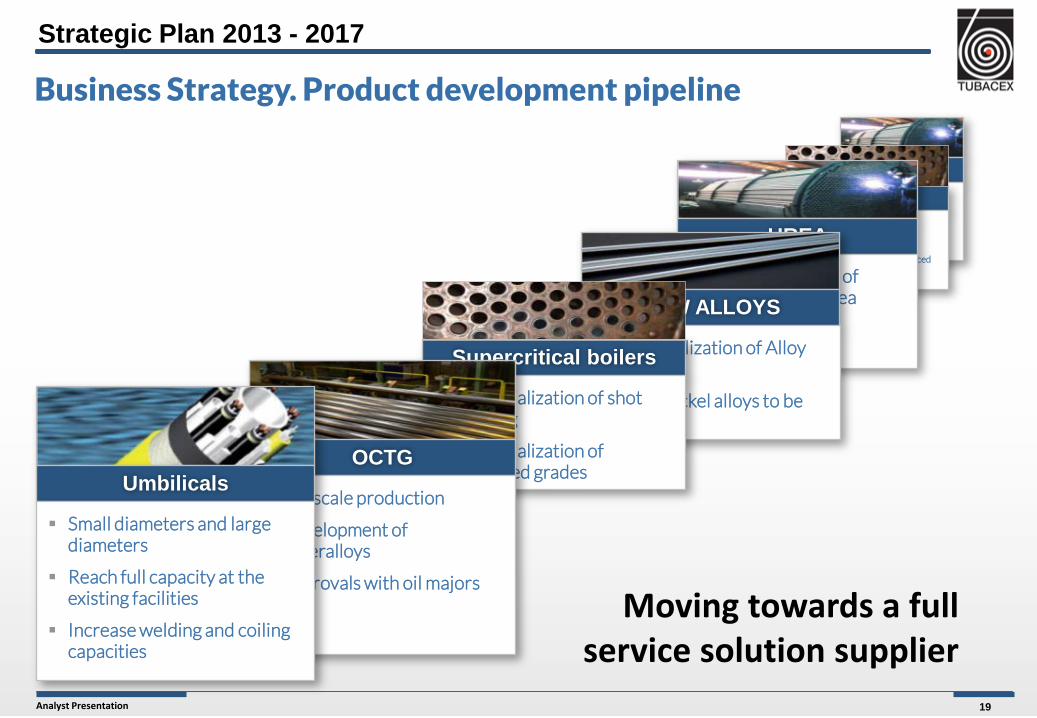
Business Strategy. Product development pipeline
Strategic Plan 2013 - 2017
UREA
Industrialization of exchangers in urea grades
Supercritical boilers
Industrialization of shot peening
Industrialization of advanced grades
UREA
Industrialization of exchangers in urea grades
NEW ALLOYS
Industrialization of Alloy 625
Other nickel alloys to be defined
Supercritical boilers
Industrialization of shot peening
Industrialization of advanced grades
OCTG
Full scale production
Development of superalloys
Approvals with oil majors
Umbilicals
Small diameters and large diameters
Reach full capacity at the existing facilities
Increase welding and coiling capacities
Moving towards a full service solution supplier

20
Analyst Presentation
Business Strategy. Product portfolio
Strategic Plan 2013 - 2017
Sales Breakdown 2012 Sales Breakdown 2017
29%
71%
To
ns
E
uro
s
Traditional Products PremiumProducts
46% 54%
44%
56% 67%
33%
Management knowledge Industrial Capacity Innovation

21
Analyst Presentation
Business Strategy. Value Chain
Strategic Plan 2013 - 2017
TUBACEX
DISTRIBUTORS
FABRICATORS
PACK-COMPILERS
TRADERS
EPC
END U SER

22
Analyst Presentation
Business Strategy. Business Teams
Strategic Plan 2013 - 2017
Integral product strategy definition for main product lines
2013/ 2104 Creation of Business Teams:
Main driver and responsible for Product
Strategy and Market development Multi disciplinary teams (incl. Product Manager,
Sales, R&D & Operations) to guaranty holistic approach, short feedback loops and quick adaptation
Leader of each team is the global Product Manager
Product Manager coordinates all groups activities to ensure the achievement of the product strategy (Development, Operations, etc.)

23
Analyst Presentation
Main tools:
Implementation of Tubacex management models at a global level with a unique and universal management system, consisting of processes focused
on excellence in management.
Strategic Plan 2013 - 2017
Management Strategy
Process map redefinition
Global deployment of best practices
Process discipline
Process Management
Coaching and human capital development
Team performance appraisal
PDPs
Innovation process re-focusing
Idea creation acceleration
R&D&I structure reinforcement
Innovation
Annual Management Cycle
Target alignment and deployment
Review Forums
Performance Indicators (KPIs)
Annual Management Plan
Industrialization process creation
Global deployment
Progress monitoring and management
Industrialization

24
Analyst Presentation
Strategic Plan 2013 - 2017
Management Strategy

25
Analyst Presentation
A company organized by processes responds with more dynamic and higher efficiency to an ever changing business environment and increasing complexity.
Strategic Plan 2013 - 2017
Cu
sto
mer
Innovation
Product industrialization
Sales Production &
delivery
Customer Satisfaction
Strategic Planning
Budget and yearly targets
Controlling
Develop a motivated and capable team
Purchasing & supplier
development
Financial management
Knowledge management
Normalized systems
Information systems
management
1
2 3
5
4
6 7
9 10 11
8
12 13 14
Management Strategy. Process management
Customer focus
Dynamic, horizontal and holistic vision
Interdependence
Focus on Added Value
People empowerment
Higher efficiency
Have an owner

26
Analyst Presentation
Mision Owner Process main inputs & Outputs Subprocesses KPIs Main tools Control standards (policies,etc)
Strategic processes Key processes Support process
Strategic Plan 2013 - 2017
Management Strategy. Process management development

27
Analyst Presentation
Strategic Cycle
Budgetary Cycle and Management Plan
Daily Meeting Cycle
Shift Meeting Cycle
Improvement Project Cycle
5 years
Previous Shift
Previous Day
Variable (Quarterly)
Next Year
Cycle Scope Review
Annual Review
Daily Review
Daily Review
Weekly Review
Monthly Review
Monthly Meeting Cycle Month Monthly Review
Strategic Plan 2013 - 2017
Management Strategy. Management cycle

28
Analyst Presentation
Deploym
ent of Targets / Actions D
eplo
ymen
t of T
arge
ts /
Act
ions
PDP
Individual Commitments
Management Plan:
BU / Plant Operations Transversal Function
Management Plan: Sales Financial Purchasing People R&D&I
Key Projects:
BU Spain
BU Austria
BU USA
BU ...
ACER TTI L TTI A
SBER 1 SBER 2
PDP
Individual Commitments
Strategic 5 years
Targets &
Management Plan
PDP PDP PDP PDP PDP PDP PDP
PDP PDP PDP PDP PDP PDP PDP
Transversal Functions Forums
Business Unit / Plant Management Committee
Tubacex Group Management Committee
Strategic Plan 2013 - 2017
Management Strategy. Management model

29
Analyst Presentation
Continuous and discontinuous line (dependency) well defined
Functions and responsibilities for key processes very clear
Goals of the employee are defined by both
The «coaching» in done together
Management Strategy. Management focus
Strategic Plan 2013 - 2017
Key considerations
Optimize synergies through a matrix organization
Take advantage of local knowledge and proximity to value creation with a global product vision and disciplined processes
Extension of management by processes - to facilitate the proper running of a matrix organization

30
Analyst Presentation
Strategic Plan 2013 - 2017
Management Strategy. Executive Team
Financial Coporate Director
Guillermo Ruiz Longarte
Commercial Corporate Director
Antón Azlor
Innovation Corporate Director
Diego Herrero
Purchasing Corporate Director
Pedro Carbajo
HR Corporate Director Manu Sarabia
Managing director TX Service Solutions
Pedro Carbajo
Managing director Operations Spain
Celes Danis
Managing director Operations Austria
Werner Horvath
Managing director Operations USA
Rufino Orce
CEO Jesús Esmoris
31
Analyst Presentation
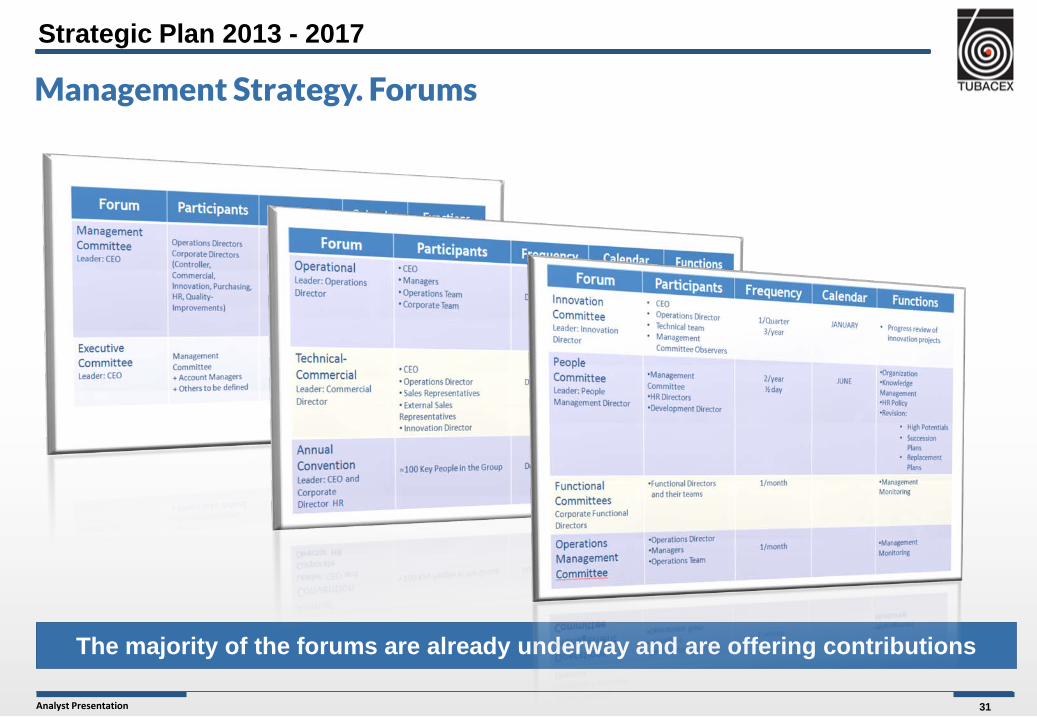
The majority of the forums are already underway and are offering contributions
Strategic Plan 2013 - 2017
Management Strategy. Forums
32
Analyst Presentation
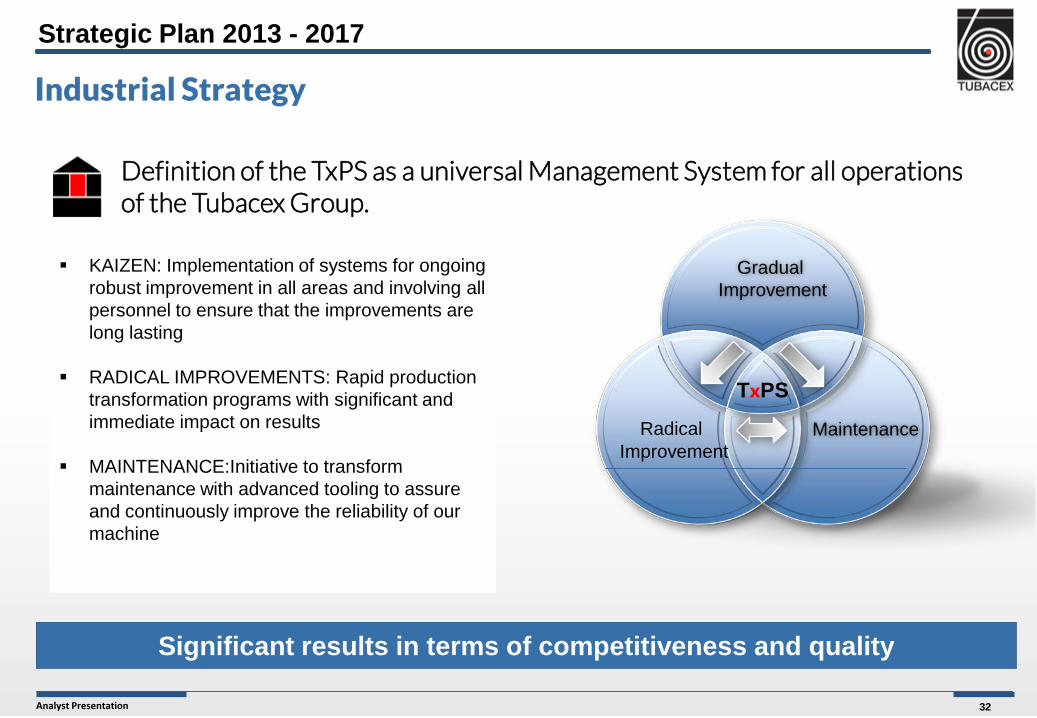
Significant results in terms of competitiveness and quality
Gradual Improvement
Maintenance Radical Improvement
TxPS
KAIZEN: Implementation of systems for ongoing robust improvement in all areas and involving all personnel to ensure that the improvements are long lasting
RADICAL IMPROVEMENTS: Rapid production transformation programs with significant and immediate impact on results
MAINTENANCE:Initiative to transform maintenance with advanced tooling to assure and continuously improve the reliability of our machine
Definition of the TxPS as a universal Management System for all operations of the Tubacex Group.
Strategic Plan 2013 - 2017
Industrial Strategy
33
Analyst Presentation
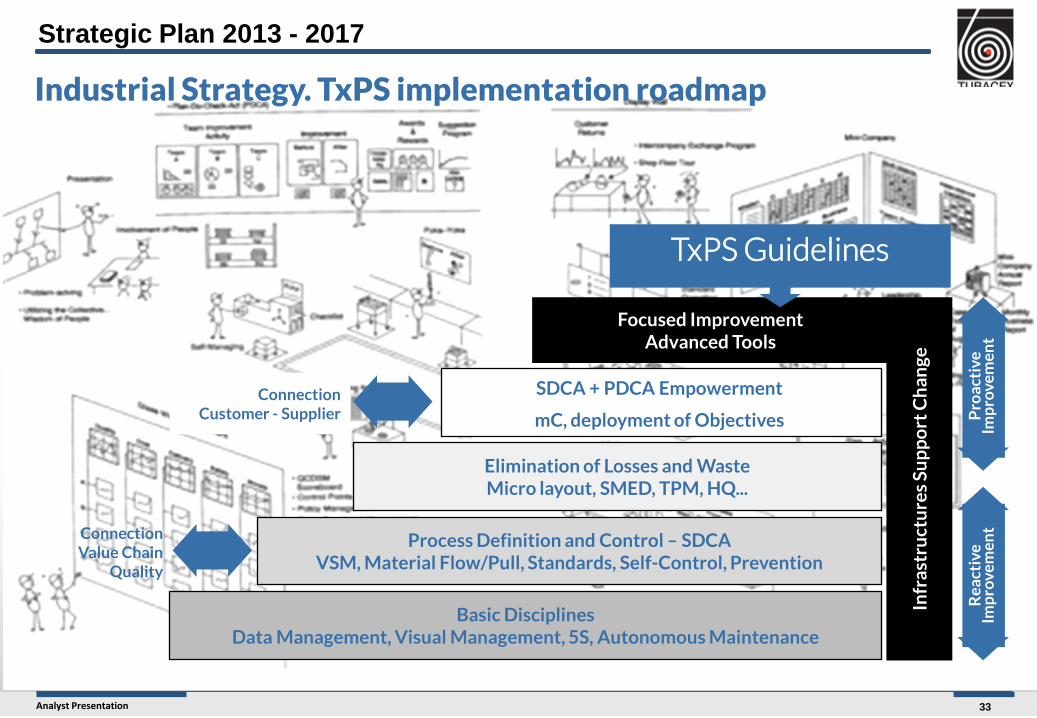
Connection Value Chain
Quality
SDCA + PDCA Empowerment
mC, deployment of Objectives
Basic Disciplines Data Management, Visual Management, 5S, Autonomous Maintenance
Process Definition and Control – SDCA VSM, Material Flow/Pull, Standards, Self-Control, Prevention
Elimination of Losses and Waste Micro layout, SMED, TPM, HQ...
Focused Improvement Advanced Tools
Infr
astr
uct
ure
s Su
pp
ort
Ch
ange
TxPS Guidelines
Rea
ctiv
e Im
pro
vem
ent
Pro
acti
ve
Imp
rove
men
t
Connection Customer - Supplier
Strategic Plan 2013 - 2017
Industrial Strategy. TxPS implementation roadmap
34
Analyst Presentation
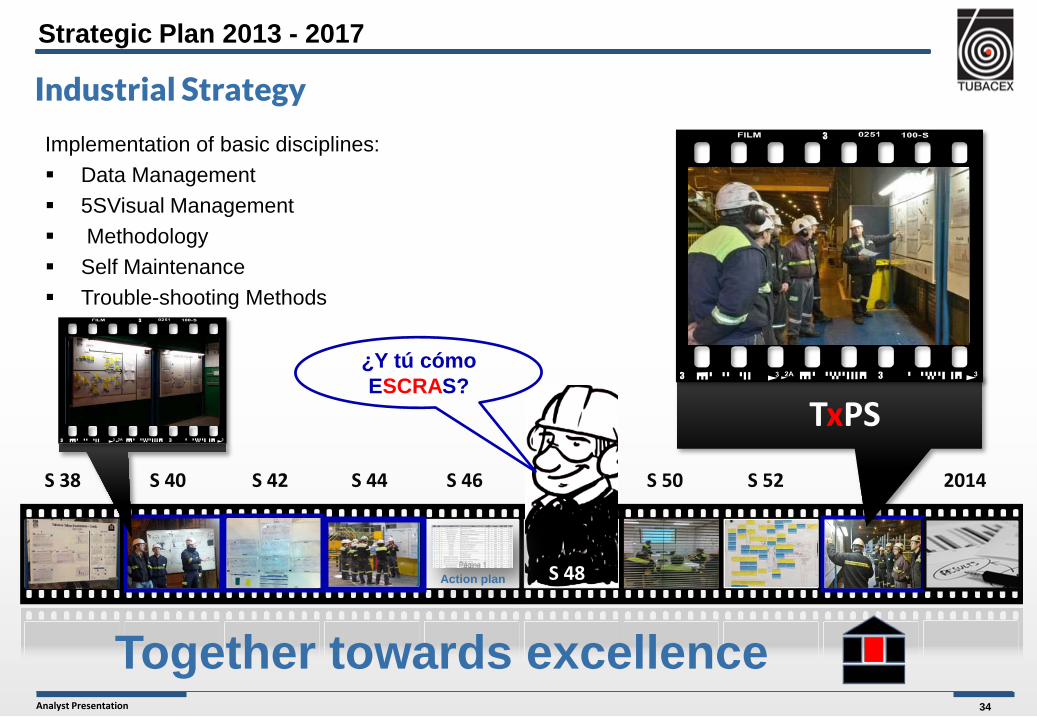
Implementation of basic disciplines: Data Management 5SVisual Management Methodology Self Maintenance Trouble-shooting Methods
2014 S 52 S 50 S 44 S 42 S 40 S 38 S 46
TxPS ¿Y tú cómo ESCRAS?
S 48 Action plan
Together towards excellence
Strategic Plan 2013 - 2017
Industrial Strategy

35
Analyst Presentation
Together towards excellence
Strategic Plan 2013 - 2017
Industrial Strategy – Infrastructures supporting change
Management through different key tools at a global level: TxPS fully integrated in the Tubacex management model
PDCAs, PDPs, project management, etc.
Continued training of teams, middle management and operators
Local recognition initiatives
Monthly SCRA, "Hitparade SCRA" etc.
Monthly communication campaign
posters, information charts, pocket manual, flyer, etc.

36
Analyst Presentation
1 2 3 4
Strategic Plan 2013 – 2017
Table of Contents
Goals achieved in 2013
Tubacex Group
Growth Strategy

37
Analyst Presentation
Product Strategy. Premium positioning progress
Significant increase in premium product sales
New Finishing Line
Extended Product Range
High alloy orders
Extended Product Range
Official approvals with main end-users
OCTG
Offshore
Umbilicals
2012 2013
45 60
45% 50%
Sales mix breakdown Developments to be highlighted
Premium
Standard
Goals achieved in 2013

38
Analyst Presentation
Process map redefinition
Global deployment of best practices
Process discipline
Process Management
Coaching and human capital development
Team performance appraisal
PDPs
Innovation process re-focusing
Idea creation acceleration
R&D&I structure reinforcement
Innovation
Annual Management Cycle
Target alignment and deployment
Review Forums
Performance Indicators (KPIs)
Annual Management Plan
Industrialization process creation
Global deployment
Progress monitoring and management
Industrialization
Management strategy. Continuous Improvement management initiatives
Continuous implementation of advanced management tools
Goals achieved in 2013

39
Analyst Presentation
Management Strategy - Operational and organizational excellence
High-performance equipment and system implementation
TxPS - Phase I
Data and visual management
Management cycles for Shift/day and month
Efficient troubleshooting
Dramatic Improvements Implementatio
n of Lean-Tools in pilot projects
Focus on Stock reduction and flow improvement
Quick-wins
Business Teams
Product focus reinforcement
Product strategy leadership
Multi-disciplinary teams
Tech. Teams
Standardization of best practices
Cross-company benchmark
Technological references
Process innovation
Matrix Org.
Reorganization through synergy maximizing
Cross global vision / local advantages
Management extension per process
Goals achieved in 2013

40
Analyst Presentation
Industrial Strategy – Progress according to the Implementation Roadmap
Work team is exceeding expectations and is ahead of the implementation plan. Schedule Time flexibly managed by each plant in accordance with its needs
Goals achieved in 2013
ConnectionValue Chain
Quality
SDCA + PDCA Empowerment
mC, deployment of Objectives
Basic DisciplinesData Management, Visual Management, 5S, Autonomous Maintenance
Process Definition and Control – SDCAVSM, Material Flow/Pull, Standards, Self-Control, Prevention
Elimination of Losses and WasteMicro layout, SMED, TPM, HQ...
Focused Improvement Advanced Tools
Infr
astr
uct
ure
s Su
pp
ort
Ch
ange
TxPS Guidelines
Rea
ctiv
eIm
prov
emen
tP
roac
tive
Impr
ovem
ent
ConnectionCustomer - Supplier
We defined the TxPS Roadmap with five lean levels in the previous strategic plan, which are still valid and are being implemented in all of the plants at the appropriate time.
Spain: Launching Lean Level 2 Process definition and control Example on following page Austria and USA: Progressing on Lean Level 1 Closing basic disciplines Example on following pages

41
Analyst Presentation
Goals achieved in 2013
Industrial Strategy - Actions
The improvements implemented will help increase the production mix.
Plant Load
Load increase of 15% Ton/d
Without external roughing in '14
With improvement margins with and without external roughing
Press Performance
Increase of 15% Ton/d in spite of unfavorable mix
Considerable improvement in rounded containers
Future: TPM (TiM)
Deliveries
DBR: traffic light prioritization, item pickers
Consequences:
1. Positive Backlog Evolution
2. Lead time/stock Reduction
Productivity
TxPS Management: OEE Overall increase
Radical Improvement: 2.2 Mio Euro savings in 2013
Continuous improvement has no limits
MauM
Positive evolution in hot rolling
OCTG Monitoring commenced: good evolution
Good evolution in standard and special steels.
TTI BACKLOG MauM (Llodio)
1 2 3 4 5 6 7 9 10 11 12 1 2 3 4 5
Ton/d Press OEE Amurrio
12 1 3 5 7 10 12 1 3 5
Ton/d Prod

42
Analyst Presentation
Sales 532.4 554.1 4.1%
EBITDA 45.8 51.3 12.0%
EBITDA Margin 8.6% 9.3%
EBIT 26.5 31.5 18.7%
EBIT Margin 5.0% 5.7%
Profit Before Tax 13.1 16.6 26.5%
Margin on sales 2.5% 3.0%
Net Profit 11.9 15.0 26.6%
Net Margin 2.2% 2.7%
Working Capital 294.3 217.6 -26.1%
Net Financial Debt 262.3 194.6 -25.8%
Net Financial Debt / EBITDA 5.7x 3.8x
Gross Cash Generation 16.1 128.0
Key Financial Figures Million Euro
Significant improvement in all items
2012 % 2013
Goals achieved in 2013

43
Analyst Presentation
Main item evolution
Sales
Invoiced volume growth and sales mix improvement have led to an increased turnover, partly offsetting nickel price drop.
EBITDA
Major EBITDA margin improvement due to: − Sales mix improvement − Operational improvement
Working Capital
A strong effort has been made to reduce working capital:
− Intermediate stocks − Customers − Suppliers
294 218
2012 2013
46 51
8,6% 9,3%
8,0% 8,5% 9,0% 9,5% 10,0% 10,5% 11,0% 11,5%
2012 2013
532
554
2012 2013
- €76.7 M
+ 12.0%
+ 4%
Increased results and working capital reduction
Goals achieved in 2013

44
Analyst Presentation
Cash Flow Generation
Dividends (€6.6 M) Commitment to shareholder
remuneration 40% Pay out
Other (€13.9 M) Interests Taxes
Capital Expenditure (€39.8 M) Competitive situation
improvement in premium products
OCTG finishing line, extrusion mill power increased in Llodio, Salem, etc.
Debt reduction (€67.7 M) Financial structure
improvement
€128M gross cash flow generated
224,0 237,1
262,3
194,6 17,5x
8,7x
5,7x 3,8x
-
5,0x
10,0x
15,0x
20,0x
25,0x
30,0x
2010 2011 2012 2013
128 Million Euro
Goals achieved in 2013

45
Analyst Presentation
First Quarter. Key Financial Figures
Million Euro
Gradual improvement trend continues
Sales 145.5 140.3 -3.6%
EBITDA 14.4 16.5 15.1%
EBITDA Margin 9.9% 11.8%
EBIT 9.0 10.9 20.4%
EBIT Margin 6.2% 7.7%
Profit Before Tax 5.2 7.6 45.2%
Margin on sales 3.6% 5.4%
Q1 2013 % Q1 2014
Working Capital 217.6 213.7 -1.8%
Net Financial Debt 194.6 176.7 -9.2%
Net Financial Debt / EBITDA 3.8x 3.3x
Dec. 2013 % Q1 2014
Goals achieved in 2013
46
Analyst Presentation
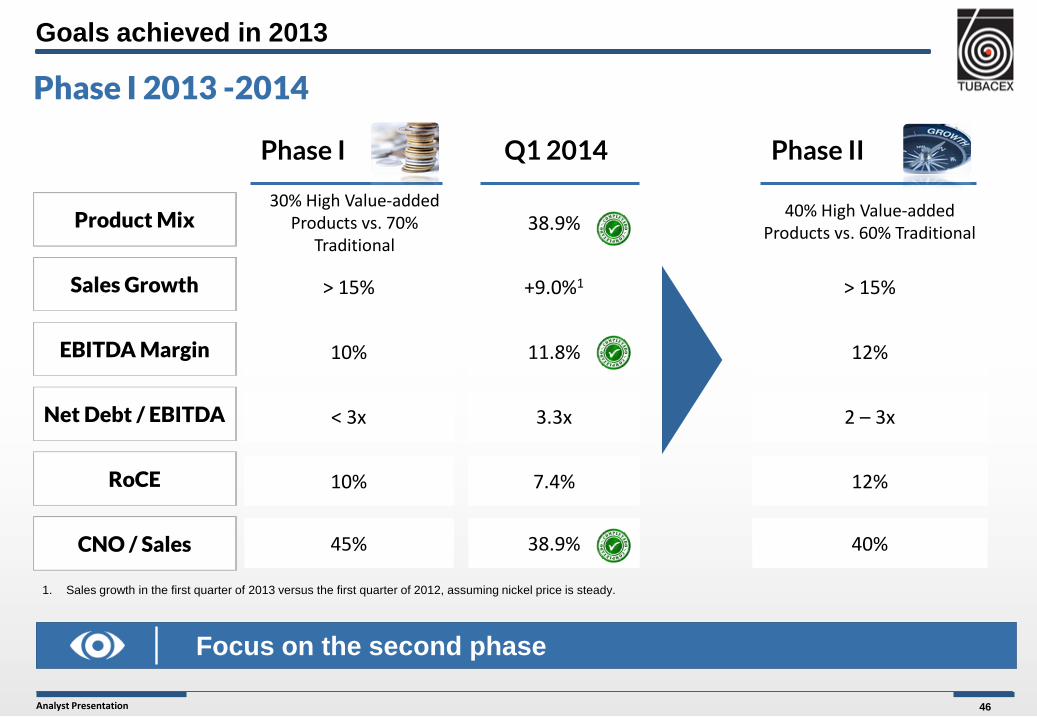
Focus on the second phase
Phase I Phase II
Sales Growth
EBITDA Margin
Net Debt / EBITDA
RoCE
CNO / Sales
30% High Value-added Products vs. 70%
Traditional
40% High Value-added Products vs. 60% Traditional
> 15% > 15%
10% 12%
< 3x 2 – 3x
10% 12%
45% 40%
Product Mix
Phase I 2013 -2014
Q1 2014
38.9%
+9.0%1
11.8%
3.3x
7.4%
38.9%
1. Sales growth in the first quarter of 2013 versus the first quarter of 2012, assuming nickel price is steady.
Goals achieved in 2013
47
Analyst Presentation
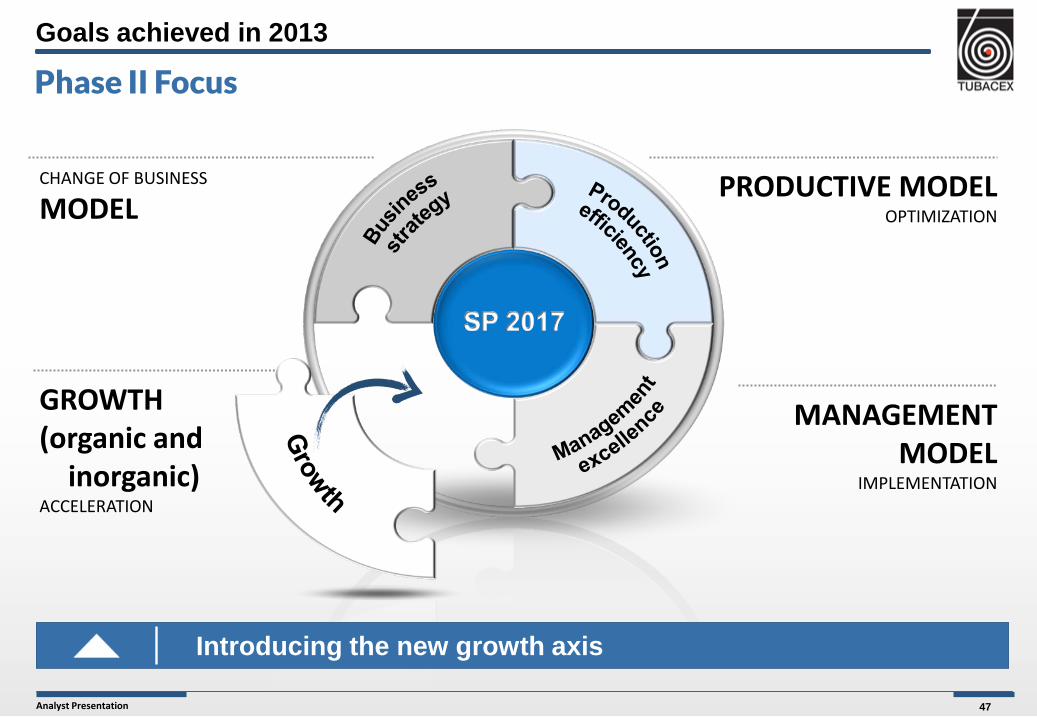
CHANGE OF BUSINESS
MODEL PRODUCTIVE MODEL
OPTIMIZATION
MANAGEMENT MODEL
IMPLEMENTATION
GROWTH (organic and
inorganic) ACCELERATION
Phase II Focus
Introducing the new growth axis
Goals achieved in 2013

48
Analyst Presentation
1 2 3 4
Strategic Plan 2013 – 2017
Table of Contents
Goals achieved in 2013
Tubacex Group
Growth Strategy

49
Analyst Presentation
Introduction
Growth Strategy
Vision: Be a solutions provider
Organic and inorganic growth focused on value generation seeking complementarity and synergies.
Maintain debt multiples of 2-3 times EBITDA. Feasible and manageable integration processes.
Strategic Alliances New Products New factories
In: “Brown Feald” in LCC Complementary products Services to increase added value
Organic Growth Inorganic Growth

50
Analyst Presentation
Organic Growth. Tubacex Service Solutions
Growth Strategy
Shotpeening: Operational in Q3-2014
Tubacoat: still in R&D
PHAS
E 1
Beveling, samples and others
New central distribution warehouse (2015)
Finishing of TTI and LCC tube (2015)
PHAS
E 2
In identification stage to be implemented as of 2015.
PHAS
E 3
• Replacement of subcontracting
• Central Warehouse
• Finishing Line
• Special inspection and finishing operations
• New finished products
51
Analyst Presentation
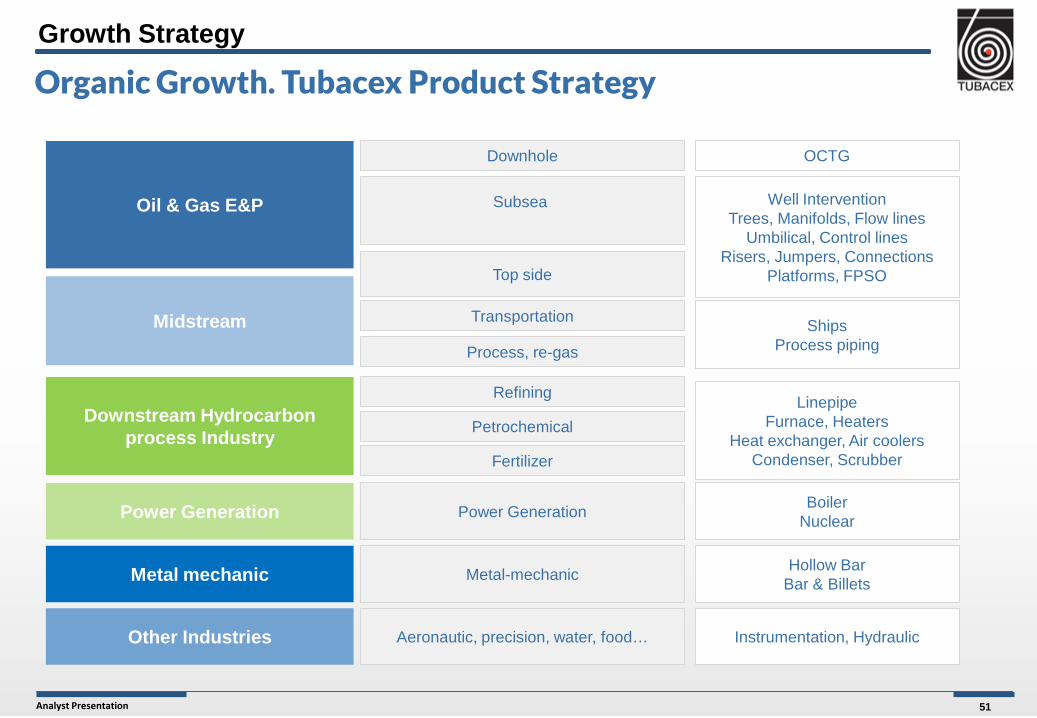
Oil & Gas E&P
Downhole
Subsea
Downstream Hydrocarbon process Industry
Refining
Petrochemical
Top side
OCTG
Midstream Process, re-gas
Transportation
Fertilizer
Power Generation
Metal mechanic
Power Generation
Metal-mechanic
Other Industries Aeronautic, precision, water, food… Instrumentation, Hydraulic
Well Intervention Trees, Manifolds, Flow lines
Umbilical, Control lines Risers, Jumpers, Connections
Platforms, FPSO
Ships Process piping
Linepipe Furnace, Heaters
Heat exchanger, Air coolers Condenser, Scrubber
Boiler Nuclear
Hollow Bar Bar & Billets
Organic Growth. Tubacex Product Strategy
Growth Strategy
52
Analyst Presentation
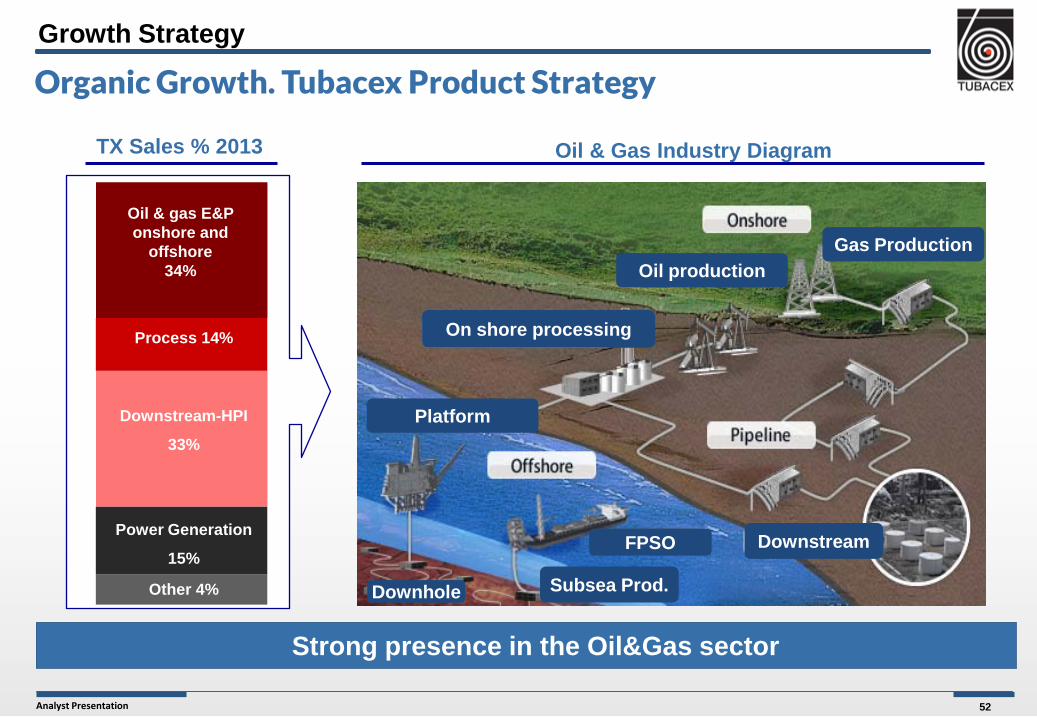
Downstream
Subsea Prod.
FPSO
Platform
Oil production Gas Production
On shore processing
Downhole
Oil & Gas Industry Diagram TX Sales % 2013
Oil & gas E&P onshore and
offshore 34%
Process 14%
Downstream-HPI
33%
Power Generation
15%
Other 4%
Strong presence in the Oil&Gas sector
Organic Growth. Tubacex Product Strategy
Growth Strategy

53
Analyst Presentation
>5% Subsea and Top-site Growth
The umbilicals market continues to show very high growth rates over 5%.
Good fundamentals with sustained and more variable growth for subsea and top-site, respectively.
Opportunity: to complete our portfolio and continue progressing in our knowledge curve to strengthen our competitive situation.
Subsea Market
Source: World Subsea Hardware Market 2012-2016 (Douglas-Westwood)
0
5
10
15
20
25
30
35
2011 2012 2013 2014 2015 2016
Organic Growth – Oil&Gas E&P: Subsea
Growth Strategy

54
Analyst Presentation
Downstream
Upstream E&P
Offshore
Onshore
SUBSEA
Topside/Platform
Tie-Back
Drill-ship
FPSO/FLNG
Drilling Rig
FPSO: Floating, Production, Storage and Offloading. FLNG: Floating Liquified Natural Gas
SURF: Subsea, Umbilicals, Risers and Flowlines
Greenfields: New Fields. Nowadays Deeper waters, HPHT field
Brownfield: Old fields that need to increase recovery
Organic Growth – Oil&Gas E&P: Subsea. Concepts
Growth Strategy

55
Analyst Presentation
Manifold
Xmas Trees
BOP/Well Heads
Jumpers/Spools
Umbilicals
Flowline
Pipeline Risers
Manifold
Organic Growth – Oil&Gas E&P: Subsea. Products
Growth Strategy

56
Analyst Presentation
Operators
Integrators
EPCs
Organic Growth – Oil&Gas E&P: Subsea. Players
Growth Strategy

57
Analyst Presentation
>5% expected growth
Our competitive position in OCTG is strong thanks to our investments and applied R&D
Development prospects are very positive for Asia (Middle East and Far East)
Tubacex was very well received by end-users Opportunity: to continue our technological develepoment with
new dimesions and grades
OCTG demand evolution
0
10
20
30
40
50
2007 2008 2009 2010 2011 2012 2013 2014 2015 2016 2017 2018
CAPU 86% 81% 62% 66% 55% 63% 66% 67% 70% 67% 71% 71%
Source: SMI-Steel Market Intelligence GmbH
Organic Growth – Oil&Gas E&P: OCTG
Growth Strategy

58
Analyst Presentation
+4% expected growth
The fertilizer market is a key target of our new Strategic Plan. Sustained growth and lower fluctuations than in the energy
sector. Opportunity: to increase our market knowledge and to enter
into a new market
0
50
100
150
200
2006 2007 2008 2009 2010 2011 2012F 2013F 2014F Source: Fertecon, IFA, Potash Corp 2011
Global Fertilizer Consumption
Organic Growth – Downstream HPI: Fertilizer
Growth Strategy
59
Analyst Presentation
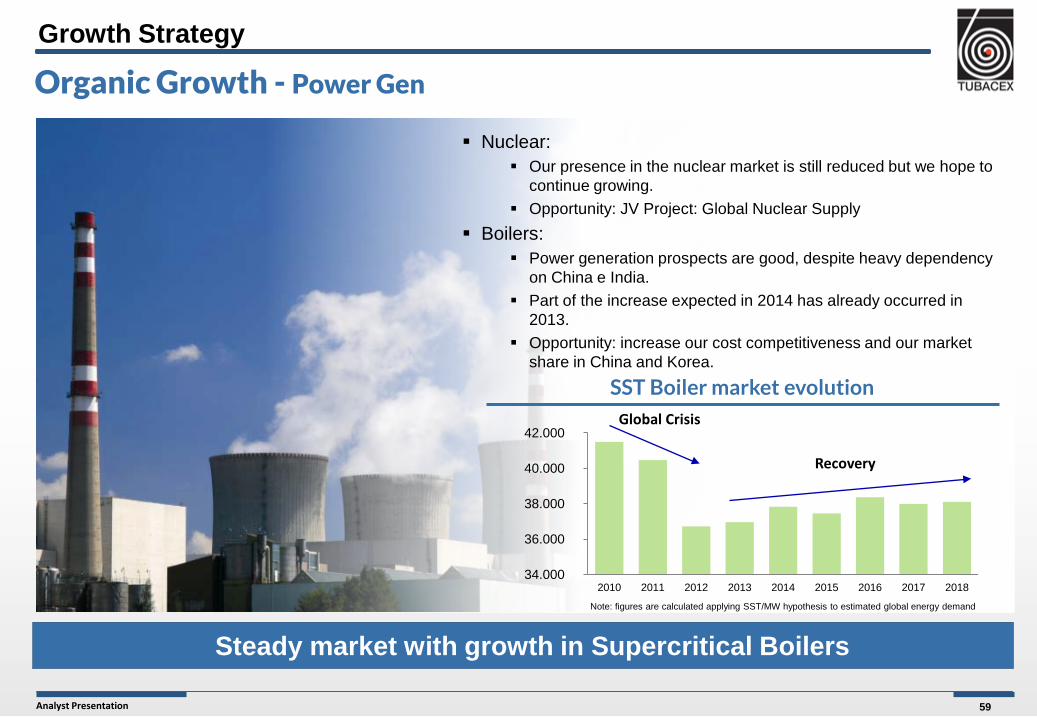
Steady market with growth in Supercritical Boilers
Nuclear: Our presence in the nuclear market is still reduced but we hope to
continue growing. Opportunity: JV Project: Global Nuclear Supply
Boilers: Power generation prospects are good, despite heavy dependency
on China e India. Part of the increase expected in 2014 has already occurred in
2013. Opportunity: increase our cost competitiveness and our market
share in China and Korea.
34.000
36.000
38.000
40.000
42.000
2010 2011 2012 2013 2014 2015 2016 2017 2018
Global Crisis
Recovery
Note: figures are calculated applying SST/MW hypothesis to estimated global energy demand
SST Boiler market evolution
Organic Growth - Power Gen
Growth Strategy

60
Analyst Presentation
Growth is difficult to measure but positive
Good fundamentals Good competitive position of Salem: major opportunities in
the US and to be developed in Europe
Source: Hydrocarbon Processing
Aircraft Demand
0
200
400
600
800
1000
1200
1400
2006 2007 2008 2009 2010 2011 2012 2013 2014 2015
Organic Growth - Precision & Aerospace
Growth Strategy

61
Analyst Presentation
New important hubs appearing in Asia
NORTH EUROPE
PERSIC GULF
ASIA - PACIFIC
INDIA & Middle Asia
Growth Strategy
Organic Growth – Greographic Strategy
62
Analyst Presentation
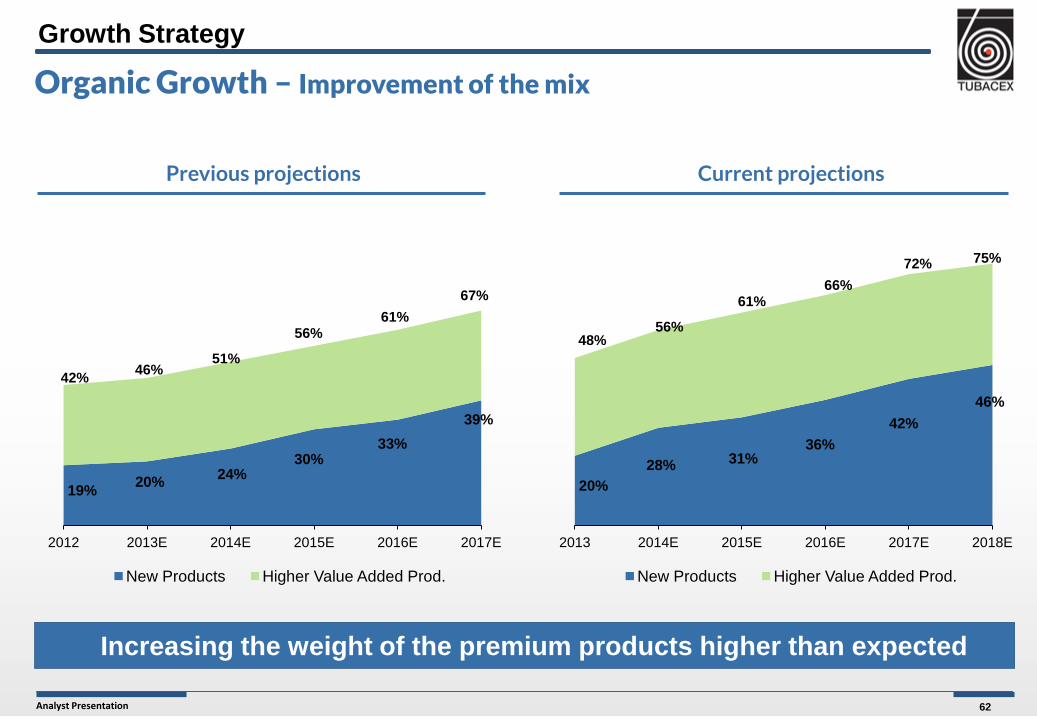
20% 28% 31%
36% 42%
46%
2013 2014E 2015E 2016E 2017E 2018E
New Products Higher Value Added Prod.
19% 20% 24% 30%
33% 39%
2012 2013E 2014E 2015E 2016E 2017E
New Products Higher Value Added Prod.
Increasing the weight of the premium products higher than expected
Previous projections Current projections
42% 46% 51%
56% 61%
67%
48% 56%
61% 66%
72% 75%
Growth Strategy
Organic Growth – Improvement of the mix

63
Analyst Presentation
Phase I 2013-2014
Sales Growth
EBITDA Margin
Net Debt / EBITDA
RoCE
CNO / Sales
30% High Value-added Products vs. 70% Traditional
40% High Value-added Products vs. 60% Traditional
50% High Value-added Products vs. 50% Traditional
> 15% > 15% > 10%
10% 12% 15%
< 3x 2 – 3x 2 – 3x
10% 12% 15%
45% 40% 35%
Product Mix
Conclusion
Phase II 2015-2016
Phase III 2017…
Cash Generation Growth Consolidation
Growth Strategy

64
Analyst Presentation
Questions?

65
Analyst Presentation
MANY THANKS FOR YOUR ATTENTION
WWW.TUBACEX.COM