Embed Size (px)
Citation preview

Direct and Indirect Antioxidant Activity of Polyphenol- and Isothiocyanate-Enriched Fractions from Moringa oleifera
Tugba Boyunegmez Tumer*, Patricio Rojas-Silva, Alexander Poulev, Ilya Raskin, and Carrie WatermanDepartment of Plant Biology and Pathology, Rutgers, The State University of New Jersey, 59 Dudley Road, New Brunswick, New Jersey 08901, United States
Abstract
Moringa oleifera Lam. is a fast-growing, tropical tree with various edible parts used as nutritious
food and traditional medicine. This study describes an efficient preparatory strategy to extract and
fractionate moringa leaves by fast centrifugal partition chromatography (FCPC) to produce
polyphenol and isothiocyanate (ITC) rich fractions. Characterization and further purification of
these fractions showed that moringa polyphenols were potent direct antioxidants assayed by
oxygen radical absorbance capacity (ORAC), whereas moringa ITCs were effective indirect
antioxidants assayed by induction of NAD(P)H quinone oxidoreductase 1 (NQO1) activity in
Hepa1c1c7 cells. In addition, purified 4-[(α-L-rhamnosyloxy)benzyl]-isothiocyanate and 4-[(4′-O-
acetyl-α-L-rhamnosyloxy)benzyl]isothiocyanate were further evaluated for their ORAC and NQO1
inducer potency in comparison with sulforaphane (SF). Both ITCs were as potent as SF in
inducing NQO1 activity. These findings suggest that moringa leaves contain a potent mixture of
direct and indirect antioxidants that can explain its various health-promoting effects.
Keywords
Moringa oleifera; isothiocyanates; 4-[(α-L-rhamnosyloxy)benzyl]isothiocyanate; 4-[(4′-O-acetyl-α-L-rhamnosyloxy)benzyl]isothiocyanate; polyphenols; NQO1; FCPC; antioxidants
INTRODUCTION
Isothiocyanates (ITCs) are food-derived compounds with strong chemopreventive and anti-
inflammatory activities, which can be attributed to modulation of oxidative stress by
induction of phase II detoxifying enzymes.1,2 The plant order Brassicales provides a rich
source of these molecules for the human diet.3 ITCs are formed from glucosinolates (GLSs),
having a backbone of glucose attached to sulfonated aldoxime with a variable side chain
(Figure 1), by the action of myrosinase (β-thioglucosidase), which is stored in a different
compartment in the same plant cells.4 Although the concentration of ITCs in intact plant
*Corresponding Author. (T.B.T.) Mail: Department of Molecular Biology and Genetics, Faculty of Arts and Sciences, Çanakkale Onsekiz Mart University, Terzioglu Campus, Çanakkale, Turkey 17100. Phone: +90 286 2180018-1844. [email protected] or [email protected].
IR has equity in Nutrasorb LLC, which licensed Moringa-related intellectual property from Rutgers University.The authors declare no competing financial interest.
HHS Public AccessAuthor manuscriptJ Agric Food Chem. Author manuscript; available in PMC 2016 March 18.
Published in final edited form as:J Agric Food Chem. 2015 February 11; 63(5): 1505–1513. doi:10.1021/jf505014n.
Author M
anuscriptA
uthor Manuscript
Author M
anuscriptA
uthor Manuscript

tissue is very low or undetecable,5 upon tissue disruption such as cutting, chewing, or other
mechanical insult, myrosinase and GLSs come in contact and glucose is removed from the
molecule, producing an aglycone that is subsequently converted into a corresponding ITC.
The bioactivity of ITCs is a function of the –N═C═S group (ITC pharmacophore, Figure
1), which has been reported to cleave disulfide bonds in proteins and react with amino acids
in vitro.6 The rest of the molecule determines its polarity, stability, and volatility.
Most ITCs, including sulforaphane (SF, Figure 1A) isolated from broccoli, are volatile oils,
unstable at room temperature, and are spontaneously converted to several inactive
intermediates with relatively high degradation rates.7 In contrast to unstable ITCs from
crucifers, the four ITCs formed in the leaves of Moringa oleifera Lam. (Moringaceae
family, Brassicales order), commonly known as moringa, have emerged as highly stable
analogues due to an additional sugar moiety in the aglycone portion of the molecule (Figure
1B).8 The presence of a rhamnose sugar moiety is unique to moringa ITCs in nature and
likely explains their observed stability and solid appearance at room temperature. It has been
shown that compound 1 (4-[(α-L-rhamnosyloxy)benzyl]isothiocyanate) and compound 4 (4-
[(4′-O-acetyl-α-L-rhamnosyloxy)benzyl]isothiocyanate) (Figure 1B) from M. oleifera Lam.
demonstrated 70 and 100% stability, respectively, over 30 days at room temperature.8 In
addition to distinguished stability, studies of moringa ITCs (1–4) revealed possible
pharmacological advantages as anti-inflammatory agents over well-studied crucifer ITCs
including SF. For example, compound 1 was found to be a stronger inhibitor of nuclear
factor kappa B (NF-κB) expression and myeloma growth in nude mice than SF.9 ITCs (1–4)
were also shown to reduce nitric oxide (NO) formation at low micromolar concentrations in
macrophages.10 Further studies reported that compound 2 (4-[(2′-O-acetyl-α-L-
rhamnosyloxy)-benzyl]isothiocyanate) specifically attenuated NO formation more
effectively than SF and benzylisothiocyanate.11 Recently, we showed that both compound 1 and 4 attenuated expression of iNOS and IL-1β and formation of NO and tumor necrosis
factor alpha (TNFα) in RAW macrophages at 1 and 5 µM concentrations.8
Although there are considerable data on the bioactivity, absorption, metabolism (including
hydrolysis in human gut microbiota), and bioavailability of various ITCs from crucifers, for
the rhamnose-substituted GLSs and corresponding ITCs of moringa tissues, the available
bioactivity data are limited to the above-mentioned examples, and there are no comparable
data on the metabolism, absorption, etc. The analysis of GLS content from the leaves of M.
oleifera has shown that GLS 1 (see Figure 1B for the structure) is present in significant
concentrations (ranging between 33.9 and 59.4 mg/g dry weight of the tissue). However, the
concentration of its monoacetyl isomers, especially GLSs 2 and 3, are relatively less
abundant (ranging between 1.2 and 5.0 mg/g dry weight of the tissue).12 The occurrence of
these compounds at relatively low levels makes isolation of them and their corresponding
ITCs a purification challenge. Herein, we accomplished a large-scale fractionation of
moringa leaf extract to yield ITC-rich fractions by fast partition counter current
chromatography (FCPC) using a three-phase solvent system, which has been previously
used to separate a mixture of plant compounds having a broad range of polarity in a one-step
operation.13 We applied this system followed by solid phase extraction (SPE) to further
enrich the ITC content of the fractions, thus enabling the isolation of other, less abundant
Boyunegmez Tumer et al. Page 2
J Agric Food Chem. Author manuscript; available in PMC 2016 March 18.
Author M
anuscriptA
uthor Manuscript
Author M
anuscriptA
uthor Manuscript

monoacetyl isomers. The methanolic extract of moringa was prepared from finely chopped
and crushed fresh leaves to activate plant myrosinase for the efficient conversion of GLSs to
corresponding ITCs.
The use of moringa leaves as traditional medicine dates back to ancient times. Growing
scientific evidence has suggested the effectiveness of moringa in treating inflammation,
hyperlipidemia, hyperglycemia, hypertension, bacterial and viral infections, ulcers, and
cancer.14–16 It is now well-known that many of these conditions are brought on and/or
exacerbated by oxidative and electrophilic stress.17 Thus, moringa’s ability to prevent and
treat such conditions may be due to the high level of antioxidant/bioactive compounds
present in the leaves including vitamins, micronutrients, and polyphenols.14,18 To date,
moringa ITCs have not been well studied for their antioxidant activity. Therefore, this study
was designed to evaluate and distinguish the role of moringa polyphenols and ITCs in both
direct and indirect antioxidant capacities.
Generally, direct antioxidants are redox active, short-lived small molecules that directly
scavenge reactive oxygen and/or nitrogen species.17 On the other hand, indirect antioxidants
induce a battery of phase II xenobiotic metabolizing enzymes (XMEs) through a shared
Keap1/Nrf2/ARE pathway resulting in increased antioxidant capacity and long-lived
protective effect compared to direct antioxidants.17 Among phase II XMEs, NAD(P)H
quinone oxidoreductase 1 [NQO1, EC 1.6.99.2] serves as a cytoprotective marker enzyme to
evaluate indirect antioxidant potential of various phytochemicals including ITCs.19,20 NQO1
catalyzes a two-electron reduction of highly reactive quinone molecules that are found in
automobile exhaust, cigarette smoke, and many foods.21 Numerous studies have shown
associations between elevated NQO1 activity and protection against cancer and
inflammatory diseases.22,23
Assaying NQO1 inducer potency has been used to isolate several chemoprotective agents
from plant materials, leading to the synthesis of more effective ITCs and curcumin
derivatives.24 SF was first isolated from broccoli by monitoring NQO1 inducer potency.25
In the current work, polyphenol-rich fractions, ITC-enriched fractions, compounds 1 and 4,
and SF were tested and compared for indirect antioxidant activity by measuring induction of
NQO1 activity in murine hepatoma cells and direct antioxidant activity by measuring the
oxygen radical absorbance capacity (ORAC). This study also demonstrates the effectiveness
of FCPC and solid phase extraction (SPE) to concentrate polyphenols and ITCs from
moringa leaves.
MATERIALS AND METHODS
Chemicals
Acetonitrile, 2,2′-azobis(2-methylpropionamidine) dihydrochloride (AAPH), 3-(4,5-
dimethylthiazol-2-yl)-2,5-diphenyltetrazolium bromide (MTT), fluorescein sodium salt,
Folin–Ciocalteu phenol reagent, gallic acid, n-hexane, methanol, methyl acetate, β-
naphthoflavone (BNF), phosphate-buffered saline (PBS) 10× concentrate, L-sulforaphane
(SF), and trolox [(±)-6-hydroxy-2,5,7,8-tetramethylchromane-2-carboxylic acid, 97%] were
purchased from Sigma-Aldrich (St. Louis, MO, USA). Fetal bovine serum and α-minimum
Boyunegmez Tumer et al. Page 3
J Agric Food Chem. Author manuscript; available in PMC 2016 March 18.
Author M
anuscriptA
uthor Manuscript
Author M
anuscriptA
uthor Manuscript
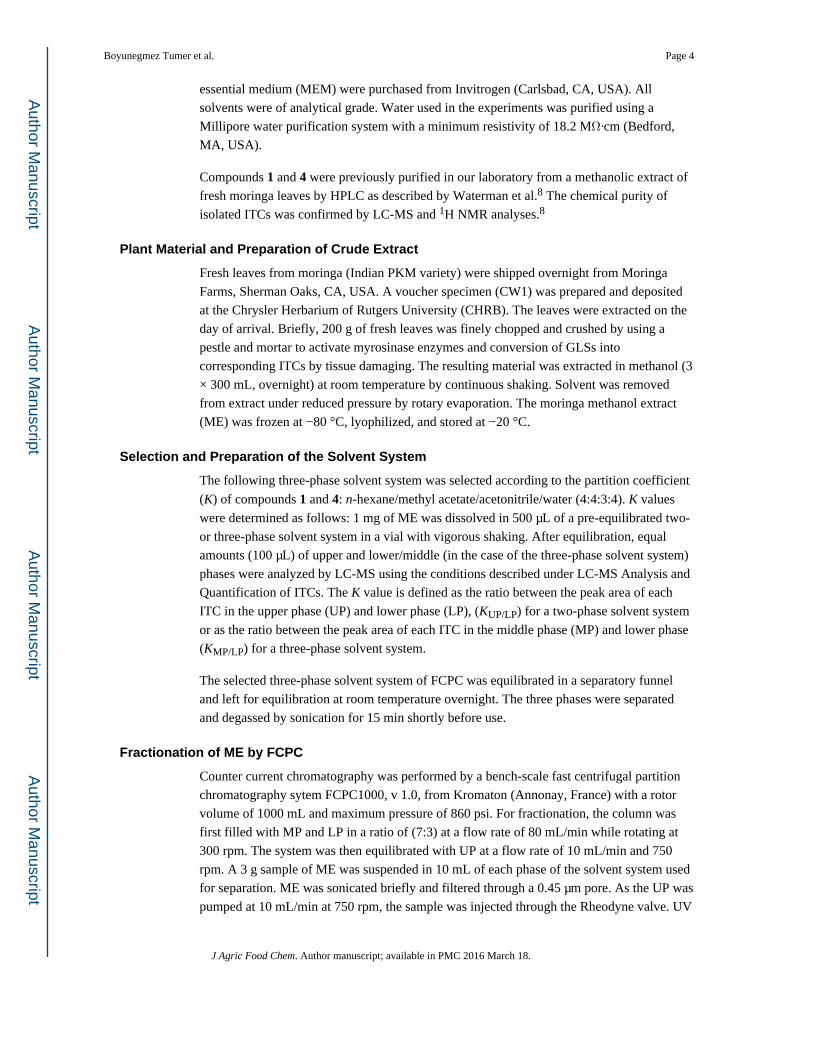
essential medium (MEM) were purchased from Invitrogen (Carlsbad, CA, USA). All
solvents were of analytical grade. Water used in the experiments was purified using a
Millipore water purification system with a minimum resistivity of 18.2 MΩ·cm (Bedford,
MA, USA).
Compounds 1 and 4 were previously purified in our laboratory from a methanolic extract of
fresh moringa leaves by HPLC as described by Waterman et al.8 The chemical purity of
isolated ITCs was confirmed by LC-MS and 1H NMR analyses.8
Plant Material and Preparation of Crude Extract
Fresh leaves from moringa (Indian PKM variety) were shipped overnight from Moringa
Farms, Sherman Oaks, CA, USA. A voucher specimen (CW1) was prepared and deposited
at the Chrysler Herbarium of Rutgers University (CHRB). The leaves were extracted on the
day of arrival. Briefly, 200 g of fresh leaves was finely chopped and crushed by using a
pestle and mortar to activate myrosinase enzymes and conversion of GLSs into
corresponding ITCs by tissue damaging. The resulting material was extracted in methanol (3
× 300 mL, overnight) at room temperature by continuous shaking. Solvent was removed
from extract under reduced pressure by rotary evaporation. The moringa methanol extract
(ME) was frozen at −80 °C, lyophilized, and stored at −20 °C.
Selection and Preparation of the Solvent System
The following three-phase solvent system was selected according to the partition coefficient
(K) of compounds 1 and 4: n-hexane/methyl acetate/acetonitrile/water (4:4:3:4). K values
were determined as follows: 1 mg of ME was dissolved in 500 µL of a pre-equilibrated two-
or three-phase solvent system in a vial with vigorous shaking. After equilibration, equal
amounts (100 µL) of upper and lower/middle (in the case of the three-phase solvent system)
phases were analyzed by LC-MS using the conditions described under LC-MS Analysis and
Quantification of ITCs. The K value is defined as the ratio between the peak area of each
ITC in the upper phase (UP) and lower phase (LP), (KUP/LP) for a two-phase solvent system
or as the ratio between the peak area of each ITC in the middle phase (MP) and lower phase
(KMP/LP) for a three-phase solvent system.
The selected three-phase solvent system of FCPC was equilibrated in a separatory funnel
and left for equilibration at room temperature overnight. The three phases were separated
and degassed by sonication for 15 min shortly before use.
Fractionation of ME by FCPC
Counter current chromatography was performed by a bench-scale fast centrifugal partition
chromatography sytem FCPC1000, v 1.0, from Kromaton (Annonay, France) with a rotor
volume of 1000 mL and maximum pressure of 860 psi. For fractionation, the column was
first filled with MP and LP in a ratio of (7:3) at a flow rate of 80 mL/min while rotating at
300 rpm. The system was then equilibrated with UP at a flow rate of 10 mL/min and 750
rpm. A 3 g sample of ME was suspended in 10 mL of each phase of the solvent system used
for separation. ME was sonicated briefly and filtered through a 0.45 µm pore. As the UP was
pumped at 10 mL/min at 750 rpm, the sample was injected through the Rheodyne valve. UV
Boyunegmez Tumer et al. Page 4
J Agric Food Chem. Author manuscript; available in PMC 2016 March 18.
Author M
anuscriptA
uthor Manuscript
Author M
anuscriptA
uthor Manuscript

detection was performed at 227 nm, and 20 mL fractions were collected every 2 min with a
CHF122 SC Advantec fraction collector (Dublin, CA, USA).
Enrichment of Fractions by SPE
FCPC fractions, particularly C, D, and E (50–100 mg), were dissolved in 1 mL of water
containing 1% acetic acid and sonicated for 10–15 min. A 3 mL SPE column with C18
absorbents (J. T. Baker, Bakerbond) was equilibrated by 3 mL of methanol followed by 3
mL of water containing 1% acetic acid. The sample solution (1 mL) was loaded into the SPE
column. The aliquots (1 mL × 3) of water (1% acetic acid) and methanol (1 mL × 3) were
successively applied into the SPE tube, and two elutes were collected separately and
evaporated to dryness. The methanol elute was used for further characterization of fractions
in terms of ITC content, total polyphenol content (TPC), ORAC, and NQO1 activity assays.
LC-MS Analysis and Quantification of ITCs
LC-MS analysis was performed using the Dionex UltiMate 3000 RSLC ultrahigh-pressure
liquid chromatography system, consisting of a workstation with Dionex Chromeleon v. 6.8
software package, solvent rack/degasser SRD-3400, pulseless chromatography pump
HPG-3400RS, autosampler WPS-3000RS, column compartment TCC-3000RS, and
photodiode array detector DAD-3000RS. After the photodiode array detector, the eluent
flow was guided to a Varian 1200L (Varian Inc., Palo Alto, CA, USA) triple-quadrupole
mass detector with electrospray ionization interface, operating in the negative ionization
mode. The voltage was adjusted to −4.5 kV, heated capillary temperature was 280 °C, and
sheath gas (zero grade compressed air) was used for the negative ionization mode. The mass
detector was used in scanning mode from 65 to 1500 atomic mass units. Data from the the
Varian 1200L mass detector were collected, compiled, and analyzed using Varian’s MS
Workstation, v. 6.9, SP2. Compounds were separated on a Phenomenex Luna C8 reversed
phase column, size 150 × 2 mm, particle size = 3 µm, pore size = 100 Å. The mobile phase
consisted of two components: solvent A (0.5% ACS grade acetic acid in double-distilled
deionized water, pH 3–3.5), and solvent B (acetonitrile). The initial conditions of the
gradient were 95% A and 5% B. The gradient progressed linearly to 5% A and 95% B over
30 min and then remained isocratic for the next 8 min. During the following 4 min, the ratio
of solvents A and B was brought to initial conditions linearly. An 8 min equilibration
interval was included between subsequent injections.
ITCs were characterized on the basis of their retention times, UV maxima, and MS
fragmentation patterns. The MS data obtained for the ITCs (1–4) gave the expected m/z
values and fragment ions that were characteristic for these compounds.8 In the current study,
the quantification of ITCs in the fractions were done by using standard curves generated for
pure 1 and 4, which were purified (>98%) previously as described by Waterman et al.8
Briefly, 1 µL LC-MS injections of compound 1 at 20, 100, and 200 ng/µL generated a
standard curve (y = 123x − 0.098, R2 = 1), and injections of compound 4 at 10, 50, and 100
ng/µL generated a standard curve (y = 104.32x − 0.098, R2 > 0.99). The concentrations of
compounds 2 and 3 in the fractions and crude extract were estimated by using the standard
curve of compound 4. All injections were repeated at least three times for either standard
Boyunegmez Tumer et al. Page 5
J Agric Food Chem. Author manuscript; available in PMC 2016 March 18.
Author M
anuscriptA
uthor Manuscript
Author M
anuscriptA
uthor Manuscript

curve generation or determination of ITC content in the fractions. Therefore, results are
represented as means ± SD of three independent measurements.
Analyses of TPC and ORAC
TPC was quantified according to a modified Folin–Ciocalteu method26 as previously
described27 and expressed as mean gallic acid equivalents (GAE) of at least three
independent experiments. ORAC was determined by using fluorescein as the fluorescent
probe and AAPH as a peroxyl radical generator in a procedure adapted from a previously
published method.28 ORAC results for fractions and ME were expressed as µM Trolox
equiv (TE)/g and directly expressed as TE for 1, 4, and SF. All samples were assayed in
triplicate. Results are presented as means ± SD.
NQO1 Induction Assay: Cell Culture and Treatment
Hepa1c1c7 mouse hepatoma cells (CRL-2026, American Type Culture Collection,
Manassas, VA, USA) were plated in 24-well tissue culture plates (Greiner Bio One,
Frickenhausen, Germany) and grown at 37 °C in a humidified incubator with 5% CO2 to
near confluence in α-MEM without ribonucleosides or deoxyribonucleosides (Invitrogen
Corp., Carlsbad, CA, USA) supplemented with 100 IU/mL penicillin, 100 mg/mL
streptomycin (Cellgro, Manassas, VA, USA), and 10% (v/v) fetal bovine serum. Confluent
cells were washed two times with PBS (1×) and incubated in serum-free α-MEM overnight
(18 h). Cells were treated in triplicate with BNF (0.05–5 µM), SF (5 µM), extract/fractions
(ME, A–C, F, 1, 5, and 10 µg/mL; D, E, 1, 2.5, and 5 µg/mL), and compounds 1 (1, 5, and
10 µM) and 4 (1, 2.5, and 5 µM) in serum-free media for 48 h. The NQO1 activity in the
cultured cells was assayed in duplicate at the end of the incubation by using an Abcam
NQO1 activity assay kit (Abcam, Cambridge, MA, USA). Briefly, cells were washed with
PBS (1×) twice and solubilized in 0.2 mL of extraction buffer supplied by the manufacturer.
Cells were scraped and incubated on ice for 15 min. Then, lysates were centrifuged at
18000g for 20 min at 4 °C. Supernatant was assayed immediately or stored at −80 °C. The
protein concentration in the supernatant was quantified by the Pierce BCA Protein Assay Kit
(Thermo Scientific, Rockford, IL, USA). The NQO1 activity was measured at 440 nm for 5
min. The linear rate of increase in absorbance was examined over time. The NQO1 activity
was normalized to total protein content of each sample to eliminate sample-to-sample
variability. NQO1 fold induction was expressed as specific activity of treatment over those
of control. Results are means ± SD of three independent experiments.
Cell Viability
Hepa1c1c7 cells were plated into 24-well plates at 1 × 10⁵ cells/well and grown for 48 h
(90% confluent), and then confluent cells were washed two times with PBS (1×) and
incubated in serum-free α-MEM overnight (18 h). ME (1–25 µg/mL), fractions (A, B, 10
and 25 µg/mL; C–F, 1–25 µg/mL), and compounds 1 and compound 4 (both 5 and 10 µM),
dissolved in ethanol (0.25% v/v final concentrations), were added to cells together with
vehicle control (ethanol alone) and incubated for an additional 48 h. The effect of treatments
on cell viability was examined by using MTT (TCI, Portland, OR, USA).29 MTT working
solution (5 mg/mL in 1× PBS) was filtered through a 0.22 µm cellulose membrane (Corning,
Boyunegmez Tumer et al. Page 6
J Agric Food Chem. Author manuscript; available in PMC 2016 March 18.
Author M
anuscriptA
uthor Manuscript
Author M
anuscriptA
uthor Manuscript

Corning, NY, USA) and added to treated cells during the last 3 h of treatment (48 h). Media
were carefully aspirated; cells were dissolved in DMSO, and the absorbance was read at 570
nm. Results are means ± SD of three independent experiments.
Statistical Analysis
Data were analyzed by one-way ANOVA followed by a Dunnett or Wilcoxon test as
indicated. Pearson’s correlation coefficients for ORAC results with TPCs were calculated
using means of triplicate measurements. For statistical analysis GraphPad Prism version
6.02 for Windows (GraphPad Software, Inc.) was used.
RESULTS AND DISCUSSION
Optimization of FCPC Solvent System
Various two-phase solvent systems for FCPC separations were tested and K values
measured for compounds 1 and 4 (Table 1). Three two-phase solvent systems n-butanol/
ethyl acetate/water, methanol/ ethyl acetate/water, and n-hexane/ethyl acetate/methanol/
water at different volume ratios could not provide acceptable partition coefficients, ideally
0.5–2.0 for efficient separation.30 The three-phase solvent system composed of n-hexane/
methyl acetate/acetonitrile/water (4:4:3:4) was selected for the current study as the best
solvent system on the basis of the optimal partition coefficient of ITCs between the MP and
LP. Accordingly, the ideal KMP/LP value obtained for 1 (1.61) together with a larger value
for 4 (5.14) suggest that relatively less hydrophilic 4 should be eluted first by MP, followed
by more hydrophilic 1 by LP. With this strategy, 1 and 4 were separated completely within a
single FCPC run even though their structure differed only by the presence of one acetyl
group.
Separation by FCPC
The UV absorption of compounds separated by FCPC in ME is shown in Figure 2. The
starting mobile UP was eluted for 100 min to obtain hydrophobic compounds and then
switched to MP to elute moderately hydrophilic compounds for 100 min. Finally, the highly
polar compounds were separated by eluting the column with LP for 150 min. LC-MS
analyses revealed that fractions A, collected between 0 and 92 min (393 mg; 13.1%), and B,
collected between 94 and 172 min (231 mg; 7.7%), were composed of nonpolar compounds
such as fatty acids and chlorophylls. Fractions C, collected between 176 and 196 min (111
mg; 3.7%), D, collected between 198 and 204 min (123 mg; 4.1%), and E, collected between
206 and 224 min (108 mg; 3.6%), contained high levels of compounds 1–4 (Figure 3). The
UV profile of fraction C showed compound 4 representing 94% of the total peak area
(Figure 3A) and fraction E with compound 1 at 87% of total peak area (Figure 3C),
demonstrating efficient separation of these two structurally similar compounds by FCPC.
Fraction D contained all ITCs (1–4) together with niazicin A (see enlarged representation in
Figure 3B). Fraction F (2.014 g, 67%), eluted between 226 and 360 min (Figure 2),
contained the majority of polyphenolic compounds.
Boyunegmez Tumer et al. Page 7
J Agric Food Chem. Author manuscript; available in PMC 2016 March 18.
Author M
anuscriptA
uthor Manuscript
Author M
anuscriptA
uthor Manuscript

Enrichment by SPE
ITCs 1–4 were quantified in fractions C, D, and E before and after SPE by LC-MS analysis
as previously described6 and expressed as percent of fraction dry weight (DW). There was
significant enrichment in the total concentration of ITCs (1–4), after SPE in all three
fractions (Figure 4). The concentration of ITCs (1–4) was increased by 3.7-fold in fraction
C-SPE, yielding concentrations of 1.62 ± 0.07% (1), 1.50 ± 0.01% (2), 1.66 ± 0.11% (3),
and 5.4 ± 0.08% (4) of fraction DW. Fraction D-SPE was enriched by 2.1-fold yielding
concentrations of 6.41 ± 0.01% (1), 4.00 ± 0.05% (2), 1.85 ± 0.05% (3), and 5.18 ± 0.06%
(4) of fraction DW. The highest enrichment (15-fold) was observed in fraction E, initially
containing 2.0% (±0.14) of 4 and increasing to 30% (±0.43) of fraction DW after SPE.
Overall, fractions obtained by FCPC/SPE contained higher percentage values of 1–4 when
compared to the crude extract, which contained 1.46% (±0.05) of 1, 1.36% (±0.07) of 4, and
undetectable amounts of 2 and 3. These results demonstrated an efficient method to
concentrate ITCs for bioassay applications or for further purification by HPLC.
TPC and ORAC
Generally, phenolic compounds are direct antioxidants, which can effectively scavenge
and/or chelate readily oxidizable reactive compounds. Moringa extracts and fractions
containing phenolic acids (chlorogenic acid, ellagic acids) and flavonoids (mostly quercetin,
kaempferol, and rutin) possess direct antioxidant activity in several in vitro assays including
β-carotene bleaching, ferric reducing, DPPH/super-oxide/hydroxyl radical scavenging, and
lipid peroxidation.18,31 However, there have not been any studies evaluating the role of
moringa ITCs in direct antioxidant activity. Therefore, we evaluated the direct antioxidant
capacity of moringa FCPC fractions containing different classes of compounds ranging from
essential oils and chlorophylls to ITCs and polyphenols by using the in vitro ORAC assay.
ORAC provides an improved analysis technique for direct antioxidant capacity by
measuring the inhibition of the peroxyl radical (predominant free radical in biological
system) damage over a time course and combining these factors into a single “area under
curve” (AUC) quantity.32 We also measured TPC of each fraction to establish the
contribution of polyphenol components of moringa to direct antioxidant capacity (Figure
5A).
As seen in Figure 5A, the highest ORAC value was obtained for ME (12721 ± 310 µmol
TE/g extract) with the highest TPC (18.1 ± 0.3 mg GAE/100 mg). The ORAC of ME was
higher than reported values for coffee powder (10007 µmol TE/g), black tea leaves (1566–
1629 µmol TE/g), grape seeds (11681–11889 µmol TE/g), and blueberry extracts (2441–
2792 µmol TE/g), which have been noted for their high antioxidant values.32,33 Although
TPC of fraction F was 2.6 times less than TPC of ME, the ORAC of fraction F (12452 ± 488
TE/g) was not significantly different from the ORAC of the ME. The LC-MS analysis of
fraction F showed much higher peak areas of rutin, chlorogenic acid, and quercetin-
malonylglucoside compared to the ME, suggesting these polyphenols concentrated in
fraction F play a significant role in the observed high direct antioxidant activity.
In SPE-enriched ITC fractions C, D, and E, the ORAC values were found to be moderate,
almost 2–3 times less than that of fraction F. Statistical analyses performed for these
Boyunegmez Tumer et al. Page 8
J Agric Food Chem. Author manuscript; available in PMC 2016 March 18.
Author M
anuscriptA
uthor Manuscript
Author M
anuscriptA
uthor Manuscript
fractions revealed that, although ORAC values were significantly correlated (r = 0.99, p <
0.05) with TPC, they did not correlate with total ITC content. These findings support the
role of moringa polyphenols as direct antioxidants, however, leaving the role of ITCs
uncertain. For further investigation, we determined the ORAC of compounds 1 and 4 in
comparison to SF, which has no direct antioxidant activity.34 Figure 5B reports the linear
regression analyses of trolox, compounds 1 and 4 (ranging from 1.25 to 12.5 µM), and SF
(12.5–62.5 µM) with respect to their net AUC value. SF was found to have the lowest
ORAC value (0.09 TE); however, both 1 (0.54 TE) and 4 (0.38 TE) had 6 and 4.2 times
higher (p < 0.0001) ORAC compared to SF. This relatively high antioxidant capacity of
compounds 1 and 4 most likely can be attributed to the presence of an aromatic side chain
and increased stability of molecules due to the presence of a rhamnose sugar moiety (Figure
1B). On the basis of previous papers, ORAC values of 1 and 4 are considerably lower than
those of other direct acting phenolic compounds such as quercetin (7.28 TE), rutin (6.01
TE), and chlorogenic acid (3.14 TE).33 On the other hand, the similarity of our data to the
ORAC of some physiologically active endogenous antioxidants such as glutathione (0.57
TE) and ascorbic acid (0.75 TE)35 suggests that moringa ITCs may act as direct
antioxidants.
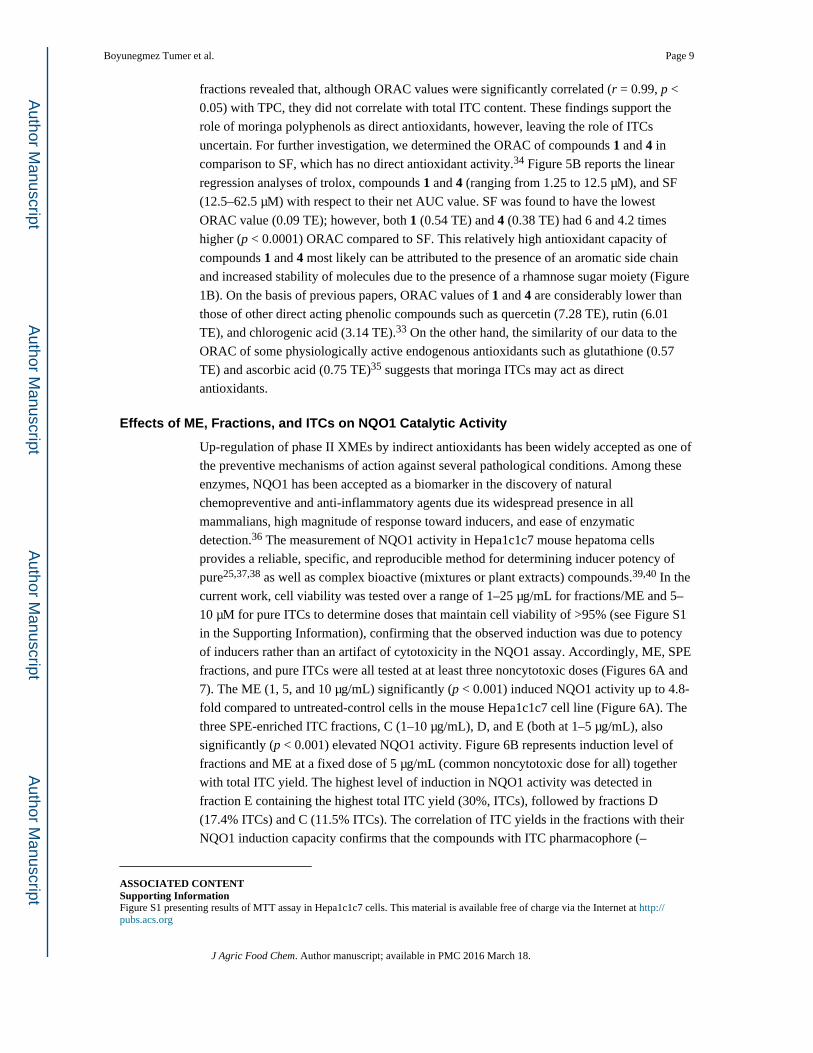
Effects of ME, Fractions, and ITCs on NQO1 Catalytic Activity
Up-regulation of phase II XMEs by indirect antioxidants has been widely accepted as one of
the preventive mechanisms of action against several pathological conditions. Among these
enzymes, NQO1 has been accepted as a biomarker in the discovery of natural
chemopreventive and anti-inflammatory agents due its widespread presence in all
mammalians, high magnitude of response toward inducers, and ease of enzymatic
detection.36 The measurement of NQO1 activity in Hepa1c1c7 mouse hepatoma cells
provides a reliable, specific, and reproducible method for determining inducer potency of
pure25,37,38 as well as complex bioactive (mixtures or plant extracts) compounds.39,40 In the
current work, cell viability was tested over a range of 1–25 µg/mL for fractions/ME and 5–
10 µM for pure ITCs to determine doses that maintain cell viability of >95% (see Figure S1
in the Supporting Information), confirming that the observed induction was due to potency
of inducers rather than an artifact of cytotoxicity in the NQO1 assay. Accordingly, ME, SPE
fractions, and pure ITCs were all tested at at least three noncytotoxic doses (Figures 6A and
7). The ME (1, 5, and 10 µg/mL) significantly (p < 0.001) induced NQO1 activity up to 4.8-
fold compared to untreated-control cells in the mouse Hepa1c1c7 cell line (Figure 6A). The
three SPE-enriched ITC fractions, C (1–10 µg/mL), D, and E (both at 1–5 µg/mL), also
significantly (p < 0.001) elevated NQO1 activity. Figure 6B represents induction level of
fractions and ME at a fixed dose of 5 µg/mL (common noncytotoxic dose for all) together
with total ITC yield. The highest level of induction in NQO1 activity was detected in
fraction E containing the highest total ITC yield (30%, ITCs), followed by fractions D
(17.4% ITCs) and C (11.5% ITCs). The correlation of ITC yields in the fractions with their
NQO1 induction capacity confirms that the compounds with ITC pharmacophore (–
ASSOCIATED CONTENTSupporting InformationFigure S1 presenting results of MTT assay in Hepa1c1c7 cells. This material is available free of charge via the Internet at http://pubs.acs.org
Boyunegmez Tumer et al. Page 9
J Agric Food Chem. Author manuscript; available in PMC 2016 March 18.
Author M
anuscriptA
uthor Manuscript
Author M
anuscriptA
uthor Manuscript

N═C═S group) are highly effective in inducing indirect antioxidant activity. Fractions A
and B, which do not contain ITCs, showed NQO1 activity at the same low level as the
control, indicating the fatty acids and chlorophylls do not have any indirect antioxidant
activity.
Similarly, fraction F did not induce NQO1 activity even at the relatively high dose (10
µg/mL; Figure 6A), indicating polyphenols present in this fraction (predominantly
hydroxylated flavones, quercetin 3-O-rutinoside, quercetin 3-O-(6″-malonylglucoside), and
5-caffeoylquinic acid) do not possess indirect antioxidant capacity, confirming a recent
study which showed that hydroxylated flavones are ineffective at inducing cytoprotective
enzymes, despite having substantial direct antioxidant activity.41 However, other classes of
polyphenols, including methoxylated flavones, have been shown to significantly increase
NQO1 and elicit cytoprotective enzyme activity.20,38 Accordingly, we observed a clear
dose-dependent induction pattern in cells treated with β-naphthoflavone (5,6-benzoflavone,
BNF) (Figure 6B), a classical phenolic inducer of NQO1,42 confirming the sensitivity of the
cells to certain polyphenols under our experimental conditions.
As seen in Figure 7, in addition to the ME and FCPC fractions, compounds 1 (1–10 µM) and
4 (1–5 µM) were tested for their NQO1 inducer capacities in comparison to SF (5 µM).
Previously, it was shown that SF is the most potent inducer of NQO1 activity, reaching a
maximum induction of 3–5-fold between 2.5 and 8 µM concentrations.25,37,43 In accordance
with these studies, the current work showed 5 µM SF induced NQO1 activity 4.2-fold. At
this concentration, compounds 1 and 4 induced NQO1 activity 4.3-and 3.9-fold,
respectively, showing that SF and ITCs (1, 4) from moringa are equipotent inducers of
NQO1. For compound 1, concentrations of 10 µM did not cause any greater induction than 5
µM did. Similarly, a dose response could not be observed from 1 to 5 µM for compound 4,
indicating that a clear dose-dependent response occurs under 1 µM dose range. To our
knowledge, this is the first study demonstrating that moringa ITCs can significantly induce
NQO1 activity at such low concentrations; therefore, it may be a practical dietary alternative
to SF from broccoli due to increased stability as previously shown.
In summary, the separation and concentration of distinct classes of compounds in moringa
leaves, namely, phenolics and ITCs, were successfully achieved through FCPC fractionation
followed by SPE. These enriched fractions allowed direct and indirect antioxidant analysis,
distinguishing which phytochemicals are responsible for differential antioxidant mechanism.
We determined that the polyphenol-rich fraction had high ORAC, indicating strong direct
antioxidant activity, whereas ITC-enriched fractions, compounds 1 and 4, effectively
induced NQO1 activity, representing their potent indirect antioxidant activity.
The unique combination of direct (polyphenols) and indirect (ITCs) antioxidant compounds
in moringa provides justification and support for the therapeutic uses of polyphenol-and
ITC-enriched moringa products. One of the major findings of this study is that compounds 1 and 4 are as potent as SF in inducing NQO1 activity. This indirect antioxidant potency of
moringa ITCs, combined with their unique chemical stability and anti-inflammatory activity,
makes them attractive food-based therapeutic alternatives to unstable ITCs such as SF.
Health-related applications will require the purification of ITCs (1–4) in significant
Boyunegmez Tumer et al. Page 10
J Agric Food Chem. Author manuscript; available in PMC 2016 March 18.
Author M
anuscriptA
uthor Manuscript
Author M
anuscriptA
uthor Manuscript
quantities. The large-scale fractionation followed by SPE enrichment techniques reported
here may provide an efficient strategy for ITC isolation.
Acknowledgments
Funding
This study was supported by a Botanical Research Center Pilot Program Sub award 5P50AT002776-08 S12-50318 and P50AT002776-01 from the National Center for Complementary and Alternative Medicine (NCCAM) and the Office of Dietary Supplements (ODS). C.W. was also supported by NIH Training Grant T32:5T32AT004094-04. P.R.-S. was supported by the SENESCYT 2011 Fellowship from Ecuador. T.B.T. was supported by a postdoctoral research grant of the Higher Education Council of Turkey.
REFERENCES
1. Dinkova-Kostova AT, Kostov RV. Glucosinolates and isothiocyanates in health and disease. Trends Mol. Med. 2012; 18:337–347. [PubMed: 22578879]
2. Traka M, Mithen R. Glucosinolates, isothiocyanates and human health. Phytochem. Rev. 2009; 8:269–282.
3. Sønderby IE, Geu-Flores F, Halkier BA. Biosynthesis of glucosinolates – gene discovery and beyond. Trends Plant. Sci. 2010; 15:283–290. [PubMed: 20303821]
4. Koroleva OA, Gibson TM, Cramer R, Stain C. Glucosinolate-accumulating S-cells in Arabidopsis leaves and flower stalks undergo programmed cell death at early stages of differentiation. Plant J. 2010; 64:456–469. [PubMed: 20815819]
5. Siegfried, J. Cyanogenic plants. In: Rizk, AM., editor. Poisonous Plant Contamination of Edible Plants. 1st. Boca Raton, FL, USA: CRC Press; 1991.
6. Kawakishi S, Kaneko T. Interaction of proteins with allyl isothiocyanate. J. Agric. Food Chem. 1987; 35:85–88.
7. Franklin SJ, Dickinson SE, Karlage KL, Bowden GT, Myrdal PB. Stability of sulforaphane for topical formulation. Drug Dev. Ind. Pharm. 2014; 40:494–502. [PubMed: 23611476]
8. Waterman C, Cheng DM, Rojas-Silva P, Poulev A, Dreifus J, Lila MA, Raskin I. Stable, water extractable isothiocyanates from Moringa oleifera leaves attenuate inflammation in vitro. Phytochemistry. 2014; 103:114–122. [PubMed: 24731259]
9. Brunelli D, Tavecchio M, Falcioni C, Frapolli R, Erba E, Iori R, Rollin P, Barillari J, Manzotti C, Morazzoni P, D’Incalci M. The isothiocyanate produced from glucomoringin inhibits NF-κB and reduces myeloma growth in nude mice in vivo. Biochem. Pharmacol. 2010; 79:1141–1148. [PubMed: 20006591]
10. Cheenpracha S, Park EJ, Yoshida WY, Barit C, Wall M, Pezzuto JM, Chang LC. Potential anti-inflammatory phenolic glycosides from the medicinal plant Moringa oleifera fruits. Bioorg. Med. Chem. 2010; 18:6598–6602. [PubMed: 20685125]
11. Park EJ, Cheenpracha S, Chang LC, Kondratyuk TP, Pezzuto JM. Inhibition of lipopolysaccharide-induced cyclooxygenase-2 and inducible nitric oxide synthase expression by 4-[(2′-O-acetyl-α-l-rhamnosyloxy)benzyl]isothiocyanate from Moringa oleifera. Nut. Cancer. 2011; 63:971–982.
12. Bennett RN, Mellon FA, Foidl N, Pratt JH, Dupont MS, Perkins L, Kroon PA. Profiling glucosinolates and phenolics in vegetative and reproductive tissues of the multi-purpose trees Moringa oleifera L. (horseradish tree) and Moringa stenopetala L. J. Agric. Food Chem. 2003; 51:3546–3553. [PubMed: 12769522]
13. Shibusawa Y, Yamakawa Y, Noji R, Yanagida A, Shindo H, Ito Y. Three-phase solvent systems for comprehensive separation of a wide variety of compounds by high-speed counter-current chromatography. J. Chromatogr., A. 2006; 10:119–125. [PubMed: 16920128]
14. Mbikay M. Therapeutic potential of Moringa oleifera leaves in chronic hyperglycemia and dyslipidemia: a review. Front. Pharmacol. 2012; 3:1–12. [PubMed: 22291651]
15. Fahey JW. Moringa oleifera: a review of the medical evidence for its nutritional, therapeutic, and prophylactic properties. Trees Life J. 2005; 1:5.
Boyunegmez Tumer et al. Page 11
J Agric Food Chem. Author manuscript; available in PMC 2016 March 18.
Author M
anuscriptA
uthor Manuscript
Author M
anuscriptA
uthor Manuscript

16. Jung IL. Soluble extract from Moringa oleifera leaves with a new anticancer activity. PLoS One. 2014; 9(4):e95492. [PubMed: 24748376]
17. Dinkova-Kostova AT, Talalay P. Direct and indirect antioxidant properties of inducers of cytoprotective proteins. Mol. Nutr. Food Res. 2008; 52:S128–S138. [PubMed: 18327872]
18. Verma AR, Vijayakumar M, Mathela CS, Rao CV. In vitro and in vivo antioxidant properties of different fractions of Moringa oleifera leaves. Food Chem. Toxicol. 2009; 47:2196–2201. [PubMed: 19520138]
19. Fahey JW, Stephenson KK. Pinostrobin from honey and Thai ginger (Boesenbergia pandurata): a potent flavonoid inducer of mammalian phase 2 chemoprotective and antioxidant enzymes. J. Agric. Food Chem. 2002; 50:7472–7476. [PubMed: 12452678]
20. Dinkova-Kostova AT, Massiah MA, Bozak RE, Hicks RJ, Talalay P. Potency of Michael reaction acceptors as inducers of enzymes that protect against carcinogenesis depends on their reactivity with sulfhydryl groups. Proc. Natl. Acad. Sci. U.S.A. 2001; 98:3404–3409. [PubMed: 11248091]
21. Ernster L, Navazio F. Soluble diaphorases in animal tissues. Acta Chem. Scand. 1958; 12:595–602.
22. Iskander K, Jaiswal AK. Quinone oxido reductases in protection against myelogenous hyperplasia and benzene toxicity. Chem. – Biol. Interact. 2005:153–154. 147–157. [PubMed: 16289500]
23. Smith MT, Wang Y, Skibola CF, Slater DJ, LoNigro L, Nowell PC, Lange BJ, Felix CA. Low NAD(P)H: quinone oxidoreductase activity is associated with increased risk of leukemia with MLL translocations in infants and children. Blood. 2002; 100:4590–4593. [PubMed: 12393620]
24. Fahey JW, Dinkova-Kostova AT, Stephenson KK, Talalay P. The “Prochaska” microtiter plate bioassay for inducers of NQO1. Methods Enzymol. 2004; 382:243–258. [PubMed: 15047106]
25. Zhang YS, Talalay P, Cho CG, Posner GH. A major inducer of anticarcinogenic protective enzymes from broccoli – isolation and elucidation of structure. Proc. Natl. Acad. Sci. U.S.A. 1992; 89:2399–2403. [PubMed: 1549603]
26. Singleton V, Rossi JA. Colorimetry of total phenolics with phosphomolybdic-phosphotungstic acid reagents. Am. J. Enol. Vitic. 1965; 16:144–158.
27. Cheng DM, Kuhn P, Poulev A, Rojo LE, Lila MA, Raskin I. In vivo and in vitro antidiabetic effects of aqueous cinnamon extract and cinnamon polyphenol-enhanced food matrix. Food Chem. 2010; 135:2994–3002. [PubMed: 22980902]
28. Prior RL, Hoang H, Gu L, Wu X, Bacchiocca M, Howard L, Hampsch-Woodill M, Huang D, Ou B, Jacob R. Assays for hydrophilic and lipophilic antioxidant capacity (oxygen radical absorbance capacity (ORAC(FL))) of plasma and other biological and food samples. J. Agric. Food Chem. 2003; 51:3273–3279. [PubMed: 12744654]
29. Mosmann T. Rapid colorimetric assay for cellular growth and survival: application to proliferation and cytotoxicity assays. J. Immunol. Methods. 1983; 65:55–63. [PubMed: 6606682]
30. Ito Y. Golden rules and pitfalls in selecting optimum conditions for high-speed counter-current chromatography. J. Chromatogr., A. 2005; 1065:145–168. [PubMed: 15782961]
31. Siddhuraju P, Becker K. Antioxidant properties of various solvent extracts of total phenolic constituents from three different agroclimatic origins of drumstick tree (Moringa oleifera Lam.) leaves. J. Agric. Food Chem. 2003; 51:2144–2155. [PubMed: 12670148]
32. Huang D, Ou B, Hampsch-Woodill M, Flanagan JA, Prior RL. High-throughput assay of oxygen radical absorbance capacity (ORAC) using a multichannel liquid handling system coupled with a microplate fluorescence reader in 96-well format. J. Agric. Food Chem. 2002; 50:4437–4444. [PubMed: 12137457]
33. Ou B, Hampsch-Woodill M, Prior RL. Development and validation of an improved oxygen radical absorbance capacity assay using fluorescein as the fluorescent probe. J. Agric. Food Chem. 2001; 49:4619–4626. [PubMed: 11599998]
34. Fahey JW, Talalay P. Antioxidant functions of sulforaphane: a potent inducer of phase II detoxication enzymes. Food Chem. Toxicol. 1999; 37:973–979. [PubMed: 10541453]
35. Benedetti S, Benvenuti F, Scoglio S, Canestrari F. Oxygen radical absorbance capacity of phycocyanin and phycocyanobilin from the food supplement Aphanizomenon f los-aquae. J. Med. Food. 2010; 13:223–227. [PubMed: 20136460]
Boyunegmez Tumer et al. Page 12
J Agric Food Chem. Author manuscript; available in PMC 2016 March 18.
Author M
anuscriptA
uthor Manuscript
Author M
anuscriptA
uthor Manuscript

36. Talalay P, Fahey JW. Phytochemicals from cruciferous plants protect against cancer by modulating carcinogen metabolism. J. Nutr. 2001; 131:3027S–3033S. [PubMed: 11694642]
37. Matusheski NV, Jeffery EH. Comparison of the bioactivity of two glucoraphanin hydrolysis products found in broccoli, sulforaphane and sulforaphane nitrile. J. Agric. Food Chem. 2001; 49:5743–5749. [PubMed: 11743757]
38. Uda Y, Price KR, Williamson G, Rhodes MJ. Induction of the anticarcinogenic marker enzyme, quinone reductase, in murine hepatoma cells in vitro by flavonoids. Cancer Lett. 1997; 120:213–216. [PubMed: 9461039]
39. Hashimoto K, Kawamata S, Usui N, Tanaka A, Uda Y. In vitro induction of the anticarcinogenic marker enzyme, quinone reductase, in human hepatoma cells by food extracts. Cancer Lett. 2002; 180:1–5. [PubMed: 11911963]
40. Chandra S, De Mejia Gonzalez E. Polyphenolic compounds, antioxidant capacity, and quinone reductase activity of an aqueous extract of Ardisia compressa in comparison to mate (Ilex paraguariensis) and green (Camellia sinensis) teas. J. Agric. Food Chem. 2004; 52:3583–3589. [PubMed: 15161234]
41. Tsuji PA, Stephenson KK, Wade KL, Liu H, Fahey JW. Structure-activity analysis of flavonoids: direct and indirect antioxidant, and antiinflammatory potencies and toxicities. Nutr. Cancer. 2013; 65:1014–1025. [PubMed: 24087992]
42. Kohle C, Bock KW. Activation of coupled Ah receptor and Nrf2 gene batteries by dietary phytochemicals in relation to chemoprevention. Biochem. Pharmacol. 2006; 72:795–805. [PubMed: 16780804]
43. Gerhäuser C, You M, Liu J, Moriarty RM, Hawthorne M, Mehta RG, Moon RC, Pezzuto JM. Cancer chemopreventive potential of sulforamate, a novel analogue of sulforaphane that induces phase 2 drug-metabolizing enzymes. Cancer Res. 1997; 57:272–278. [PubMed: 9000567]
Boyunegmez Tumer et al. Page 13
J Agric Food Chem. Author manuscript; available in PMC 2016 March 18.
Author M
anuscriptA
uthor Manuscript
Author M
anuscriptA
uthor Manuscript
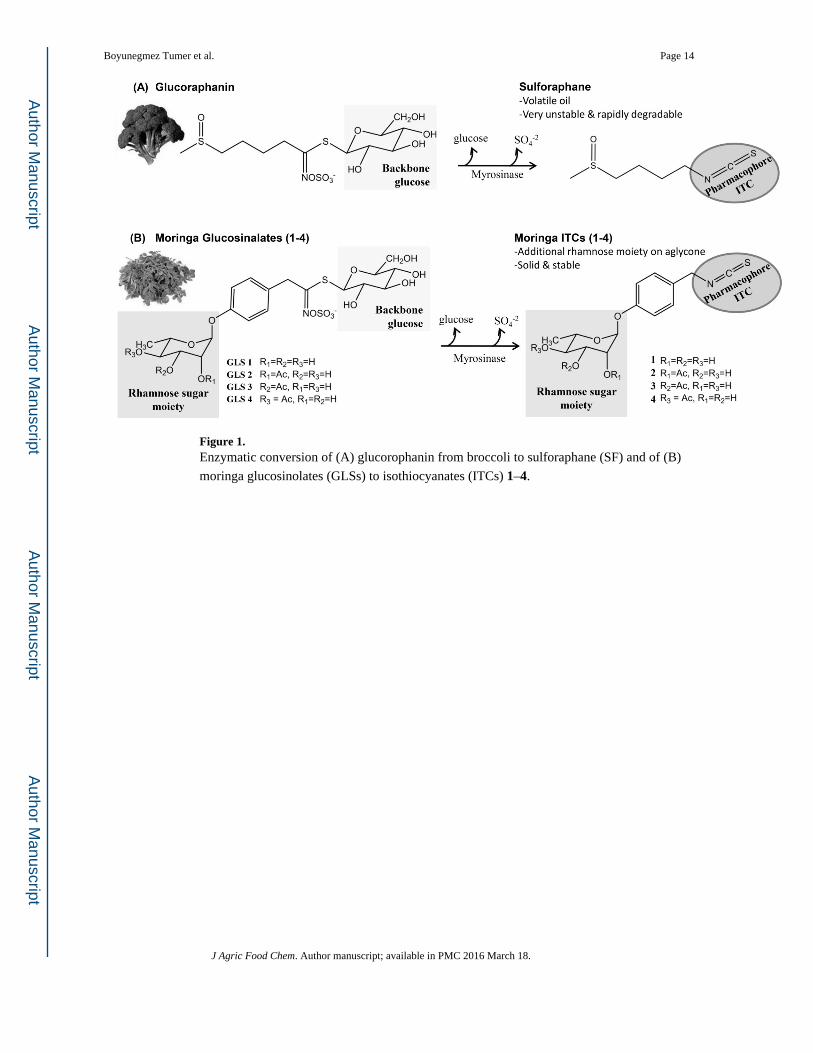
Figure 1. Enzymatic conversion of (A) glucorophanin from broccoli to sulforaphane (SF) and of (B)
moringa glucosinolates (GLSs) to isothiocyanates (ITCs) 1–4.
Boyunegmez Tumer et al. Page 14
J Agric Food Chem. Author manuscript; available in PMC 2016 March 18.
Author M
anuscriptA
uthor Manuscript
Author M
anuscriptA
uthor Manuscript

Figure 2. Fractionation chromatogram of moringa methanolic leaf extract (ME) by fast centrifugal
partition chromatography (FCPC) using n-hexane/methyl acetate/acetonitrile/water (4:4:3:4)
three-phase solvent system.
Boyunegmez Tumer et al. Page 15
J Agric Food Chem. Author manuscript; available in PMC 2016 March 18.
Author M
anuscriptA
uthor Manuscript
Author M
anuscriptA
uthor Manuscript

Figure 3. LC-MS analysis of fractions C, D, and E. (A) Fraction C. Elution peak corresponds to
compound 4; UV spectra of ITCs 2–4 (isomers) are also presented on the right. (B) Fraction
D. Elution peaks seen in the inset correspond to 1, niazicin A, and 2–4, respectively. (C)
Fraction E. Elution peak corresponds to compound 1; UV spectra are also presented on the
right.
Boyunegmez Tumer et al. Page 16
J Agric Food Chem. Author manuscript; available in PMC 2016 March 18.
Author M
anuscriptA
uthor Manuscript
Author M
anuscriptA
uthor Manuscript

Figure 4. ITCs (1–4) as percent of fraction dry weight (DW) before and after solid phase extraction
(SPE).
Boyunegmez Tumer et al. Page 17
J Agric Food Chem. Author manuscript; available in PMC 2016 March 18.
Author M
anuscriptA
uthor Manuscript
Author M
anuscriptA
uthor Manuscript

Figure 5. (A) Oxygen radical absorbance capacity (ORAC) and total polyphenol content (TPC) of
fractions (A–F) and moringa methanol extract (ME). ORAC was determined as µmol Trolox
equiv (TE)/g. TPC was determined as mg gallic acid equiv/100 mg extract or fractions. (B)
Linear regression of ORAC value as a function of the concentration (µM) of Trolox (y =
1.534x ± 0.017; r = 0.999), 1 (y = 0.824x ± 0.042; r = 0.989), 4 (y = 0.576x ± 0.042; r =
0.989), and SF (y = 0.1494x ± 0.0048; r = 0.996). The table on the graph shows TE values of
each ITC calculated by slope of compound/slope of trolox. The net AUCs were calculated
Boyunegmez Tumer et al. Page 18
J Agric Food Chem. Author manuscript; available in PMC 2016 March 18.
Author M
anuscriptA
uthor Manuscript
Author M
anuscriptA
uthor Manuscript

by subtracting AUC of blank (75 mM potassium phosphate buffer at pH 7.4) from AUC of
sample. Data represent the mean of three independent experiments.
Boyunegmez Tumer et al. Page 19
J Agric Food Chem. Author manuscript; available in PMC 2016 March 18.
Author M
anuscriptA
uthor Manuscript
Author M
anuscriptA
uthor Manuscript

Figure 6. Effect of moringa methanol extract (ME) and its FCPC fractions (A–F) on the induction of
NQO1 catalytic activity (treated/untreated) in Hepa1c1c7 cells (A) at three different
noncytotoxic doses and (B) at fixed common noncytotoxic doses (5 µg/mL) in comparison
with corresponding ITC concentration (1–4, % by DW) in each fraction. β-Naphthoflavone
was used as a positive control. Data represent the mean of three experiments ± SD; ***, p <
0.001.
Boyunegmez Tumer et al. Page 20
J Agric Food Chem. Author manuscript; available in PMC 2016 March 18.
Author M
anuscriptA
uthor Manuscript
Author M
anuscriptA
uthor Manuscript
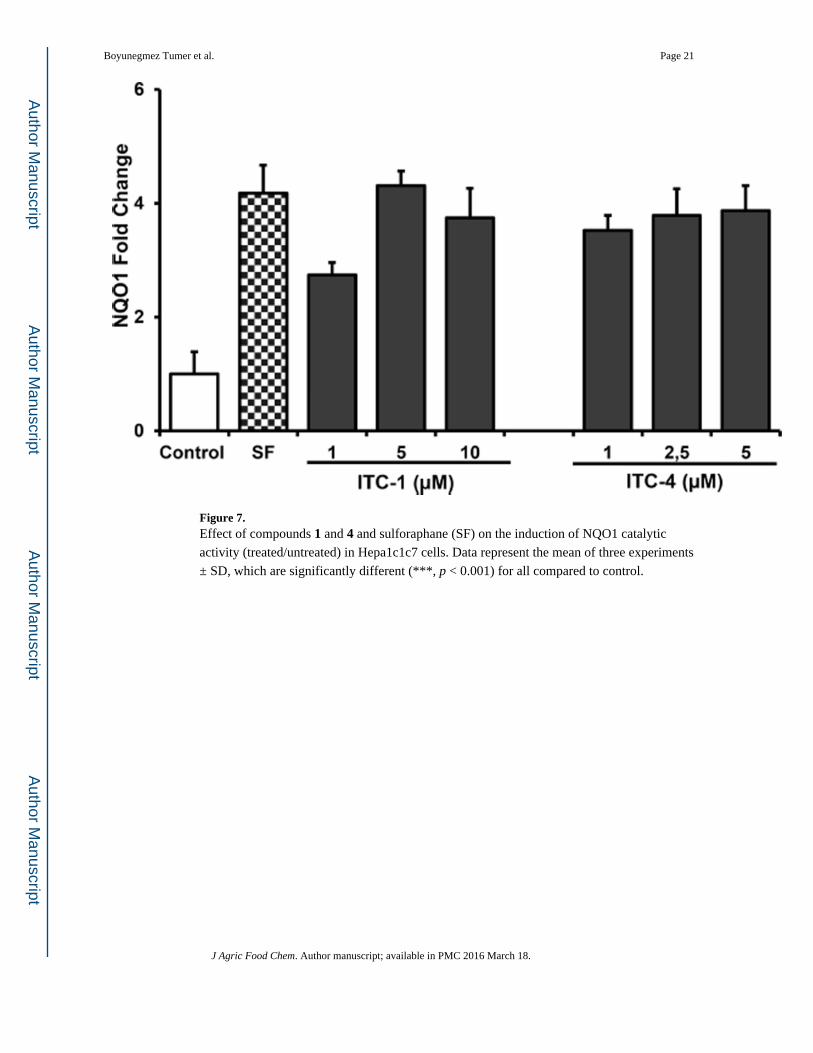
Figure 7. Effect of compounds 1 and 4 and sulforaphane (SF) on the induction of NQO1 catalytic
activity (treated/untreated) in Hepa1c1c7 cells. Data represent the mean of three experiments
± SD, which are significantly different (***, p < 0.001) for all compared to control.
Boyunegmez Tumer et al. Page 21
J Agric Food Chem. Author manuscript; available in PMC 2016 March 18.
Author M
anuscriptA
uthor Manuscript
Author M
anuscriptA
uthor Manuscript

Author M
anuscriptA
uthor Manuscript
Author M
anuscriptA
uthor Manuscript
Boyunegmez Tumer et al. Page 22
Table 1
Partition Coefficients (K) of 1 and 4 in Various Solvent Systems
partitioncoefficienta (K)
solvent system ratio 1 4
n-butanol/ethyl acetate/water 1:1.5:2.5 28.5 74.5
methanol/ethyl acetate/water 1:3:2 3.97 9.66
1:2:2 3.97 8.24
n-hexane/ethyl acetate/methanol/water 4:6:4:6 0.01 0.03
3:7:4:6 0.09 0.37
3:7:3:7 0.02 0.10
35:100:35:100 0.02 0.07
n-hexane/methyl acetate/acetonitrile/waterb 4:4:3:4 1.61c 5.14c
aExpressed as concentration at upper phase/concentration at lower phase.
bSolvent system used in the current study.
cThree-phase solvent system: concentration at middle phase/concentration at lower phase.
J Agric Food Chem. Author manuscript; available in PMC 2016 March 18.