Embed Size (px)
Citation preview

Turbine Spacing. Rows are perpendicular to prevailing wind direction. Turbines are spaced about 3 top heights apart in the rows, with about 10 top heights between rows.

Determine My Time of Day, Hub Height and Swept Area and Manufacturer


Specs GE 1.5sle GE 1.5xle GE 2.5 MB 2.4 CommentsRated Output - MW 1.5 1.5 2.5 2.4Rated Wind Speed - m/s 12.5 11.5 12.5 11.5Hub Height - m 65 80 85 80Rotor Diameter D - m 77 82.5 100 102Swept Area - m^2 4657 5346 7854 8171Cut-in Wind Speed - m/s 3.5 3.5 3.0 3.0Cut-Out Wind Speed - m/s 25.0 20.0 25.0 25.0Rated Blade RPM 20 15Blade Length - m 49.7Voltage 690 690Rated Generator RPM 1200
CalculationsTip Top - m 103.5 121.3 135.0 131.0Tip Bottom - m 26.5 38.8 35.0 29.0PI * D^2 / 4 - m2 4657 5346 7854 8171Tip Speed - m/s 81 80 About 80 m/sTip Speed Ratio 6.5 7.0 6 to 7Wind Power Density (KA=KT=1) at Rated Wind Speed - W/m^2 1196 932 1196 932 About 1 kW/m^2Wind Power at Rated Wind Speed - MW 5.6 5.0 9.4 7.6Rated Output MW / Wind Power at Rated Speed MW 0.27 0.30 0.27 0.32 About 0.3Wind Speed(tip top) / Wind Speed (tip bottom), for alpha = 1/7th 1.21 1.18 1.21 1.24Wind Speed(tip top) / Wind Speed (tip bottom), for alpha = 0.1 1.15 1.12 1.14 1.16
Wind Pressure(tip top) / Wind Pressure (tip bottom), for alpha = 1/7th 1.46 1.39 1.46 1.54Wind Pressure(tip top) / Wind Pressure (tip bottom), for alpha = 0.1 1.32 1.25 1.30 1.35 About 1.5
Other Comments1. 100 m tip-top gets you 1.5 MW, 150 m tip-top gets you 2.5 MW. So, MW varies approx. by the square of tip-top height.2. Required footprint per turbine is 3 tip-top heights perpendicular to prevailing wind direction, and 10 tip-tops in the prevailing wind direction3. Both footprint and MW vary by the square of tip-top height, and the ratio is about 1.5 MW / 300 / 1000 = 1.5 MW / 0.3 km^2,which is about 5 MW per km^2.4. Conversion factors: 1609 m/mile. 12.5 m/s = 28 mph. 80 m/s = 178 mph.


Each Annotation Falls Into a Category
•Wind gen artificially held back
•Not enough gen –makes some money
•Significant unit trip
•Winter started
•Rush hour
•Not rush hour
•How big compared to summer peak?
•Wind gen in phase with load
•Clocks approaching correction tolerance limit
•Wind gen too high

These are all lift-type (the sweep surface faces the wind)
Blue font and lines – need to know

Too much interference from tower
Not high enough above ground
These are suitable for utility-scale generation

Wind
Drag-Type - not suitable for serious power

1 mile = 1609 m
4 m/s cut-in 25 m/s cut out12.5 m/s rated power
56
25
Pmax region, pitch regulated to hold Pmax
cubic


May 2003
Desert Sky Desert Sky Wind FarmWind Farm
www.desertskywind.com

May 2003
Desert Sky Wind Farm Desert Sky Wind Farm -- MapMap
• Dallas - 400 Miles• San Antonio - 266 Miles • Odessa - 90 Miles
• Ft. Stockton - 50 miles• McCamey - 20 Miles • Iraan - 12 Miles

Desert Sky Wind Farm(approx 300 miles due west of Austin)
215 ft
115 ft
330 ft
At least 100 wind turbines in a wind farm
Operate at 10 – 20 RPM, with wind speed range 8 – 56 MPH
Approx. 10 wind turbines (15 MW) per square mile. Thus, a farm needs at least 10 square miles.
Metric units – about 6 MW per square km.

May 2003
Desert Sky Wind FarmDesert Sky Wind Farm• Commercial operation - Jan ‘02• 160 MW Project
• One hundred seven 1.5 MW turbines• 211 ft (65 meter) hub height• 229 ft (70.5 meter) rotor diameter• Total height of 329 ft (101 meters) to
top of blade tip to base• Project occupies about 16 square
miles• One substation with two
transmission interconnects

May 2003
GE 1.5S Wind GE 1.5S Wind TurbineTurbine OperationOperation
• Operates in 8-56 mph wind speeds
• Each turbine is a self-contained independent power plant, no operator intervention required
• Onboard weather station, yaw control facing wind
• Variable speed, operates from 10-20 RPM rotor/blade assembly, generator speeds 850 to 1440 RPM

May 2003
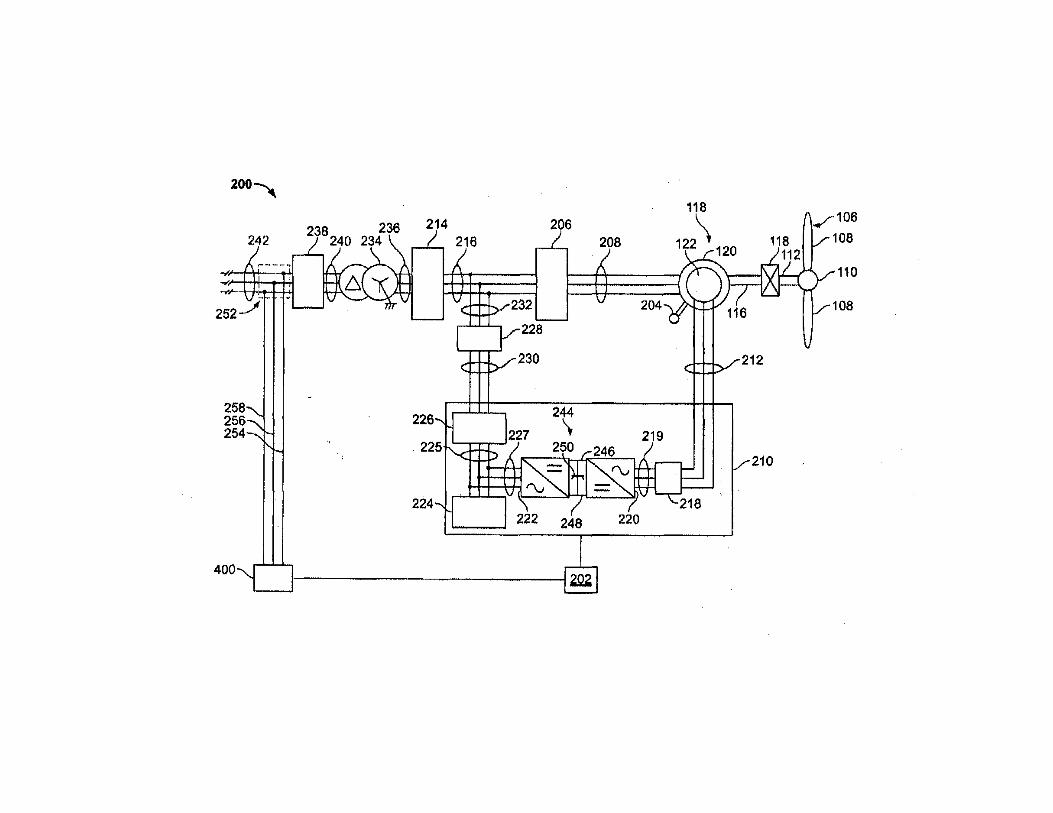
Nacelle LayoutNacelle Layout

May 2003
Technical Talking PointsTechnical Talking Points
*6 pole machine, Synchronous speed 1200 rpm.*Converter operation (Variable speed
machines), Sub-synchronous/super-synchronous operation
*Gearbox Operation (1:72 ratio)*Low Voltage ride through*Collection system/substation design*Transmission system issues (congestion)*Power Factor/ VAR control/Transmission
system voltage control*Non-dispatchable nature of wind
power/renewable energy systems in general*Climb assists

May 2003
O&M O&M -- NonNon--Routine Corrective Routine Corrective MaintenanceMaintenance
• Blade repairs, lightning damage & leading edge erosion.
• Blade inspections and repairs are completed annually. • About 25 lightning related repairs per year.
• Since commissioning, three blades have required replacement due to lightning damage.
• Gearbox failures and subsequent replacement.• Gearbox life cycle appears to be 5-8 years. Note: The repairs mentioned above require two cranes, a large 300 ton crane and a smaller 100 ton crane. Crane availability and expense are serious issues facing wind farm owners. Demand for crane service is currently outpacing availability.
25 lightning-related repairs per year per 100 turbines

Relative Air Density (Nominal 1.0 at Sea Level, 15 Deg C)
0.70
0.75
0.80
0.85
0.90
0.95
1.00
1.05
1.10
1.15
-20 -15 -10 -5 0 5 10 15 20 25 30 35 40
Temp - C
Rel
ativ
e A
ir D
ensi
ty
Sea Level
500 m
1000 m
1500m
2000 m
2500 m
3000 m
Drops about 0.1 per 1000m,
and about 0.1 per 15º C

Betz Limit – Max theoretical turbine energy capture = 59.3% of swept area when downwind is slowed to 1/3rd of the upwind speed.
swept

Betz Limit – Max theoretical turbine energy capture = 59.3% of swept area when downwind is slowed to 1/3rd of the upwind speed.

sec)/()(sec)/(
mvmRrad
vSpeedTipTSR
wind
rotorrotor
wind
•==ω

Response from Roy Blackshear, Manager of Desert Sky Wind Farm
• We reach rated power at about 12.5 m/s or 28 mph at an air density of 1.09, which was originally calculated as the year round average for this site.
• When wind speeds exceed rated, i.e., >12.5 m/s, the blades pitch-regulate to maintain rated output and rotor speed at slightly over 20 rpm.
• Turbines pitch blades out of the wind if 10 minute average wind speeds exceed 25 m/s or 56 mph, or wind speeds of > 28 m/s for 30 seconds, or storm gusts of 30 m/s or 67 mph.
• Lower ambient temperatures in the winter increase the air density substantially, resulting in improved performance of about 5% on the coldest days.
• In general, the change in performance is subtle and only apparent where ambient temperatures are very low, below freezing.
Roy Blackshear, cont.

From GE Wind Energy Basics
Q. How much does a wind farm cost?
A. The total cost will vary significantly based on site-specific conditions, permitting and construction requirements, and transportation constraints. In general wind power development can cost around $2 million per megawatt (MW) of generating capacity installed, including supporting infrastructure commonly referred to as Balance of Plant (BoP).
Q. How big are wind turbines?
A. The “tip height” of a GE 1.5 MW turbine is approximately 120 meters, which represents the total height of tower plus a blade in its highest vertical position.

Moderate: 6.4 - 7 m/s
Good: 7- 7.5 m/s
Excellent: >7.5 m/s

Wind Energy’s Potential
Wind power accounted for about 42% of all new power generating capacity added in the US in 2008, representing one of the largest components of new capacity addition.
Wind energy could supply about 20% of America's electricity, according to Battelle Pacific Northwest Laboratory, a federal research lab. Wind energy resources useful for generating electricity can be found in nearly every state.
Wind is projected to deliver 33% of all new electricity generation capacity and provide electricity for 86 million Europeans by 2010.

GE 1.5MW Turbines


EE411, Fall 2011, Lab. 4. Phase-Locked Loop
In Lab 1, you manually followed the 120Vac grid voltage by adjusting an external waveform generator. In Lab 4, you will perform the same feat using your built-in pulse generator, and also automate the process using a phase-locked loop with proportional-integral (PI) controller. A phase-locked loop “locks” the phase and frequency of the built-in pulse generator with the 120Vac voltage.
In Lab 1, you used the following cosine product trig expression:
which (see page 13) gives positive error in the first “beat frequency” term when the two signals are in phase, zero error when they are 90º out of phase, and negative error when they are 180º out of phase. In Lab 4, you will use the following sine, cosine product to achieve zero error in the beat frequency term when the two signals are in phase (i.e., “phase locked”). The sine term is obtained by integrating the grid voltage.
[ ]BAtBAtBtAt ++++−+−=+•+ )(cos)(cos21)cos()cos( 212121 ωωωωωω
[ ]BAtBAtBtAt ++++−+−=+•+ )(sin)(sin21)cos()sin( 212121 ωωωωωω
A PI controller converts a first-order response system (such as an RC or RL circuit) to a second-order response system so that error can be quickly minimized. Our “system,” which is essentially the relationship between the RF3 knob and the pulse generator frequency, is not exactly first-order, but nevertheless it can be approximated as such. You will replace RF3 with a MOSFET, which in our case will be a voltage-controlled resistor. A feedback voltage based upon error and integral of error adjusts the pulse generator frequency to achieve “locking.”
Theory follows on the next few slides. This material is taken from EE462L Power Electronics and illustrates how a PI controller regulates the output voltage of a DC-DC converter.

EE411, Fall 2011, Lab. 4. Phase-Locked Loop, cont.
A proportional-integral controller (i.e., PI) with feedback can take the place of manual adjustment of the switching duty cycle to a DC-DC converter and act much more quickly than is possible “by hand.” Consider the Transformer, DBR, MOSFET Firing Circuit, DC-DC Converter, and Load as “a process” shown below. In the open loop mode that you used last time, you manually adjusted duty cycle voltage Dcont. To automate the process, the “feedback loop” is closed and an error signal (+ or –) is obtained. The PI controller acts upon the error with parallel proportional and integral responses in an attempt to drive the error to zero. Let αVout be a scaled down replica of Vout. When αVout equals Vset, then the error is zero. A resistor divider attached to Vout produces αVout, which is suitably low for op-amps voltage levels.
Dcont (0-3.5V)
Transformer, DBR, MOSFET Firing Circuit, DC-DC Converter, and Load
Vout (0-120V)
Figure 1. Open Loop Process
Vset αVout
(100V scaled down to about
1.5V)
PI controller
Error
– +
Dcont
Figure 2. Closed Loop Process with PI Controller
Transformer, DBR, MOSFET Firing Circuit, DC-DC Converter, and Load
Multiply by Gain Kp
Integrate using Gain Ki
∑Error
Zoom-In of PI Controller

EE411, Fall 2011, Lab. 4. Phase-Locked Loop, cont.
10k
Fullyclockwise
22k100k
Vac wall wart
22k10k
10k10k
G
S D
100k
B100k, Ki
B10k, Kp
+ 4.7µF
Integrate Vac
Error filter
−Integral (of error) sig.
−Proportional (to error) sig.
−Summer
Unmarked red resistors are 220k. Unmarked red capacitors are 0.1μF. The 4.7μF capacitor is polarized and the + terminal is marked. Bottom leads of twin caps in “Integrate Vac” are pushed through the holes below the amp – tack soldering them to the board is advisable. The MOSFET is a voltage-controlled resistor − raise voltage Vgs, and MOSFET resistance Rds decreases. G,D,S are MOSFET gate, drain, source. The integral of Vac is on pin K(A+B).
Fullyclockwise
D = 0.5
On
220k 220k0.1μF
Error sig.hole
DC filter
Flat side of MOSFET faces lower right-hand
corner of board
Feedback sig. to G
Wire up with #24 solid orange

0.0
55kΩ ? Supertex MOSFET Power 60V, 5Ω,
VN10KN3-G
EE411, Fall 2011, Lab. 4. Phase-Locked Loop, cont.
1. When MOSFET is removed, RF = 440kΩ, and computed F = 27Hz (actual measurement is 33Hz),
2. When RF3 is shorted, which is essentially the same situation as MOSFET “on,” RF = 220kΩ, and computed F = 55Hz (actual measurement is 66Hz),
3. When MOSFET is inserted but “off,”with its open gate terminal connected to ground through a 1kΩ resistor, the actual measurement is 55Hz.Backcalculating, RF = 264kΩ, thus MOSFET “off” resistance is 55kΩ.
4. You may need to vary CF or RF1 to achieve a range of frequency similar to the 55-to-66Hz range in Steps 2-3 above. The range should be approx. centered around 60Hz.
RF2
RF1
RF3 = RDS
RF for Pulse Generator equalsRF1 + RF2 || RF3
Free-Running Tests. RF1 = RF2 = 220kΩ, CF = 0.1µF.

EE411, Fall 2011, Lab. 4. Phase-Locked Loop, cont.
Checkpoint Screen Snapshots, Taken When “Locked”
1. Vac (pin A), and integral of Vac (pin K(A+B))
4. Vac (pin A), and pulse generator (pin PULSE). Pulse is steady when locked.
2. Pulse generator (pin PULSE), and pulse generator with DC removed (multiplier input Y)
3. Error signal (pin X*Y/10) and filtered error signal (error filter op amp Vout)

5. PULSE and MOSFET gate voltage Vgs
Vgs about 1.5V avg
EE411, Fall 2011, Lab. 4. Phase-Locked Loop, cont.


![[Codientu.org] 3 EE462L Diode Bridge Rectifier](https://img.pdfslide.net/doc/110x75/577ccd321a28ab9e788bc2dd/codientuorg-3-ee462l-diode-bridge-rectifier.jpg)