Embed Size (px)
Citation preview
0
HFMA REGION V DIXIE INSTITUTEFebruary 8-11, 2005
Charleston, SC
Turning Data into Useful Information:How to Effectively Collect, Analyze, and Report
Financial and Clinical Data to Enhance Decision-Making in Health Care
Presented by:
Anne FarmerVice President
TriNet Healthcare ConsultantsWestford, MA
February 10, 2005
1
OUTLINE
I. Introduction• Definitions• The challenges
II. Meeting the Needs of the Information-Driven Organization
III. Conducting an Assessment / Re-assessment
IV. What’s in Your Tool-Kit?
V. Examples of Clinical and Financial Data Integration• Service line analysis• Strategic financial plan
2
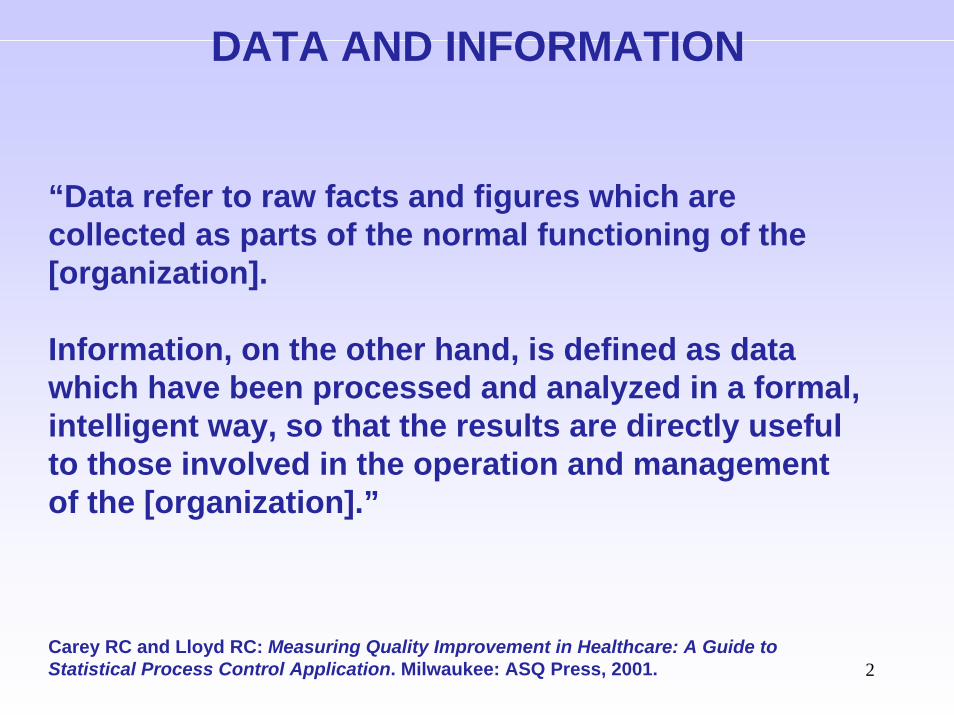
DATA AND INFORMATION
“Data refer to raw facts and figures which are collected as parts of the normal functioning of the [organization].
Information, on the other hand, is defined as data which have been processed and analyzed in a formal, intelligent way, so that the results are directly useful to those involved in the operation and management of the [organization].”
Carey RC and Lloyd RC: Measuring Quality Improvement in Healthcare: A Guide to Statistical Process Control Application. Milwaukee: ASQ Press, 2001.
3
THE DECISION-MAKING MODEL
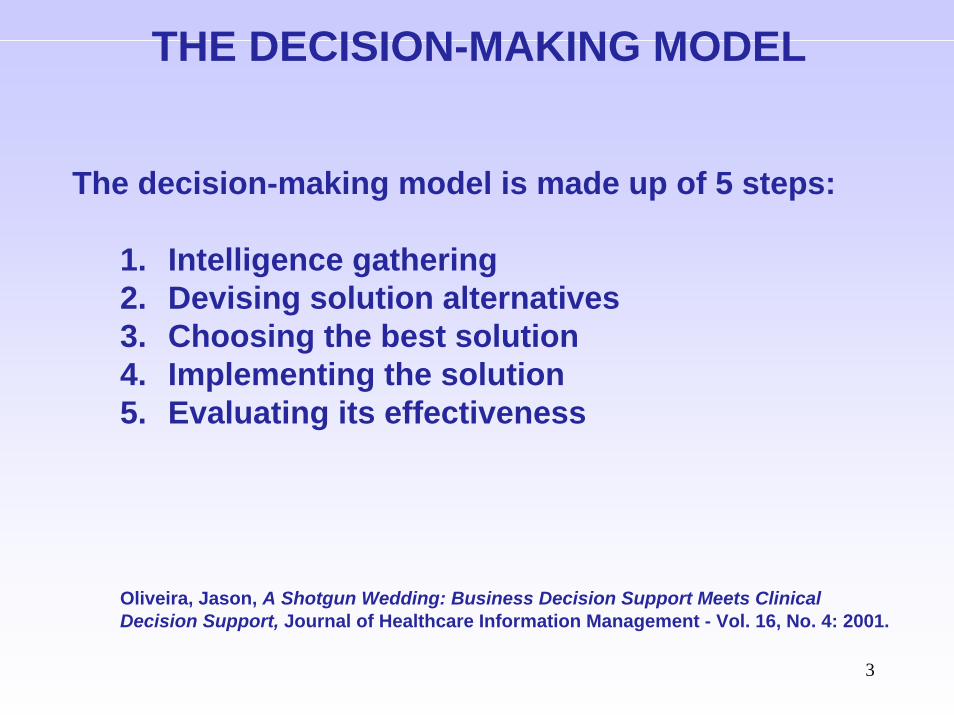
The decision-making model is made up of 5 steps:
1. Intelligence gathering2. Devising solution alternatives3. Choosing the best solution4. Implementing the solution5. Evaluating its effectiveness
Oliveira, Jason, A Shotgun Wedding: Business Decision Support Meets Clinical Decision Support, Journal of Healthcare Information Management - Vol. 16, No. 4: 2001.
4
DECISION SUPPORT DEFINITION
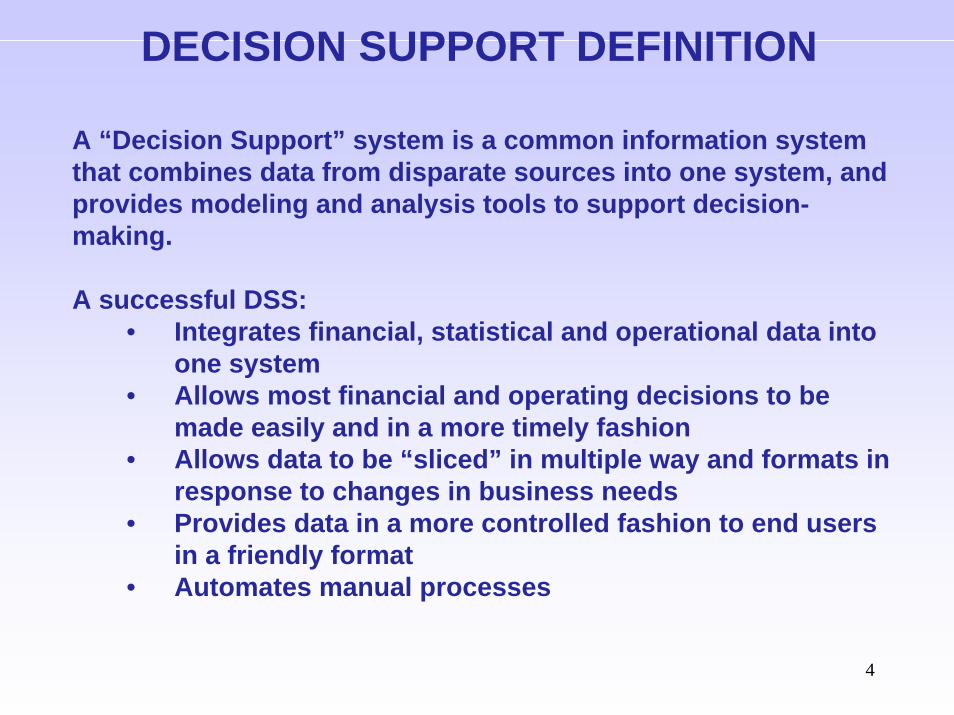
A “Decision Support” system is a common information system that combines data from disparate sources into one system, and provides modeling and analysis tools to support decision-making.
A successful DSS:• Integrates financial, statistical and operational data into
one system• Allows most financial and operating decisions to be
made easily and in a more timely fashion• Allows data to be “sliced” in multiple way and formats in
response to changes in business needs• Provides data in a more controlled fashion to end users
in a friendly format• Automates manual processes
5
DECISION SUPPORT ARCHITECTURE
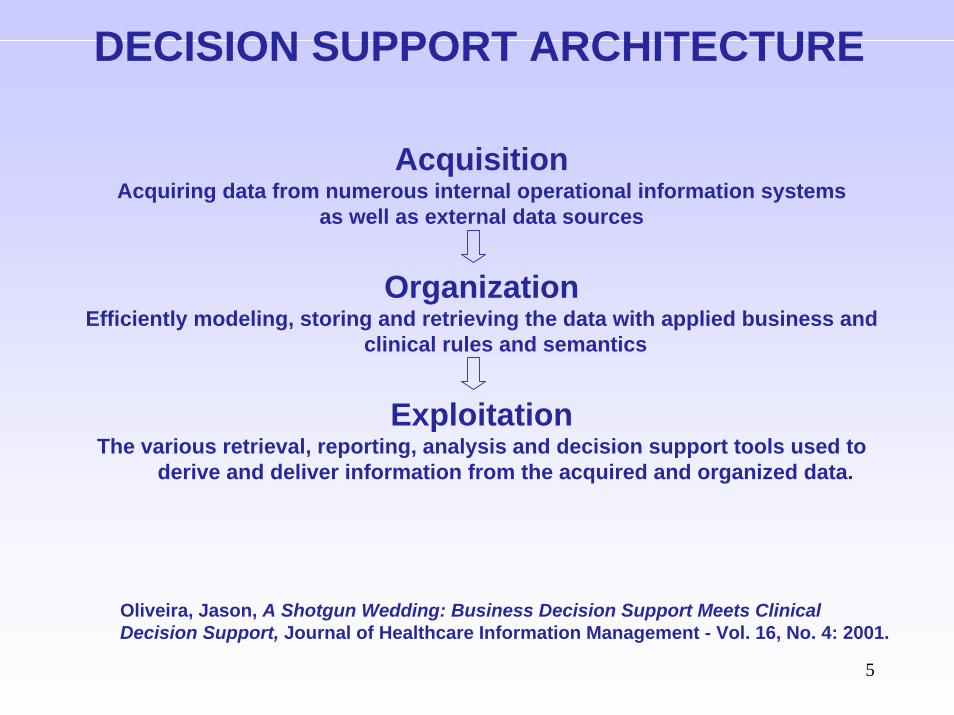
AcquisitionAcquiring data from numerous internal operational information systems
as well as external data sources
OrganizationEfficiently modeling, storing and retrieving the data with applied business and
clinical rules and semantics
ExploitationThe various retrieval, reporting, analysis and decision support tools used to
derive and deliver information from the acquired and organized data.
Oliveira, Jason, A Shotgun Wedding: Business Decision Support Meets Clinical Decision Support, Journal of Healthcare Information Management - Vol. 16, No. 4: 2001.
6
NEW BUZZ-WORDS
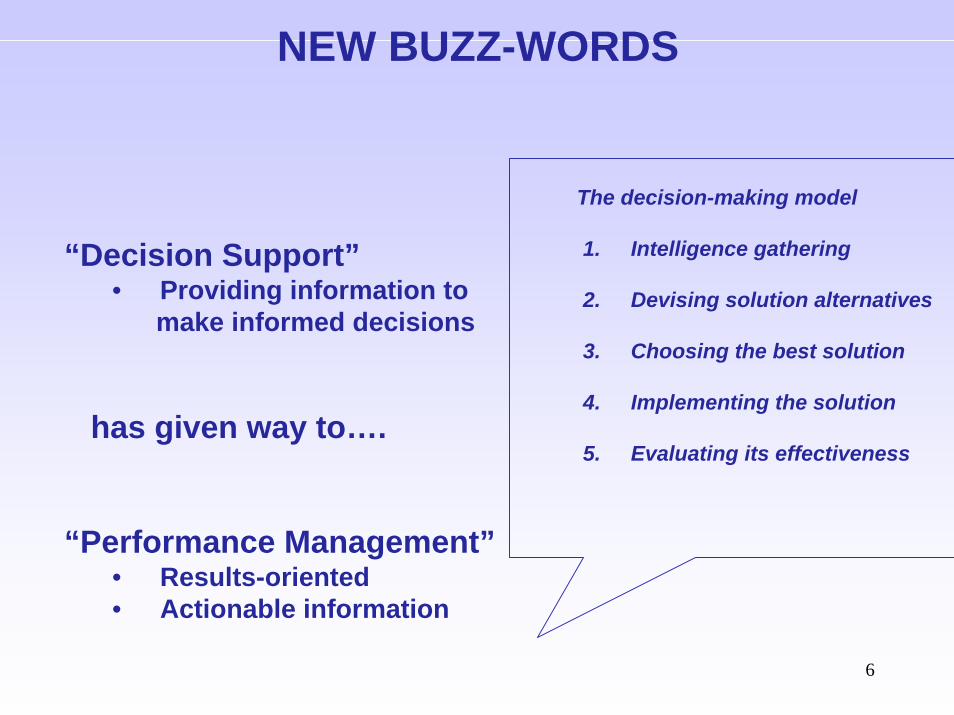
“Decision Support” • Providing information to
make informed decisions
has given way to….
“Performance Management” • Results-oriented• Actionable information
The decision-making model
1. Intelligence gathering
2. Devising solution alternatives
3. Choosing the best solution
4. Implementing the solution
5. Evaluating its effectiveness
7
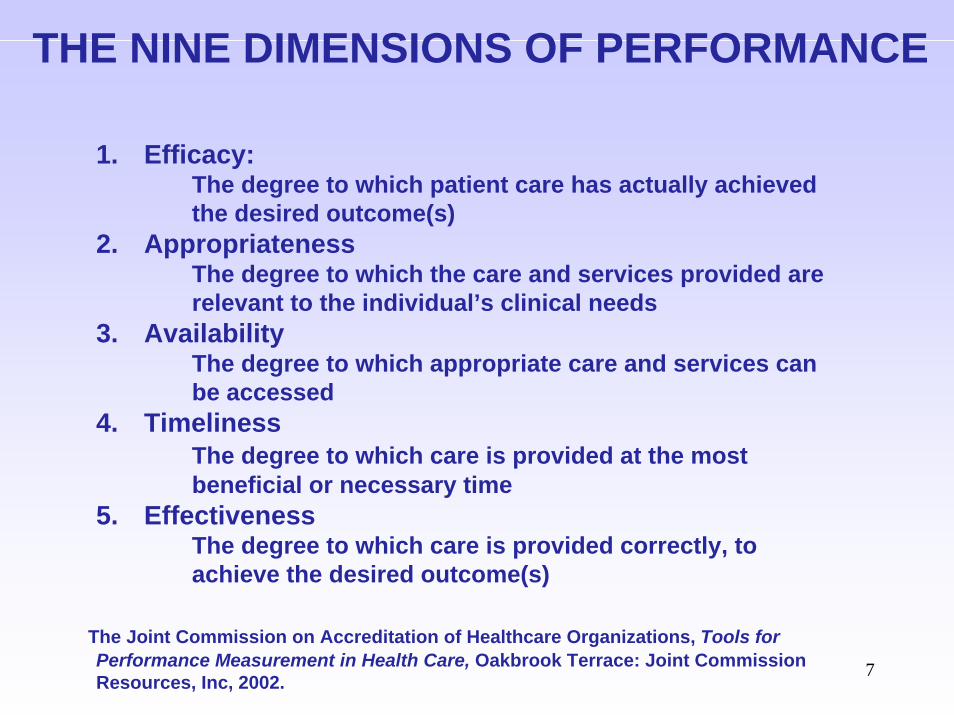
THE NINE DIMENSIONS OF PERFORMANCE
1. Efficacy: The degree to which patient care has actually achieved the desired outcome(s)
2. AppropriatenessThe degree to which the care and services provided are relevant to the individual’s clinical needs
3. AvailabilityThe degree to which appropriate care and services can be accessed
4. TimelinessThe degree to which care is provided at the most beneficial or necessary time
5. EffectivenessThe degree to which care is provided correctly, to achieve the desired outcome(s)
The Joint Commission on Accreditation of Healthcare Organizations, Tools for Performance Measurement in Health Care, Oakbrook Terrace: Joint Commission Resources, Inc, 2002.
8
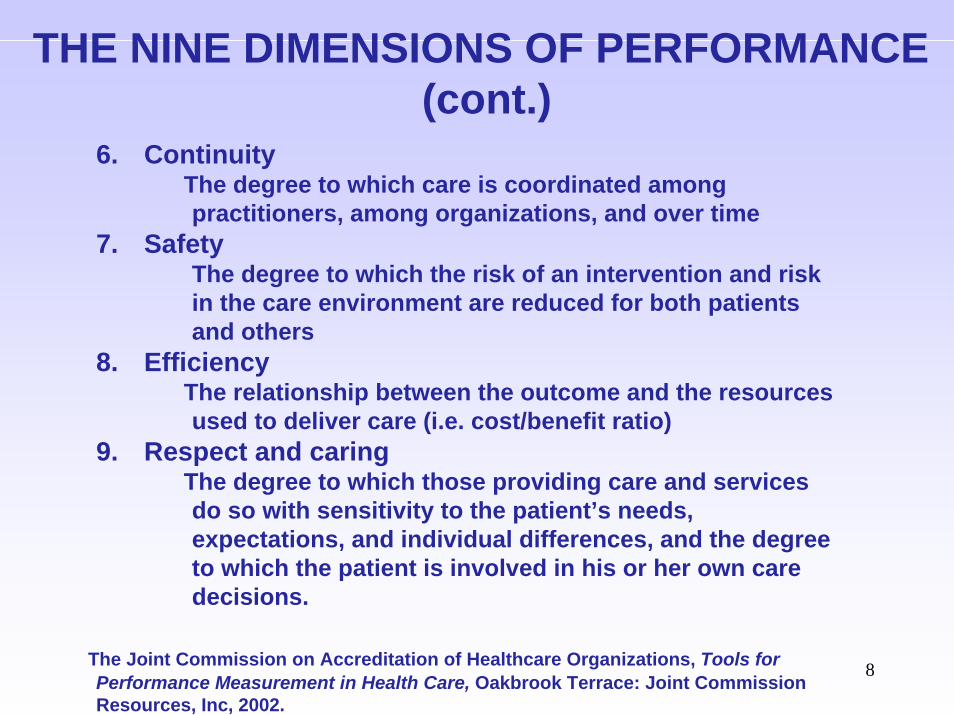
THE NINE DIMENSIONS OF PERFORMANCE(cont.)
6. ContinuityThe degree to which care is coordinated among practitioners, among organizations, and over time
7. SafetyThe degree to which the risk of an intervention and risk in the care environment are reduced for both patients and others
8. EfficiencyThe relationship between the outcome and the resources used to deliver care (i.e. cost/benefit ratio)
9. Respect and caringThe degree to which those providing care and services do so with sensitivity to the patient’s needs, expectations, and individual differences, and the degree to which the patient is involved in his or her own care decisions.
The Joint Commission on Accreditation of Healthcare Organizations, Tools for Performance Measurement in Health Care, Oakbrook Terrace: Joint Commission Resources, Inc, 2002.
9
MEETING THE NEEDS OF THE “INFORMATION-DRIVEN”
ORGANIZATION
10
MEETING THE NEEDS OF THE“INFORMATION-DRIVEN” ORGANIZATION
When meeting information requests, it’s important to:
• Recognize the REAL question
• Anticipate future information needs
. State the problem before trying to find the solution
11
HANDLING INFORMATION REQUESTS
– The analyst must often revise or re-state the information request.
– Why?
– The Decision Support analyst is close to the data:• Audits data, notices irregularities• Knows what data is available from various
systems in the organization• Know what others are looking at
12
QUESTIONS TO ASK
What is the report for?• Purpose of the report• Is there a premise/hypothesis that is being confirmed or
disputed?
Who is it for? (ultimate recipient of the information)
What population should be included in the report?
What data is needed?
Are there any exclusions? e.g. • Outliers • Non-acute
13
QUESTIONS TO ASK (cont.)
How should the data be organized?• What detail is needed?• What, if any, subtotals should be reported• Graphs vs. tabular reports
What other information is needed to tell a story? e.g.• Break out ICU from Med/Surg days• Break out costs by direct/indirect• ALWAYS show volume (no. cases)• Add ratios (per case, per day)• Add severity data if available
How frequently will the report be run in the future?• Frequency affects decisions about how the report is set up• Consider ease of maintenance• Automate reports that are run frequently
14
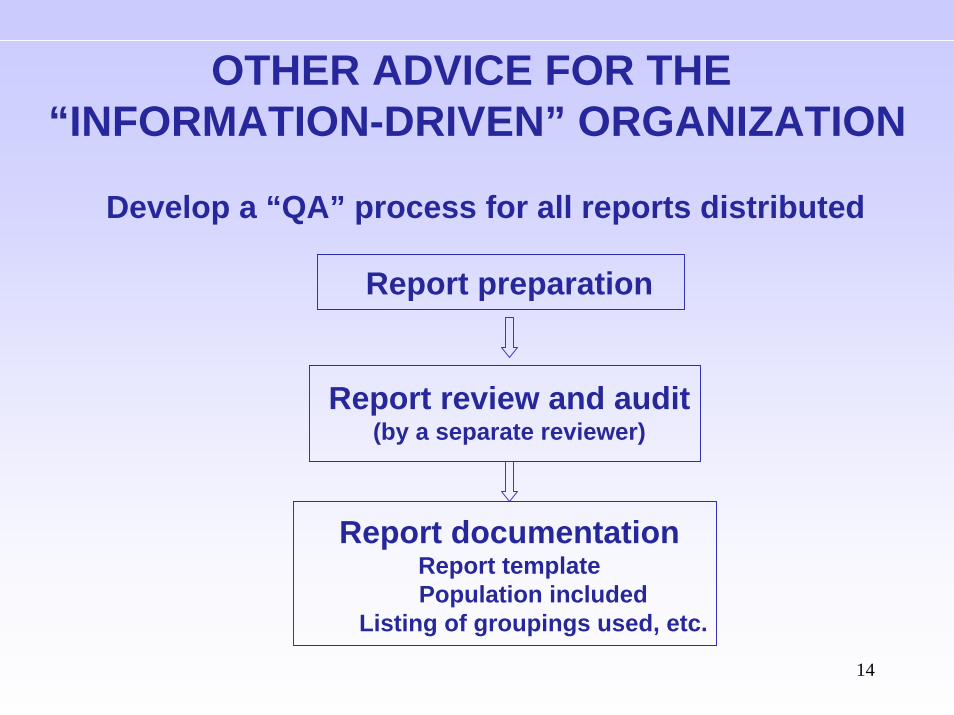
Develop a “QA” process for all reports distributed
Report preparation
Report review and audit(by a separate reviewer)
Report documentationReport templatePopulation included
Listing of groupings used, etc.
OTHER ADVICE FOR THE “INFORMATION-DRIVEN” ORGANIZATION
15
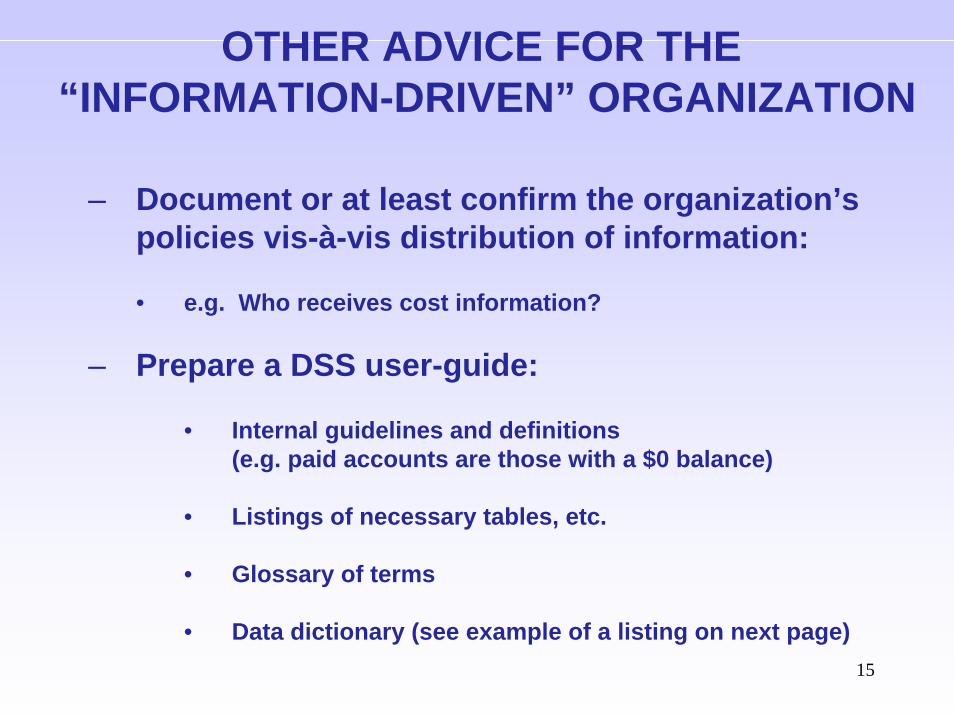
OTHER ADVICE FOR THE “INFORMATION-DRIVEN” ORGANIZATION
– Document or at least confirm the organization’s policies vis-à-vis distribution of information:
• e.g. Who receives cost information?
– Prepare a DSS user-guide:
• Internal guidelines and definitions(e.g. paid accounts are those with a $0 balance)
• Listings of necessary tables, etc.
• Glossary of terms
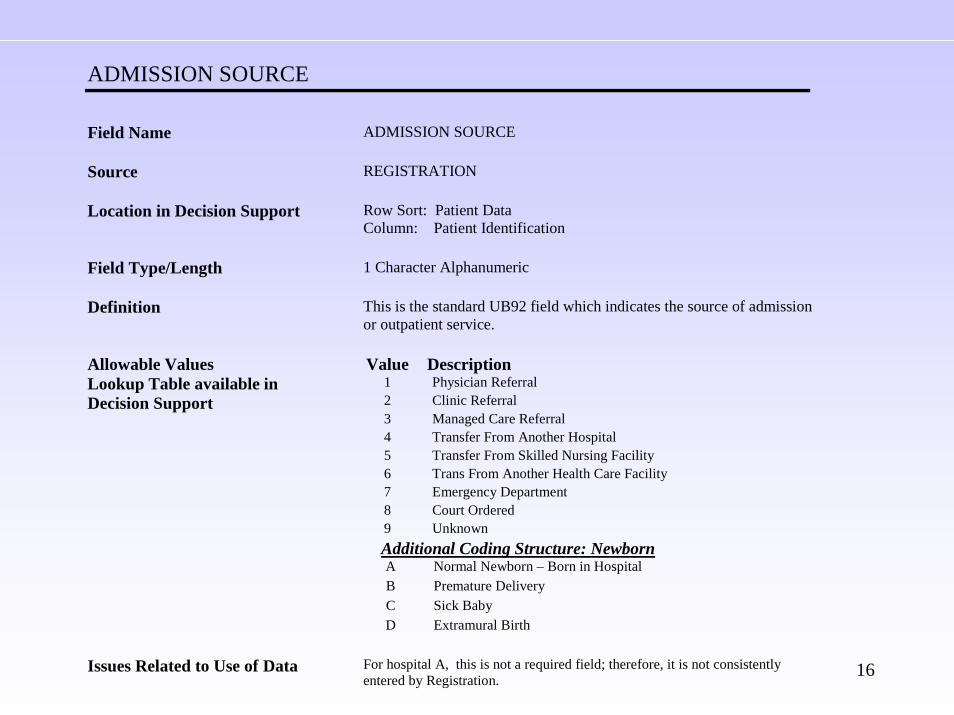
• Data dictionary (see example of a listing on next page)
16
ADMISSION SOURCE Field Name
ADMISSION SOURCE
Source
REGISTRATION
Location in Decision Support
Row Sort: Patient Data Column: Patient Identification
Field Type/Length
1 Character Alphanumeric
Definition
This is the standard UB92 field which indicates the source of admission or outpatient service.
Value Description 1 Physician Referral 2 Clinic Referral 3 Managed Care Referral 4 Transfer From Another Hospital 5 Transfer From Skilled Nursing Facility 6 Trans From Another Health Care Facility 7 Emergency Department 8 Court Ordered
Allowable Values Lookup Table available in Decision Support
9 Unknown Additional Coding Structure: Newborn A Normal Newborn – Born in Hospital B Premature Delivery C Sick Baby D Extramural Birth Issues Related to Use of Data For hospital A, this is not a required field; therefore, it is not consistently
entered by Registration.

17
CONDUCTING AN ASSESSMENT / RE-ASSESSMENT
18
CONDUCTING AN ASSESSMENT/ REASSESSMENT
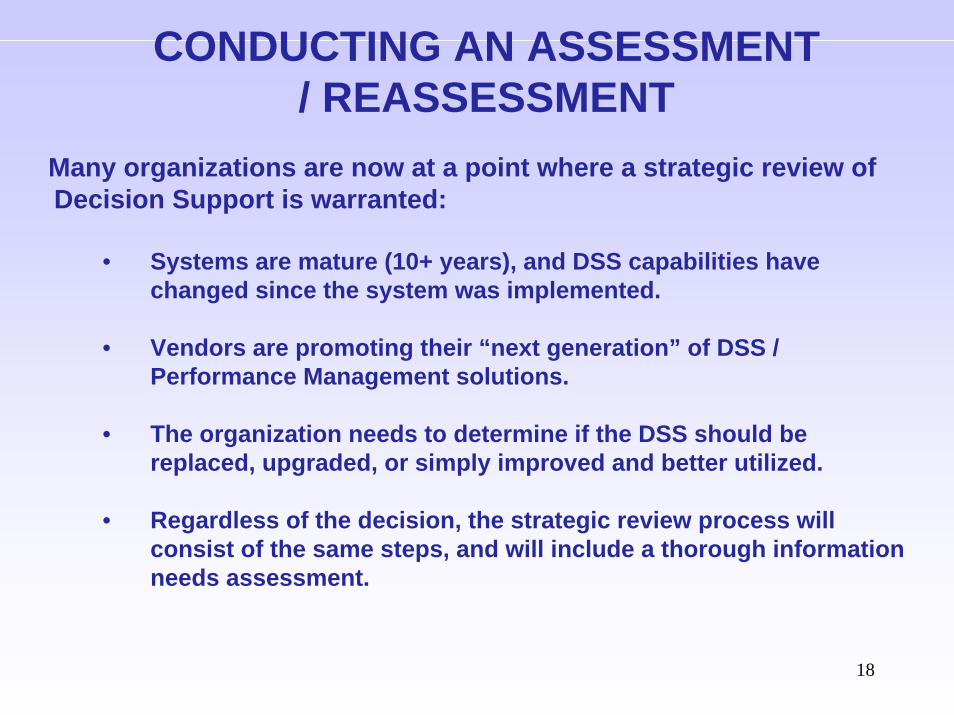
Many organizations are now at a point where a strategic review of Decision Support is warranted:
• Systems are mature (10+ years), and DSS capabilities have changed since the system was implemented.
• Vendors are promoting their “next generation” of DSS / Performance Management solutions.
• The organization needs to determine if the DSS should be replaced, upgraded, or simply improved and better utilized.
• Regardless of the decision, the strategic review process will consist of the same steps, and will include a thorough information needs assessment.
19
CONDUCTING AN ASSESSMENT/ REASSESSMENT
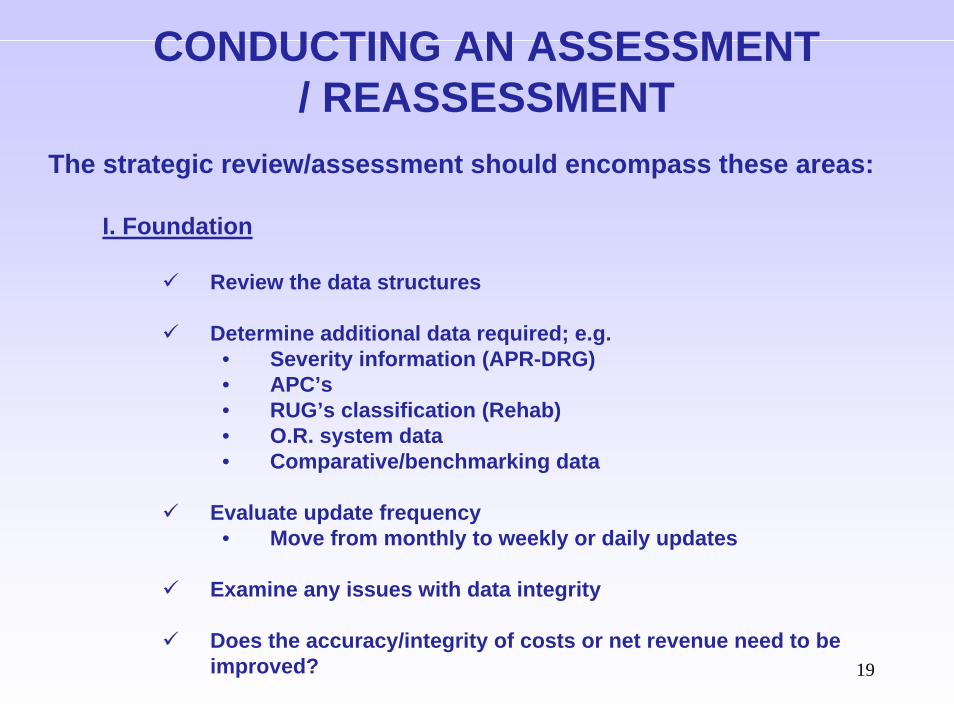
The strategic review/assessment should encompass these areas:
I. Foundation
Review the data structures
Determine additional data required; e.g.• Severity information (APR-DRG)• APC’s• RUG’s classification (Rehab)• O.R. system data• Comparative/benchmarking data
Evaluate update frequency• Move from monthly to weekly or daily updates
Examine any issues with data integrity
Does the accuracy/integrity of costs or net revenue need to be improved?
20
CONDUCTING AN ASSESSMENT/ REASSESSMENT
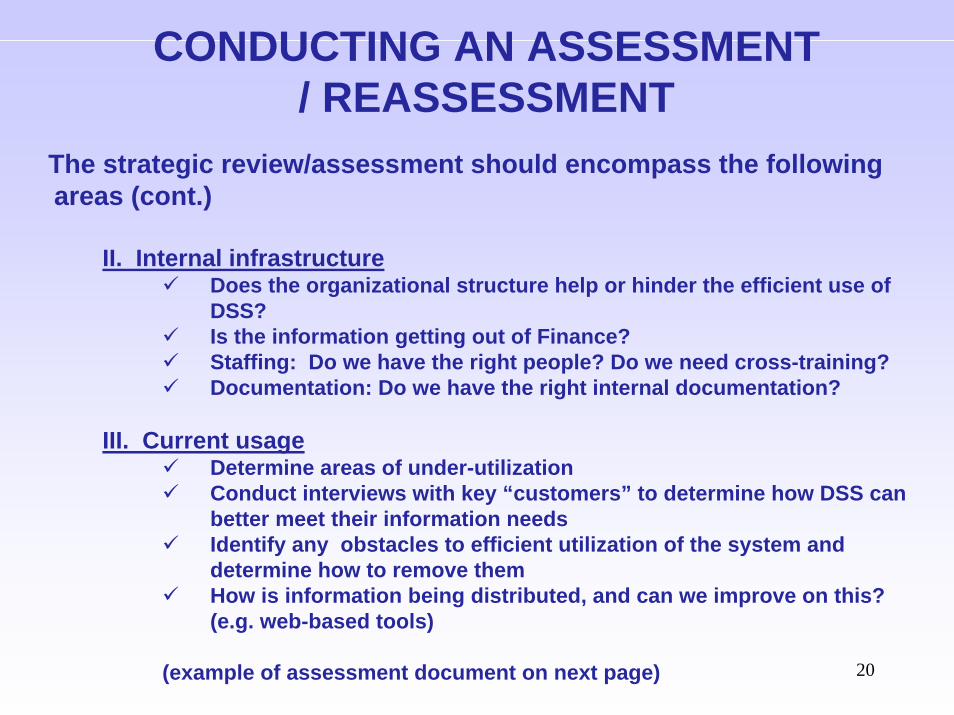
The strategic review/assessment should encompass the following areas (cont.)
II. Internal infrastructureDoes the organizational structure help or hinder the efficient use of DSS?Is the information getting out of Finance?Staffing: Do we have the right people? Do we need cross-training?Documentation: Do we have the right internal documentation?
III. Current usageDetermine areas of under-utilizationConduct interviews with key “customers” to determine how DSS canbetter meet their information needsIdentify any obstacles to efficient utilization of the system and determine how to remove themHow is information being distributed, and can we improve on this? (e.g. web-based tools)
(example of assessment document on next page)
21
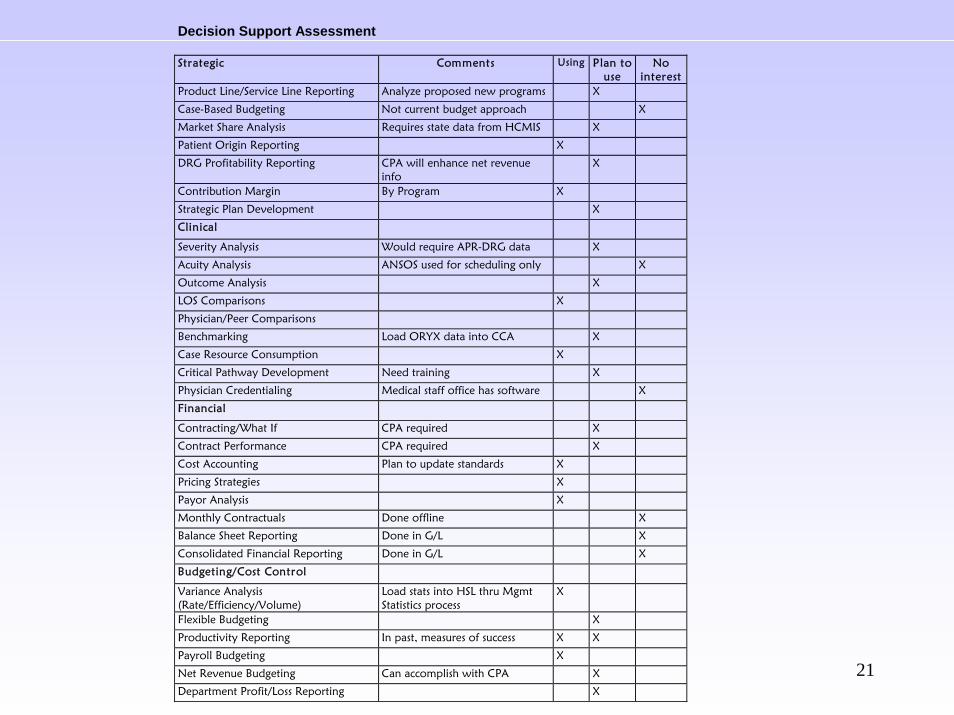
Decision Support Assessment Strategic Comments Using Plan to
use No
interest Product Line/Service Line Reporting Analyze proposed new programs X
Case-Based Budgeting Not current budget approach X
Market Share Analysis Requires state data from HCMIS X
Patient Origin Reporting X
DRG Profitability Reporting CPA will enhance net revenue info
X
Contribution Margin By Program X
Strategic Plan Development X
Clinical
Severity Analysis Would require APR-DRG data X
Acuity Analysis ANSOS used for scheduling only X
Outcome Analysis X
LOS Comparisons X
Physician/Peer Comparisons
Benchmarking Load ORYX data into CCA X
Case Resource Consumption X
Critical Pathway Development Need training X
Physician Credentialing Medical staff office has software X
Financial
Contracting/What If CPA required X
Contract Performance CPA required X
Cost Accounting Plan to update standards X
Pricing Strategies X
Payor Analysis X
Monthly Contractuals Done offline X
Balance Sheet Reporting Done in G/L X
Consolidated Financial Reporting Done in G/L X
Budgeting/Cost Control
Variance Analysis (Rate/Efficiency/Volume)
Load stats into HSL thru Mgmt Statistics process
X
Flexible Budgeting X
Productivity Reporting In past, measures of success X X
Payroll Budgeting X
Net Revenue Budgeting Can accomplish with CPA X
Department Profit/Loss Reporting X
22
CONDUCTING AN ASSESSMENT/ REASSESSMENT (cont.)
The strategic review/assessment should encompass the following areas (cont.):
IV. GoalsFinal outcome of the process is a list of DSS goals, and…Action plan to implement the goalsDevelop a steering committee/DSS user group to monitor the progress

WHAT’S IN YOUR TOOL-KIT?
24
TOOLS FOR TURNING DATA INTO USEFUL INFORMATION
Comparative/Benchmark Data
– Most Decision Support / Performance Management systems offer the ability to load comparative & benchmark data from any source.
– Providers of this information fall into two categories:
• “Off-the-shelf”: use publicly available data such as the MedPar file, or patient data required by the state to be submitted on aquarterly or annual basis
• License /Partner agreements: use data submitted by their member hospitals. You supply your data to add to their data base, they compile comparative reports.
25
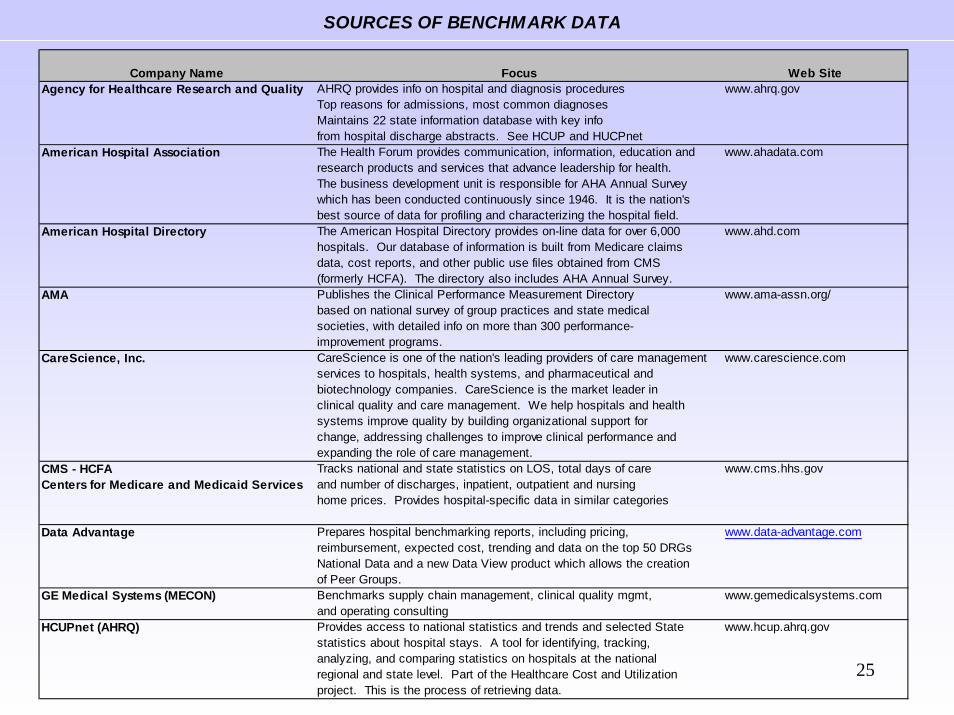
SOURCES OF BENCHMARK DATA
Company Name Focus Web SiteAgency for Healthcare Research and Quality AHRQ provides info on hospital and diagnosis procedures www.ahrq.gov
Top reasons for admissions, most common diagnosesMaintains 22 state information database with key infofrom hospital discharge abstracts. See HCUP and HUCPnet
American Hospital Association The Health Forum provides communication, information, education and www.ahadata.comresearch products and services that advance leadership for health.The business development unit is responsible for AHA Annual Surveywhich has been conducted continuously since 1946. It is the nation'sbest source of data for profiling and characterizing the hospital field.
American Hospital Directory The American Hospital Directory provides on-line data for over 6,000 www.ahd.com hospitals. Our database of information is built from Medicare claims
data, cost reports, and other public use files obtained from CMS (formerly HCFA). The directory also includes AHA Annual Survey.
AMA Publishes the Clinical Performance Measurement Directory www.ama-assn.org/based on national survey of group practices and state medicalsocieties, with detailed info on more than 300 performance-improvement programs.
CareScience, Inc. CareScience is one of the nation's leading providers of care management www.carescience.comservices to hospitals, health systems, and pharmaceutical and biotechnology companies. CareScience is the market leader inclinical quality and care management. We help hospitals and healthsystems improve quality by building organizational support forchange, addressing challenges to improve clinical performance and
expanding the role of care management. CMS - HCFA Tracks national and state statistics on LOS, total days of care www.cms.hhs.govCenters for Medicare and Medicaid Services and number of discharges, inpatient, outpatient and nursing
home prices. Provides hospital-specific data in similar categories
Data Advantage Prepares hospital benchmarking reports, including pricing, www.data-advantage.comreimbursement, expected cost, trending and data on the top 50 DRGsNational Data and a new Data View product which allows the creationof Peer Groups.
GE Medical Systems (MECON) Benchmarks supply chain management, clinical quality mgmt, www.gemedicalsystems.comand operating consulting
HCUPnet (AHRQ) Provides access to national statistics and trends and selected State www.hcup.ahrq.govstatistics about hospital stays. A tool for identifying, tracking,analyzing, and comparing statistics on hospitals at the nationalregional and state level. Part of the Healthcare Cost and Utilizationproject. This is the process of retrieving data.
26
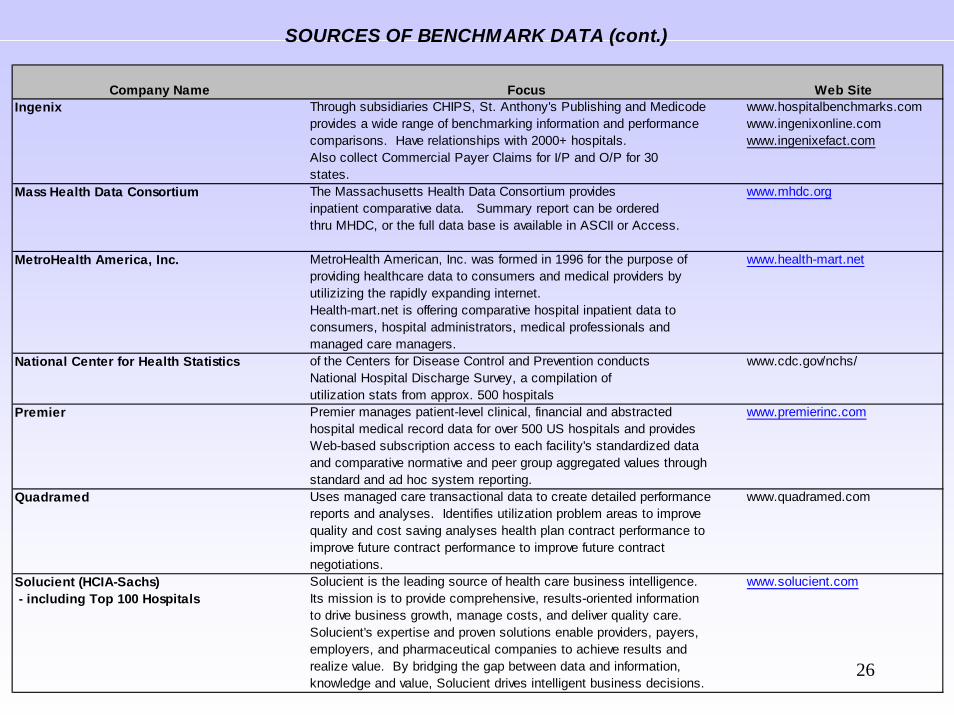
SOURCES OF BENCHMARK DATA (cont.)
Company Name Focus Web SiteIngenix Through subsidiaries CHIPS, St. Anthony's Publishing and Medicode www.hospitalbenchmarks.com
provides a wide range of benchmarking information and performance www.ingenixonline.comcomparisons. Have relationships with 2000+ hospitals. www.ingenixefact.comAlso collect Commercial Payer Claims for I/P and O/P for 30states.
Mass Health Data Consortium The Massachusetts Health Data Consortium provides www.mhdc.org inpatient comparative data. Summary report can be ordered
thru MHDC, or the full data base is available in ASCII or Access.
MetroHealth America, Inc. MetroHealth American, Inc. was formed in 1996 for the purpose of www.health-mart.netproviding healthcare data to consumers and medical providers byutilizizing the rapidly expanding internet. Health-mart.net is offering comparative hospital inpatient data toconsumers, hospital administrators, medical professionals andmanaged care managers.
National Center for Health Statistics of the Centers for Disease Control and Prevention conducts www.cdc.gov/nchs/National Hospital Discharge Survey, a compilation of utilization stats from approx. 500 hospitals
Premier Premier manages patient-level clinical, financial and abstracted www.premierinc.comhospital medical record data for over 500 US hospitals and providesWeb-based subscription access to each facility's standardized dataand comparative normative and peer group aggregated values throughstandard and ad hoc system reporting.
Quadramed Uses managed care transactional data to create detailed performance www.quadramed.comreports and analyses. Identifies utilization problem areas to improvequality and cost saving analyses health plan contract performance to improve future contract performance to improve future contract negotiations.
Solucient (HCIA-Sachs) Solucient is the leading source of health care business intelligence. www.solucient.com - including Top 100 Hospitals Its mission is to provide comprehensive, results-oriented information
to drive business growth, manage costs, and deliver quality care.Solucient's expertise and proven solutions enable providers, payers,employers, and pharmaceutical companies to achieve results andrealize value. By bridging the gap between data and information,knowledge and value, Solucient drives intelligent business decisions.
27
TOOLS (continued)
Business Intelligence Solutions
• Web-based
• New tools for “paperless” distribution of information
• Pull data from virtually any source (DSS and other)
• Offer graphing, dashboard, drill-down capabilities
• Information recipient has greater flexibility (e.g. can add arithmetic columns, change sort levels, rank, etc.)
• Intuitive, quick learning curve
28
TOOLS (continued)Dashboard Display
• Executive summary of organization’s performance in crucial areas
• Condensed, at a glance
• Usually includes a 12-month history in graphic form
• Software companies offer solutions that enhance the dashboard with easy-to-interpret graphics:• Green/red/yellow color coding• Ability to flag variances, and send email alerts
29
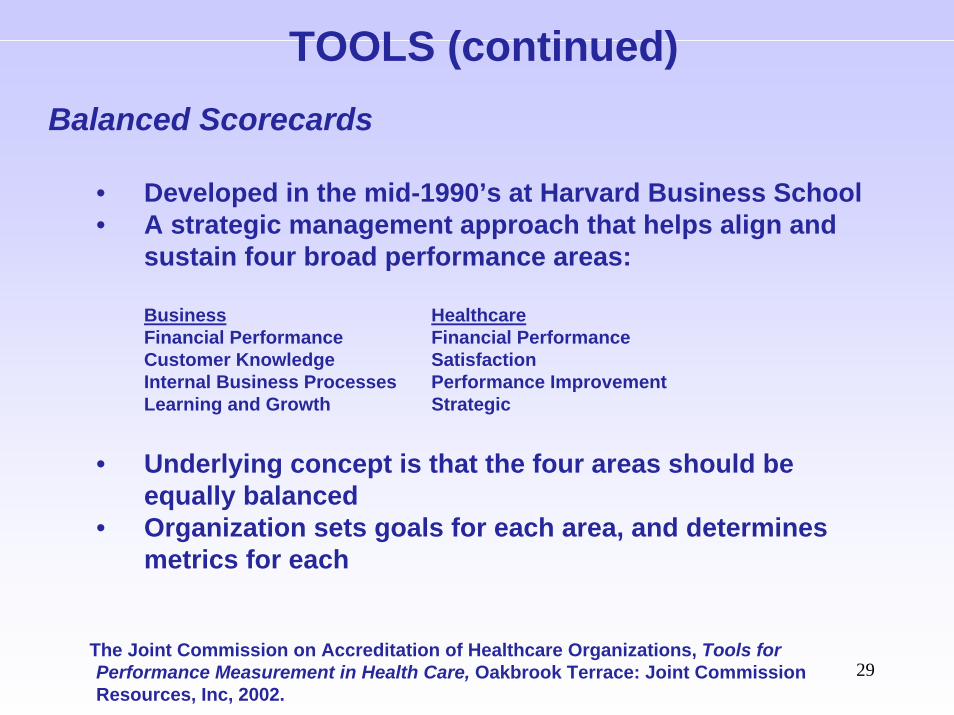
TOOLS (continued)Balanced Scorecards
• Developed in the mid-1990’s at Harvard Business School• A strategic management approach that helps align and
sustain four broad performance areas:
Business HealthcareFinancial Performance Financial PerformanceCustomer Knowledge SatisfactionInternal Business Processes Performance ImprovementLearning and Growth Strategic
• Underlying concept is that the four areas should be equally balanced
• Organization sets goals for each area, and determines metrics for each
The Joint Commission on Accreditation of Healthcare Organizations, Tools for Performance Measurement in Health Care, Oakbrook Terrace: Joint Commission Resources, Inc, 2002.
30
EXAMPLES OF
CLINICAL AND FINANCIAL DATA INTEGRATION
31
SERVICE LINE ANALYSIS
“Service lines are back.” (March 2004 HFM article)
What’s different this time around?“Service line strategy is not viewed as just a marketing function this time around. This time, senior managers seem to be on board, and they realize that the concept not only hold great financial promise, but also offers potential for gaining a competitive edge.”
“The second wave of service-line strategy - driven by more competitive forces and constrained payment - is likely to garner greater attention and improved execution as it is seen as more organizationally pervasive and market relevant.”
E. Preston Lee, Divide and Compete: A New Look at Service Lines,Healthcare Financial Management: March 2004.
32
SERVICE LINE ANALYSIS
What’s different this time around?
- Service Line Definitions: We’ve had more experience with defining service lines, and now understand the need for service line definitions to be;
Data driven,Market comparableLogical from an organizational perspective.
- Profit/Loss Analysis: More attention is being paid to accuracy of assigning both costs and net revenue to the service line level.
33
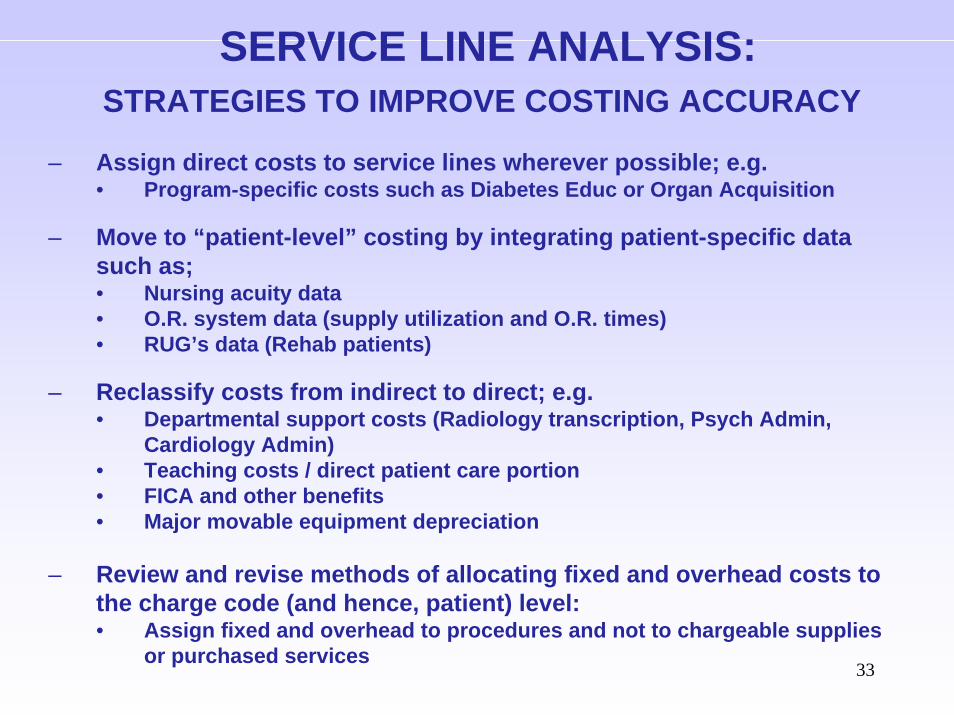
SERVICE LINE ANALYSIS:STRATEGIES TO IMPROVE COSTING ACCURACY
– Assign direct costs to service lines wherever possible; e.g.• Program-specific costs such as Diabetes Educ or Organ Acquisition
– Move to “patient-level” costing by integrating patient-specific data such as;• Nursing acuity data• O.R. system data (supply utilization and O.R. times)• RUG’s data (Rehab patients)
– Reclassify costs from indirect to direct; e.g.• Departmental support costs (Radiology transcription, Psych Admin,
Cardiology Admin)• Teaching costs / direct patient care portion• FICA and other benefits• Major movable equipment depreciation
– Review and revise methods of allocating fixed and overhead costs to the charge code (and hence, patient) level:• Assign fixed and overhead to procedures and not to chargeable supplies
or purchased services
34
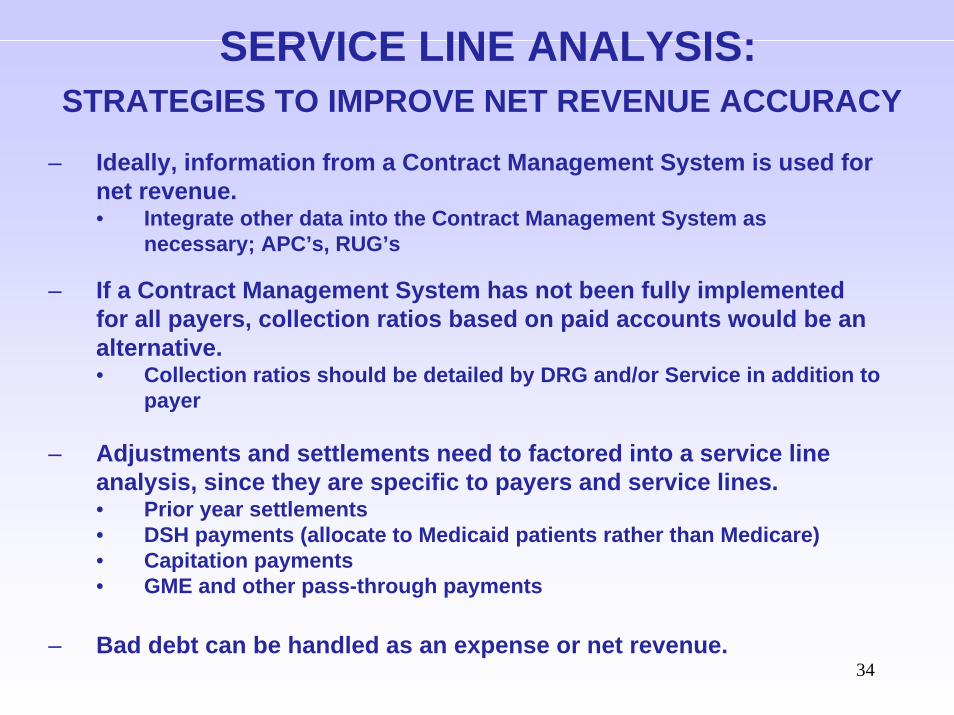
SERVICE LINE ANALYSIS:STRATEGIES TO IMPROVE NET REVENUE ACCURACY
– Ideally, information from a Contract Management System is used for net revenue.• Integrate other data into the Contract Management System as
necessary; APC’s, RUG’s
– If a Contract Management System has not been fully implemented for all payers, collection ratios based on paid accounts would be an alternative.• Collection ratios should be detailed by DRG and/or Service in addition to
payer
– Adjustments and settlements need to factored into a service lineanalysis, since they are specific to payers and service lines.• Prior year settlements• DSH payments (allocate to Medicaid patients rather than Medicare)• Capitation payments• GME and other pass-through payments
– Bad debt can be handled as an expense or net revenue.
35
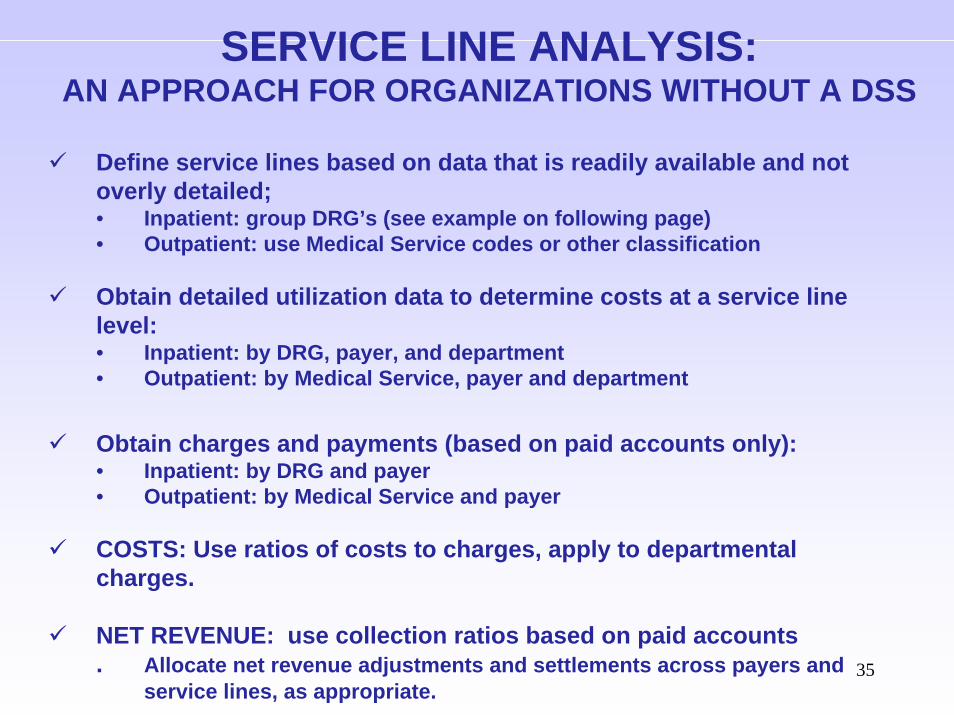
SERVICE LINE ANALYSIS:AN APPROACH FOR ORGANIZATIONS WITHOUT A DSS
Define service lines based on data that is readily available and not overly detailed;• Inpatient: group DRG’s (see example on following page)• Outpatient: use Medical Service codes or other classification
Obtain detailed utilization data to determine costs at a service line level:• Inpatient: by DRG, payer, and department• Outpatient: by Medical Service, payer and department
Obtain charges and payments (based on paid accounts only):• Inpatient: by DRG and payer• Outpatient: by Medical Service and payer
COSTS: Use ratios of costs to charges, apply to departmental charges.
NET REVENUE: use collection ratios based on paid accounts. Allocate net revenue adjustments and settlements across payers and
service lines, as appropriate.
36
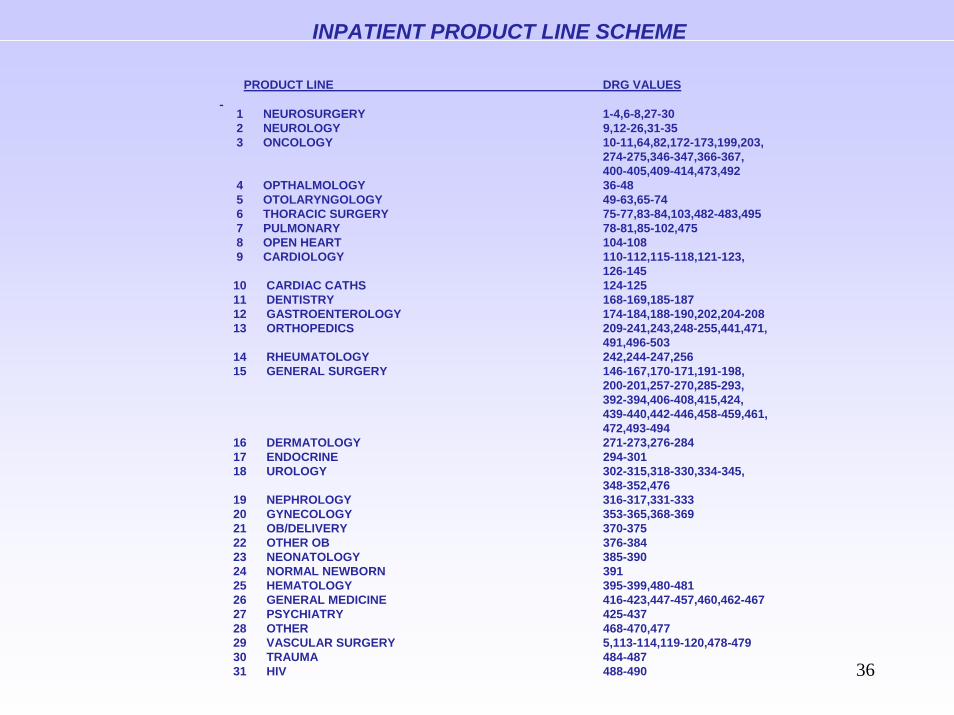
INPATIENT PRODUCT LINE SCHEME
PRODUCT LINE DRG VALUES
1 NEUROSURGERY 1-4,6-8,27-302 NEUROLOGY 9,12-26,31-353 ONCOLOGY 10-11,64,82,172-173,199,203,
274-275,346-347,366-367,400-405,409-414,473,492
4 OPTHALMOLOGY 36-485 OTOLARYNGOLOGY 49-63,65-746 THORACIC SURGERY 75-77,83-84,103,482-483,4957 PULMONARY 78-81,85-102,4758 OPEN HEART 104-1089 CARDIOLOGY 110-112,115-118,121-123,
126-14510 CARDIAC CATHS 124-12511 DENTISTRY 168-169,185-18712 GASTROENTEROLOGY 174-184,188-190,202,204-20813 ORTHOPEDICS 209-241,243,248-255,441,471,
491,496-50314 RHEUMATOLOGY 242,244-247,25615 GENERAL SURGERY 146-167,170-171,191-198,
200-201,257-270,285-293,392-394,406-408,415,424,439-440,442-446,458-459,461,472,493-494
16 DERMATOLOGY 271-273,276-28417 ENDOCRINE 294-30118 UROLOGY 302-315,318-330,334-345,
348-352,47619 NEPHROLOGY 316-317,331-33320 GYNECOLOGY 353-365,368-36921 OB/DELIVERY 370-37522 OTHER OB 376-38423 NEONATOLOGY 385-39024 NORMAL NEWBORN 39125 HEMATOLOGY 395-399,480-48126 GENERAL MEDICINE 416-423,447-457,460,462-46727 PSYCHIATRY 425-43728 OTHER 468-470,47729 VASCULAR SURGERY 5,113-114,119-120,478-47930 TRAUMA 484-48731 HIV 488-490
37
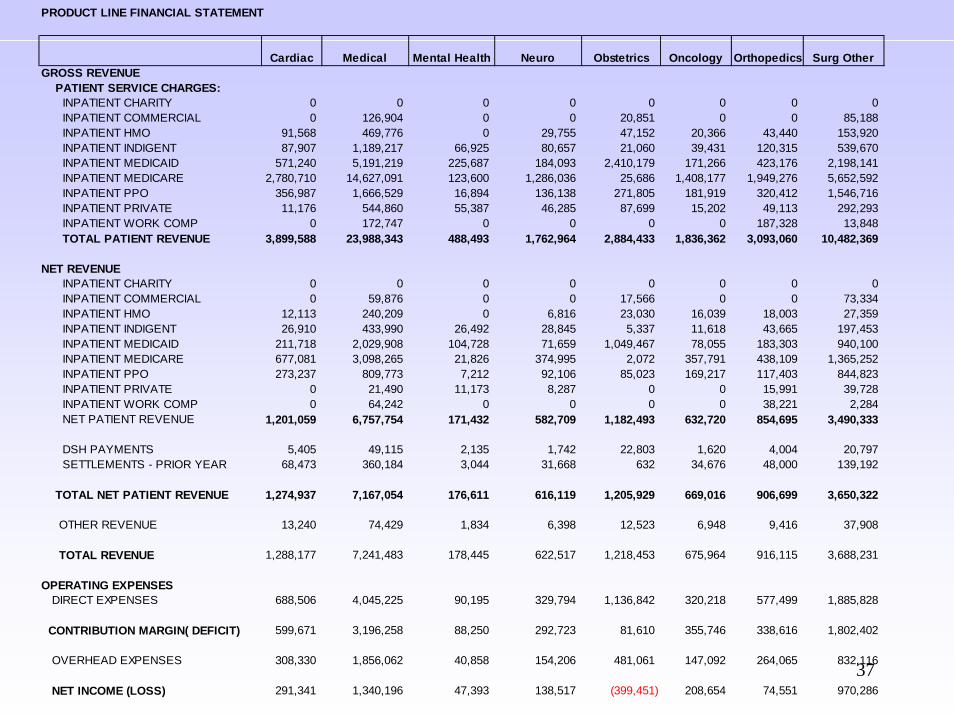
PRODUCT LINE FINANCIAL STATEMENT
Cardiac Medical Mental Health Neuro Obstetrics Oncology Orthopedics Surg OtherGROSS REVENUE PATIENT SERVICE CHARGES: INPATIENT CHARITY 0 0 0 0 0 0 0 0 INPATIENT COMMERCIAL 0 126,904 0 0 20,851 0 0 85,188 INPATIENT HMO 91,568 469,776 0 29,755 47,152 20,366 43,440 153,920 INPATIENT INDIGENT 87,907 1,189,217 66,925 80,657 21,060 39,431 120,315 539,670 INPATIENT MEDICAID 571,240 5,191,219 225,687 184,093 2,410,179 171,266 423,176 2,198,141 INPATIENT MEDICARE 2,780,710 14,627,091 123,600 1,286,036 25,686 1,408,177 1,949,276 5,652,592 INPATIENT PPO 356,987 1,666,529 16,894 136,138 271,805 181,919 320,412 1,546,716 INPATIENT PRIVATE 11,176 544,860 55,387 46,285 87,699 15,202 49,113 292,293 INPATIENT WORK COMP 0 172,747 0 0 0 0 187,328 13,848 TOTAL PATIENT REVENUE 3,899,588 23,988,343 488,493 1,762,964 2,884,433 1,836,362 3,093,060 10,482,369
NET REVENUE INPATIENT CHARITY 0 0 0 0 0 0 0 0 INPATIENT COMMERCIAL 0 59,876 0 0 17,566 0 0 73,334 INPATIENT HMO 12,113 240,209 0 6,816 23,030 16,039 18,003 27,359 INPATIENT INDIGENT 26,910 433,990 26,492 28,845 5,337 11,618 43,665 197,453 INPATIENT MEDICAID 211,718 2,029,908 104,728 71,659 1,049,467 78,055 183,303 940,100 INPATIENT MEDICARE 677,081 3,098,265 21,826 374,995 2,072 357,791 438,109 1,365,252 INPATIENT PPO 273,237 809,773 7,212 92,106 85,023 169,217 117,403 844,823 INPATIENT PRIVATE 0 21,490 11,173 8,287 0 0 15,991 39,728 INPATIENT WORK COMP 0 64,242 0 0 0 0 38,221 2,284 NET PATIENT REVENUE 1,201,059 6,757,754 171,432 582,709 1,182,493 632,720 854,695 3,490,333
DSH PAYMENTS 5,405 49,115 2,135 1,742 22,803 1,620 4,004 20,797 SETTLEMENTS - PRIOR YEAR 68,473 360,184 3,044 31,668 632 34,676 48,000 139,192
TOTAL NET PATIENT REVENUE 1,274,937 7,167,054 176,611 616,119 1,205,929 669,016 906,699 3,650,322
OTHER REVENUE 13,240 74,429 1,834 6,398 12,523 6,948 9,416 37,908
TOTAL REVENUE 1,288,177 7,241,483 178,445 622,517 1,218,453 675,964 916,115 3,688,231
OPERATING EXPENSES DIRECT EXPENSES 688,506 4,045,225 90,195 329,794 1,136,842 320,218 577,499 1,885,828
CONTRIBUTION MARGIN( DEFICIT) 599,671 3,196,258 88,250 292,723 81,610 355,746 338,616 1,802,402
OVERHEAD EXPENSES 308,330 1,856,062 40,858 154,206 481,061 147,092 264,065 832,116
NET INCOME (LOSS) 291,341 1,340,196 47,393 138,517 (399,451) 208,654 74,551 970,286
38
• Our job is to keep our organizations from being “DRIP” (data-rich, information-poor).
• As the volume of available data increases in healthcare organizations, it becomes more challenging to turn this into meaningful information. In essence, our challenge is to condense information:
“The real issue for future technology does not appear to be production of information, and certainly not transmission. Almost anybody can add information. The difficult question is how to reduce it.”
Eli NoamColumbia University
IN CONCLUSION…