Embed Size (px)
Citation preview
Sample to Insight
Tutorial
RNA-Seq with Ingenuity Pathway AnalysisNovember 21, 2017
QIAGEN Aarhus Silkeborgvej 2 Prismet 8000 Aarhus C DenmarkTelephone: +45 70 22 32 44 [email protected]
Tutorial
RNA-Seq with Ingenuity Pathway Analysis 2
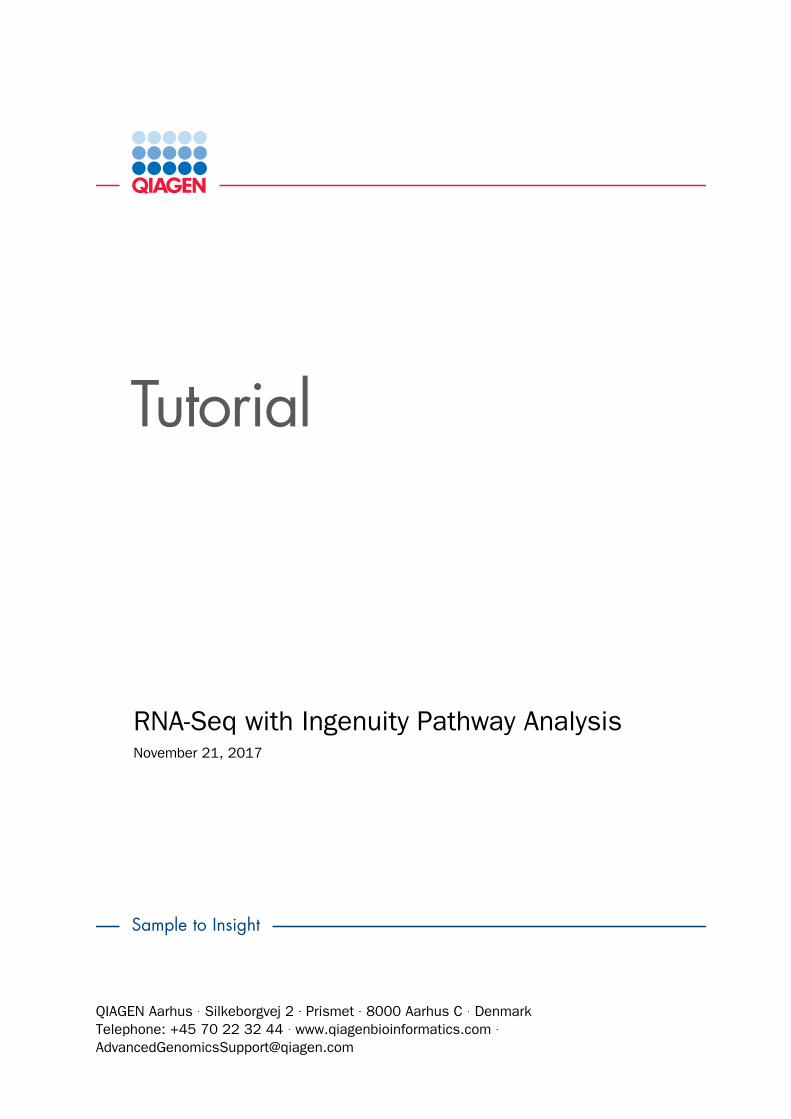
RNA-Seq with Ingenuity Pathway AnalysisThis tutorial will demonstrate the collaborative power of the Biomedical Genomics WorkbenchRNA-Seq tools and the Ingenuity Pathway Analysis plugin to analyze and interpret RNA-Seqexpression data.
Prerequisites For this tutorial, you must be working with the Biomedical Genomics Work-bench 4.0 or higher and have installed the Ingenuity Pathway Analysis plugin. How to installplugins is described here: http://resources.qiagenbioinformatics.com/manuals/biomedicalgenomicsworkbench/current/index.php?manual=Installing_plugins.html, as well as in each plugin manual.
In addition, you must have secured access to Ingenuity Pathway Analysis services. A freetrial account for Ingenuity Pathway Analysis can be created using this link: http://www.ingenuity.com/products/ipa/try-ipa-for-free. Please note that setting up anaccount can take 1-4 business days.
Download and import data
This tutorial will use RNA-Seq data for 4 tumor/normal tissue pairs. To allow the completion ofthe tutorial in a reasonable amount of time, we have reduced the reads to only 5% of the originaldataset, selecting them so they map only to chromosome 20.
The data set includes:
• A subset of the reads from 4 paired samples.
• An Excel spreadsheet that contains the metadata for each tumor/normal pair.
• Three reference sequence for the human hg38 genome, as well as genes and mRNAreference tracks for chromosome 20.
Go through the following steps to download and import the data into the Workbench.
1. Download the sample data from our website: http://resources.qiagenbioinformatics.com/testdata/RNA_Seq_IPA20.zip and unzip the file on your local machine.
2. In Biomedical Genomics Workbench, import the reads via the toolbar: File | Import ( ) |Standard Import ( ). Choose the file called "Reads" and the three references. Leave theimport type set to Automatic and save the imported data in a new folder you can create inyour Navigation Area (called for example RNA-Seq tutorial).
3. Import the metadata table via the toolbar: File | Import ( ) | Import Metadata ( ).
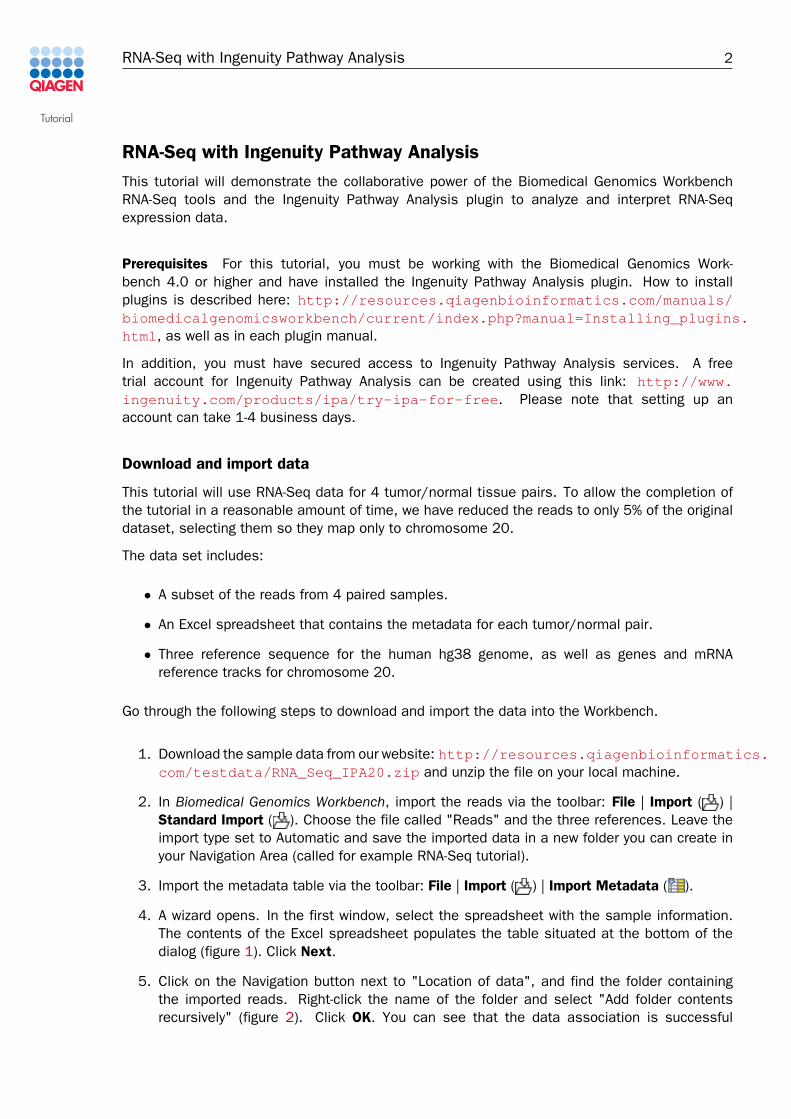
4. A wizard opens. In the first window, select the spreadsheet with the sample information.The contents of the Excel spreadsheet populates the table situated at the bottom of thedialog (figure 1). Click Next.
5. Click on the Navigation button next to "Location of data", and find the folder containingthe imported reads. Right-click the name of the folder and select "Add folder contentsrecursively" (figure 2). Click OK. You can see that the data association is successful
Tutorial
RNA-Seq with Ingenuity Pathway Analysis 3
Figure 1: In the Import Metadata wizard, select the spreadsheet with the sample information.
Figure 2: In the Import Metadata wizard, select the reads to associate with the metadata.
because the metadata has filled in the columns of the Data association table at the bottomof the dialog. Click Next.
6. Select the "RNA-Seq tutorial" folder to save the resulting metadata table.
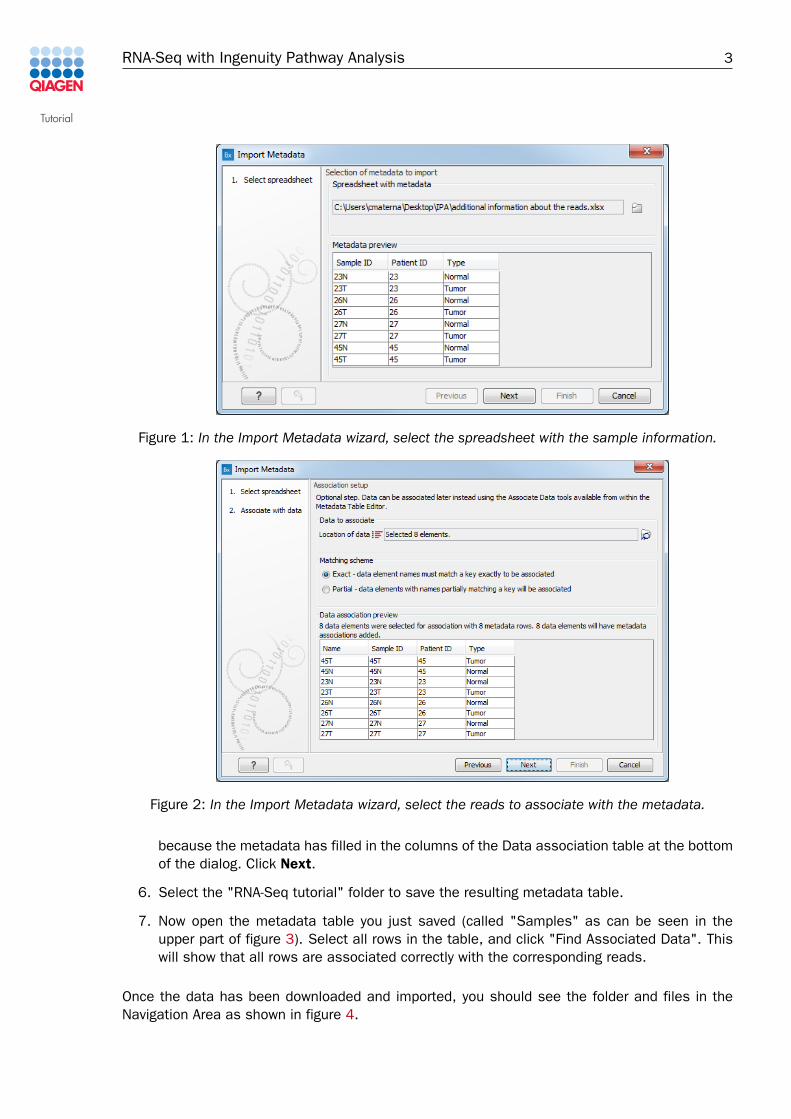
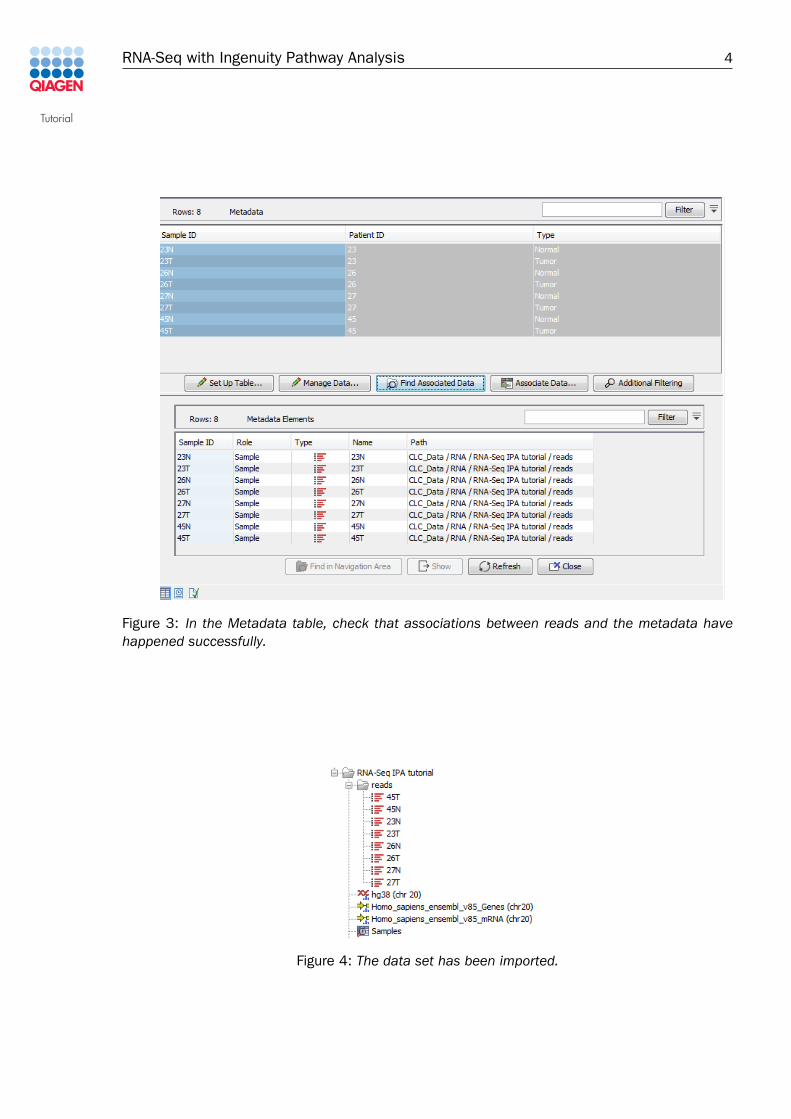
7. Now open the metadata table you just saved (called "Samples" as can be seen in theupper part of figure 3). Select all rows in the table, and click "Find Associated Data". Thiswill show that all rows are associated correctly with the corresponding reads.
Once the data has been downloaded and imported, you should see the folder and files in theNavigation Area as shown in figure 4.
Tutorial
RNA-Seq with Ingenuity Pathway Analysis 4
Figure 3: In the Metadata table, check that associations between reads and the metadata havehappened successfully.
Figure 4: The data set has been imported.
Tutorial
RNA-Seq with Ingenuity Pathway Analysis 5
RNA-Seq quantification step
To map the reads to the reference, we will use the RNA-Seq tool. Go to:
Toolbox | RNA-Seq Analysis | RNA-Seq Analysis ( )
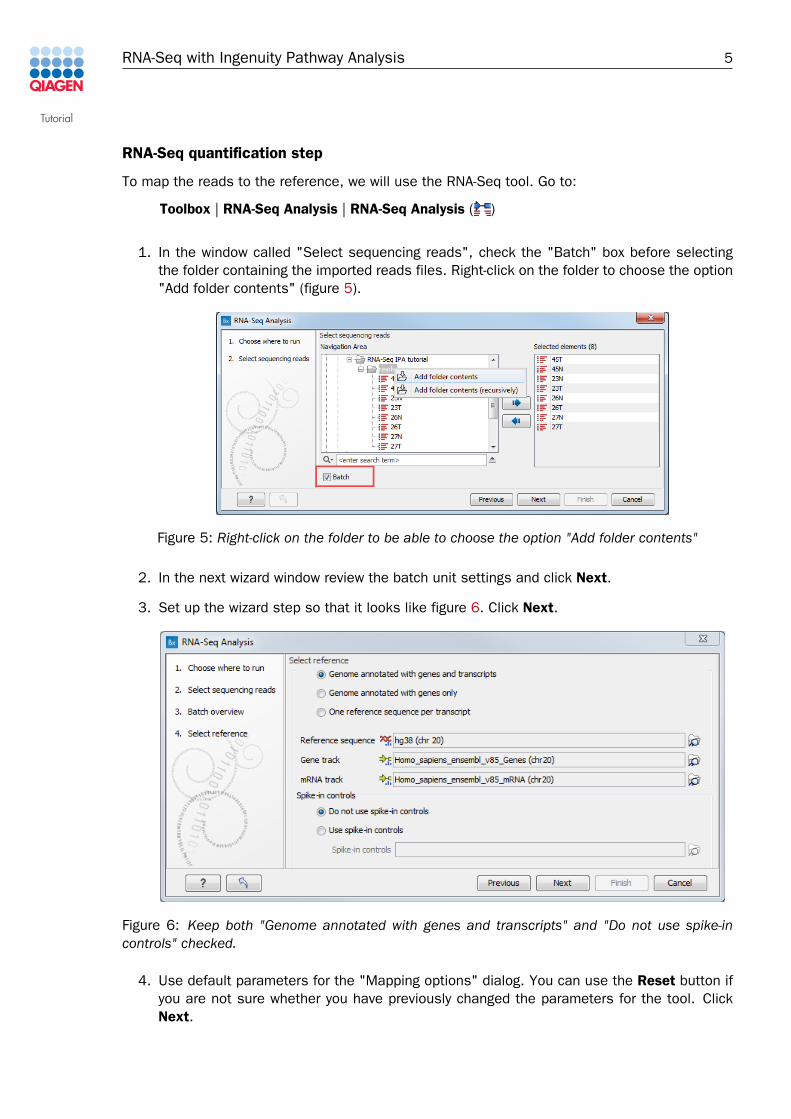
1. In the window called "Select sequencing reads", check the "Batch" box before selectingthe folder containing the imported reads files. Right-click on the folder to choose the option"Add folder contents" (figure 5).
Figure 5: Right-click on the folder to be able to choose the option "Add folder contents"
2. In the next wizard window review the batch unit settings and click Next.
3. Set up the wizard step so that it looks like figure 6. Click Next.
Figure 6: Keep both "Genome annotated with genes and transcripts" and "Do not use spike-incontrols" checked.
4. Use default parameters for the "Mapping options" dialog. You can use the Reset button ifyou are not sure whether you have previously changed the parameters for the tool. ClickNext.
Tutorial
RNA-Seq with Ingenuity Pathway Analysis 6
5. In the "Expression level options" dialog, leave all parameters as default.
6. Save the results in a subfolder called RNA-Seq analysis.
After starting the tool, you can use the progress bar to see how it is progressing (figure 7).
Figure 7: A process called "Batch Process" indicates how many batches have been completed,while the one called "RNA-Seq Analysis" shows the analysis progress of a particular batch unit.
From expression tracks to Ingenuity Pathway Analysis
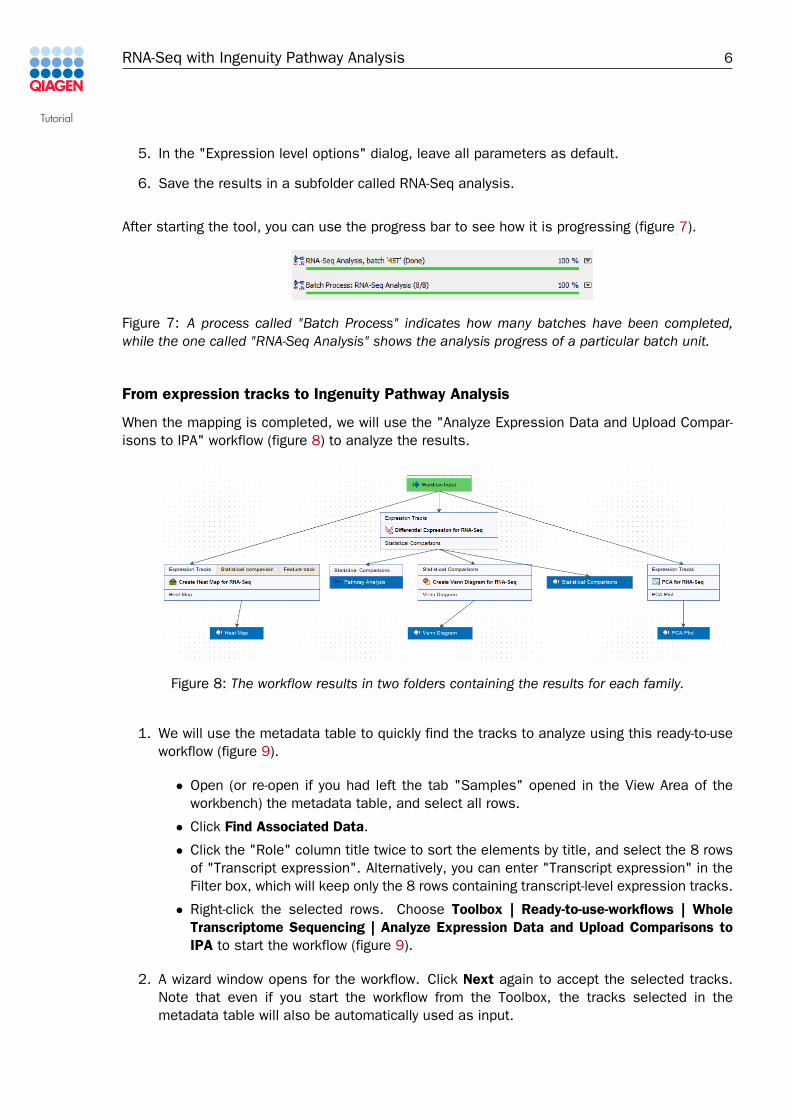
When the mapping is completed, we will use the "Analyze Expression Data and Upload Compar-isons to IPA" workflow (figure 8) to analyze the results.
Figure 8: The workflow results in two folders containing the results for each family.
1. We will use the metadata table to quickly find the tracks to analyze using this ready-to-useworkflow (figure 9).
• Open (or re-open if you had left the tab "Samples" opened in the View Area of theworkbench) the metadata table, and select all rows.
• Click Find Associated Data.
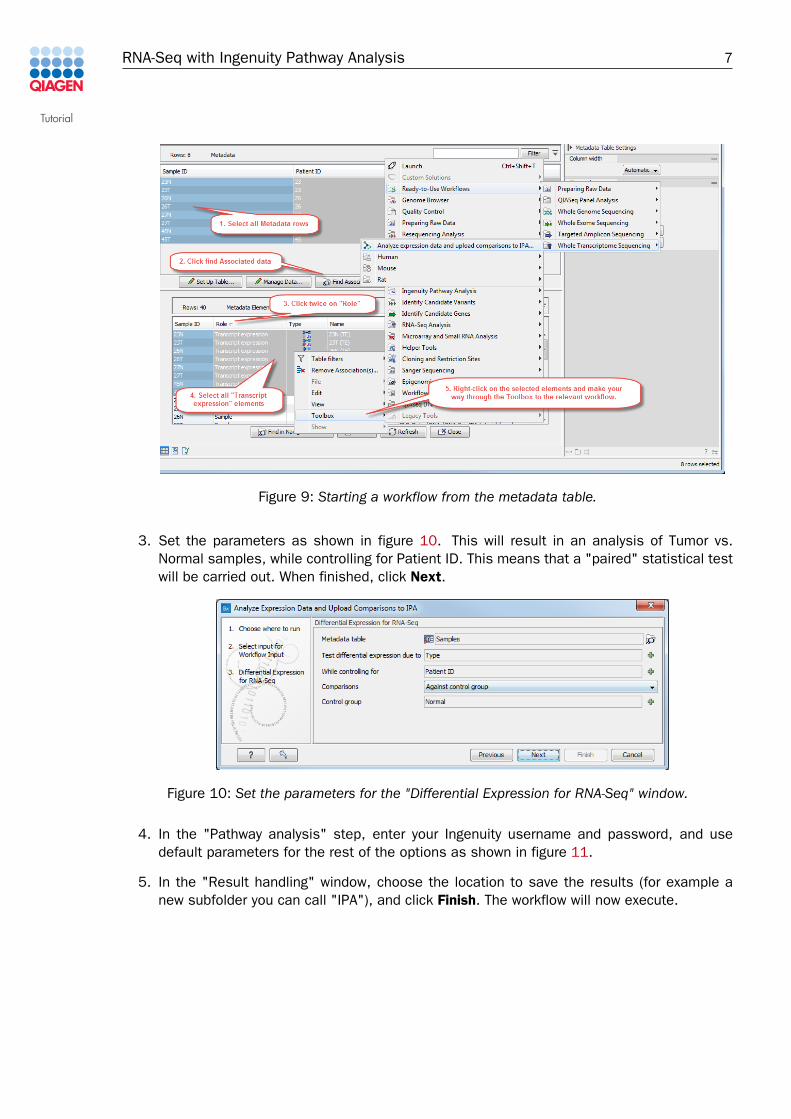
• Click the "Role" column title twice to sort the elements by title, and select the 8 rowsof "Transcript expression". Alternatively, you can enter "Transcript expression" in theFilter box, which will keep only the 8 rows containing transcript-level expression tracks.
• Right-click the selected rows. Choose Toolbox | Ready-to-use-workflows | WholeTranscriptome Sequencing | Analyze Expression Data and Upload Comparisons toIPA to start the workflow (figure 9).
2. A wizard window opens for the workflow. Click Next again to accept the selected tracks.Note that even if you start the workflow from the Toolbox, the tracks selected in themetadata table will also be automatically used as input.
Tutorial
RNA-Seq with Ingenuity Pathway Analysis 7
Figure 9: Starting a workflow from the metadata table.
3. Set the parameters as shown in figure 10. This will result in an analysis of Tumor vs.Normal samples, while controlling for Patient ID. This means that a "paired" statistical testwill be carried out. When finished, click Next.
Figure 10: Set the parameters for the "Differential Expression for RNA-Seq" window.
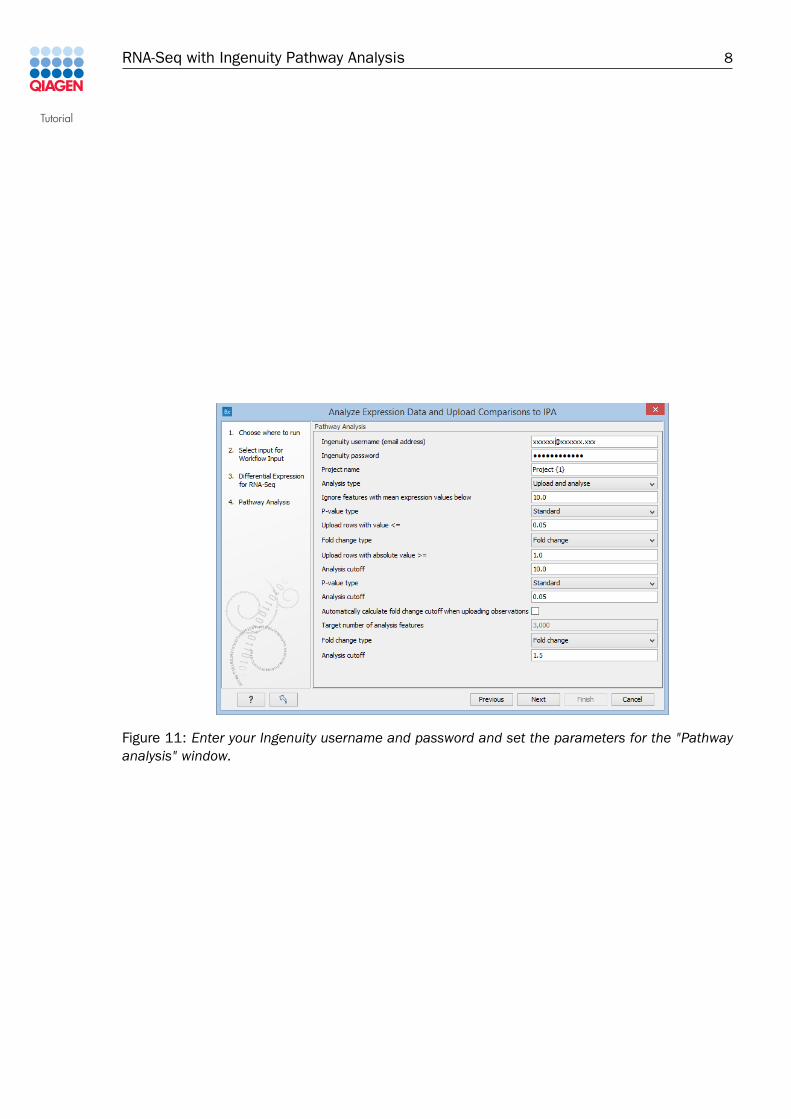
4. In the "Pathway analysis" step, enter your Ingenuity username and password, and usedefault parameters for the rest of the options as shown in figure 11.
5. In the "Result handling" window, choose the location to save the results (for example anew subfolder you can call "IPA"), and click Finish. The workflow will now execute.
Tutorial
RNA-Seq with Ingenuity Pathway Analysis 8
Figure 11: Enter your Ingenuity username and password and set the parameters for the "Pathwayanalysis" window.
Tutorial
RNA-Seq with Ingenuity Pathway Analysis 9
Results visualization and interpretation
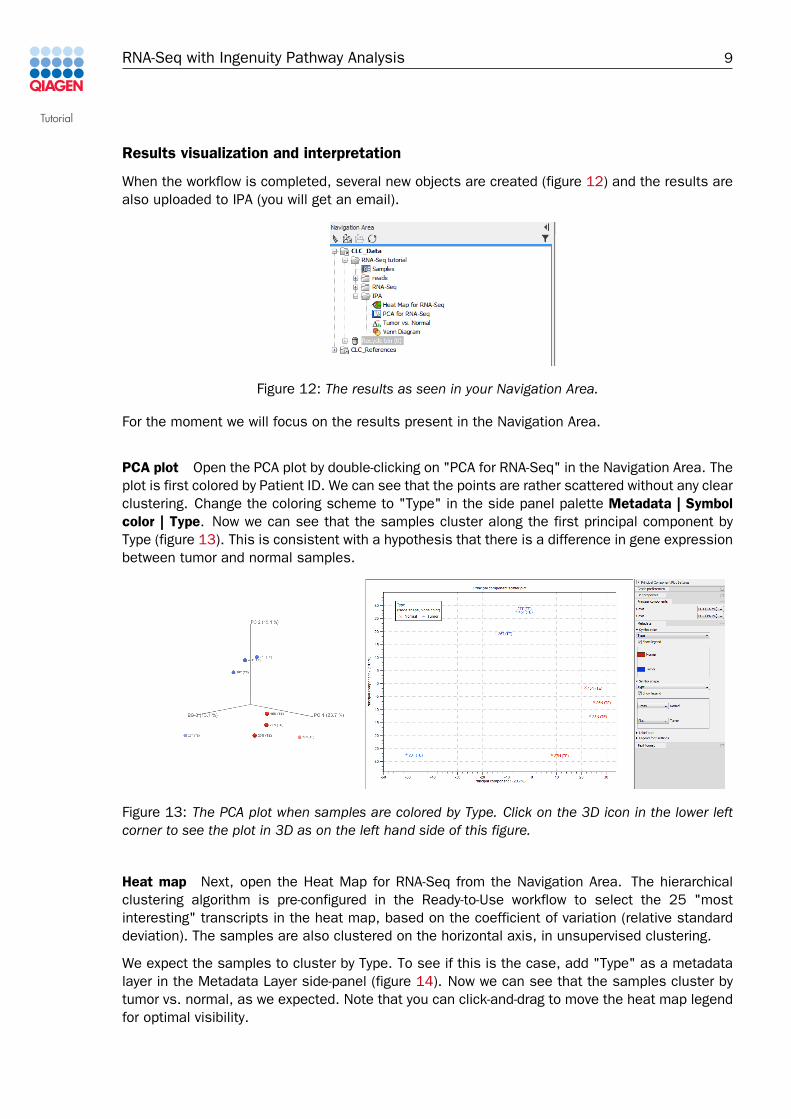
When the workflow is completed, several new objects are created (figure 12) and the results arealso uploaded to IPA (you will get an email).
Figure 12: The results as seen in your Navigation Area.
For the moment we will focus on the results present in the Navigation Area.
PCA plot Open the PCA plot by double-clicking on "PCA for RNA-Seq" in the Navigation Area. Theplot is first colored by Patient ID. We can see that the points are rather scattered without any clearclustering. Change the coloring scheme to "Type" in the side panel palette Metadata | Symbolcolor | Type. Now we can see that the samples cluster along the first principal component byType (figure 13). This is consistent with a hypothesis that there is a difference in gene expressionbetween tumor and normal samples.
Figure 13: The PCA plot when samples are colored by Type. Click on the 3D icon in the lower leftcorner to see the plot in 3D as on the left hand side of this figure.
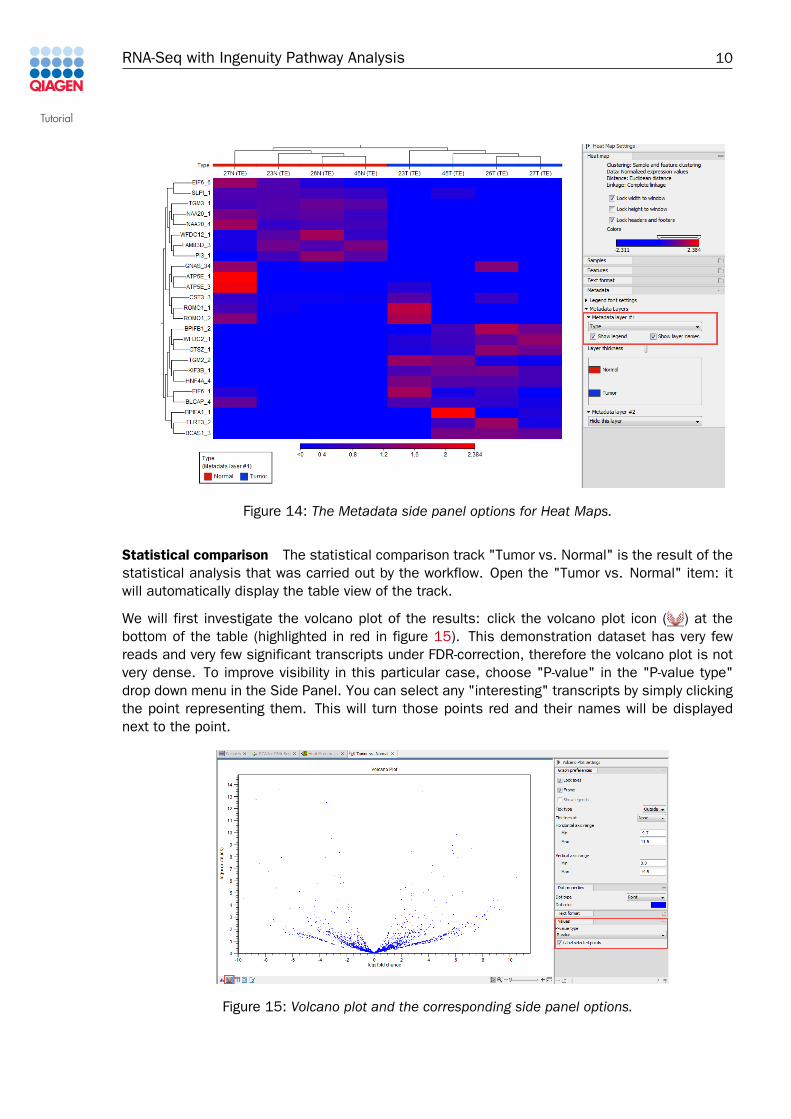
Heat map Next, open the Heat Map for RNA-Seq from the Navigation Area. The hierarchicalclustering algorithm is pre-configured in the Ready-to-Use workflow to select the 25 "mostinteresting" transcripts in the heat map, based on the coefficient of variation (relative standarddeviation). The samples are also clustered on the horizontal axis, in unsupervised clustering.
We expect the samples to cluster by Type. To see if this is the case, add "Type" as a metadatalayer in the Metadata Layer side-panel (figure 14). Now we can see that the samples cluster bytumor vs. normal, as we expected. Note that you can click-and-drag to move the heat map legendfor optimal visibility.
Tutorial
RNA-Seq with Ingenuity Pathway Analysis 10
Figure 14: The Metadata side panel options for Heat Maps.
Statistical comparison The statistical comparison track "Tumor vs. Normal" is the result of thestatistical analysis that was carried out by the workflow. Open the "Tumor vs. Normal" item: itwill automatically display the table view of the track.
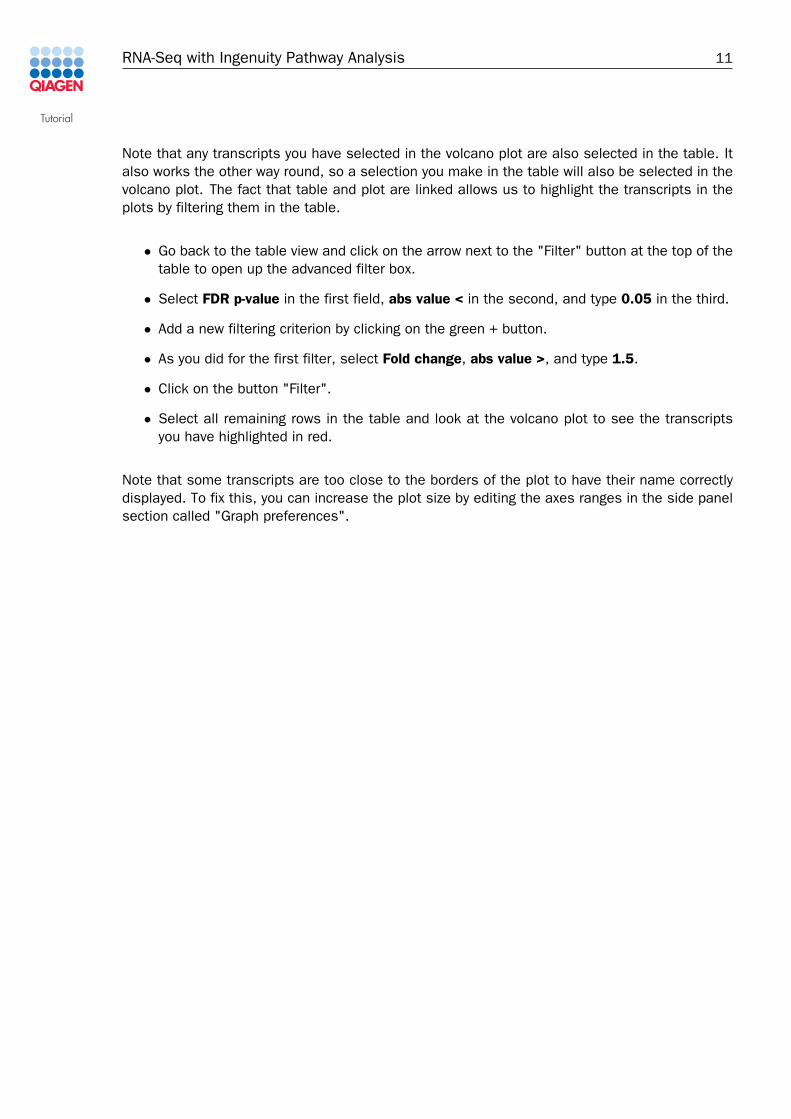
We will first investigate the volcano plot of the results: click the volcano plot icon ( ) at thebottom of the table (highlighted in red in figure 15). This demonstration dataset has very fewreads and very few significant transcripts under FDR-correction, therefore the volcano plot is notvery dense. To improve visibility in this particular case, choose "P-value" in the "P-value type"drop down menu in the Side Panel. You can select any "interesting" transcripts by simply clickingthe point representing them. This will turn those points red and their names will be displayednext to the point.
Figure 15: Volcano plot and the corresponding side panel options.
Tutorial
RNA-Seq with Ingenuity Pathway Analysis 11
Note that any transcripts you have selected in the volcano plot are also selected in the table. Italso works the other way round, so a selection you make in the table will also be selected in thevolcano plot. The fact that table and plot are linked allows us to highlight the transcripts in theplots by filtering them in the table.
• Go back to the table view and click on the arrow next to the "Filter" button at the top of thetable to open up the advanced filter box.
• Select FDR p-value in the first field, abs value < in the second, and type 0.05 in the third.
• Add a new filtering criterion by clicking on the green + button.
• As you did for the first filter, select Fold change, abs value >, and type 1.5.
• Click on the button "Filter".
• Select all remaining rows in the table and look at the volcano plot to see the transcriptsyou have highlighted in red.
Note that some transcripts are too close to the borders of the plot to have their name correctlydisplayed. To fix this, you can increase the plot size by editing the axes ranges in the side panelsection called "Graph preferences".
Tutorial
RNA-Seq with Ingenuity Pathway Analysis 12
Advanced batching by patient
Sometimes it can be useful to compare Tumor vs. Normal results on a patient-specific basis. Forthis, we can execute in batch mode a modified version of the Ready-to-Use workflow to do theanalysis.
1. First reorganize the RNA-seq analysis folder by moving all (TE) results file in a subfoldercalled "Transcript Expression".
2. To edit the "Analyze Expression Data and Upload Comparisons to IPA" workflow, first selectand then right-click the workflow name in the Toolbox Ready-to-use-workflows | WholeTranscriptome Sequencing | Analyze Expression Data and Upload Comparisons to IPA.Choose "Open copy of workflow".
3. Select the "Create Heat Map for RNA-Seq" tool together with its output, and remove it bypressing Delete on your keyboard. Similarly, remove the "PCA for RNA-Seq" tool and itsoutput, as well as the "Venn diagram" tool and its output.
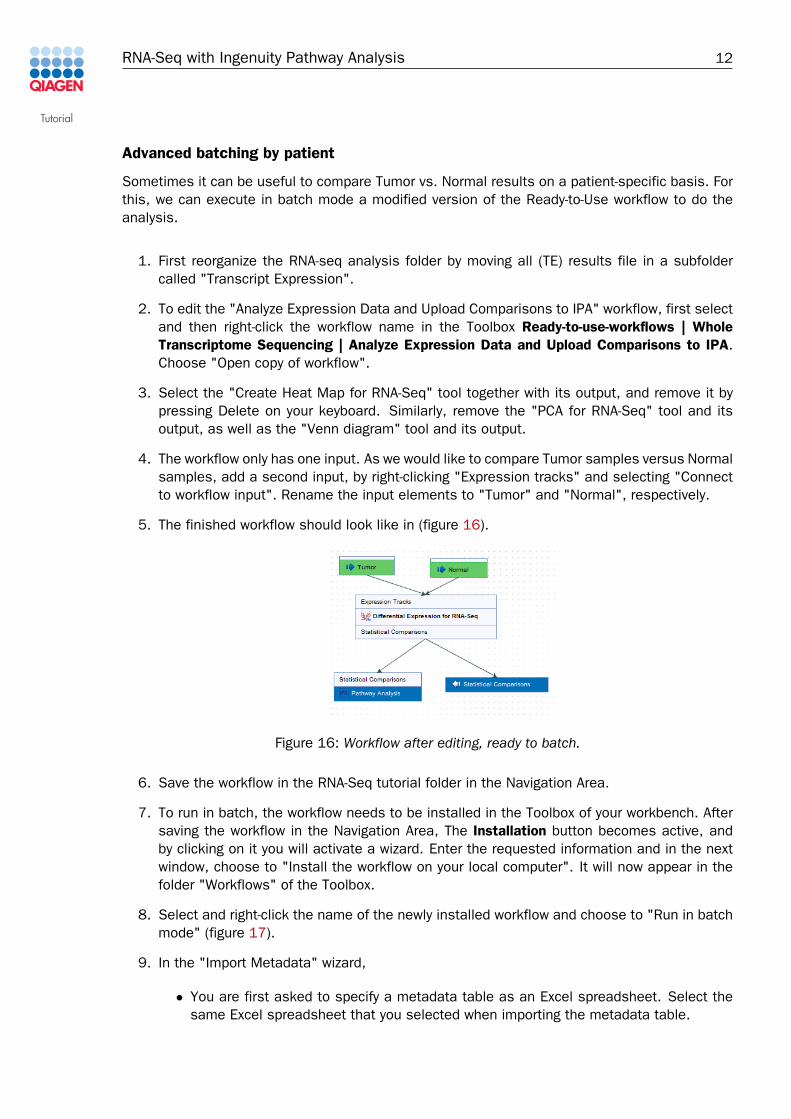
4. The workflow only has one input. As we would like to compare Tumor samples versus Normalsamples, add a second input, by right-clicking "Expression tracks" and selecting "Connectto workflow input". Rename the input elements to "Tumor" and "Normal", respectively.
5. The finished workflow should look like in (figure 16).
Figure 16: Workflow after editing, ready to batch.
6. Save the workflow in the RNA-Seq tutorial folder in the Navigation Area.
7. To run in batch, the workflow needs to be installed in the Toolbox of your workbench. Aftersaving the workflow in the Navigation Area, The Installation button becomes active, andby clicking on it you will activate a wizard. Enter the requested information and in the nextwindow, choose to "Install the workflow on your local computer". It will now appear in thefolder "Workflows" of the Toolbox.
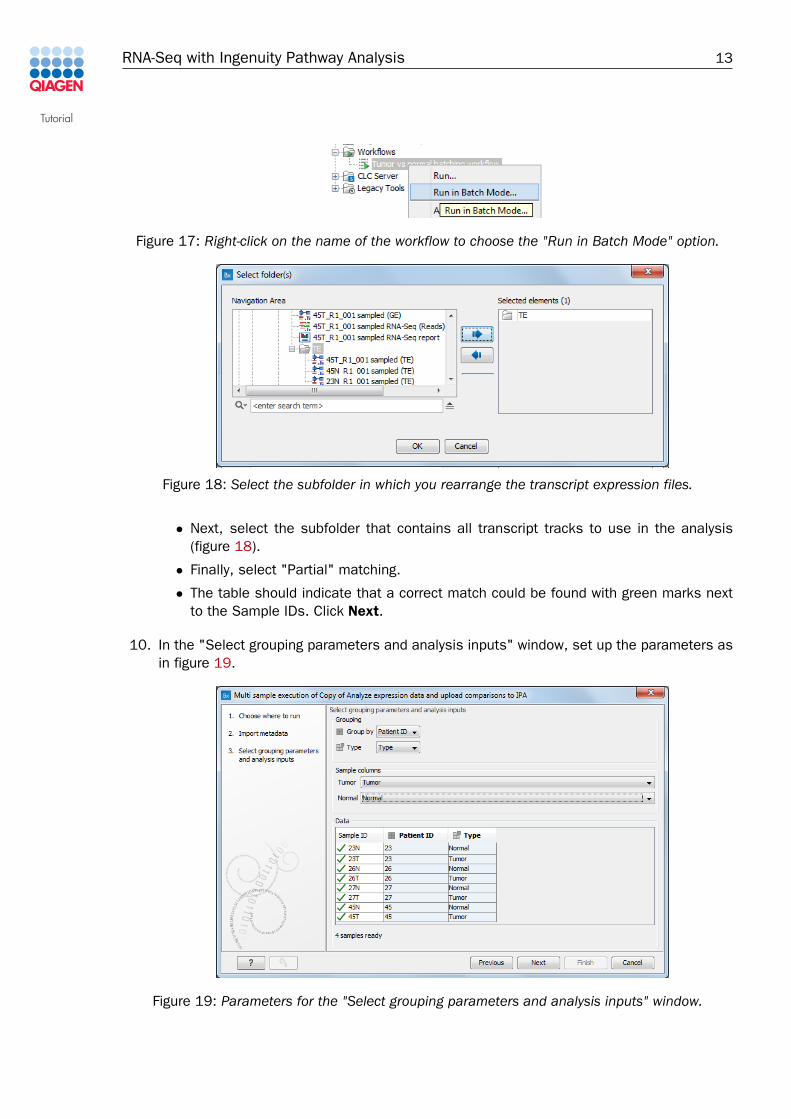
8. Select and right-click the name of the newly installed workflow and choose to "Run in batchmode" (figure 17).
9. In the "Import Metadata" wizard,
• You are first asked to specify a metadata table as an Excel spreadsheet. Select thesame Excel spreadsheet that you selected when importing the metadata table.
Tutorial
RNA-Seq with Ingenuity Pathway Analysis 13
Figure 17: Right-click on the name of the workflow to choose the "Run in Batch Mode" option.
Figure 18: Select the subfolder in which you rearrange the transcript expression files.
• Next, select the subfolder that contains all transcript tracks to use in the analysis(figure 18).
• Finally, select "Partial" matching.
• The table should indicate that a correct match could be found with green marks nextto the Sample IDs. Click Next.
10. In the "Select grouping parameters and analysis inputs" window, set up the parameters asin figure 19.
Figure 19: Parameters for the "Select grouping parameters and analysis inputs" window.
Tutorial
RNA-Seq with Ingenuity Pathway Analysis 14
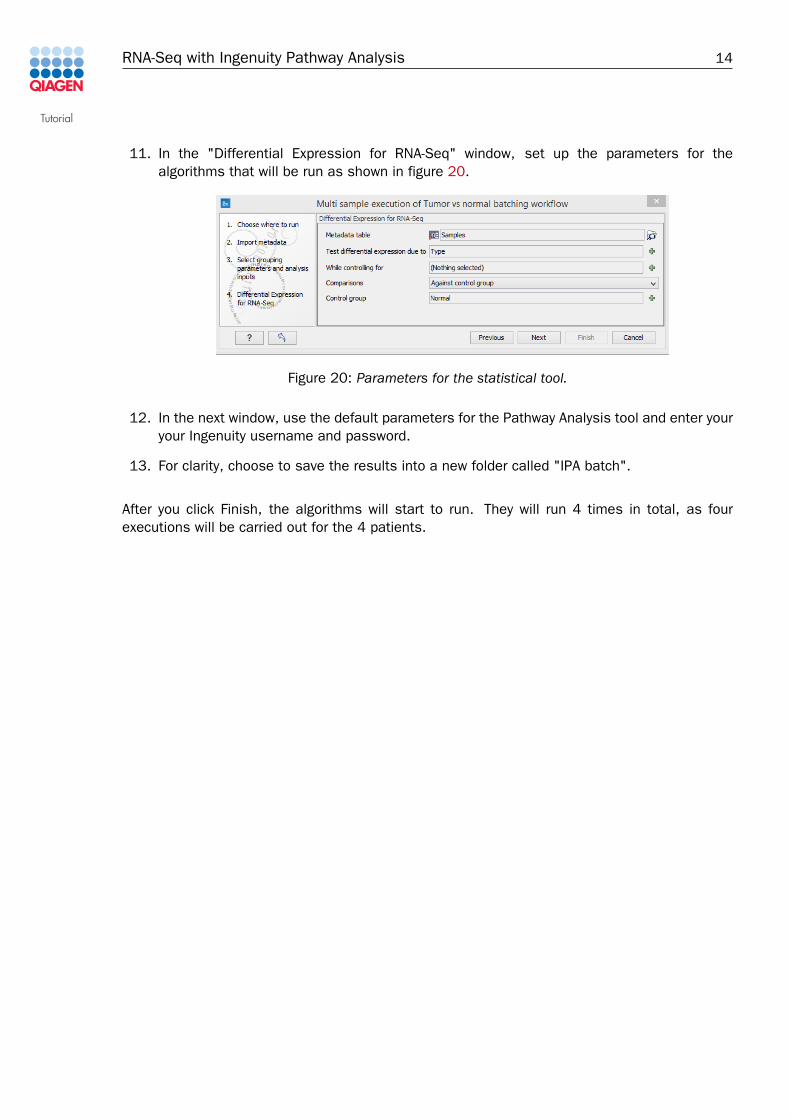
11. In the "Differential Expression for RNA-Seq" window, set up the parameters for thealgorithms that will be run as shown in figure 20.
Figure 20: Parameters for the statistical tool.
12. In the next window, use the default parameters for the Pathway Analysis tool and enter youryour Ingenuity username and password.
13. For clarity, choose to save the results into a new folder called "IPA batch".
After you click Finish, the algorithms will start to run. They will run 4 times in total, as fourexecutions will be carried out for the 4 patients.
Tutorial
RNA-Seq with Ingenuity Pathway Analysis 15
Results of the advanced batching by patient
We will now analyze the results of the advanced batching of the workflow. Each batch unit issaved in a different subfolder within the "IPA batch folder".
Venn diagram
1. First, rename the output objects by appending the patient ID to the names of the resultingstatistical comparison tracks (figure 21).
Figure 21: Rename the "Tumor vs. Normal" object in each folder by appending the folder name toit.
2. Next, go to: Toolbox | RNA-Seq analysis | Create Venn Diagram for RNA-Seq. You can alsostart this tool by using the Launch button and then beginning to type "venn".
3. In the first wizard window, select the four output tracks you just renamed.
4. Choose to open the result.
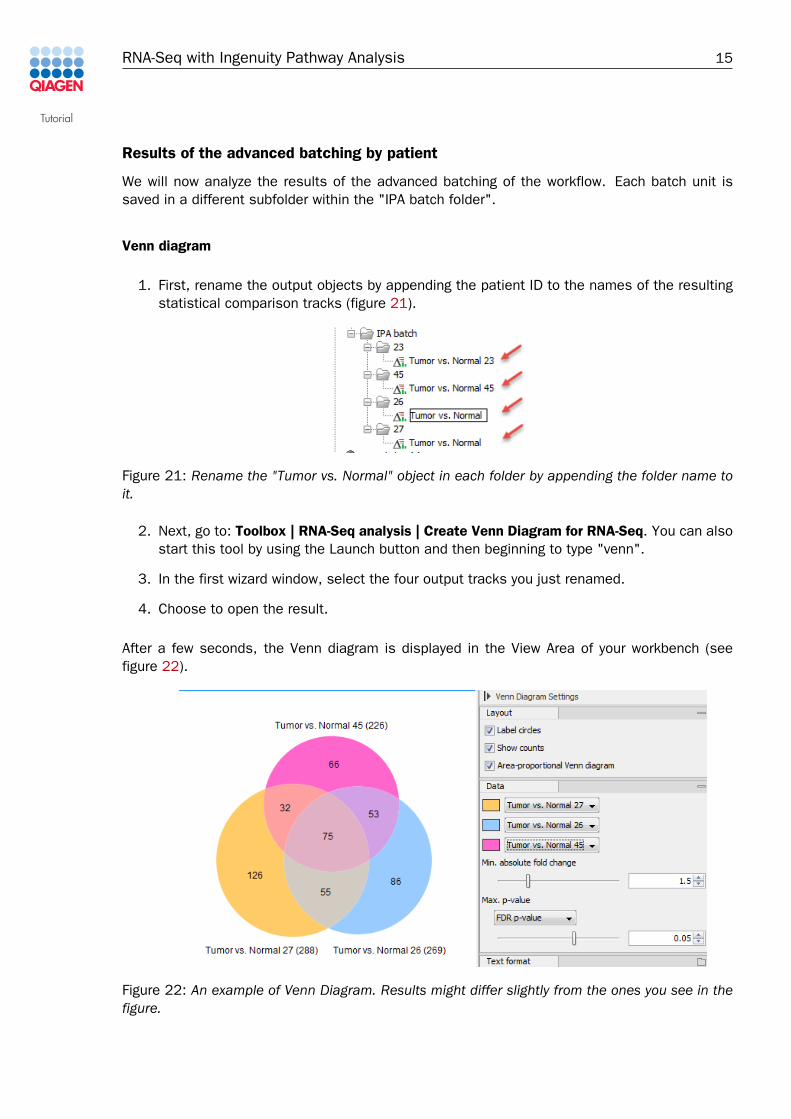
After a few seconds, the Venn diagram is displayed in the View Area of your workbench (seefigure 22).
Figure 22: An example of Venn Diagram. Results might differ slightly from the ones you see in thefigure.
Tutorial
RNA-Seq with Ingenuity Pathway Analysis 16
The Venn diagram shows how many transcripts were detected to be differentially expressedin each comparison. Note: only 3 comparisons can be visualized at a time. You can selectwhich comparisons should be visualized in the side panel. In this example, 76 transcripts weredetected to be differentially expressed in all three comparisons.
Select the middle intersection with the transcripts that were differentially expressed in allcomparisons. With the selection maintained, go to the table view of the Venn diagram. The sametranscripts will still be selected in the table. It can be hard to find them, however you can createa new selection only containing selected transcripts by clicking the Create from selection button.This will open a new table in split view. This table contains only the 76 transcripts that weredifferentially expressed in all three comparisons for the example above.
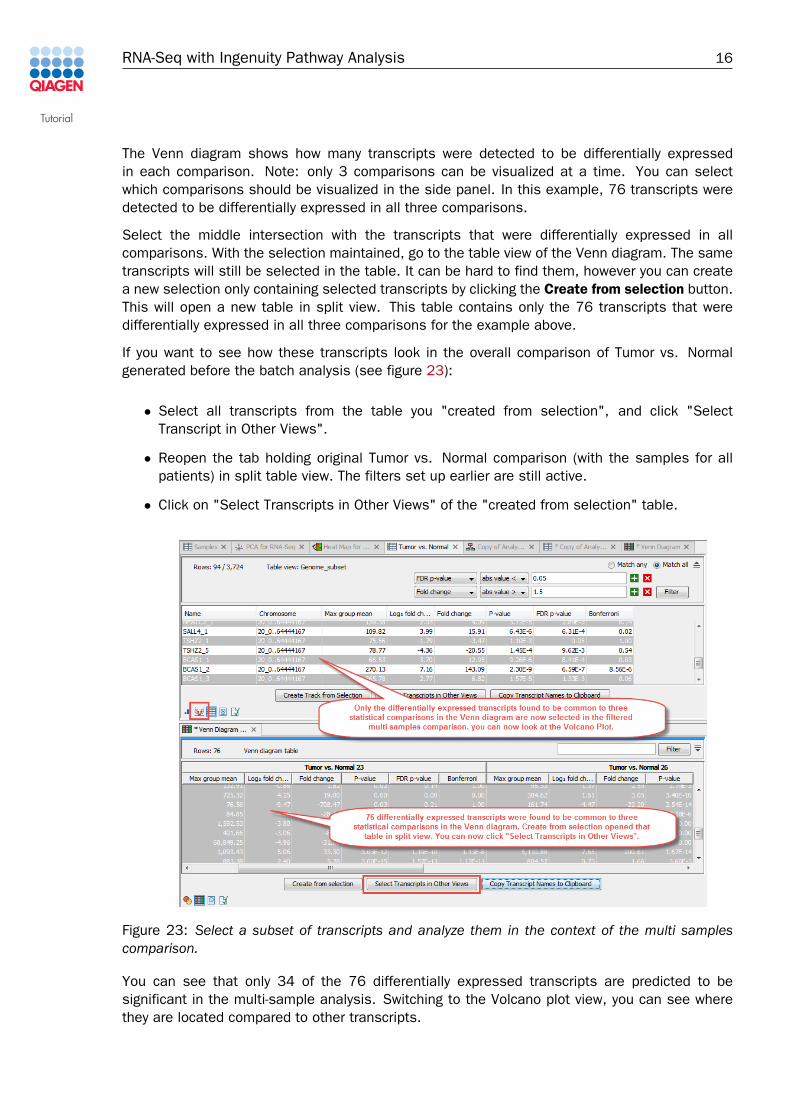
If you want to see how these transcripts look in the overall comparison of Tumor vs. Normalgenerated before the batch analysis (see figure 23):
• Select all transcripts from the table you "created from selection", and click "SelectTranscript in Other Views".
• Reopen the tab holding original Tumor vs. Normal comparison (with the samples for allpatients) in split table view. The filters set up earlier are still active.
• Click on "Select Transcripts in Other Views" of the "created from selection" table.
Figure 23: Select a subset of transcripts and analyze them in the context of the multi samplescomparison.
You can see that only 34 of the 76 differentially expressed transcripts are predicted to besignificant in the multi-sample analysis. Switching to the Volcano plot view, you can see wherethey are located compared to other transcripts.

Tutorial
RNA-Seq with Ingenuity Pathway Analysis 17
For the sake of completeness, we mention that the "Select transcripts in other views" buttonwill allow you to do synchronized selections between expression tracks, statistical comparisontracks (including volcano plots), and the table view of Venn diagrams.
Finally, you can also Launch IPA to look for genes and associated pathways that are differentiallyexpressed between tumor and normal samples. Remember that we are only analyzing genespresent on chromosome 20 in this tutorial, and thus IPA might not output a comprehensivepicture. For more information on IPA, see https://www.qiagenbioinformatics.com/products/ingenuity-pathway-analysis/.
--------------------------------------------------------------------