Embed Size (px)
Citation preview
arX
iv:0
904.
3861
v1 [
astr
o-ph
.CO
] 24
Apr
200
9
Mon. Not. R. Astron. Soc.000, 000–000 (0000) Printed 29 October 2018 (MN LATEX style file v2.2)
Two-dimensional kinematics of SLACS lenses – II.Combined lensing and dynamics analysis of early-type galaxiesat z = 0.08− 0.33
Matteo Barnabe1⋆, Oliver Czoske1, Leon V. E. Koopmans1, Tommaso Treu2,Adam S. Bolton3 and Raphael Gavazzi41Kapteyn Astronomical Institute, University of Groningen,PO Box 800, 9700 AV Groningen, the Netherlands2Department of Physics, University of California, Santa Barbara, CA 93101, USA3Institute for Astronomy, University of Hawaii, 2680 Woodlawn Drive, Honolulu, HI 96822-1897, USA4Institut d’Astrophysique de Paris, CNRS, UMR 7095, Universite Pierre et Marie Curie, 98bis Bd Arago, 75014 Paris, France
Accepted 2009 April 18. Received 2009 March 30; in original form 2009 January 12.
ABSTRACTWe present the first detailed analysis of the mass and dynamical structure of a sample ofsix early-type lens galaxies, selected from the Sloan Lens ACS Survey, in the redshift range0.08 . z . 0.33. Both Hubble Space Telescope (HST)/ACS high-resolution imaging andVLT VIMOS integral field spectroscopy are available for these systems. The galaxies aremodelled—under the assumptions of axial symmetry and two-integral stellar distributionfunction—by making use of thecauldron code, which self-consistently combines gravita-tional lensing and stellar dynamics, and is fully embedded within the framework of Bayesianstatistics. The principal results of this study are: (i) allgalaxies in the sample are well de-scribed by a simple axisymmetric power-law profile for the total density, with a logarithmicslopeγ′ very close to isothermal (〈γ′〉 = 1.98±0.05 and an intrinsic spread close to 5 per cent)showing no evidence of evolution over the probed range of redshift; (ii) the axial ratio of thetotal density distribution is rounder than 0.65 and in all cases, except for a fast rotator, doesnot deviate significantly from the flattening of the intrinsic stellar distribution; (iii) the darkmatter fraction within the effective radius has a lower limit of about 15 to 30 per cent; (iv)the sample galaxies are only mildly anisotropic, with|δ| 6 0.16; (v) the physical distinctionamong slow and fast rotators, quantified by thev/σ ratio and the intrinsic angular momentum,is already present atz& 0.1. Altogether, early-type galaxies atz= 0.08− 0.33 are found to bemarkedly smooth and almost isothermal systems, structurally and dynamically very similar totheir nearby counterparts. This work confirms the effectiveness of the combined lensing anddynamics analysis as a powerful technique for the study of early-type galaxies beyond thelocal Universe.
Key words: gravitational lensing — galaxies: elliptical and lenticular, cD — galaxies: kine-matics and dynamics — galaxies: structure.
1 INTRODUCTION
The currently favoured cosmological scenario, the so-calledΛCDM (cold dark matter) paradigm, has been remarkably success-ful at explaining the large scale structure of the Universe.In thenon-linear regime, below several Mpc, however, the situation is lesscertain, and a full understanding of the galaxy formation and evo-lution processes remains a work in progress.
Within the standard paradigm, massive early-type galaxiesarethought to be the end-product of hierarchical merging of lowermass galaxies, and to be embedded in extended dark matter haloes
⋆ E-mail: [email protected]
(e.g. Toomre 1977; White & Frenk 1991; Barnes 1992; Cole et al.2000). Numerical studies of merging galaxies (e.g. Naab et al.2006; Jesseit et al. 2007) have managed to reproduce a numberofobservational characteristics of massive ellipticals, and have madeclear that stringent tests of galaxy formation models require a de-tailed and reliable description of the intrinsic physical propertiesof real early-type galaxies, such as their mass density distributionand orbital structure. Furthermore, knowledge of how thesegalaxyproperties evolve through time would provide much needed infor-mation and even stronger constraints on the theoretical predictions.
In the last decades, local early-type galaxies have been theobject of substantial observational and modelling efforts. Thesestudies have employed a variety of tracers ranging from stel-
c© 0000 RAS
2 M. Barnabe et al.
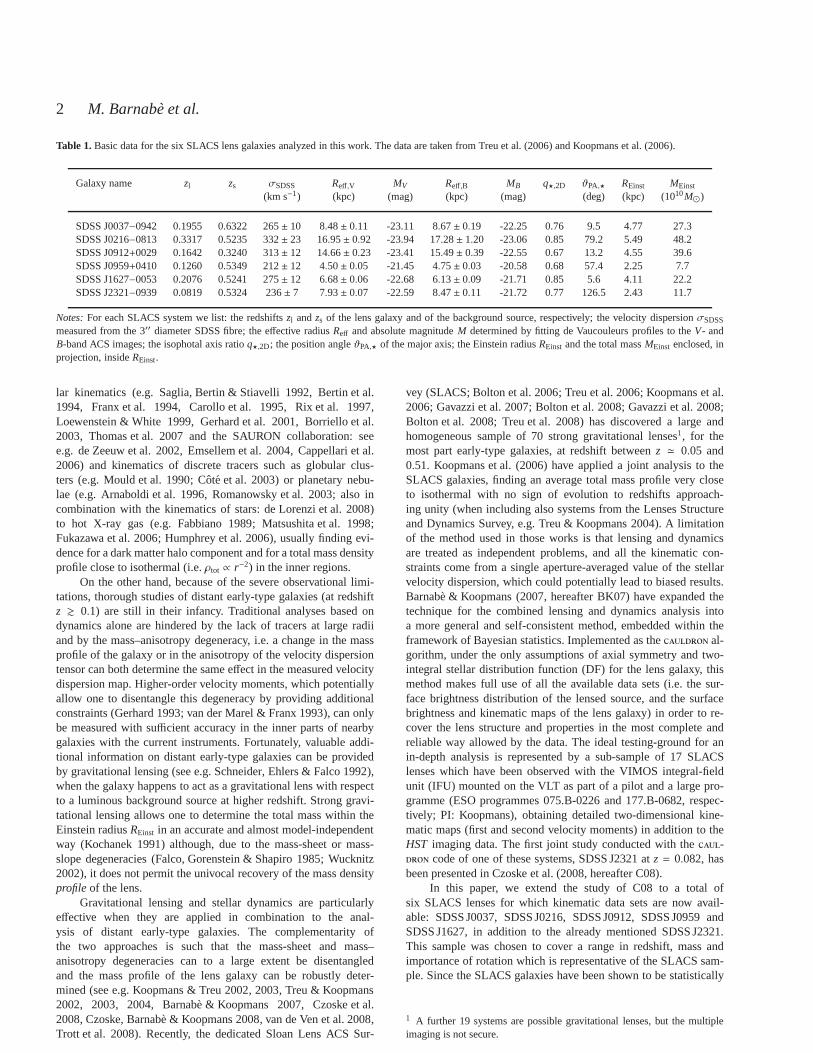
Table 1.Basic data for the six SLACS lens galaxies analyzed in this work. The data are taken from Treu et al. (2006) and Koopmans et al. (2006).
Galaxy name zl zs σSDSS Reff,V MV Reff,B MB q⋆,2D ϑPA,⋆ REinst MEinst
(km s−1) (kpc) (mag) (kpc) (mag) (deg) (kpc) (1010M⊙)
SDSS J0037−0942 0.1955 0.6322 265± 10 8.48± 0.11 -23.11 8.67± 0.19 -22.25 0.76 9.5 4.77 27.3SDSS J0216−0813 0.3317 0.5235 332± 23 16.95± 0.92 -23.94 17.28± 1.20 -23.06 0.85 79.2 5.49 48.2SDSS J0912+0029 0.1642 0.3240 313± 12 14.66± 0.23 -23.41 15.49± 0.39 -22.55 0.67 13.2 4.55 39.6SDSS J0959+0410 0.1260 0.5349 212± 12 4.50± 0.05 -21.45 4.75± 0.03 -20.58 0.68 57.4 2.25 7.7SDSS J1627−0053 0.2076 0.5241 275± 12 6.68± 0.06 -22.68 6.13± 0.09 -21.71 0.85 5.6 4.11 22.2SDSS J2321−0939 0.0819 0.5324 236± 7 7.93± 0.07 -22.59 8.47± 0.11 -21.72 0.77 126.5 2.43 11.7
Notes:For each SLACS system we list: the redshiftszl andzs of the lens galaxy and of the background source, respectively; the velocity dispersionσSDSS
measured from the 3′′ diameter SDSS fibre; the effective radiusReff and absolute magnitudeM determined by fitting de Vaucouleurs profiles to theV- andB-band ACS images; the isophotal axis ratioq⋆,2D; the position angleϑPA,⋆ of the major axis; the Einstein radiusREinst and the total massMEinst enclosed, inprojection, insideREinst.
lar kinematics (e.g. Saglia, Bertin & Stiavelli 1992, Bertin et al.1994, Franx et al. 1994, Carollo et al. 1995, Rix et al. 1997,Loewenstein & White 1999, Gerhard et al. 2001, Borriello et al.2003, Thomas et al. 2007 and the SAURON collaboration: seee.g. de Zeeuw et al. 2002, Emsellem et al. 2004, Cappellari etal.2006) and kinematics of discrete tracers such as globular clus-ters (e.g. Mould et al. 1990; Cote et al. 2003) or planetarynebu-lae (e.g. Arnaboldi et al. 1996, Romanowsky et al. 2003; alsoincombination with the kinematics of stars: de Lorenzi et al. 2008)to hot X-ray gas (e.g. Fabbiano 1989; Matsushita et al. 1998;Fukazawa et al. 2006; Humphrey et al. 2006), usually finding evi-dence for a dark matter halo component and for a total mass densityprofile close to isothermal (i.e.ρtot ∝ r−2) in the inner regions.
On the other hand, because of the severe observational limi-tations, thorough studies of distant early-type galaxies (at redshiftz & 0.1) are still in their infancy. Traditional analyses based ondynamics alone are hindered by the lack of tracers at large radiiand by the mass–anisotropy degeneracy, i.e. a change in the massprofile of the galaxy or in the anisotropy of the velocity dispersiontensor can both determine the same effect in the measured velocitydispersion map. Higher-order velocity moments, which potentiallyallow one to disentangle this degeneracy by providing additionalconstraints (Gerhard 1993; van der Marel & Franx 1993), can onlybe measured with sufficient accuracy in the inner parts of nearbygalaxies with the current instruments. Fortunately, valuable addi-tional information on distant early-type galaxies can be providedby gravitational lensing (see e.g. Schneider, Ehlers & Falco 1992),when the galaxy happens to act as a gravitational lens with respectto a luminous background source at higher redshift. Strong gravi-tational lensing allows one to determine the total mass within theEinstein radiusREinst in an accurate and almost model-independentway (Kochanek 1991) although, due to the mass-sheet or mass-slope degeneracies (Falco, Gorenstein & Shapiro 1985; Wucknitz2002), it does not permit the univocal recovery of the mass densityprofile of the lens.
Gravitational lensing and stellar dynamics are particularlyeffective when they are applied in combination to the anal-ysis of distant early-type galaxies. The complementarity ofthe two approaches is such that the mass-sheet and mass–anisotropy degeneracies can to a large extent be disentangledand the mass profile of the lens galaxy can be robustly deter-mined (see e.g. Koopmans & Treu 2002, 2003, Treu & Koopmans2002, 2003, 2004, Barnabe & Koopmans 2007, Czoske et al.2008, Czoske, Barnabe & Koopmans 2008, van de Ven et al. 2008,Trott et al. 2008). Recently, the dedicated Sloan Lens ACS Sur-
vey (SLACS; Bolton et al. 2006; Treu et al. 2006; Koopmans et al.2006; Gavazzi et al. 2007; Bolton et al. 2008; Gavazzi et al. 2008;Bolton et al. 2008; Treu et al. 2008) has discovered a large andhomogeneous sample of 70 strong gravitational lenses1, for themost part early-type galaxies, at redshift betweenz ≃ 0.05 and0.51. Koopmans et al. (2006) have applied a joint analysis to theSLACS galaxies, finding an average total mass profile very closeto isothermal with no sign of evolution to redshifts approach-ing unity (when including also systems from the Lenses Structureand Dynamics Survey, e.g. Treu & Koopmans 2004). A limitationof the method used in those works is that lensing and dynamicsare treated as independent problems, and all the kinematic con-straints come from a single aperture-averaged value of the stellarvelocity dispersion, which could potentially lead to biased results.Barnabe & Koopmans (2007, hereafter BK07) have expanded thetechnique for the combined lensing and dynamics analysis intoa more general and self-consistent method, embedded withintheframework of Bayesian statistics. Implemented as thecauldron al-gorithm, under the only assumptions of axial symmetry and two-integral stellar distribution function (DF) for the lens galaxy, thismethod makes full use of all the available data sets (i.e. thesur-face brightness distribution of the lensed source, and the surfacebrightness and kinematic maps of the lens galaxy) in order tore-cover the lens structure and properties in the most completeandreliable way allowed by the data. The ideal testing-ground for anin-depth analysis is represented by a sub-sample of 17 SLACSlenses which have been observed with the VIMOS integral-fieldunit (IFU) mounted on the VLT as part of a pilot and a large pro-gramme (ESO programmes 075.B-0226 and 177.B-0682, respec-tively; PI: Koopmans), obtaining detailed two-dimensional kine-matic maps (first and second velocity moments) in addition totheHST imaging data. The first joint study conducted with thecaul-dron code of one of these systems, SDSS J2321 atz = 0.082, hasbeen presented in Czoske et al. (2008, hereafter C08).
In this paper, we extend the study of C08 to a total ofsix SLACS lenses for which kinematic data sets are now avail-able: SDSS J0037, SDSS J0216, SDSS J0912, SDSS J0959 andSDSS J1627, in addition to the already mentioned SDSS J2321.This sample was chosen to cover a range in redshift, mass andimportance of rotation which is representative of the SLACSsam-ple. Since the SLACS galaxies have been shown to be statistically
1 A further 19 systems are possible gravitational lenses, butthe multipleimaging is not secure.
c© 0000 RAS, MNRAS000, 000–000
Two-dimensional kinematics of SLACS lenses – II.3
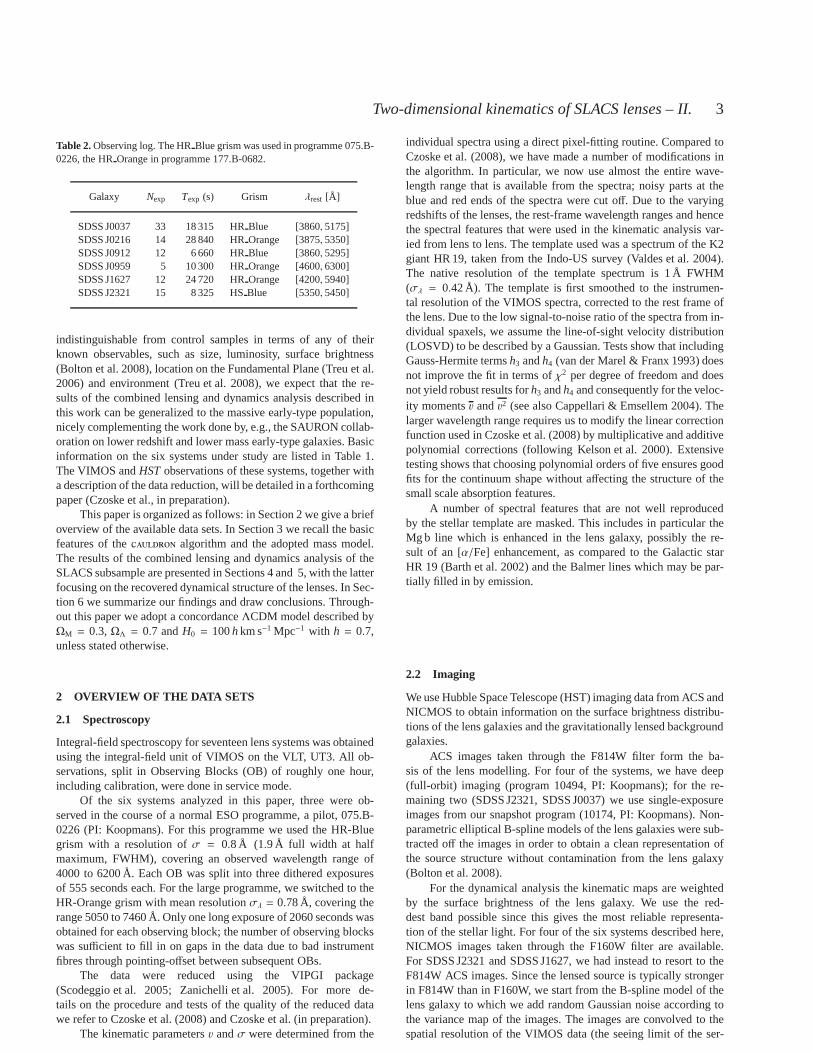
Table 2.Observing log. The HRBlue grism was used in programme 075.B-0226, the HROrange in programme 177.B-0682.
Galaxy Nexp Texp (s) Grism λrest [Å]
SDSS J0037 33 18 315 HRBlue [3860, 5175]SDSS J0216 14 28 840 HROrange [3875, 5350]SDSS J0912 12 6 660 HRBlue [3860, 5295]SDSS J0959 5 10 300 HROrange [4600, 6300]SDSS J1627 12 24 720 HROrange [4200, 5940]SDSS J2321 15 8 325 HSBlue [5350, 5450]
indistinguishable from control samples in terms of any of theirknown observables, such as size, luminosity, surface brightness(Bolton et al. 2008), location on the Fundamental Plane (Treu et al.2006) and environment (Treu et al. 2008), we expect that the re-sults of the combined lensing and dynamics analysis described inthis work can be generalized to the massive early-type population,nicely complementing the work done by, e.g., the SAURON collab-oration on lower redshift and lower mass early-type galaxies. Basicinformation on the six systems under study are listed in Table 1.The VIMOS andHSTobservations of these systems, together witha description of the data reduction, will be detailed in a forthcomingpaper (Czoske et al., in preparation).
This paper is organized as follows: in Section 2 we give a briefoverview of the available data sets. In Section 3 we recall the basicfeatures of thecauldron algorithm and the adopted mass model.The results of the combined lensing and dynamics analysis oftheSLACS subsample are presented in Sections 4 and 5, with the latterfocusing on the recovered dynamical structure of the lenses. In Sec-tion 6 we summarize our findings and draw conclusions. Through-out this paper we adopt a concordanceΛCDM model described byΩM = 0.3, ΩΛ = 0.7 andH0 = 100hkm s−1 Mpc−1 with h = 0.7,unless stated otherwise.
2 OVERVIEW OF THE DATA SETS
2.1 Spectroscopy
Integral-field spectroscopy for seventeen lens systems wasobtainedusing the integral-field unit of VIMOS on the VLT, UT3. All ob-servations, split in Observing Blocks (OB) of roughly one hour,including calibration, were done in service mode.
Of the six systems analyzed in this paper, three were ob-served in the course of a normal ESO programme, a pilot, 075.B-0226 (PI: Koopmans). For this programme we used the HR-Bluegrism with a resolution ofσ = 0.8 Å (1.9 Å full width at halfmaximum, FWHM), covering an observed wavelength range of4000 to 6200 Å. Each OB was split into three dithered exposuresof 555 seconds each. For the large programme, we switched to theHR-Orange grism with mean resolutionσλ = 0.78 Å, covering therange 5050 to 7460 Å. Only one long exposure of 2060 seconds wasobtained for each observing block; the number of observing blockswas sufficient to fill in on gaps in the data due to bad instrumentfibres through pointing-offset between subsequent OBs.
The data were reduced using the VIPGI package(Scodeggio et al. 2005; Zanichelli et al. 2005). For more de-tails on the procedure and tests of the quality of the reduceddatawe refer to Czoske et al. (2008) and Czoske et al. (in preparation).
The kinematic parametersv andσ were determined from the
individual spectra using a direct pixel-fitting routine. Compared toCzoske et al. (2008), we have made a number of modifications inthe algorithm. In particular, we now use almost the entire wave-length range that is available from the spectra; noisy partsat theblue and red ends of the spectra were cut off. Due to the varyingredshifts of the lenses, the rest-frame wavelength ranges and hencethe spectral features that were used in the kinematic analysis var-ied from lens to lens. The template used was a spectrum of the K2giant HR 19, taken from the Indo-US survey (Valdes et al. 2004).The native resolution of the template spectrum is 1 Å FWHM(σλ = 0.42 Å). The template is first smoothed to the instrumen-tal resolution of the VIMOS spectra, corrected to the rest frame ofthe lens. Due to the low signal-to-noise ratio of the spectrafrom in-dividual spaxels, we assume the line-of-sight velocity distribution(LOSVD) to be described by a Gaussian. Tests show that includingGauss-Hermite termsh3 andh4 (van der Marel & Franx 1993) doesnot improve the fit in terms ofχ2 per degree of freedom and doesnot yield robust results forh3 andh4 and consequently for the veloc-ity momentsv andv2 (see also Cappellari & Emsellem 2004). Thelarger wavelength range requires us to modify the linear correctionfunction used in Czoske et al. (2008) by multiplicative and additivepolynomial corrections (following Kelson et al. 2000). Extensivetesting shows that choosing polynomial orders of five ensures goodfits for the continuum shape without affecting the structure of thesmall scale absorption features.
A number of spectral features that are not well reproducedby the stellar template are masked. This includes in particular theMg b line which is enhanced in the lens galaxy, possibly the re-sult of an [α/Fe] enhancement, as compared to the Galactic starHR 19 (Barth et al. 2002) and the Balmer lines which may be par-tially filled in by emission.
2.2 Imaging
We use Hubble Space Telescope (HST) imaging data from ACS andNICMOS to obtain information on the surface brightness distribu-tions of the lens galaxies and the gravitationally lensed backgroundgalaxies.
ACS images taken through the F814W filter form the ba-sis of the lens modelling. For four of the systems, we have deep(full-orbit) imaging (program 10494, PI: Koopmans); for the re-maining two (SDSS J2321, SDSS J0037) we use single-exposureimages from our snapshot program (10174, PI: Koopmans). Non-parametric elliptical B-spline models of the lens galaxieswere sub-tracted off the images in order to obtain a clean representation ofthe source structure without contamination from the lens galaxy(Bolton et al. 2008).
For the dynamical analysis the kinematic maps are weightedby the surface brightness of the lens galaxy. We use the red-dest band possible since this gives the most reliable representa-tion of the stellar light. For four of the six systems described here,NICMOS images taken through the F160W filter are available.For SDSS J2321 and SDSS J1627, we had instead to resort to theF814W ACS images. Since the lensed source is typically strongerin F814W than in F160W, we start from the B-spline model of thelens galaxy to which we add random Gaussian noise according tothe variance map of the images. The images are convolved to thespatial resolution of the VIMOS data (the seeing limit of theser-
c© 0000 RAS, MNRAS000, 000–000
4 M. Barnabe et al.
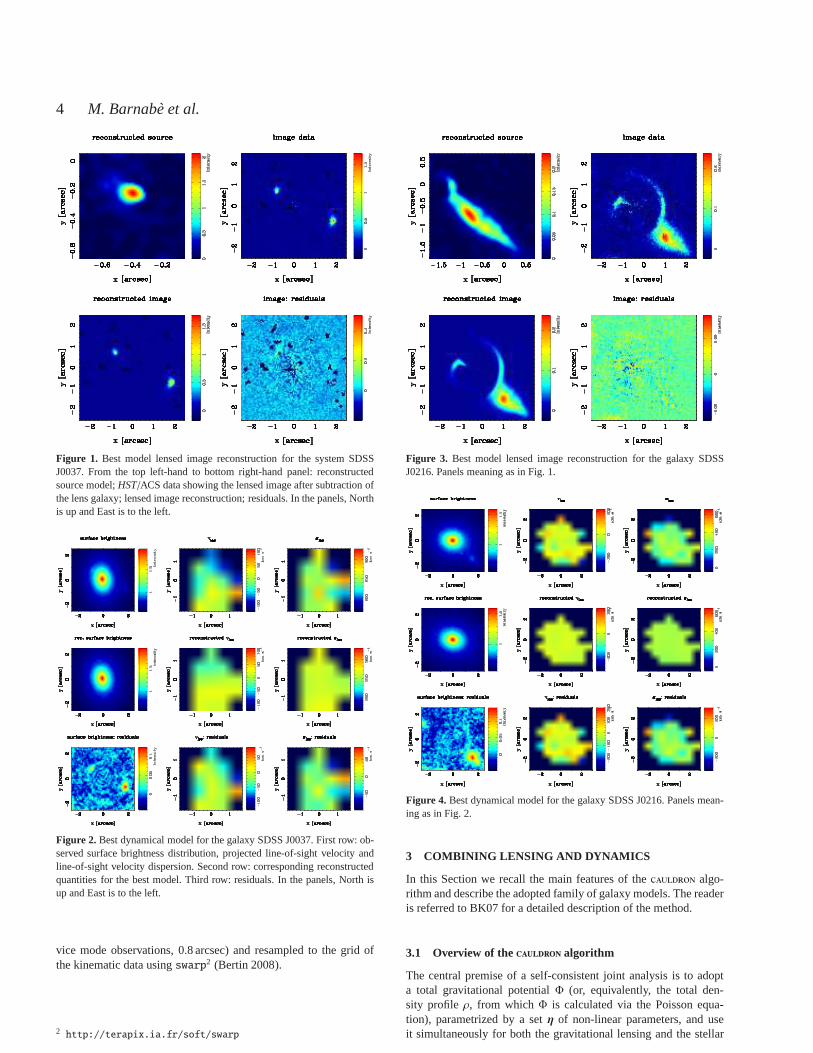
Figure 1. Best model lensed image reconstruction for the system SDSSJ0037. From the top left-hand to bottom right-hand panel: reconstructedsource model;HST/ACS data showing the lensed image after subtraction ofthe lens galaxy; lensed image reconstruction; residuals. In the panels, Northis up and East is to the left.
Figure 2. Best dynamical model for the galaxy SDSS J0037. First row: ob-served surface brightness distribution, projected line-of-sight velocity andline-of-sight velocity dispersion. Second row: corresponding reconstructedquantities for the best model. Third row: residuals. In the panels, North isup and East is to the left.
vice mode observations, 0.8 arcsec) and resampled to the grid ofthe kinematic data usingswarp2 (Bertin 2008).
2 http://terapix.ia.fr/soft/swarp
Figure 3. Best model lensed image reconstruction for the galaxy SDSSJ0216. Panels meaning as in Fig. 1.
Figure 4. Best dynamical model for the galaxy SDSS J0216. Panels mean-ing as in Fig. 2.
3 COMBINING LENSING AND DYNAMICS
In this Section we recall the main features of thecauldron algo-rithm and describe the adopted family of galaxy models. The readeris referred to BK07 for a detailed description of the method.
3.1 Overview of thecauldron algorithm
The central premise of a self-consistent joint analysis is to adopta total gravitational potentialΦ (or, equivalently, the total den-sity profile ρ, from whichΦ is calculated via the Poisson equa-tion), parametrized by a setη of non-linear parameters, and useit simultaneously for both the gravitational lensing and the stellar
c© 0000 RAS, MNRAS000, 000–000
Two-dimensional kinematics of SLACS lenses – II.5
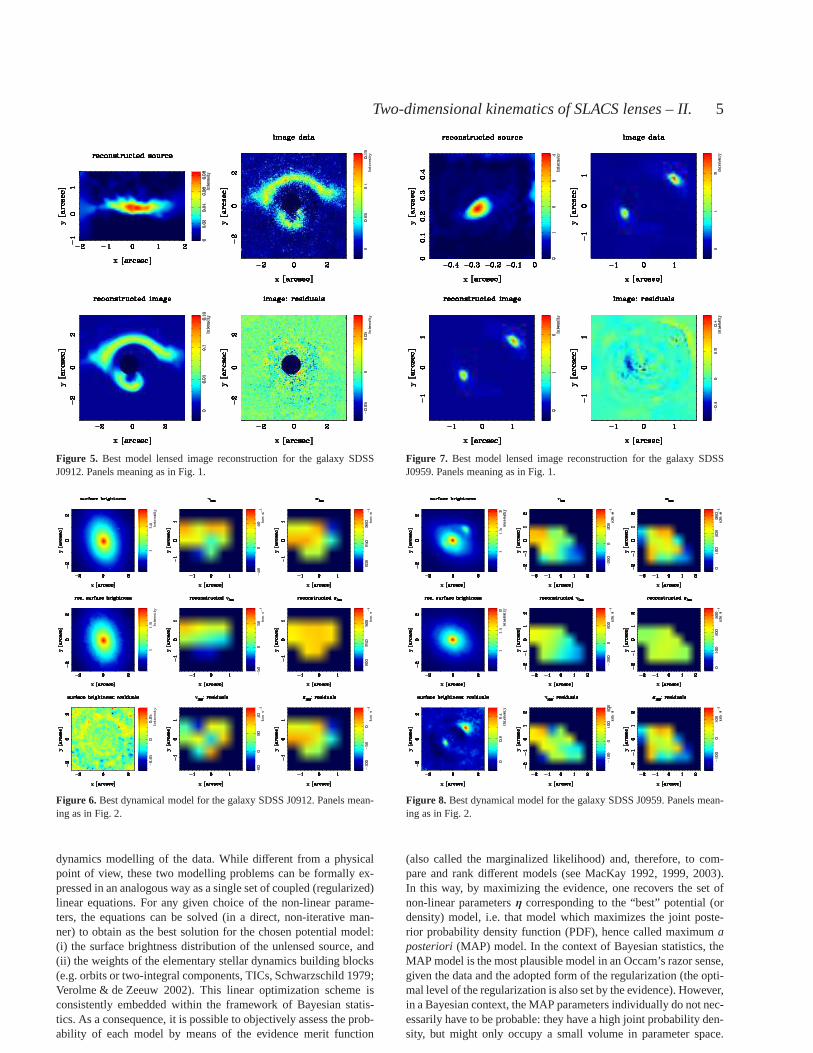
Figure 5. Best model lensed image reconstruction for the galaxy SDSSJ0912. Panels meaning as in Fig. 1.
Figure 6. Best dynamical model for the galaxy SDSS J0912. Panels mean-ing as in Fig. 2.
dynamics modelling of the data. While different from a physicalpoint of view, these two modelling problems can be formally ex-pressed in an analogous way as a single set of coupled (regularized)linear equations. For any given choice of the non-linear parame-ters, the equations can be solved (in a direct, non-iterative man-ner) to obtain as the best solution for the chosen potential model:(i) the surface brightness distribution of the unlensed source, and(ii) the weights of the elementary stellar dynamics building blocks(e.g. orbits or two-integral components, TICs, Schwarzschild 1979;Verolme & de Zeeuw 2002). This linear optimization scheme isconsistently embedded within the framework of Bayesian statis-tics. As a consequence, it is possible to objectively assessthe prob-ability of each model by means of the evidence merit function
Figure 7. Best model lensed image reconstruction for the galaxy SDSSJ0959. Panels meaning as in Fig. 1.
Figure 8. Best dynamical model for the galaxy SDSS J0959. Panels mean-ing as in Fig. 2.
(also called the marginalized likelihood) and, therefore,to com-pare and rank different models (see MacKay 1992, 1999, 2003).In this way, by maximizing the evidence, one recovers the setofnon-linear parametersη corresponding to the “best” potential (ordensity) model, i.e. that model which maximizes the joint poste-rior probability density function (PDF), hence called maximum aposteriori (MAP) model. In the context of Bayesian statistics, theMAP model is the most plausible model in an Occam’s razor sense,given the data and the adopted form of the regularization (the opti-mal level of the regularization is also set by the evidence).However,in a Bayesian context, the MAP parameters individually do not nec-essarily have to be probable: they have a high joint probability den-sity, but might only occupy a small volume in parameter space.
c© 0000 RAS, MNRAS000, 000–000
6 M. Barnabe et al.
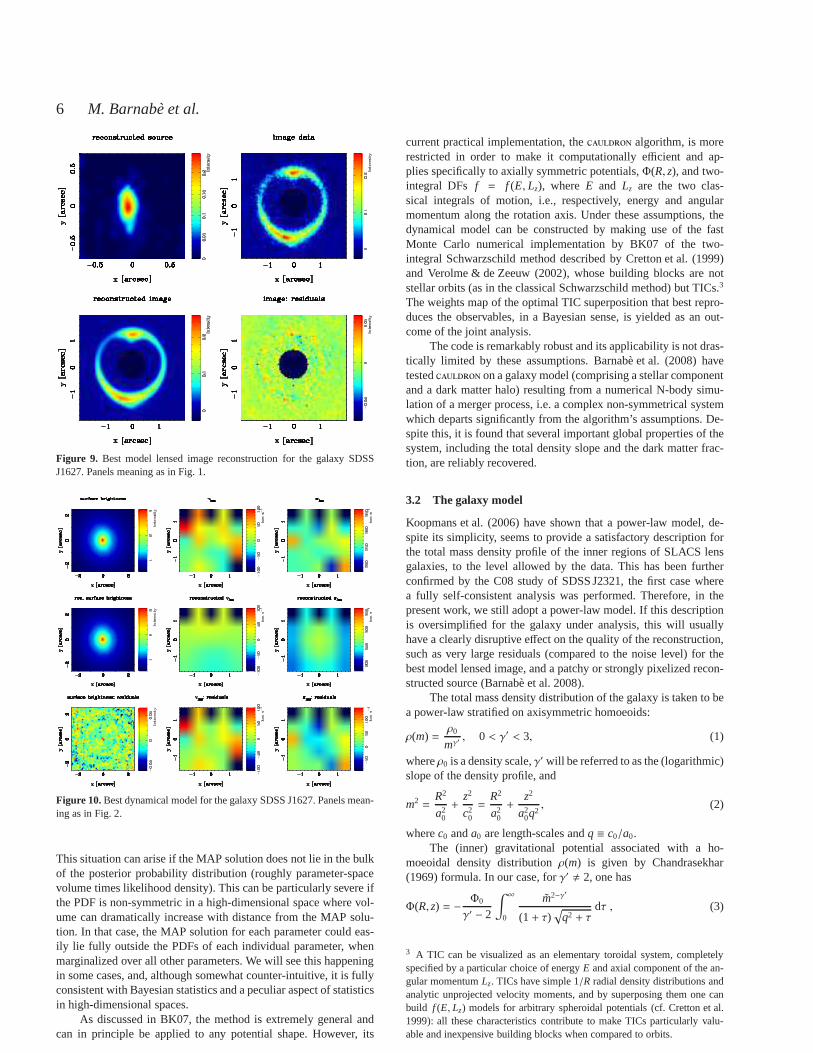
Figure 9. Best model lensed image reconstruction for the galaxy SDSSJ1627. Panels meaning as in Fig. 1.
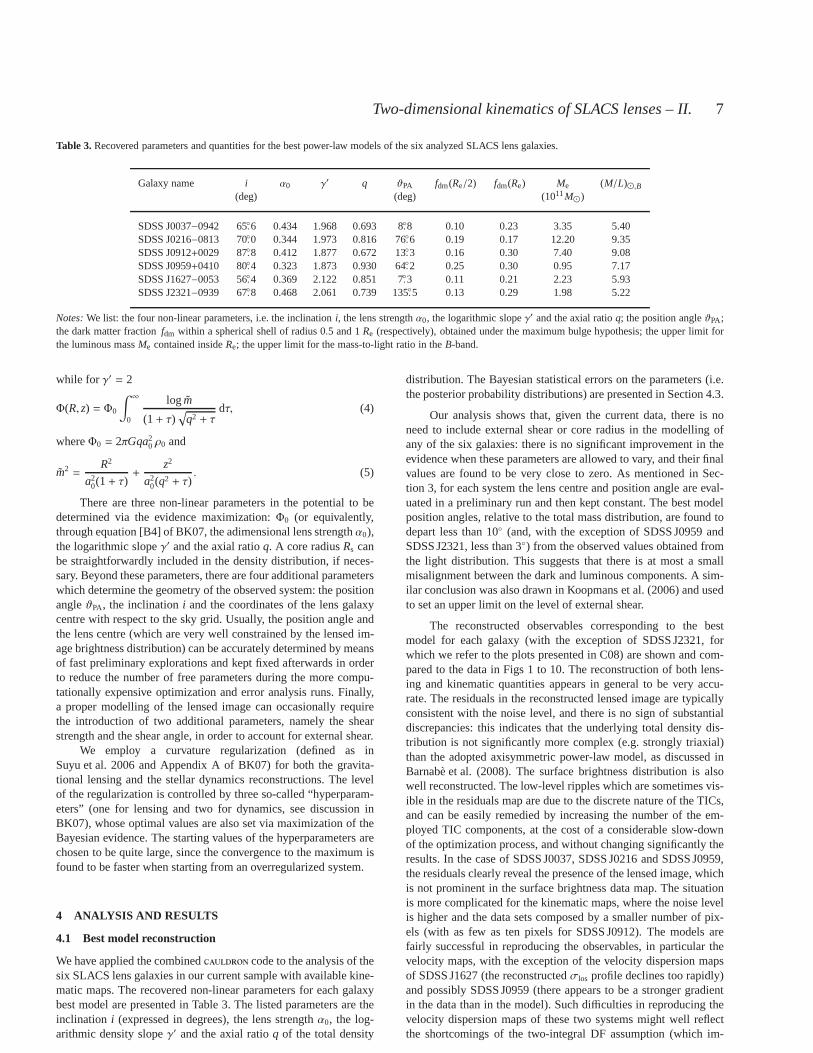
Figure 10.Best dynamical model for the galaxy SDSS J1627. Panels mean-ing as in Fig. 2.
This situation can arise if the MAP solution does not lie in the bulkof the posterior probability distribution (roughly parameter-spacevolume times likelihood density). This can be particularlysevere ifthe PDF is non-symmetric in a high-dimensional space where vol-ume can dramatically increase with distance from the MAP solu-tion. In that case, the MAP solution for each parameter couldeas-ily lie fully outside the PDFs of each individual parameter,whenmarginalized over all other parameters. We will see this happeningin some cases, and, although somewhat counter-intuitive, it is fullyconsistent with Bayesian statistics and a peculiar aspect of statisticsin high-dimensional spaces.
As discussed in BK07, the method is extremely general andcan in principle be applied to any potential shape. However,its
current practical implementation, thecauldron algorithm, is morerestricted in order to make it computationally efficient and ap-plies specifically to axially symmetric potentials,Φ(R, z), and two-integral DFs f = f (E, Lz), where E and Lz are the two clas-sical integrals of motion, i.e., respectively, energy and angularmomentum along the rotation axis. Under these assumptions,thedynamical model can be constructed by making use of the fastMonte Carlo numerical implementation by BK07 of the two-integral Schwarzschild method described by Cretton et al. (1999)and Verolme & de Zeeuw (2002), whose building blocks are notstellar orbits (as in the classical Schwarzschild method) but TICs.3
The weights map of the optimal TIC superposition that best repro-duces the observables, in a Bayesian sense, is yielded as an out-come of the joint analysis.
The code is remarkably robust and its applicability is not dras-tically limited by these assumptions. Barnabe et al. (2008) havetestedcauldron on a galaxy model (comprising a stellar componentand a dark matter halo) resulting from a numerical N-body simu-lation of a merger process, i.e. a complex non-symmetrical systemwhich departs significantly from the algorithm’s assumptions. De-spite this, it is found that several important global properties of thesystem, including the total density slope and the dark matter frac-tion, are reliably recovered.
3.2 The galaxy model
Koopmans et al. (2006) have shown that a power-law model, de-spite its simplicity, seems to provide a satisfactory description forthe total mass density profile of the inner regions of SLACS lensgalaxies, to the level allowed by the data. This has been furtherconfirmed by the C08 study of SDSS J2321, the first case wherea fully self-consistent analysis was performed. Therefore, in thepresent work, we still adopt a power-law model. If this descriptionis oversimplified for the galaxy under analysis, this will usuallyhave a clearly disruptive effect on the quality of the reconstruction,such as very large residuals (compared to the noise level) for thebest model lensed image, and a patchy or strongly pixelized recon-structed source (Barnabe et al. 2008).
The total mass density distribution of the galaxy is taken tobea power-law stratified on axisymmetric homoeoids:
ρ(m) =ρ0
mγ′, 0 < γ′ < 3, (1)
whereρ0 is a density scale,γ′ will be referred to as the (logarithmic)slope of the density profile, and
m2 =R2
a20
+z2
c20
=R2
a20
+z2
a20q
2, (2)
wherec0 anda0 are length-scales andq ≡ c0/a0.The (inner) gravitational potential associated with a ho-
moeoidal density distributionρ(m) is given by Chandrasekhar(1969) formula. In our case, forγ′ , 2, one has
Φ(R, z) = −Φ0
γ′ − 2
∫ ∞
0
m2−γ′
(1+ τ)√
q2 + τdτ , (3)
3 A TIC can be visualized as an elementary toroidal system, completelyspecified by a particular choice of energyE and axial component of the an-gular momentumLz. TICs have simple 1/R radial density distributions andanalytic unprojected velocity moments, and by superposingthem one canbuild f (E, Lz) models for arbitrary spheroidal potentials (cf. Cretton et al.1999): all these characteristics contribute to make TICs particularly valu-able and inexpensive building blocks when compared to orbits.
c© 0000 RAS, MNRAS000, 000–000
Two-dimensional kinematics of SLACS lenses – II.7
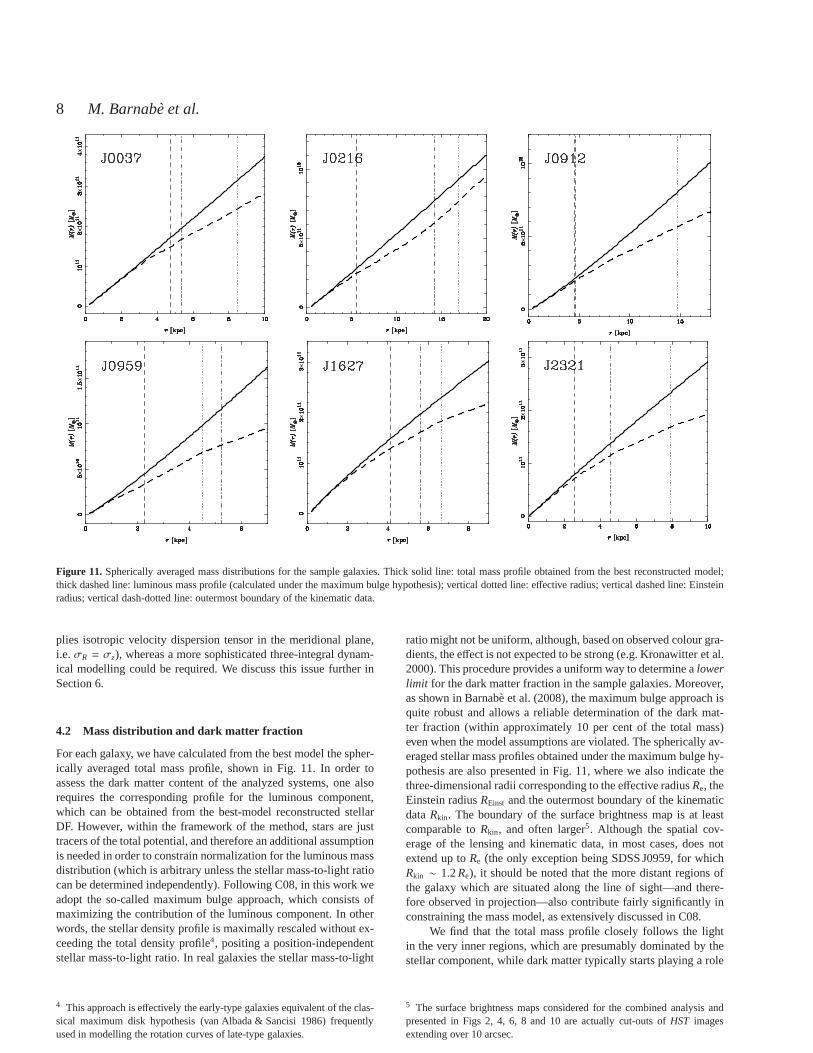
Table 3.Recovered parameters and quantities for the best power-lawmodels of the six analyzed SLACS lens galaxies.
Galaxy name i α0 γ′ q ϑPA fdm(Re/2) fdm(Re) Me (M/L)⊙,B(deg) (deg) (1011M⊙)
SDSS J0037−0942 65.6 0.434 1.968 0.693 8.8 0.10 0.23 3.35 5.40SDSS J0216−0813 70.0 0.344 1.973 0.816 76.6 0.19 0.17 12.20 9.35SDSS J0912+0029 87.8 0.412 1.877 0.672 13.3 0.16 0.30 7.40 9.08SDSS J0959+0410 80.4 0.323 1.873 0.930 64.2 0.25 0.30 0.95 7.17SDSS J1627−0053 56.4 0.369 2.122 0.851 7.3 0.11 0.21 2.23 5.93SDSS J2321−0939 67.8 0.468 2.061 0.739 135.5 0.13 0.29 1.98 5.22
Notes:We list: the four non-linear parameters, i.e. the inclination i, the lens strengthα0, the logarithmic slopeγ′ and the axial ratioq; the position angleϑPA;the dark matter fractionfdm within a spherical shell of radius 0.5 and 1Re (respectively), obtained under the maximum bulge hypothesis; the upper limit forthe luminous massMe contained insideRe; the upper limit for the mass-to-light ratio in theB-band.
while for γ′ = 2
Φ(R, z) = Φ0
∫ ∞
0
logm
(1+ τ)√
q2 + τdτ, (4)
whereΦ0 = 2πGqa20 ρ0 and
m2 =R2
a20(1+ τ)
+z2
a20(q2 + τ)
. (5)
There are three non-linear parameters in the potential to bedetermined via the evidence maximization:Φ0 (or equivalently,through equation [B4] of BK07, the adimensional lens strengthα0),the logarithmic slopeγ′ and the axial ratioq. A core radiusRs canbe straightforwardly included in the density distribution, if neces-sary. Beyond these parameters, there are four additional parameterswhich determine the geometry of the observed system: the positionangleϑPA, the inclinationi and the coordinates of the lens galaxycentre with respect to the sky grid. Usually, the position angle andthe lens centre (which are very well constrained by the lensed im-age brightness distribution) can be accurately determinedby meansof fast preliminary explorations and kept fixed afterwards in orderto reduce the number of free parameters during the more compu-tationally expensive optimization and error analysis runs. Finally,a proper modelling of the lensed image can occasionally requirethe introduction of two additional parameters, namely the shearstrength and the shear angle, in order to account for external shear.
We employ a curvature regularization (defined as inSuyu et al. 2006 and Appendix A of BK07) for both the gravita-tional lensing and the stellar dynamics reconstructions. The levelof the regularization is controlled by three so-called “hyperparam-eters” (one for lensing and two for dynamics, see discussioninBK07), whose optimal values are also set via maximization oftheBayesian evidence. The starting values of the hyperparameters arechosen to be quite large, since the convergence to the maximum isfound to be faster when starting from an overregularized system.
4 ANALYSIS AND RESULTS
4.1 Best model reconstruction
We have applied the combinedcauldron code to the analysis of thesix SLACS lens galaxies in our current sample with availablekine-matic maps. The recovered non-linear parameters for each galaxybest model are presented in Table 3. The listed parameters are theinclination i (expressed in degrees), the lens strengthα0, the log-arithmic density slopeγ′ and the axial ratioq of the total density
distribution. The Bayesian statistical errors on the parameters (i.e.the posterior probability distributions) are presented inSection 4.3.
Our analysis shows that, given the current data, there is noneed to include external shear or core radius in the modelling ofany of the six galaxies: there is no significant improvement in theevidence when these parameters are allowed to vary, and their finalvalues are found to be very close to zero. As mentioned in Sec-tion 3, for each system the lens centre and position angle areeval-uated in a preliminary run and then kept constant. The best modelposition angles, relative to the total mass distribution, are found todepart less than 10 (and, with the exception of SDSS J0959 andSDSS J2321, less than 3) from the observed values obtained fromthe light distribution. This suggests that there is at most asmallmisalignment between the dark and luminous components. A sim-ilar conclusion was also drawn in Koopmans et al. (2006) and usedto set an upper limit on the level of external shear.
The reconstructed observables corresponding to the bestmodel for each galaxy (with the exception of SDSS J2321, forwhich we refer to the plots presented in C08) are shown and com-pared to the data in Figs 1 to 10. The reconstruction of both lens-ing and kinematic quantities appears in general to be very accu-rate. The residuals in the reconstructed lensed image are typicallyconsistent with the noise level, and there is no sign of substantialdiscrepancies: this indicates that the underlying total density dis-tribution is not significantly more complex (e.g. strongly triaxial)than the adopted axisymmetric power-law model, as discussed inBarnabe et al. (2008). The surface brightness distribution is alsowell reconstructed. The low-level ripples which are sometimes vis-ible in the residuals map are due to the discrete nature of theTICs,and can be easily remedied by increasing the number of the em-ployed TIC components, at the cost of a considerable slow-downof the optimization process, and without changing significantly theresults. In the case of SDSS J0037, SDSS J0216 and SDSS J0959,the residuals clearly reveal the presence of the lensed image, whichis not prominent in the surface brightness data map. The situationis more complicated for the kinematic maps, where the noise levelis higher and the data sets composed by a smaller number of pix-els (with as few as ten pixels for SDSS J0912). The models arefairly successful in reproducing the observables, in particular thevelocity maps, with the exception of the velocity dispersion mapsof SDSS J1627 (the reconstructedσlos profile declines too rapidly)and possibly SDSS J0959 (there appears to be a stronger gradientin the data than in the model). Such difficulties in reproducing thevelocity dispersion maps of these two systems might well reflectthe shortcomings of the two-integral DF assumption (which im-
c© 0000 RAS, MNRAS000, 000–000
8 M. Barnabe et al.
Figure 11. Spherically averaged mass distributions for the sample galaxies. Thick solid line: total mass profile obtained from thebest reconstructed model;thick dashed line: luminous mass profile (calculated under the maximum bulge hypothesis); vertical dotted line: effective radius; vertical dashed line: Einsteinradius; vertical dash-dotted line: outermost boundary of the kinematic data.
plies isotropic velocity dispersion tensor in the meridional plane,i.e.σR = σz), whereas a more sophisticated three-integral dynam-ical modelling could be required. We discuss this issue further inSection 6.
4.2 Mass distribution and dark matter fraction
For each galaxy, we have calculated from the best model the spher-ically averaged total mass profile, shown in Fig. 11. In ordertoassess the dark matter content of the analyzed systems, one alsorequires the corresponding profile for the luminous component,which can be obtained from the best-model reconstructed stellarDF. However, within the framework of the method, stars are justtracers of the total potential, and therefore an additionalassumptionis needed in order to constrain normalization for the luminous massdistribution (which is arbitrary unless the stellar mass-to-light ratiocan be determined independently). Following C08, in this work weadopt the so-called maximum bulge approach, which consistsofmaximizing the contribution of the luminous component. In otherwords, the stellar density profile is maximally rescaled without ex-ceeding the total density profile4, positing a position-independentstellar mass-to-light ratio. In real galaxies the stellar mass-to-light
4 This approach is effectively the early-type galaxies equivalent of the clas-sical maximum disk hypothesis (van Albada & Sancisi 1986) frequentlyused in modelling the rotation curves of late-type galaxies.
ratio might not be uniform, although, based on observed colour gra-dients, the effect is not expected to be strong (e.g. Kronawitter et al.2000). This procedure provides a uniform way to determine alowerlimit for the dark matter fraction in the sample galaxies. Moreover,as shown in Barnabe et al. (2008), the maximum bulge approach isquite robust and allows a reliable determination of the darkmat-ter fraction (within approximately 10 per cent of the total mass)even when the model assumptions are violated. The spherically av-eraged stellar mass profiles obtained under the maximum bulge hy-pothesis are also presented in Fig. 11, where we also indicate thethree-dimensional radii corresponding to the effective radiusRe, theEinstein radiusREinst and the outermost boundary of the kinematicdataRkin. The boundary of the surface brightness map is at leastcomparable toRkin, and often larger5. Although the spatial cov-erage of the lensing and kinematic data, in most cases, does notextend up toRe (the only exception being SDSS J0959, for whichRkin ∼ 1.2Re), it should be noted that the more distant regions ofthe galaxy which are situated along the line of sight—and there-fore observed in projection—also contribute fairly significantly inconstraining the mass model, as extensively discussed in C08.
We find that the total mass profile closely follows the lightin the very inner regions, which are presumably dominated bythestellar component, while dark matter typically starts playing a role
5 The surface brightness maps considered for the combined analysis andpresented in Figs 2, 4, 6, 8 and 10 are actually cut-outs ofHST imagesextending over 10 arcsec.
c© 0000 RAS, MNRAS000, 000–000
Two-dimensional kinematics of SLACS lenses – II.9
in the vicinity of the (three-dimensional) radiusr = Re/2, where itscontribution in total mass is of order 10 to 25 per cent, and becomesprogressively more important when moving outwards (the systemSDSS J0216, however, constitutes an exception, with its dark mat-ter fraction remaining roughly constant over the probed region forr & 10 kpc). Within a sphere of radiusr = Re, approximately15 to 30 per cent of the mass is dark. This result is in generalagreement with the conclusions of previous dynamical studies ofearly-type galaxies in the local Universe, in particular the analysisof 21 nearly round and slowly-rotating ellipticals by Gerhard et al.(2001), the modelling of 25 SAURON systems (under the assump-tion that mass follows light, Cappellari et al. 2006), and the studyby Thomas et al. (2007) of 17 early-type galaxies in the Coma clus-ter.
From the valueMe of the luminous mass inside the effectiveradius, obtained under the maximum bulge hypothesis, we also cal-culate for each system the corresponding upper limit for thestellarmass-to-light ratio (see Table 3), finding 5. (M/L)⊙,B . 9. Thisis in agreement with stellar population studies, e.g. Trujillo et al.(2004).
4.3 Error analysis
In this Section we present, for each galaxy in the sample, thecor-responding model uncertainties, i.e. the errors on the recoverednon-linear parametersi, α0, γ′ andq. The uncertainties are calcu-lated within the framework of Bayesian statistics by makinguse ofthe recently developed nested sampling technique (Skilling 2004,Sivia & Skilling 2006; see also Vegetti & Koopmans 2008 for thefirst astrophysical application in the context of gravitational lens-ing). Nested sampling is a Monte Carlo method aimed at calculat-ing the Bayesian evidence, i.e. the fundamental quantity for modelcomparison, in a computationally efficient way. The marginalizedposterior probability distribution functions (PDFs) of the model pa-rameters, which are used to estimate the uncertainties, areobtainedas very valuable by-products of the method.
Within the context of Bayesian statistics, a priori assumptionsor knowledge on each parameterηi are made explicit and formal-ized by defining the prior functionp(ηi). We assign a uniform priorwithin the interval 2δηi , symmetrical around the recovered bestmodel valueηb,i and wide enough to include the bulk of the likeli-hood (very conservative estimates ofδηi are obtained by means offast preliminary runs), that is:
p(ηi) =
constant for |ηb,i − ηi | 6 δηi
0 for |ηb,i − ηi | > δηi .
(6)
This choice of an uniform prior is aimed at formalizing the ab-sence of any a priori information within the interval 2δηi (see e.g.Cousins 1995). We find, however, that the errors on the parametersare very small in comparison withδηi , so that the prior, largely in-dependently of the adopted functional form, is nearly constant overthe likelihood. Therefore, the specific choice forp(ηi) is not criticalin our case.
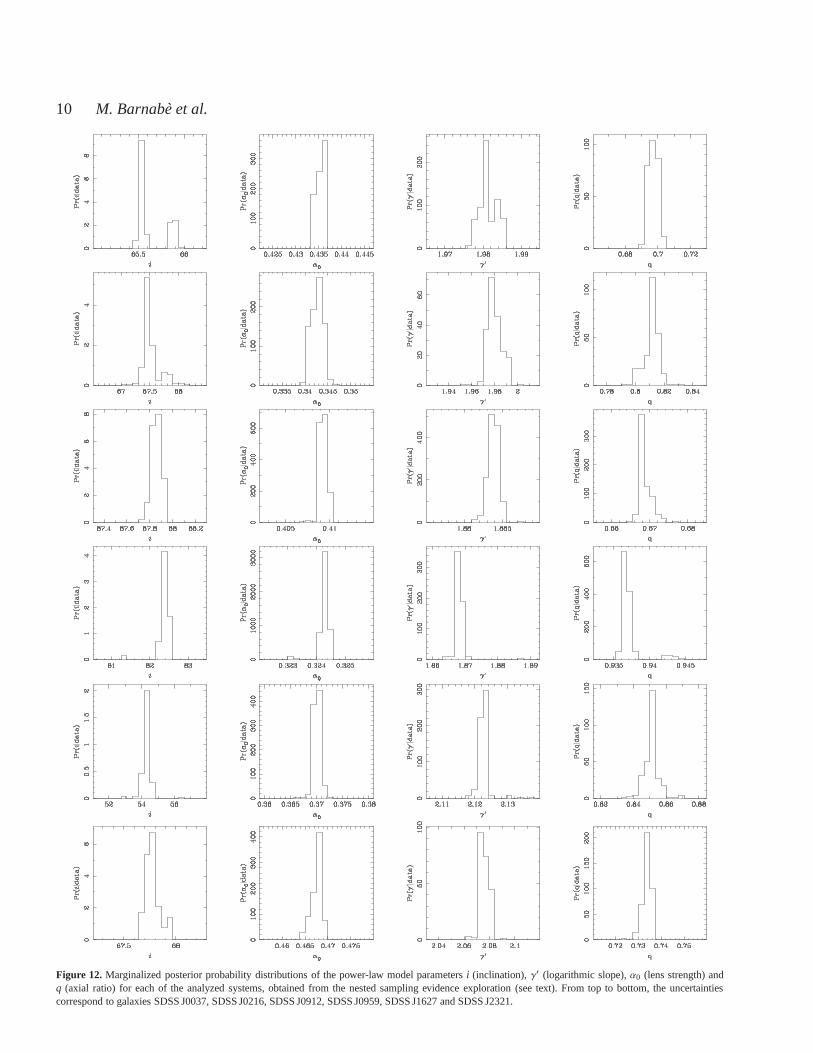
For each analyzed galaxy, the histograms in Fig. 12 show themarginalized posterior PDF of the power-law model non-linear pa-rameters. Because of the marginalization involved in theirevalua-tion, these distributions constitute the most conservative estimateof statistical errors on the parameters, given the data and all theassumptions (i.e. positing that the adopted model is the “true” de-scription underlying the data; cf. MacKay 1992). These errors are
relatively small, as a consequence of the numerous constraints pro-vided by the data: the typical data set for each of the sample galax-ies consists of∼ 104 data points or more, most of them (in thelensed image and surface brightness maps) characterized byfairlygood signal to noise level. Furthermore, the maximumηi,mp of theposterior PDF (and, more generally, the bulk of the posterior proba-bility) for the i-th parameter is often found to be somewhat skewedwith respect to the corresponding best model valueηi,b. This is awell-known projection effect arising from the marginalization overa single parameter of a complicated high-dimensional multivariatefunction such as the total posterior PDF, as discussed above(§ 3.1).
The analysis conducted in this Section does not take into ac-count systematic uncertainties, which are frequently larger than thestatistical errors, and more difficult to quantify. They can arise froma variety of sources, including incorrect modelling assumptions andproblems associated with the generation of the data sets (see e.g.Marshall et al. 2007 for an in-depth treatment of the systematic un-certainties connected with the lens galaxy subtraction process andthe incomplete knowledge of the PSF). The study of Barnabe et al.(2008) provides a more quantitative feel for the systematicerrorsintroduced by the adoption of an oversimplified galaxy model,showing that even in a quite extreme case (where the reconstruc-tion of lensing observables is clearly unsatisfactory) thesystem-atic error onγ′ remains within about 10 per cent. Other parameterssuch as inclination and oblateness, however, are less robust and ac-tually become ill-defined if the assumption of axial symmetry doesnot hold. We note, however, that in none of the six systems un-der study are the model residuals as severe as in the simulations inBarnabe et al. (2008). Therefore, we expect systematic uncertain-ties to remain within a few per cent level.
4.4 The density profile of the ensemble
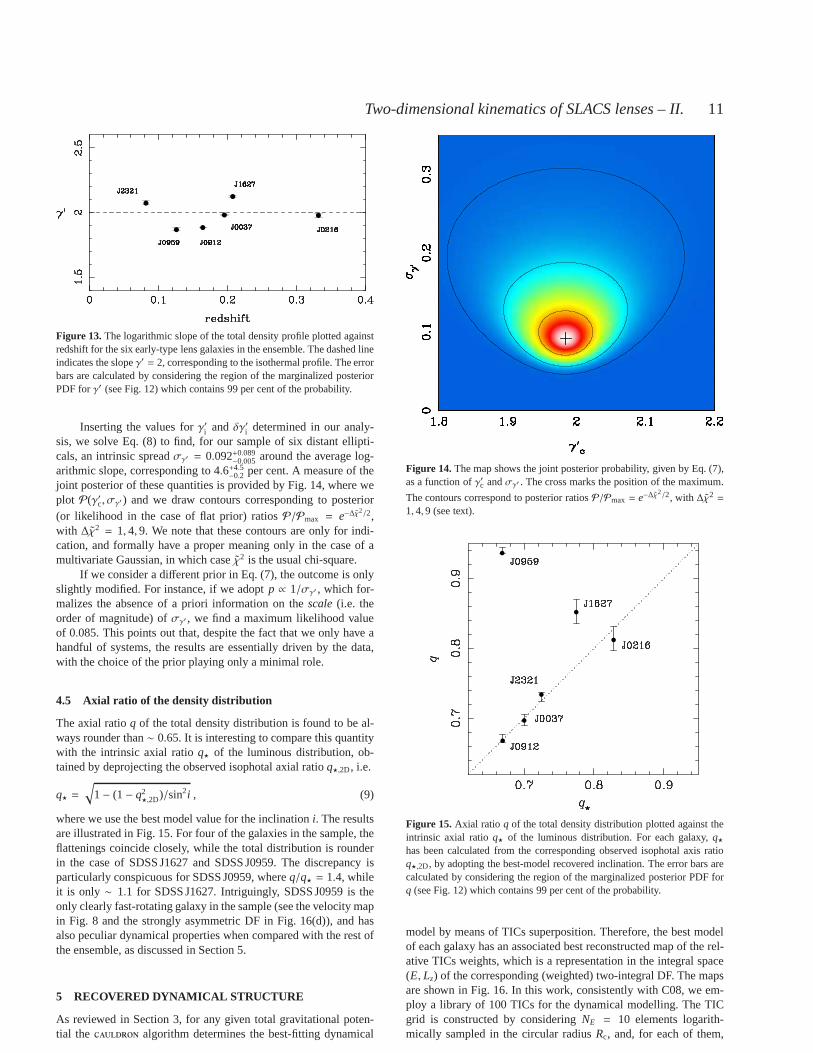
From the combined analysis, we have found that all the galaxies inthe ensemble have a total density profile very close to isothermal,with an average logarithmic slope〈γ′〉 = 1.98± 0.05, in agreementwith the results of Koopmans et al. (2006). There is also no evi-dence of evolution of the density slope with redshift (see Fig. 13).
No correlation is found between the logarithmic slopeγ′ andthe axial ratioq, the effective radius, the normalized Einstein radius(i.e., the ratioREinst/Re) and the aperture averaged velocity disper-sionσSDSS.
We now want to calculate, on the basis of the analyzed sys-tems, theintrinsic spread around the average slope. If we assumethat the slopeγ′i of each galaxy is extracted from a parent Gaussiandistribution of centreγ′c and varianceσγ′ , then the joint posteriorprobability for the sampling is given by
P(γ′c, σγ′ | γ′i ) ∝ p(γ′c, σγ′ )
∏
i
exp
[
−(γ′i −γ
′c)2
2(σ2γ′+δγ′i
2)
]
√
2π(σ2γ′+ δγ′i
2), (7)
wherep(γ′c, σγ′ ) is the prior onγ′c andσγ′ (for which we adopt auniform distribution) andδγ′i are the 1σ errors onγ′i , calculated byconsidering the region around the peak which contains 68 percentof the posterior probability. From Eq. (7), the maximum likelihoodsolution forγ′c is simply the average slope〈γ′〉, while for σγ′ isobtained from the equation
∑
i
(γ′i − γ′c)
2 − σ2γ′− δγ′i
2
(
σ2γ′+ δγ′i
2)2
= 0. (8)
c© 0000 RAS, MNRAS000, 000–000
10 M. Barnabe et al.
Figure 12. Marginalized posterior probability distributions of the power-law model parametersi (inclination),γ′ (logarithmic slope),α0 (lens strength) andq (axial ratio) for each of the analyzed systems, obtained from the nested sampling evidence exploration (see text). Fromtop to bottom, the uncertaintiescorrespond to galaxies SDSS J0037, SDSS J0216, SDSS J0912, SDSS J0959, SDSS J1627 and SDSS J2321.
c© 0000 RAS, MNRAS000, 000–000
Two-dimensional kinematics of SLACS lenses – II.11
Figure 13.The logarithmic slope of the total density profile plotted againstredshift for the six early-type lens galaxies in the ensemble. The dashed lineindicates the slopeγ′ = 2, corresponding to the isothermal profile. The errorbars are calculated by considering the region of the marginalized posteriorPDF forγ′ (see Fig. 12) which contains 99 per cent of the probability.
Inserting the values forγ′i andδγ′i determined in our analy-sis, we solve Eq. (8) to find, for our sample of six distant ellipti-cals, an intrinsic spreadσγ′ = 0.092+0.089
−0.005 around the average log-arithmic slope, corresponding to 4.6+4.5
−0.2 per cent. A measure of thejoint posterior of these quantities is provided by Fig. 14, where weplot P(γ′c, σγ′ ) and we draw contours corresponding to posterior(or likelihood in the case of flat prior) ratiosP/Pmax = e−∆χ
2/2,with ∆χ2 = 1, 4,9. We note that these contours are only for indi-cation, and formally have a proper meaning only in the case ofamultivariate Gaussian, in which case ˜χ2 is the usual chi-square.
If we consider a different prior in Eq. (7), the outcome is onlyslightly modified. For instance, if we adoptp ∝ 1/σγ′ , which for-malizes the absence of a priori information on thescale(i.e. theorder of magnitude) ofσγ′ , we find a maximum likelihood valueof 0.085. This points out that, despite the fact that we only have ahandful of systems, the results are essentially driven by the data,with the choice of the prior playing only a minimal role.
4.5 Axial ratio of the density distribution
The axial ratioq of the total density distribution is found to be al-ways rounder than∼ 0.65. It is interesting to compare this quantitywith the intrinsic axial ratioq⋆ of the luminous distribution, ob-tained by deprojecting the observed isophotal axial ratioq⋆,2D, i.e.
q⋆ =√
1− (1− q2⋆,2D)/sin2i , (9)
where we use the best model value for the inclinationi. The resultsare illustrated in Fig. 15. For four of the galaxies in the sample, theflattenings coincide closely, while the total distributionis rounderin the case of SDSS J1627 and SDSS J0959. The discrepancy isparticularly conspicuous for SDSS J0959, whereq/q⋆ = 1.4, whileit is only ∼ 1.1 for SDSS J1627. Intriguingly, SDSS J0959 is theonly clearly fast-rotating galaxy in the sample (see the velocity mapin Fig. 8 and the strongly asymmetric DF in Fig. 16(d)), and hasalso peculiar dynamical properties when compared with the rest ofthe ensemble, as discussed in Section 5.
5 RECOVERED DYNAMICAL STRUCTURE
As reviewed in Section 3, for any given total gravitational poten-tial the cauldron algorithm determines the best-fitting dynamical
Figure 14.The map shows the joint posterior probability, given by Eq. (7),as a function ofγ′c andσγ′ . The cross marks the position of the maximum.
The contours correspond to posterior ratiosP/Pmax = e−∆χ2/2, with ∆χ2 =
1, 4,9 (see text).
Figure 15.Axial ratio q of the total density distribution plotted against theintrinsic axial ratioq⋆ of the luminous distribution. For each galaxy,q⋆has been calculated from the corresponding observed isophotal axis ratioq⋆,2D, by adopting the best-model recovered inclination. The error bars arecalculated by considering the region of the marginalized posterior PDF forq (see Fig. 12) which contains 99 per cent of the probability.
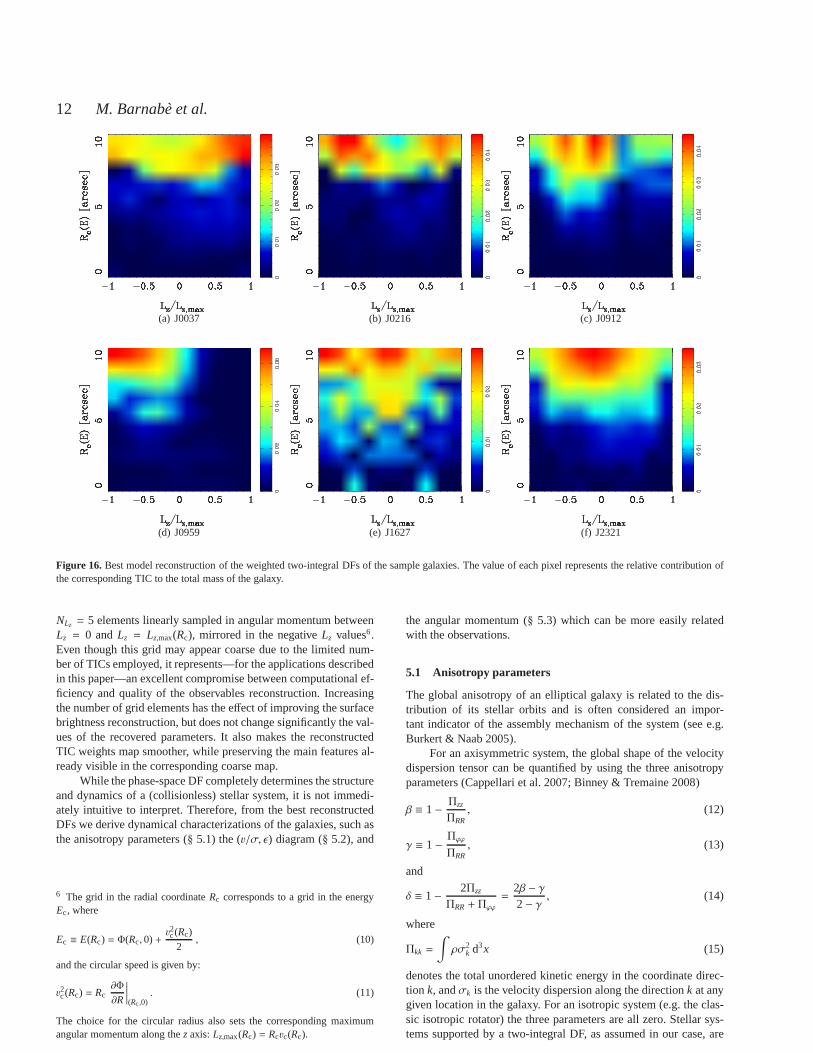
model by means of TICs superposition. Therefore, the best modelof each galaxy has an associated best reconstructed map of the rel-ative TICs weights, which is a representation in the integral space(E, Lz) of the corresponding (weighted) two-integral DF. The mapsare shown in Fig. 16. In this work, consistently with C08, we em-ploy a library of 100 TICs for the dynamical modelling. The TICgrid is constructed by consideringNE = 10 elements logarith-mically sampled in the circular radiusRc, and, for each of them,
c© 0000 RAS, MNRAS000, 000–000
12 M. Barnabe et al.
(a) J0037 (b) J0216 (c) J0912
(d) J0959 (e) J1627 (f) J2321
Figure 16.Best model reconstruction of the weighted two-integral DFsof the sample galaxies. The value of each pixel represents the relative contribution ofthe corresponding TIC to the total mass of the galaxy.
NLz = 5 elements linearly sampled in angular momentum betweenLz = 0 andLz = Lz,max(Rc), mirrored in the negativeLz values6.Even though this grid may appear coarse due to the limited num-ber of TICs employed, it represents—for the applications describedin this paper—an excellent compromise between computational ef-ficiency and quality of the observables reconstruction. Increasingthe number of grid elements has the effect of improving the surfacebrightness reconstruction, but does not change significantly the val-ues of the recovered parameters. It also makes the reconstructedTIC weights map smoother, while preserving the main features al-ready visible in the corresponding coarse map.
While the phase-space DF completely determines the structureand dynamics of a (collisionless) stellar system, it is not immedi-ately intuitive to interpret. Therefore, from the best reconstructedDFs we derive dynamical characterizations of the galaxies,such asthe anisotropy parameters (§ 5.1) the (v/σ, ǫ) diagram (§ 5.2), and
6 The grid in the radial coordinateRc corresponds to a grid in the energyEc, where
Ec ≡ E(Rc) = Φ(Rc, 0)+v2c(Rc)
2, (10)
and the circular speed is given by:
v2c(Rc) = Rc∂Φ
∂R
∣
∣
∣
∣
∣
(Rc,0). (11)
The choice for the circular radius also sets the corresponding maximumangular momentum along thezaxis:Lz,max(Rc) = Rcvc(Rc).
the angular momentum (§ 5.3) which can be more easily relatedwith the observations.
5.1 Anisotropy parameters
The global anisotropy of an elliptical galaxy is related to the dis-tribution of its stellar orbits and is often considered an impor-tant indicator of the assembly mechanism of the system (see e.g.Burkert & Naab 2005).
For an axisymmetric system, the global shape of the velocitydispersion tensor can be quantified by using the three anisotropyparameters (Cappellari et al. 2007; Binney & Tremaine 2008)
β ≡ 1−Πzz
ΠRR, (12)
γ ≡ 1−Πϕϕ
ΠRR, (13)
and
δ ≡ 1−2Πzz
ΠRR+ Πϕϕ=
2β − γ2− γ
, (14)
where
Πkk =
∫
ρσ2k d3x (15)
denotes the total unordered kinetic energy in the coordinate direc-tion k, andσk is the velocity dispersion along the directionk at anygiven location in the galaxy. For an isotropic system (e.g. the clas-sic isotropic rotator) the three parameters are all zero. Stellar sys-tems supported by a two-integral DF, as assumed in our case, are
c© 0000 RAS, MNRAS000, 000–000
Two-dimensional kinematics of SLACS lenses – II.13
isotropic in the meridional plane, i.e.σ2R = σ
2z everywhere, which
impliesβ ≡ 0.For each object in the sample, we have calculated the
anisotropy parameters by integrating up to half the effective radius,which is the typical region inside which the galaxy models are morestrongly constrained. The results are reported in Table 4. All thesystems, with the exception of SDSS J0959, have slightly positiveδ, i.e. are mildly anisotropic in the sense of having larger pressureparallel to the equatorial plane than perpendicular to it. This is quitesimilar to what Cappellari et al. (2007) and Thomas et al. (2008),using three-integral axisymmetric orbit-superposition codes, findfor local ellipticals; however, their samples also displaya fewgalaxies with clearly higher anisotropy (δ ∼ 0.4). The fast-rotatinggalaxy SDSS J0959, instead, is anisotropic in the opposite sense,due to the fact that for this systemσ2
ϕ < σ2R = σ
2z over most of the
density-weighted volume, which translates into a negativeδ param-eter. This property is uncommon, although not unprecedented, fornearby early-type galaxies: two systems out of the 19 analyzed byThomas et al. (2008) haveδ < 0, while no case is reported from theSAURON sample.
Since for our modelsβ = 0 by construction, the two remain-ing anisotropy parameters are univocally related by Eq. 14 so that,for 0 < δ < 1, γ is necessarily negative. The two-integral DFassumption in general does not hold for nearby ellipticals (e.g.Merrifield 1991; Gerssen et al. 1997; Thomas et al. 2008); if thisis the case also for distant ellipticals, then the recoveredγ could besignificantly in error. On the other hand, as shown in Barnab`e et al.(2008), the global parameterδ is more robust, and can be reliablyrecovered bycauldron (typically within ∼ 15 per cent) even whenthe assumptions of two-integral DF and axial symmetry are bothviolated.
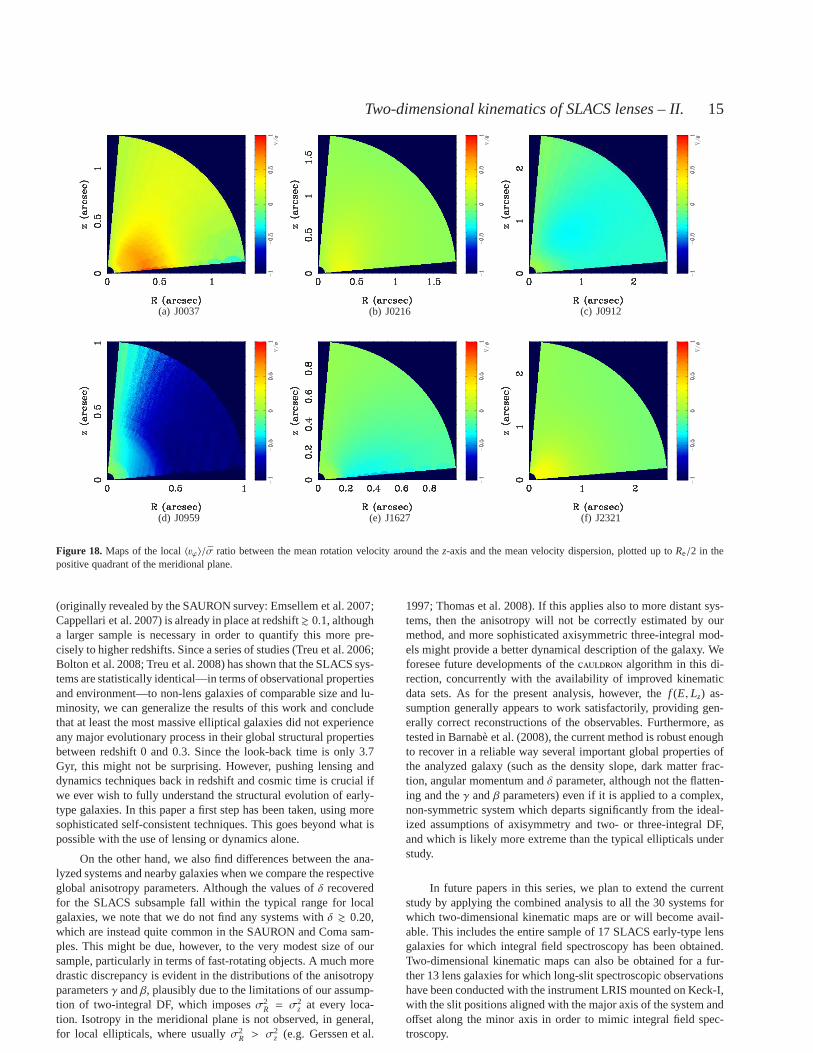
5.2 The global and localu/σ
The (v/σ, ǫ) diagram provides a classic indicator to estimate theimportance of rotation with respect to random motions in early-type galaxies (see Binney 1978). For each system, we calculatethe “intrinsic” (i.e. inclination corrected) global quantity v/σ fromthe best reconstructed DF by integrating up toRe/2 (the results arelisted in Table 4), and we plot it against the intrinsic ellipticity ofthe luminous distributionǫ⋆ = 1− q⋆. The diagram is presented inFig. 17 and compared with the findings for 24 SAURON galaxies,corrected for inclination (Cappellari et al. 2007). There is a sharpdichotomy in the SLACS subsample between the obviously fast-rotating system SDSS J0959 and the remaining galaxies, fourofwhich havev/σ ≈ 0.2 (two of these systems have clear character-istics of slow rotators, as discussed in Section 5.3).
Whereasv/σ is a global quantity which provides informationon the general properties of the galaxy, important insightson thecharacteristics of the system at different locations of the meridionalplane are offered by its local analogue, i.e. the ratio〈vϕ〉/σ betweenthe mean rotation velocity around thez-axis and the mean velocitydispersion ¯σ2 = (σ2
R + σ2ϕ + σ
2z)/3. We illustrate this quantity in
Fig. 18 for the galaxies in our sample. For visualization purposes,the plot was produced from a weighted DF map of 900 elements(NE = 30 andNLz = 15, mirrored). In order to do this, we reopti-mized the best model for the dynamics hyperparameters only,de-termining the new optimal level of the regularization, while all theother parameters were kept fixed. This procedure amounts to someextent to an interpolation over the weighted DF map of Fig. 16withthe aim of obtaining a smoother distribution.
Figure 17. Model (v/σ, ǫ) diagram for the six lens galaxies in our sam-ple (black circles):ǫ⋆ is the intrinsic ellipticity of luminous distribution,and v/σ is calculated from the best model by integrating up toRe/2. Wealso show, for comparison, the corresponding quantities (corrected for in-clination; v/σ measured withinRe) for the 24 nearby SAURON ellipticalsstudied in Cappellari et al. (2007), divided in fast and slowrotators (blueand red points, respectively). The solid line shows the location of edge-onisotropic rotators, assumingα = 0.15 (see Binney 2005).
5.3 Angular momentum
Another robust way to characterize the global velocity structure ofa galaxy is provided by its angular momentum content. For eachgalaxy in the ensemble we calculate the (mass-normalized) com-ponent of the angular momentum parallel to the axis of symmetryas
Jz =
∫
ρ⋆R〈vϕ〉 d3x∫
ρ⋆ d3x, (16)
whereR is the radial coordinate,〈vϕ〉 denotes the mean azimuthalstellar velocity at positionx andρ⋆ is the spatial density of starsas obtained by the best reconstructed DF, i.e.ρ⋆ =
∫
f d3v. The re-sults obtained by integrating insideRe/2 (the region most stronglyconstrained by the observations for all the systems) are reported inTable 4 in units of kpc km s−1.
Whereas the dimensional parameterJz has a direct physicalinterpretation as angular momentum, it is not the most practicalway to quantify and to compare the level of ordered rotation inelliptical galaxies. To this purpose, we define a more convenientadimensional parameter as:
jz ≡
∫
ρ⋆R|〈vϕ〉| d3x
∫
ρ⋆R√
〈vϕ〉2+ σ2 d3x
. (17)
This quantity is effectively the intrinsic equivalent ofthe observationally-defined λR parameter introduced byEmsellem et al. (2007) as an objective criterion for the kine-matic classification of early-type galaxies. Analogously to λR,jz tends to unity for systems which display large-scale orderedrotation, and conversely it goes to zero for galaxies globally
c© 0000 RAS, MNRAS000, 000–000
14 M. Barnabe et al.
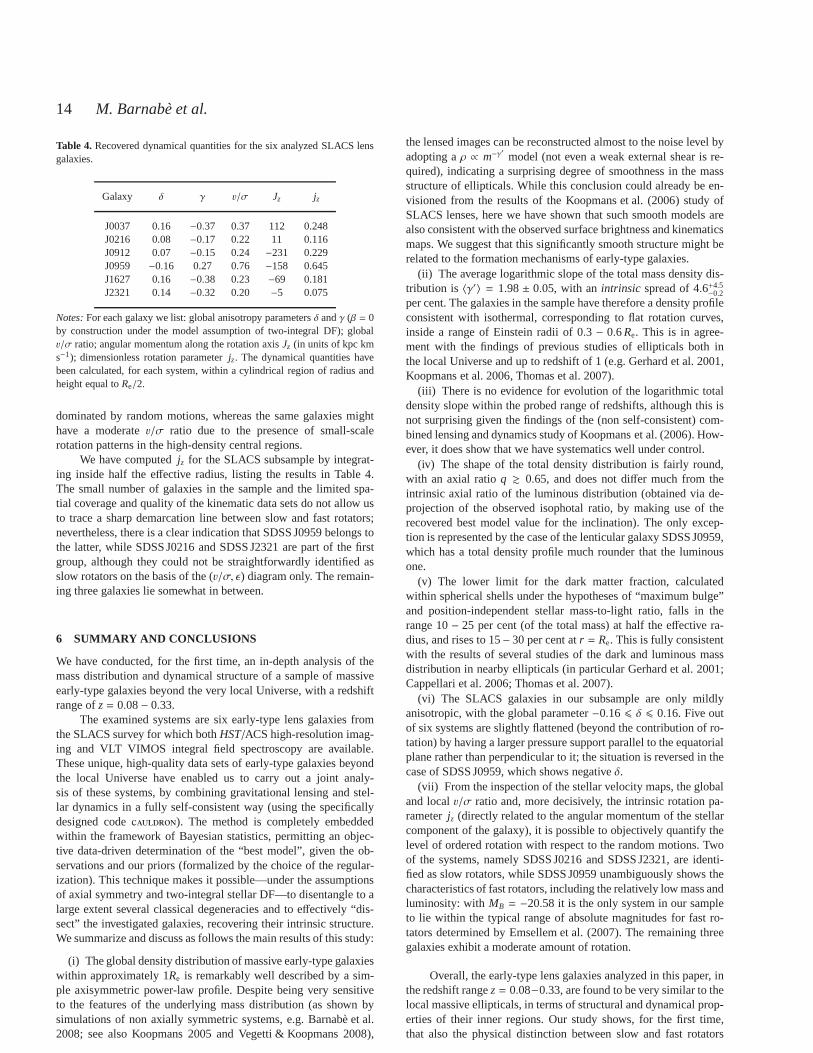
Table 4.Recovered dynamical quantities for the six analyzed SLACS lensgalaxies.
Galaxy δ γ v/σ Jz jz
J0037 0.16 −0.37 0.37 112 0.248J0216 0.08 −0.17 0.22 11 0.116J0912 0.07 −0.15 0.24 −231 0.229J0959 −0.16 0.27 0.76 −158 0.645J1627 0.16 −0.38 0.23 −69 0.181J2321 0.14 −0.32 0.20 −5 0.075
Notes:For each galaxy we list: global anisotropy parametersδ andγ (β = 0by construction under the model assumption of two-integralDF); globalv/σ ratio; angular momentum along the rotation axisJz (in units of kpc kms−1); dimensionless rotation parameterjz. The dynamical quantities havebeen calculated, for each system, within a cylindrical region of radius andheight equal toRe/2.
dominated by random motions, whereas the same galaxies mighthave a moderatev/σ ratio due to the presence of small-scalerotation patterns in the high-density central regions.
We have computedjz for the SLACS subsample by integrat-ing inside half the effective radius, listing the results in Table 4.The small number of galaxies in the sample and the limited spa-tial coverage and quality of the kinematic data sets do not allow usto trace a sharp demarcation line between slow and fast rotators;nevertheless, there is a clear indication that SDSS J0959 belongs tothe latter, while SDSS J0216 and SDSS J2321 are part of the firstgroup, although they could not be straightforwardly identified asslow rotators on the basis of the (v/σ, ǫ) diagram only. The remain-ing three galaxies lie somewhat in between.
6 SUMMARY AND CONCLUSIONS
We have conducted, for the first time, an in-depth analysis ofthemass distribution and dynamical structure of a sample of massiveearly-type galaxies beyond the very local Universe, with a redshiftrange ofz= 0.08− 0.33.
The examined systems are six early-type lens galaxies fromthe SLACS survey for which bothHST/ACS high-resolution imag-ing and VLT VIMOS integral field spectroscopy are available.These unique, high-quality data sets of early-type galaxies beyondthe local Universe have enabled us to carry out a joint analy-sis of these systems, by combining gravitational lensing and stel-lar dynamics in a fully self-consistent way (using the specificallydesigned codecauldron). The method is completely embeddedwithin the framework of Bayesian statistics, permitting anobjec-tive data-driven determination of the “best model”, given the ob-servations and our priors (formalized by the choice of the regular-ization). This technique makes it possible—under the assumptionsof axial symmetry and two-integral stellar DF—to disentangle to alarge extent several classical degeneracies and to effectively “dis-sect” the investigated galaxies, recovering their intrinsic structure.We summarize and discuss as follows the main results of this study:
(i) The global density distribution of massive early-type galaxieswithin approximately 1Re is remarkably well described by a sim-ple axisymmetric power-law profile. Despite being very sensitiveto the features of the underlying mass distribution (as shown bysimulations of non axially symmetric systems, e.g. Barnab`e et al.2008; see also Koopmans 2005 and Vegetti & Koopmans 2008),
the lensed images can be reconstructed almost to the noise level byadopting aρ ∝ m−γ
′
model (not even a weak external shear is re-quired), indicating a surprising degree of smoothness in the massstructure of ellipticals. While this conclusion could already be en-visioned from the results of the Koopmans et al. (2006) studyofSLACS lenses, here we have shown that such smooth models arealso consistent with the observed surface brightness and kinematicsmaps. We suggest that this significantly smooth structure might berelated to the formation mechanisms of early-type galaxies.
(ii) The average logarithmic slope of the total mass densitydis-tribution is 〈γ′〉 = 1.98± 0.05, with anintrinsic spread of 4.6+4.5
−0.2per cent. The galaxies in the sample have therefore a densityprofileconsistent with isothermal, corresponding to flat rotationcurves,inside a range of Einstein radii of 0.3 − 0.6Re. This is in agree-ment with the findings of previous studies of ellipticals both inthe local Universe and up to redshift of 1 (e.g. Gerhard et al.2001,Koopmans et al. 2006, Thomas et al. 2007).
(iii) There is no evidence for evolution of the logarithmic totaldensity slope within the probed range of redshifts, although this isnot surprising given the findings of the (non self-consistent) com-bined lensing and dynamics study of Koopmans et al. (2006). How-ever, it does show that we have systematics well under control.
(iv) The shape of the total density distribution is fairly round,with an axial ratioq & 0.65, and does not differ much from theintrinsic axial ratio of the luminous distribution (obtained via de-projection of the observed isophotal ratio, by making use oftherecovered best model value for the inclination). The only excep-tion is represented by the case of the lenticular galaxy SDSSJ0959,which has a total density profile much rounder that the luminousone.
(v) The lower limit for the dark matter fraction, calculatedwithin spherical shells under the hypotheses of “maximum bulge”and position-independent stellar mass-to-light ratio, falls in therange 10− 25 per cent (of the total mass) at half the effective ra-dius, and rises to 15− 30 per cent atr = Re. This is fully consistentwith the results of several studies of the dark and luminous massdistribution in nearby ellipticals (in particular Gerhardet al. 2001;Cappellari et al. 2006; Thomas et al. 2007).
(vi) The SLACS galaxies in our subsample are only mildlyanisotropic, with the global parameter−0.16 6 δ 6 0.16. Five outof six systems are slightly flattened (beyond the contribution of ro-tation) by having a larger pressure support parallel to the equatorialplane rather than perpendicular to it; the situation is reversed in thecase of SDSS J0959, which shows negativeδ.
(vii) From the inspection of the stellar velocity maps, the globaland localv/σ ratio and, more decisively, the intrinsic rotation pa-rameterjz (directly related to the angular momentum of the stellarcomponent of the galaxy), it is possible to objectively quantify thelevel of ordered rotation with respect to the random motions. Twoof the systems, namely SDSS J0216 and SDSS J2321, are identi-fied as slow rotators, while SDSS J0959 unambiguously shows thecharacteristics of fast rotators, including the relatively low mass andluminosity: with MB = −20.58 it is the only system in our sampleto lie within the typical range of absolute magnitudes for fast ro-tators determined by Emsellem et al. (2007). The remaining threegalaxies exhibit a moderate amount of rotation.
Overall, the early-type lens galaxies analyzed in this paper, inthe redshift rangez= 0.08−0.33, are found to be very similar to thelocal massive ellipticals, in terms of structural and dynamical prop-erties of their inner regions. Our study shows, for the first time,that also the physical distinction between slow and fast rotators
c© 0000 RAS, MNRAS000, 000–000
Two-dimensional kinematics of SLACS lenses – II.15
(a) J0037 (b) J0216 (c) J0912
(d) J0959 (e) J1627 (f) J2321
Figure 18. Maps of the local〈vϕ〉/σ ratio between the mean rotation velocity around thez-axis and the mean velocity dispersion, plotted up toRe/2 in thepositive quadrant of the meridional plane.
(originally revealed by the SAURON survey: Emsellem et al. 2007;Cappellari et al. 2007) is already in place at redshift& 0.1, althougha larger sample is necessary in order to quantify this more pre-cisely to higher redshifts. Since a series of studies (Treu et al. 2006;Bolton et al. 2008; Treu et al. 2008) has shown that the SLACS sys-tems are statistically identical—in terms of observational propertiesand environment—to non-lens galaxies of comparable size and lu-minosity, we can generalize the results of this work and concludethat at least the most massive elliptical galaxies did not experienceany major evolutionary process in their global structural propertiesbetween redshift 0 and 0.3. Since the look-back time is only 3.7Gyr, this might not be surprising. However, pushing lensinganddynamics techniques back in redshift and cosmic time is crucial ifwe ever wish to fully understand the structural evolution ofearly-type galaxies. In this paper a first step has been taken, usingmoresophisticated self-consistent techniques. This goes beyond what ispossible with the use of lensing or dynamics alone.
On the other hand, we also find differences between the ana-lyzed systems and nearby galaxies when we compare the respectiveglobal anisotropy parameters. Although the values ofδ recoveredfor the SLACS subsample fall within the typical range for localgalaxies, we note that we do not find any systems withδ & 0.20,which are instead quite common in the SAURON and Coma sam-ples. This might be due, however, to the very modest size of oursample, particularly in terms of fast-rotating objects. A much moredrastic discrepancy is evident in the distributions of the anisotropyparametersγ andβ, plausibly due to the limitations of our assump-tion of two-integral DF, which imposesσ2
R = σ2z at every loca-
tion. Isotropy in the meridional plane is not observed, in general,for local ellipticals, where usuallyσ2
R > σ2z (e.g. Gerssen et al.
1997; Thomas et al. 2008). If this applies also to more distant sys-tems, then the anisotropy will not be correctly estimated byourmethod, and more sophisticated axisymmetric three-integral mod-els might provide a better dynamical description of the galaxy. Weforesee future developments of thecauldron algorithm in this di-rection, concurrently with the availability of improved kinematicdata sets. As for the present analysis, however, thef (E, Lz) as-sumption generally appears to work satisfactorily, providing gen-erally correct reconstructions of the observables. Furthermore, astested in Barnabe et al. (2008), the current method is robust enoughto recover in a reliable way several important global properties ofthe analyzed galaxy (such as the density slope, dark matter frac-tion, angular momentum andδ parameter, although not the flatten-ing and theγ andβ parameters) even if it is applied to a complex,non-symmetric system which departs significantly from the ideal-ized assumptions of axisymmetry and two- or three-integralDF,and which is likely more extreme than the typical ellipticals understudy.
In future papers in this series, we plan to extend the currentstudy by applying the combined analysis to all the 30 systemsforwhich two-dimensional kinematic maps are or will become avail-able. This includes the entire sample of 17 SLACS early-typelensgalaxies for which integral field spectroscopy has been obtained.Two-dimensional kinematic maps can also be obtained for a fur-ther 13 lens galaxies for which long-slit spectroscopic observationshave been conducted with the instrument LRIS mounted on Keck-I,with the slit positions aligned with the major axis of the system andoffset along the minor axis in order to mimic integral field spec-troscopy.
c© 0000 RAS, MNRAS000, 000–000
16 M. Barnabe et al.
ACKNOWLEDGMENTS
M. B. is grateful to Mattia Righi for many lively and stimulat-ing discussions. M. B. acknowledges the support from an NWOprogram subsidy (project number 614.000.417). OC and LVEKare supported (in part) through an NWO-VIDI program subsidy(project number 639.042.505). We also acknowledge the contin-uing support by the European Community’s Sixth FrameworkMarie Curie Research Training Network Programme, ContractNo. MRTN-CT-2004-505183 ‘ANGLES’. TT acknowledges sup-port from the NSF through CAREER award NSF-0642621, by theSloan Foundation through a Sloan Research Fellowship, and bythe Packard Foundation through a Packard Fellowship. Support forprograms #10174 and #10494 was provided by NASA through agrant from the Space Telescope Science Institute, which is oper-ated by the Association of Universities for Research in Astronomy,Inc., under NASA contract NAS 5-26555.
REFERENCES
Arnaboldi M., Freeman K. C., Mendez R. H., Cappaccioli M.,Ciardullo R., Ford H., Gerhard O., Hui X., Jacoby G. H., Ku-dritzki R. P., Quinn P. J., 1996, ApJ, 472, 145
Barnabe M., Koopmans L. V. E., 2007, ApJ, 666, 726Barnabe M., Nipoti C., Koopmans L. V. E., Vegetti S., CiottiL.,2008, MNRAS, in press
Barnes J. E., 1992, ApJ, 393, 484Barth A. J., Ho L. C., Sargent W. L. W., 2002, AJ, 124, 2607Bertin E., 2008, SWARP User’s Guide. v2.17.0 ednBertin G., Bertola F., Buson L. M., Danzinger I. J., DejongheH.,Sadler E. M., Saglia R. P., de Zeeuw P. T., Zeilinger W. W., 1994,A&A, 292, 381
Binney J., 1978, MNRAS, 183, 501Binney J., 2005, MNRAS, 363, 937Binney J., Tremaine S., 2008, Galactic Dynamics. PrincetonUni-versity Press
Bolton A. S., Burles S., Koopmans L. V. E., Treu T., Gavazzi R.,Moustakas L. A., Wayth R., Schlegel D. J., 2008, ApJ, 682, 964
Bolton A. S., Burles S., Koopmans L. V. E., Treu T., MoustakasL. A., 2006, ApJ, 638, 703
Bolton A. S., Treu T., Koopmans L. V. E., Gavazzi R., MoustakasL. A., Burles S., Schlegel D. J., Wayth R., 2008, ApJ, 684, 248
Borriello A., Salucci P., Danese L., 2003, MNRAS, 341, 1109Burkert A., Naab T., 2005, MNRAS, 363, 597Cappellari M., Bacon R., Bureau M., Damen M. C., Davies R. L.,de Zeeuw P. T., Emsellem E., Falcon-Barroso J., et al., 2006,MNRAS, 366, 1126
Cappellari M., Emsellem E., 2004, PASP, 116, 138Cappellari M., Emsellem E., Bacon R., Bureau M., Davies R. L.,de Zeeuw P. T., Falcon-Barroso J., Krajnovic D., KuntschnerH., McDermid R. M., Peletier R. F., Sarzi M., van den BoschR. C. E., van de Ven G., 2007, MNRAS, 379, 418
Carollo C. M., de Zeeuw P. T., van der Marel R. P., Danziger I. J.,Qian E. E., 1995, ApJ, 441, L25
Chandrasekhar S., 1969, Ellipsoidal Figures of Equilibrium. YaleUniversity Press
Cole S., Lacey C. G., Baugh C. M., Frenk C. S., 2000, MNRAS,319, 168
Cote P., McLaughlin D. E., Cohen J. G., Blakeslee J. P., 2003,ApJ, 591, 850
Cousins R. D., 1995, American Journal of Physics, 63, 398
Cretton N., de Zeeuw P. T., van der Marel R. P., Rix H.-W., 1999,ApJS, 124, 383
Czoske O., Barnabe M., Koopmans L. V. E., 2008, in Prob-ing Stellar Populations out to the Distant Universe Conference,(arXiv:0811.2391) Integral-field spectroscopy of SLACS lenses
Czoske O., Barnabe M., Koopmans L. V. E., Treu T., Bolton A. S.,2008, MNRAS, 384, 987
de Lorenzi F., Gerhard O., Saglia R. P., Sambhus N., DebattistaV. P., Pannella M., Mendez R. H., 2008, MNRAS, 385, 1729
de Zeeuw P. T., Bureau M., Emsellem E., Bacon R., Carollo C. M.,Copin Y., Davies R. L., Kuntschner H., et al., 2002, MNRAS,329, 513
Emsellem E., Cappellari M., Krajnovic D., van de Ven G., Ba-con R., Bureau M., Davies R. L., de Zeeuw P. T., et al., 2007,MNRAS, 379, 401
Emsellem E., Cappellari M., Peletier R. F., McDermid R. M.,Bacon R., Bureau M., Copin Y., Davies R. L., Krajnovic D.,Kuntschner H., Miller B. W., de Zeeuw P. T., 2004, MNRAS,352, 721
Fabbiano G., 1989, ARAA, 27, 87Falco E. E., Gorenstein M. V., Shapiro I. I., 1985, ApJ, 289, L1Franx M., van Gorkom J. H., de Zeeuw T., 1994, ApJ, 436, 642Fukazawa Y., Botoya-Nonesa J. G., Pu J., Ohto A., Kawano N.,2006, ApJ, 636, 698
Gavazzi R., Treu T., Koopmans L. V. E., Bolton A. S., MoustakasL. A., Burles S., Marshall P. J., 2008, ApJ, 677, 1046
Gavazzi R., Treu T., Rhodes J. D., Koopmans L. V. E., BoltonA. S., Burles S., Massey R. J., Moustakas L. A., 2007, ApJ, 667,176
Gerhard O., Kronawitter A., Saglia R. P., Bender R., 2001, AJ,121, 1936
Gerhard O. E., 1993, MNRAS, 265, 213Gerssen J., Kuijken K., Merrifield M. R., 1997, MNRAS, 288,618
Humphrey P. J., Buote D. A., Gastaldello F., Zappacosta L., Bul-lock J. S., Brighenti F., Mathews W. G., 2006, ApJ, 646, 899
Jesseit R., Naab T., Peletier R. F., Burkert A., 2007, MNRAS,376,997
Kelson D. D., Illingworth G. D., van Dokkum P. G., Franx M.,2000, ApJ, 531, 159
Kochanek C. S., 1991, ApJ, 373, 354Koopmans L., Treu T., Bolton A. S., Burles S., Moustakas L. A.,2006, ApJ, 649, 599
Koopmans L. V. E., Treu T., 2002, ApJ, 568, L5Koopmans L. V. E., Treu T., 2003, ApJ, 583, 606Koopmans Leon V. E., 2005, MNRAS, 363, 1136Kronawitter A., Saglia R. P., Gerhard O., Bender R., 2000, A&AS,144, 53
Loewenstein M., White III R. E., 1999, ApJ, 518, 50MacKay D. J. C., 1992, PhD ThesisMacKay D. J. C., 1999, Neural Comp, 11, 1035MacKay D. J. C., 2003, Information Theory, Inference and Learn-ing Algorithms. Cambridge University Press
Marshall P. J., Treu T., Melbourne J., Gavazzi R., Bundy K., Am-mons S. M., Bolton A. S., Burles S., Larkin J. E., Le MignantD., Koo D. C., Koopmans L. V. E., Max C. E., Moustakas L. A.,Steinbring E., Wright S. A., 2007, ApJ, 671, 1196
Matsushita K., Makishima K., Ikebe Y., Rokutanda E., YamasakiN., Ohashi T., 1998, ApJ, 499, L13
Merrifield M. R., 1991, AJ, 102, 1335Mould J. R., Oke J. B., de Zeeuw P. T., Nemec J. M., 1990, AJ,99, 1823
c© 0000 RAS, MNRAS000, 000–000
Two-dimensional kinematics of SLACS lenses – II.17
Naab T., Khochfar S., Burkert A., 2006, ApJ, 636, L81Rix H.-W., de Zeeuw P. T., Cretton N., van der Marel R. P., CarolloC. M., 1997, ApJ, 488, 702
Romanowsky A. J., Douglas N. G., Arnaboldi M., Kuijken K.,Merrifield M. R., Napolitano N. R., Capaccioli M., FreemanK. C., 2003, Science, 301, 1696
Saglia R. P., Bertin G., Stiavelli M., 1992, ApJ, 384, 433Schneider P., Ehlers J., Falco E. E., 1992, Gravitational Lenses.Berlin, Springer-Verlag
Schwarzschild M., 1979, ApJ, 232, 236Scodeggio M., Franzetti P., Garilli B., Zanichelli A., Paltani S.,Maccagni D., Bottini D., Le Brun V., et al., 2005, PASP, 117,1284
Sivia D. S., Skilling J., 2006, Data Analysis: A Bayesian Tutorial.Oxford University Press
Skilling J., 2004, in Fischer R., Preuss R., Toussaint U. V.,eds,American Institute of Physics Conference Series Vol. 735 ofAmerican Institute of Physics Conference Series, Nested Sam-pling. pp 395–405
Suyu S. H., Marshall P. J., Hobson M. P., Blandford R. D., 2006,MNRAS, 371, 983
Thomas J., Jesseit R., Naab T., Saglia R. P., Burkert A., BenderR., 2007, MNRAS, 381, 1672
Thomas J., Jesseit R., Saglia R. P., Bender R., Burkert A., CorsiniE. M., Gebhardt K., Magorrian J., Naab T., Thomas D., WegnerG., 2008, MNRAS, in press
Thomas J., Saglia R. P., Bender R., Thomas D., Gebhardt K.,Magorrian J., Corsini E. M., Wegner G., 2007, MNRAS, 382,657
Toomre A., 1977, in Tinsley B. M., Larson R. B., eds, Evolutionof Galaxies and Stellar Populations Mergers and Some Conse-quences. p. 401
Treu T., Gavazzi R., Gorecki A., Marshall P. J., KoopmansL. V. E., Bolton A. S., Moustakas L. A., Burles S., 2008, ApJ, inpress
Treu T., Koopmans L. V. E., 2002, MNRAS, 337, L6Treu T., Koopmans L. V. E., 2003, MNRAS, 343, L29Treu T., Koopmans L. V. E., 2004, ApJ, 611, 739Treu T., Koopmans L. V. E., Bolton A. S., Burles S., MoustakasL., 2006, ApJ, 640, 662
Trott C. M., Treu T., Koopmans L. V. E., Webster R. L., 2008,preprint (arXiv:0812.0748)
Trujillo I., Burkert A., Bell E. F., 2004, ApJ, 600, L39Valdes F., Gupta R., Rose J. A., Singh H. P., Bell D. J., 2004,ApJS, 152, 251
van Albada T. S., Sancisi R., 1986, Royal Society of LondonPhilosophical Transactions Series A, 320, 447
van de Ven G., Falcon-Barroso J., McDermid R. M., Cap-pellari M., Miller B. W., de Zeeuw P. T., 2008, preprint(arXiv:0807.4175)
van der Marel R. P., Franx M., 1993, ApJ, 407, 525Vegetti S., Koopmans L. V. E., 2008, MNRAS, in pressVerolme E. K., de Zeeuw P. T., 2002, MNRAS, 331, 959White S. D. M., Frenk C. S., 1991, ApJ, 379, 52Wucknitz O., 2002, MNRAS, 332, 951Zanichelli A., Garilli B., Scodeggio M., Franzetti P., Rizzo D.,Maccagni D., Merighi R., Picat J.-P., et al., 2005, PASP, 117,1271
c© 0000 RAS, MNRAS000, 000–000


![KINEMATICS - new.excellencia.co.innew.excellencia.co.in/college/web/pdf/Kinematics-merged.pdf · KINEMATICS KINEMATICS WORKSHEET 1 1) Displacement is a _____ [ ] 1) Vector quantity](https://img.pdfslide.net/doc/110x75/5f356d4687229051801abace/kinematics-new-kinematics-kinematics-worksheet-1-1-displacement-is-a-.jpg)