Embed Size (px)
Citation preview
TXRF analysis of cell culture media and medical microsamples– saving time, money and livesBruker Nano Analytics, BerlinWebinar, January 18th, 2018
Innovation with Integrity
1/19/2018 2
Welcome
Speakers
Dr. Hagen StosnachApplications Scientist TXRFBerlin, Germany
Dr. Armin GrossGlobal Product Manager TXRFBerlin, Germany
Itinerary
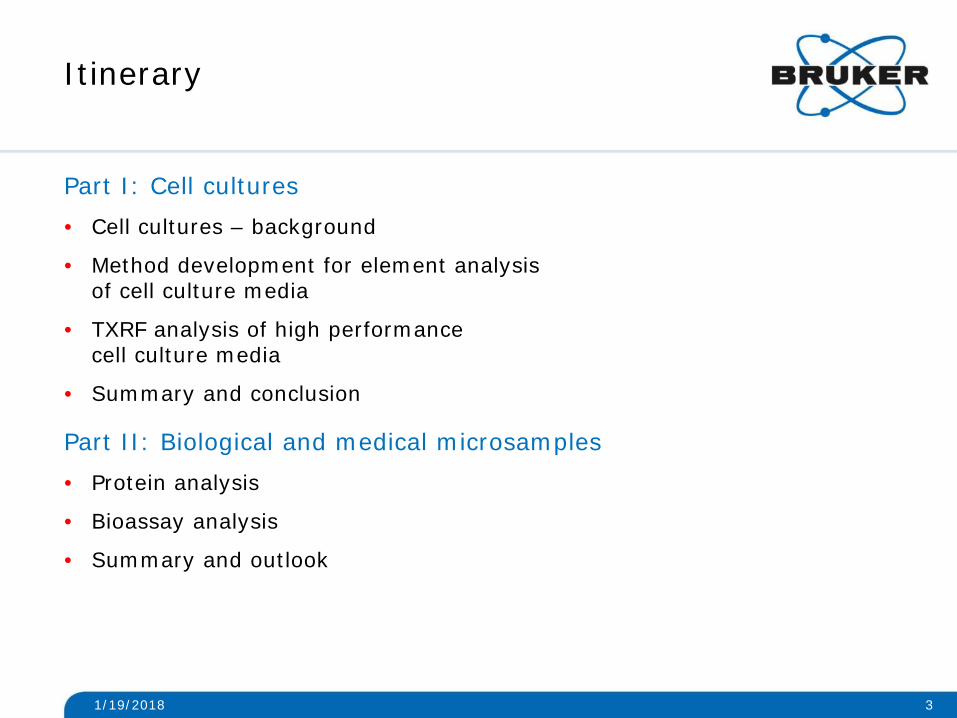
Part I: Cell cultures• Cell cultures – background
• Method development for element analysisof cell culture media
• TXRF analysis of high performancecell culture media
• Summary and conclusion
Part II: Biological and medical microsamples• Protein analysis
• Bioassay analysis
• Summary and outlook
1/19/2018 3

Part I: Cell cultures
Background
Cell culturesBackground
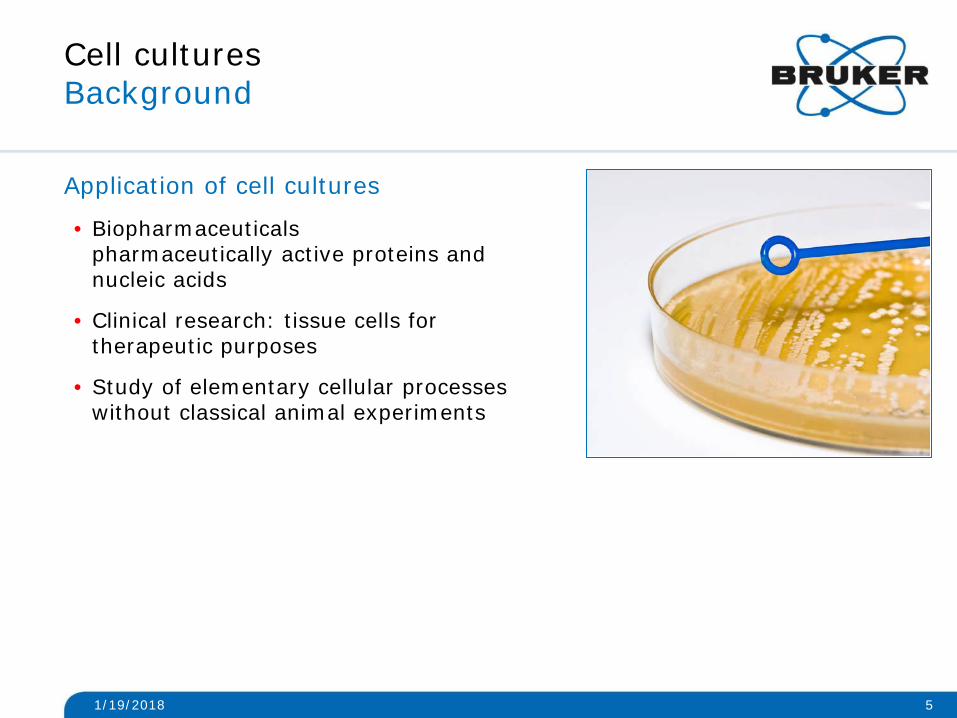
Application of cell cultures
• Biopharmaceuticalspharmaceutically active proteins and nucleic acids
• Clinical research: tissue cells for therapeutic purposes
• Study of elementary cellular processes without classical animal experiments
1/19/2018 5
Cell culturesBackground
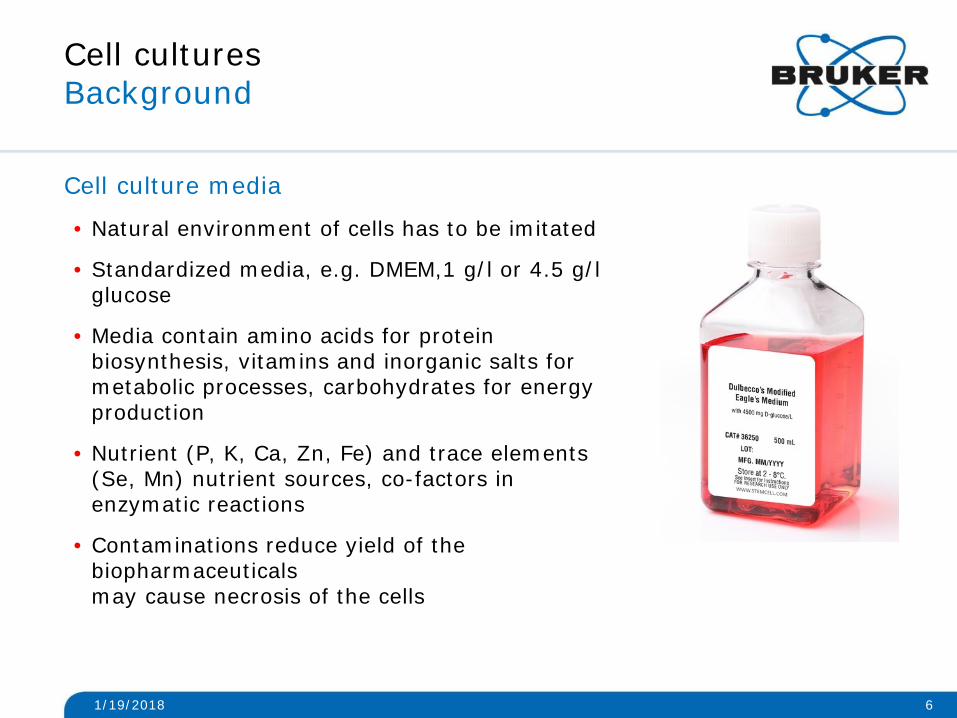
Cell culture media
• Natural environment of cells has to be imitated
• Standardized media, e.g. DMEM,1 g/l or 4.5 g/l glucose
• Media contain amino acids for protein biosynthesis, vitamins and inorganic salts for metabolic processes, carbohydrates for energy production
• Nutrient (P, K, Ca, Zn, Fe) and trace elements (Se, Mn) nutrient sources, co-factors in enzymatic reactions
• Contaminations reduce yield of the biopharmaceuticalsmay cause necrosis of the cells
1/19/2018 6
Cell culture mediaObjective
Objective 1
• Development of a TXRF method for cell culture media1. Optimize sample layer on disc, standard DMEM media
2. Determination of LOD / LOQ
3. Reproducibility
Objective 2
• Measurement of nutrient elements in cell culture media
Objective 3
• Apply method to modern high performance media
1. QC: identify contaminants
2. Spike experiments for method detection limits
1/19/2018 7
Cell culture mediaObjective
Samples
• Commercially available DMEM, 1 g/l or 4.5 g/l glucose
• Mammalian media from two German suppliersSugars conc. 8 g/l− Human Embryonic Kidney (HEK)− Chinese Hamster Ovary (CHO)− Baby Hamster Kidney (BHK)− Invertebrate (IKZ)− Feed media (20 g/l glucose)
1/19/2018 8
Cell culture mediaTXRF spectrometer
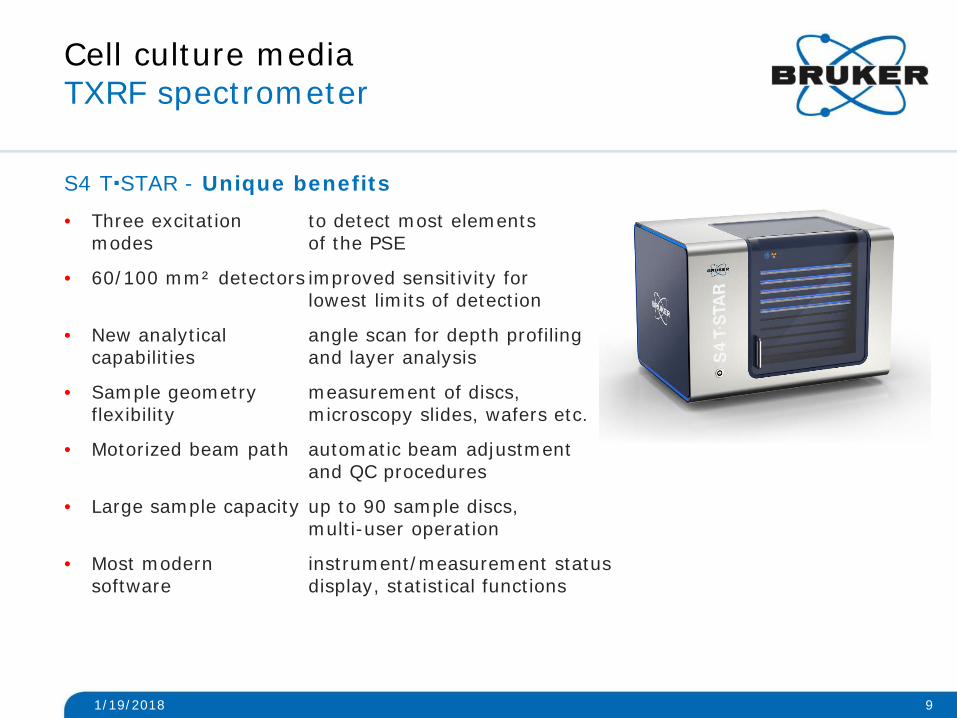
S4 TSTAR - Unique benefits• Three excitation to detect most elements
modes of the PSE
• 60/100 mm² detectors improved sensitivity for lowest limits of detection
• New analytical angle scan for depth profiling capabilities and layer analysis
• Sample geometry measurement of discs, flexibility microscopy slides, wafers etc.
• Motorized beam path automatic beam adjustment and QC procedures
• Large sample capacity up to 90 sample discs, multi-user operation
• Most modern instrument/measurement statussoftware display, statistical functions
1/19/2018 9
Method development for elementanalysis of cell culture media
Cell culture mediaMethod development
1. Optimize sample layer on disc
Comparison of different modifier solutions(smoothing agents)
• DMEM media with 50 – 200 ppm P, S, K, Ca
• Addition of 10% modifier(1% Triton X-100, Ethanol, PVA (0,3 g/l))
• Dilutions down to 1 : 100
• Internal standard Sc
Measurement parameter S4 T-STAR
• Mo excitation, 50 kV, 1000 µA
• W-L excitation, 50 kV, 1000 µA
• Measurement time 1000 s
1/19/2018 11
0
40
80
120
160
200
1:5
1:10
1:20
1:50
1:10
0
1:5
1:10
1:20
1:50
1:10
0
1:5
1:10
1:20
1:50
1:10
0
1:5
1:10
1:20
1:50
1:10
0
PVA Ethanol Triton X-100 Water
Reco
very
(%)
Potassium Calcium
Cell culture mediaMethod development
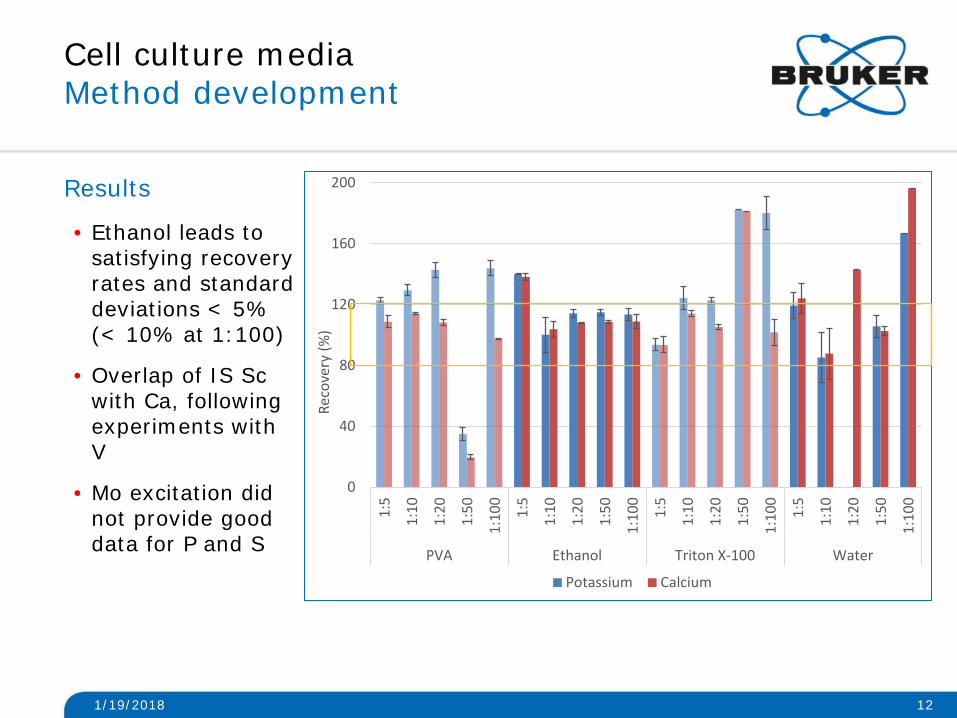
Results
• Ethanol leads tosatisfying recoveryrates and standarddeviations < 5% (< 10% at 1:100)
• Overlap of IS Scwith Ca, followingexperiments withV
• Mo excitation didnot provide gooddata for P and S
1/19/2018 12
0
40
80
120
160
200
1:5
1:10
1:20
1:50
1:10
0
1:5
1:10
1:20
1:50
1:10
0
1:5
1:10
1:20
1:50
1:10
0
1:5
1:10
1:20
1:50
1:10
0
PVA Ethanol Triton X-100 Water
Phosphor Sulfur
Cell culture mediaMethod development
Results
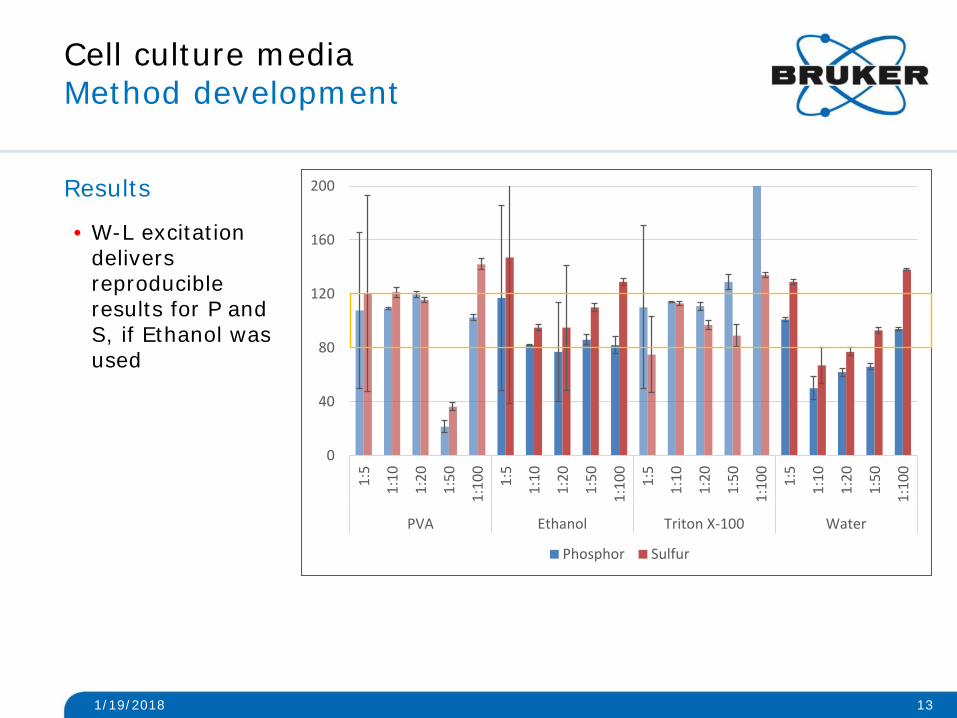
• W-L excitationdeliversreproducibleresults for P andS, if Ethanol was used
1/19/2018 13
Cell culture mediaMethod development
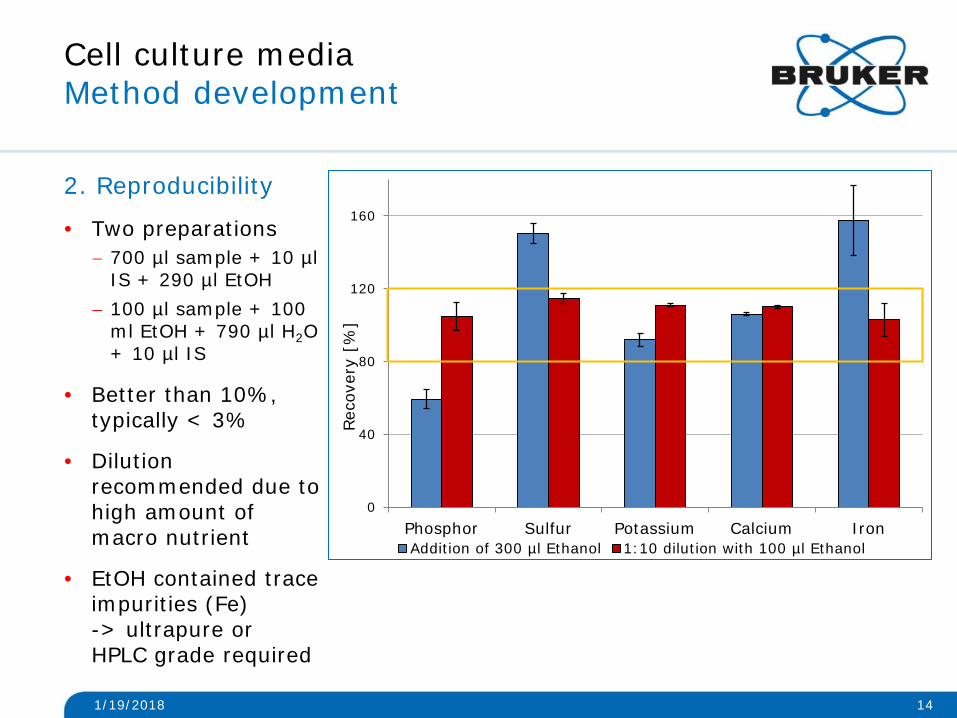
2. Reproducibility
• Two preparations− 700 µl sample + 10 µl
IS + 290 µl EtOH− 100 µl sample + 100
ml EtOH + 790 µl H2O + 10 µl IS
• Better than 10%, typically < 3%
• Dilution recommended due tohigh amount ofmacro nutrient
• EtOH contained traceimpurities (Fe)-> ultrapure orHPLC grade required
1/19/2018 14
0
40
80
120
160
Phosphor Sulfur Potassium Calcium Iron
Reco
very
[%
]
Addition of 300 µl Ethanol 1:10 dilution with 100 µl Ethanol
Cell culture mediaMethod development
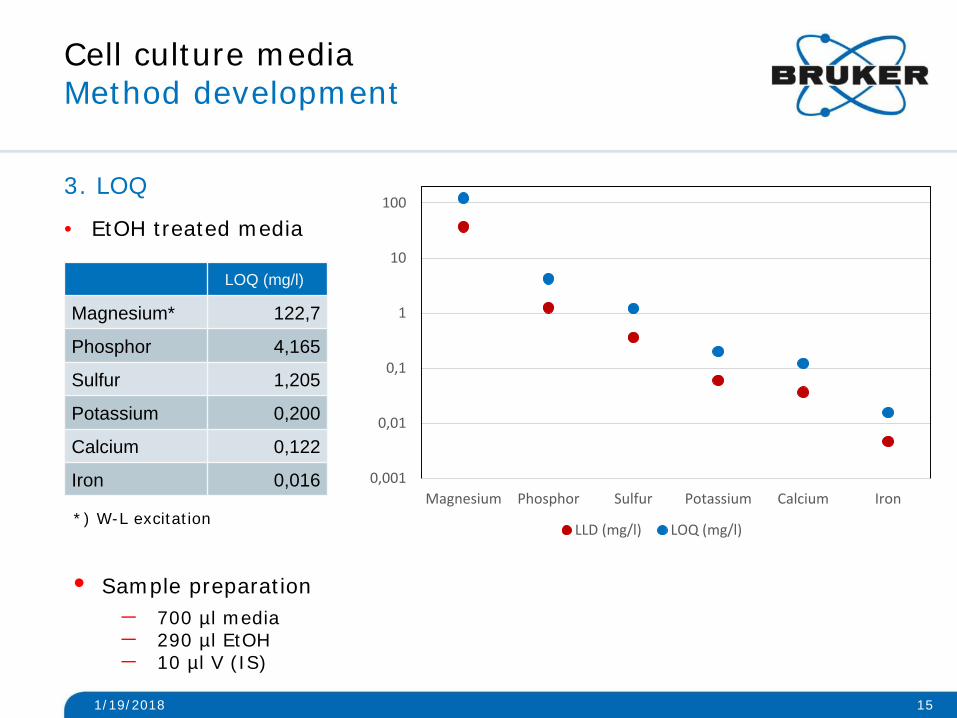
3. LOQ
• EtOH treated media
1/19/2018 15
0,001
0,01
0,1
1
10
100
Magnesium Phosphor Sulfur Potassium Calcium Iron
LLD (mg/l) LOQ (mg/l)
LOQ (mg/l)
Magnesium* 122,7
Phosphor 4,165
Sulfur 1,205
Potassium 0,200
Calcium 0,122
Iron 0,016
*) W-L excitation
• Sample preparation− 700 µl media− 290 µl EtOH− 10 µl V (IS)
TXRF analysis of high performancecell culture media
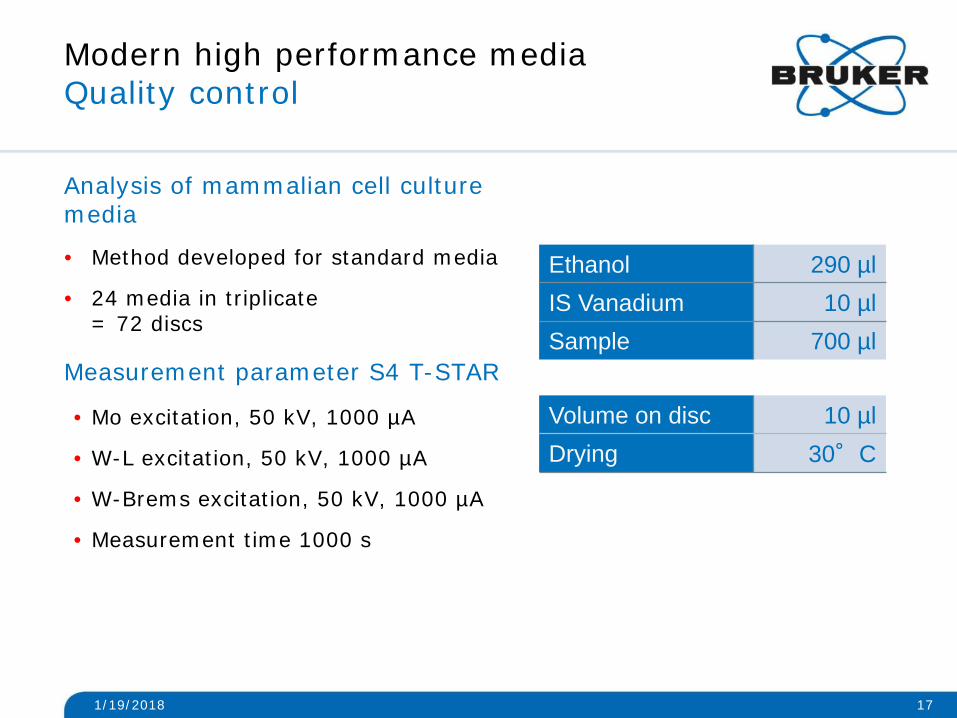
Modern high performance mediaQuality control
Analysis of mammalian cell culturemedia
• Method developed for standard media
• 24 media in triplicate= 72 discs
Measurement parameter S4 T-STAR
• Mo excitation, 50 kV, 1000 µA
• W-L excitation, 50 kV, 1000 µA
• W-Brems excitation, 50 kV, 1000 µA
• Measurement time 1000 s
1/19/2018 17
Ethanol 290 µlIS Vanadium 10 µlSample 700 µl
Volume on disc 10 µlDrying 30°C
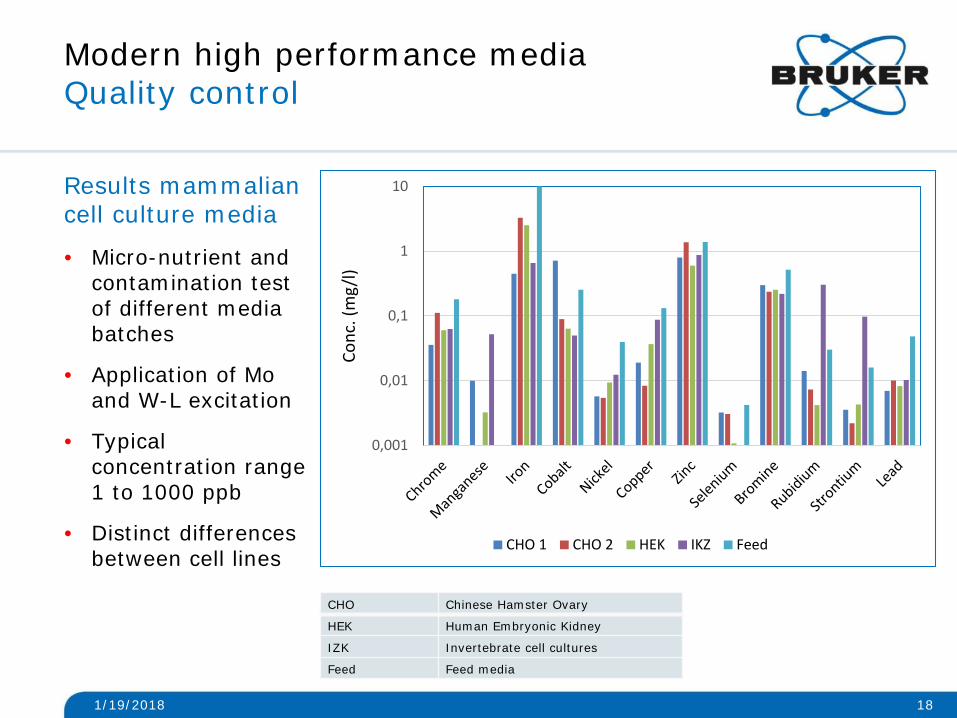
Modern high performance mediaQuality control
Results mammaliancell culture media
• Micro-nutrient andcontamination testof different mediabatches
• Application of Mo and W-L excitation
• Typicalconcentration range1 to 1000 ppb
• Distinct differencesbetween cell lines
1/19/2018 18
0,001
0,01
0,1
1
10
Conc
. (m
g/l)
CHO 1 CHO 2 HEK IKZ Feed
CHO Chinese Hamster Ovary
HEK Human Embryonic Kidney
IZK Invertebrate cell cultures
Feed Feed media
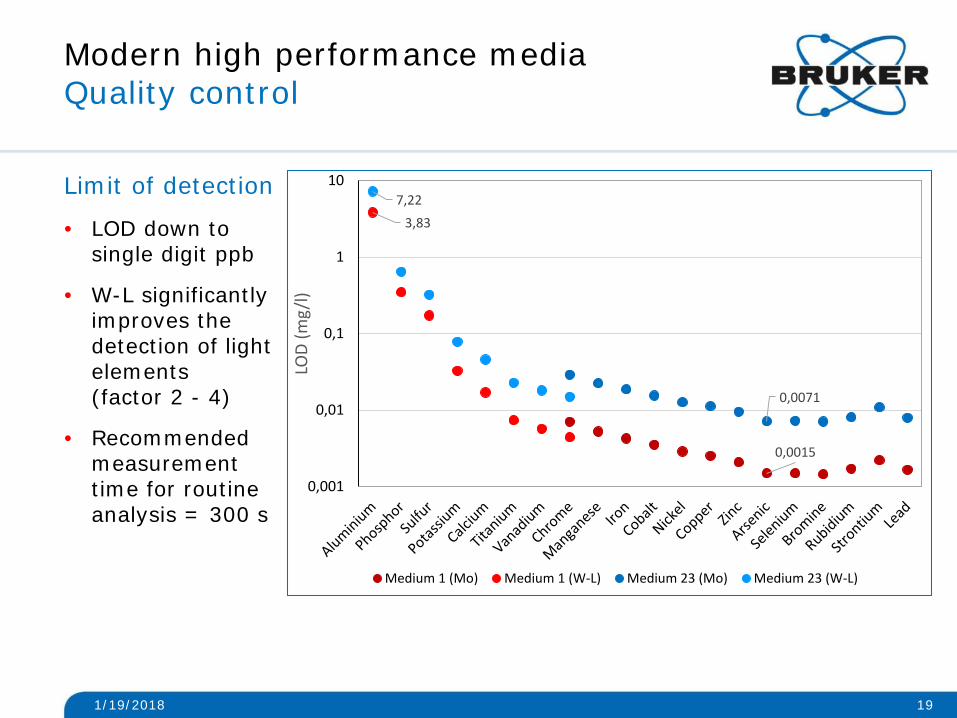
Modern high performance mediaQuality control
Limit of detection
• LOD down tosingle digit ppb
• W-L significantlyimproves thedetection of light elements(factor 2 - 4)
• Recommended measurementtime for routineanalysis = 300 s
1/19/2018 19
0,0015
3,83
0,0071
7,22
0,001
0,01
0,1
1
10
LOD
(mg/
l)
Medium 1 (Mo) Medium 1 (W-L) Medium 23 (Mo) Medium 23 (W-L)
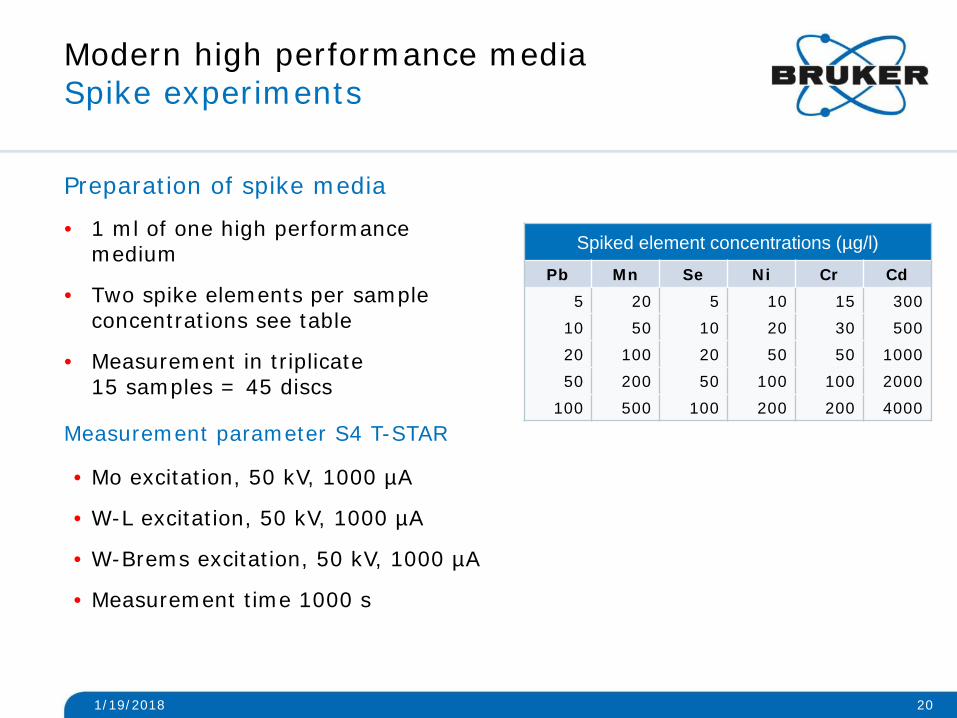
Modern high performance mediaSpike experiments
Spiked element concentrations (µg/l)
Pb Mn Se Ni Cr Cd5 20 5 10 15 300
10 50 10 20 30 50020 100 20 50 50 100050 200 50 100 100 2000
100 500 100 200 200 4000
1/19/2018 20
Preparation of spike media
• 1 ml of one high performancemedium
• Two spike elements per sample concentrations see table
• Measurement in triplicate15 samples = 45 discs
Measurement parameter S4 T-STAR
• Mo excitation, 50 kV, 1000 µA
• W-L excitation, 50 kV, 1000 µA
• W-Brems excitation, 50 kV, 1000 µA
• Measurement time 1000 s
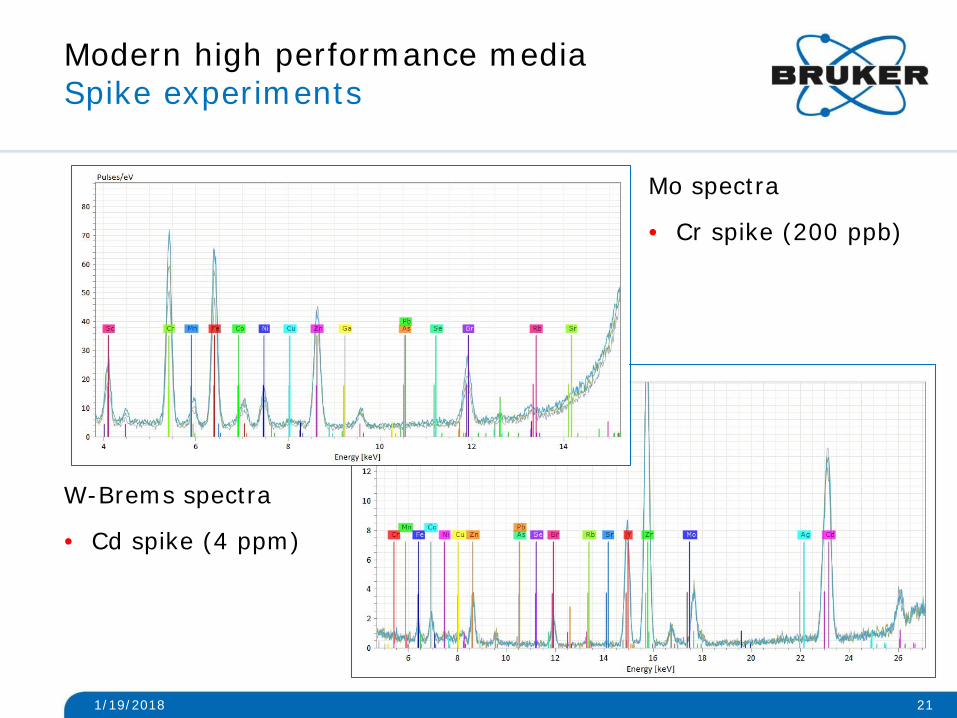
W-Brems spectra
• Cd spike (4 ppm)
1/19/2018 21
Mo spectra
• Cr spike (200 ppb)
Modern high performance mediaSpike experiments
y = 1,0256x + 0,0077R² = 0,9982
-0,05
0,05
0,1
0,15
0,2
0,25
-0,05 0,05 0,1 0,15 0,2 0,25
Mea
sure
d co
ncen
trat
ion
[mg/
l]
Spiked Ni concentration [mg/l]
Spiked values Measured values
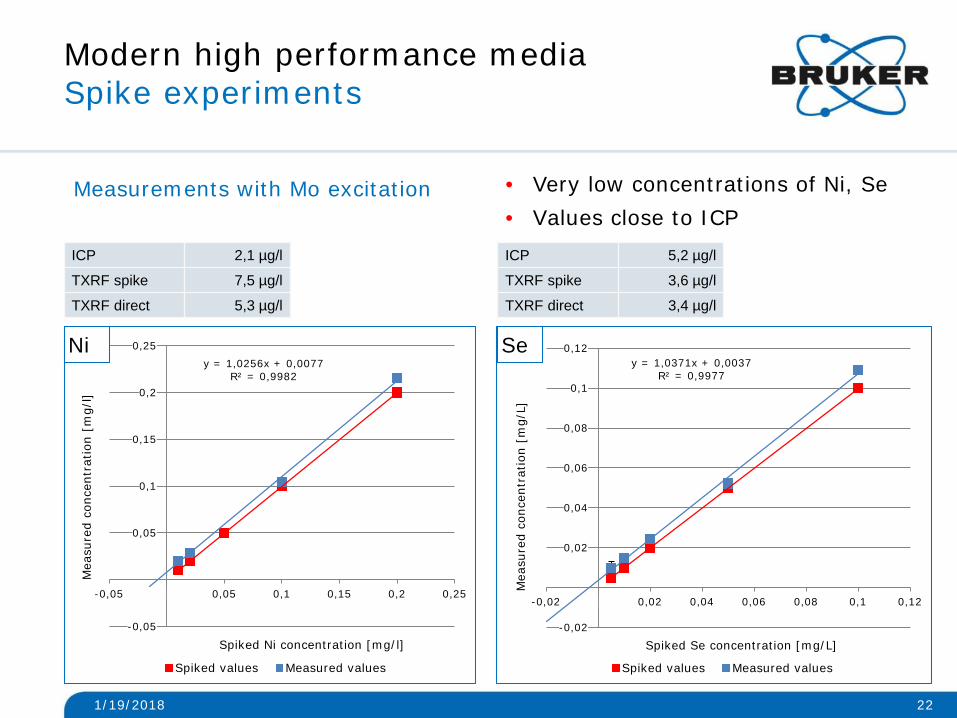
Modern high performance mediaSpike experiments
1/19/2018 22
Ni
Measurements with Mo excitation
ICP 2,1 µg/l
TXRF spike 7,5 µg/l
TXRF direct 5,3 µg/l
y = 1,0371x + 0,0037R² = 0,9977
-0,02
0,02
0,04
0,06
0,08
0,1
0,12
-0,02 0,02 0,04 0,06 0,08 0,1 0,12
Mea
sure
d co
ncen
trat
ion
[mg/
L]
Spiked Se concentration [mg/L]
Spiked values Measured values
Se
ICP 5,2 µg/l
TXRF spike 3,6 µg/l
TXRF direct 3,4 µg/l
• Very low concentrations of Ni, Se• Values close to ICP
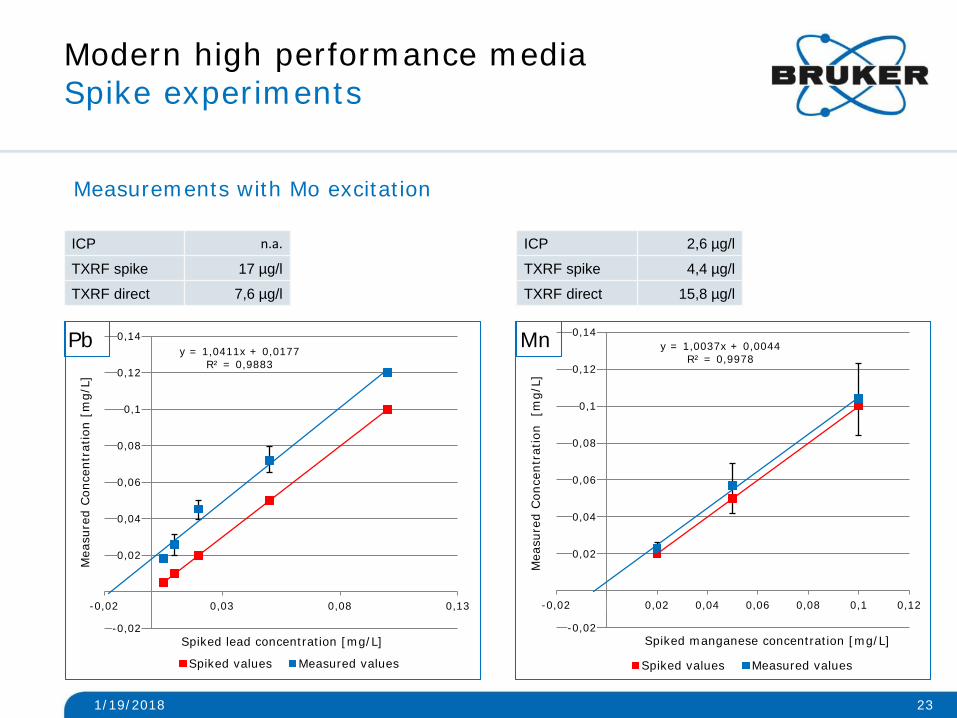
Modern high performance mediaSpike experiments
1/19/2018 23
y = 1,0411x + 0,0177R² = 0,9883
-0,02
0,02
0,04
0,06
0,08
0,1
0,12
0,14
-0,02 0,03 0,08 0,13
Mea
sure
d Con
cent
ratio
n [m
g/L]
Spiked lead concentration [mg/L]
Spiked values Measured values
y = 1,0037x + 0,0044R² = 0,9978
-0,02
0,02
0,04
0,06
0,08
0,1
0,12
0,14
-0,02 0,02 0,04 0,06 0,08 0,1 0,12
Mea
sure
d Con
cent
ratio
n [m
g/L]
Spiked manganese concentration [mg/L]
Spiked values Measured values
MnPb
Measurements with Mo excitation
ICP n.a.
TXRF spike 17 µg/l
TXRF direct 7,6 µg/l
ICP 2,6 µg/l
TXRF spike 4,4 µg/l
TXRF direct 15,8 µg/l
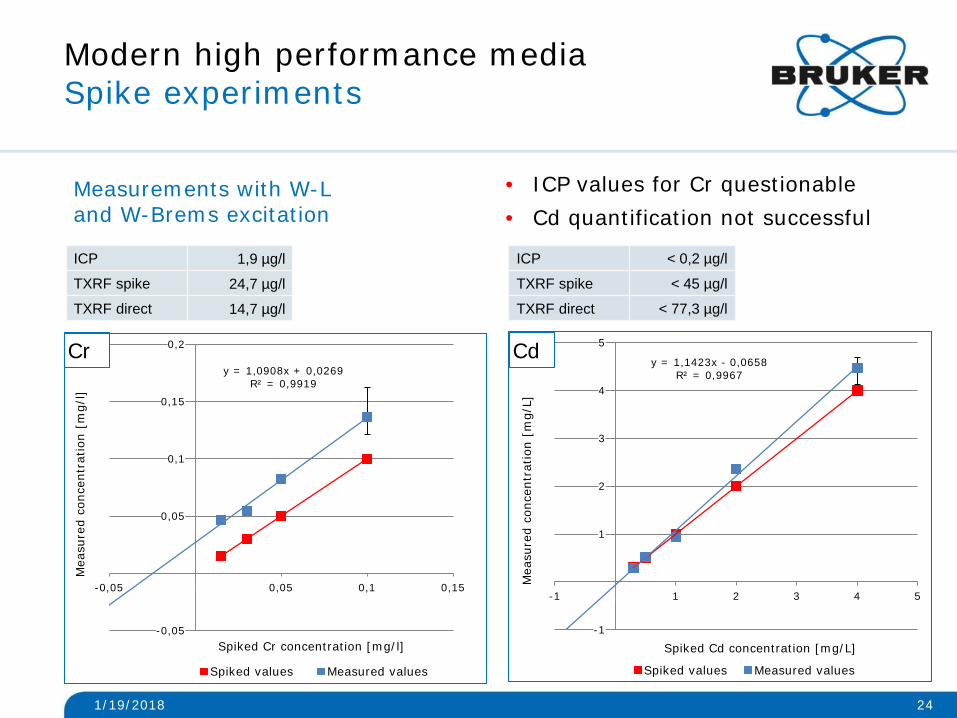
Modern high performance mediaSpike experiments
ICP 1,9 µg/l
TXRF spike 24,7 µg/l
TXRF direct 14,7 µg/l
1/19/2018 24
Measurements with W-L and W-Brems excitation
y = 1,1423x - 0,0658R² = 0,9967
-1
1
2
3
4
5
-1 1 2 3 4 5
Mea
sure
d co
ncen
trat
ion
[mg/
L]
Spiked Cd concentration [mg/L]
Spiked values Measured values
Cdy = 1,0908x + 0,0269
R² = 0,9919
-0,05
0,05
0,1
0,15
0,2
-0,05 0,05 0,1 0,15
Mea
sure
d co
ncen
trat
ion
[mg/
l]
Spiked Cr concentration [mg/l]
Spiked values Measured values
Cr
ICP < 0,2 µg/l
TXRF spike < 45 µg/l
TXRF direct < 77,3 µg/l
• ICP values for Cr questionable• Cd quantification not successful
Summary and conclusion
• A rapid method for TXRF measurements of cellculture media was developed
• EtOH has to be used as smooting agent foroptimal layer formation on quartz sample discs
• For contamination control detection limits in theone digit ppb range can be achieved
• The measurement of nutrient elements after a1:10 dilution provides a reproducibility < 10%
1/19/2018 25

Part II: Biological and medical microsamples

Protein analysisIntroduction
1/19/2018 27
Metal ions and enzymes• Metal ions are important for the biological
function of enzymes• Various modes of metal-protein interaction:
metal-, ligand-, enzyme-bridge complexes• Metals serve as electron donors or
acceptors, Lewis acids or structuralregulators
(Riordan JF.: “The role of metals in enzyme activity.”, Ann Clin Lab Sci. 1977 Mar-Apr;7(2):119-29
.
Protein analysisIntroduction
1/19/2018 28
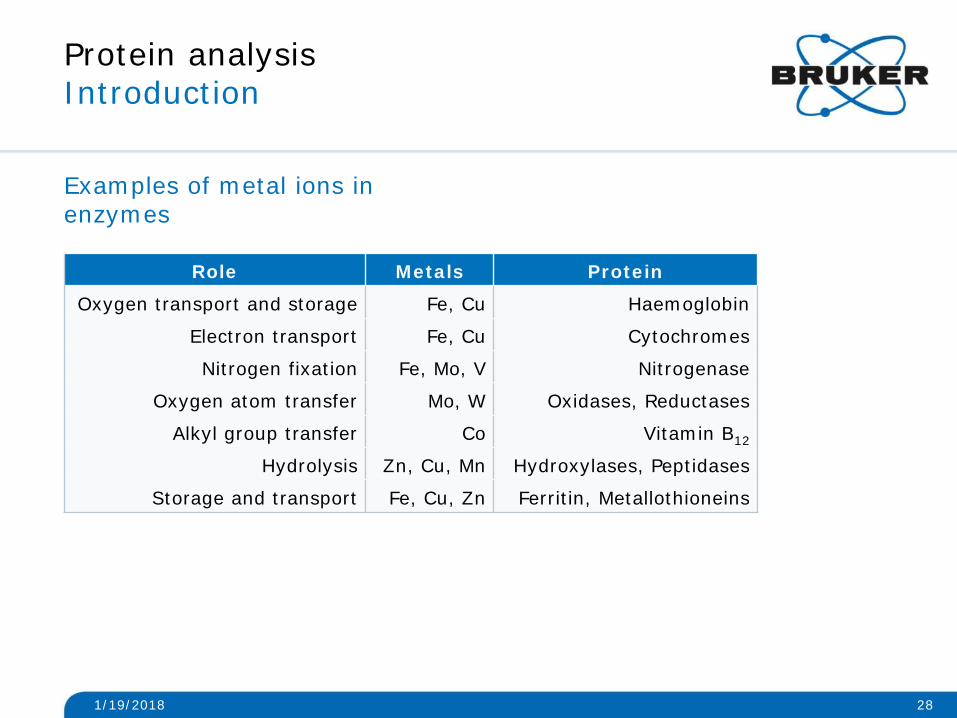
Examples of metal ions in enzymes
Role Metals Protein
Oxygen transport and storage Fe, Cu Haemoglobin
Electron transport Fe, Cu Cytochromes
Nitrogen fixation Fe, Mo, V Nitrogenase
Oxygen atom transfer Mo, W Oxidases, Reductases
Alkyl group transfer Co Vitamin B12
Hydrolysis Zn, Cu, Mn Hydroxylases, Peptidases
Storage and transport Fe, Cu, Zn Ferritin, Metallothioneins
Protein analysisIntroduction
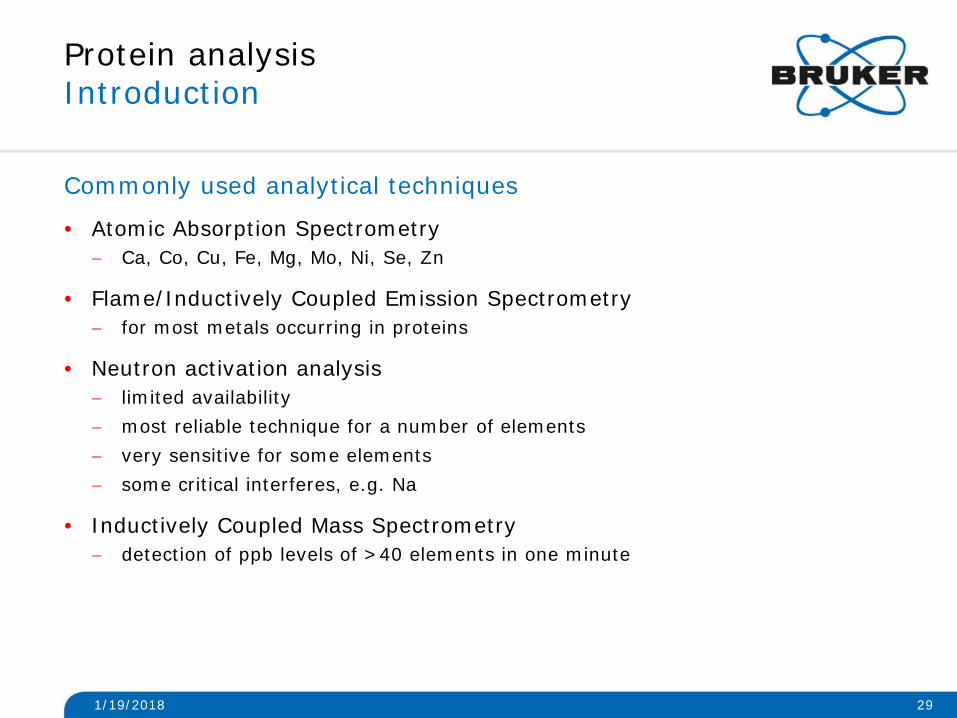
Commonly used analytical techniques
• Atomic Absorption Spectrometry− Ca, Co, Cu, Fe, Mg, Mo, Ni, Se, Zn
• Flame/Inductively Coupled Emission Spectrometry − for most metals occurring in proteins
• Neutron activation analysis − limited availability− most reliable technique for a number of elements− very sensitive for some elements− some critical interferes, e.g. Na
• Inductively Coupled Mass Spectrometry− detection of ppb levels of >40 elements in one minute
1/19/2018 29
Protein analysisIntroduction
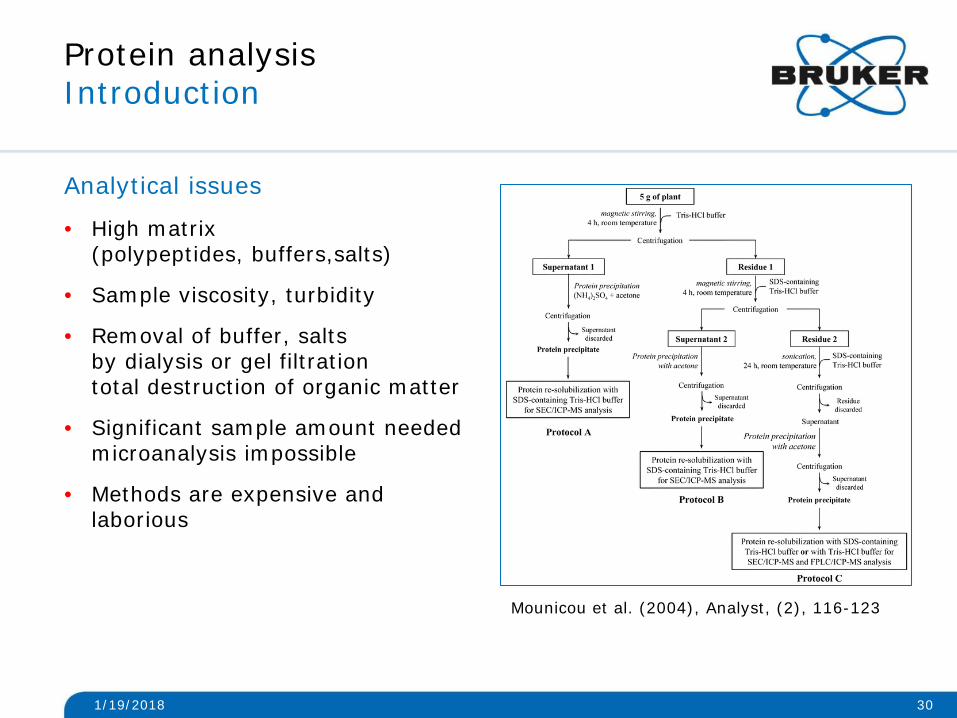
Analytical issues
• High matrix(polypeptides, buffers,salts)
• Sample viscosity, turbidity
• Removal of buffer, salts by dialysis or gel filtrationtotal destruction of organic matter
• Significant sample amount neededmicroanalysis impossible
• Methods are expensive and laborious
1/19/2018 30
Mounicou et al. (2004), Analyst, (2), 116-123
Protein analysisTXRF spectroscopy
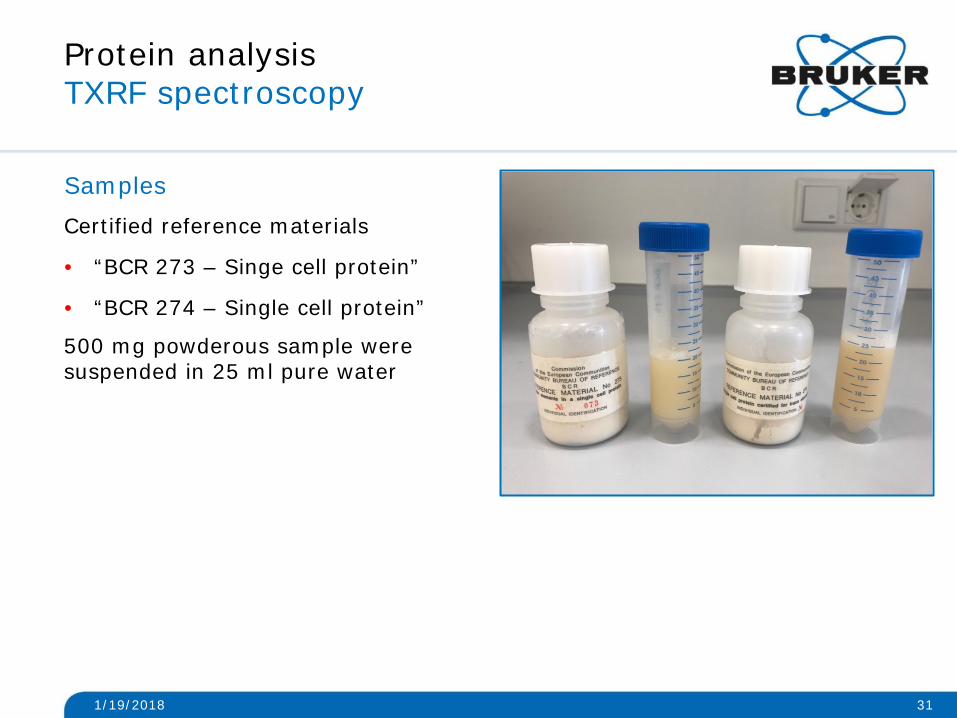
SamplesCertified reference materials
• “BCR 273 – Singe cell protein”
• “BCR 274 – Single cell protein”
500 mg powderous sample were suspended in 25 ml pure water
1/19/2018 31
Protein analysisTXRF spectroscopy
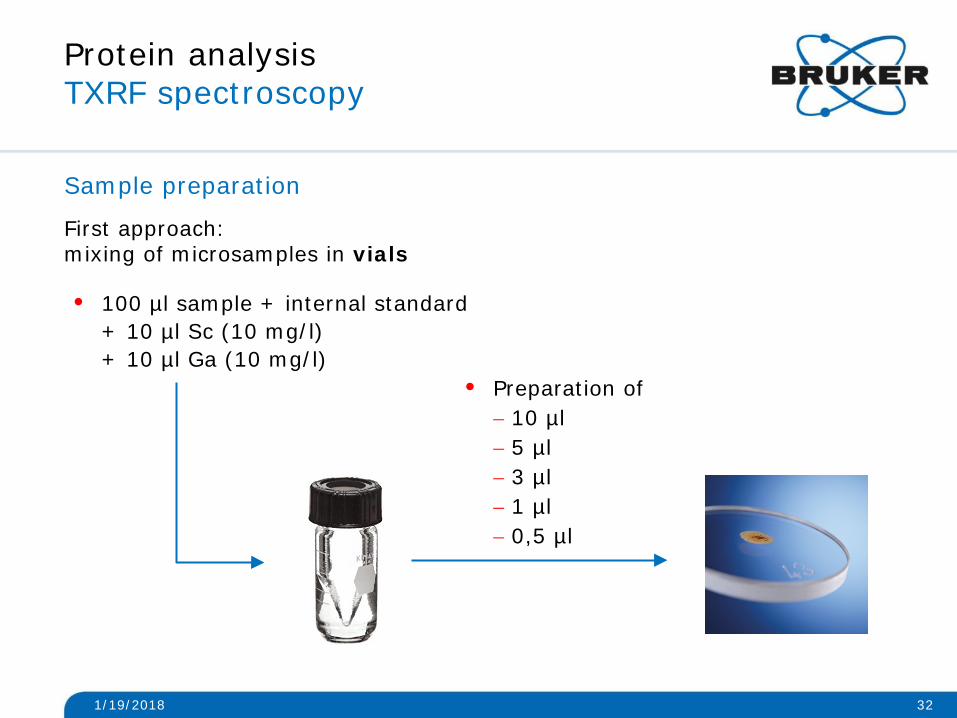
Sample preparation
First approach: mixing of microsamples in vials
1/19/2018 32
• 100 µl sample + internal standard+ 10 µl Sc (10 mg/l)+ 10 µl Ga (10 mg/l)
• Preparation of− 10 µl− 5 µl− 3 µl− 1 µl− 0,5 µl
Protein analysisTXRF spectroscopy
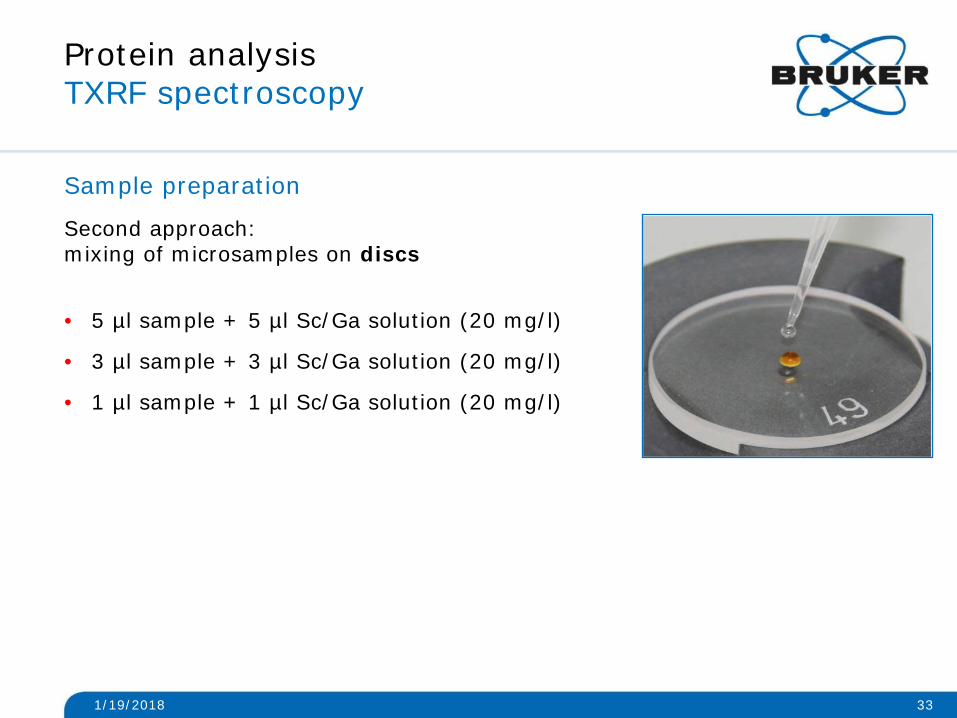
Sample preparation
Second approach: mixing of microsamples on discs
• 5 µl sample + 5 µl Sc/Ga solution (20 mg/l)
• 3 µl sample + 3 µl Sc/Ga solution (20 mg/l)
• 1 µl sample + 1 µl Sc/Ga solution (20 mg/l)
1/19/2018 33
Protein analysisTXRF spectroscopy
1/19/2018 34
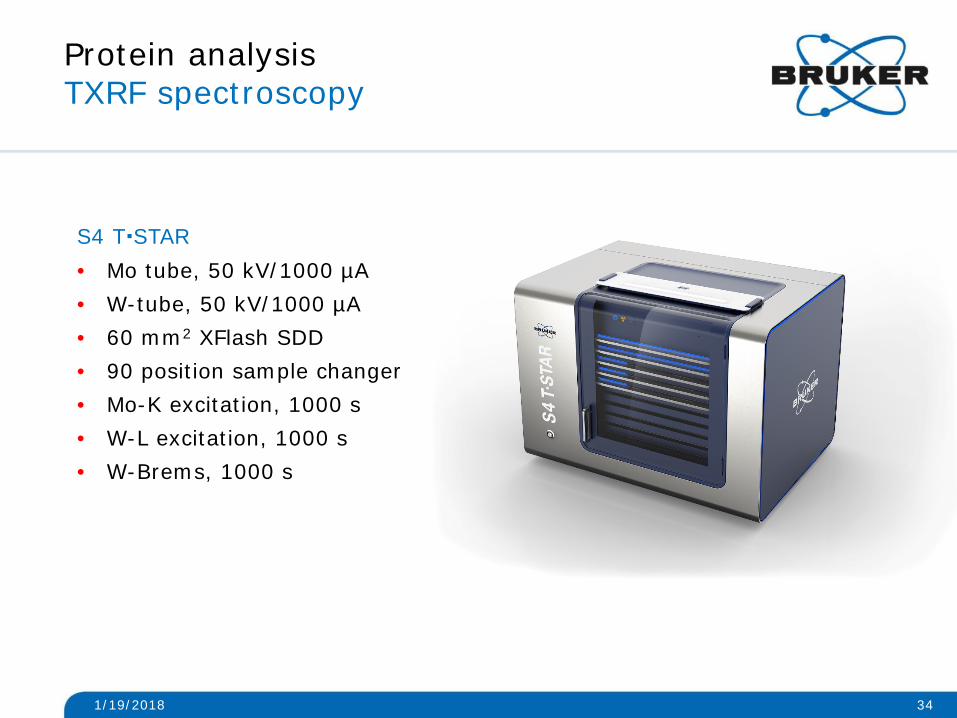
S4 TSTAR• Mo tube, 50 kV/1000 µA• W-tube, 50 kV/1000 µA• 60 mm2 XFlash SDD• 90 position sample changer• Mo-K excitation, 1000 s• W-L excitation, 1000 s• W-Brems, 1000 s
Protein analysisTXRF spectroscopy
1/19/2018 35
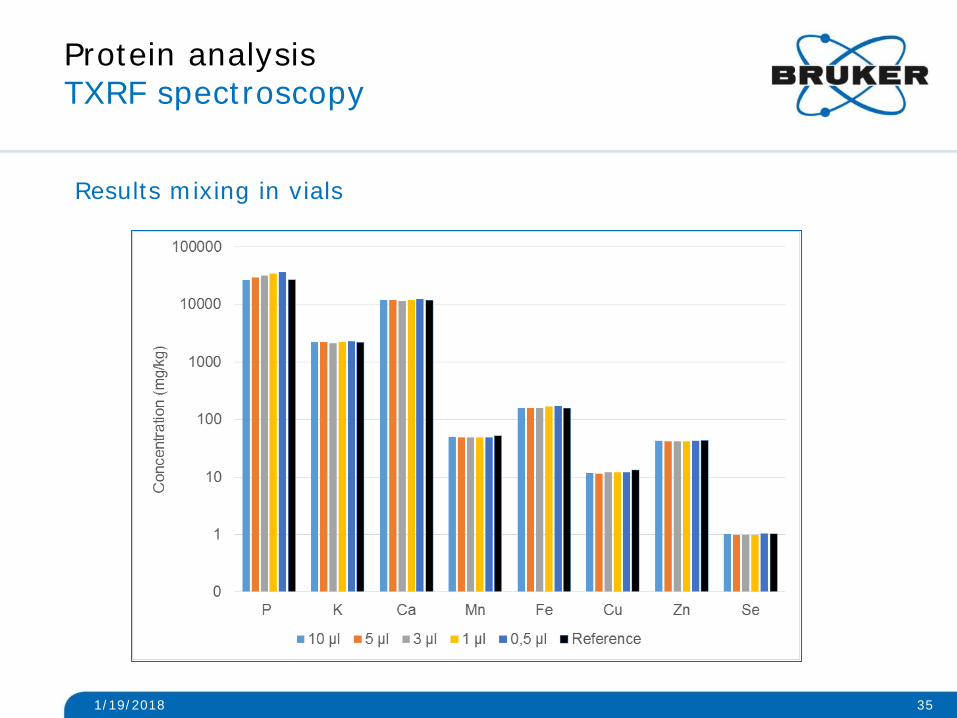
Results mixing in vials
Protein analysisTXRF spectroscopy
1/19/2018 36
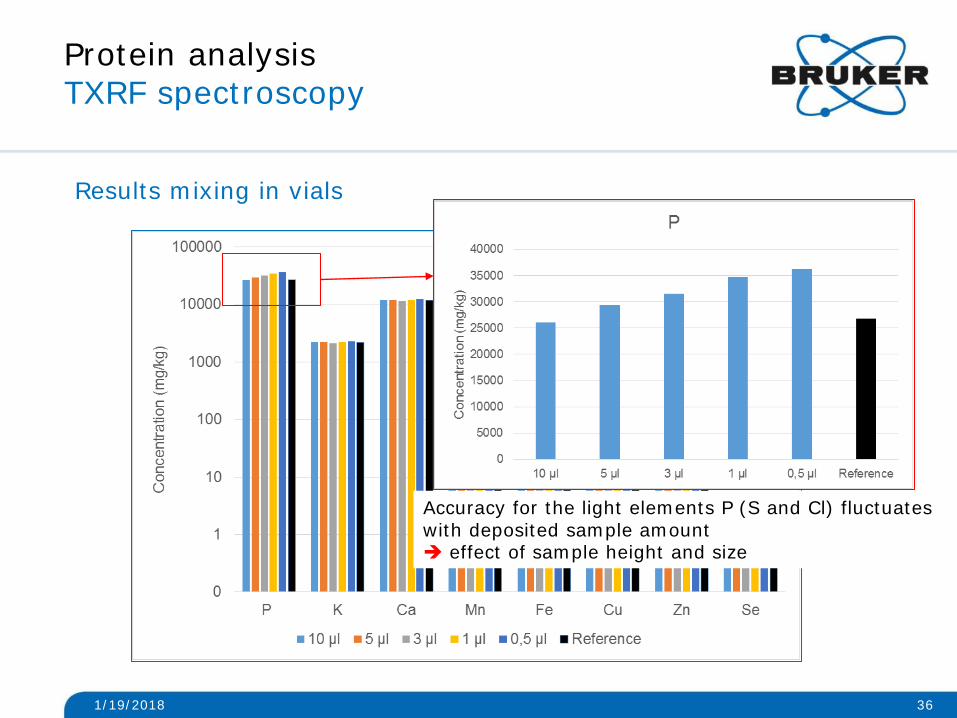
Results mixing in vials
Accuracy for the light elements P (S and Cl) fluctuates with deposited sample amount effect of sample height and size
Protein analysisTXRF spectroscopy
1/19/2018 37
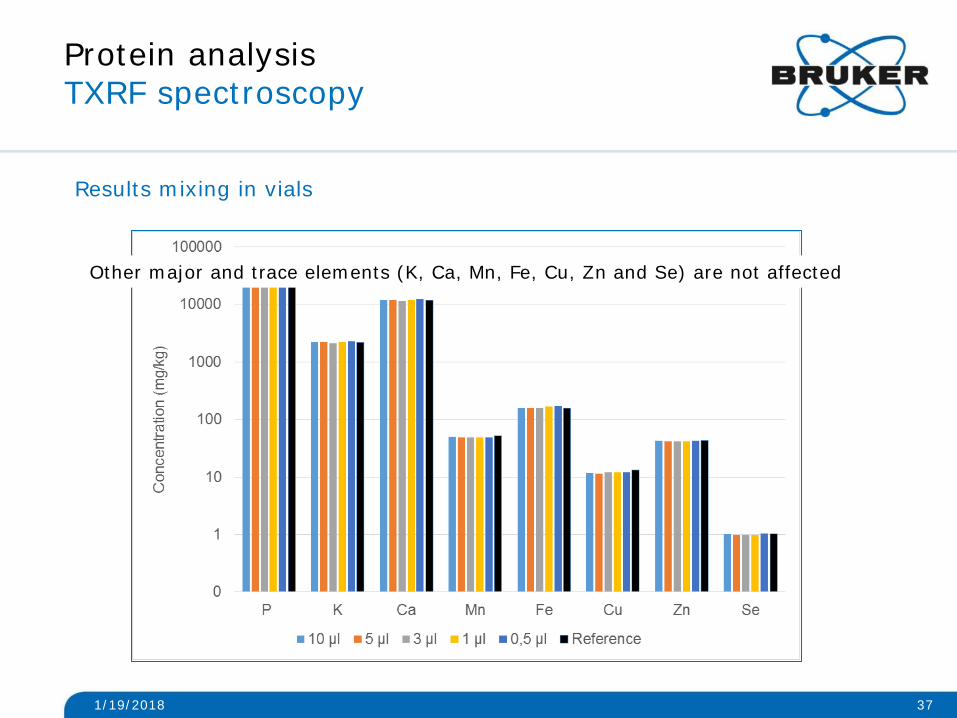
Results mixing in vials
Other major and trace elements (K, Ca, Mn, Fe, Cu, Zn and Se) are not affected
Protein analysisTXRF spectroscopy
1/19/2018 38
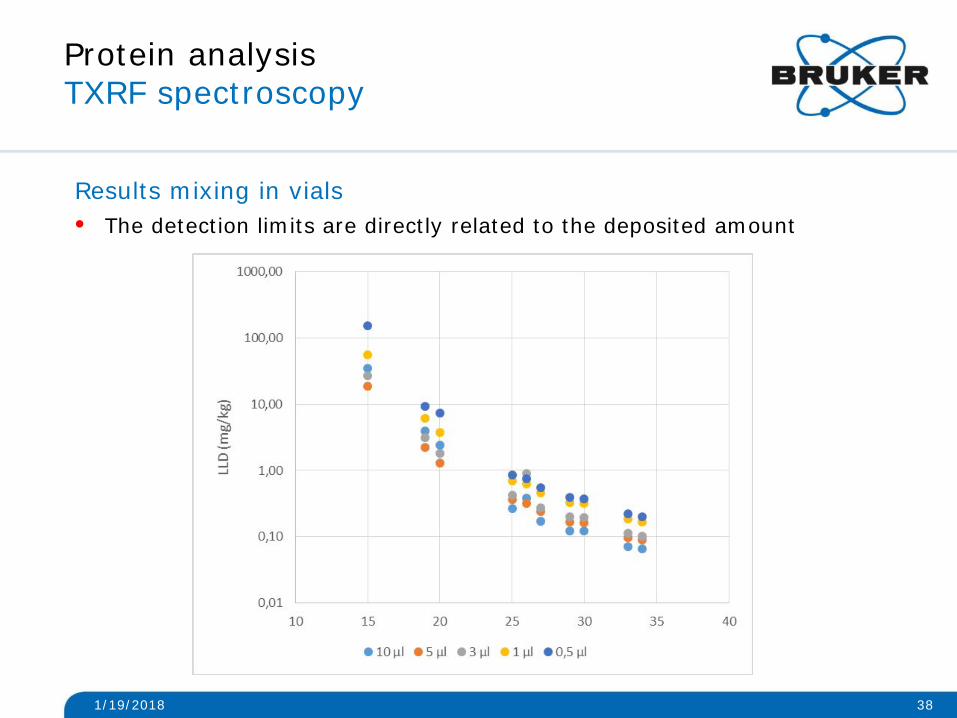
Results mixing in vials• The detection limits are directly related to the deposited amount
Protein analysisTXRF spectroscopy
1/19/2018 39
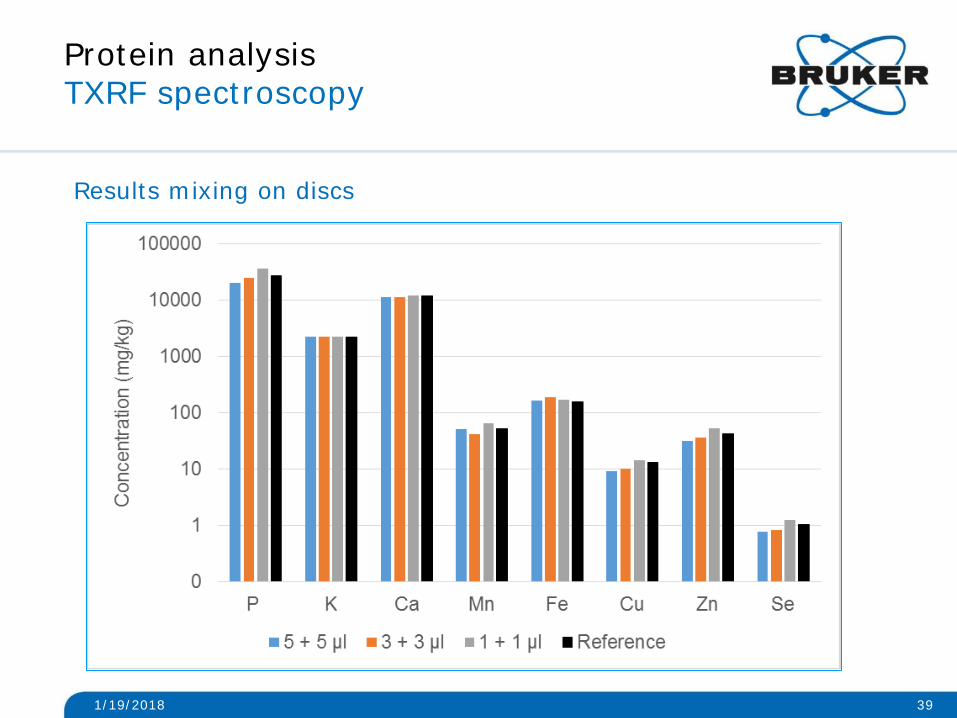
Results mixing on discs
Protein analysisTXRF spectroscopy
1/19/2018 40
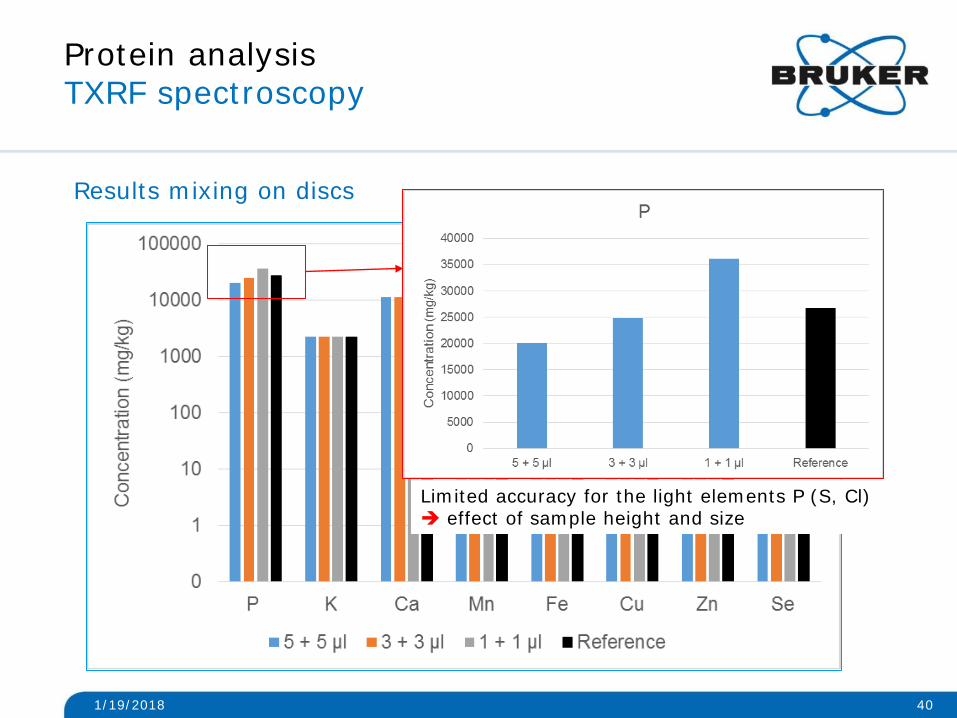
Results mixing on discs
Limited accuracy for the light elements P (S, Cl) effect of sample height and size
Protein analysisTXRF spectroscopy
1/19/2018 41
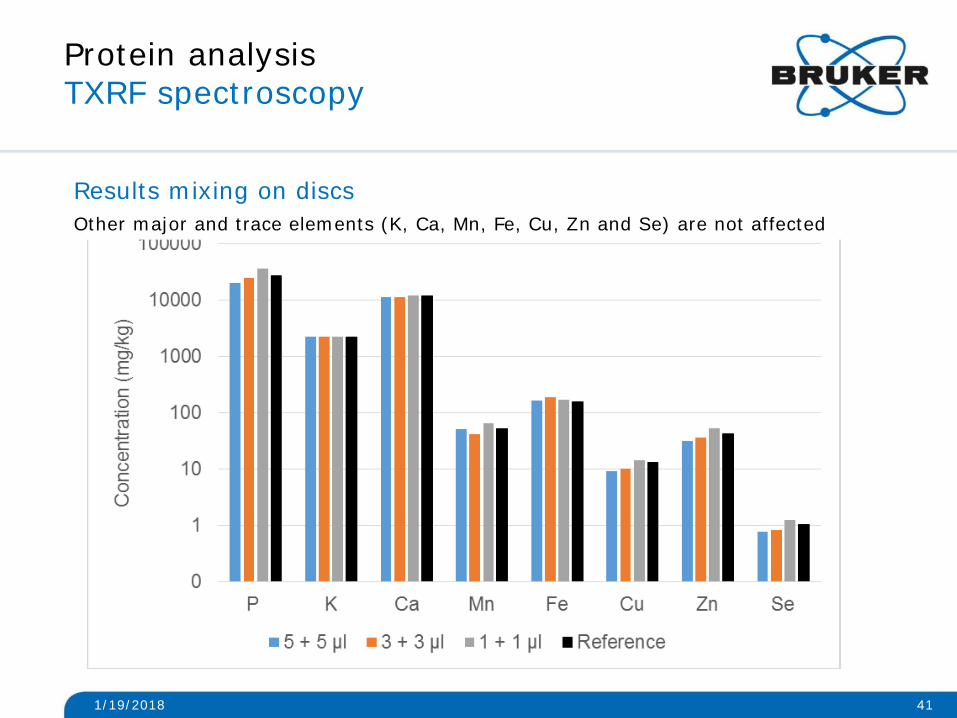
Results mixing on discsOther major and trace elements (K, Ca, Mn, Fe, Cu, Zn and Se) are not affected
Protein analysisTXRF spectroscopy
1/19/2018 42
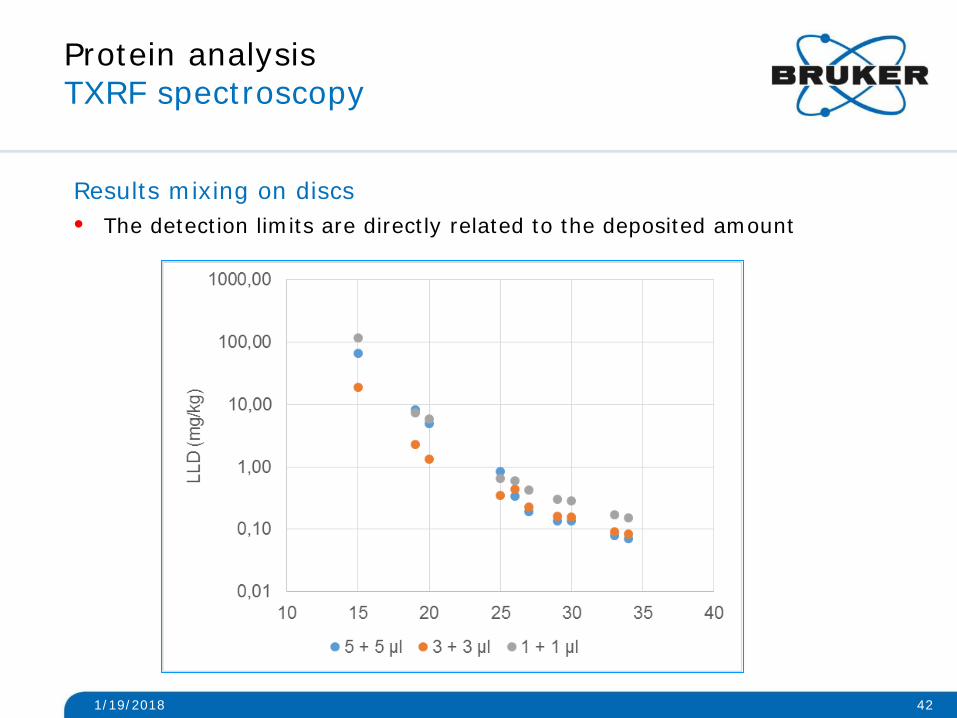
Results mixing on discs• The detection limits are directly related to the deposited amount
Bioassay analysisIntroduction
Saving lifes…?Not directly theirs…
1/19/2018 43
Bioassay analysisIntroduction
Saving lifes…?But theirs…
1/19/2018 44
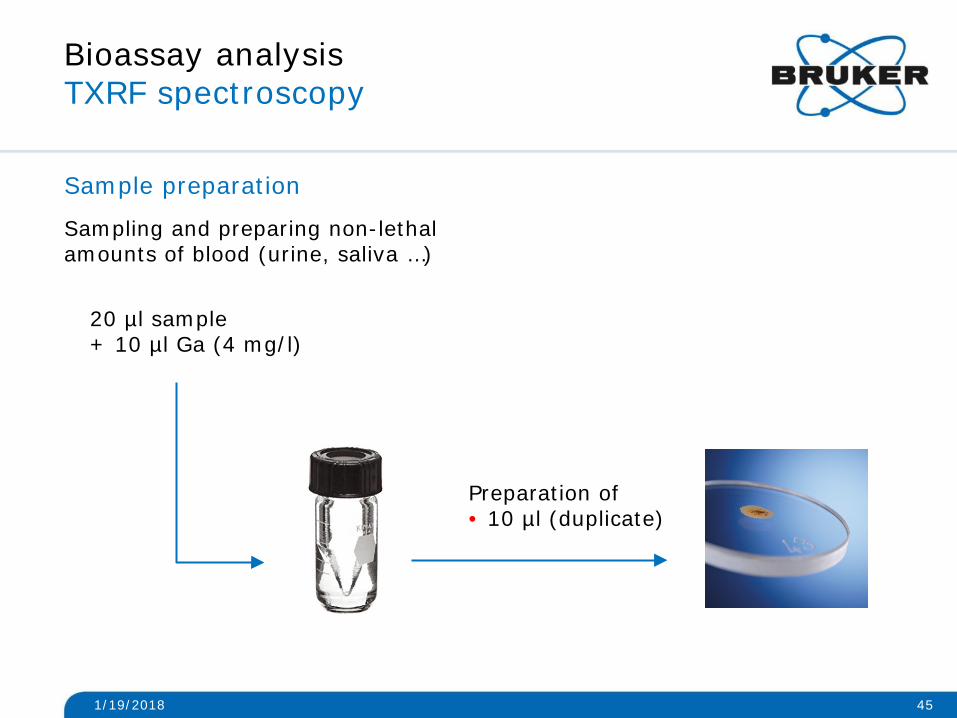
Bioassay analysisTXRF spectroscopy
Sample preparation
Sampling and preparing non-lethal amounts of blood (urine, saliva …)
1/19/2018 45
20 µl sample+ 10 µl Ga (4 mg/l)
Preparation of• 10 µl (duplicate)

Bioassay analysisTXRF spectroscopy
Results• Seronorm human serum CRM, S2 PICOFOX
1/19/2018 46
1
10
100
1000
10000
P S Cl K Ca Fe Cu Zn Se Br Ba
Con
cent
ratio
n (µ
g/l)
TXRF Reference
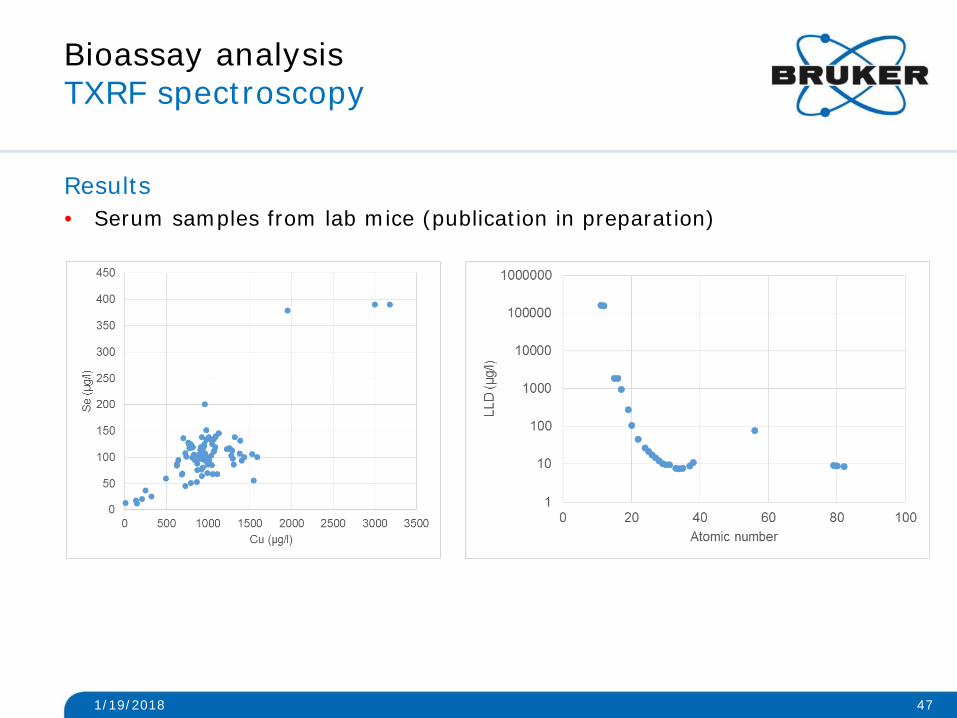
Bioassay analysisTXRF spectroscopy
Results• Serum samples from lab mice (publication in preparation)
1/19/2018 47
Summary and Outlook
The analysis of minute protein or serumsamples by means of TXRF is possible
• Mixing of internal standard and sample in a vial is recommended
• Determination of detection limits for traceelements requires careful consideration of thesample amount
1/19/2018 48
Outlook
• Intensive analysis of bioassays is ongoing
• Measurements with W-Brems excitation(S4 TSTAR) to detect elements like Mo, I
• Method development for light elements withoptimized calibration factors

1/19/2018 49
Q & A
Any Questions?
Please type in the questions you may have for our speakers in the Questions Box and click Submit

Innovation with Integrity
Copyright © 2018 Bruker Corporation. All rights reserved. www.bruker.com 50
Thank you for your attention!www.bruker.com / www.s4tstar.com