Embed Size (px)
Citation preview

Type 1 and Type 2 Diabetesin Children and Youth:
What’s New and What’s TrueFrancine Ratner Kaufman, MD, FAAPDistinguished Professor Emerita of Pediatrics and Communications, The Keck School of Medicine of the University of Southern CaliforniaCenter for Diabetes and Endocrinology, Childrens Hospital Los AngelesChief Medical Officer of Medtronic DiabetesLos Angeles, CA
Prepared for your next patient.
I am the Chief Medical Officer for Medtronic Diabetes.
Disclaimer
Disclaimers continued
• Statements and opinions expressed are those of the authors and not necessarily those of the American Academy of Pediatrics.
• Mead Johnson sponsors programs such as this to give healthcare professionals access to scientific and educational information provided by experts. The presenter has complete and independent control over the planning and content of the presentation, and is not receiving any compensation from Mead Johnson for this presentation. The presenter’s comments and opinions are not necessarily those of Mead Johnson. In the event that the presentation contains statements about uses of drugs that are not within the drugs' approved indications, Mead Johnson does not promote the use of any drug for indications outside the FDA-approved product label.
Outline of Presentation1. Presentation, Diagnostic Criteria, Screening
2. Rates, Causes – Genes/Environment
3. Treatment
4. Co-morbidities and Complications
5. Prevention
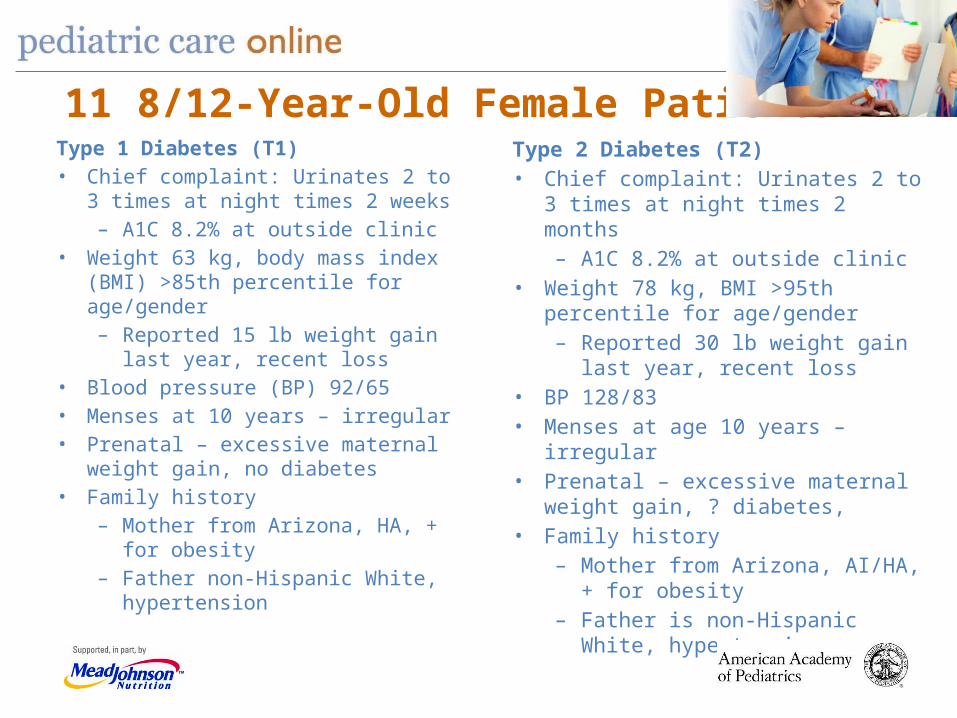
11 8/12-Year-Old Female PatientsType 2 Diabetes (T2)• Chief complaint: Urinates 2 to 3 times
at night times 2 months– A1C 8.2% at outside clinic
• Weight 78 kg, BMI >95th percentile for age/gender – Reported 30 lb weight gain last
year, recent loss• BP 128/83• Menses at age 10 years – irregular• Prenatal – excessive maternal weight
gain, ? diabetes, • Family history
– Mother from Arizona, AI/HA, + for obesity
– Father is non-Hispanic White, hypertension
Type 1 Diabetes (T1)• Chief complaint: Urinates 2 to 3 times
at night times 2 weeks– A1C 8.2% at outside clinic
• Weight 63 kg, body mass index (BMI) >85th percentile for age/gender– Reported 15 lb weight gain last
year, recent loss • Blood pressure (BP) 92/65• Menses at 10 years – irregular• Prenatal – excessive maternal weight
gain, no diabetes• Family history
– Mother from Arizona, HA, + for obesity
– Father non-Hispanic White, hypertension
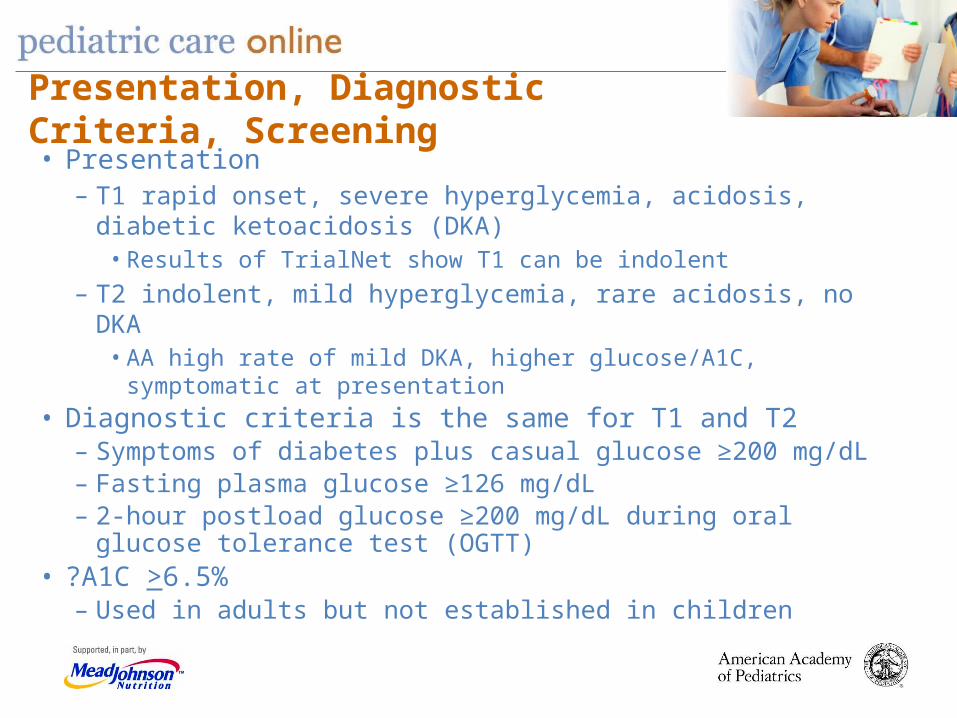
• Presentation– T1 rapid onset, severe hyperglycemia, acidosis, diabetic
ketoacidosis (DKA)• Results of TrialNet show T1 can be indolent
– T2 indolent, mild hyperglycemia, rare acidosis, no DKA• AA high rate of mild DKA, higher glucose/A1C, symptomatic at
presentation• Diagnostic criteria is the same for T1 and T2
– Symptoms of diabetes plus casual glucose ≥200 mg/dL – Fasting plasma glucose ≥126 mg/dL – 2-hour postload glucose ≥200 mg/dL during oral glucose tolerance
test (OGTT) • ?A1C >6.5%
– Used in adults but not established in children
Presentation, Diagnostic Criteria, Screening
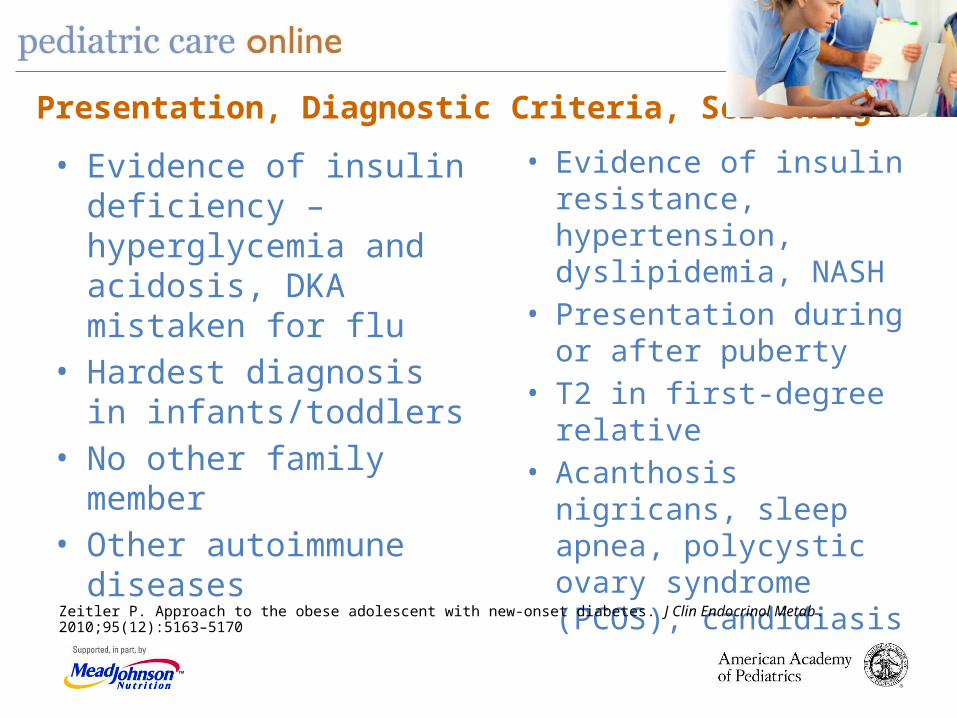
Presentation, Diagnostic Criteria, Screening • Evidence of insulin
resistance, hypertension, dyslipidemia, NASH
• Presentation during or after puberty
• T2 in first-degree relative• Acanthosis nigricans,
sleep apnea, polycystic ovary syndrome (PCOS), candidiasis
• Evidence of insulin deficiency – hyperglycemia and acidosis, DKA mistaken for flu
• Hardest diagnosis in infants/toddlers
• No other family member• Other autoimmune
diseases
Zeitler P. Approach to the obese adolescent with new-onset diabetes. J Clin Endocrinol Metab. 2010;95(12):5163–5170

Screening for T1
• In the context of research trials– TrialNet, Immune
Tolerance Network,TEDDY, etc.
• Screen with antibodies,? genes
• Reason– Prevention studies
• Oral insulin, omegas, vitamin D, anti-CD3
– Natural history study
Immune Tolerance Network
The reason to screen and intervene early in T1D:
• Common, serious in terms of morbidity and mortality
• Latency period without symptoms
• Screening test with sensitivity and specificity
• Intervention early is more effective, preservesC-peptide
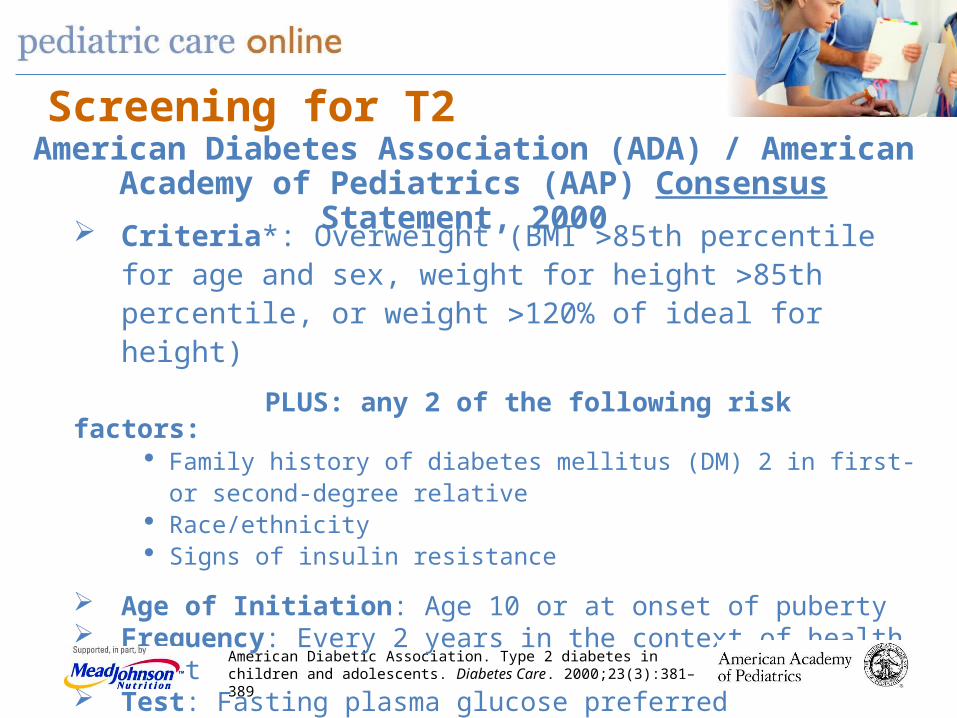
American Diabetic Association. Type 2 diabetes in children and adolescents. Diabetes Care. 2000;23(3):381–389
Criteria*: Overweight (BMI 85th percentile for age and sex, weight for height 85th percentile, or weight 120% of ideal for height)
PLUS: any 2 of the following risk factors:· Family history of diabetes mellitus (DM) 2 in first- or second-degree relative· Race/ethnicity · Signs of insulin resistance
Age of Initiation: Age 10 or at onset of puberty Frequency: Every 2 years in the context of health visit Test: Fasting plasma glucose preferred
* Clinical judgment should be used.
Screening for T2American Diabetes Association (ADA) / American Academy of
Pediatrics (AAP) Consensus Statement, 2000
Screening for T2
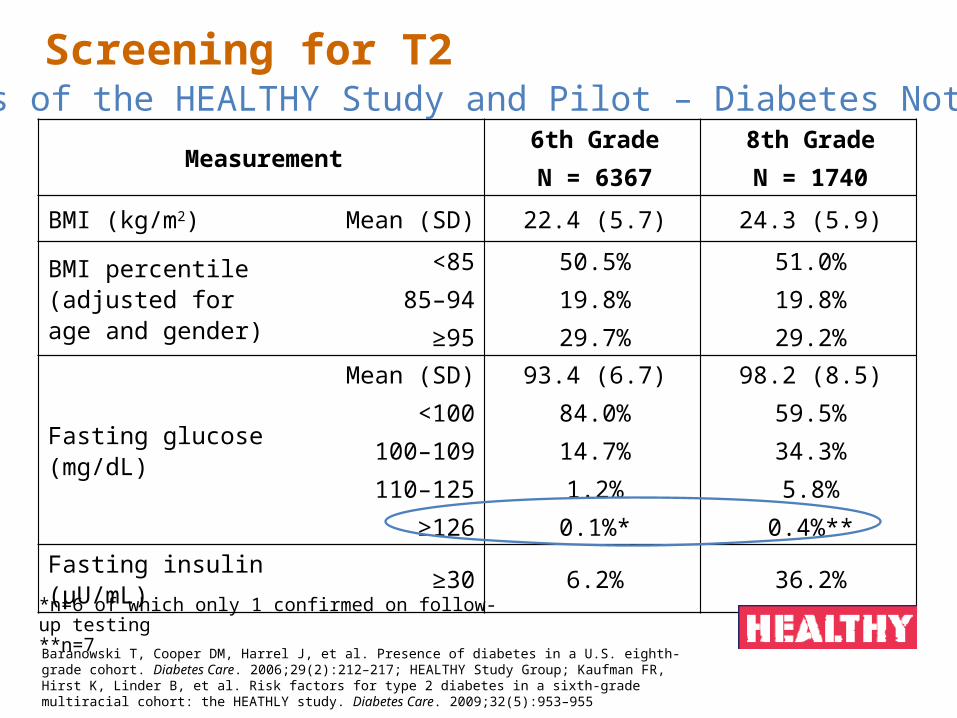
Measurement6th GradeN = 6367
8th GradeN = 1740
BMI (kg/m2) Mean (SD) 22.4 (5.7) 24.3 (5.9)
BMI percentile (adjusted for age and gender)
<8585–94
≥95
50.5%19.8%29.7%
51.0%19.8%29.2%
Fasting glucose (mg/dL)
Mean (SD)<100
100–109110–125
≥126
93.4 (6.7)84.0%14.7%1.2%
0.1%*
98.2 (8.5)59.5%34.3%5.8%
0.4%**
Fasting insulin (µU/mL) ≥30 6.2% 36.2%
Results of the HEALTHY Study and Pilot – Diabetes Not Found
Baranowski T, Cooper DM, Harrel J, et al. Presence of diabetes in a U.S. eighth-grade cohort. Diabetes Care. 2006;29(2):212–217; HEALTHY Study Group; Kaufman FR, Hirst K, Linder B, et al. Risk factors for type 2 diabetes in a sixth-grade multiracial cohort: the HEATHLY study. Diabetes Care. 2009;32(5):953–955
*n=6 of which only 1 confirmed on follow-up testing**n=7
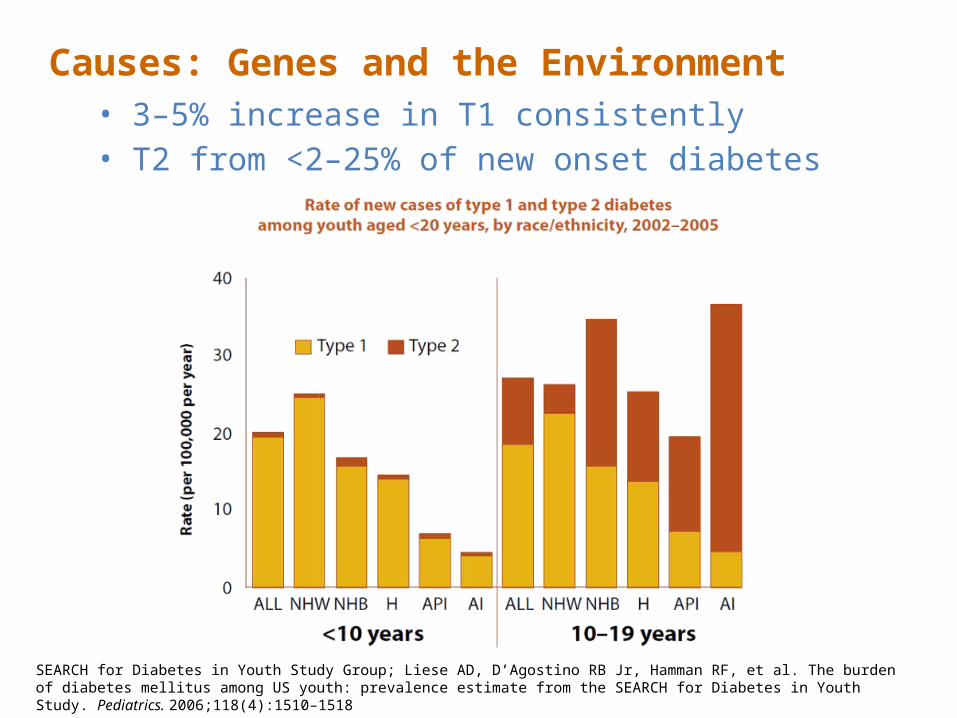
Causes: Genes and the Environment• 3–5% increase in T1 consistently• T2 from <2–25% of new onset diabetes
SEARCH for Diabetes in Youth Study Group; Liese AD, D’Agostino RB Jr, Hamman RF, et al. The burden of diabetes mellitus among US youth: prevalence estimate from the SEARCH for Diabetes in Youth Study. Pediatrics. 2006;118(4):1510–1518
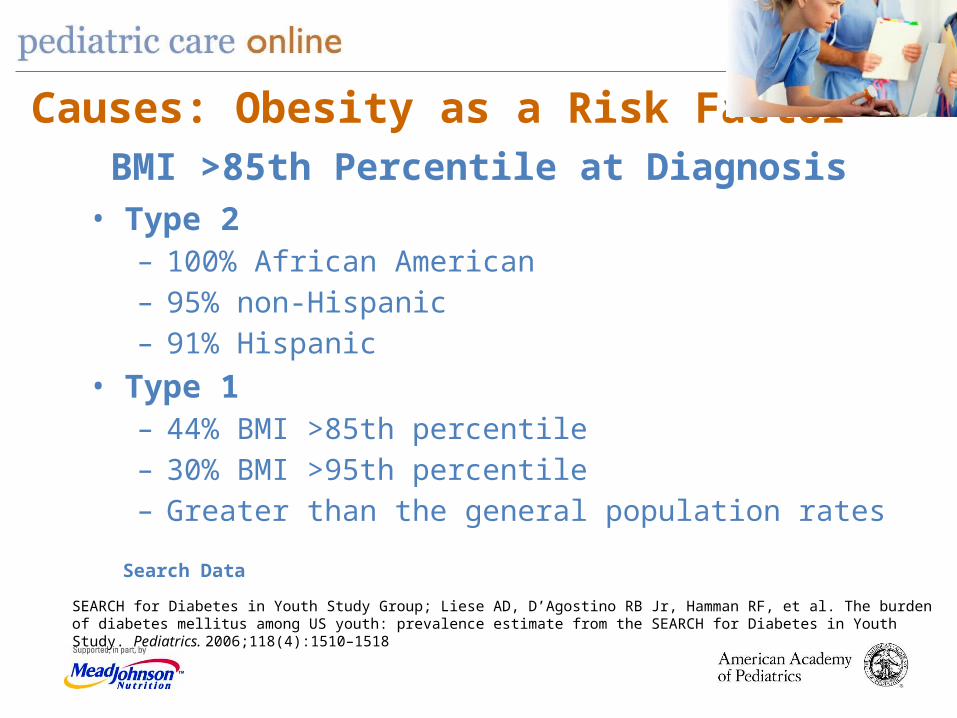
Causes: Obesity as a Risk Factor
• Type 2 – 100% African American– 95% non-Hispanic – 91% Hispanic
• Type 1 – 44% BMI >85th percentile – 30% BMI >95th percentile– Greater than the general population rates
Search Data
BMI >85th Percentile at Diagnosis
SEARCH for Diabetes in Youth Study Group; Liese AD, D’Agostino RB Jr, Hamman RF, et al. The burden of diabetes mellitus among US youth: prevalence estimate from the SEARCH for Diabetes in Youth Study. Pediatrics. 2006;118(4):1510–1518
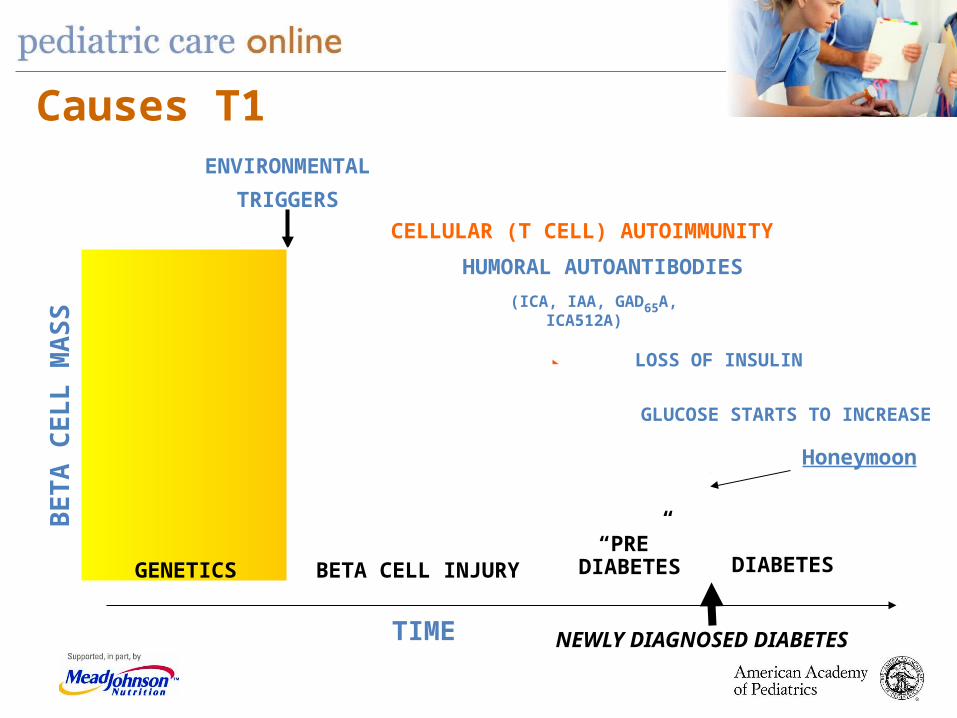
ENVIRONMENTAL
TRIGGERS
TIME
Causes T1B
ETA
CELL M
ASS
GENETICS BETA CELL INJURY DIABETES
“PRE” DIABETE
S
NEWLY DIAGNOSED DIABETES
HUMORAL AUTOANTIBODIES
CELLULAR (T CELL) AUTOIMMUNITY
LOSS OF INSULIN
GLUCOSE STARTS TO INCREASE
(ICA, IAA, GAD65A, ICA512A)
Honeymoon
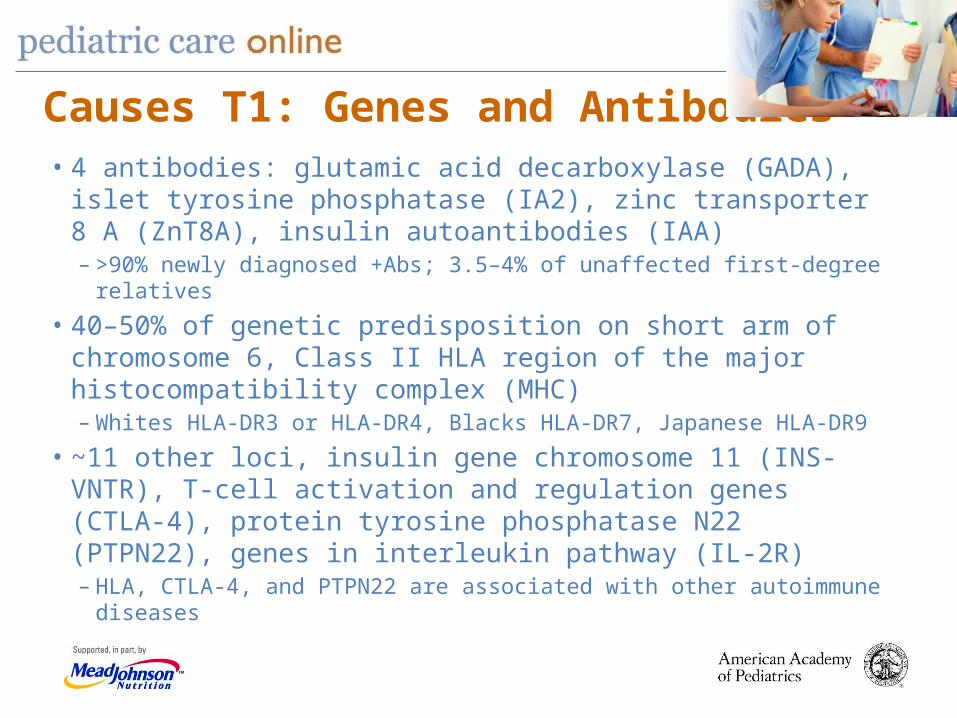
Causes T1: Genes and Antibodies• 4 antibodies: glutamic acid decarboxylase (GADA), islet
tyrosine phosphatase (IA2), zinc transporter 8 A (ZnT8A), insulin autoantibodies (IAA)– >90% newly diagnosed +Abs; 3.5–4% of unaffected first-degree
relatives • 40–50% of genetic predisposition on short arm of
chromosome 6, Class II HLA region of the major histocompatibility complex (MHC) – Whites HLA-DR3 or HLA-DR4, Blacks HLA-DR7, Japanese HLA-DR9
• ~11 other loci, insulin gene chromosome 11 (INS-VNTR), T-cell activation and regulation genes (CTLA-4), protein tyrosine phosphatase N22 (PTPN22), genes in interleukin pathway (IL-2R) – HLA, CTLA-4, and PTPN22 are associated with other autoimmune
diseases
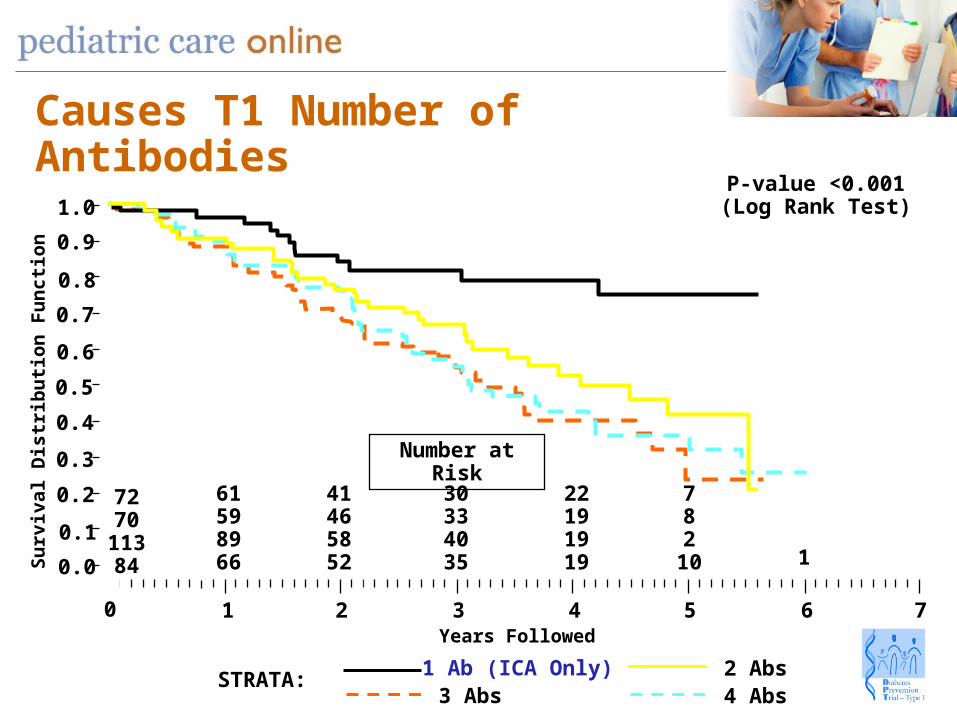
Causes T1 Number of Antibodies
1.0
0.9
0.8
0.7
0.6
0.5
0.4
0.3
0.2
0.1
0.0
7270
11384
61598966
41465852
30334035
22191919
782
10 1
Number at Risk
Su
rviv
al D
istr
ibu
tion
Fu
ncti
on
P-value <0.001(Log Rank Test)
0 1 2 3 4 5 6 7
STRATA: 1 Ab (ICA Only) 2 Abs3 Abs 4 Abs
Years Followed
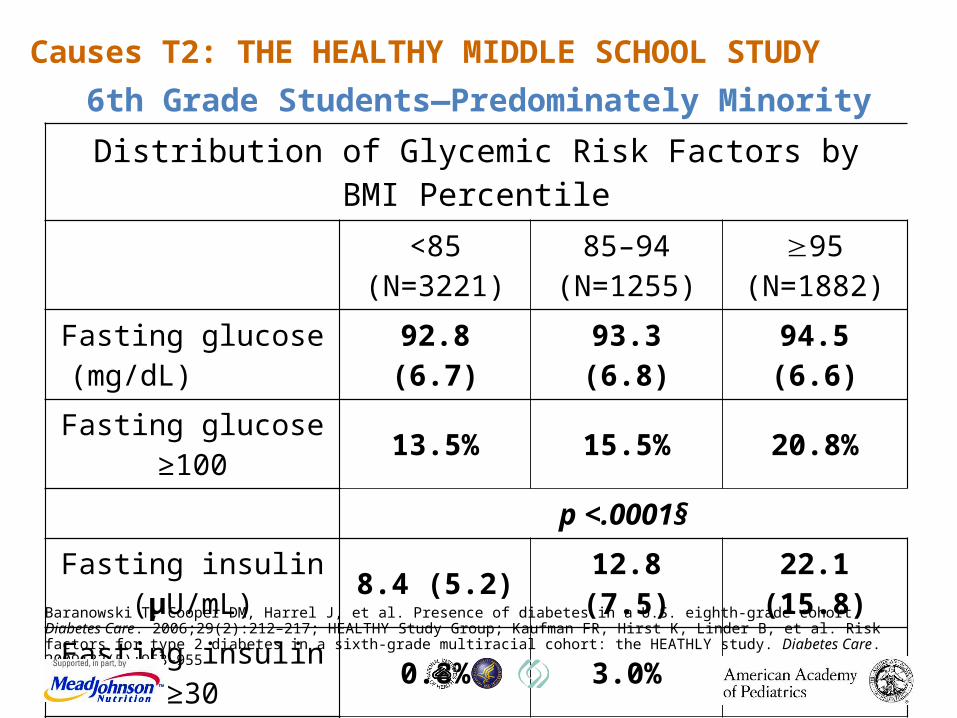
Causes T2: THE HEALTHY MIDDLE SCHOOL STUDY
Distribution of Glycemic Risk Factors by BMI Percentile<85
(N=3221)85–94
(N=1255)95
(N=1882)
Fasting glucose (mg/dL) 92.8 (6.7) 93.3 (6.8) 94.5 (6.6)
Fasting glucose ≥100 13.5% 15.5% 20.8%
p <.0001§
Fasting insulin (μU/mL) 8.4 (5.2) 12.8 (7.5) 22.1 (15.8)
Fasting insulin ≥30 0.8% 3.0% 19.6%
p <.0001§
6th Grade Students—Predominately Minority
Baranowski T, Cooper DM, Harrel J, et al. Presence of diabetes in a U.S. eighth-grade cohort. Diabetes Care. 2006;29(2):212–217; HEALTHY Study Group; Kaufman FR, Hirst K, Linder B, et al. Risk factors for type 2 diabetes in a sixth-grade multiracial cohort: the HEATHLY study. Diabetes Care. 2009;32(5):953–955
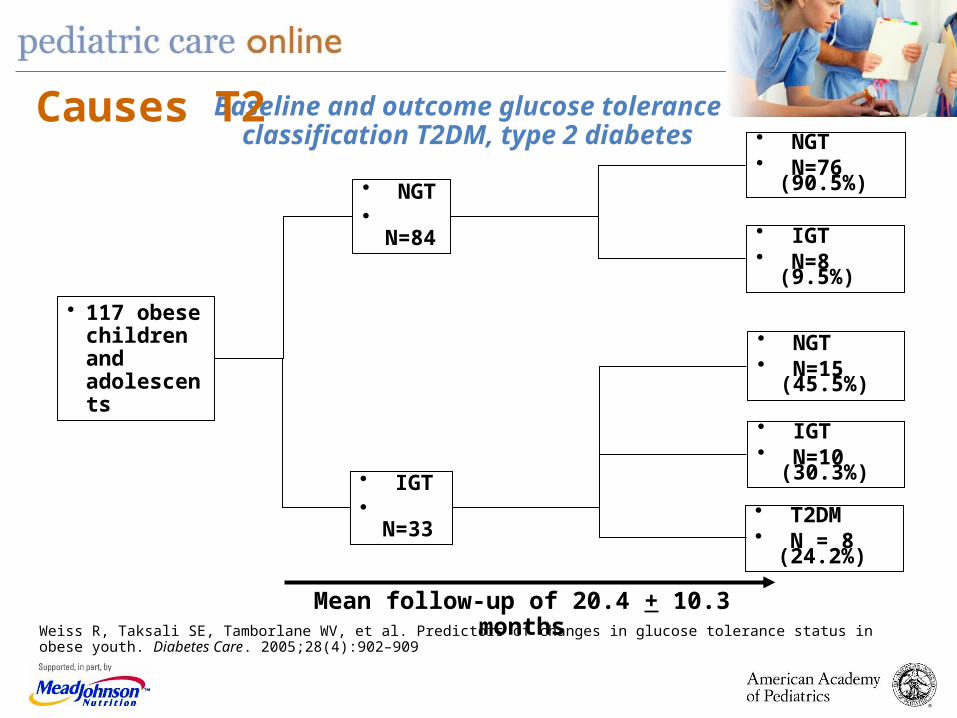
Weiss R, Taksali SE, Tamborlane WV, et al. Predictors of changes in glucose tolerance status in obese youth. Diabetes Care. 2005;28(4):902–909
• 117 obese children and adolescents
• NGT• N=84
• IGT• N=33
• NGT• N=76
(90.5%)
• IGT• N=8 (9.5%)
• NGT• N=15
(45.5%)
• IGT• N=10
(30.3%)
• T2DM• N = 8
(24.2%)
Mean follow-up of 20.4 + 10.3 months
Baseline and outcome glucose tolerance classification T2DM, type 2 diabetes
Causes T2

IGT to NGT IGT to T2D
BMI 33 versus 44
BMI z-score 2.27 versus 2.76
Weight Δ kg 6.1 versus 27
BMI Δ 1.06 versus 6.8
Causes T2Comparison of Subjects with Impaired Glucose Tolerance (IGT) Who Developed
Type 2 Diabetes and Who Reverted to Normal Glucose Tolerance (NGT)
Weiss R, Taksali SE, Tamborlane WV, et al. Predictors of changes in glucose tolerance status in obese youth. Diabetes Care. 2005;28(4):902–909
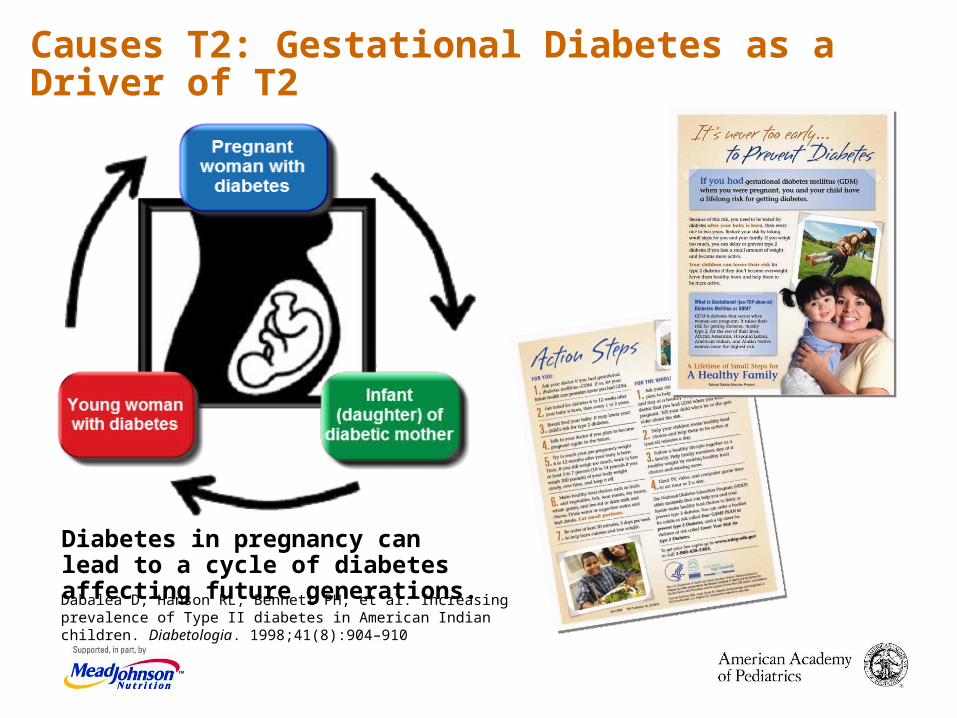
Dabalea D, Hanson RL, Bennett PH, et al. Increasing prevalence of Type II diabetes in American Indian children. Diabetologia. 1998;41(8):904–910
Diabetes in pregnancy can lead to a cycle of diabetes affecting future generations.
Causes T2: Gestational Diabetes as a Driver of T2
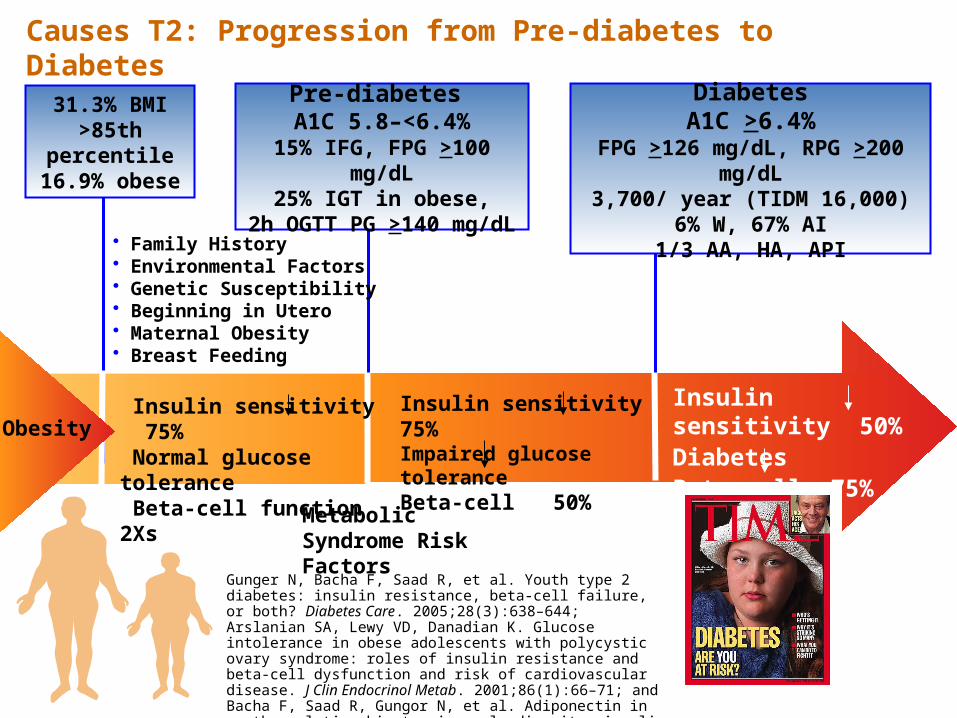
Causes T2: Progression from Pre-diabetes to Diabetes Pre-diabetes A1C 5.8–<6.4%
15% IFG, FPG >100 mg/dL25% IGT in obese,
2h OGTT PG >140 mg/dL
DiabetesA1C >6.4%
FPG >126 mg/dL, RPG >200 mg/dL3,700/ year (TIDM 16,000)
6% W, 67% AI1/3 AA, HA, API
Metabolic Syndrome Risk Factors
31.3% BMI>85th percentile
16.9% obese
Insulin sensitivity 75%Impaired glucose toleranceBeta-cell 50%
Insulin sensitivity 50%DiabetesBeta-cell 75%
Gunger N, Bacha F, Saad R, et al. Youth type 2 diabetes: insulin resistance, beta-cell failure, or both? Diabetes Care. 2005;28(3):638–644; Arslanian SA, Lewy VD, Danadian K. Glucose intolerance in obese adolescents with polycystic ovary syndrome: roles of insulin resistance and beta-cell dysfunction and risk of cardiovascular disease. J Clin Endocrinol Metab. 2001;86(1):66–71; and Bacha F, Saad R, Gungor N, et al. Adiponectin in youth: relationship to visceral adiposity, insulin sensitivity, and beta-cell function. Diabetes Care. 2004;27(2):547–552
• Family History • Environmental Factors • Genetic Susceptibility• Beginning in Utero• Maternal Obesity• Breast Feeding
Obesity Insulin sensitivity 75% Normal glucose tolerance Beta-cell function 2Xs
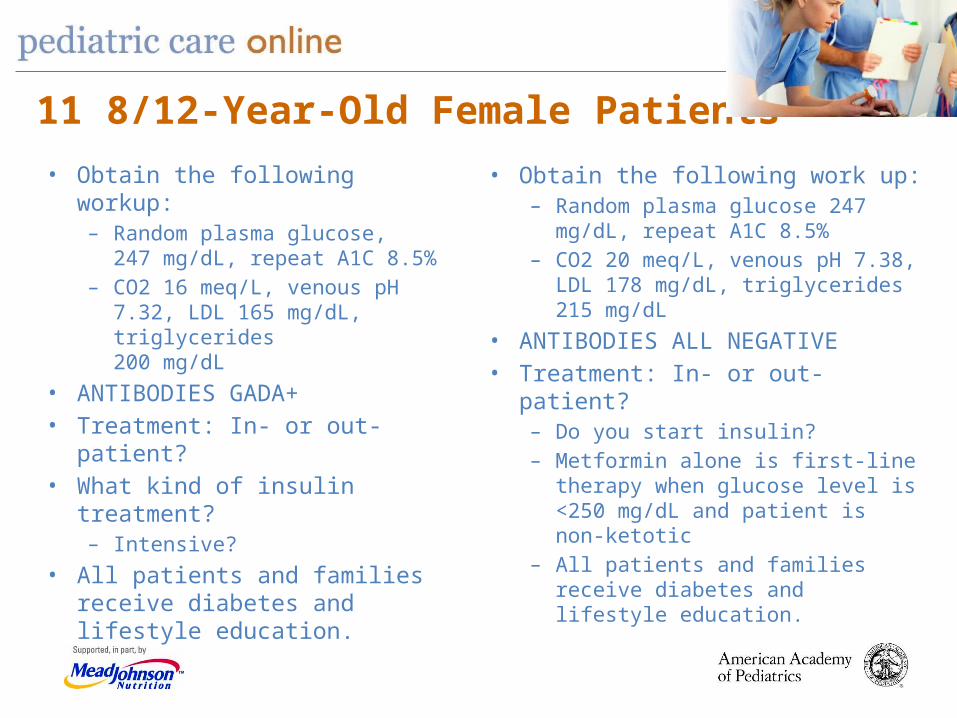
11 8/12-Year-Old Female Patients• Obtain the following work up:
– Random plasma glucose 247 mg/dL, repeat A1C 8.5%
– CO2 20 meq/L, venous pH 7.38, LDL 178 mg/dL, triglycerides 215 mg/dL
• ANTIBODIES ALL NEGATIVE• Treatment: In- or out-patient?
– Do you start insulin?– Metformin alone is first-line therapy
when glucose level is <250 mg/dL and patient is non-ketotic
– All patients and families receive diabetes and lifestyle education.
• Obtain the following workup:– Random plasma glucose,
247 mg/dL, repeat A1C 8.5%– CO2 16 meq/L, venous pH 7.32,
LDL 165 mg/dL, triglycerides200 mg/dL
• ANTIBODIES GADA+• Treatment: In- or out-patient?• What kind of insulin treatment?
– Intensive?• All patients and families receive
diabetes and lifestyle education.
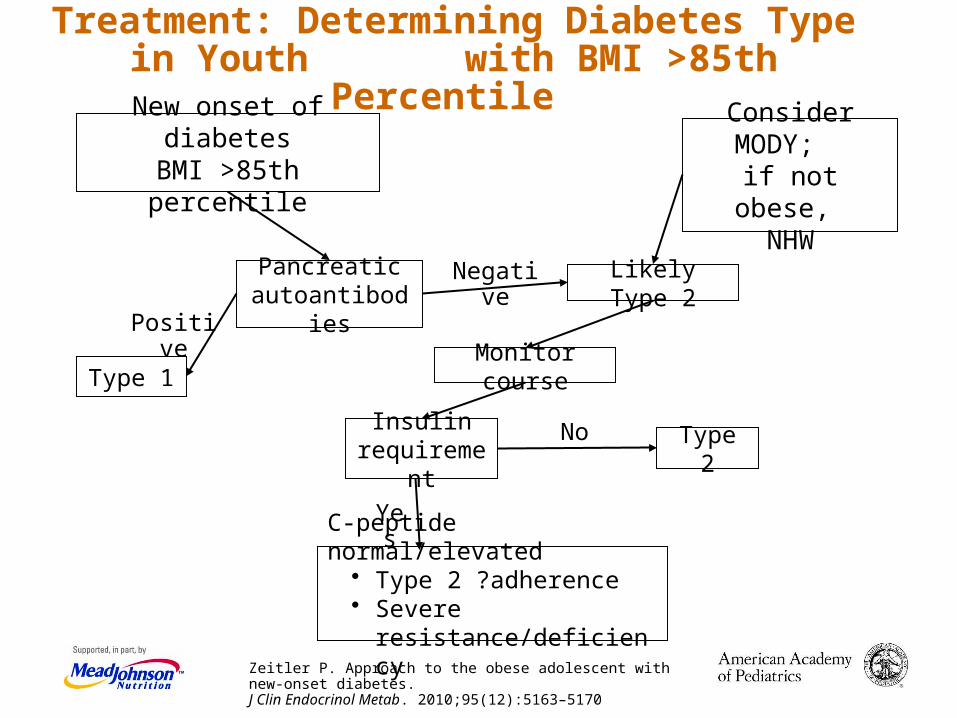
New onset of diabetesBMI >85th percentile
Pancreaticautoantibodies
Type 1
Insulinrequirement
Consider MODY; if not obese,
NHW
Likely Type 2
Monitor course
Type 2
C-peptide normal/elevated• Type 2 ?adherence• Severe resistance/deficiency
Positive
Negative
No
Yes
Zeitler P. Approach to the obese adolescent with new-onset diabetes.J Clin Endocrinol Metab. 2010;95(12):5163–5170
Treatment: Determining Diabetes Type in Youth with BMI >85th Percentile
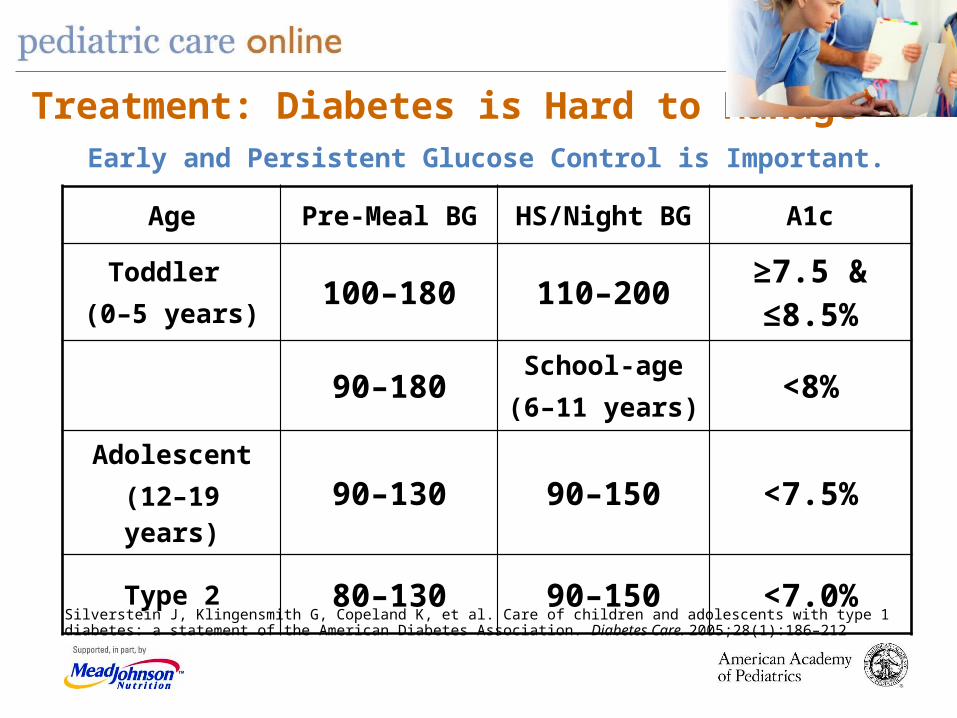
Treatment: Diabetes is Hard to Manage
Age Pre-Meal BG HS/Night BG A1c
Toddler (0–5 years) 100–180 110–200 ≥7.5 & ≤8.5%
90–180 School-age(6–11 years) <8%
Adolescent(12–19 years) 90–130 90–150 <7.5%
Type 2 80–130 90–150 <7.0%
Silverstein J, Klingensmith G, Copeland K, et al. Care of children and adolescents with type 1 diabetes: a statement of the American Diabetes Association. Diabetes Care. 2005;28(1):186–212
Early and Persistent Glucose Control is Important.
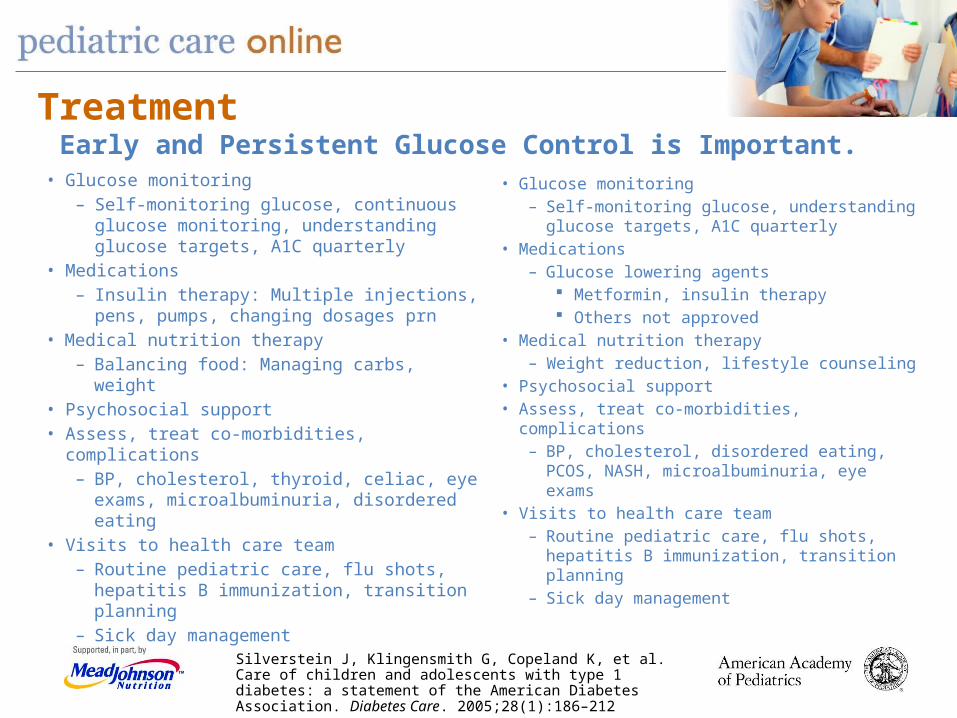
Treatment
• Glucose monitoring – Self-monitoring glucose, continuous
glucose monitoring, understanding glucose targets, A1C quarterly
• Medications – Insulin therapy: Multiple injections, pens,
pumps, changing dosages prn• Medical nutrition therapy
– Balancing food: Managing carbs, weight • Psychosocial support• Assess, treat co-morbidities, complications
– BP, cholesterol, thyroid, celiac, eye exams, microalbuminuria, disordered eating
• Visits to health care team– Routine pediatric care, flu shots, hepatitis
B immunization, transition planning– Sick day management
• Glucose monitoring – Self-monitoring glucose, understanding
glucose targets, A1C quarterly • Medications
– Glucose lowering agents Metformin, insulin therapy Others not approved
• Medical nutrition therapy– Weight reduction, lifestyle counseling
• Psychosocial support• Assess, treat co-morbidities, complications
– BP, cholesterol, disordered eating, PCOS, NASH, microalbuminuria, eye exams
• Visits to health care team– Routine pediatric care, flu shots, hepatitis
B immunization, transition planning– Sick day management
Silverstein J, Klingensmith G, Copeland K, et al. Care of children and adolescents with type 1 diabetes: a statement of the American Diabetes Association. Diabetes Care. 2005;28(1):186–212
Early and Persistent Glucose Control is Important.
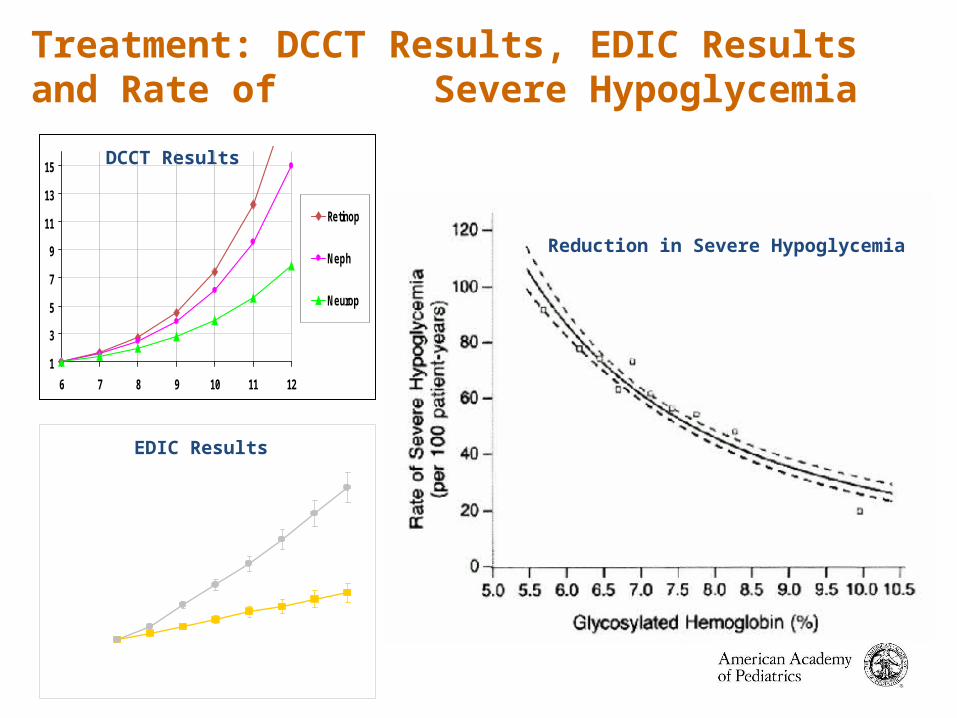
Treatment: DCCT Results, EDIC Results and Rate of Severe Hypoglycemia
0
0.1
0.2
0.3
0.4
0.5
0 1 2 3 4 5 6 7
Years in EDIC
1
3
5
7
9
11
13
15
6 7 8 9 10 11 12
Retinop
Neph
Neurop
DCCT Results
EDIC Results
Reduction in Severe Hypoglycemia
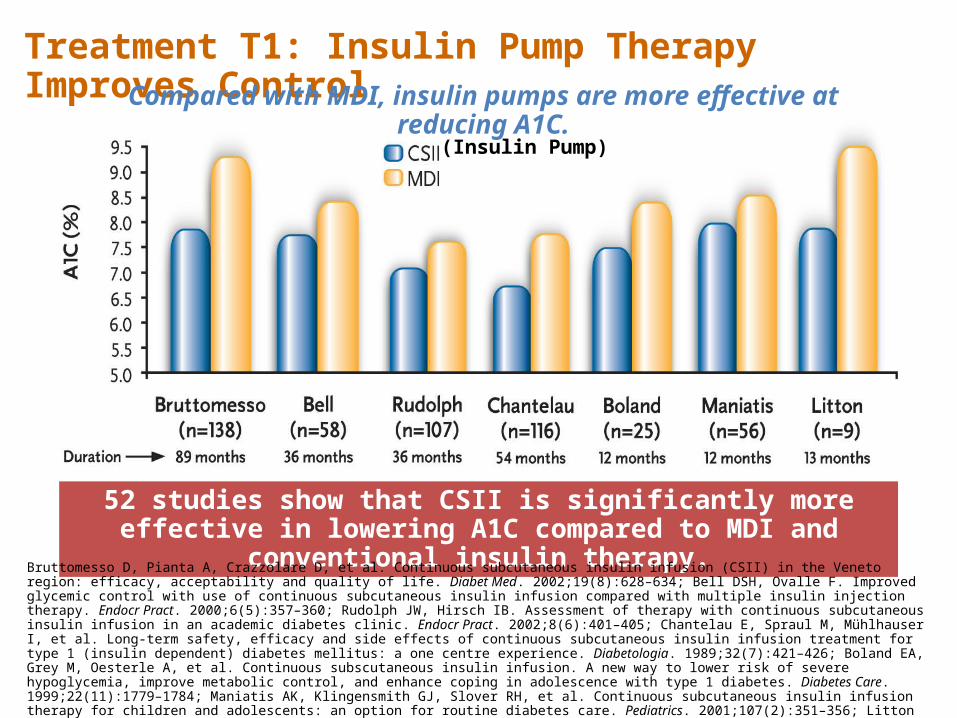
52 studies show that CSII is significantly more effective in lowering A1C compared to MDI and conventional insulin therapy.
Bruttomesso D, Pianta A, Crazzolare D, et al. Continuous subcutaneous insulin infusion (CSII) in the Veneto region: efficacy, acceptability and quality of life. Diabet Med. 2002;19(8):628–634; Bell DSH, Ovalle F. Improved glycemic control with use of continuous subcutaneous insulin infusion compared with multiple insulin injection therapy. Endocr Pract. 2000;6(5):357–360; Rudolph JW, Hirsch IB. Assessment of therapy with continuous subcutaneous insulin infusion in an academic diabetes clinic. Endocr Pract. 2002;8(6):401–405; Chantelau E, Spraul M, Mühlhauser I, et al. Long-term safety, efficacy and side effects of continuous subcutaneous insulin infusion treatment for type 1 (insulin dependent) diabetes mellitus: a one centre experience. Diabetologia. 1989;32(7):421–426; Boland EA, Grey M, Oesterle A, et al. Continuous subscutaneous insulin infusion. A new way to lower risk of severe hypoglycemia, improve metabolic control, and enhance coping in adolescence with type 1 diabetes. Diabetes Care. 1999;22(11):1779–1784; Maniatis AK, Klingensmith GJ, Slover RH, et al. Continuous subcutaneous insulin infusion therapy for children and adolescents: an option for routine diabetes care. Pediatrics. 2001;107(2):351–356; Litton J, Rice A, Friedman N, et al. Insulin pump therapy in toddlers and preschool children with type 1 diabetes mellitus. J Pediatr. 2002;141(4):490–495; and Weissberg-Benchell J, Lomaglio JA, Seshadri R. Insulin pump therapy: a meta-analysis. Diabetes Care. 2003;26(4):1079–1087
Treatment T1: Insulin Pump Therapy Improves Control
(Insulin Pump)
Compared with MDI, insulin pumps are more effective at reducing A1C.

Treatment T1: CSII Reduces Incidents of Severe Hypoglycemia
Rudolph JW, Hirsch IB. Assessment of therapy with continuous subcutaneous insulin infusion in an academic diabetes clinic. Endocr Pract. 2002;8(6):401–405; Bode BW, Steed RD, Davidson PC. Reduction in severe hypoglycemia with long-term continuous subcutaneous insulin infusion in type 1 diabetes. Diabetes Care. 1996;19(4):324–327; and Boland EA, Grey M, Oesterle A, et al. Continuous subscutaneous insulin infusion. A new way to lower risk of severe hypoglycemia, improve metabolic control, and enhance coping in adolescence with type 1 diabetes. Diabetes Care. 1999;22(11):1779–1784
Severe hypoglycemic episodes MDI vs CSII
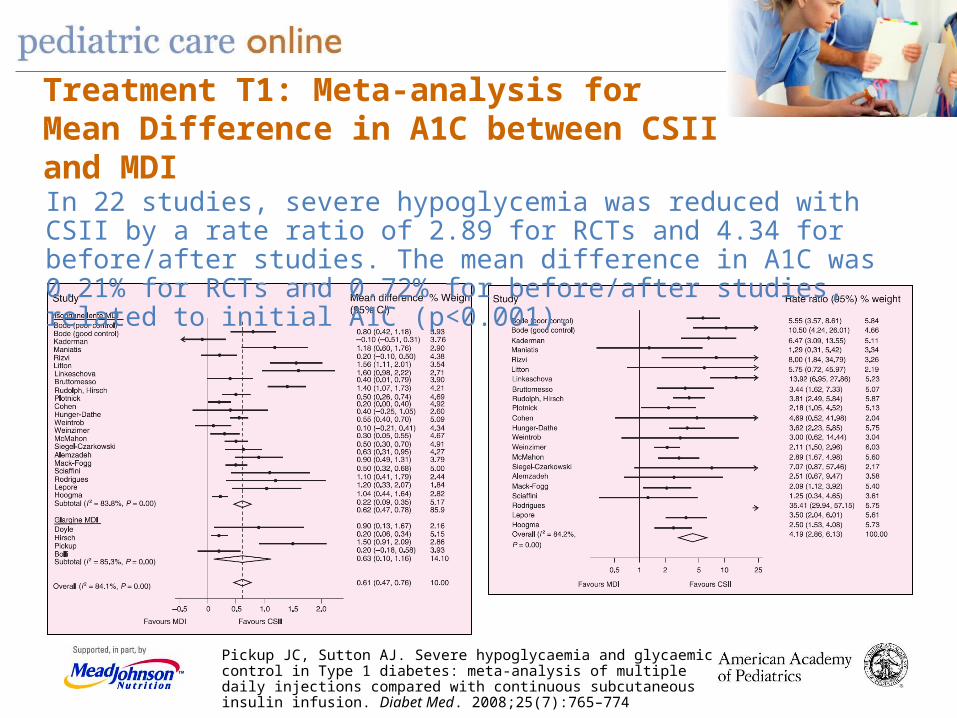
Treatment T1: Meta-analysis for Mean Difference in A1C between CSII and MDI
Pickup JC, Sutton AJ. Severe hypoglycaemia and glycaemic control in Type 1 diabetes: meta-analysis of multiple daily injections compared with continuous subcutaneous insulin infusion. Diabet Med. 2008;25(7):765–774
In 22 studies, severe hypoglycemia was reduced with CSII by a rate ratio of 2.89 for RCTs and 4.34 for before/after studies. The mean difference in A1C was 0.21% for RCTs and 0.72% for before/after studies, related to initial A1C (p<0.001).
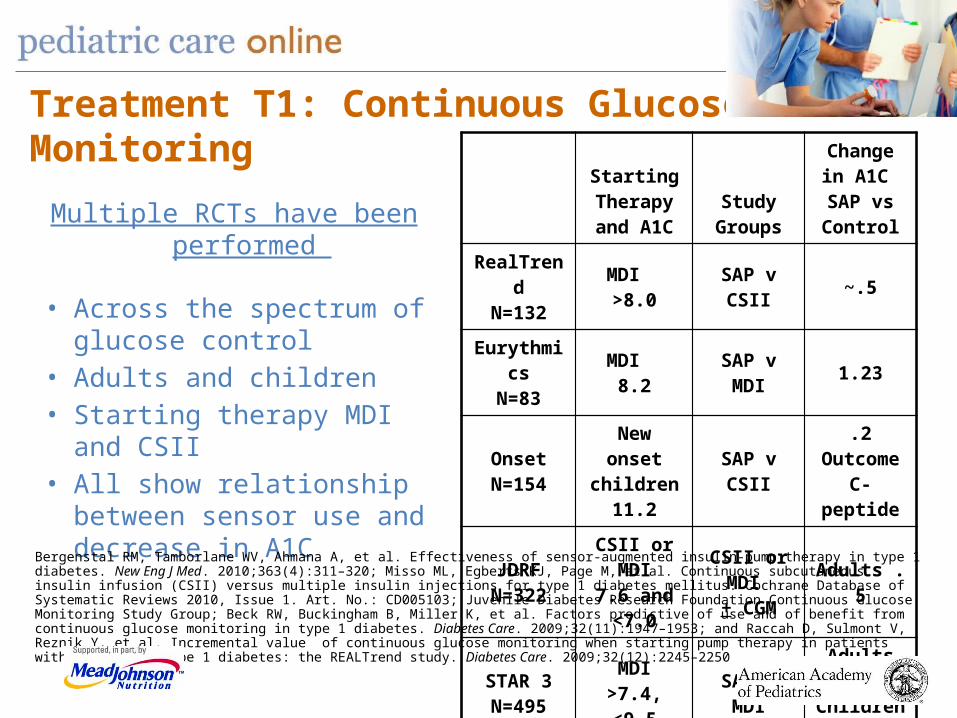
Treatment T1: Continuous GlucoseMonitoring
Multiple RCTs have been performed
• Across the spectrum of glucose control
• Adults and children• Starting therapy MDI and CSII• All show relationship between
sensor use and decrease in A1C
Starting Therapyand A1C
Study Groups
Change in A1C
SAP vs Control
RealTrendN=132
MDI >8.0 SAP v CSII ~.5
EurythmicsN=83
MDI 8.2 SAP v MDI 1.23
OnsetN=154
New onset children
11.2SAP v CSII
.2OutcomeC-peptide
JDRFN=322
CSII or MDI7.6 and <7.0
CSII or MDI + CGM Adults .5
STAR 3N=495
MDI>7.4, <9.5 SAP v MDI Adults and
Children .6
Bergenstal RM, Tamborlane WV, Ahmana A, et al. Effectiveness of sensor-augmented insulin-pump therapy in type 1 diabetes. New Eng J Med. 2010;363(4):311–320; Misso ML, Egberts KJ, Page M, et al. Continuous subcutaneous insulin infusion (CSII) versus multiple insulin injections for type 1 diabetes mellitus. Cochrane Database of Systematic Reviews 2010, Issue 1. Art. No.: CD005103; Juvenile Diabetes Research Foundation Continuous Glucose Monitoring Study Group; Beck RW, Buckingham B, Miller K, et al. Factors predictive of use and of benefit from continuous glucose monitoring in type 1 diabetes. Diabetes Care. 2009;32(11):1947–1953; and Raccah D, Sulmont V, Reznik Y, et al. Incremental value of continuous glucose monitoring when starting pump therapy in patients with controlled type 1 diabetes: the REALTrend study. Diabetes Care. 2009;32(12):2245–2250

Treatment T1: Glycemic Control During Real-time CGMMeta-analysis of Randomized Controlled Trials Using Individual Patient Data
Pickup JC, Freeman SC, Sutton AJ. Glycemic control in type 1 diabetes during real time continuous glucose monitoring compared with self monitoring of blood glucose: meta analysis of randomized controlled trials using individual patient data. BMJ. 2011;343:d3805
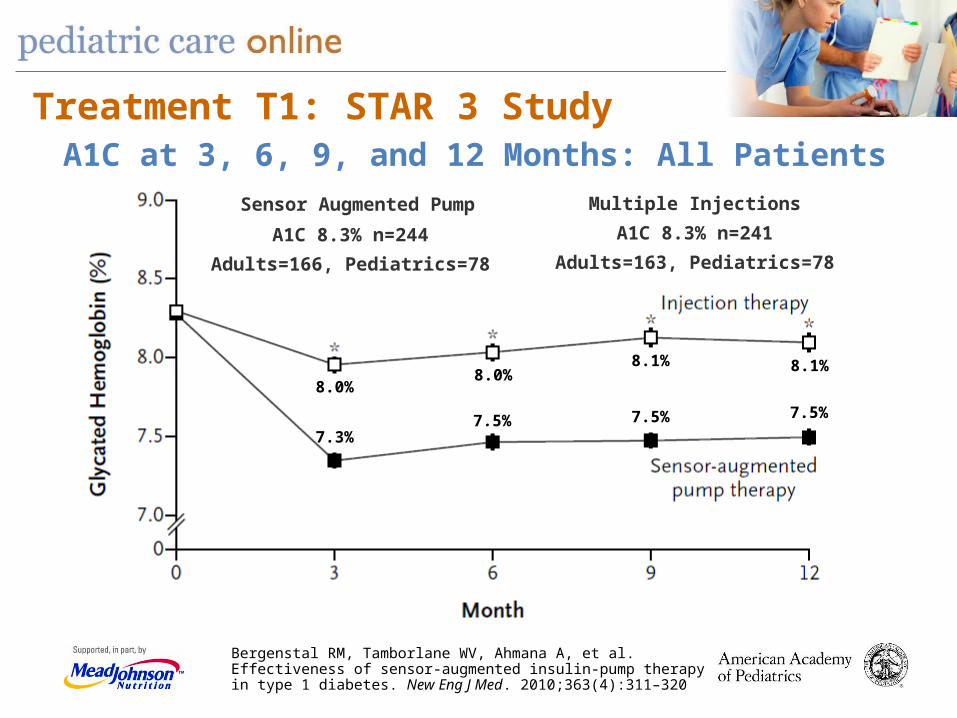
Treatment T1: STAR 3 Study
7.3%7.5% 7.5% 7.5%
8.0%8.0%
8.1% 8.1%
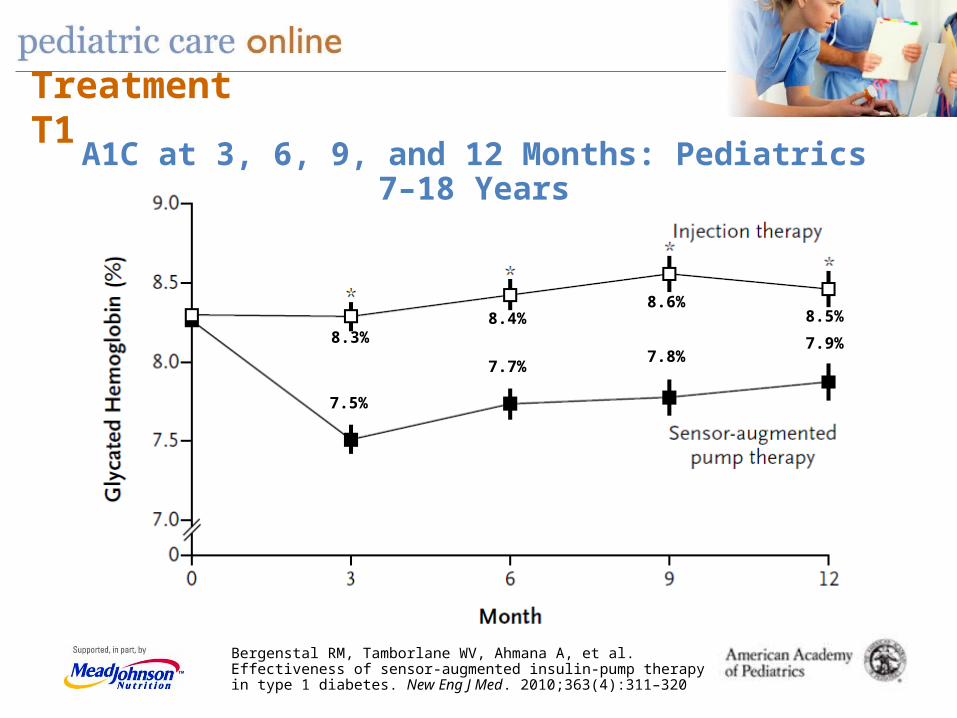
Bergenstal RM, Tamborlane WV, Ahmana A, et al. Effectiveness of sensor-augmented insulin-pump therapy in type 1 diabetes. New Eng J Med. 2010;363(4):311–320
Sensor Augmented Pump
A1C 8.3% n=244
Adults=166, Pediatrics=78
Multiple Injections
A1C 8.3% n=241
Adults=163, Pediatrics=78
A1C at 3, 6, 9, and 12 Months: All Patients
Treatment T1
7.5%
7.7%7.8%
7.9%8.3%8.4%
8.6%8.5%
A1C at 3, 6, 9, and 12 Months: Pediatrics 7–18 Years
Bergenstal RM, Tamborlane WV, Ahmana A, et al. Effectiveness of sensor-augmented insulin-pump therapy in type 1 diabetes. New Eng J Med. 2010;363(4):311–320

-0.19
-0.64-0.79
-1.21-1.5
-1
-0.5
0
21-40% 41-60% 61-80% 81-100%Frequency of Sensor Use (% of Time)
Chan
ge in
A1C
at 1
Yea
r vs
Base
line
n=27 n=46 n=108 n=56
Treatment T1
The majority of patients used sensors >60% of the time.
SAP Groupn=247
MDI Groupn=248
PValue
Severe HypoglycemiaRate per 100 person-years
13.31 13.4 0.84
Diabetic Ketoacidosis Number of events(# pts)
3 (3) 2 (1) 0.38
Weight Change +2.4 kg +1.8 kg 0.19
Severe hypoglycemia rate low and at lower A1C, little DKA
A1C Reduction is Correlated with Increased Sensor Usebut Not an Increase in Hypoglycemia or DKA
Bergenstal RM, Tamborlane WV, Ahmana A, et al. Effectiveness of sensor-augmented insulin-pump therapy in type 1 diabetes. New Eng J Med. 2010;363(4):311–320
Treatment T1
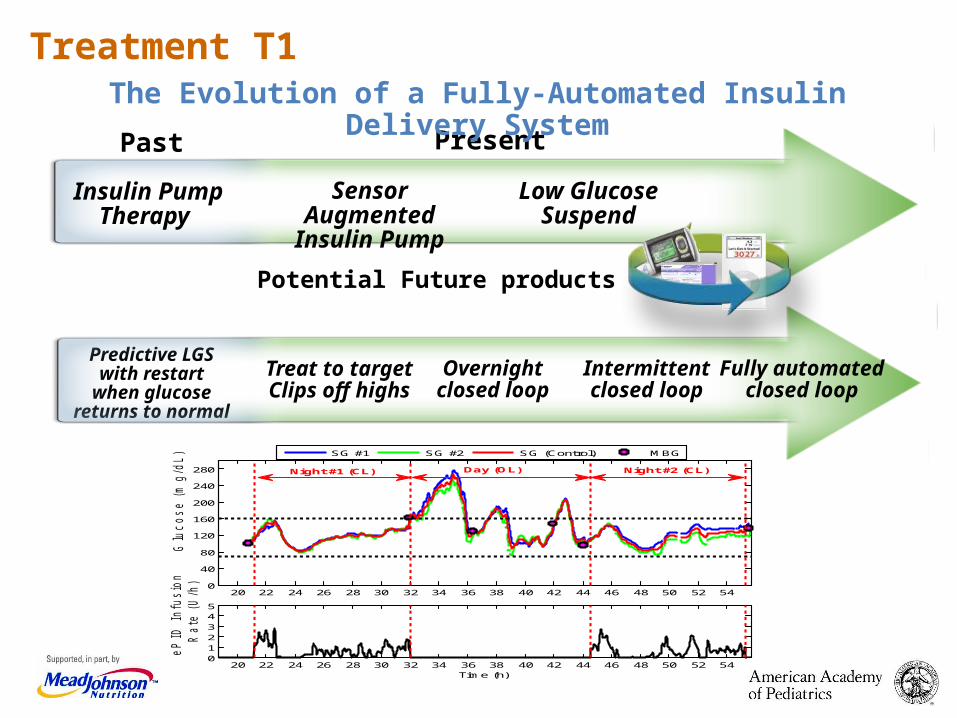
Sensor AugmentedInsulin Pump
Insulin Pump Therapy
Predictive LGS with restart when glucose returns
to normal
Present
Low Glucose Suspend
Past
Treat to targetClips off highs
Overnightclosed loop
Fully automated closed loop
Intermittent closed loop
Potential Future products
20 22 24 26 28 30 32 34 36 38 40 42 44 46 48 50 52 540
40
80
120
160
200
240
280
Glu
cose (
mg/d
L)
SG #1 SG #2 SG (Control) MBG
20 22 24 26 28 30 32 34 36 38 40 42 44 46 48 50 52 54012345
eP
ID I
nfu
sio
n
Rate
(U
/h)
Time (h)
Night #2 (CL)Night #1 (CL) Day (OL)
The Evolution of a Fully-Automated Insulin Delivery System
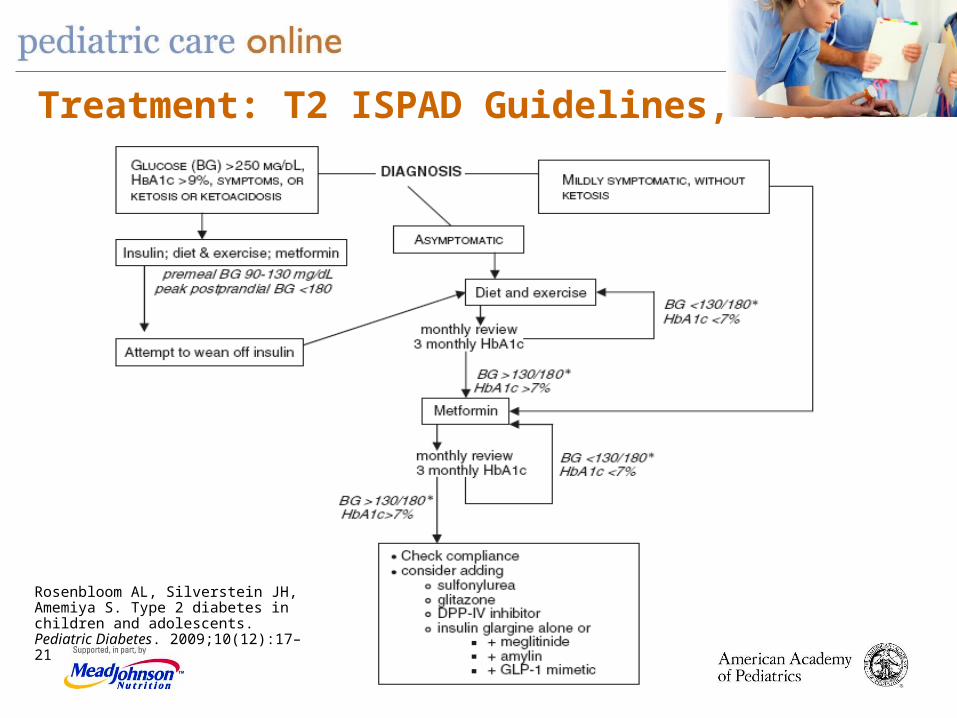
Rosenbloom AL, Silverstein JH, Amemiya S. Type 2 diabetes in children and adolescents. Pediatric Diabetes. 2009;10(12):17–21
Treatment: T2 ISPAD Guidelines, 2009
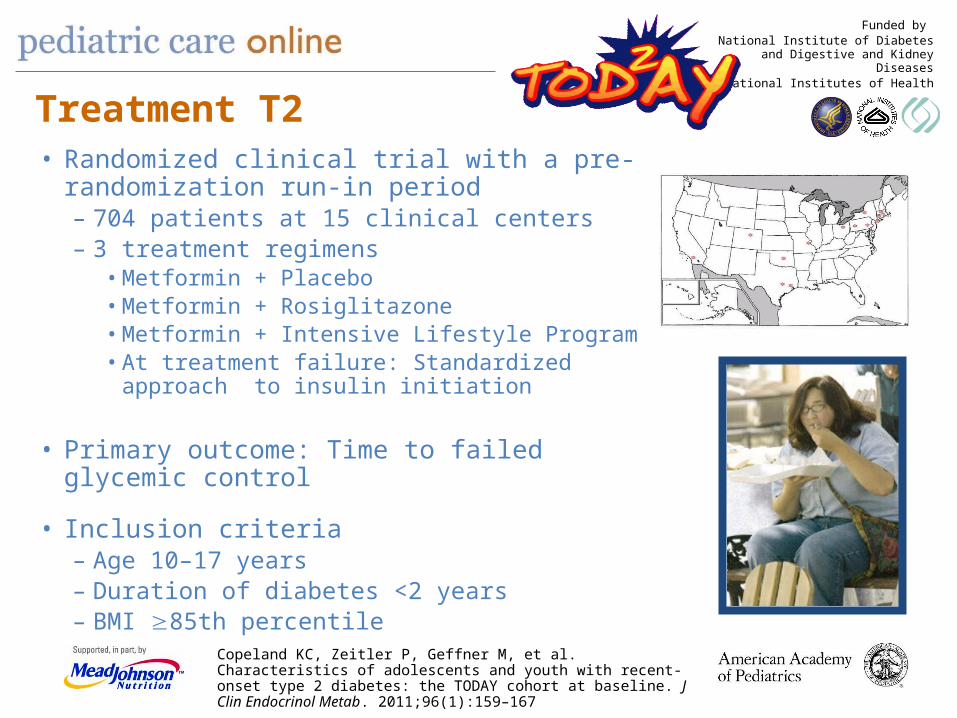
• Randomized clinical trial with a pre-randomization run-in period– 704 patients at 15 clinical centers– 3 treatment regimens
• Metformin + Placebo • Metformin + Rosiglitazone• Metformin + Intensive Lifestyle Program• At treatment failure: Standardized approach to
insulin initiation
• Primary outcome: Time to failed glycemic control
• Inclusion criteria– Age 10–17 years– Duration of diabetes <2 years– BMI 85th percentile
Funded by National Institute of Diabetes and
Digestive and Kidney DiseasesNational Institutes of Health
Copeland KC, Zeitler P, Geffner M, et al. Characteristics of adolescents and youth with recent-onset type 2 diabetes: the TODAY cohort at baseline. J Clin Endocrinol Metab. 2011;96(1):159–167
Treatment T2
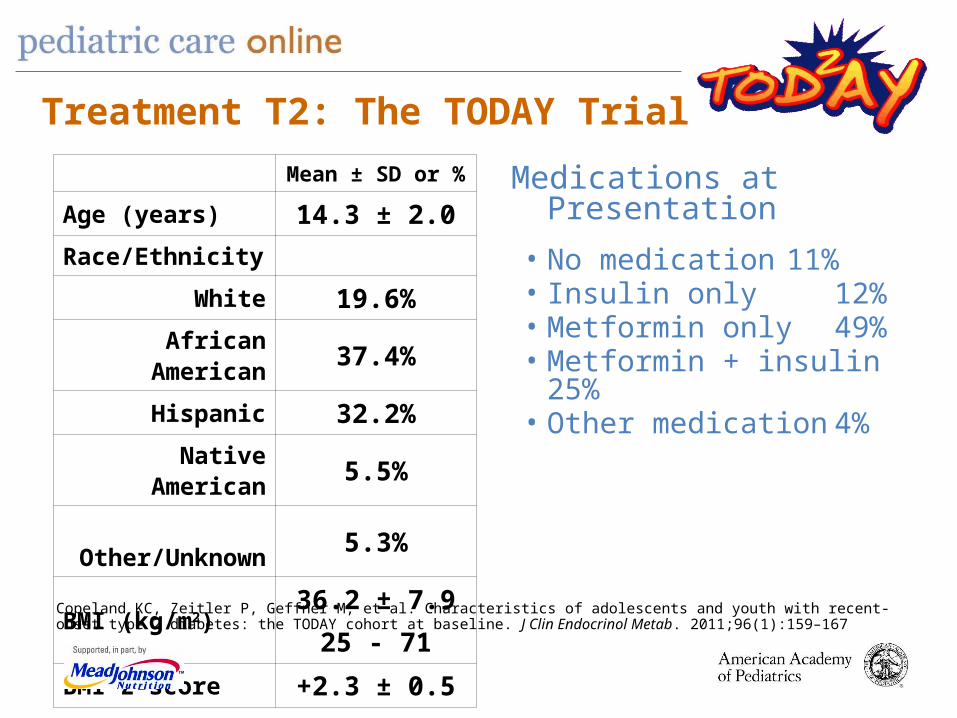
Medications at Presentation• No medication 11%• Insulin only 12%• Metformin only 49%• Metformin + insulin 25%• Other medication 4%
Mean ± SD or %
Age (years) 14.3 ± 2.0Race/Ethnicity
White 19.6% African American 37.4%
Hispanic 32.2% Native American 5.5%
Other/Unknown 5.3%
BMI (kg/m2)36.2 ± 7.9
25 - 71BMI Z-score +2.3 ± 0.5
Treatment T2: The TODAY Trial
Copeland KC, Zeitler P, Geffner M, et al. Characteristics of adolescents and youth with recent-onset type 2 diabetes: the TODAY cohort at baseline. J Clin Endocrinol Metab. 2011;96(1):159–167
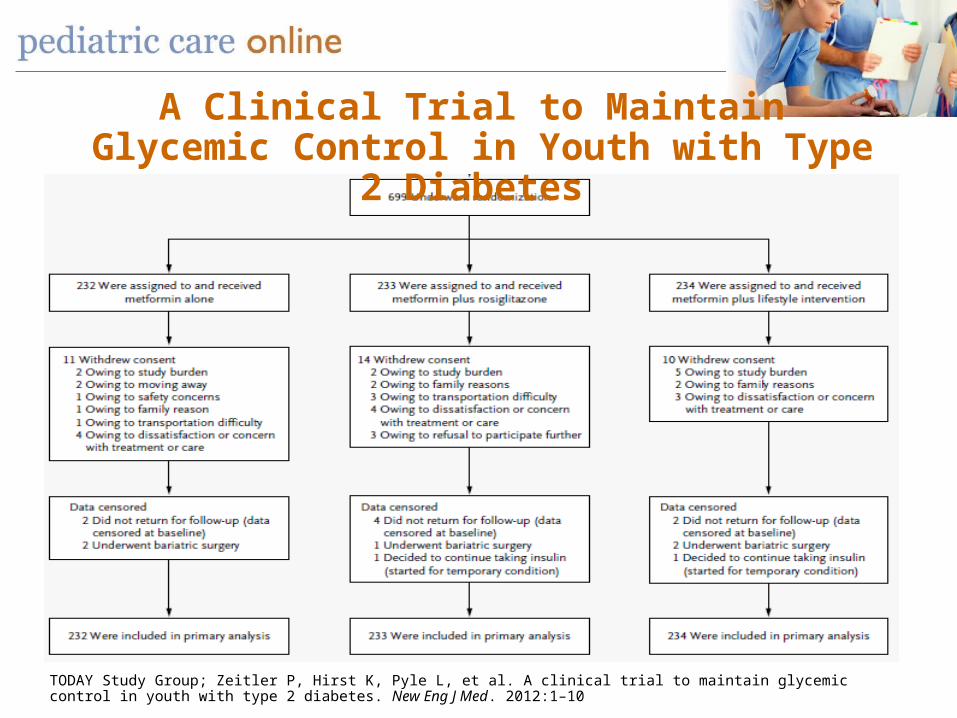
A Clinical Trial to Maintain Glycemic Control in Youth with Type 2 Diabetes
TODAY Study Group; Zeitler P, Hirst K, Pyle L, et al. A clinical trial to maintain glycemic control in youth with type 2 diabetes. New Eng J Med. 2012:1–10
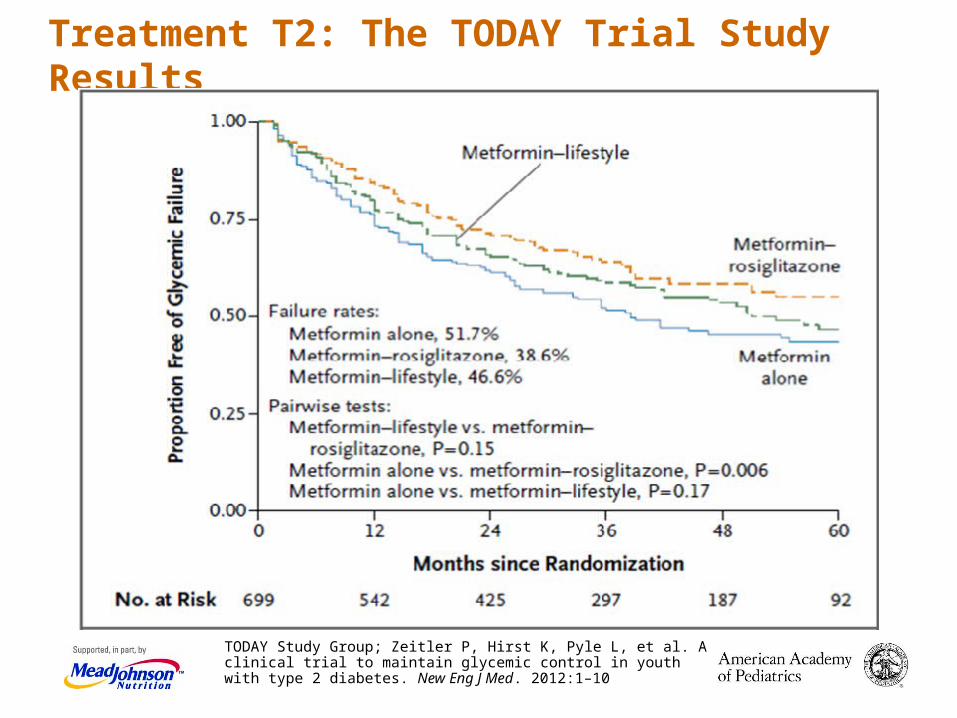
Treatment T2: The TODAY Trial Study Results
TODAY Study Group; Zeitler P, Hirst K, Pyle L, et al. A clinical trial to maintain glycemic control in youth with type 2 diabetes. New Eng J Med. 2012:1–10
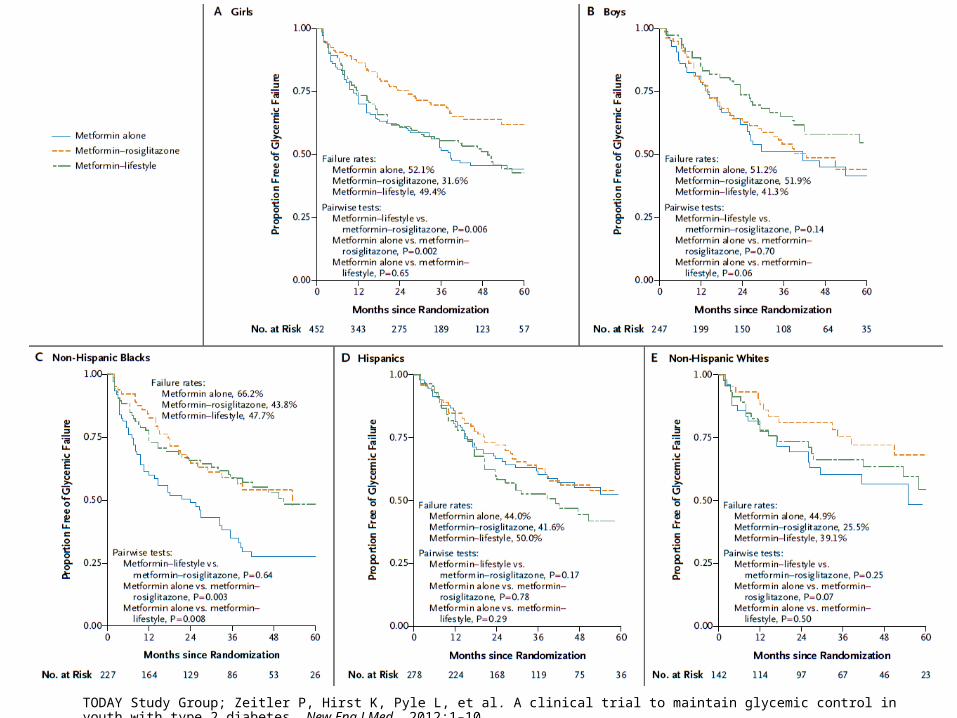
TODAY Study Group; Zeitler P, Hirst K, Pyle L, et al. A clinical trial to maintain glycemic control in youth with type 2 diabetes. New Eng J Med. 2012:1–10

Treatment: Lifestyle Tips for Teens with Diabetes Series from National Diabetes Education Program
0
10
20
30
40
50
60
70
80
90
100
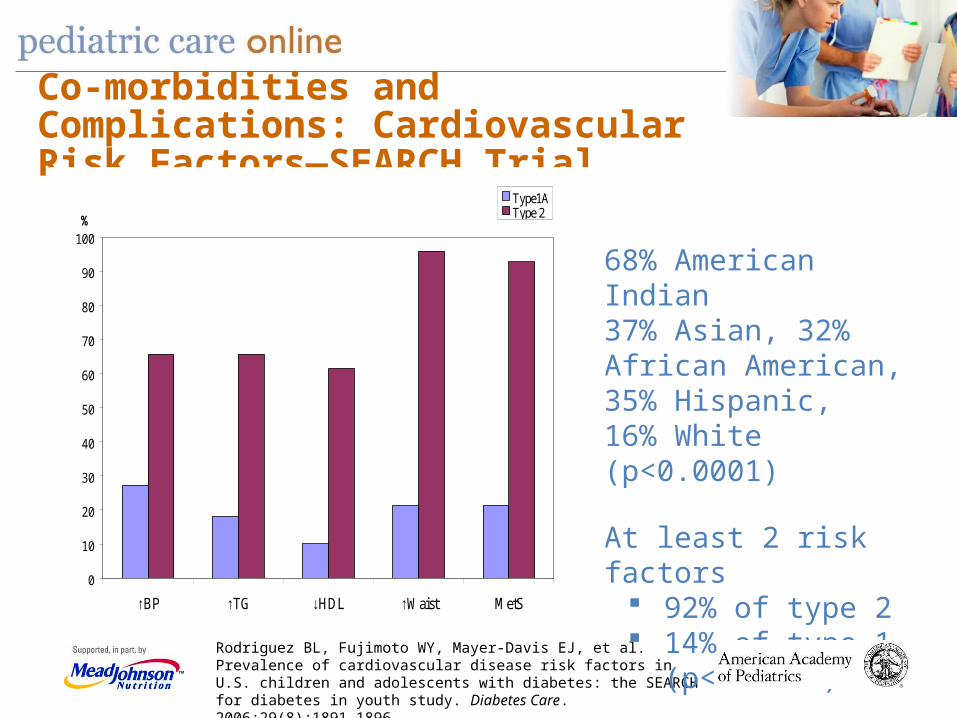
↑BP ↑TG ↓HDL ↑Waist MetS
%
Type1AType 2MetS: >2 cardiovascular disease (CVD) risk factors
Rodriguez BL, Fujimoto WY, Mayer-Davis EJ, et al. Prevalence of cardiovascular disease risk factors in U.S. children and adolescents with diabetes: the SEARCH for diabetes in youth study. Diabetes Care. 2006;29(8);1891–1896
• 68% American Indian37% Asian, 32% African American, 35% Hispanic,16% White (p<0.0001)
• At least 2 risk factors 92% of type 2 14% of type 1
(p<0.0001)
Co-morbidities and Complications: Cardiovascular Risk Factors—SEARCH Trial
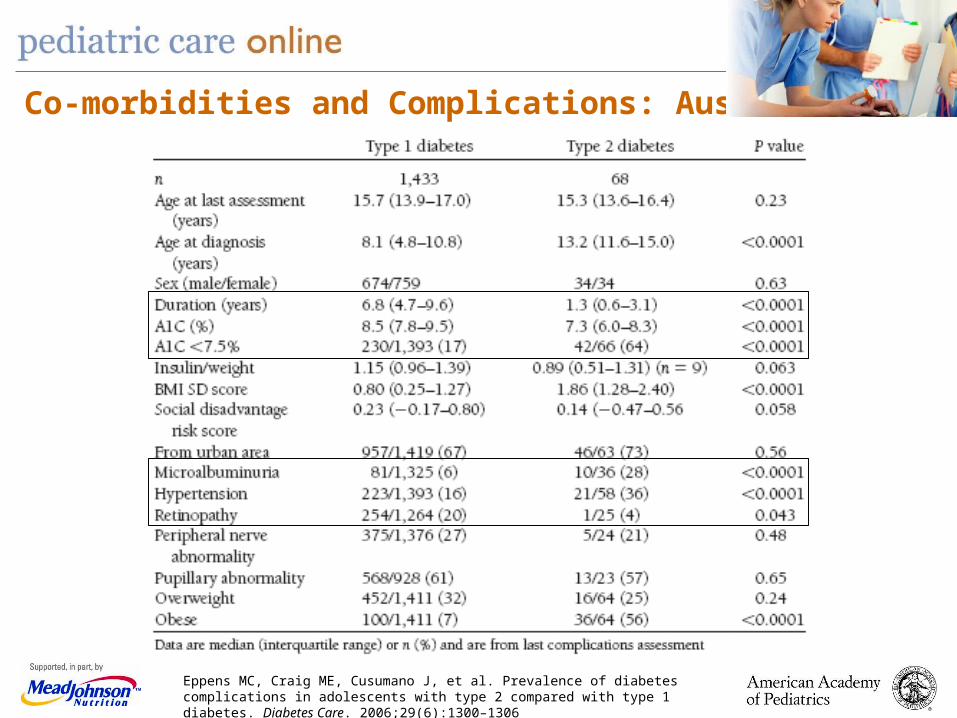
Co-morbidities and Complications: Australia
Eppens MC, Craig ME, Cusumano J, et al. Prevalence of diabetes complications in adolescents with type 2 compared with type 1 diabetes. Diabetes Care. 2006;29(6):1300–1306
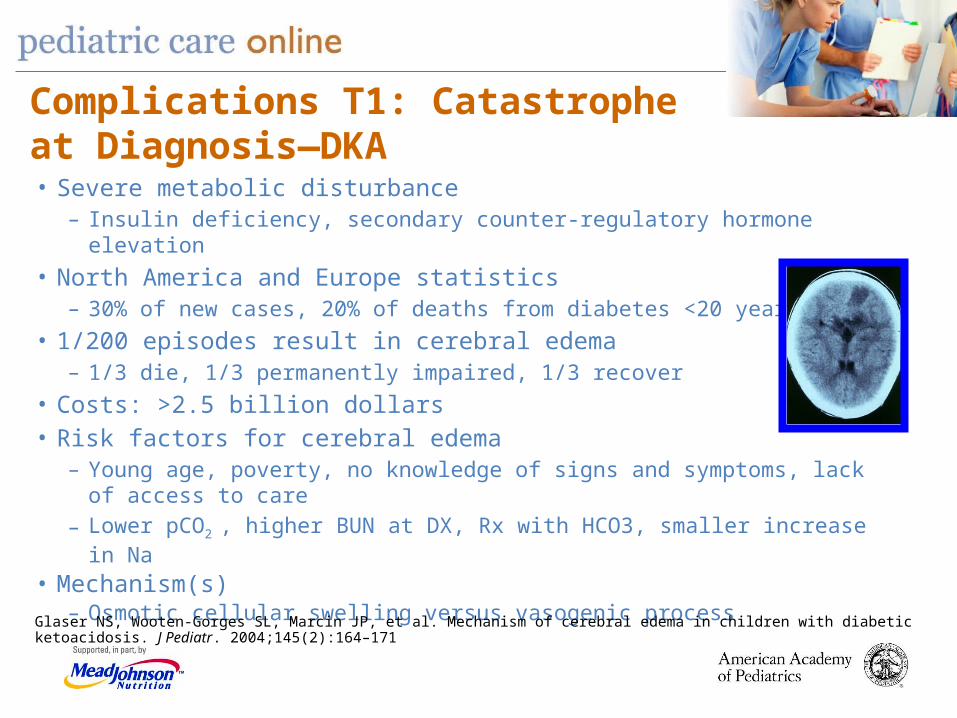
Complications T1: Catastrophe at Diagnosis—DKA • Severe metabolic disturbance
– Insulin deficiency, secondary counter-regulatory hormone elevation• North America and Europe statistics
– 30% of new cases, 20% of deaths from diabetes <20 years• 1/200 episodes result in cerebral edema
– 1/3 die, 1/3 permanently impaired, 1/3 recover• Costs: >2.5 billion dollars• Risk factors for cerebral edema
– Young age, poverty, no knowledge of signs and symptoms, lack of access to care– Lower pCO2 , higher BUN at DX, Rx with HCO3, smaller increase in Na
• Mechanism(s)– Osmotic cellular swelling versus vasogenic process
Glaser NS, Wooten-Gorges SL, Marcin JP, et al. Mechanism of cerebral edema in children with diabetic ketoacidosis. J Pediatr. 2004;145(2):164–171
Complications T2: Type 2 Diabetes is a Severe Disease• Hyperglycemic Hyperosmolar Non-Ketotic Syndrome—at onset—very high glucose
levels– 3.7% (7/190) in Philadelphia
Mortality 14.3%– Currently 28 reported other cases
Mortality 43%
• Pima Indians diagnosed at <20 years of age – 22% had microalbuminuria at diagnosis– Increased to 60% at 20–29 years of age
• Indigenous Canadians 23 years of age, 9 years duration – HbA1c 10.9%
67% poor glycemic control – 45% hypertension requiring treatment– 35% microalbuminuria (6% required dialysis) – 38% pregnancy loss – 9% mortality Fourtner SH, Weinzimer SA, Katz LEL. Hyperglycemic hyperosmolar non-ketotic syndrome in children with type 2 diabetes. Pediatr Diabetes. 2005;6(3):129–
135; Butler M, McKary RA, Popoff IJ, et al. Specific inhibition of PTEN expression reverses hyperglycemia in diabetic mice. Diabetes. 2002;51(4):1028–1034
Kaufman, Type 2 Youth
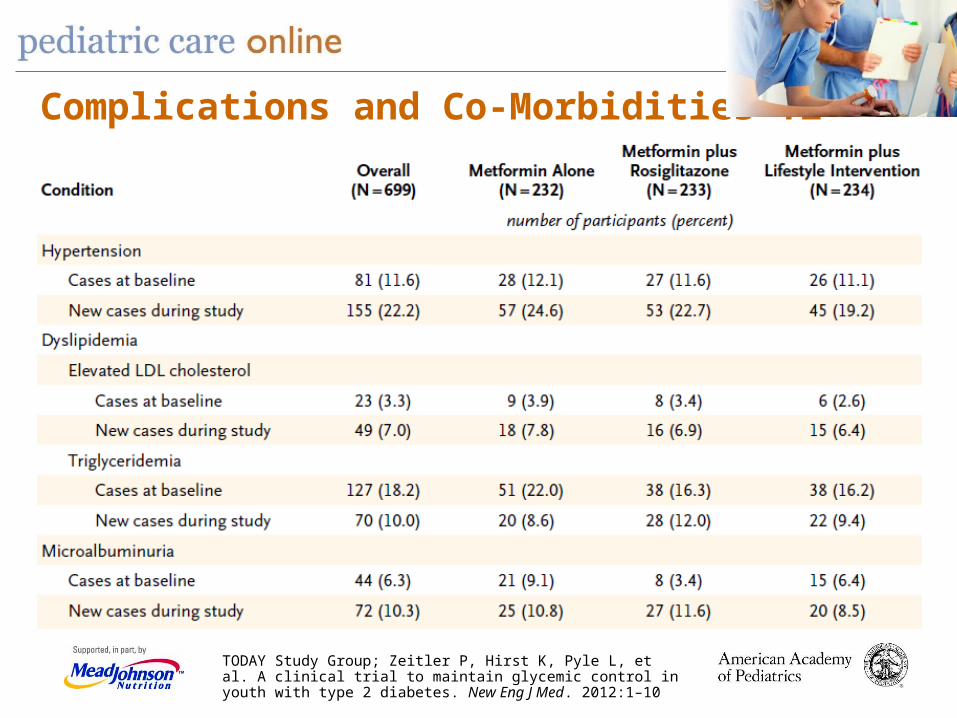
Complications and Co-Morbidities T2
TODAY Study Group; Zeitler P, Hirst K, Pyle L, et al. A clinical trial to maintain glycemic control in youth with type 2 diabetes. New Eng J Med. 2012:1–10

Prevention or Interdiction of T1
• Anti-CD3• Mycophenolate Mofetil +/- Anti-CD25• Anti-CD20• Anti-thymocyte globulin• CTLA-4• GAD-Alum immunization• Intense metabolic control• Oral insulin• Supplemental vitamin D• Omega fatty acids• Hydrolyzed formula compared to cow's milk• Outside TrialNet and Immune Tolerance
Network– Alpha-1-antitrypsin, BCG, insulin peptide B:9-23,
heat shock protein DiaPep277
Some studies have shown an initial benefit in
C-peptide preservation.
Has tolerance been achieved or only
immuno-blockade?
Are multiple or sequential agents required?
What are the risks/benefits over
the long term?
TrialNet and Immune Tolerance Network

Social Norms Subculture
Sectors of Influence
Behavioral Settings
Individual Factors
Home
Communities
Health Care Access, Adherence
Schools and Child Care
Worksites
Age, Sex, SES, Race/Ethnicity
Culture
Psychosocial Factors - Stress
Genes,Gene-Environment
Interactions
Intrauterine Environment
Built EnvironmentGovernmentPublic HealthAgricultureEducation
MediaLand Use and
TransportationCommunitiesFoundations
IndustryFood
BeverageRetail
Leisure and RecreationEntertainment
Physical Activity
Food & Beverage
Intake
Energy BalanceEnergy Intake Energy Expenditure
ObesityInsulin Resistance/Deficiency
Type 2 Diabetes
5. Prevention Socio-ecological Model
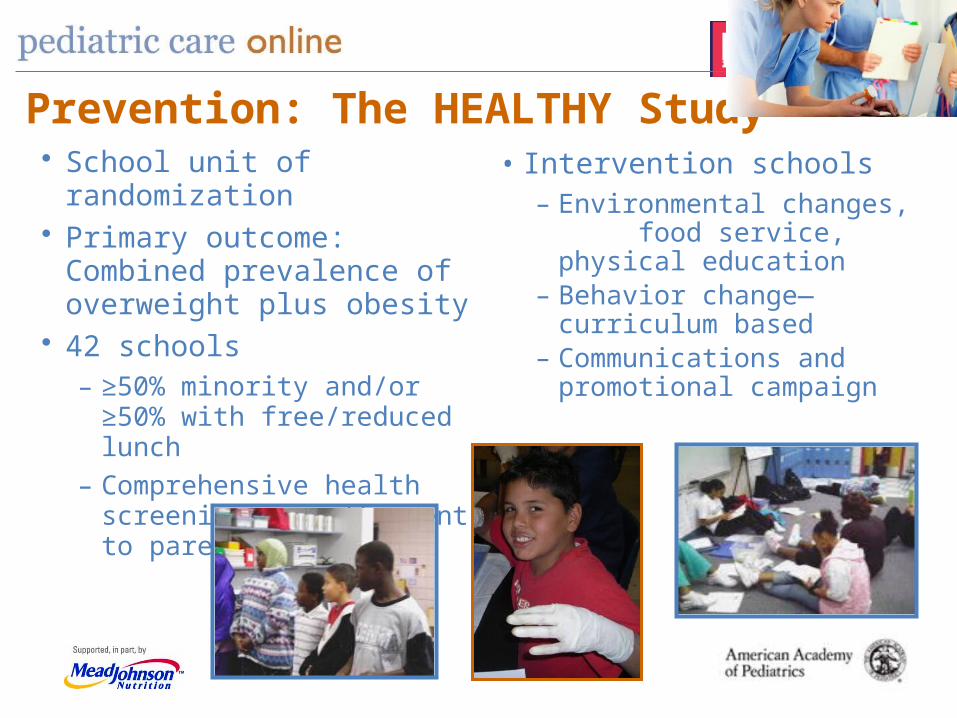
• Intervention schools– Environmental changes, food
service, physical education– Behavior change—curriculum
based– Communications and
promotional campaign
49
• School unit of randomization• Primary outcome: Combined
prevalence of overweight plus obesity
• 42 schools – ≥50% minority and/or ≥50% with
free/reduced lunch– Comprehensive health screening,
results sent to parents
Diabetes Care 29:212–217, 2006
Prevention: The HEALTHY Study

• Reduction in percentage of overweight/obesity by 4% in both groups
• Prevalence of obesity declined more in intervention schools (p=0.05)
• Significant reduction in intervention schools (p=0.04)– BMI z-score – Prevalence of large waist circumference– Fasting insulin fell
• In the overweight/obese subgroup (n=2292), intervention schools had significantly greater decreases in prevalence of:– Obesity (p=0.04)– Large waist circumference (p=0.03)– Insulin (p=0.04)
HEALTHY Study Group; Foster GD, Linder B, Baranowski T, et al. A school-based intervention for diabetes risk reduction. New Eng J Med. 2010;363(5):443–453
Prevention: The HEALTHY Trial RESULTS
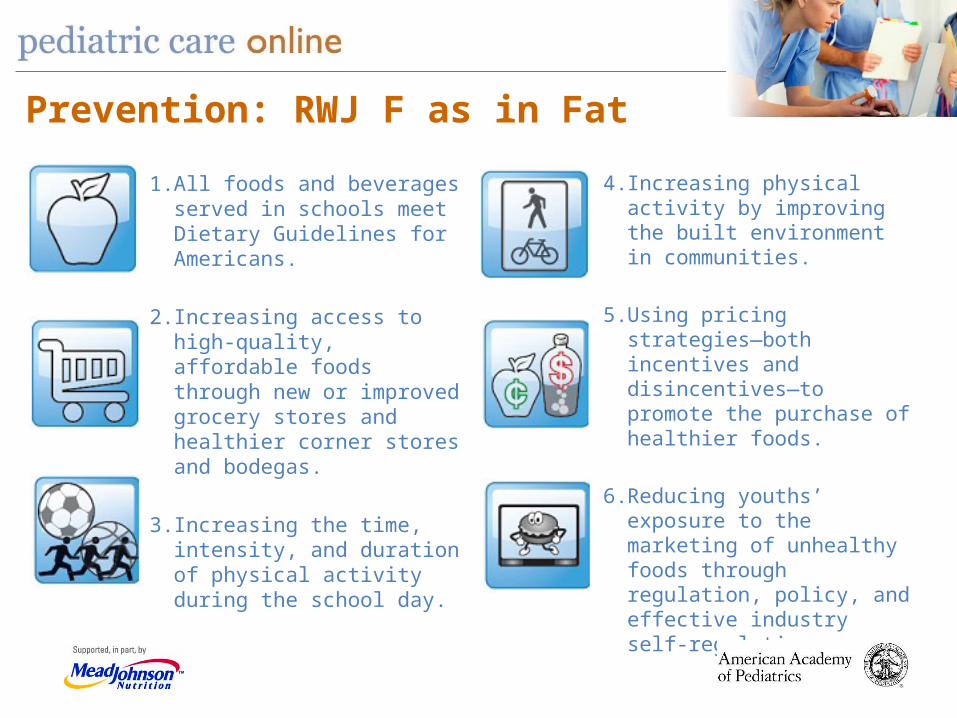
1. All foods and beverages served in schools meet Dietary Guidelines for Americans.
2. Increasing access to high-quality, affordable foods through new or improved grocery stores and healthier corner stores and bodegas.
3. Increasing the time, intensity, and duration of physical activity during the school day.
Prevention: RWJ F as in Fat
4. Increasing physical activity by improving the built environment in communities.
5. Using pricing strategies—both incentives and disincentives—to promote the purchase of healthier foods.
6. Reducing youths’ exposure to the marketing of unhealthy foods through regulation, policy, and effective industry self-regulation.
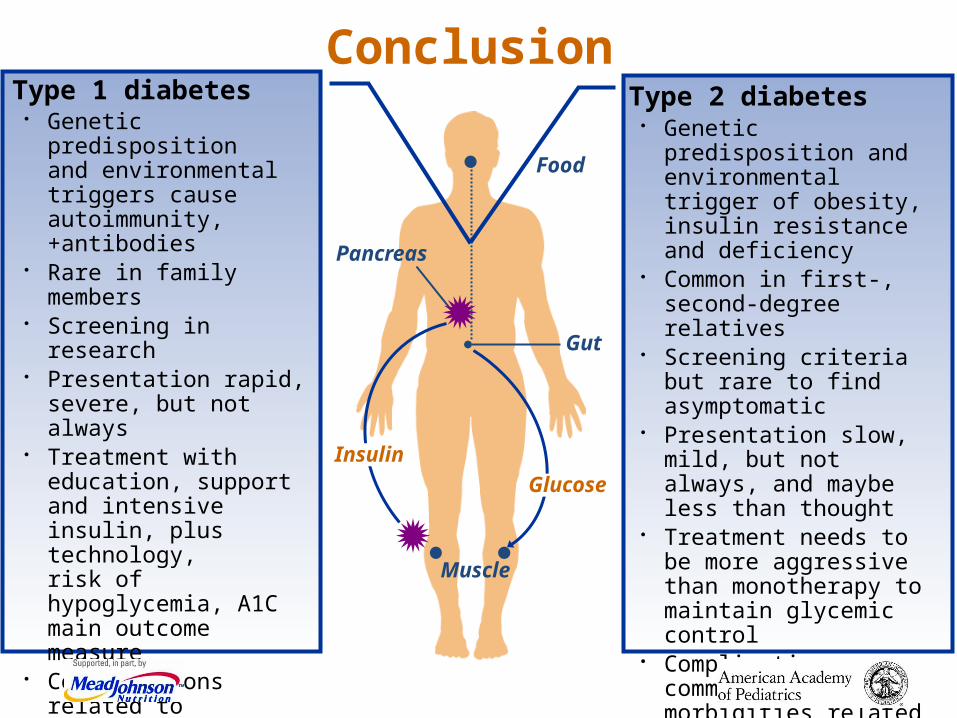
Conclusion
Gut
Food
Pancreas
Muscle
Glucose
Insulin
Type 1 diabetes• Genetic predisposition
and environmental triggers cause autoimmunity, +antibodies
• Rare in family members• Screening in research • Presentation rapid, severe,
but not always• Treatment with education,
support and intensive insulin, plus technology,risk of hypoglycemia, A1C main outcome measure
• Complications related to dysglycemia, occur in youth but rare, co-morbidities related to autoimmunity
• Prevention trials withmulti-agents/approaches
Type 2 diabetes • Genetic predisposition and
environmental trigger of obesity, insulin resistance and deficiency
• Common in first-, second-degree relatives
• Screening criteria but rare to find asymptomatic
• Presentation slow, mild, but not always, and maybe less than thought
• Treatment needs to be more aggressive than monotherapy to maintain glycemic control
• Complications common, early, co-morbidities related to insulin resistance
• Prevention addresses the environment to support healthy lifestyle adoption

For more information… On this topic and a host of other topics, visit www.pediatriccareonline.org.
Pediatric Care Online is a convenient electronic resource for immediate expert help with virtually every pediatric clinical information need. Must-have resources are included in a comprehensive reference library and time-saving clinical tools.
• Haven't activated your Pediatric Care Online trial subscription yet?It's quick and easy: simply follow the steps on the back of the card you received from your Mead Johnson representative.
• Haven't received your free trial card?Contact your Mead Johnson representative or call 888/363-2362 today.


![References - Shodhganga : a reservoir of Indian theses ...shodhganga.inflibnet.ac.in/bitstream/10603/11287/13/13_references.pdf · 190 Chapter 1 [1] M Ratner, D Ratner, Nanotechnology:a](https://img.pdfslide.net/doc/110x75/5b3bfbf97f8b9a986e8cb481/references-shodhganga-a-reservoir-of-indian-theses-190-chapter-1-1.jpg)