Embed Size (px)
Citation preview

Flood Studies and Maps 3-1
UNIT 3:NFIP FLOOD STUDIES AND MAPS
In this unit
This unit describes the flood data, studies, and maps that the NationalFlood Insurance Program provides to communities to assist them in carryingout their floodplain management program. It reviews:
♦ Flood study and map terminology,
♦ How flood studies are prepared along riverine floodplains,
♦ How flood studies are prepared on coastal floodplains, and
♦ How the NFIP maps display the study data.
Materials needed for this unit
♦ Flood Insurance Study, Flood County, USA and Incorporated Areas
♦ Flood Insurance Rate Map, Flood County, USA and IncorporatedAreas
Flood Studies and Maps 3-2
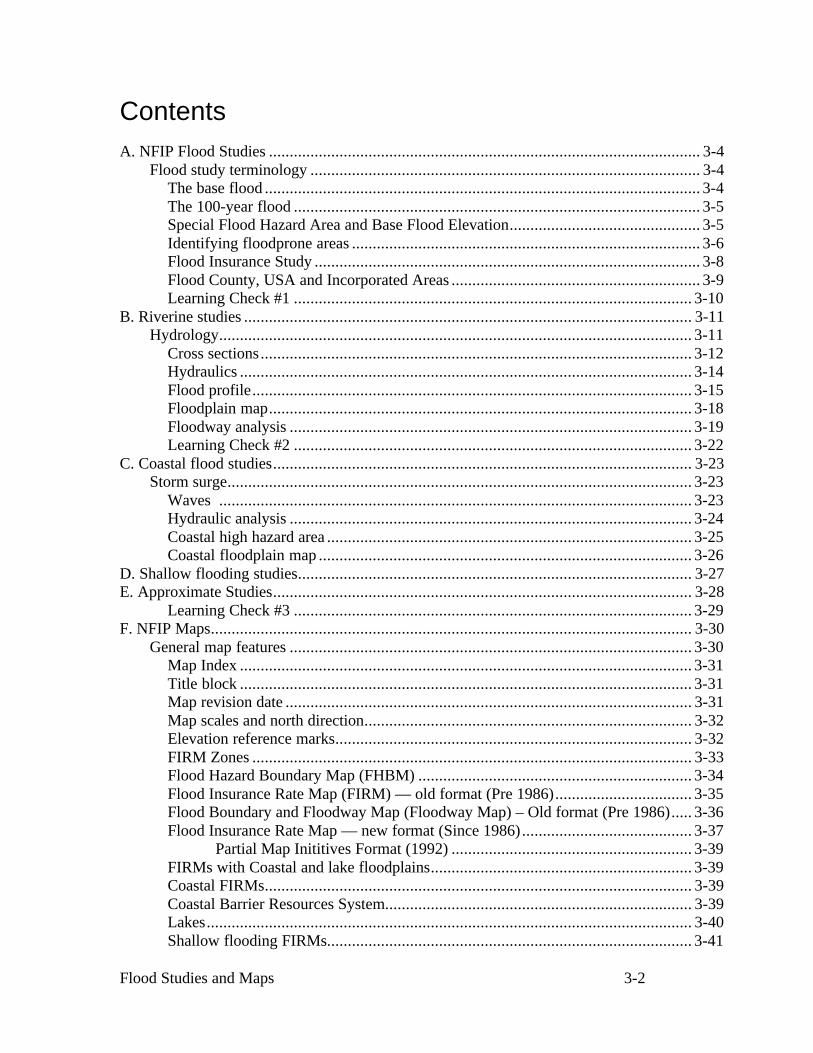
ContentsA. NFIP Flood Studies ........................................................................................................ 3-4
Flood study terminology .............................................................................................. 3-4The base flood ......................................................................................................... 3-4The 100-year flood .................................................................................................. 3-5Special Flood Hazard Area and Base Flood Elevation.............................................. 3-5Identifying floodprone areas .................................................................................... 3-6Flood Insurance Study ............................................................................................. 3-8Flood County, USA and Incorporated Areas ............................................................ 3-9Learning Check #1 ................................................................................................ 3-10
B. Riverine studies ............................................................................................................ 3-11Hydrology.................................................................................................................. 3-11
Cross sections........................................................................................................ 3-12Hydraulics ............................................................................................................. 3-14Flood profile.......................................................................................................... 3-15Floodplain map...................................................................................................... 3-18Floodway analysis ................................................................................................. 3-19Learning Check #2 ................................................................................................ 3-22
C. Coastal flood studies..................................................................................................... 3-23Storm surge................................................................................................................ 3-23
Waves .................................................................................................................. 3-23Hydraulic analysis ................................................................................................. 3-24Coastal high hazard area ........................................................................................ 3-25Coastal floodplain map .......................................................................................... 3-26
D. Shallow flooding studies............................................................................................... 3-27E. Approximate Studies..................................................................................................... 3-28
Learning Check #3 ................................................................................................ 3-29F. NFIP Maps.................................................................................................................... 3-30
General map features ................................................................................................. 3-30Map Index ............................................................................................................. 3-31Title block ............................................................................................................. 3-31Map revision date .................................................................................................. 3-31Map scales and north direction............................................................................... 3-32Elevation reference marks...................................................................................... 3-32FIRM Zones .......................................................................................................... 3-33Flood Hazard Boundary Map (FHBM) .................................................................. 3-34Flood Insurance Rate Map (FIRM) — old format (Pre 1986)................................. 3-35Flood Boundary and Floodway Map (Floodway Map) – Old format (Pre 1986)..... 3-36Flood Insurance Rate Map — new format (Since 1986)......................................... 3-37
Partial Map Inititives Format (1992) .......................................................... 3-39FIRMs with Coastal and lake floodplains............................................................... 3-39Coastal FIRMs....................................................................................................... 3-39Coastal Barrier Resources System.......................................................................... 3-39Lakes..................................................................................................................... 3-40Shallow flooding FIRMs........................................................................................ 3-41

Flood Studies and Maps 3-3
FIRMs with flood protection projects……………… ............................................. 3-41Countywide FIRMs ............................................................................................... 3-42Digital FIRMs ....................................................................................................... 3-44Digital Flood Insurance Rate Map (DFIRM).......................................................... 3-44Digital Flood Insurance Rate Map – Digital Line Graph ........................................ 3-45Q3 Flood Data ....................................................................................................... 3-46Learning Check #4 ................................................................................................ 3-48
Unit Learning Exercise...................................................................................................... 3-50Answers to the learning checks.............................................................................. 3-52Learning Check #1 ................................................................................................ 3-52Learning Check #2 ................................................................................................ 3-53Learning Check #3 ................................................................................................ 3-54Learning Check #4 ................................................................................................ 3-55Unit Learning Exercise .......................................................................................... 3-57

Flood Studies and Maps 3-4
A. NFIP FLOOD STUDIES
FLOOD STUDY TERMINOLOGY
Before describing how flood studies are developed, we first need to introduce some ofthe common terms used in floodplain analysis and in the National Flood InsuranceProgram (NFIP). The following terms are integral for understanding the basis for floodstudies and flood maps:
♦ The base flood,
♦ The 100-year flood,
♦ Special Flood Hazard Area, and
♦ Base Flood Elevation.
The base flood
Floods come in many sizes — with varying degrees of magnitude and frequency.
Rivers and coastlines are expected to flood, as all bodies of water have floodplains.But rivers and coastlines are different, as well; each has its own probability of flooding.Probability is a statistical term having to do with the size of a flood and the odds of thatsize of flood occurring in any year.
For each river, engineers assign statistical probabilities to different size floods. This isdone to understand what might be a common or ordinary flood for a particular riverversus a less likely or a severe flood for that same river.
In order to have common standards, the NFIP adopted a baseline probability calledthe base flood. The base flood is the one-percent annual chance flood. The one-percentannual chance flood is the flood that has a one-percent (one out of 100) chance ofoccurring in any given year. The base flood, which is also informally referred to as the100-year flood, is the national standard used by the NFIP and all Federal agencies for thepurposes of requiring the purchase of flood insurance and regulating new development
The one-percent annual chance flood was chosen as a compromise between a morefrequent flood (such as a 10-percent chance flood), which would permit excessiveexposure to flood risk, and a more infrequent flood (say, a 0.1-percent chance flood),which would be considered an excessive and unreasonable standard.

Flood Studies and Maps 3-5
The 100-year flood
The one-percent annual chance flood is also called the 100-year flood because theinverse of one percent (one divided by one percent or 0.01) equals 100. This calculationgives us the flood’s recurrence interval, in terms of probability, which is 100 years.
The term “100-year flood” is often misconstrued. Commonly, people interpret the100-year flood definition to mean “once every 100 years.” This is wrong. You couldexperience a 100-year flood two times in the same year, two years in a row, or four timesover the course of 100 years. You could also not experience a 100-year flood over thecourse of 200 or more years.
To avoid confusion (and because probabilities and statistics can be confusing), theNFIP uses the term “base flood.” A 100-year base flood is defined as having a one-percent chance of being reached or exceeded in any single year. Thus, the 100-year floodalso is called the “one-percent annual chance flood.”
To restate, “100-year flood” and “base flood” both refer to a flood that has a one-percent chance of occurring in any given year. The terms “base flood,” “100-year flood,”and “one-percent annual chance flood” are often used interchangeably.
Special Flood Hazard Area and Base Flood Elevation
The land area covered by the floodwaters of the base flood is the base floodplain. OnNFIP maps, the base floodplain is called the Special Flood Hazard Area (SFHA).
The SFHA is the area where the NFIP’s floodplain management regulations must beenforced by the community as a condition of participation in the NFIP and the area wherethe mandatory flood insurance purchase requirement applies.
The computed elevation to which floodwater is anticipated to rise during the baseflood is the Base Flood Elevation (BFE).

Flood Studies and Maps 3-6
WHAT ARE THE ODDS OF BEING FLOODED?
The term "100-year flood" has caused much confusionfor people not familiar with statistics. Another way tolook at flood risk is to think of the odds that a 100-yearflood will happen sometime during the life of a 30-yearmortgage—a 26% chance for a structure located in theSFHA.
Chance of Flooding over a Period of Years
Time Flood Size Period 10-year 25-year 50-year 100-year
1 year 10% 4% 2% 1%10 years 65% 34% 18% 10%20 years 88% 56% 33% 18%30 years 96% 71% 45% 26%50 years 99% 87% 64% 39%
Even these numbers do not convey the true floodrisk because they focus on the larger, less frequent,floods. If a house is low enough, it may be subject tothe 10- or 25-year flood. During a 30-year mortgage,it may have a 26% chance of being hit by the100-year flood, but the odds are 96% (nearlyguaranteed) that it will be hit by a 10-year flood.Compare those odds to the only 1-2% chance thatthe house will catch fire during the same 30-yearmortgage.
IDENTIFYING FLOODPRONE AREAS
The National Flood Insurance Act of 1968 directed the Federal InsuranceAdministration (FIA) to:
♦ Identify all floodprone areas within the United States.
♦ Establish flood-risk zones within floodprone areas.
Today, the Federal Emergency Management Agency (FEMA) is responsible forimplementing this directive. FEMA has conducted flood studies and produced variousforms of maps. The flood studies analyze the terrain and the factors that affect floodhazards. This information is used to draw the maps that delineate floodplain boundaries.
The maps and flood studies also show projected flood elevations, flood velocities,floodway dimensions, insurance rating zones, and descriptions of how the study was

Flood Studies and Maps 3-7
conducted and how the maps were prepared. This information is needed for floodinsurance and floodplain management purposes.
All of this information is referred to as a community’s Flood Insurance Study (FIS),which is conducted under standards set by FEMA for the NFIP. FEMA has preparedflood insurance studies for more than 19,000 communities.
In keeping with the directive of the National Flood Insurance Act of 1968, initialflood study and mapping efforts of the NFIP were focused on identifying all floodproneareas within the United States. Flood data and floodplain information from many sources— such as soils mapping, actual high water profiles, aerial photographs of previousfloods, topographic maps, etc. — were used to overlay the approximate outline of thebase (100-year) floodplain for specific stream reaches on available community maps,usually U. S. Geological Survey topographic quadrangle maps.
These documents were referred to as Flood Hazard Boundary Maps and were basedon approximate studies. Most communities used a Flood Hazard Boundary Map whenthey first joined the NFIP.
As money was appropriated by Congress, FEMA performed more detailed studies formany communities, resulting in the publication of Flood Insurance Study reports andFlood Insurance Rate Maps (FIRMs). These studies provide communities with dataneeded to adopt and implement more comprehensive floodplain management measuresand to enter the Regular Phase of the NFIP.
FISs, also referred to as detailed studies, were carried out for developed communitiesand for those areas experiencing rapid growth. FISs contain guidance on understandingthe FIRM as well as information needed for new construction allowed in developing anddeveloped areas.
Today, almost every community in the NFIP has a FIRM, which may containapproximate and/or detailed flood hazard analyses. The areas mapped with approximatestudies are areas where, originally, there was little or no development or expectation ofdevelopment. However, recent development may have created a need for future detailedstudies in these areas.
Flood maps are one of the most vital parts of a floodplain management program, so it isimportant to understand how the maps were created and to be familiar with theinformation that is available within the accompanying flood study.

Flood Studies and Maps 3-8
FLOOD INSURANCE STUDY
When a flood study is completed for the NFIP, the information and maps areassembled into a Flood Insurance Study (FIS). A FIS is a compilation and presentation offlood risk data for specific watercourses, lakes, and coastal flood hazard areas within acommunity.
The FIS report and associated maps delineate the SFHA, designate flood risk zonesand establish base flood elevations. They serve as the basis for rating flood insurance andfor regulating floodplain development and carrying out other floodplain managementmeasures.
The study has three components:
♦ The FIS — Flood Insurance Study report
♦ The FIRM — Flood Insurance Rate Map
♦ Prior to 1986, a separate Flood Boundary and Floodway Map (FBFM) was issuedas a component of the FIS for each community studied.
The FIS report includes:
♦ An appraisal of the community’s floodproblems in a narrative that describes:
-- the purpose of the study,
-- historic floods,
-- the area and flooding sources studied, and
-- the engineering methods employed.
♦ A vicinity map of the community and,occasionally, photographs of historic floods.
♦ Tables summarizing various flood hazard data.
♦ Computed flood profiles for various recurrenceprobabilities, usually the 10-, 50-, 100-, and/or500-year floods.

Flood Studies and Maps 3-9
FLOOD COUNTY, USA AND INCORPORATED AREAS
Included in the course materials are the FIS report and maps for Flood County, USAand Incorporated Areas. This fictitious community was developed to illustrate examplesof both riverine and coastal flood hazards.
This unit uses these documents for Flood County, USA and Incorporated Areas:
♦ The FIS report, and
♦ The FIRM, accompanying Map Index, and panels 25, 38, and 40.
Flood County is subject to flooding from several flooding sources; however, this unitconcentrates on the following three sources:
♦ The Rocky River, which drains from the west, and flows through the Town ofFloodville to the Atlantic Ocean.
♦ Cobb Brook, which flows from the west to the Rocky River.
♦ The Atlantic Ocean.
As you look at Flood County, you may find that some street names do not appear onthe FIRM. This is because flood hazard maps are created to show details related toidentified floodplains. If your community flood maps lack street names, use asupplementary street map to assist you in locating properties accurately.
As you work through this unit, we recommend that you locate similar sections in yourcommunity’s FIS and see how this information pertains to your situation. The outline issimilar for all FISs, so you should be able to locate the same tables and exhibits in thetable of contents.

Flood Studies and Maps 3-10
LEARNING CHECK #1
1. As directed by the National Flood Insurance Act of 1968, FEMA conducts floodstudies in order to determine __________________________ and___________________ .
2. The base flood is a flood that has a ____________________ of occurring in anyyear.
3. The base flood is also called the ________ - year flood.
4. Determine whether the following statements are true or false. Circle T for True and Ffor False.
A 100-year flood will occur only once every 100 years. T F
A 100-year flood could occur two times in one year. T F
The 100-year flood might not occur in a 200-year period. T F
The base flood could occur in two consecutive years in a row. T F
5. On NFIP maps, the base floodplain is called the _____________ _________________________ ___________ . (4 words)
6. BFE is the acronym for __________ __________ _____________ .
7. What are the components of a Flood Insurance Study?
Flood Studies and Maps 3-11
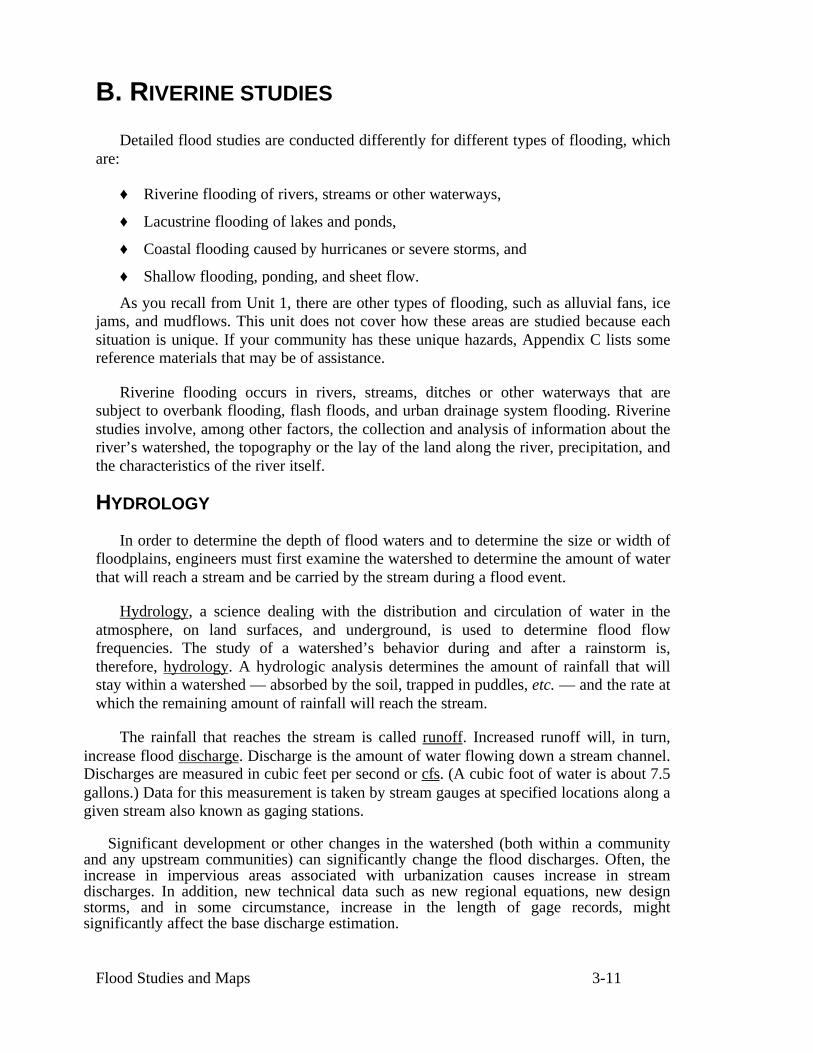
B. RIVERINE STUDIES
Detailed flood studies are conducted differently for different types of flooding, whichare:
♦ Riverine flooding of rivers, streams or other waterways,
♦ Lacustrine flooding of lakes and ponds,
♦ Coastal flooding caused by hurricanes or severe storms, and
♦ Shallow flooding, ponding, and sheet flow.
As you recall from Unit 1, there are other types of flooding, such as alluvial fans, icejams, and mudflows. This unit does not cover how these areas are studied because eachsituation is unique. If your community has these unique hazards, Appendix C lists somereference materials that may be of assistance.
Riverine flooding occurs in rivers, streams, ditches or other waterways that aresubject to overbank flooding, flash floods, and urban drainage system flooding. Riverinestudies involve, among other factors, the collection and analysis of information about theriver’s watershed, the topography or the lay of the land along the river, precipitation, andthe characteristics of the river itself.
HYDROLOGY
In order to determine the depth of flood waters and to determine the size or width offloodplains, engineers must first examine the watershed to determine the amount of waterthat will reach a stream and be carried by the stream during a flood event.
Hydrology, a science dealing with the distribution and circulation of water in theatmosphere, on land surfaces, and underground, is used to determine flood flowfrequencies. The study of a watershed’s behavior during and after a rainstorm is,therefore, hydrology. A hydrologic analysis determines the amount of rainfall that willstay within a watershed — absorbed by the soil, trapped in puddles, etc. — and the rate atwhich the remaining amount of rainfall will reach the stream.
The rainfall that reaches the stream is called runoff. Increased runoff will, in turn,increase flood discharge. Discharge is the amount of water flowing down a stream channel.Discharges are measured in cubic feet per second or cfs. (A cubic foot of water is about 7.5gallons.) Data for this measurement is taken by stream gauges at specified locations along agiven stream also known as gaging stations.
Significant development or other changes in the watershed (both within a communityand any upstream communities) can significantly change the flood discharges. Often, theincrease in impervious areas associated with urbanization causes increase in streamdischarges. In addition, new technical data such as new regional equations, new designstorms, and in some circumstance, increase in the length of gage records, mightsignificantly affect the base discharge estimation.

Flood Studies and Maps 3-12
Runoff amounts and discharge rates vary depending on soil type, ground slope, landuse, and the presence of storm sewers. In general, more runoff occurs on non-vegetatedland, on paved and built-on urban land, and on steeper slopes.
Discharges are estimated by using rainfall and snowmelt data and historical streamrecords or by using regional equations that represent such data. Computer models allowengineers to incorporate numerous watershed characteristics into the hydrologic analyses.Discharge rates also generally increase as the size of a watershed increases.
Upon completion of the hydrologic analysis, engineers have flood discharges forvarious size rainstorms that are measured at different points along a stream, such as at theconfluence with another stream and at the mouth of a tributary stream.
CROSS SECTIONS
All detailed flood studies examine the areas through which floodwater will flow. Thisrequires a determination of ground elevations and obstructions to flow (such as vegetation,buildings, bridges, and other development) for these areas. Accurate data on the channelgeometry and changes in the floodplain are obtained from ground surveys, aerialphotography, or topographic maps.
To locate the true elevations at a site, surveyors have established elevation referencemarks or bench marks that are referenced to a common vertical elevation reference called adatum. The use of a datum ensures uniformity of references to land elevations and avoidsmisinterpretation of flood elevations.
Established reference marks and bench marks with a recorded elevation allowsurveyors to describe the changes in the ground levels or stream characteristics aselevations relative to the referenced datum. They are also used by surveyors to determinethe elevations of buildings that are at risk of flooding.
A cross section is a graphical depiction of the stream and the floodplain at a particularpoint along the stream. It is taken at right angles to the flow of the stream. At each crosssection, the engineer has accurate information on the size and geometry of the channel, theshape of the floodplain, and the changes in the elevation of the ground. A typical surveyedcross section is shown in Figure 3-1.
Cross sections are taken of the floodplain at locations along the stream that arerepresentative of local conditions. Cross sections are taken at each bridge or other majorobstruction and at other locations, depending on how much the stream or adjacentfloodplain conditions change (Figure 3-2). The more changes there are in topography(perhaps steep riverbanks changing to large flat overbank areas), the more cross sectionsare needed to define the floodplain accurately.

Flood Studies and Maps 3-13
Figure 3-1: Surveyed cross section
About Datums and Elevations
During the 1920s, the U.S. government created a network of 21 tidal gages in the U.S. and five inCanada to provide a fixed continental datum that would bring a consistent relationship to allvertical elevation determinations in the U.S. This new datum was known as the Mean Sea Level(MSL) Datum of 1929 and is the base elevation to which all relief features and elevation data arereferenced in the contiguous United States. In 1973, to avoid confusion in many communities thatused a local mean sea level datum, the name was changed to the National Geodetic Vertical Datum(NGVD) of 1929. NGVD is also the datum of reference for the vast majority of FISs.
Most permanent elevation reference marks (or bench marks) are referenced to the NGVD (seeexample). Reference marks are not always brass caps; they can bechiseled squares or other designated markers left by surveyors. The cityor county surveyor or engineer’s office should have a list of bench marksin the community. An ultimate goal of the NFIP is to convert all FISs to anewer standard called the North American Vertical Datum (NAVD) of1988. This latest standard will eliminate inconsistencies caused when theNGVD is not consistent at all 26 tidal stations.
When reporting elevations for structures, cross sections, or topographicmapping, it is very important to note the datum to which the survey isreferenced. Differences between NAVD 88 and NGVD 29 vary by as much as –1.5 feet along theeast coast of southern Florida to + 4.9 feet in the Rocky Mountains of Colorado. Software forconverting between NAVD 88 and NGVD 29 is available from the National Geodetic Survey.
There are now 600,000 permanent benchmarks associated with the NAVD of1988. See Flood Insurance Study: Guidelines and Specifications for StudyContractors, FEMA-37 (1995), for further information.

Flood Studies and Maps 3-14
Figure 3-2: Typical cross section locations
The surveyors and engineers also estimate the roughness factor along the floodplainto determine how fast floodwater will flow through the area. Roughness factors arerelated to ground surface conditions, and they reflect changes in floodwater velocity dueto ground friction. For example, water will flow faster over mowed grass and pavementthan it will over an area covered in bushes and trees, or planted in tall crops.
A portion of the collected survey information is used in the hydrologic analysis, butthe surveyed cross sections and other survey information are the building blocks of thehydraulic analysis and mapping efforts.
HYDRAULICS
Hydraulics, a science that deals with fluids in motion, is used to determine how aquantity of water will flow through a channel or floodplain. For purposes of floodplainanalysis, hydraulics is the study of floodwaters moving through the stream and thefloodplain. Hydraulic analysis combines:
♦ Flood hydrology, or discharges,
♦ The cross section data on how much area there is to carry the flood, and
♦ Stream characteristics — roughness, slope, locations and sizes of structures.
The data are usually processed using a computer model, most commonly HEC-2 orHEC-RAS, which were developed by the U.S. Army Corps of Engineers’ HydrologicEngineering Center.
Changes in hydraulic conditions of a stream usually occur when new bridges, culvertsand road crossings are constructed, and when there are changes in the physicalcharacteristics of the stream. If a bridge or culvert is not properly sized, it can cause floodwaters to back-up, which increases flood levels upstream. Although most bridge openingsand culverts are designed to allow stream flows associated with frequent storm events topass without such backwater effects, they may still cause increase in the base flood

Flood Studies and Maps 3-15
elevation. Therefore, any bridges, culverts, or other road crossings that have beenconstructed since the analyses for the effective FIS and FIRM were completed should beevaluated for their potential effect on the base flood and the associated floodway. Inaddition, any significant changes in the stream channel or floodplain geometry couldaffect the floodplain and floodway. One should always ask the questions: 1) has anyportion of the floodplain been filled? 2) has the stream channel migrated or changedlocation because of significant erosion and/or depositions? 3) have any portions of thestream been channelized, widened, or dredged? 4) have there been significant changes inthe vegetation in the floodplain? Aerial photographs are useful tools in evaluatingchanges in stream channels and floodplains.
The hydraulic study produces determinations of flood elevations, velocities, andfloodplain widths at each cross section for a range of flood flow frequencies (Figure 3-3).These elevations are the primary source of data used by engineers to map the floodplain.
Figure 3-3: Cross section with flood elevations
A FIS typically produces elevations for the 10-, 50-, 100-, and 500-year floods.Water-Surface Elevations (WSEL) for the 10-, 50-, and 500-year floods are typicallyused for other floodplain management purposes. For example, the 10-year flood data maybe used for locating septic systems, the 50-year flood for placing bridges and culverts,and the 500-year for siting critical facilities, such as hospitals or emergency operationfacilities.
FLOOD PROFILE
The hydraulic computer program generates potential flood elevations at each crosssection, but flood elevations at locations between the cross sections need to be

Flood Studies and Maps 3-16
determined as well. This is done by plotting the elevations at the cross sections on agraph and connecting the plotted points. Such a graph is called a flood profile.
Figure 3-4 shows a portion of the flood profile for the Rocky River. The entire profileis found in the back of the Flood County FIS report.
The bottom of the graph (the horizontal axis or x-axis) shows the distance along thestream, which is commonly called stationing. For stationing, you start at the mouth of astream (its point of discharge into a larger body of water) and look upstream. Generally,when profiles are plotted, the slope of the streambed will rise as you read the graph fromleft to right.
River distances are measured in either feet or miles (1mile=5280 feet), or meters andkilometers (1 kilometer=1000 meters). For most profiles, the distance is measured abovethe mouth of the stream or above its confluence (where it meets with another stream). Inthe case of Flood County, the stream distances for the Rocky River are measured abovethe County Boundary.
The left and right sides of the graph (the vertical axis or y-axis) show elevations infeet (NGVD). The legend at the bottom right corner shows the symbol for each floodprofile plotted. Bridges are indicated with an “I” shaped symbol. The bottom of the “I”represents the bridge’s low chord (lowest beam) and the top of the “I” represents the topof the roadway or the top of a solid bridge railing.
Additional information is provided on the profiles, such as corporate limits andconfluences of smaller streams. Profiles also provide a picture of stream characteristics,such as steep sections of the streambed and where restrictive bridge openings causefloodwaters to back up (see the footbridge in Figure 3-4).
By reading a profile, you can determine the flood elevation at any point along thestream. Reading profiles is covered in Unit 4.

Flood Studies and Maps 3-17
Figure 3-4: Rocky River flood profile

Flood Studies and Maps 3-18
FLOODPLAIN MAP
The next step in the mapping process is to transfer the flood elevation data onto a mapshowing ground elevation data. This is called a topographic map or contour map becausepoints with the same elevation are connected by a contour line. The topographic orcontour map is often referred to as the base map.
The most common topographic maps used are produced by the U.S. GeologicalSurvey. Some communities have prepared their own topographic maps and providedthem to FEMA during the study process to improve the accuracy of their floodplainmaps.
The base flood elevations from the cross sections and profiles are plotted on thetopographic map. Floodplain boundary lines are drawn connecting these plotted pointsusing the contour lines as a guide. The completed map illustrates the SFHA (Figure 3-5).
Figure 3-5: The BFEs at the cross sections from the Rocky Riverprofile are used to plot the BFEs on the contour map.
Lines are connected to show the floodplain boundary on a map.
It is important to remember that floodplain map boundaries are only as accurate as thetopographic map on which they are drawn. Since the U.S. Geological Survey topographicquadrangle maps have so small a scale, the SFHA boundaries cannot be preciselymapped. This is important to remember when determining if a building is in or out of thefloodplain, and, therefore, the use of other relevant measurements may be required and isrecommended.
Correlating map features with ground features requires care, because maps do notalways represent exact conditions on the ground. Where there is an apparent discrepancybetween floodplain boundaries shown on a map and actual ground conditions, as the localadministrator, you can use elevation data to resolve the matter by locating the floodelevation on the ground via an elevation survey. This elevation represents the actualextent of flooding for that particular flood.

Flood Studies and Maps 3-19
Figure 3-6: Floodway cross section and map
Note: Banks, lending institutions and others who must read the FIRM to determine ifflood insurance is required must go by the map. They cannot make on-siteinterpretations based on data other than the FIRM. However, they may recommend thatthe property owner submit a request for a map revision or map amendment so the mapcan be officially changed to reflect the more accurate data (see Unit 4, Section D).
FLOODWAY ANALYSIS
The final step in preparing most riverine flood studies is to produce the floodwayanalysis, which identifies where encroachment by development will increase floodelevations significantly and worsen flood conditions.
The floodway is the stream channel and that portion of the adjacent floodplain thatmust remain open to permit passage of the base flood. Floodwaters generally are deepestand swiftest in the floodway, and anything in this area is in the greatest danger during aflood. FEMA has mapped designated floodways in more than 8,000 communities.
The remainder of thefloodplain is called the floodfringe (Figure 3-6), where watermay be shallower and slower.NFIP minimum standardsprovide that other areas outsidethe boundaries of the floodwaycan be developed without furtheranalysis. Consequently, mostcommunities permit developmentin the flood fringe if thedevelopment is elevated orotherwise protected to the baseflood level (or any higher state orlocal standards). Development inthe floodway is allowed if it canbe demonstrated that no rise inthe base flood elevation willoccur. It is recommended,however, that floodwaydevelopment be discouraged oreven prohibited because of the
hazardous nature of this area.

Flood Studies and Maps 3-20
A floodway analysis determines the boundaries of the floodway using these floodplainmanagement concepts:
♦ Continued development in the floodplain will likely further obstruct flood flows,which will back water up or divert it to other properties.
♦ Properties on both sides of a river or stream should be treated equitably. Thedegree of obstruction permitted now for one should be permitted in the future forthe other.
♦ Property owners should be allowed to develop their land, provided they do notobstruct flood flows, cause damage or create a nuisance to others. (A communitymay allow development in the flood fringe that cumulatively increases the BFE,but NFIP regulations specify that such total increases cannot exceed one foot atany point along the stream. Some states or communities have more restrictivestandards that must be met.)
A floodway analysis is done with a computer program that can make the necessarycalculations of the effects of further development. Beginning at both edges of thefloodplain, the computer model starts “filling” the floodplain. This “squeezes” thefloodwater toward the channel and causes the flood level to rise. At the point where thisprocess reaches a one foot rise, the floodway boundaries are drawn (Figure 3-7).
Figure 3-7: Computer floodway analysis
The floodway boundaries at each cross section are transferred to the topographic orcontour map that shows the SFHA boundaries. The plotted points are connected to showthe floodway and flood fringe on the floodplain map.
Not every cross section will show an exact one-foot rise. Topographic conditions andthe need to “smooth out” the floodway line will result in some cross sections havingincreases of less than one foot.
Allowing flood heights to rise up to one foot is a compromise standard. Prohibitingany rise in flood heights would prohibit most types of new development or

Flood Studies and Maps 3-21
redevelopment. On the other hand, allowing development to cause significant increases inflood heights can cause great problems for others.
States and communities may use a more restrictive standard for delineating afloodway. Some may allow only a 0.5-foot or 0.1-foot rise in the base flood elevation inthe floodway analysis. This results in wider floodways and less area in the flood fringe.
A floodway analysis should be prepared with close coordination between themodeling engineer and those who are responsible for community planning and floodplainmanagement.
The number of possible floodway configurations is almost limitless. Therefore, inchoosing a regulatory configuration, the interests of individual property owners and thecommunity as a whole must be weighed.

Flood Studies and Maps 3-22
LEARNING CHECK #2
1. For purposes of a riverine flood study, ______________ is the study of thedistribution and circulation of water in the environment, and ______________ is thestudy of fluids in motion and how water will flow through the channel.
2. The rate at which runoff (an amount of water) flows downstream is called the flood______________ .
3. What probable effect does increase in urbanization within a community or upstreamof it have on the stream discharges within that community?
4. What consequence on flood water level of a stream would usually occur when abridge is constructed over a stream?
5. To locate the true elevations at a site, surveyors have established ______________________________ marks also known as _______________ marks.
6. Cross sections describe the of the floodplain.
7. What is the datum used for your FIS, FIRM, and profiles?
8. Flood profiles are developed by plotting the flood elevations at the __________________________ and connecting the plotted points.
9. To make a floodplain map, the base flood elevations are plotted on a _____________map or a _____________ map.
10. The ______________ is defined as the stream channel and that portion of theadjacent floodplain that must remain open to permit passage of the base flood.
11. A floodway analysis conducted to the minimum NFIP standard allows the fringe to beobstructed until the base flood level is increased by how much?

Flood Studies and Maps 3-23
C. COASTAL FLOOD STUDIES
Coastal flood studies are conducted for communities along the Atlantic and PacificOceans, the Gulf of Mexico, the Great Lakes, and the Caribbean Sea. Coastal studies areused to establish a base flood and an SFHA, but they may also designate a coastal highhazard area (V Zone).
Note that coastal communities, particularly counties, may also have riverinefloodplains with designated floodways.
STORM SURGE
Most coastal floods are caused by coastal storms, usually hurricanes and northeasters.Such storms bring air pressure changes and strong winds that “pile” water up against theshore in what is called a storm surge.
A computer simulation of a coastal storm is developed based on data from paststorms. Such data include wind speeds, wind direction, and air pressure from historicalhurricanes and northeasters. The resulting surge elevations are then calibrated usinghistorical information so the probabilities for each event can be determined.
The coastal storm surge computer program produces stillwater flood elevations — theelevations of various coastal floods, not including waves. The computer model iscalibrated by reproducing the observed historical stillwater elevations. The programdetermines the stillwater elevation from these historical data.
WAVES
In addition to storm surge, wave action is an important aspect of coastal storms.Wind-driven waves produce velocities and impacts that may cause significant structuraldamage. The coastal flood study analyzes how high the wave crest elevation will beabove the stillwater elevation as water is driven onshore.
When waves hit the shore, water is moving with such force that it keeps travelinginland. This is called wave runup, when land areas that are higher than the stillwaterelevation are flooded (Figure 3-8). Wave setup is defined as the additional elevation ofthe water surface over normal surge elevation caused by onshore mass transport of thewater by wave action. Wave set-up is a function of deepwater wave height and duration.

Flood Studies and Maps 3-24
Figure 3-8: Wave runup
HYDRAULIC ANALYSIS
As with riverine studies, a coastal hydraulic analysis determines where moving watergoes. Using similar surveying techniques as in a riverine study, the coastal flood engineersurveys transects instead of cross sections.
A transect shows the elevation of the ground both onshore and offshore. The groundelevation data are used by computer programs to determine the expected height of thewave crests and runup above the storm surge.
A transect schematic is shown in Figure 3-9. A transect location map appears on page11 of Flood County’s FIS report. This map shows where the transects were measured.
Figure 3-9. Transect schematic
Mean

Flood Studies and Maps 3-25
Underwater topography, called bathymetry, and the shapes and locations of coastalislands, headlands, estuaries, harbors, and other coastal features are also taken intoconsideration in determining flood elevations.
The official BFE is the stillwater elevation plus wave runup, or the wave crestelevation, whichever is greater. The resulting BFE can be many feet higher than thestillwater elevation.
Obstructions such as dunes or buildings break the waves, dissipating wave energy sothat wave height and BFEs are reduced as you go inland. Figure 3-9 shows that as watermoves inland, the waves break and the base flood elevation (including wave effects) isreduced while the stillwater elevation stays the same.
COASTAL HIGH HAZARD AREA
Waves pack a lot of power. Much more destructive than standing or slow-movingwater, their power increases dramatically with their height. For the purposes of the NFIP,the flood study identifies the coastal high hazard area as that most hazardous part of thecoastal floodplain, due to its exposure to wave effects. This is typically the area betweenthe shoreline and the most landward of the following points:
♦ where the computed wave heights for the base flood are three feet or more,
♦ the inland limit of the primary frontal dune, or
♦ where the eroded ground profile is three feet below the computed runup elevation.
The three-foot wave height threshold was selected because a three-foot wavegenerally carries enough energy to break a wall panel away from a floor to which it hasbeen nailed.
These areas are designated as V Zones, where the “V” stands for “velocity waveaction.” V Zones are subject to more stringent regulatory requirements and a differentflood insurance rate structure because they are exposed to an increased degree of risk.Coastal flood areas not within the coastal high hazard area are mapped as A Zones (seeFigure 3-9).

Flood Studies and Maps 3-26
COASTAL FLOODPLAIN MAP
After gathering stillwater elevation and wave height data at the transects, the coastalflood engineer then transfers the elevation data to the best available topographic map.Flood elevations between transects are interpolated, taking local topography intoconsideration.
Flood County FIRM number 99009C, Panel 0040 D, shows a coastal floodplain forthe Atlantic Ocean coastline. Note that south of Flower Street, the V Zone boundariesmeander along the shoreline, and the BFEs decrease over a relatively wide space from 14feet to 12 feet (above NGVD, or roughly sea level). Landward of the Zone VE (EL 12)boundary, the zones change to Zone AE, with BFEs decreasing from 11 feet to 10 feetNGVD. These wider flood zones are typical of gradually varying topography on barrierisland beaches or marshland.
In contrast, the V Zone boundaries between Flower Street and Public Way arenarrower and roughly parallel to the shoreline, with BFEs decreasing rapidly from 14 feetto 13 feet NGVD. Note also that the area directly landward of the Zone VE (EL 13) isdesignated Zone AO (Depth 2’), signifying shallow flooding of 2 feet NGVD or less.This situation often occurs when a substantial dune line or flood protection structureexists along the shoreline.

Flood Studies and Maps 3-27
D. SHALLOW FLOODING STUDIES
For the NFIP, shallow flooding is defined as flooding with an average depth of one tothree feet in areas where a clearly defined channel does not exist. Shallow flooding canexist in any of the following situations:
♦ Ponding: In flat areas, water collects or “ponds” in depressions.
♦ Sheet flow: In steeper areas where there are no defined channels or on flat plains,water will spread out over the land surface.
♦ Urban drainage: Local drainage problems can be caused where runoff collects inyards or swales or when storm sewers back up.
♦ Coastal flooding: Wave runup will send water inland over flat areas or overdunes. Often it may collect or pond behind an obstruction which keeps it fromdraining back into the ocean.
For the purposes of the NFIP, shallow flooding is distinguishable from riverine orcoastal flooding because it occurs in areas where there is no channel or identifiable flowpath.
Shallow flooding is mapped based on historic flood experiences and a study of thetopography. In some areas, the techniques used for riverine studies are used. The resultwill either be a BFE or a base flood depth (in feet above the ground). A shallow floodingstudy usually produces data for the base flood, but not for the 10-year or other floods.
On Flood County’s FIRM, there is a small area upstream of Argyle Way, on Panel0038, that is shown as “Zone AO (Depth 2’),” indicating that the base flood depth is twofeet above the ground. Therefore, it is a sheet flow area. Sheet flow areas (which usuallyhave depths established) are AO Zones, and ponding areas (which have BFEsestablished) are usually designated AH Zones on a FIRM.

Flood Studies and Maps 3-28
E. APPROXIMATE STUDIES
Detailed studies are expensive — a riverine study typically costs $5,000 to $10,000per mile of stream that is to be mapped — so it is not cost effective to perform a detailedstudy in watersheds where there is little or no development and none is anticipated, suchas in rural areas.
Therefore, some NFIP maps show floodplains that were mapped using approximatestudy methods. Flood data and floodplain information from a variety of sources — suchas soils mapping, actual high water profiles, aerial photographs of previous floods, andtopographic maps — were used to overlay the approximate outline of the base floodplainfor specific stream reaches on available community maps, usually U.S. GeologicalSurvey topographic quadrangle maps.
In addition, many flooding sources have been studied by other Federal, State, or localagencies. Some of these studies do not meet the NFIP standards for a FIS, but oftencontain valuable flood hazard information, which may be incorporated into the NFIPmaps as approximate studies. Those types of studies typically cover developed ordeveloping areas. They often contain flood elevation profiles that can be used as “bestavailable data” for floodplain management purposes.

Flood Studies and Maps 3-29
LEARNING CHECK #3
1. What causes storm surge?
2. What is wave runup?
3. Instead of cross sections, coastal flood engineers survey ____________ .
4. The BFEs for coastal studies are the __________ ___________ plus the ________________________________________ .
5. The most hazardous part of the coastal floodplain is the ________________________ ___________ area, which is shown on the map as a ____ Zone.
6. What differentiates shallow flooding from riverine flooding?
7. Flood studies that do not identify BFEs are called __________ ______________ .

Flood Studies and Maps 3-30
F. NFIP MAPS
This section will explain how flood hazards and flood insurance zones are depictedon NFIP maps. The Flood County, USA and Incorporated Areas maps will be referencedwherever possible. As this information is presented, look for similar types of maps ormap features on your community’s maps.
Maps published with an FIS are:
♦ The Flood Insurance Rate Map (the FIRM), which is published in an old format instudies prepared before 1986 and a new format in studies prepared after 1986.
♦ The Flood Boundary and Floodway Map (the FBFM or Floodway Map), which wasincluded in studies prepared before 1986.
Again, since 1986, the Flood Boundary and Floodway Map information has beenincorporated into the Flood Insurance Rate Map.
The maps allow you to identify SFHAs, determine the location of a specific propertyin relation to the SFHA, determine the BFE at a specific site, locate regulatoryfloodways, and identify undeveloped coastal barriers where flood insurance is notavailable.
The flood maps, particularly the FIRMs, come in many formats because of themapping of additional hazards, the need for more regional flood maps, and the increaseduse of computer generated maps. Several general features are included on all maps.
Originally, the FIRMs were designed for use by insurance agents and lenders. TheFloodway Maps were created for use by local floodplain managers and administrators.For all studies conducted since 1986, the FIRM contains both the flood insurance ratezones and floodways.
GENERAL MAP FEATURES
Flood maps are either flat or Z-fold. Flat maps are on 11-inch-by-17-inch “ledger”size paper. Z-fold maps are on larger pages and get their name from the way they arefolded.
Your student packet includes the FIRM panels for Flood County, USA andIncorporated Areas, which are Z-fold maps.
All flood maps are prepared with general features or elements that may include anindex, a legend (or key to map), a title block, community name and number information,panel or map number information, an arrow pointing north on the map, and effective dateor revision date information.
Many communities, especially counties, are geographically too large to fit on onemap or panel at a usable scale. Maps for these communities are divided into two or more
Flood Studies and Maps 3-31
panels with unique panel numbers. Whenever a community requires more than one panel,a Map Index for both the FIRM and Floodway Map is prepared.
In this section, we will discuss the Map Index, elevation reference marks, and mapscales and direction. Other map features will be presented as we discuss FIRMs andFloodway Maps.
MAP INDEX
The Map Index shows the community’s boundaries, highlighting prominent featuressuch as major highways, railroads, and streams. The map index shows how thecommunity is displayed on the various panels.
Flood County’s Map Index shows that the county’s FIRM has three panels, 0025,0038, and 0040. In cases where panels have no identified flood hazard areas (or nofloodways on a Floodway Map), they are not printed. Note that panel 0030 D was notprinted, as is indicated on the index by an asterisk (*).
The number of panels that have been printed for a particular community appears inthe title block (“Panels Printed: 25, 38, 40).
Title block
The title block is the lower right portion of the opened map for both the Map Indexand the FIRM panels. The FIRM panel title block includes:
♦ the community’s name -- Flood County, USA and Incorporated Areas,
♦ the six-digit community identification number or map number -- 99009C,
♦ the panel number, such as “0025,” “0038,” or “0040,”
♦ a map panel suffix – “D,” which indicates the number of revisions that have beenmade (e.g., “D” is the fourth publishing of that panel), and
♦ a map effective or revision date – “August 19, 1998.”
Map revision date
The date in the title block shows the map’s most recent revision. As changes occurwithin a community that result in a change in flood elevations or floodplain delineations,FEMA republishes only the Map Index and the changed map panels. Any revised panelsare given a new map revision date and a new suffix letter.
Once the panels are issued to the community, the date on the panel is referred to asthe effective date. Some communities have map panels with different effective dates. TheMap Index lists the current effective date for the most recently revised panel of a FIRMor of the FIRM itself, if all panels were revised.
With each revision comes a new panel suffix. Note that Flood County’s panels werelast revised in 1998 and have the suffix “D.”

Flood Studies and Maps 3-32
Map scales and north direction
Different scales may be used for a single community with more than one panel. As anexample, the map scale on the Flood County FIRM Panel 0038 is 1 inch = 500 feet (oneinch equals 500 feet), and the scale of panel 40 is 1 inch = 1,000 feet.
Different scales are used on FIRM and Floodway Maps, depending on the size of themapped area for a community and the base map that is used.
An arrow pointing north is shown on all maps, including the map index. For FIRMsand Floodway Maps, the north direction arrow is located near the map scale. The northdirection on the maps may be “turned” tomaximize the mapped area that can be shownon a panel and to minimize the number of panels.To ensure correct orientation and accurate use ofthe FIRM, it is very important to pay attentionto the direction of the north arrow on the panel.
Elevation reference marks
Elevation reference marks are located on FIRMs and Floodway Maps. For these twotypes of maps, locations are identified with a small “x” and the designation “ERM” or“RM” simply followed by a reference mark number. For the newer Digital FIRMs(DFIRMs), locations are identified with a small “x” and the designation “ERM” or “RM”followed by the panel number and the number of the reference mark. Descriptions of themarks, including their elevations, appear either on FIRM panels, on Floodway Maps, orin the FIS text. Note that some ERM and RM descriptions may appear on a different mappanel than the mark itself due to space limitations.
ERMs and RMs are important sites. They provide a ground elevation reference forsurveyors to start from when they determine theelevation of a building, a cross, section, ortopography for a site. Occasionally, an ERMcannot be found as described on the FIRM orFloodway Map because new construction or someother change in the area has obliterated themonument. In these instances, the nextclosest ERM may be used. Alternatively,USGS, USC&GS, or NGS bench marks, which are marked on most USGS 7.5 minuteseries topographic maps, may be used.
FIRM Zones
FIRMs show different floodplains with different zone designations. These areprimarily for insurance rating purposes, but the zone differentiation can be very helpfulfor other floodplain management purposes. The more common zones are listed in Figure3-10.

Flood Studies and Maps 3-33
Zone A The 100-year or base floodplain. There are six types of A Zones:
A The base floodplain mapped by approximate methods, i.e., BFEs arenot determined. This is often called an unnumbered A Zone or anapproximate A Zone.
A1-30 These are known as numbered A Zones (e.g., A7 or A14). This is thebase floodplain where the FIRM shows a BFE (old format).
AE The base floodplain where base flood elevations are provided. AEZones are now used on new format FIRMs instead of A1-A30 Zones.
AO The base floodplain with sheet flow, ponding, or shallow flooding.Base flood depths (feet above ground) are provided.
AH Shallow flooding base floodplain. BFEs are provided.
A99 Area to be protected from base flood by levees or Federal FloodProtection Systems under construction. BFEs are not determined.
AR The base floodplain that results from the decertification of apreviously accredited flood protection system that is in the process ofbeing restored to provide a 100-year or greater level of floodprotection.
Zone V andVE
V The coastal area subject to a velocity hazard (wave action) whereBFEs are not determined on the FIRM.
VE The coastal area subject to a velocity hazard (wave action) whereBFEs are provided on the FIRM.
Zone B andZone X(shaded)
Area of moderate flood hazard, usually the area between the limits of the 100-year and 500-year floods. B Zones are also used to designate base floodplainsof lesser hazards, such as areas protected by levees from the 100-year flood, orshallow flooding areas with average depths of less than one foot or drainageareas less than 1 square mile.
Zone C andZone X(unshaded)
Area of minimal flood hazard, usually depicted on FIRMs as above the 500-year flood level. Zone C may have ponding and local drainage problems thatdon’t warrant a detailed study or designation as base floodplain. Zone X is thearea determined to be outside the 500-year flood and protected by levee from100-year flood.
Zone D Area of undetermined but possible flood hazards.
Figure 3-10: Flood Insurance Rate Map ZonesNote that the special Flood Hazard Area (SFHA) includes only A and V Zones.

Flood Studies and Maps 3-34
FLOOD HAZARD BOUNDARY MAP (FHBM)
FHBMs (Figure 3-18) were initially prepared to provide flood maps to manycommunities in a short period of time. They were made in the 1970s and early 1980swithout benefit of detailed studies or hydraulic analyses for nearly all floodpronecommunities in the nation (over 21,000). They were intended for interim use in mostcommunities until more detailed studies could be carried out.
FHBMs are still being used where detailed Flood Insurance Studies have not beenprepared or cannot be justified. They are to be used for floodplain management, inconjunction with other local studies and other available data.
On the FHBM, the SFHA is designated as a shaded area labeled “Zone A,” and nobase flood elevations are given (see Figure 3-18).
Figure 3-18: Flood Hazard Boundary Map
In some cases, FEMA simply converted the FHBM to a FIRM by issuing a letter to thecommunity stating that the FHBM shall be considered a FIRM. In those cases, thecommunity was instructed to line out FHBM on the map’s title box and write in FIRM.
Flood Studies and Maps 3-35
FLOOD INSURANCE RATE MAP (FIRM) — OLD FORMAT (PRE1986)
The FIRM is used to generally determine:
♦ Whether a property is in the floodplain.
♦ The flood insurance zone that applies to the property.
♦ The approximate base flood elevation (BFE) at the site.
Date: Several dates may be listed in the FIRM legend, including:
♦ Initial Identification — date of the first Flood Hazard Boundary Map (FHBM).
♦ Any dates of revisions to the FHBM that have occurred since the initialidentification.
♦ Flood Insurance Rate Map Effective — the date of the initial or first FIRM. Thisis the date used to determine whether a building is “pre-FIRM” or “post-FIRM.”
♦ Flood Insurance Rate Map Revisions — dates of subsequent revisions to theFIRM.
The FIRM also will show:
Base (100-year) floodplain or SFHA: Designated by the dark-shaded areas(Insurance Zones A, A1–A30, A99, AO, AH, AR, V, V1–V30).
500-year floodplain: Designated by the lighter-shaded areas (Insurance Zone B).
Base Flood Elevation (BFE): The water surface elevation of the base flood at thatpoint of the stream is denoted in whole numbers by wavy lines running across thefloodplain. Coastal Zones within the area of 100-year tidal flooding, as well as some AHZones, may have BFE lines, and some lake AE Zones have the base flood elevation notedin parentheses beneath the zone designations.
Zone break line: The thin white line separates flood insurance rate zones within the100-year floodplain.
Approximate floodplain areas: The 100-year floodplain areas are delineated usingapproximate methods. No BFEs are shown in approximate floodplain areas; these areasare classified as (unnumbered) A Zones.
An example of an approximate floodplain may be found in the upper left corner ofFlood County FIRM Panel 0040, on Rocky River. The detailed study does not extendupstream of cross section K. Note that there are no cross sections or BFEs shown in thisA Zone, which extends onto Panel 0025.

Flood Studies and Maps 3-36
FLOOD BOUNDARY AND FLOODWAY MAP (FLOODWAY MAP) –OLD FORMAT (PRE 1986)
The Flood Boundary and Floodway Map is also known as the FBFM or, simply, theFloodway Map. The Floodway Map shows how the floodplain is divided into thefloodway and flood fringe where streams are studied in detail. They also show generalfloodplain areas where floodplains have been studied by approximate methods.
Floodway Maps have these features:
Title block: Includes the community name, county name, panel number, communitynumber, and the map date. The panel numbers may be different from the FIRM panelnumbers.
Map scale: The Floodway Map may have the same or a different scale than theFIRM for the same community.
Cross section line: These lines represent the location of some of the surveyed crosssections used in the computer model of the stream for calculating 100-year floodelevations. These cross sections can be used to relate a specific point on the FloodwayMap to the flood profile and floodway data table.
Floodway: The 100-yearfloodplain has been divided into twoareas, the floodway and the floodfringe. The white area adjacent toand including the channel is thefloodway. The shaded area is thefringe.
One problem with this methodof delineating floodways is thatsometimes people confuse the whitefloodway with the white arearepresenting land that is free fromflooding. Also, because thefloodway is mapped separately,often property owners, lenders, real estate agents, and others do not have easy access tothe Floodway Maps and do not know of the severe flood hazard associated with thefloodway.
FISs published since 1986 have corrected this problem — they do not have separateFIRM and Floodway Maps. Floodways are delineated on the newer FIRMs as adiagonally hatched area (see Figures 3-11 and 3-12).
Note that no BFEs or flood zone names are shown on the Floodway Map.
The floodway is usually wider in flatter, wider floodplains and narrower in steeperareas where floodplains are narrower.

Flood Studies and Maps 3-37
If a map panel area does not include any detailed study streams or floodways, aFloodway Map will not be printed; only a FIRM panel will be printed. Because coastalstudies do not have floodways, all of the data needed are shown in the FIS report and onthe FIRM.
Flood fringe: The fringe is shown as a shaded area outside of the floodway but stillwithin the 100-year floodplain.
500-year floodplain: More lightly shaded areas adjacent to, but outside of, the 100-year floodplain delineate the 500-year floodplain for streams studied in detail.
Approximate floodplain areas: The 100-year floodplain areas are determined usingapproximate methods. The boundaries of the approximate floodplain on the FloodwayMap are shown as dashed lines.
FLOOD INSURANCE RATE MAP — NEW FORMAT (SINCE 1986)
Flood maps have been redesigned over the years since the first FISs were prepared inthe late 1960s, making them easier to use. A new format for FIRMs was introduced in1986 that includes:
♦ Floodways and other floodplain management information, such as cross sections, thatwere previously provided on separate Flood Boundary and Floodway Maps(Floodway Maps). (Except in a few instances, Floodway Maps are no longer beingprepared.)
♦ Simplified flood insurance zone designations. The previous Zones A1-A30 and V1-V30 were replaced by the designations AE and VE; Zones B and C were replaced byZone X. The 500-year floodplain is still shown as “shaded” portions of Zone X.
Figure 3-11 shows the legend for the new FIRM format. Figure 3-12 is an example ofa new format FIRM with a floodway. With these changes, the FIRMs are more easilyused by community officials for floodplain management, by lenders to determine theneed for flood insurance, by insurance agents to rate policy applications, and by landsurveyors, engineers, property owners and others to determine flood hazards in a givenlocation. The Flood County, USA and Incorporated Areas map uses the newer format.

Flood Studies and Maps 3-38
Figure 3-11: New format FIRM legend
Flood Studies and Maps 3-39
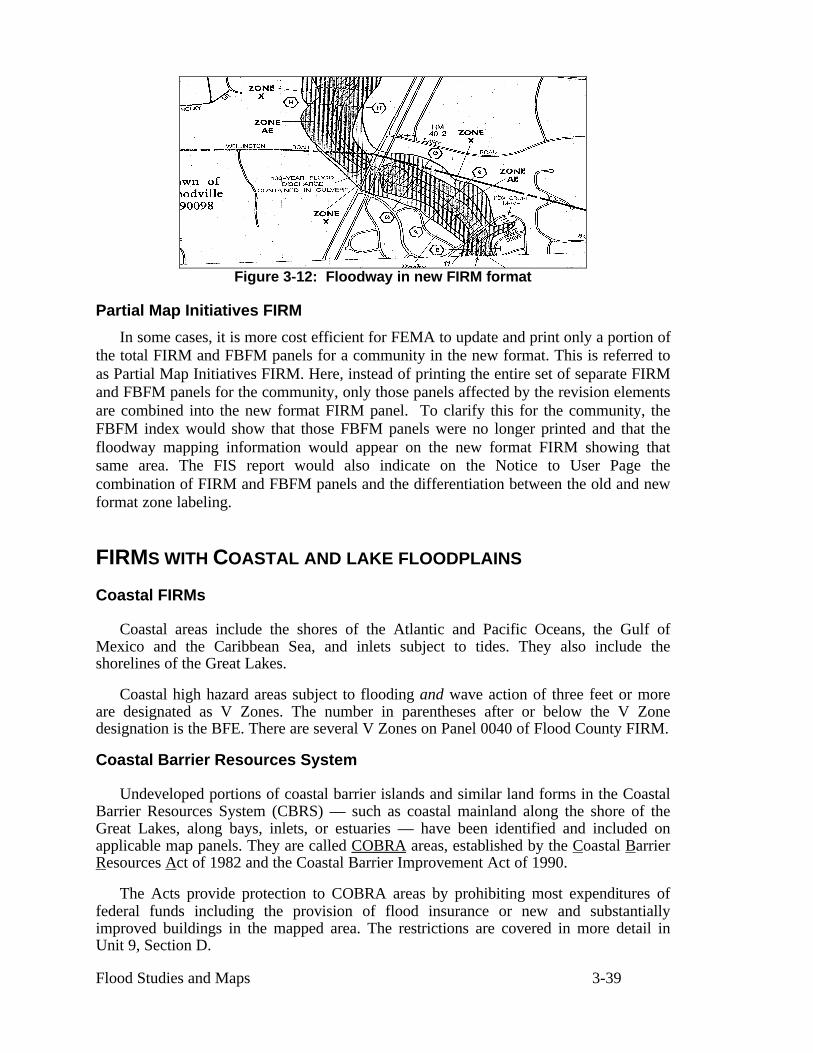
Figure 3-12: Floodway in new FIRM format
Partial Map Initiatives FIRM
In some cases, it is more cost efficient for FEMA to update and print only a portion ofthe total FIRM and FBFM panels for a community in the new format. This is referred toas Partial Map Initiatives FIRM. Here, instead of printing the entire set of separate FIRMand FBFM panels for the community, only those panels affected by the revision elementsare combined into the new format FIRM panel. To clarify this for the community, theFBFM index would show that those FBFM panels were no longer printed and that thefloodway mapping information would appear on the new format FIRM showing thatsame area. The FIS report would also indicate on the Notice to User Page thecombination of FIRM and FBFM panels and the differentiation between the old and newformat zone labeling.
FIRMS WITH COASTAL AND LAKE FLOODPLAINS
Coastal FIRMs
Coastal areas include the shores of the Atlantic and Pacific Oceans, the Gulf ofMexico and the Caribbean Sea, and inlets subject to tides. They also include theshorelines of the Great Lakes.
Coastal high hazard areas subject to flooding and wave action of three feet or moreare designated as V Zones. The number in parentheses after or below the V Zonedesignation is the BFE. There are several V Zones on Panel 0040 of Flood County FIRM.
Coastal Barrier Resources System
Undeveloped portions of coastal barrier islands and similar land forms in the CoastalBarrier Resources System (CBRS) — such as coastal mainland along the shore of theGreat Lakes, along bays, inlets, or estuaries — have been identified and included onapplicable map panels. They are called COBRA areas, established by the Coastal BarrierResources Act of 1982 and the Coastal Barrier Improvement Act of 1990.
The Acts provide protection to COBRA areas by prohibiting most expenditures offederal funds including the provision of flood insurance or new and substantiallyimproved buildings in the mapped area. The restrictions are covered in more detail inUnit 9, Section D.

Flood Studies and Maps 3-40
The designations for these undeveloped coastal barriers depend on when they weredesignated by the acts; therefore, not all COBRA areas have the same date of designation.Examples of the three different screens used on the FIRM are shown in the legend forFlood County FIRM Panel 0040. The prohibition date is indicated for each COBRA zoneon the FIRM. It should be noted that although FEMA shows COBRA areas on its FIRMs,only Congress can authorize a revision to their boundaries.
Flood County has an extensive COBRA area, which appears on FIRM Panels 0038and 0040. Note that the designation and delineation of CBRS units are not directly relatedto the floodplain.
Lakes
Most lakes have a BFE, shown in parentheses below the flood zone, that has beenrounded off to the nearest whole number (see Figure 3-13). The actual BFE, to thenearest tenth of a foot, can be obtained from the FIS report. However, many long lakes,especially reservoirs, have a higher BFE at the upstream end than at the outfall. Thesetypes of lakes and reservoirs have BFEs shown with wavy lines, the same as riverineBFEs. They also appear on the stream profiles in the FIS report.
Figure 3-13: FIRM with lake floodplainWhere studies have been carried out for lakes and reservoirs, information on BFEs is
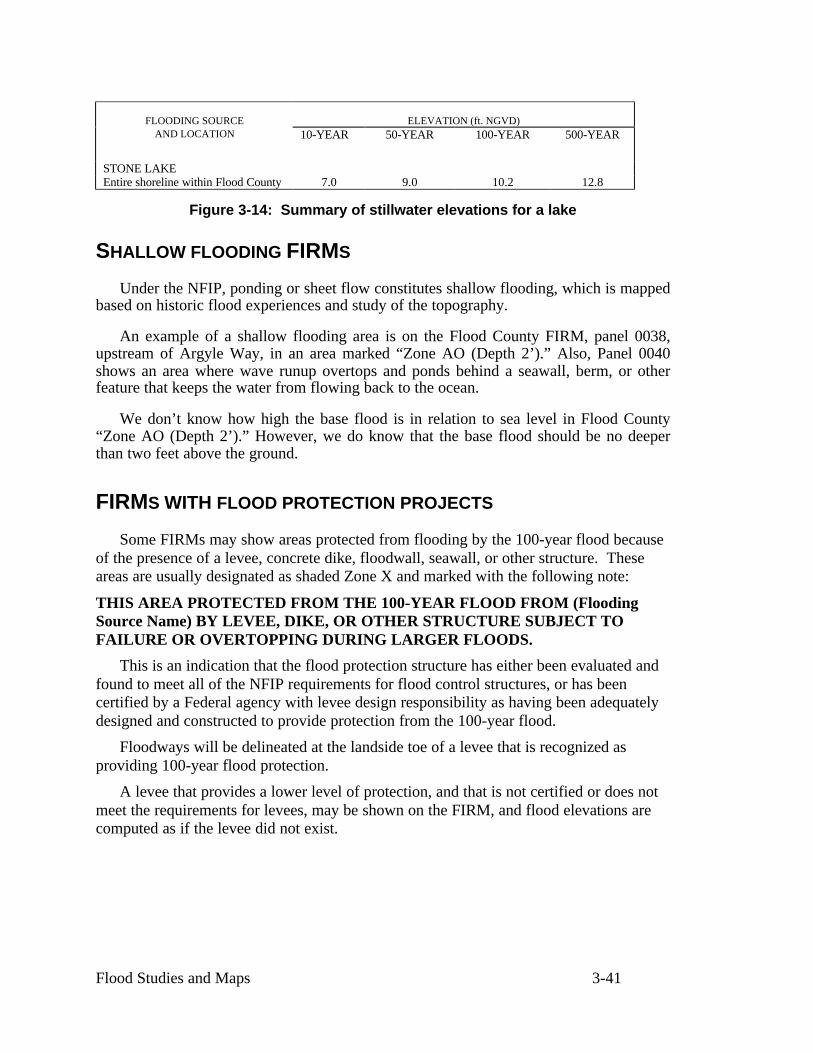
contained in Section 3.0 of the FIS report. A Summary of Stillwater Elevations table isprovided in the FIS report (Figure 3-14). Note that the actual BFEs to the nearest one-tenth of a foot appear in the table, but the BFE on the FIRM is shown in parenthesesrounded to the nearest whole number. For the most accurate BFE, use the “100-year floodelevation” from the table, not the FIRM. For a shortcut method, you can add 0.4 foot tothe elevation shown on the FIRM. This will get you an elevation at least as high as thenumber shown in the table.
Flood Studies and Maps 3-41
FLOODING SOURCE ELEVATION (ft. NGVD)AND LOCATION 10-YEAR 50-YEAR 100-YEAR 500-YEAR
STONE LAKEEntire shoreline within Flood County 7.0 9.0 10.2 12.8
Figure 3-14: Summary of stillwater elevations for a lake
SHALLOW FLOODING FIRMS
Under the NFIP, ponding or sheet flow constitutes shallow flooding, which is mappedbased on historic flood experiences and study of the topography.
An example of a shallow flooding area is on the Flood County FIRM, panel 0038,upstream of Argyle Way, in an area marked “Zone AO (Depth 2’).” Also, Panel 0040shows an area where wave runup overtops and ponds behind a seawall, berm, or otherfeature that keeps the water from flowing back to the ocean.
We don’t know how high the base flood is in relation to sea level in Flood County“Zone AO (Depth 2’).” However, we do know that the base flood should be no deeperthan two feet above the ground.
FIRMS WITH FLOOD PROTECTION PROJECTS
Some FIRMs may show areas protected from flooding by the 100-year flood becauseof the presence of a levee, concrete dike, floodwall, seawall, or other structure. Theseareas are usually designated as shaded Zone X and marked with the following note:
THIS AREA PROTECTED FROM THE 100-YEAR FLOOD FROM (FloodingSource Name) BY LEVEE, DIKE, OR OTHER STRUCTURE SUBJECT TOFAILURE OR OVERTOPPING DURING LARGER FLOODS.
This is an indication that the flood protection structure has either been evaluated andfound to meet all of the NFIP requirements for flood control structures, or has beencertified by a Federal agency with levee design responsibility as having been adequatelydesigned and constructed to provide protection from the 100-year flood.
Floodways will be delineated at the landside toe of a levee that is recognized asproviding 100-year flood protection.
A levee that provides a lower level of protection, and that is not certified or does notmeet the requirements for levees, may be shown on the FIRM, and flood elevations arecomputed as if the levee did not exist.

Flood Studies and Maps 3-42
COUNTYWIDE FIRMS
The Flood County FIS report and FIRM covers the unincorporated areas of FloodCounty and all incorporated areas within Flood County. Therefore, it is referred to as acountywide FIRM. Countywide FIRMs show flood hazard information for all geographicareas of the county, including other jurisdictions such as villages, towns, and cities.
Previously, FHBM, FIRM and FBFM maps were prepared separately for eachjurisdiction. County FIRMs, for example, showed the flood hazards identified only in theunincorporated areas of the county and did not show any flood information inside thecorporate limits of a municipality. In countywide mapping, once the countywide map isproduced, all of the identified flood hazard areas within the boundaries of the county areshown on one set of maps along with all floodway information maps (see section titledFlood Insurance Rate Map—New Format).
The countywide FIRM format has a number of advantages, and one in particular isthat the user can see the relationship and simultaneous effect of each floodplain on anumber of communities. In addition, FIRMs do not need to be updated when municipalboundaries change. Although boundaries might change, communities will continue tofind the flood hazard information they need on the same countywide FIRM.
Figure 3-15 shows the title block of a countywide FIRM panel. The title block liststhe communities mapped on that panel and their six-digit NFIP community ID numbers.The FIRM panel has a map number with five digits consisting of the NFIP-assigned statenumber as the first two digits and the NFIP-assigned county number as the next threedigits followed by the letter “C,” which stands for “countywide,” and then the four digitpanel number and suffix. Do not confuse the map panel number with the communitynumber.
All previous map dates for each floodprone community in a countywide FIS arelocated on the community map history Table (Figure ).The initial FIRM date for eachcommunity is shown on the FIRM index. These are the “post-FIRM” dates for insurancerating. Don’t confuse them with the effective date of the latest FIRM panel, which isshown in the title block.

Flood Studies and Maps 3-43
Figure 3-15: Title block of countywide FIRM panel

Flood Studies and Maps 3-44
DIGITAL FIRMS
The conversion of FIRMs to a digital format has many benefits. For example, theycan be revised and updated easily with just a few keystrokes, and they can beincorporated in the community’s mapping system and tied in with other geographicinformation systems, such as the zoning map.
Users must bear in mind that the simple conversion of FIRMs to a digital format doesnot inherently improve the engineering quality of the product. Many of the samedifficulties with interpretation of flood risk data — and the requirement that users applysound judgment in methods selected for decision making and map interpretation —remain unchanged.
FEMA charges a fee for all digital FIRM data products. Any questions regardingthese products may be directed to:
Federal Emergency Management AgencyMap Service CenterP.O. Box 1038Jessup, Maryland 20794-1038
Phone: 800/358-9616Fax: 800/358-9620Internet: http://www.fema.gov
Digital Flood Insurance Rate Map (DFIRM)
The FIRM for Flood County, USA andIncorporated Areas is actually a DigitalFlood Insurance Rate Map, or DFIRM. Thisis because it is a more recent publication,created with new digital methods; however,whether the maps are new DFIRMs orconventional FIRMs, they are still generallyreferred to as FIRMs. The DFIRM iscomprised of all digital data required tocreate the hardcopy FIRM. These datainclude base map information, graphics, text,shading, and other geographic and graphicdata. An example of a hardcopy paperDFIRM is shown in Figure 3-16.
Figure 3-16: Hardcopy DFIRM

Flood Studies and Maps 3-45
The majority of DFIRMs are produced in a countywide format, where all floodhazards for the county and incorporated communities are shown on one set of maps. Itcan be used for floodplain management purposes in a manner similar to other flood maps,but it can also be combined with other digital map information to create new informationfor planning purposes. DFIRMs are also produced for single jurisdictions whenproducing a countywide map would not be cost effective.
DFIRMs are subject to community review and approval. They are, therefore, theofficial basis for implementing the community’s NFIP regulations. This, in essence, canbe said of all FIRMS.
Digital Flood Insurance Rate Map – Digital Line Graph
The Digital Flood Insurance Rate Map - Digital Line Graph (DFIRM-DLG) isintended to be the primary means of transferring flood-risk data depicted on FIRMs toGeographic Information Systems (GIS). GISs are computer-based map systems thatallow the user to keep a map updated easily and to correlate geographic information withother data, such as tax records on properties.
The Digital Flood Insurance Rate Map - Digital Line Graph (DFIRM-DLG) is adatabase created by extractingcertain flood risk data from theDFIRM. The DFIRM-DLG doesnot include base mapinformation, nor does it includegraphic data required to create ahardcopy FIRM.
Communities whose digitalbase mapping files were used asthe base map for the DFIRM willfind that they may easily use theDFIRM-DLG files fordetermination of flood zones andfor enforcement of regulations. Agraphic image of a DFIRM-DLGis shown in Figure 3-17.
The digital data capturedfrom the hardcopy DFIRMconsists of FEMA hydrography(location of water bodies), floodhazard zones, BFEs, cross-section locations, and elevation referencemarks.
Figure 3-17: Graphic image of aDFIRM-DLG
Flood Studies and Maps 3-46
All lines and area features in DLG files are encoded with one or more seven-digitattribute codes that provide the user with detailed information about the features. FEMAintends to make the DFIRM-DLG available on CD-ROM compatible with InsuranceServices Office (ISO) 9660 standards.
With many commercially available GIS software packages, DLG data can be directlyconverted into vector data usable within the GIS environment. Third-party conversionsoftware is also available that will convert DLG data to other proprietary GIS formats.
The DFIRM-DLG, when coupled with digital base map files or the local communitydigital base, can be used in a GIS to determine whether a structure is located within anSFHA. It should be noted that if a GIS is used to determine that a structure is within ornear an SFHA, and a different base map source was used to generate the hardcopyDFIRM, the determination should be confirmed by referencing the printed hardcopyDFIRM.
Q3 Flood Data
In the Q3 Flood Data Product, FEMA has developed a graphical representation ofcertain features of the FIRM. The Q3 Flood Data are in three formats that are usable withdesktop mapping and GIS software packages. These formats are:
♦ Digital Line Graph
♦ ARC/INFO
♦ MapInfo
Q3 Flood Data are created by digitally capturing certain key features from the currenteffective paper FIRMs. These features are converted into area features in one countywidedata layer. The following vectorized (lines and areas) data features are included:
♦ SFHA and 500-year floodplain,
♦ Flood insurance zone designations,
♦ Floodway boundaries (if available),
♦ COBRA zones,
♦ Political boundaries,
♦ Community/map panel identification numbers,
♦ Boundaries between FIRM panels, and
♦ U.S. Geological Survey 7.5 minute (1:24,000 scale) quadrangle neatlines.
Several features are not included. They are:
♦ Hydrographic features,
♦ Base flood elevations,
Flood Studies and Maps 3-47
♦ Cross section lines,
♦ Roads, road names or address ranges, and
♦ Elevation reference mark locations and elevations.
Q3s were developed to support insurance-related activities and are designed toprovide guidance and a general proximity of the location of SFHAs. Unlike DFIRMs,Q3s do not replace paper FIRMs as the legal document.
The data are not suitable for applications such as detailed site design anddevelopment plans or flood risk determinations. They cannot be used to determineabsolute delineations of floodplain boundaries, but instead should be seen as portrayingzones of uncertainty and possible risks associated with flooding.
Q3 Flood Data incorporate map revisions and letters of map revision and amendment.However, they do not correct for edge-matching errors, overlaps, etc., that were in theoriginal paper FIRMs.
FEMA has produced Q3s for almost 900 counties nationwide. They are organized bycounty and contain data from all existing paper FIRM panels for the incorporated andunincorporated areas of the county.
Q3 Flood Data are available on CD-ROM from the FEMA Map Service Center. Youcan access the list of Q3 counties on the Internet and download sample data, datastandards, and other Q3 information (http://www.fema.gov).

Flood Studies and Maps 3-48
LEARNING CHECK #4
1. Prior to 1986, the maps published with an FIS were the ___________ and the___________ .
2. Since 1986, the map published with an FIS is the ________________.
3. Is your community’s FIRM a flat or Z-fold map?
4. How many panels does your FIRM have?
5. What is the map scale of your FIRM?
6. What does an elevation reference mark look like on a FIRM?
7. What is an AO Zone?
8. What is the FIRM effective date for your community?
9. How is a floodway shown on the Flood Boundary and Floodway Map?
10. How is a floodway shown on the new format FIRM?
11. A Zone C on an old format FIRM is shown as a Zone ____ on the new format FIRM.
12. COBRA stands for ______________ ______________ ____________________________ .
13. What communities’ floodplains are shown on a countywide FIRM?

Flood Studies and Maps 3-49
14. Floodways are shown along the ______________ toe of a levee on the FIRM.
15 Areas behind recognized levees are designated as _____________ ______________.

Flood Studies and Maps 3-50
UNIT LEARNING EXERCISE
1. The base flood elevation is the elevation of the ____ - year flood or the ___ % annualchance flood.
2. The Special Flood Hazard Area or SFHA is what the ______________ floodplain iscalled on FEMA maps.
3. The SFHA is shown on a FIRM as a Zone that begins with the letter ___ or ___ .
4. What are the components of a Flood Insurance Study?
5. List three things that a FIRM is used to determine.
6. _________________ is the study of a watershed’s behavior during and after a storm.
7. Surveyors reference elevation to a common ______________ .
8. Most permanent FIS elevation reference marks are referenced to what datum?
9. A hydraulic study uses the hydrology, cross section information, and streamcharacteristics to determine the flood ______________ .
12. Cross sections are shown on which map?
13. Flood profiles are used to determine what?

Flood Studies and Maps 3-51
14. In riverine situations, the floodplain is divided into two separate parts for floodplainmanagement purposes. These parts are the _____________ and the_______________.
15. Based on the minimum NFIP standard, if the flood fringe were completely filled, howhigh could the base flood elevation go up?
16. What FIRM zone has wave heights greater than three feet?
17. Instead of using a base flood elevation, some shallow flooding areas are defined usinga base flood _________ .
18. An approximate study shows the base ____________________ but does not show thebase flood ______________ .
19. How many digits are there in the NFIP community identification number?
20. What is an AH Zone?
21. What was the problem with the way the floodway was shown on the old format FloodBoundary and Floodway Maps?
22. The new format FIRMs include:
a. ____________________________________________________
b .____________________________________________________
23. Do Q3 Flood Data show base flood elevations if they are available?

Flood Studies and Maps 3-52
ANSWERS TO THE LEARNING CHECKS
Learning Check #1
1. As directed by the National Flood Insurance Act of 1968, FEMA conducts floodstudies in order to determine __________________________ and___________________ .
floodprone areas and flood risk zones
2. The base flood is a flood that has a ____________________ of occurring in anyyear.
one percent chance
3. The base flood is also called the ________ - year flood.
100-year
4. Answer the following questions (circle T for True and F for False):
A 100-year flood will occur only once every 100 years. T F
A 100-year flood could occur two times in one year. T F
The 100-year flood might not occur in a 200-year period. T F
The base flood could occur two consecutive years in a row. T F
F T T T
5. On NFIP maps, the 100-year floodplain is called the __________________________ ____________ ___________ .
Special Flood Hazard Area
6. BFE is the acronym for __________ __________ _____________ .
base flood elevation
7. What are the components of a Flood Insurance Study?
The FIS — Flood Insurance Study report
The FIRM — Flood Insurance Rate Map
The Flood Boundary and Floodway Map, which is included in studies preparedbefore 1986 (Since 1986, floodways are shown on the FIRM)

Flood Studies and Maps 3-53
Learning Check #2
1. For purposes of a riverine flood study, ________________ is the study of thedistribution and circulation of water in the environment, and _____________ is thestudy of fluids in motion and how water will flow through the channel.
Hydrology, hydraulics
2. The rate at which runoff flows downstream is called the flood ______________ .
discharge
3. What probable effect does increase in urbanization within a community or upstreamof it have on the stream discharges within that community?
Stream discharges usually will increase as a consequence to the increase inurbanization within a community or upstream of it.
4. What consequence on flood water level of a stream would usually occur when abridge is constructed over a stream?
A hydraulic analysis is always required to determine the effect of any bridgeconstruction over a stream. However, construction over a stream is considered anobstruction to the flow and therefore may increase the flood water level upstream ofthe construction.
5. To locate the true elevations at a site, surveyors have established ______________________________ marks also known as _______________ marks.
elevation reference, bench
6. Cross sections describe the of the floodplain.
shape
7. What is the datum used for your community’s flood insurance study, FIRM, andprofiles?
Depends on the community. Check the Legend or Key to your FIRM.
8. Flood profiles are developed by plotting the flood elevations at the __________________________ and connecting the plotted points.
cross sections
9. To make a floodplain map, the base flood elevations are plotted on a _____________map or a _____________ map.
topographic or contour
10. The ______________ is defined as the stream channel and that portion of theadjacent floodplain that must remain open to permit passage of the base flood.
floodway
11. A floodway analysis conducted to the minimum NFIP standard allows the fringe to beobstructed until the base flood level is increased by how much?
one foot

Flood Studies and Maps 3-54
Learning Check #3
1. What causes storm surge?
Storms that bring air pressure changes and strong winds that “pile” water up againstthe shore
2. What is wave runup?
When waves hit the shore, water moves with such force that it keeps traveling inlandhigher than the stillwater flood level.
3. Instead of cross sections, coastal flood engineers survey ____________ .
transects
4. The BFEs for coastal studies are the __________ ___________ plus the ____________________ .
stillwater elevations, wave runup
5. The most hazardous part of the coastal floodplain is the ________________________ ___________ area, which is shown on the map as a ____ Zone.
coastal high hazard, V
6. What differentiates shallow flooding from riverine flooding?
Shallow flooding is distinguishable from riverine or coastal flooding because itoccurs in areas where there is no channel or identifiable flow path.
7. Flood studies that do not identify BFEs are called __________ ______________ .
approximate studies

Flood Studies and Maps 3-55
Learning Check #4
1. Prior to 1986, the maps published with an FIS are the ___________ and the___________ .
old format FIRM, FBFM or Floodway Map
2. Since 1986, the map published with an FIS is the _________________ .
new format FIRM
3. Is your community’s FIRM a flat or Z-fold map?
Depends on the community.
4. How many panels does your FIRM have?
Depends on the community.
5. What is the map scale of your FIRM?
Depends on the community.
6. What does an elevation reference mark look like on a FIRM?
Locations are identified with a small “x” and the designation “ERM” or “RM”followed by a number.
7. What is an AO Zone?
The area subject to sheet flow, ponding, or shallow flooding.
8. What is the FIRM effective date for your community?
Depends on the community. This is the date of the first FIRM for your community. Itis an important date to know as it determines whether buildings are considered pre-FIRM or post-FIRM. If you are unsure of the date, contact your FEMA RegionalOffice or State NFIP Coordinator.
9. How is a floodway shown on the Flood Boundary and Floodway Map?
It’s the white area adjacent to and including the channel.
10. How is a floodway shown on the new format FIRM?
It is a shaded area with diagonal lines.
11. A Zone C on an old format FIRM is shown as a Zone ____ on the new format FIRM.
Zone X

Flood Studies and Maps 3-56
12. COBRA stands for ______________ ______________ ____________________________ .
Coastal Barriers Resources Act
13. What communities’ floodplains are shown on a countywide FIRM?
All the communities in the county, even those currently not in the NFIP.
14. Floodways are shown along the ____________ toe of a levee on the Firm.
landside
15. Areas behind recognized levees are designated as ____________ ___________.
Shaded Zone X

Flood Studies and Maps 3-57
Unit Learning Exercise
1. The base flood elevation is the elevation of the ____ - year flood or the ___ % annualchance flood.
100, 1
2. The Special Flood Hazard Area or SFHA is how the ______________ floodplain isshown on FEMA maps.
base flood
3. The SFHA is shown on a FIRM as a Zone that begins with the letter ___ or ___ .
A or V
4. What are the components of a Flood Insurance Study?
— Flood Insurance Study report
— Flood Insurance Rate Map
— Flood Boundary and Floodway Map for studies conducted prior to 1986. Instudies conducted since 1986, the floodway data are shown on the FIRM andthere is no separate Flood Boundary and Floodway Map.
5. List three things that a FIRM is used to determine.
— Whether a property is in the floodplain
— The flood insurance zone that applies to a property
— The approximate BFE at a site
6. _____________ is the study of a watershed’s behavior during and after a storm.
hydrology
7. Surveyors reference elevation to a common ______________ .
datum
8. Most permanent FIS elevation reference marks are referenced to what datum?
National Geodetic Vertical Datum or NGVD
9. A hydraulic study uses the hydrology, cross-section information, and streamcharacteristics to determine the flood ______________ .
elevations (also velocities and floodplain widths)

Flood Studies and Maps 3-58
10. Cross sections are shown on which map?
Floodway Map
New format FIRM
11. Flood profiles are used to determine what?
Flood elevations along a river or a stream between cross sections
12. In riverine situations, the floodplain is divided into two separate parts for floodplainmanagement purposes. These parts are the _____________ and the_______________.
floodway, flood fringe
13. Based on the minimum NFIP standard, if the flood fringe were completely filled, howhigh could the base flood elevation go up?
one foot
16. What FIRM zone has wave heights greater than three feet?
V Zone
17. Instead of using a base flood elevation, some shallow flooding areas are defined usinga base flood _________ .
depth
18. An approximate study shows the base ____________________ but does not show thebase flood ______________ .
Floodplain, elevation
19. How many digits are there in the NFIP community identification number?
They always have six digits. This is important to avoid confusion with the five-digitcountywide FIRM Number. The community identification number does not include thepanel number and other numbers that appear near it on the FIRM title block.
20. What is an AH Zone?
Shallow flooding base floodplain with base flood elevations.
21. What was the problem with the way the floodway was shown on the old format FloodBoundary and Floodway Maps?
The white area looked like it was a C Zone outside the floodplain. Also, people whohad only a FIRM did not know of the floodway hazard.

Flood Studies and Maps 3-59
22. The new format FIRMs include:
a. floodways and floodplain management information
b. simplified flood insurance zones
23. Do Q3 Flood Data show base flood elevations if they are available?
No. They are designed primarily to determine if a property is in or out of the SFHA.