Embed Size (px)
Citation preview
Technical Note No. 34 August 23, 1939
OUTLINE FOR COMPILING PRECIPITATION AND RUNOFF DATA.FROM SMALL DRAINAGE AREAS. '.',' . .., ..
Prepared by the
Division of Forest Influences
C. R. Hursh, In Charge
U. S. Department of AgricultureForest Service
Appalachian Forest Experiment StationR. E. McArdle, Director
Asheville, N. C.
CONTENTSPage
Foreword 1
Standard rain gage records 3
Record of weighted mean precipitation on an individualdrainage basin 6
Recording rain gage record ..... 10
Precipitation intensity record • ... 19
Weighted precipitation intensity record . . ........ 25
Record of runoff . . , . * . . . ; . . . • • 35
Drainage discharge data . 48
Summary of precipitation, and. runoff by storms . 54
Plates
1. Rain gage service areas 7(Drainage No. 7)
2. Mass rainfall curve 14(Drainage No. 7)
3. Recording rain gage service areas 29(Drainage Mo. 8)
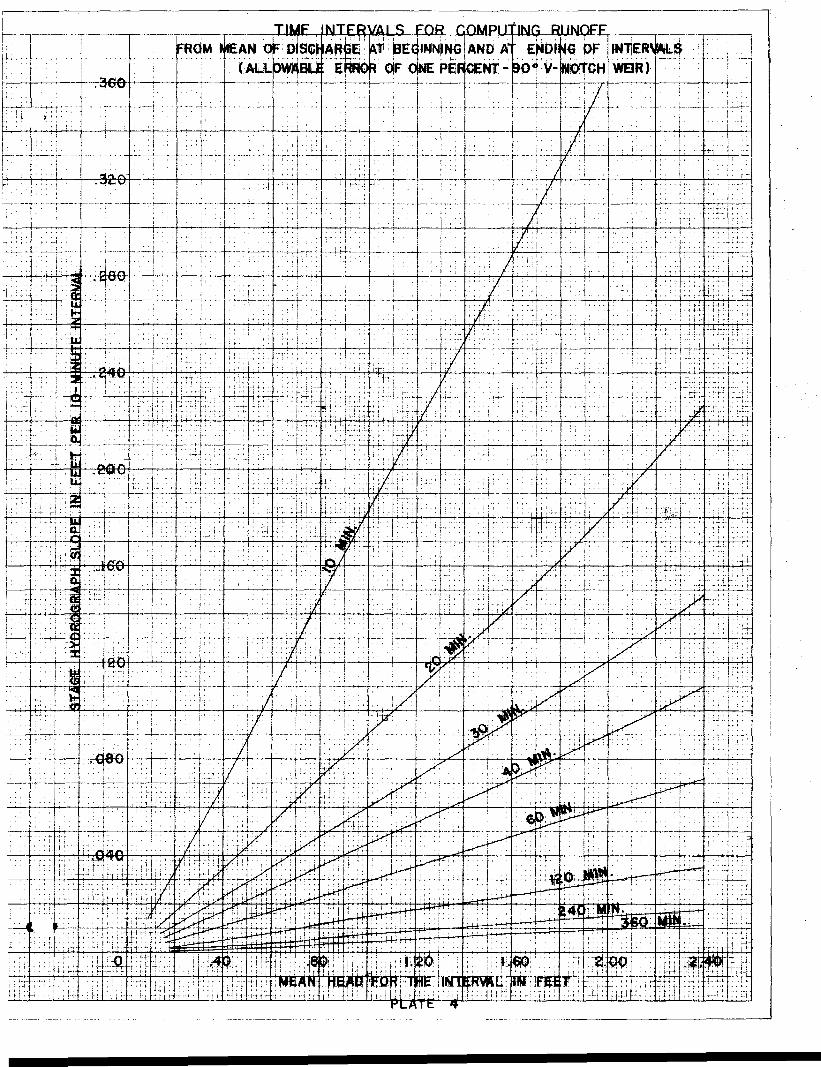
4. Time interval for computing runoff from mean ofdischarge at beginning and at ending ofintervals . . . . . 40(Allowable error of one percent - 90° "-notch weir)
5- Stage hydrograph 4!(Drainage No. 7)
6. 1936 stream hydrograph 49(Drainage No. 7)
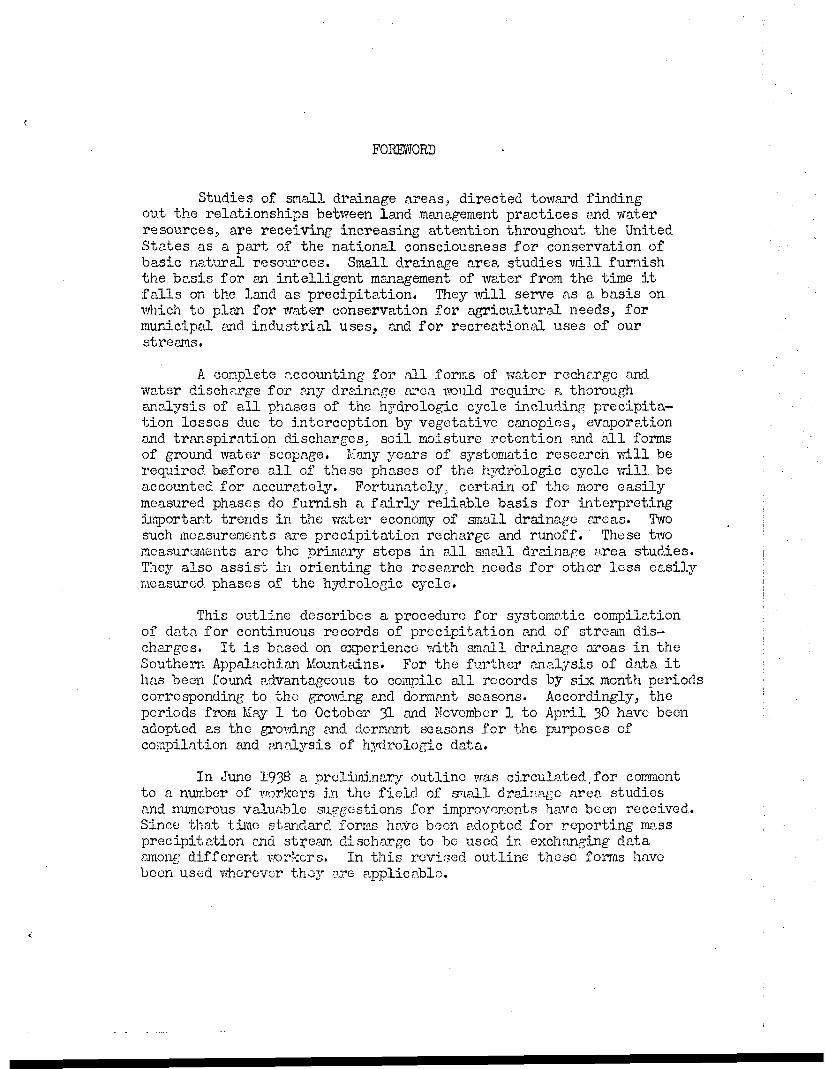
FOREWORD
Studies of small drainage areas., directed toward findingout the relationships between land management practices and waterresources;, are receiving increasing attention throughout the UnitedStates as a part of the national consciousness for conservation ofbasic natural resources. Small drainage area studies will furnishthe basis for an intelligent management of water from the time itfalls on the land as precipitation. They will serve as a basis onwhich to plan for water conservation for agricultural needs, formunicipal and. industrial uses, and for recreational uses of ourstreams.
A complete accounting for all forms of water rechrrgc andwater discharge for any drainage area would require a thoroughanalysis of all phases of the hydrologic cycle including precipita-tion losses due to interception by vegetative canopies, evaporationand transpiration discharges,; soil moisture retention and all formsof ground water seepage. Many years of systematic research will berequired before all of these phases of the hydralogic cycle will beaccounted, for accurately. Fortunately, certain of the more easilymeasured phases do furnish a fairly reliable basis for interpretingimportant trends in the water economy of small drainage areas. Twosuch measurements are precipitation recharge and runoff. These twomeasurements are the primary steps in all small drainage area studies.They also assist in orienting the research needs for other less easilymeasured phases of the hydrologic cycle.
This outline describes a procedure for systematic compilationof data for continuous records of precipitation and of stream dis-charges. It is based on experience with small drainage areas in theSouthern Appalachian Mountains. For the further analysis of, data ithas been found advantageous to compile all records by six month periodscorresponding to the growing and dormant seasons. Accordingly, theperiods from May 1 to October 31 and November 1 to April 30 have beenadopted as the growing and dormant seasons for the purposes ofcompilation and analysis of hjtirologic data.
In June 1938 a preliminary outline was circulated.for commentto a number of workers in the field of small drainage area studiesand numerous valuable suggestions for improvements have been received.Since that time standard forms have been adopted for reporting massprecipitation and stream discharge to be used in exchanging dataamong different workers. In this revised outline these forms havebeen used wherever they are applicable.
Certain procedures discussed in the first issue of theoutline, for example, that of determining infiltration-fromobserved storms by use of the "rainfall excess" method, ivhichmore nearly fall under the heading of data analysis thancompilation, have been deleted. Such procedures can be more..adequately treated under a special outline for the analysis ofhydrological data for small drainage areas.
The preliminary outline was assembled by L. K. Hill,Associate Civil Engineer, and K« A. MacKichan, Junior HydraulicEngineer. The present revision has been made largely by R. A.Hertzler, Assistant Hydraulic Engineer, and Miss Inez Willoughby,Junior Statistical Clerk* Important suggestions as to the form .of the present.outline have also been made by H. J. LougheadjAssociate Conservationist, and E. F* Brater, Assistant HydraulicEngineer.
Actually, the outline represents the efforts of both fieldand office staff of the Division of Forest Influences at theAppalachian Forest Experiment Station, for without continuousfield records such an outline could not have been developed.
C.'R. HURSH,Senior Forest Ecologist.
Note: Assistance in the preparation of these materials wasfurnished by the personnel of Works Progress AdministrationOfficial Project No. 701-3-21.
—2—
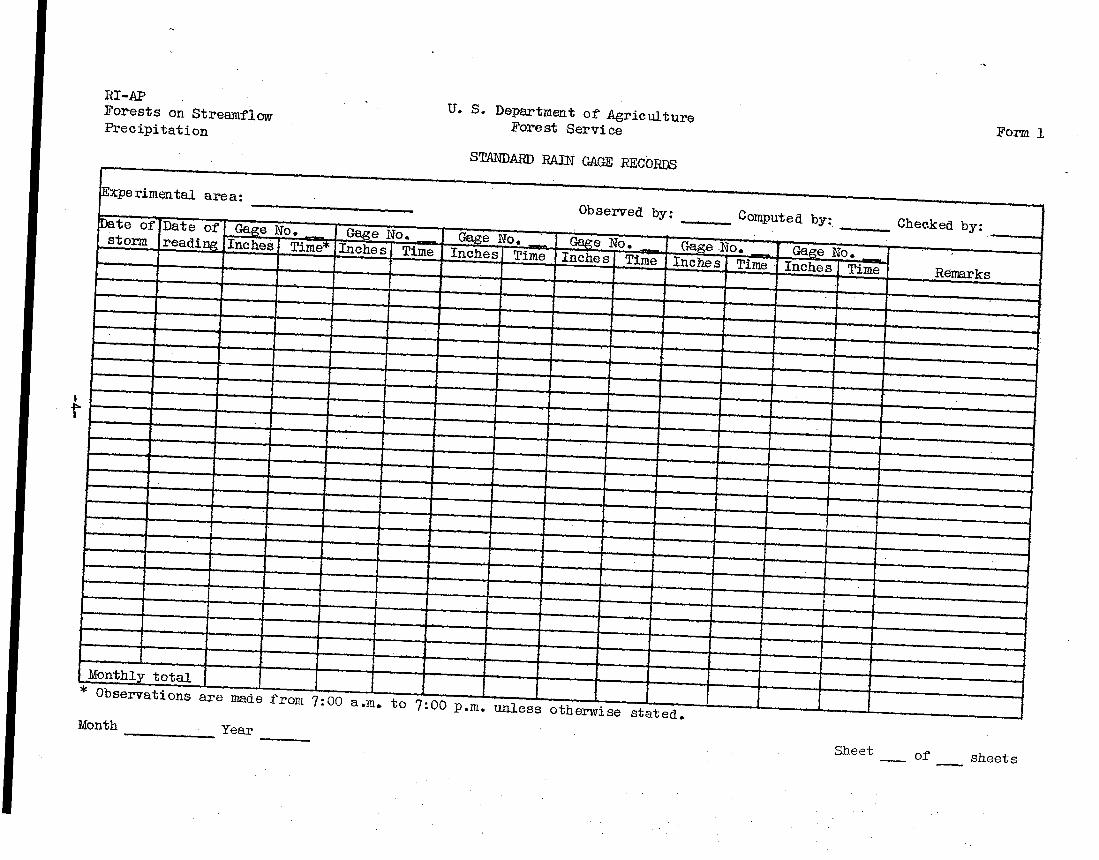
STANDARD RAIN GAGE RECORDSForm 1
Purpose
The tabulation of precipitation amounts measured by standard
rain gages is given in this form.
Procedure
The original data as collected after each storm period are
copied from the observer's field notebook and consist of the following:
date of storm period^ date observer measured the precipitation, amount
of precipitation in inches, and time of day each standard rain gage
was measured.
At the end of each month the total precipitation is recorded,
all entries checked against the observer's field notebook, and the
form filed.
RI-APForests on StreamflowPrecipitation
U. S. Department of AgricultureForest Service
STANDARD RAIN GAGE RECORDS
Form l
xperimental area:
••00 p.m. unless otherwise stated.
Year
Sheet of sheets
RI-APForests on StreamflowPrecipitation
U. S. Department of AgricultureForest Service
STANDARD RAIN GAGE RECORDS
Form 1
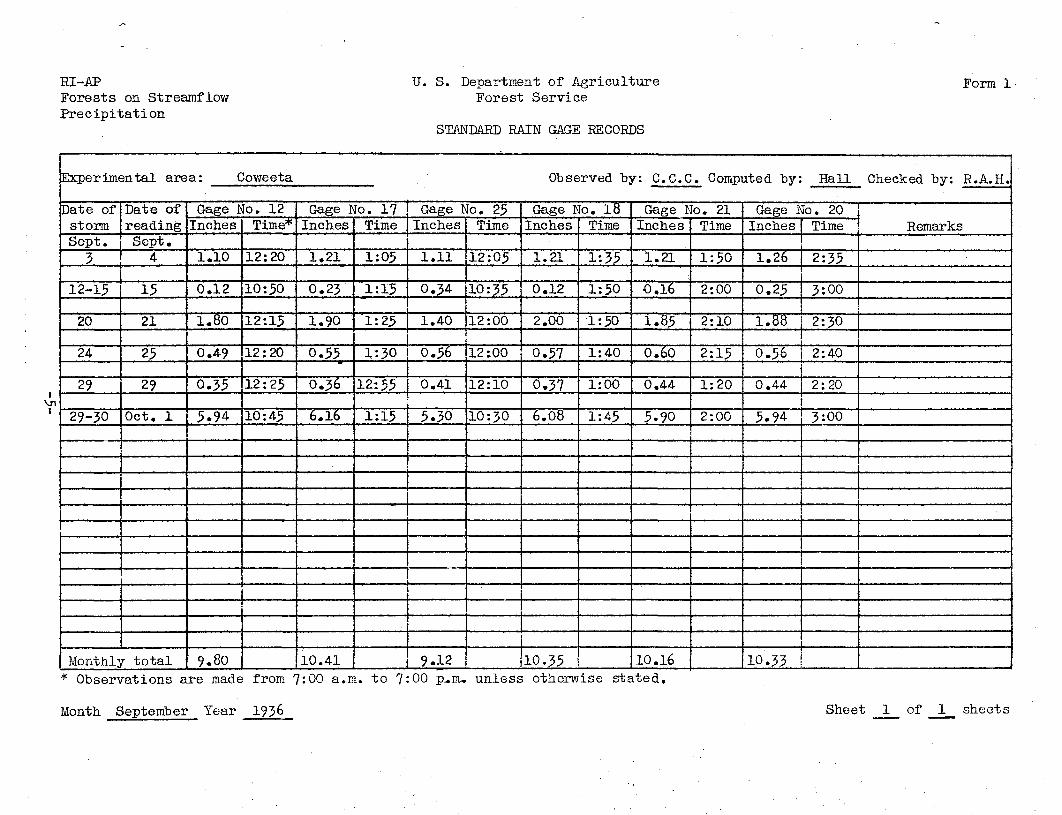
Experimental area: Co we eta
Date ofstormSept.
3
12-15
20
24
29
29-30
Date ofreadingSept.4
15
21
25
29
Oct. 1
Monthly total
Gage No. 12Inches
1.10
0.12
1.80
0.49
0.35
5.94
9.80
Time*
12:20
10:50
12:15
12:20
12:25
10:45
Gage No. 17Inches
1.21
0.23
1.90
0.55
0.36
6.16
10.41
Time
1:05
1:15
1:25
1:30
12:55
1:15
Observed by: C.C.C. Computed by:
Gage No. 25Inches
1.11
0.34
1.40
0.56
0.41
5.30
9.12
Time
12:05
10:35
12:00
12:00
12:10
10:30
Gage No. 18Inches
1.21
0.12
2.00
0.57
0.37
6.08
10.35
Time
1:35
1:50
1:50
1:40
1:00
1:45
Gage No. 21Inches
1.21
0.16
1.85
0.60
0.44
5.90
10.16
Time
1:50
2:00
2:10
2:15
1:20
2:00
Hall Checked by: R.A.H.
Gage No. 20 n
Inches
1.26
0.25
1.88
0.56
0 .44
5.94
10.33
Time
2:35
3:00
2:30
2:40
2:20
3:00
Remarks
* Observations are made from 7:00 a.m. to 7:00 p-m- unless otherwise stated.
Month September Year 1936 Sheet 1 of 1 sheets
RECORD OF WEIGHTED MEAN PRECIPITATIONON AN INDIVIDUAL DRAINAGE BASIN
Form 2
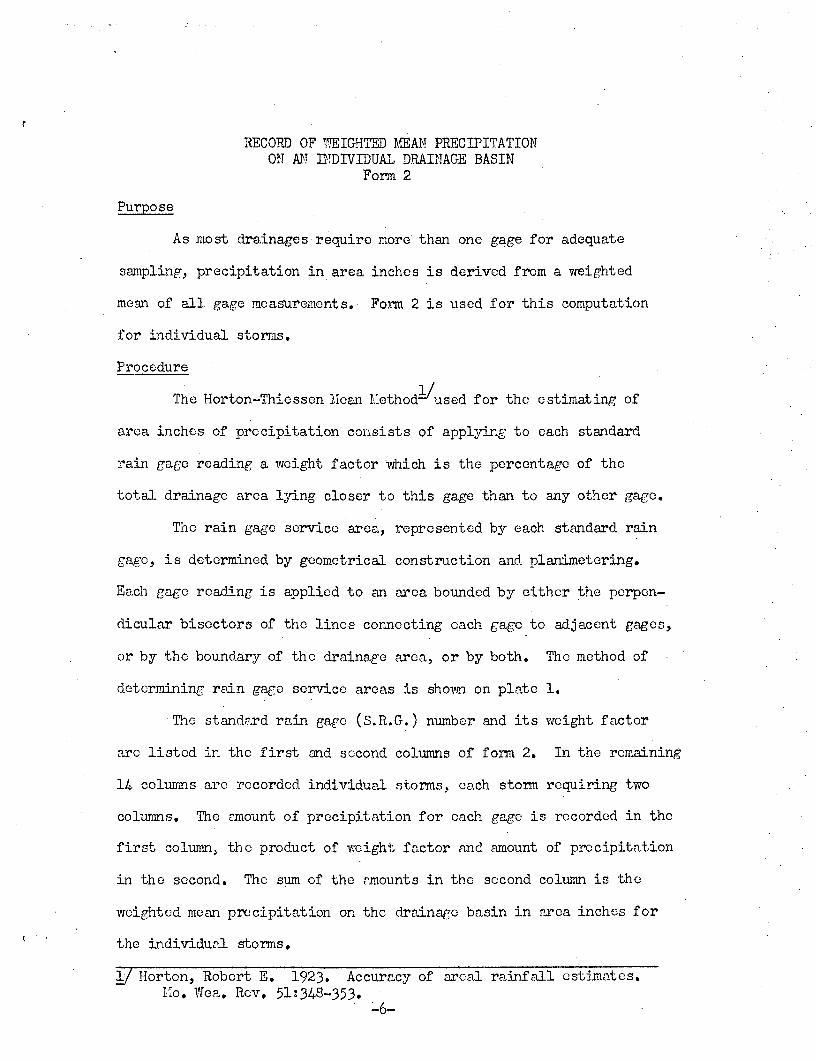
Purpose
As most drainages require more than one gage for adequate
sampling, precipitation in area inches is derived from a weighted
mean of all gage measurements. Form 2 is used for this computation
for individual storms.
Procedure
The Horton-Thiessen Mean Method-^used for the estimating of
area inches of precipitation consists of applying to each standard
rain gage reading a weight factor -which is the percentage of the
total drainage area lying closer to this gage than to any other gage.
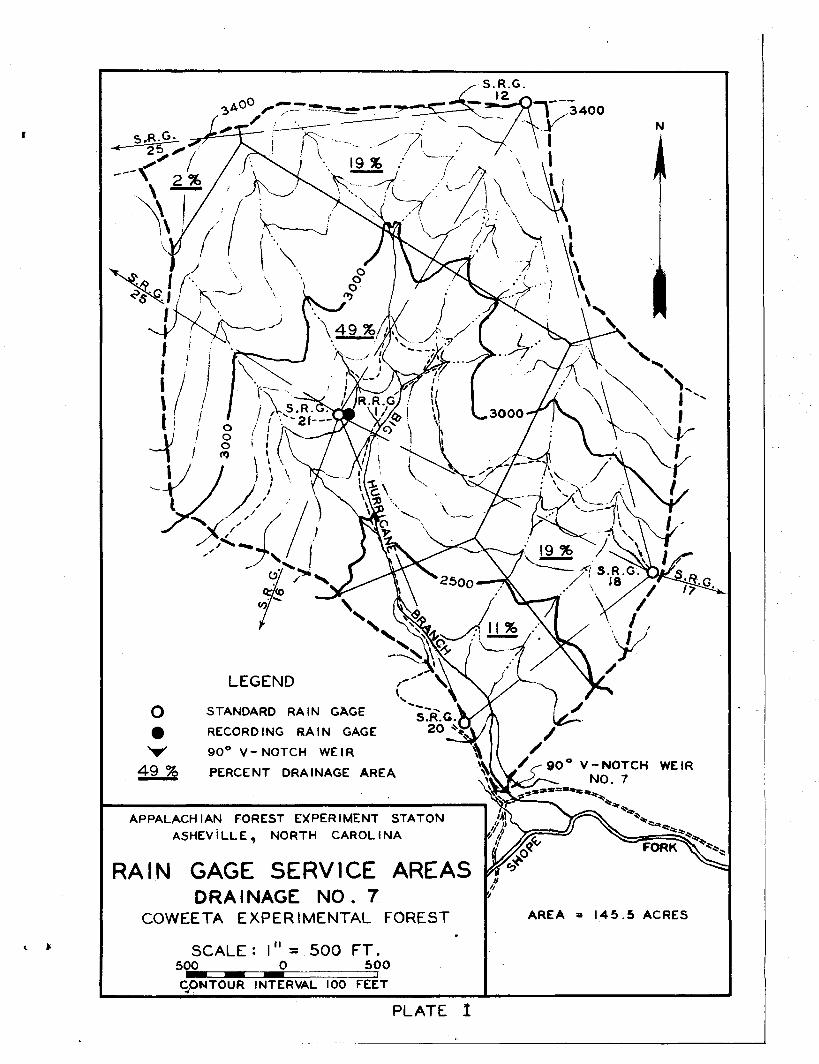
The rain gage service area, represented by each standard rain
gage, is determined by geometrical construction and planimetering.
Each gage reading is applied to an area bounded by either the perpen-
dicular bisectors of the lines connecting each gage to adjacent gages,
or by the boundary of the drainage area, or by both. The method of
determining rain gage service areas is shown on plate 1.
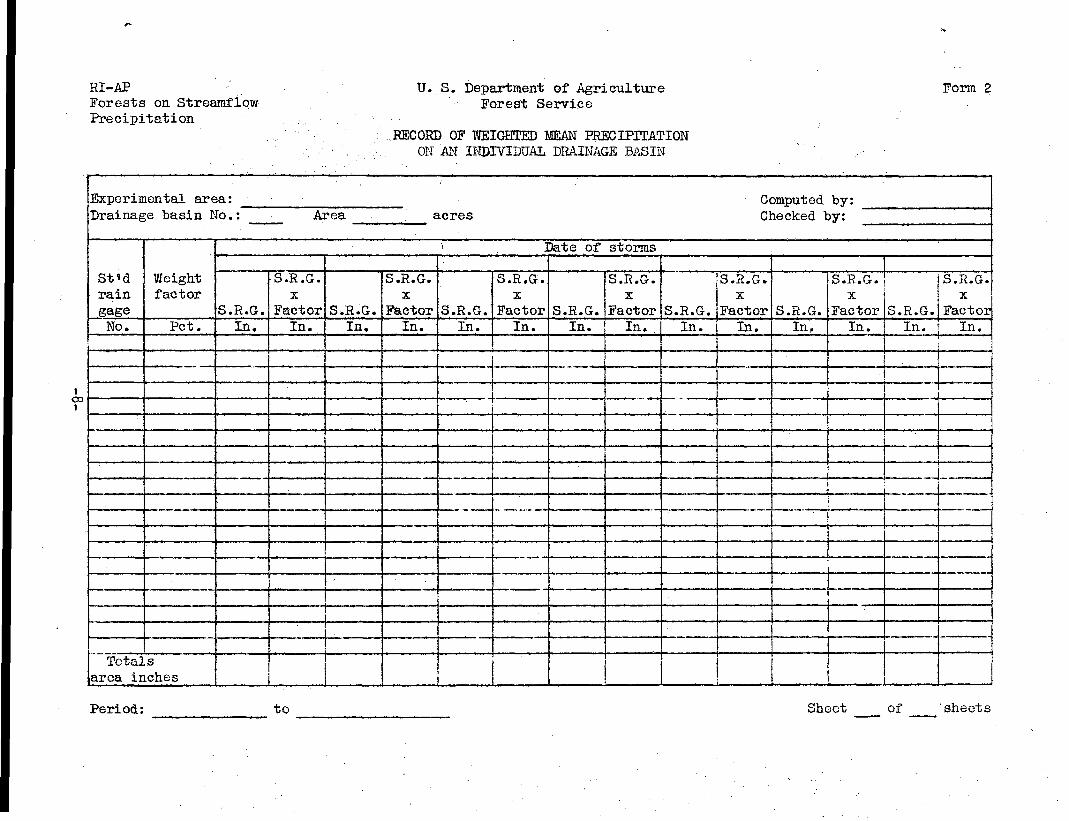
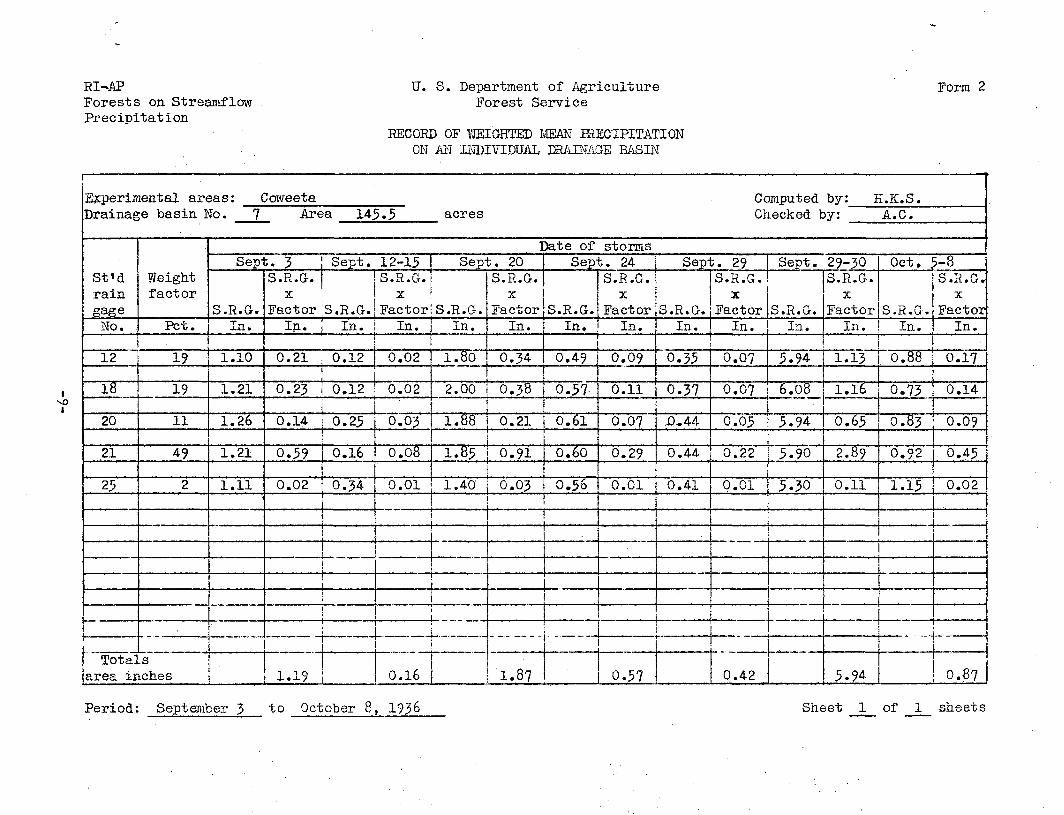
The standard rain gage (S.R.G.) number and its weight factor
are listed in the first and second columns of form 2. In the remaining
14 columns are recorded individual storms, each storm requiring two
columns. The amount of precipitation for each gage is recorded in the
first column, the product of weight factor and amount of precipitation
in the second. The sum of the amounts in the second column is the
weighted mean precipitation on the drainage basin in area inches for
the individual storms,
I/ Horton, Robert E.1923.Accuracy of areal rainfall estimates.Ko. Wca. Rev, 51:348-353.
-6-
N
90" V-NOTCH WEIRNO. 7
o
•V
LEGEND
STANDARD RAIN GAGE
RECORDING RAIN GAGE
90° V-NOTCH WEIR
PERCENT DRAINAGE AREA
APPALACHIAN FOREST EXPERIMENT STATONASHEVILLE, NORTH CAROLINA
RAIN GAGE SERVICE AREAS
DRAINAGE NO. 7
COWEETA EXPERIMENTAL FOREST
SCALE: I" =500 FT.500 0 500
AREA = 145.5 ACRES
qONTOUR INTERVAL 100 FEET
PLATE I
RI-APForests on StreamfipwPrecipitation
U. S. Department of AgricultureForest Service
.RECORD OF WEIGHTED MEAN PRECIPITATIONON 'AN INDIVIDUAL DRAINAGE BASIN
Form 2
1CO1
Experimental area: Computed by:Drainage basin No.: Area acres Checked by:
St'draingageNo.
Weightfactor
Pet.
Totalsarea inches
Date of storms
S .R .G •In.
S .R *G •X
FactorIn.
S * H • Cr •In.
»b .R. G.X
FactorIn.
S.R.G.In.
O .XL »G .2
FactorIn.
. 111i .!
s *R»GT*In.
S.R.G.X
FactorIn.
S«H»Q»In.
S «R. G.X
FactorIn.
|
Q «H • Gr»In,
S.R.G.X
FactorIn.
. .
— f •
S »R •Gr»In.
S.R.G.X
FactorIn.
|
Period: to Sheet of 'sheets
RI-AFForests on StreamflowPrecipitation
U. S. Department of AgricultureForest Service
RECORD OF WEIGHTED MEAN PRECIPITATIONON AIT INDIVIDUAL DRAINAGE BASIN
Form 2
Experimental areas: CoweetaDrainage basin No. 7 Area 145.5
St'draingageNo. .
Weightfactor
Pet.
12 1?
18
20
21
25
19
11
49
2
Totalsarea inches
acresComputed by: H.K.S.Checked by: A.C.
Date of stormsSept. 3
S »R »Gr»In.
1.10
1.21
L1.26
1.21
1.11
o .R *G.X
FactorIn.
Sept. 12-15
S.R.G.
S.R.G.TT
FactorIn . In .
0.21
0.23
0.12 0.02
0.12 0.02
|0.14 0.25
1
0.59
0.02
I 0.16
0.34
i!j
1.19
••••
0.03
0.08
0.01
Sept. 20
o •z\ »G •In.
1.80
S.R.G.X
FactorIn.
0.34
2.00 0.38- 1
1.88
1.85__
1.40'
|
i
0.21
0.91
0.03
Sept. 24
S.R.G.
o.R »G.X
FactorIn. In.
0.49
0.57
0.61
0.60
0.56
i
|_ j- — _ __
0.16 | 1.87
0.09
0.11
0.07
0.29
0.01
1
Sept. 29
S »R • Cr*la.
o .R .G .X
FactorIn.
10.35
0.37
D..44
0.44
0.41
1
0.57
0.07
0.07
Sept. 29-30
S.R.G.In.
5.94
6.08
0.05 5.94
0.22
0.01
0.42
5.90
5.30
S.R.G.X
Factor
Oct. 5-8
S .R.G.In. In.
i1.13 0.88
1.16
...0.65
2.89
0.11
0.73
0.83
0.92
1.15
1
O .Jri . vjr .X
FactorIn.
0.17
0.14
0.09
0.45
0.02
;i
, i
5.94 0.87
Period: September 3 "to October 8, Sheet 1 of 1 sheets
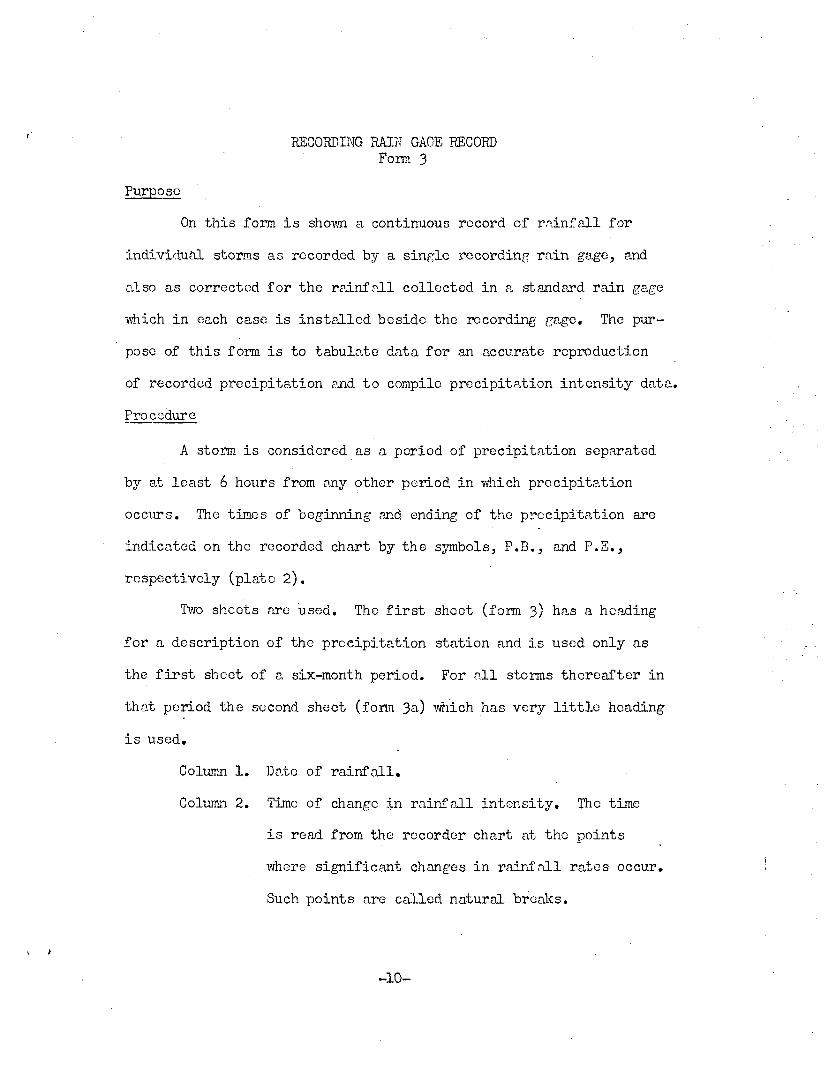
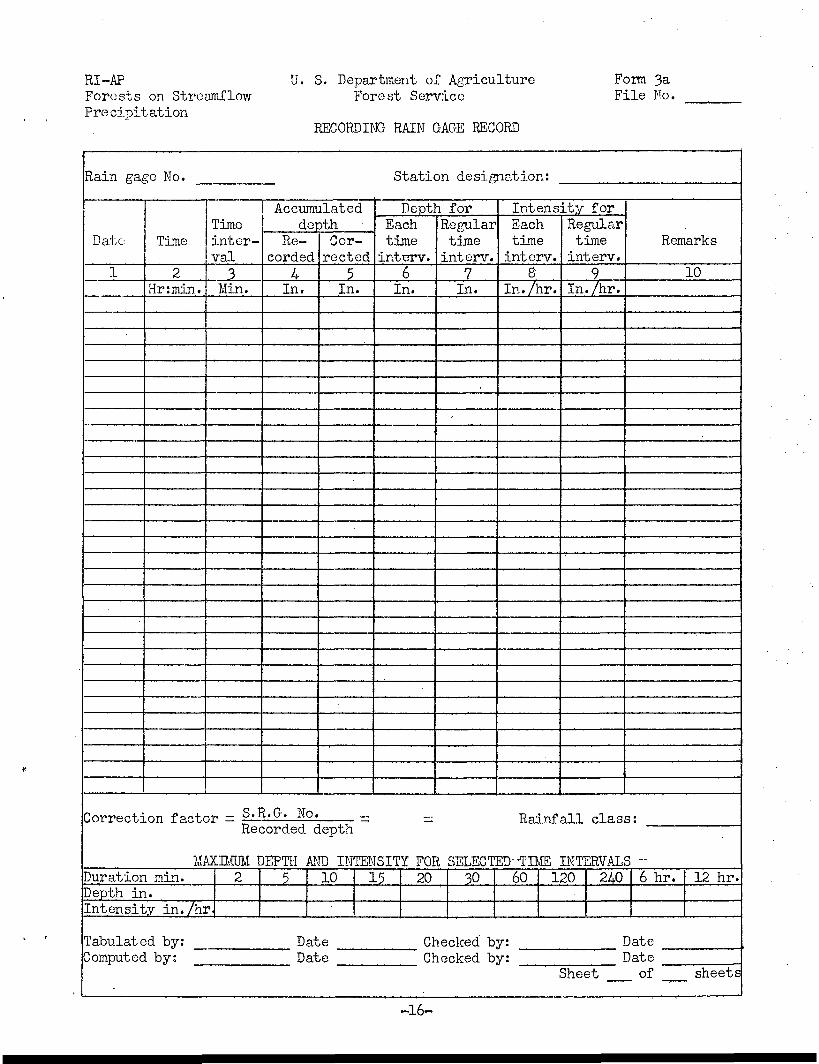
RECORDING RAIN GAGE RECORDForm 3
Purpose
On this form is shown a continuous record of rainfall for
individual storms as recorded by a single recording rain gage, and
also as corrected for the rainfall collected in a standard rain gage
which in each case is installed beside the recording gage. The pur-
pose of this form is to tabulate data for an accurate reproduction
of recorded precipitation and to compile precipitation intensity data.
Procedure
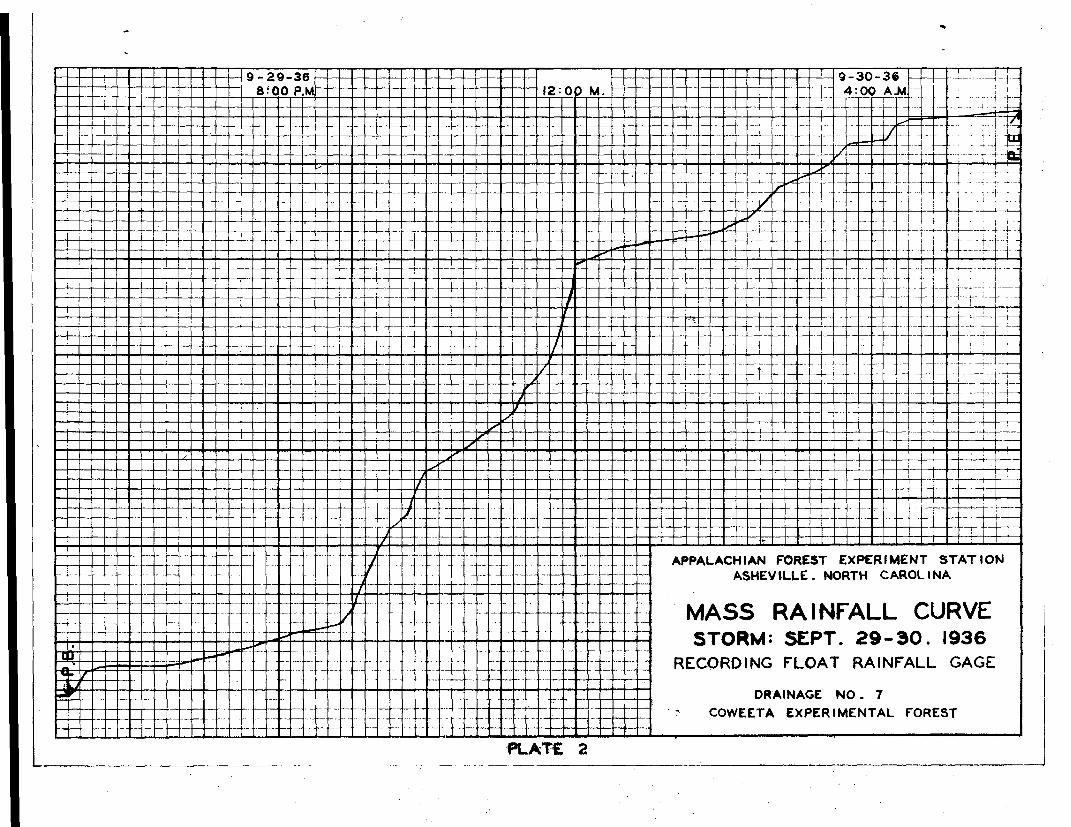
A storm is considered as a period of precipitation separated
by at least 6 hours from any other period in which precipitation
occurs. The times of beginning and ending of the precipitation are
indicated on the recorded chart by the symbols, P.B., and P.E.,
respectively (plate 2).
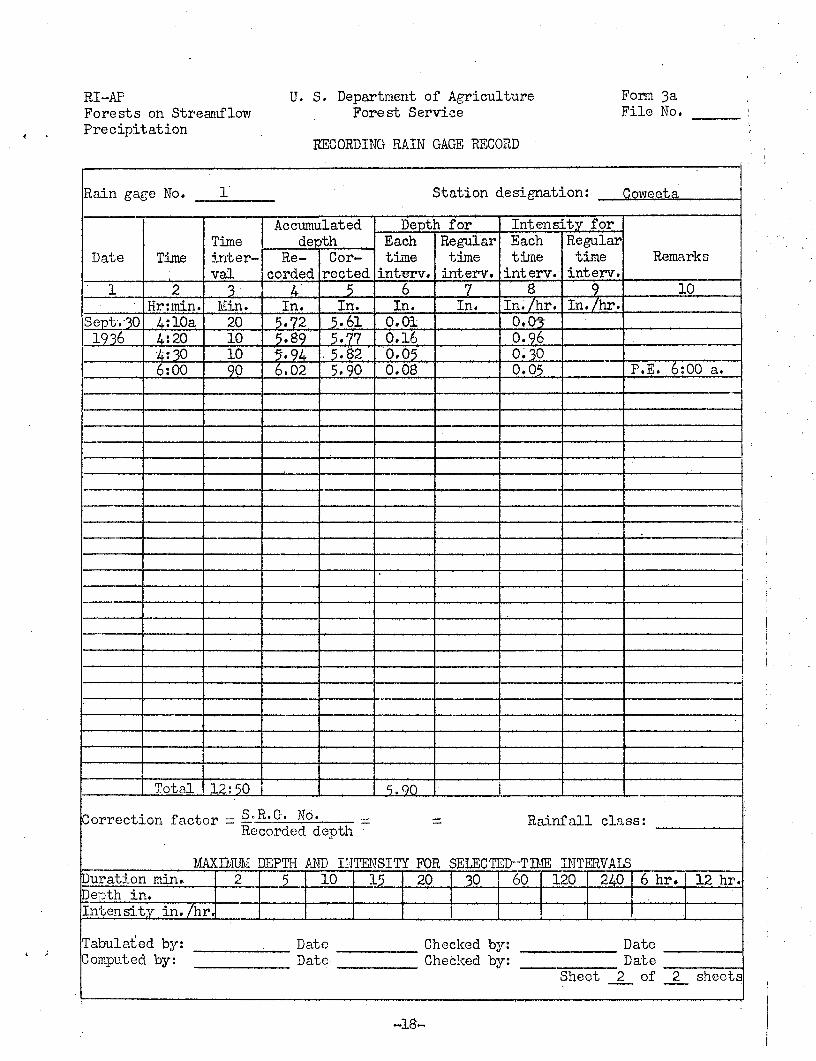
Two sheets are used. The first sheet (form 3) has a heading
for a description of the precipitation station and is used only as
the first sheet of a six-month period. For all storms thereafter in
that period the second sheet (form 3&) which has very little heading
is used.
Column 1. Date of rainfall.
Column 2. Time of change in rainfall intensity. The time
is read from the recorder chart at the points
where significant changes in rainfall rates occur.
Such points are called natural breaks.
-10-
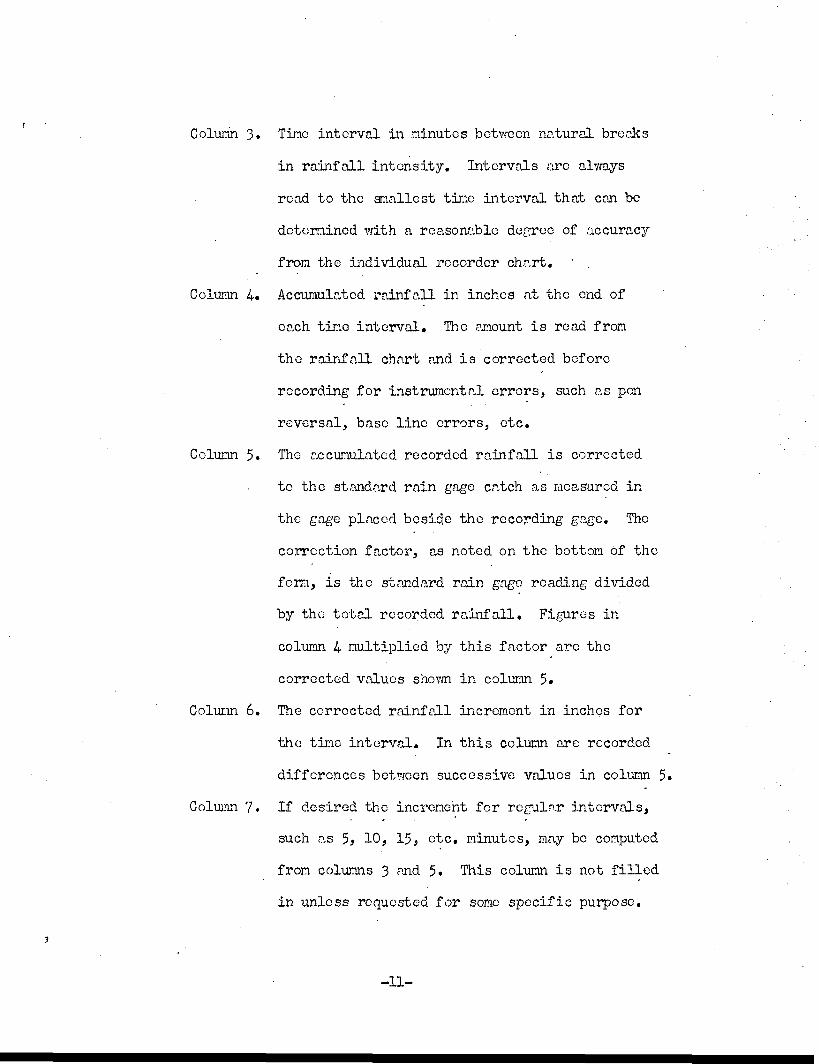
Column 3« Tirnc interval in minutes between natural breaks
in rainfall intensity. Intervals arc always
read to the smallest time interval that can be
determined with a reasonable degree of accuracy
from the individual recorder chart. • .
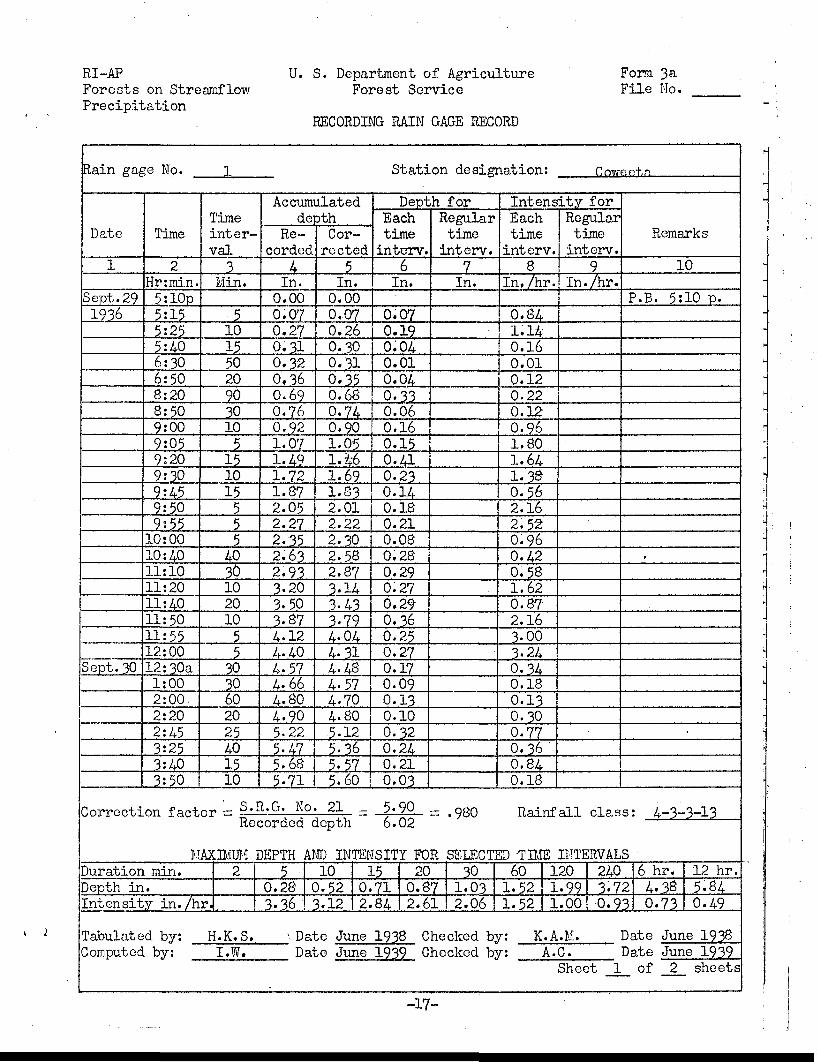
Column 4. Accumulated rainfall in inches at the end of
each time interval. The amount is read from
the rainfall chart and is corrected before
recording for instrumental errors, such as pen
reversal, base line errors, etc.
Column 5. The accumulated recorded rainfall is corrected
to the standard rain gage catch as measured in
the gage placed beside the recording gage. The
correction factor, as noted on the bottom of the
form, is the standard rain gage reading divided
by the total recorded rainfall. Figures in
column 4 multiplied by this factor arc the
corrected values shown in column 5.
Column 6. The corrected rainfall increment in inches for
the time interval. In this column are recorded
differences between successive values in column 5.
Column 7. If desired the increment for regular intervals,
such as 5> 10, 15, etc, minutes, may be computed
from columns 3 f d 5. This column is not filled
in unless requested for some specific purpose.
-11-

To use column 7 it is netiessary to show in
column 2 additional tines corresponding to
the regular interval.
Column 8. Rainfall rate in inches per hour for the tine
interval. Col. 6 x 60 min. = coluran 8.Uol. 3
Column 9. Rainfall rate in inches per hour for the regular
tine interval. Col 7x^60 nin. = coluan 9.regular interval
Column 10. Notes of beginning and ending of rainfall
(P.B. and P.E.) recorded opposite times shown
in column 2. This column is also used for
pertinent comments noticed during computations.
Bottom of The figures used in determining the correctionform.
factor are recorded on the proper lines and the
standard rain gage number is inserted in the
space provided.
The rainfall class defines pertinent character-
istics required for analysis of data. It is an
expression of four terms v."hcre each term is a
class number. The terms are given in the
following order:
First: Total rainfall.
Second: Maximum $~minute intensity.
Third: Maximum 20-minute intensity.
Fourth: Duration to the nearest hour.
-12-

The first three terms employed are based on the
arbitrary class numbers listed below; the fourth
term needs no explanation.
Key to class numbers
First term
GlassNo.
012
345
Total rainfallInches
0 - .49.50 - .99
1.00 - 1.992.00 - 3.994.00 - 7-998.00 - Up
Second and third terms
ClassNo.
012
345
Rate per hourInches
0 - .49.50 - .99
1.00 - 1.992.00 - 3.994.00 - 7-998.00 - Up
Maximum rainfall depths and intensities in inches
per hour are recorded for selected rainfall dura--
tions in minutes. These rates^ are obtained from
the original charts by considering each interval
as.a continuous time unit. With a little ex-
perience the maximum depths for the various time
intervals can be readily taken from the chart
vdth a pair of dividers.
-13-
ij
T
|
_L
1 •
T•Cp-j|w
I
r
—
?*- ,
— —_.
*
-
—
•*•"
_..
» — u-jo8 ! C O P.M
—
.*••
-
^
-
—
MV KU—
...
-
y
/t-
-
7
—
//
- -
y
>/^
-.
</
——
/* ^
-
,/
.
^
/
— •
-
/(T
_.
• • -
f
-
._
12:0 ) M.
/
//
_
^
1//
-
—
^<^^«
_
—
--
_..
—
^
-.-
(» • C1^ ^
"!i
•—•
-
X^/*
••
/
«.
^^
-
x!
--
^
4
p/
;
4:00 A>4
--
-
——- -
--
_._,._.
~r-'
-_-
=
—i-
..-!.-
•• f -
• -
—
i —
H~U
-
— =
.. : ". .— i - - - - -:
1
. ^
... ...
-1_„.
—. ..
-
— 1—
^-tt
"£
i -— i.
4--:
!j
: 1
1
— f—
j
1 1 1|
1
-H-
APPALACHIAN FOREST EXPERIMENT STATIONASHEVILLE. NORTH CAROLINA
MASS RAINFALL CURVE
STORM: SEPT. 29-30. 1936
RECORDING FLOAT RAINFALL GAGE
DRAINAGE NO. 7COWEETA EXPERIMENTAL FOREST
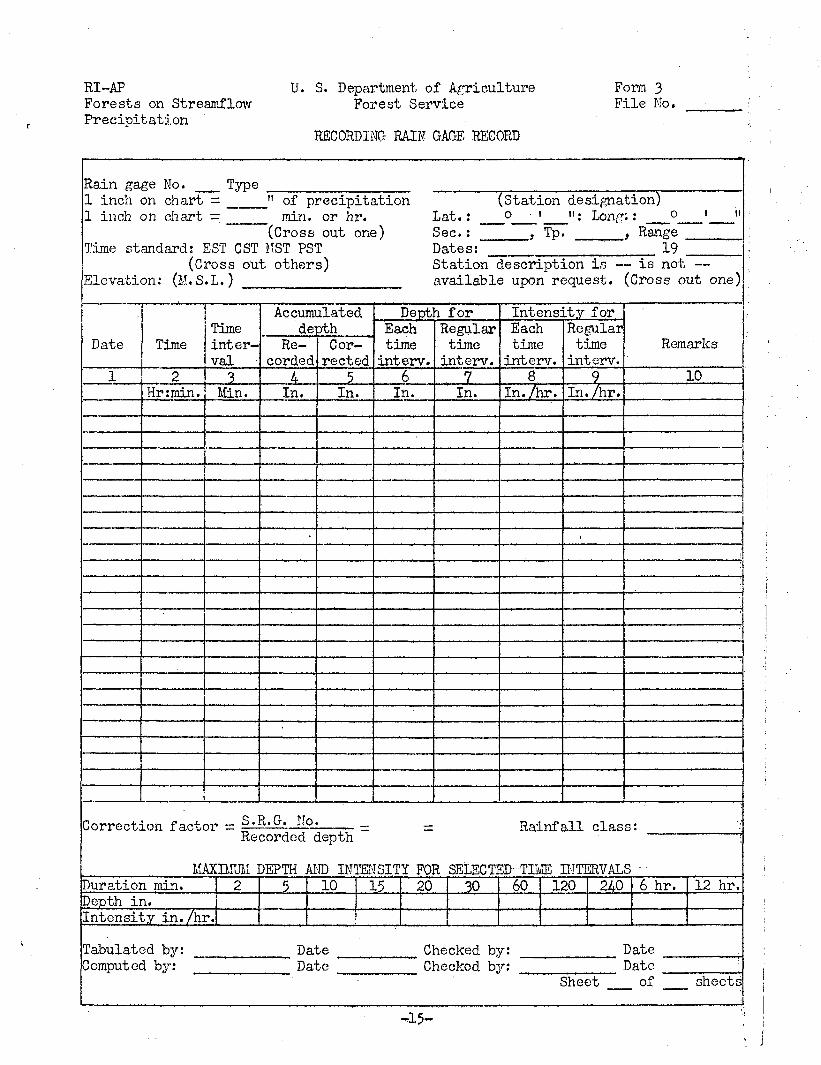
RI-APForests on StreamflowPrecipitation
U. S. Department of AgricultureForest Service
RECORDING RAIN GAGE RECORD
Form 3File No.
Rain gage No. Type1 inch on chart =1 inch on chart =
_" of precipitation (Station designation)-min. or hr. Lat. : ° • t it. Long".: ° ' "
(Cross out one) Sec. : , Tp. , RangeTime standard: EST CST MST PST Dates: 19
(Cross out others) Station description is — is not —Elevation: (M.S.L.) available upon request. (Cross out one)
Date
1
Time
2Hrrmin.
Correction f actt
MJ
Timeinter-val3
Min.
Accumulateddepth
Re-corded
kIn.
•
Cor-rected
5In.
Depth forEachtimeinterv.
6In.
-jr _ S.R.G. No.Recorded depth
UCBIUM DEPTH AKD INTENSITY F01Duration min. 2Depth in,Intensity in./hr.
5
Regulartimeinterv.
7In.
Intensity forEachtimeinterv.8
In._/hr.
Regulartimeinterv.
9In./hr.
i
Rainfall clas
\ SELECTED-TIME INTERVAL10 15 20 30
Tabulated by: Date Checked b?Computed by: Date Cleaked b;
Remarks
10
;
;l
s: '-'
s -•60 120 2 0 6 hr. 12 hr.
/•: DateT: Date ;:
Sheet of sheets
•0.5-
• J
RI-APForests on StrcamflowPrecipitation
U. S. Department of AgricultureForest Service
RECORDING RAIN GAGE RECORD
Form 3aFile No.
Rain gat
Date
1
?c No.
Time
2Hr:min.
Station designation:
Timeinter-val3
Min.
Correction factoi
MAXDuration min.Depth in.Intensity in./hr,
Tabulated by:Computed by:
Accumulateddepth
Re-corded
AIn.
Cor-rected
5In.
DepthEachtimeinturv.
6In.
forRegulartimeinterv.
7In.
Intensity forEachtimeinterv.
8In./hr.
. _ S.R.G. No. _Recorded depth
:iMUM DEPTH AND INTENSITY FOR2 5 10 15
DateDate
20
CheChe
Regulartineinterv.
9In./hr.
Rainfall clas
SELECTED-TIME INTERVAL30
eked beked b
60
7'7'
120 2 0
Remarks
lO-
st
3 -6 hr. 12 hr.
DateDate
Sheet of sheets
-16-
RI-APForests on StreamflowPrecipitation
U. S. Department of AgricultureForest Service
RECORDING RAIN GAGE RECORD
Form 3 aFile No.
Rain gage No. l
Date
1
Sept. 291936
Sept. 30
Time
2Hr:min.5:10p
5:155:255:406:JO6:508:208:509:009:059:209:30
9:459:509:5510:0010:4011:1011:2011:4011:50
11:5512:0012:30a1:002:002:20
2:453:253:403:50
Correction fact
M
Timeinter-val
3Min.
510
155020903010
51510
1555540
30102010
5530306020
25401510
Station
Accumulateddepth
Re-corded
4In.0.00
0.070.270.310.320,360.690.760.921.071.491.721.872.052.272.352.632.933-203.503.874.124.404-574.664-80
4.905-22
5-475.68
5-71
Cor-rected
5In.0.000,070.260.30
0.310.350.68
0.740.901.05l.ij:6
1.691.832.012.222.302.582.873-143-433-794.044-314-484-574-704.805-125-365-57
DepthEachtimeinturv.
6In.
0.0.0.0.0.0.0.0.0.0.0.
07
19040104
33061615
4123
0.140.0.
1.821
0.080.0.0.0.0.0.0.0.
28
29272936252717
0.090.130.100.0.0.
322421
5-60 0.03
or ' S.R.G. No. 21
designation:
forRegulartimeinterv.
7In.
- 5-90 ._Recorded depth 6.02
AXIMUM DEPTH AND INTENSITY FORDuration min. 2Depth in.Intensity in./hr.
50.283.36
100.523-12
150.712.84
200.872.61
Cowfifitn.
Intensity forEachtimeinterv.
8In./hr.
0.841.140.160.010.120.220.120.961.80
1.641.3$0.562.162.520.960.420.581.620.872.163.003.240.340.180.130.30
0.770.360.840.18
Regulartimeinterv.
9In./hr.
.980 Rainfall clas
SELECTED TEE INTERVAL301.032.06
Tabulated by: H.K.S. -Date June 1938 Checked b?Computed by: I.W. Date June 1939 Cheeked bj
Remarks
10
P.B. 5:10 p.
,
•
s : 4-3-3-13
S60 120 240 6 hr. 12 hr.1.52 1.99 3-72 4.38 5-841.52 1.00 0.93 0.73 0.49
r- K.A.M. Date June 1938r: A.C. Date June 1939
Sheet 1 of 2 sheets
-17-
RI-AFForests on StreaniflowPrecipitation
U. S. Department of AgricultureForest Service
RECORDING RAIN GAGE RECORD
Form 3aFile No.
Rain ga^
Date
1
Sept. 301936
*e No.
Time
2Hr:min.4:10a4:204:306:00
Total
1'
Timeinter-val3
Min.20101090
12:50
Correction factoi
MAXDuration min.Depth in.Intensity in./hr.
Tabulated by:Computed by:
Station designation:
Accumulateddepth
Re-corded
4.In.5.725.895.946.02
Cor-rected
5In.5.615.77
. 5.825-90
Depth forEachtimeintBrv.
6In.O.Oi0.160.050.08
5.90
Regulartimeinterv.
7In,
IntensityEachtimeinterv.
8In./hr.
0,050.960.300.05
, .. S.R.G. No.Recorded depth
:iMUM DEPTH AND INTENSITY FOR SELECT12 5 10
DateDate
15 20 30
ClCllecked b]lecked b]
Coweeta
forRegulartimeinterv.
9In./hr.
Rainfall cla
Remarks
10
P.E. 6:00 a.
,
ss:
]D"TB!E INTERVALS60
r'.fl
120 240 6 hr« 12 hr.
DateDate
Sheet 2 of 2 sheets
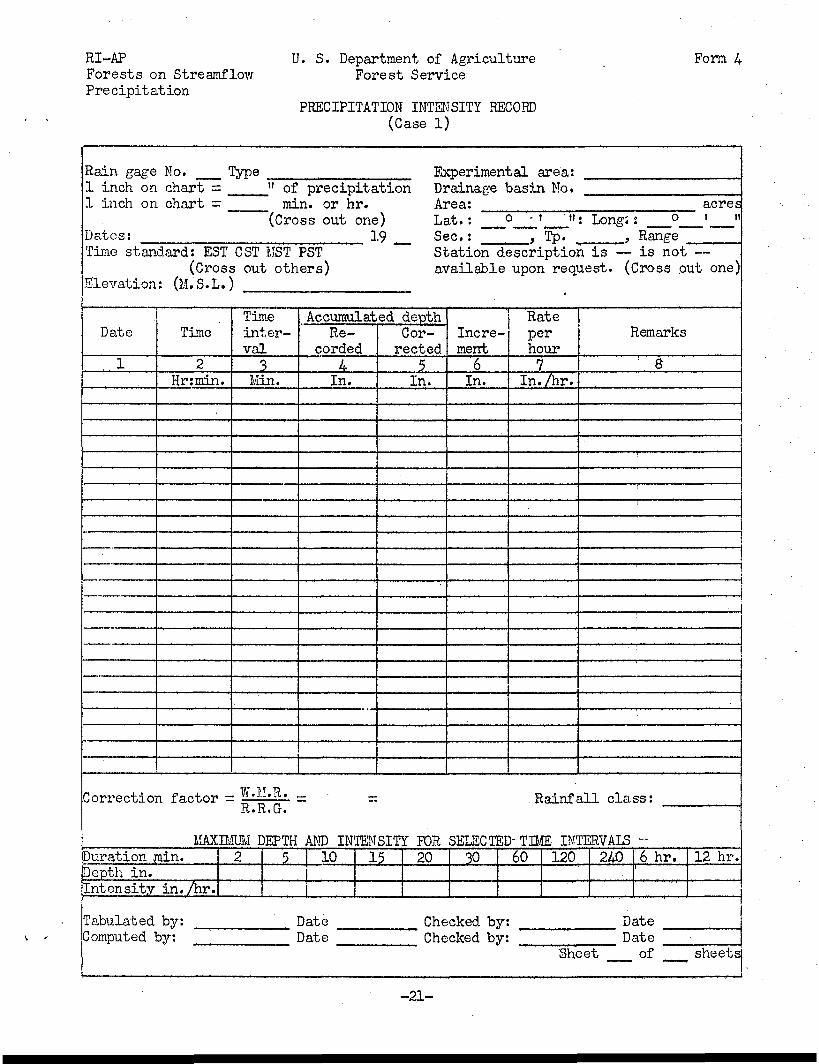
PRECIPITATION INTENSITY RECORD(Case 1 - Drainage basins with one recording precipitation gage)
Form 4
Purpose
This form is used to record weighted precipitation intensities
for an individual drainage basin having only one recording precipi-
tation gage. Intensities are recorded by individual storms which are
defined under "Procedure" on page 10.
Procedure
Columns 1, These columns are copied directly from the
2, 3, & 4.corresponding columns of form 3 or 3a for
the same storm.
Column 5. To obtain column 5 the figures of column 4
are each multiplied by the factor which
corrects the recorded rainfall to the
weighted mean rainfall for the drainage
basin. The correction factor is obtained,
as shown on the bottom of the form, by
dividing the weighted mean rainfall by the
total recorded rainfall. The weighted mean
rainfall (W.H.R.) is copied from form 2 and
the recording rain gage (R.R.G..) rainfall is
the total accumulated rainfall at the end of
the storm, column 4.
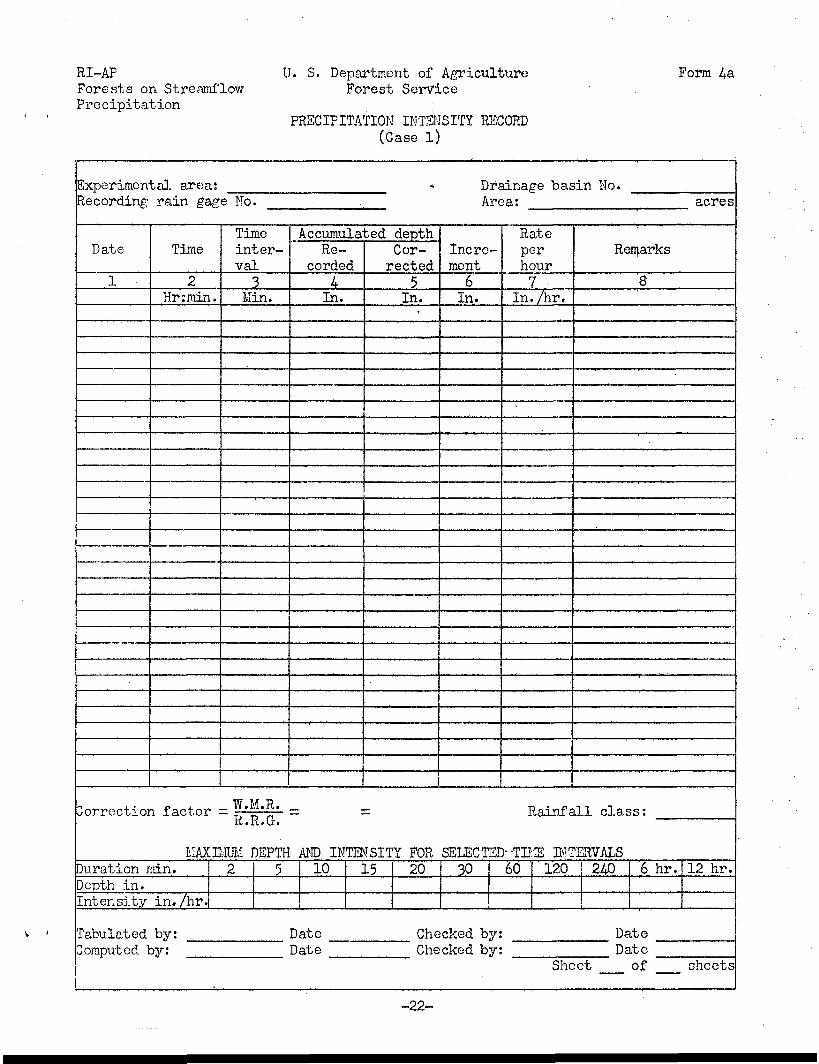
Column 6. The increments of rainfall, or the differences
between successive accumulated amounts, as
shown in column 5> are recorded in column 6.
-19-

Column 7. The increments of column 6 are converted into
rainfall rates in inches per hour for the time
interval. Col 6 x 60 min., _ column 7.Col. 3
Column 8. Show in column 8 the time vfoeri precipitation
begins and ends (P.B. and P.E.) and in addition
any notes or remarks pertinent to the entire
record.
Bottom of Actual values used in computing the correction
form.factor are inserted in the proper space accord-
ing to the method explained under "column 5"«
The rainfall class is not copied from form 3?
but is recalculated as described under "form 3"«
Maximum depths and intensitj.es for selected
time intervals are computed as explained under
"form 3".
•-20-
RI-APForests on StreamflowPrecipitation
U. S. Department of AgricultureForest Service
PRECIPITATION INTENSITY RECORD(Case 1)
Form
Rain gage1 inch on
Mo. Typechart - " of
1 inch on chart = min
Dates:
£>precipitation Di. or hr. Ai
(Cross out
Time standard: EST GST MST PST(Cross out others)
Elevation: (M.S.L.)
Date
1
Time
2Hr:min.
iperimental area:'ainage basin No.-ea: acres
one) Lat. : __°__lt _": Long;: ° ' "19 Sec. : , Tp. . , Range
Station description is — is not —available upon request. (Cross out one)
Timeinter-val3
Min.
Accumulated depthRe-
corded
kIn.
Correction factor - W-J--'^' -R.R« G.
MAXIMUM DEPTH AND INTENDuration min. 2 5Depth in.Intensity in./hr.
Tabulated
10
by: DateComputed by: Date
Cor-rected
5In.
Incre-ment6In.
Rateperhour7
In. /hr.i
Rainfc
SITY FOR SELECTED- TIME INr
15 20
CheChe
Remarks
8
*
I
VH r/Liss!
CERVALS "30 60 120 240 6 hr. 12 hr.
eked by:eked by:
DateDate
Sheet _^ of _____ sheets
—21—
RI-APForests on StreamflowPrecipitation
U. S. Department of AgricultureForest Service
PRECIPITATION INTENSITY RECORD(Case l)
Form
Experimental area:Recording1 rain gage No
Date
1
Time
2Hr:mih.
Correction factor :
KAXEDuration ruin.Depth in.Intensity in. /hr.
TabulatedComputed 1
by:
iy-
Timeinter-val3
Min.
AccumulatedRe-
corded4In.
* Drainage basArea:
depthCor-rected
5In.'
Incre-ment6In.
W.M.R.R.R.G.
MM DEPTH AND INTENSITY FOR SELECT2 5 10 15
DateDate
20 30
•in No.acres
Rateperhour
7In /hr.
I
ED--TI?60
Checked by:Cheeked by:
lainfs
S BT1
Remarks
8
ill class:
'ERVALS120 240 '6 hr. 12 hr.
DateDate
Sheet of sheets
-22-
RI-APForests on StreamflowPrecipitation
U. S. Department of AgricultureForest Service
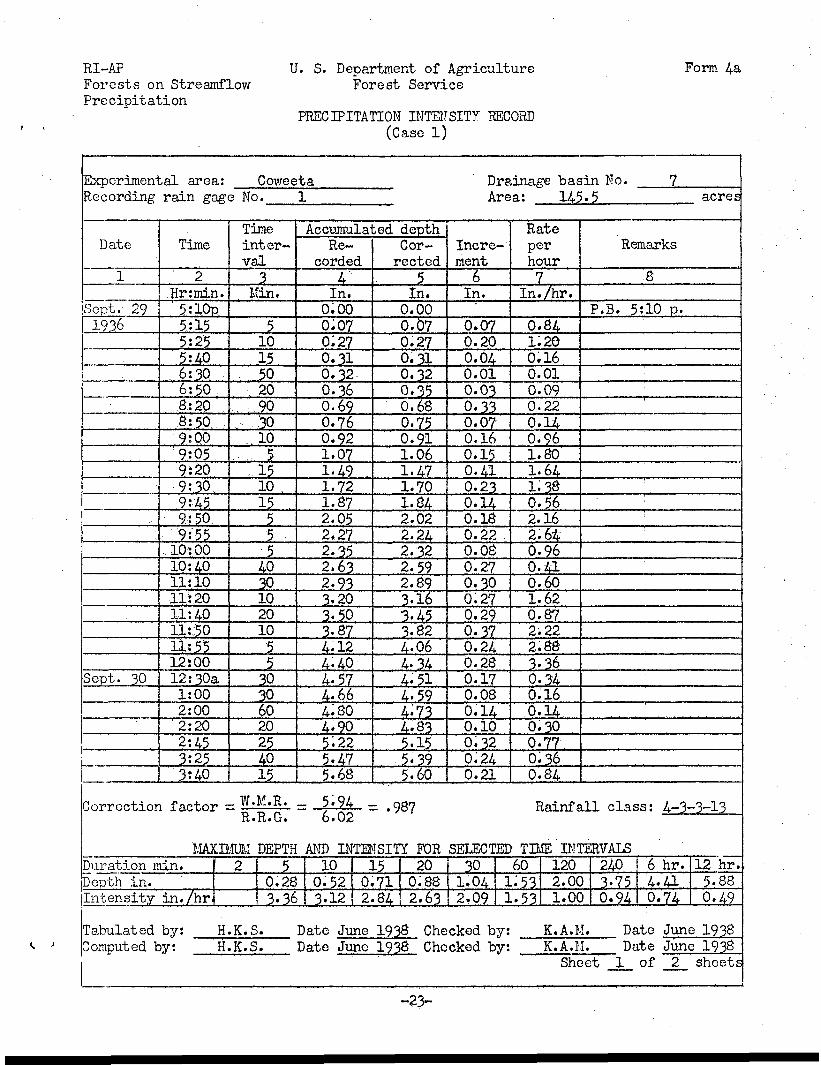
PRECIPITATION INTENSITY RECORD(Case 1)
Form
Experimental area:Recording rain gag
Date
1
Sept. 291936
Sept. 30
Time
2Hr:min.5:10p
5:155:255:406:306:508:208; 509:009:059i209:30
9:459:509:55
, 10:0010:4011:1011:2011:4011:5011:5512:0012:30a1:002:002:20
2:453:253:40
Correction factoi
MA)Duration rain.Depth in.Intensity in./hr
TabulatedComputed t
by:
>y:
Coweeta3 NO. 1
Timeinter-val
3Min.
510
155020
.. 903010
...... 5...1510 .
15 .5554030102010
5530306020
254015
Accumulated depthRe-
corded4In.0.000.07Oi270.310.320.360.690.760.921.071-491.721.872.052,272.552.632.933.203-503.874-12
. 4-404-574-664 804.905^225.475.68
Cor-rected
5In.0.000.070.270.310.320.350.680.750.911.061.471.701.842.022.242.322.592.893.163.453.824.064.344.514-594^734.835-155-395.60
Drainage ba£Area: 14*
Incre-ment6In.
0.070.200.040.010.030.330.070.160.150.410.230.140.180.22
L 0.080.270.30
0:270.290.370.240.280.170.08
0.140.100.320.240.21
, _ W.M.R. _ 5-94 _ ngyR.R.G. 6.02
[IMUM DEPTH AND INTENSITY FOR2 5 10
0.28 0.523.36 3.12
15 200.71 0.882.84 2.63
SELECT301.042,09
•in No. 7>.5 acres
Rateperhour
7In./hr.
0.1.0.0.0.0.0.0.1.1.1.
84201601
09221496806438-
0.562.2.0.
16
64;96
0.410.1.6062
0.872.222.88
3- 360.340.0.16
14.0.300.770:360.84
Rainfc
ED TIME INT60
1.531-53
H.K.S. Date June 1938 Checked by:H.K.S. Date June 1938 Cheeked by:
Remarks
8
P.B. 5:10 p.
ill class: 4-3-3-13
ffiRVALS120 240 6 hr. 12 hr.2.00 3-75 4.41 5.881.00 0.94 0.74 0,49
K.A.M, Date June 1938K.A.M. Date June 1938Sheet _1_ of 2 sheets
-23-
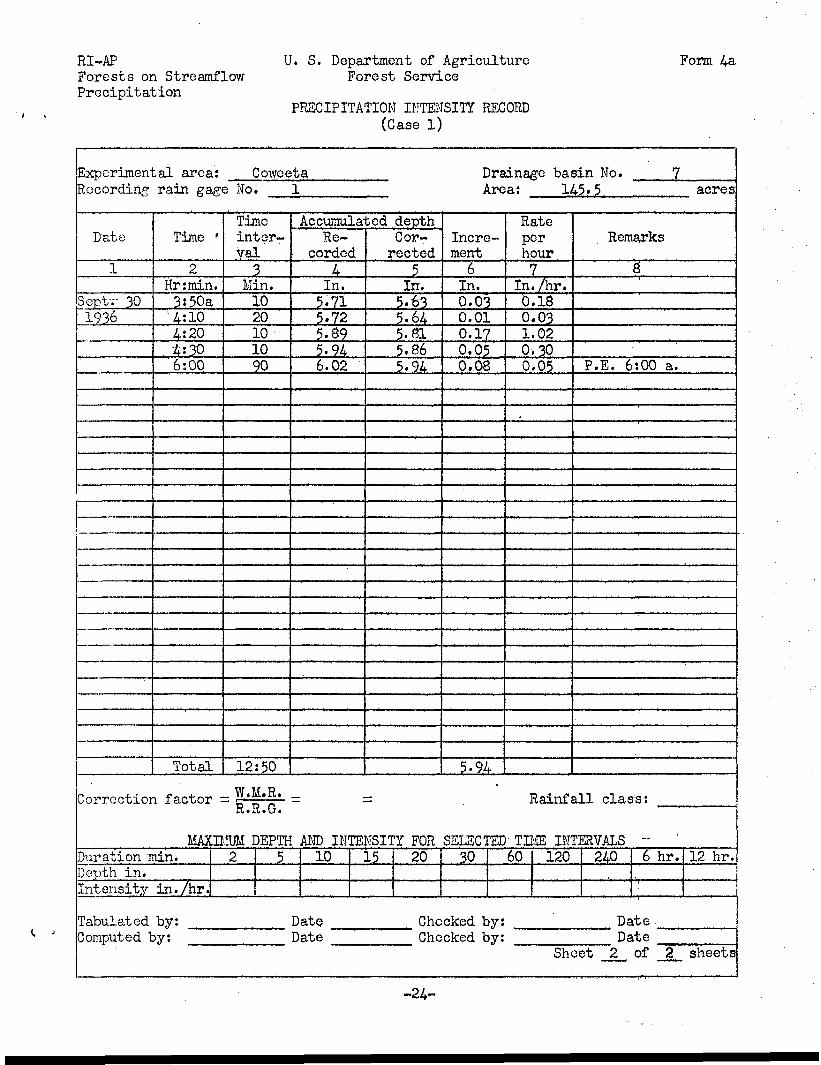
RI-APForests on StreamflowPrecipitation
U. S. Department of AgricultureForest Service
PRECIPITATION INTENSITY RECORD(Case 1)
Form 4a
Experimental area: C owe etaRecording rain gage No
'Date
1
Sept-r 301936
Correctior
Time '
2Hr:min.3?50a4:104:20•4:306:00
Total
1
Timeinter-val
3Min.1020101090
12:50
Drainage basin No. 7Area: 145* 5 acres
Accumulated depthRe-
corded
4In.5.715.725-895.946.02
LR,"""' * R.R.G.
MAXIMUM DEPTHDuration min. 2Depth in.Intensity in./hr.
TabulatedComputed I
by:
>y:
5
Cor-rected
5In.5.635.645.815.865.94
Incre-ment6In.
0.030.010.170.050.08
5-94
Rateperhour
7In. /hr.0.180.031.020.300.05
f
Remarks
8
P.E. 6:00 a.
= Rainfall class:
AND INTENSITY FOR SELECTED' TIME INTERVALS -10
Date?Date
15 20 30 60 120 240 6 hr. 12 hr.
Checked by:Cheeked by:
DateDate
Sheet _ 2m of 2 sheets
V J
-24-
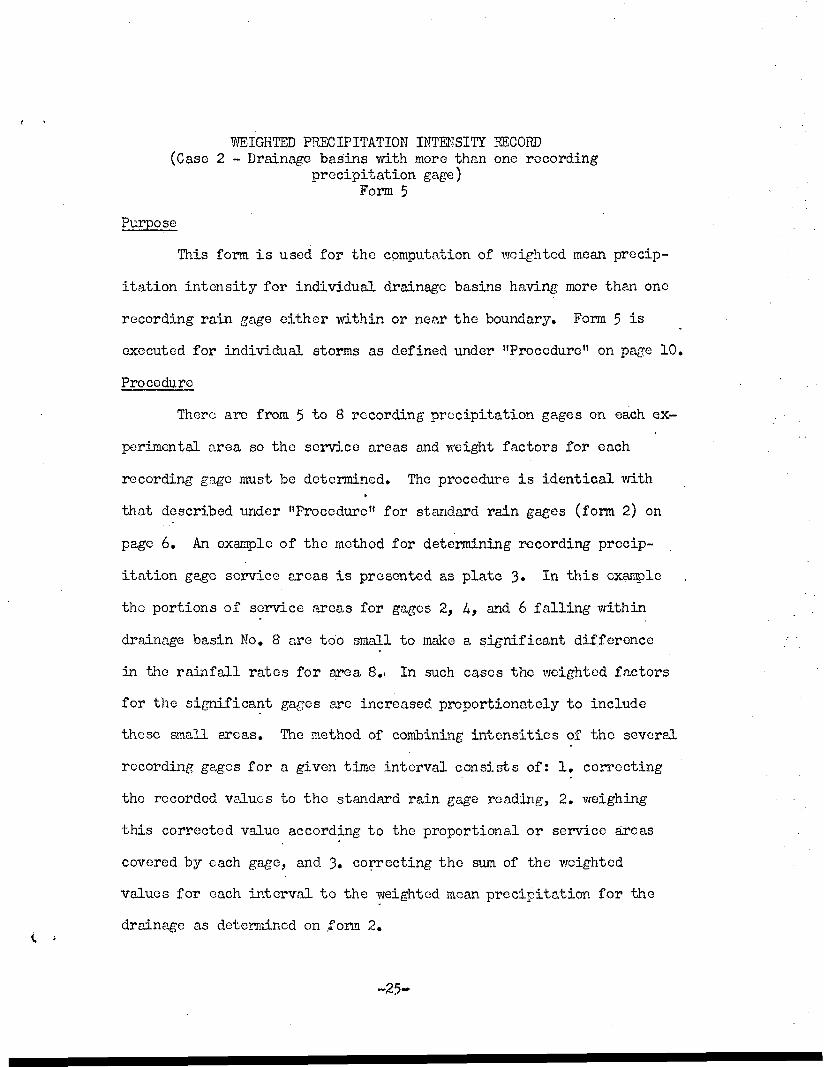
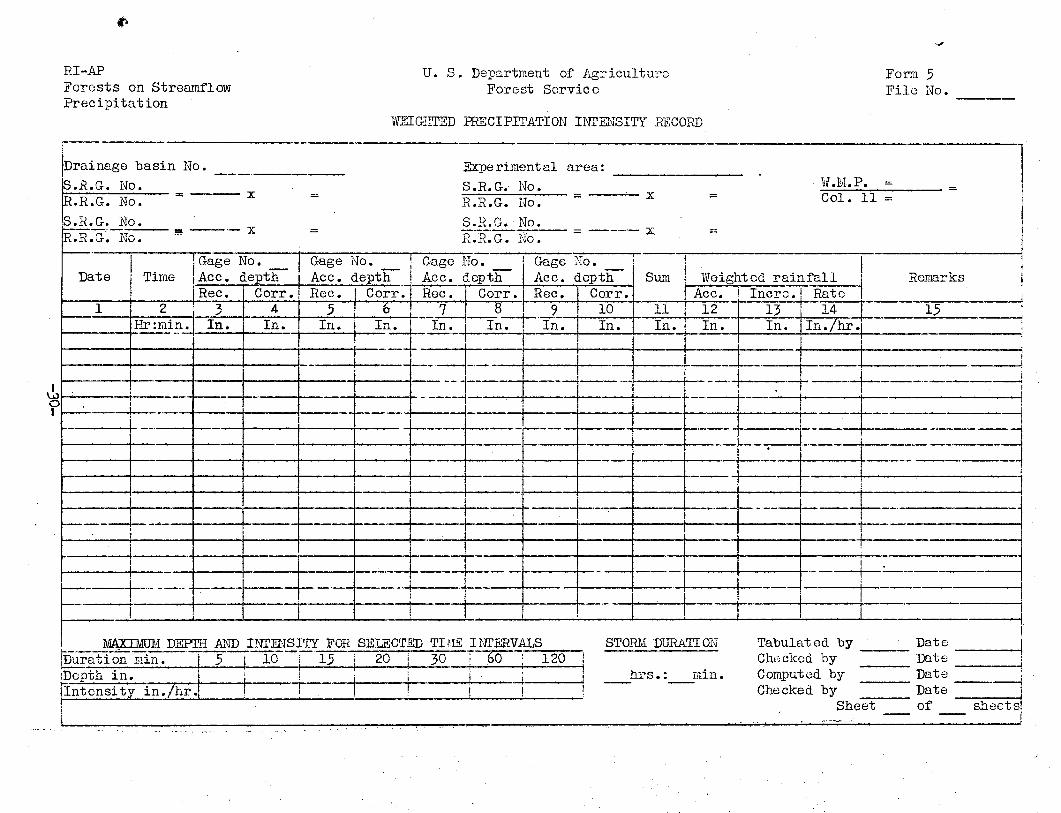
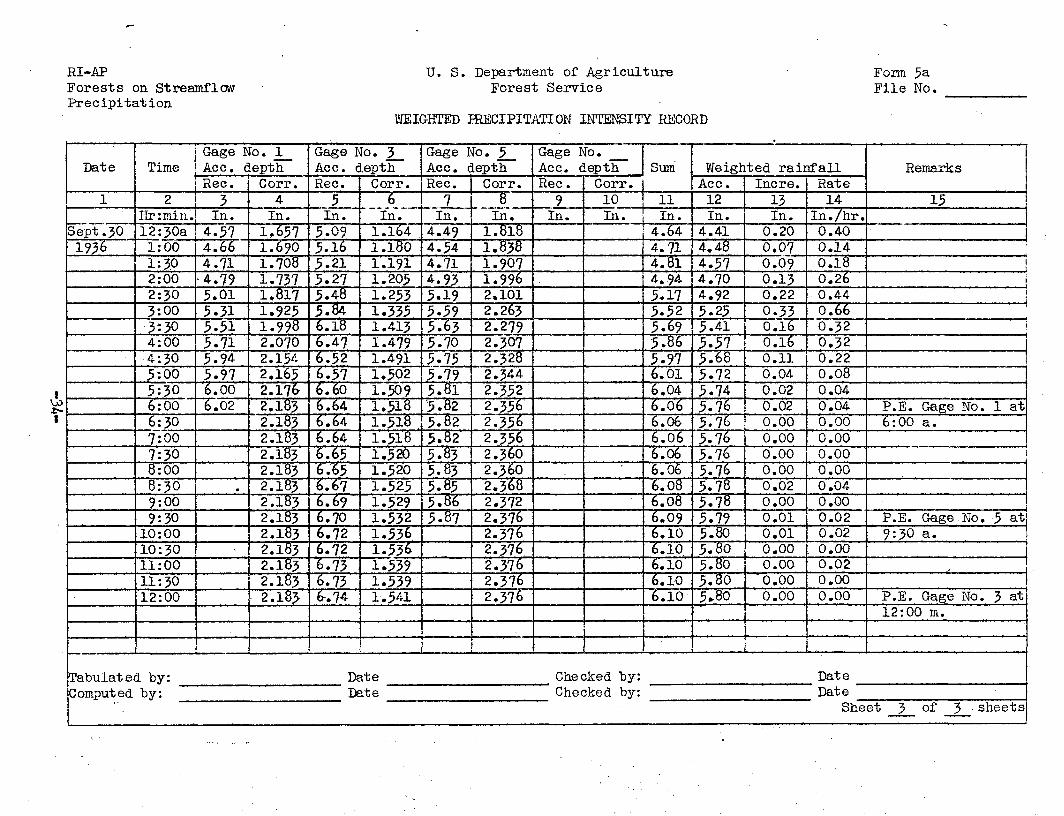
WEIGHTED PRECIPITATION INTENSITY RECORD(Case 2 - Drainage basins with more than one recording
precipitation gage)Form 5
Purpose
This form is used for the computation of weighted mean precip-
itation intensity for individual drainage basins having more than one
recording rain gage either within or near the boundary. Form 5 is
executed for individual storms as defined under "Procedure" on page 10.
Procedure
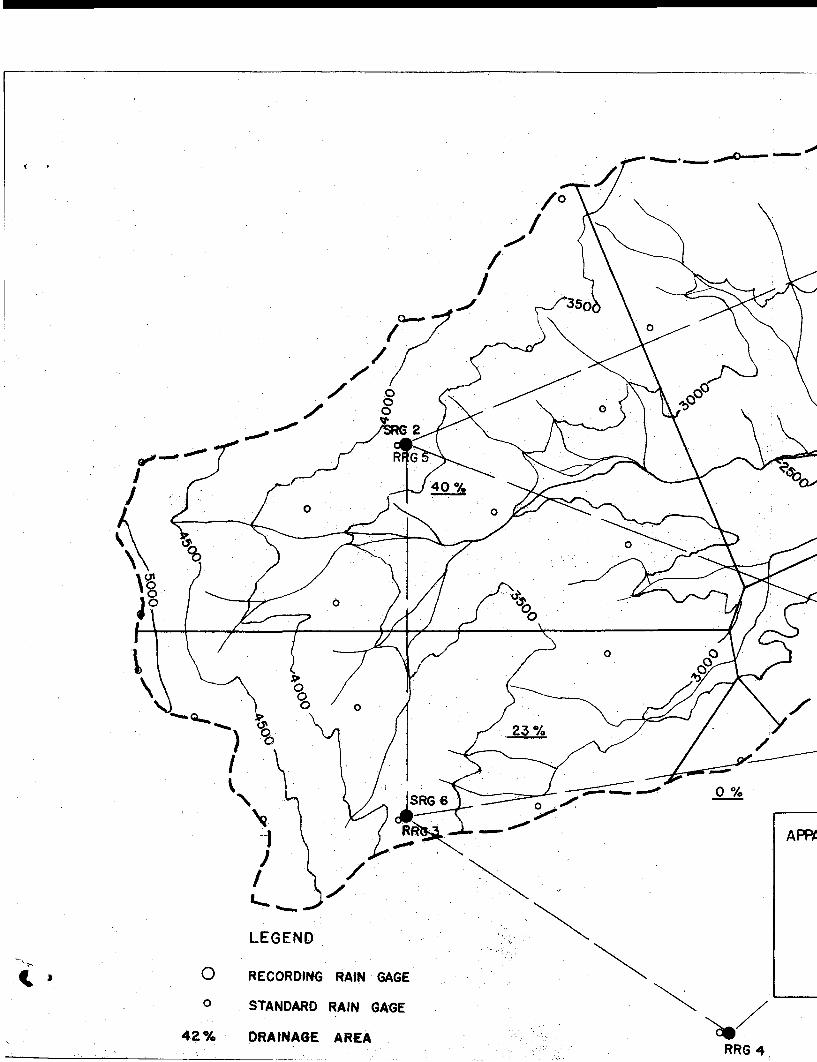
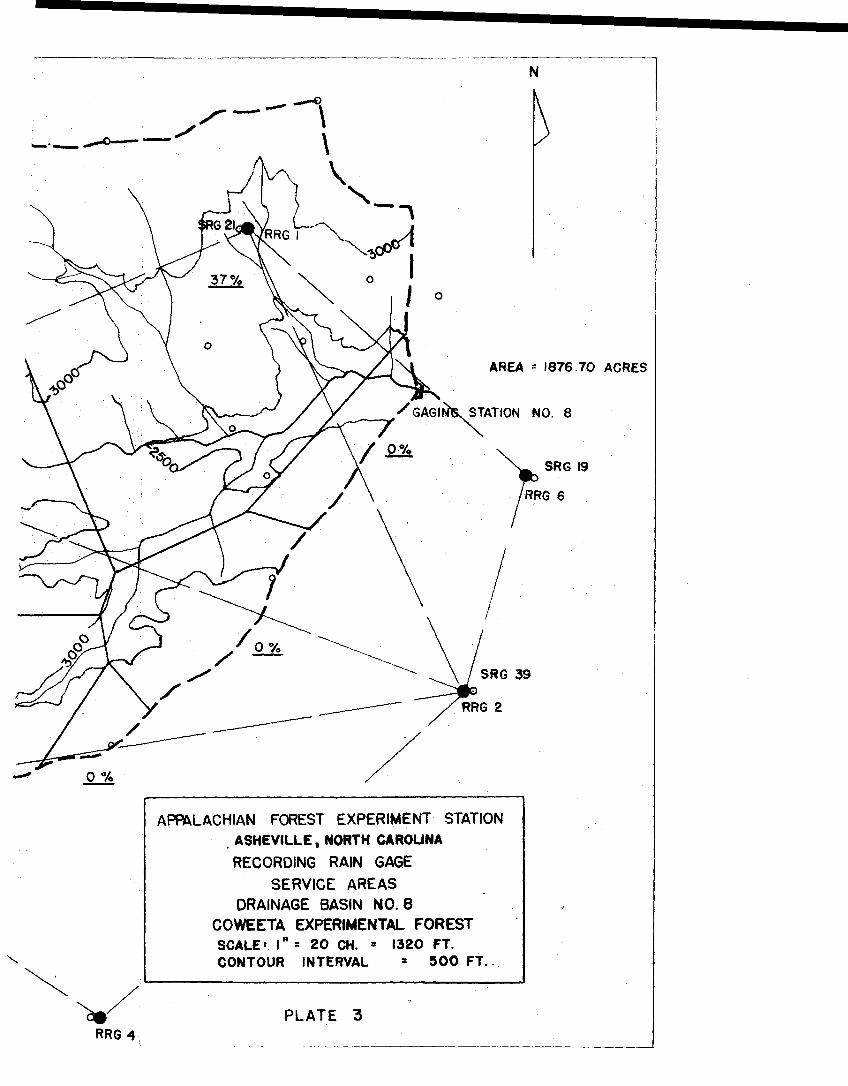
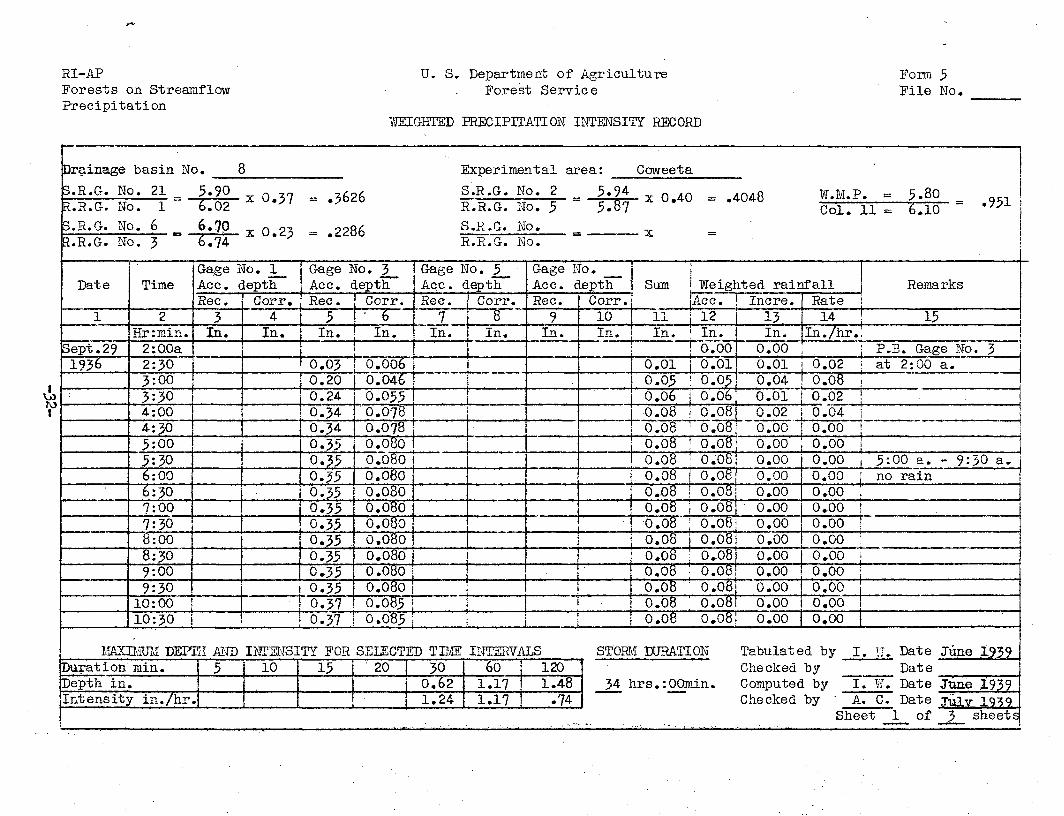
There are from 5 to 8 recording precipitation gages on each ex-
perimental area so the service areas and weight factors for each
recording gage must be determined. The procedure is identical with
that described under "Procedure" for standard rain gages (form 2) on
page 6. An example of the method for determining recording precip-
itation gage service areas is presented as plate 3« In this example
the portions of service areas for gages 2, k, and 6 falling within
drainage basin No. 8 are too small to make a significant difference
in the rainfall rates for area 8.1 In such cases the weighted factors
for the significant gages are increased proportionately to include
these small areas. The method of combining intensities of the several
recording gages for a given time interval consists of: 1, correcting
the recorded values to the standard rain gage reading, 2. weighing
this corrected value according to the proportional or service areas
covered by each gage, and 3. correcting the sum of the weighted
values for each interval to the weighted mean precipitation for the
drainage as determined on jTonn 2,

The recorded values in columns 3, 5, 1, and 9 may be used in
computing weighted precipitation intensities for other drainage basins.
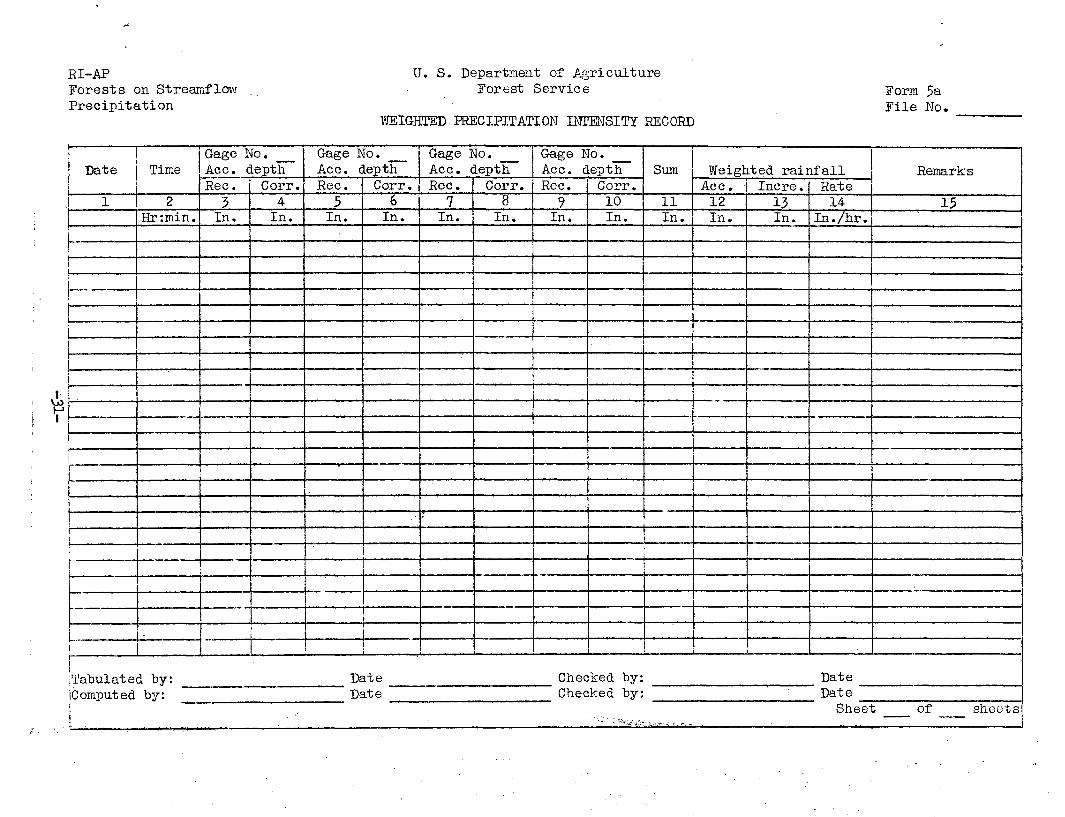
Form 5 is used for the first sheet and form 5a for all additional
sheets required to record an individual storm.
Heading
The drainage basin and experimental area are inserted in the
spaces provided. The standard and recording rain gage numbers are
inserted for each determination of a recording gage correction factor.
In determining the correction factor, the reading for the standard rain
gage installed beside the recording gage is set down as the numerator
of a fraction, the denominator of which is the total recorded rainfall.
This fraction should be identical with that shown on form 3 for the
same storm. The quotient, multiplied by the weight factor of the
recording gage, which is also inserted, is the weighted correction
factor to be applied to recorded values shown below. The correction
factor shown at the right is the weighted mean precipitation for the
drainage basin as obtained from form 2 (bottom of page) divided by
the accumulated total precipitation at the end of the storm, as shown
in column 11. This correction factor is used to obtain the weighted
precipitation for the drainage basin shown in column 12.
Column 1. The date of the rainfall is inserted in column 1.
Column 2. The time in hours and minutes is recorded in
column 2. Since two or more gages are combined,
it is necessary to show the same time intervals
for each gage. The interval to be used for any
drainage area is the smallest time interval -that
-26-
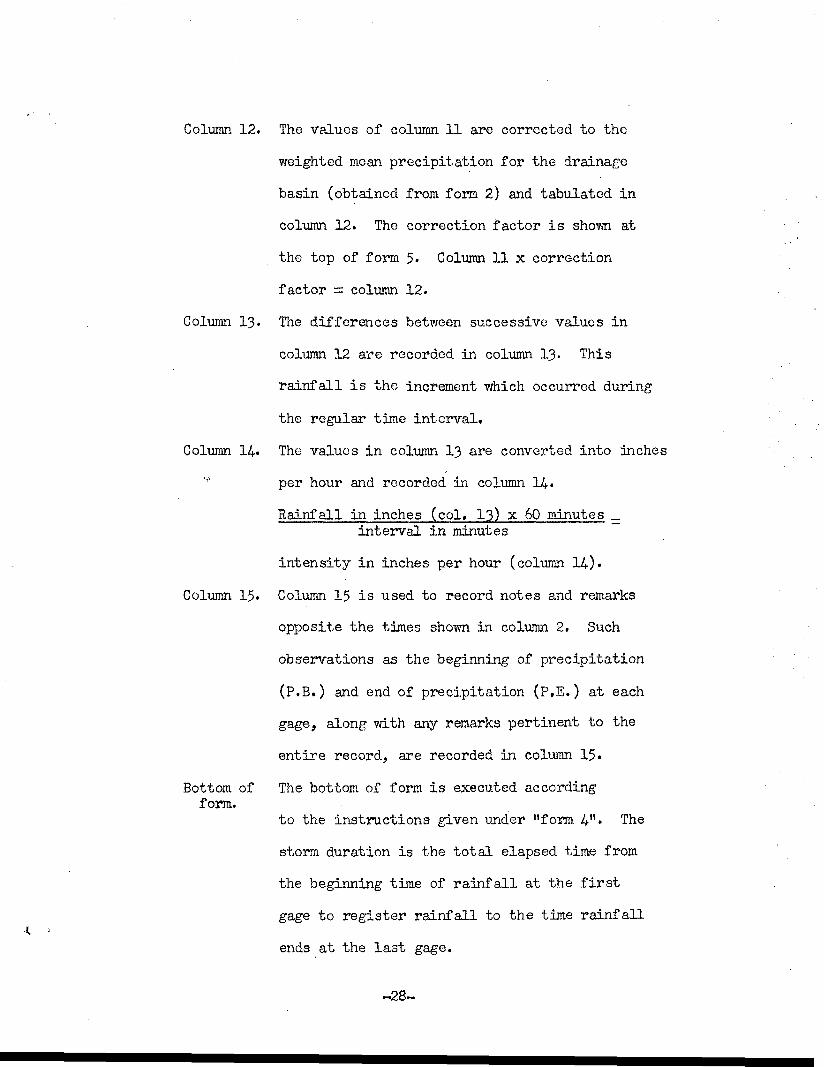
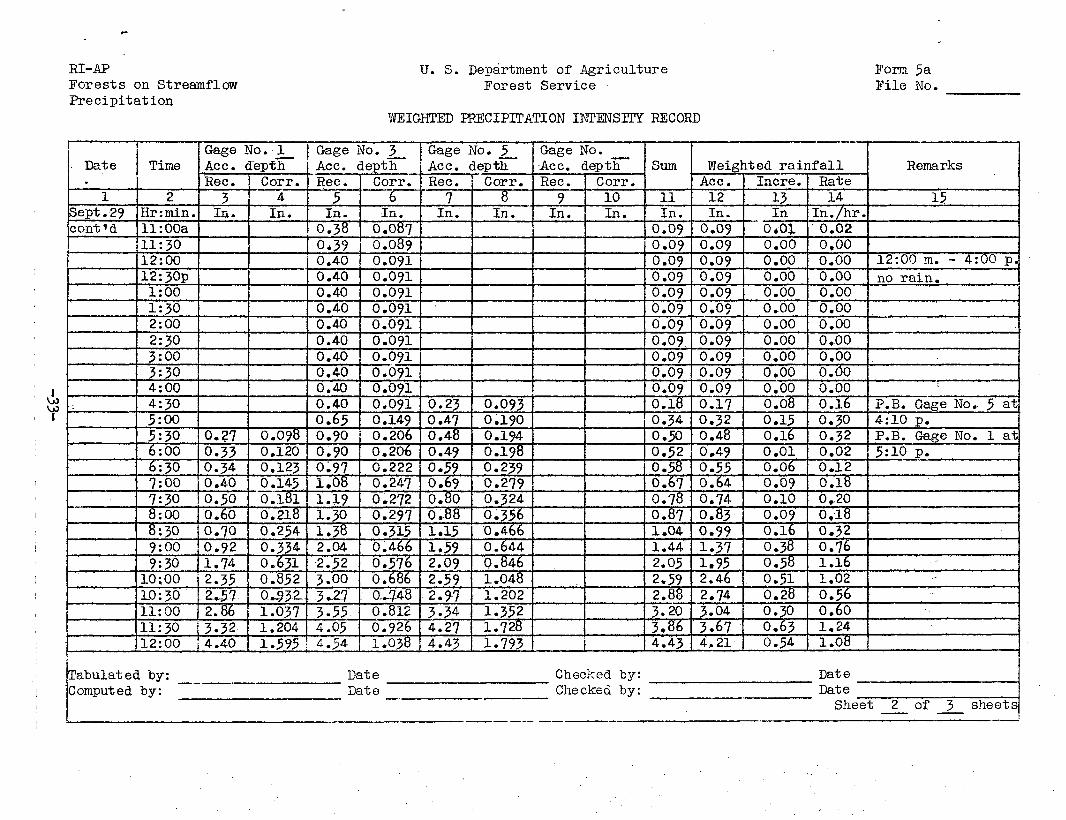
Column 12. The values of column 11 are corrected to the
weighted mean precipitation for the drainage
basin (obtained from form 2) and tabulated in
column 12. The correction factor is shovm at
the top of form 5. Column 11 x correction
factor = column 12.
Column 13. The differences between successive values in
column 12 are recorded in column 13. This
rainfall is the increment which occurred during
the regular time interval.
Column 14. The values in column 13 are converted into inches
per hour and recorded in column 14..
Rainfall in inches (col, 13) x 60 minutes _interval in minutes
intensity in inches per hour (column 14)•
Column 15. Column 15 is used to record notes and remarks
opposite the times shown in column 2. Such
observations as the beginning of precipitation
(P.B.) and end of precipitation (P,E.) at each
gage, along with any remarks pertinent to the
entire record, are recorded in column 15.
Bottom of The bottom of form is executed accordingform.
to the instructions given under "form 4". The
storm duration is the total elapsed time from
the beginning time of rainfall at the first
gage to register rainfall to the time rainfall
ends at the last gage.
-28-
o
o
42%
LEGEND
RECORDING RAIN GAGE
STANDARD RAIN GAGE
DRAINAGE AREA
N
hhs. STATION NO. 8
AREA = 1876.70 ACRES
APPALACHIAN FOREST EXPERIMENT STATION
ASHEVILLE, NORTH CAROLINA
RECORDING RAIN GAGE
SERVICE AREAS
DRAINAGE BASIN NO. 8
COWEETA EXPERIMENTAL FOREST
SCALE' I" • 20 CH. « 1320 FT.CONTOUR INTERVAL « 50O FT.
PLATE 3RRG 4
RI-APForests on StreamflowPrecipitation
U. S. Department of AgricultureForest Service
WEIGHTED PRECIPITATION INTENSITY RECORD
Form 5File No.
iDrainage basin No.
S.R.G. No.R.R.G. No.
S.R.G. No.R.R.G. No.
Date
- 1
Time
2Hrrmin.
j
.;ii
,j
i
X
X
Gage No.Ace . depthRec.
3In.
Corr.4In.
Expe riment al area :
S.R.G.- No.R.R.G. No. A
S.R.G. No.
W.M.P. =Col. 11 -
R.R.G. No. X
Gage No. Gage No.Ace. depth i Ace. depthRec. | Corr.
5In.
! 1
6In.
Rec .
u 7In.
Corr.8In.
Gage No.Ace. depthRec.
9 .*~~ In.
Corr.10In.
Sum
11In.
Weighted rainfallAce. Incre.12In.
MAXIMUM DEPTH AND INTENSITY FOR SELECTED TIME INTERVALS STORM DURATIONDuration rain.Depth in.Intensity in./hr
5 10 i 15 20 | 30 | 60 ; 120 j
i1 j j hrs . : min .
1 1 i !
13In.
'
Rate14
In./hr.
Tabulated byChocked byComputed byChecked by
Remarks i
15
1 i
ij
. ., , ,!
DateDateDateDate
Sheet of sheets
RI-APForests on StreamflowPrecipitation
U. S. Department of AgricultureForest Service
WEIGHTED PRECIPITATION INTENSITY RECORD
Form 5aFile No.
Date
1
tj
J .
Time
2Hr:min.
Gage No.Ace. depthRec.
5In.
Corr.4In.
Gage No.Ace. depthRec.
5In.
Corr.6In.
-•;
i
I
Gage No.Ace. depthRec.
7In.
Corr.8In.
.
- -
Gage No.Ace. depthRec.
9In.
Corr.10In.
Sum
11In.
-——-————- ........
Tabulated by: Date Checked by:jComputedj
by: Date Checked by:
Weighted rainfallAce. Incre.12In.
13In.
Rate14
In./hr.
Remarks
15
i
DateDateSheet of sheets
- -•- ' :-."v; VrV'-"'r'n ' . . L I ,
RI-APForests on StreamflowPrecipitation
U. S, Department of AgricultureForest Service
WEIGHTED PRECIPITATION INTENSITY RECORD
Form 5File No,
Drainage basin No. 8
S.R.G. No. 21R.R.G. N<
S.R.G. N(
5.90D. 1 6.02
3. 6 6. 70R.R.G. No. 3 6.74
Date
1
Sept. 291936
Time
2Hr:min.
2:00a2:303:003:304:004:305:005:306:006:307:007:308:008:309:009:30
x 0.37
x 0.23
Gage Ho. 1Ace . depthRec.
3In.
10:00
16
16
Gage No. 3Ace. depth
Corr. Rec. { Corr.4 5 1 ' 6
In. In. In.1
0.03 0.006j 0.20j 0.24i 0.34
0.34o.350.350.350.350.350.350.350.35
0.0460.055
Experimental area: Coweeta
S.R.G. No. 2 5.94 ^ r, / r
R.R.G. No. 5 5.87 "
S.R.G. No. 7
R.R.G. No.
Gage No. 5Ace . depthRee.
L 7In.
0.0780.0780.0800.0800.0800.0800.0800.0800.080
Corr.8
In.
jIi
0.0800.35 0.0800.35 j
! 0.370.080
ii
0.085 i 110:30 | 0.37 0.085
Gage No.Ace. depth j SumRec.
9In.
Corr.10 11In. In.
i
0.010.050.060.080.080.080.08
i 0.080.080.080.080.08
- • ,j 0.08
0.080.08
! 0.08i ! ! 0.08
> ti1048 W.M.P. - 5.80Col. 11 = 6.10 'n
Weighted rainfall RemarksAce.
12In.O.OO0.010.050.060.08
^0.08"0.08
Incre .13In.
Rate !14 15
In./hr.,0.00 i P.B. Gage No. 30.010.04
0.02 at 2:00 a.0.08 i
0.01 0.020.02 i 0.040.00 0.000.00 0.00
0.08 0.000.080.080.080.080.080.080.080.080.080.08
MAXIMUM DEPTH AND INTENSITY FOR SELECTED TIME INTERVALS STORM DURATIONDuration min.Depth in.Intensity in./hr
5
»
10 15 20
.
300.621.24
60 i 1201.17 1 1.481.17 .74
34 hrs.:00min.
0.000.000.000.000.000.000.000.00
0.00 5:00 a. - 9:30 a.0.00 no rain0.000.000.000.00 ;0.00 j0.000.00
0.00 0.000.00 0.00
Tabulated by I. w. Date June 1539Checked by DateComputed by I. ¥7. Date Jxme X939Checked by ' A. C. Date Jii^v 1939
Sheet 1 of 3 sheets
RI-APForests on StreamflowPrecipitation
U. S. Department of AgricultureForest Service
WEIGHTED PRECIPITATION INTENSITY RECORD
Form 5aFile No.
Bate
1Sept. 29cont'd
Time
2Hr:min.ll:00a11:3012:0012:30p1:001:302:002:303:003:304:004:305:005:306:006:307:007:308:008:309:009:30
10:0010:3011:0011:3012:00
Gage No . 1Jlcc. depthRec.
3In.
0.270.330.340.400.500.600.700.921.742.352*572.863.324.40
Corr.4
In.
0.0980.1200.1230.1450.1810.2180.2540.3340.6310.852Q_932-1.0371.2041.595
Gage No. 3Ace. depthRec.
5In.
0.380*390.400.400.400.400.400.400.400.400.400.400.650.900.900.971.081.191.301.382.042.523.003-273.554.054.54
Corr.6
In.0.0870.0890.0910.0910.0910.0910.0910.0910.0910.0910.0910.0910.1490.2060.2060.2220.2470.2720.2970.3150.4660.5760.686CU-7480.8120.9261.038
Gage No. 5Ace. depthRec.
7In.
0.230.470.480.490.590.690.800.881.151.592.092.592.973.344.274.43
Corr.8
In.
0.0930.1900.1940.1980.2390.2790.3240.3560.4660.6440.8461.0481.2021.3521.7281.793
Gage No.Ace. depthRec.
9In.
Corr.10In.
Tabulated by: Date Checked by:Computed by: Date Checked by:
Sum
11In.
0.090.090.090.090.090.090.090.090.090.090.090.180.340.500.520.580.670.780.871.041.442.052.592.883.203,864,43
Weighted rainfallAce.
12In.
0.090.090.090.090.090.090.090.090.090.090.090.170.320.480.490.550.640.740.830.991.371.952.462.743.043.674.21
Incre.
13In
OiOi0.000.000.000.000.000.000.000.000.000.000.080.150.160.010.060.090.100.090.160.380.580.510.280.300.630.54
Rate14
In./hr.0.020,000.000.000.000.000.000.000.000.000.000.160.300.320.020.120.180,200,180.320.761.161.020.560.601.241.08
Remarks
15
12:00 m. - 4:00 p.
no rain.
P.B. Gage No. 5 at4:10 p.P.B. Gage No. 1 at5:10 p.
-
DateDate
Sheet 2 of 3 sheets
RI-APForests on StreamflowPrecipitation
U. S. Department of AgricultureForest Service
WEIGHTED PRECIPITATION INTENSITY RECORD
Form 5aFile No.
Date
1
Sept. 301936
Time
2
Gage No. 1Ace . depthRec.
3Hr:min. In.12:30a f 4.571:001:302:002:303:003:304:004:305:005:306:006:307:007:308:008:309:009:30
10:0010:3011:0011:3012:00
4.664.714.795.015.315.515.715.945.976.006.02
.
Corr.4
In.1,6571.6901.7081.7371.8171.9251.9982.0702.1542.1652.17&2.1832.1832.1832.1832.1832.1832.1832.1832.1832.1832.1832.1832.1§>
Gage No. 3Ace. depthRec.
I 5In.
5.095.165.215.275.485.846.186.476.526.576.606.646.646.646.656.656.676.696.706.726.726.736.736-. 74
Corr.6
h In. ~11.1641.180
L 1.1911.2051.2531.3351.4131.4791.4911.5021.5091.5181.5181.5181.5201.5201.5251.5291.5321.5361.5361.5391.5391.541
Gage No. 5Ace. depthRec.
7In.
4.494.544.714.935.195.595.635.705.755.795.815.825.825.825.835.835.855.865.8?
Corr.8
In.1.8181.8381.9071.9962.1012.2632.2792.3072.3282.3442.3522.3562.3562.3562.3602.3602.3682.3722.3762.3762.3762.3762.3762.376
Gage No.Ace. depthRec .
9In.
Corr.10In.
Tabulated by: Date Checked by:Computed by: Date Checked by:
Sum
11In.
4.644.714.814.945.175.525.695.865.976.016.046.066.066.066.066.066.086.086.096.106.106.106.106.10
Weighted rainfallAce .
12In.
4.414.484.574.704.925.255.415.575.685.725.745.765.765.765.765.765.785.785.795.805.805.805.805*80
Incre.13In.
0.200.070.090.130.22
L 0.330.160.160.110.040.020.020.00
L 0.000.000.000.020.000.010.010.000.000.000.00
Rate14
In./hr.0.400.140.180.260.440.660.320.320.220.080.040.040.000.000.000.000.040.000.020.020.000.020.000.00
Remarks
15
I
I
P.E. Gage No. 1 at6:00 a.
.P.E. Gage. No. 5 at9:30 a.
P.E. Gage No. 3 at12:00 m.
DateDate
Sheet 3 of 3 • sheets

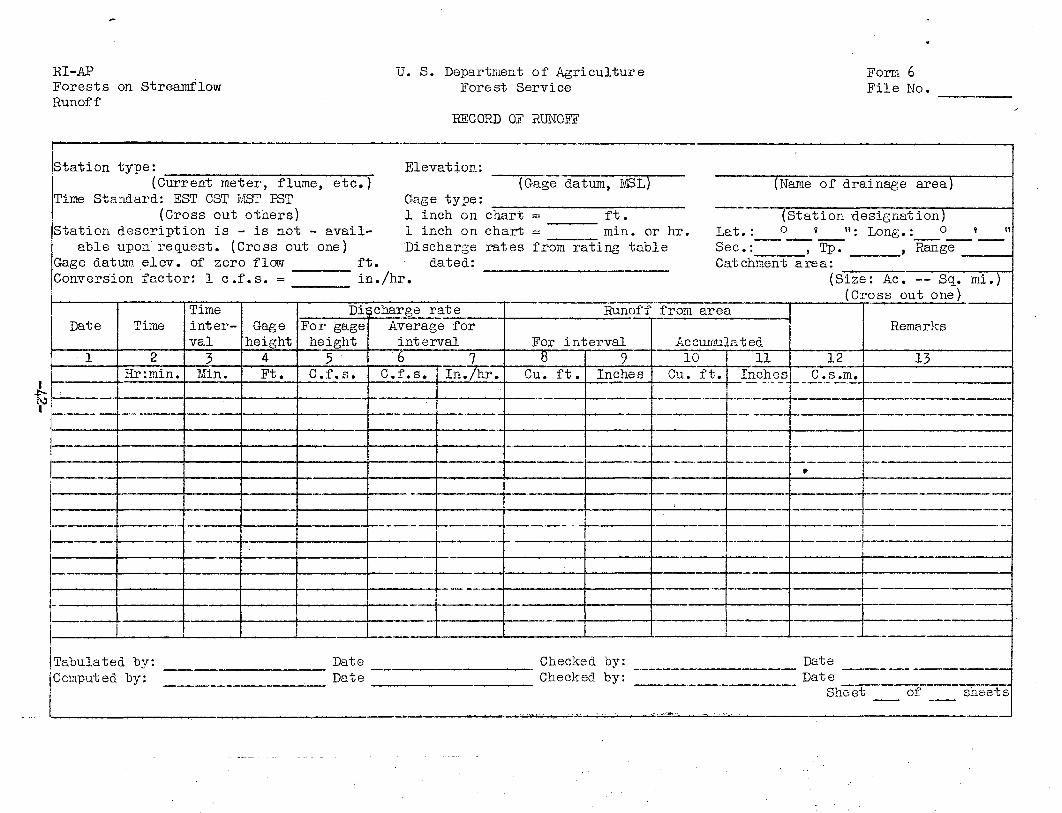
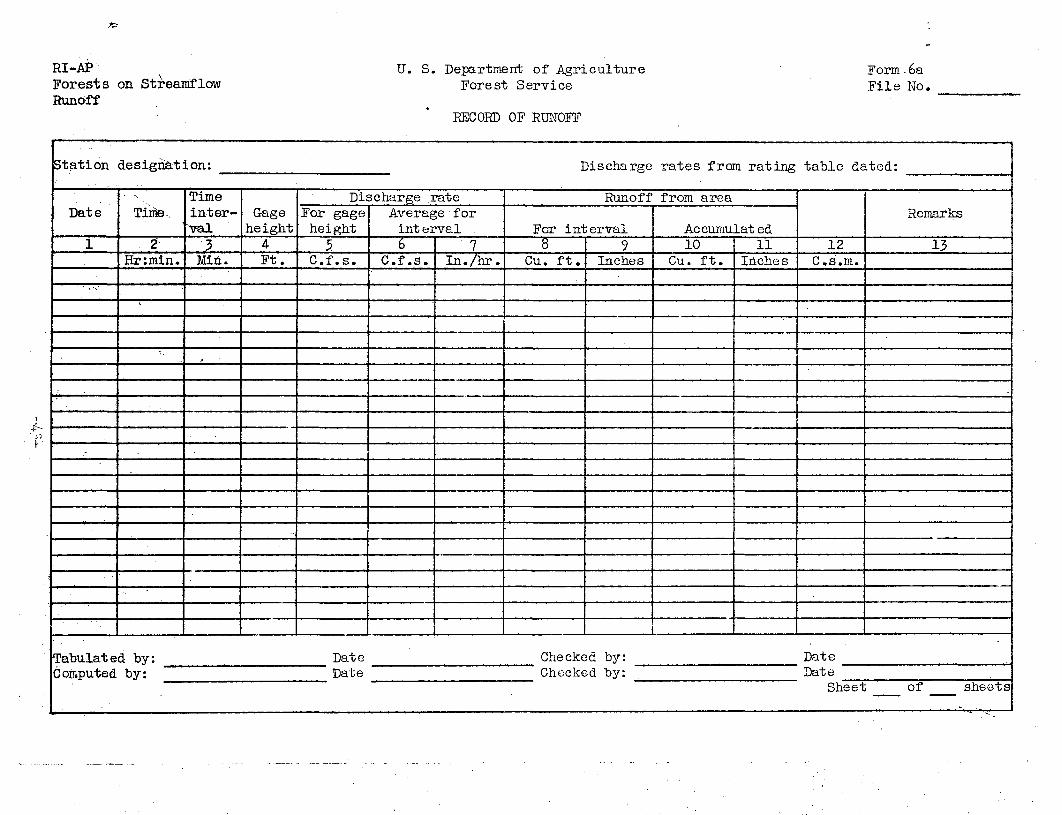
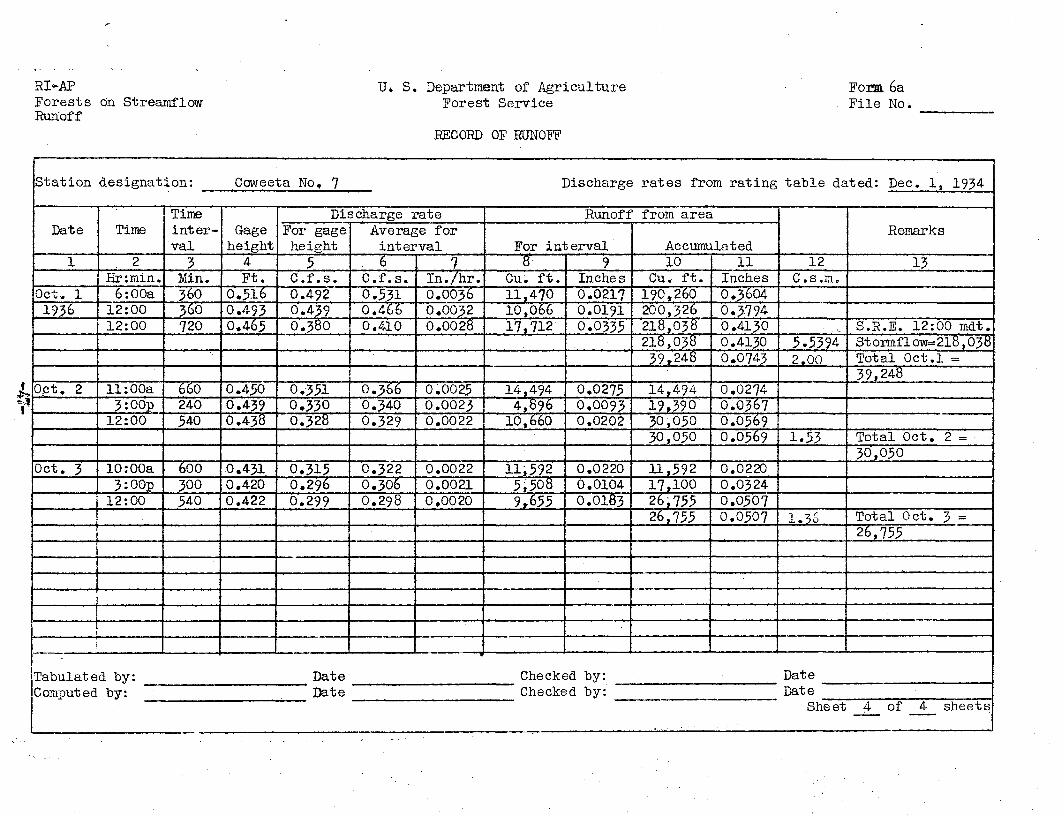
RECORD OF RUNOFFForm 6
Purpose
This form is used in computing a continuous runoff record for
an individual drainage basin. Data are broken down into time inter-
vals of such lengths that the records may be used in the analysis of
storms, water yield.,, baseflow accretion and depletion, infiltration,
and storage or detention.
Procedure
To determine the total runoff by storms as well as by days, it
is necessary to fix the end. of a storm. This is accomplished as follows:
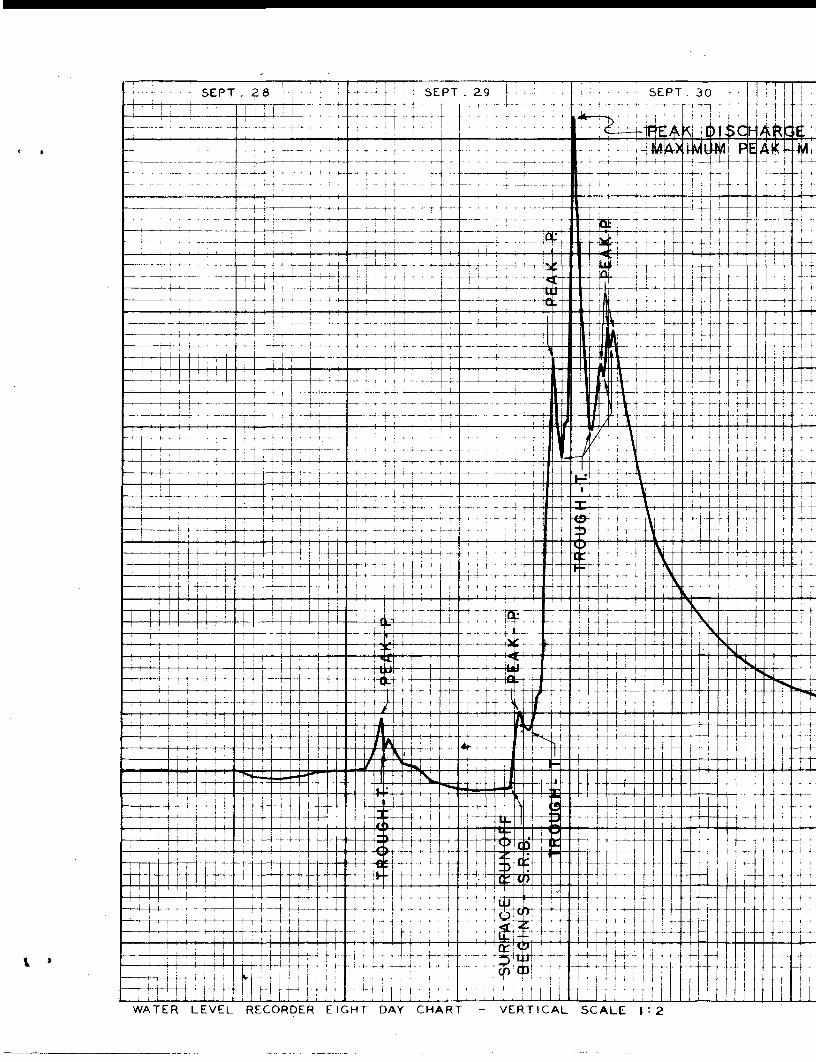
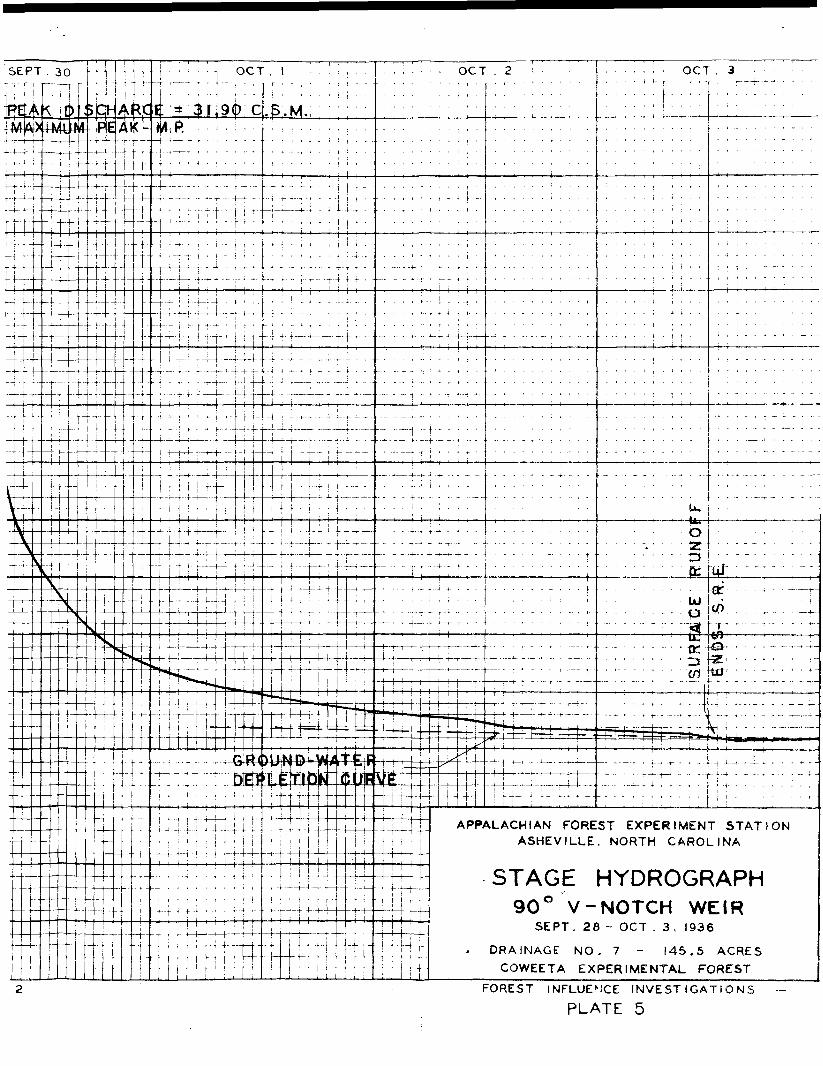
a. Determine a depletion curve for the six-month period
(dormant or growing, as described on page l) for each
drainage basin. This curve is derived from -all original
2/stream gage charts for the six- aonth period. It represents
the relation between head (or gage height) and time, both
to the same scale as the original charts, and is a composite
baseflow depletion curve uninfluenced by any phase of
stormflow.
b. The stage-time depletion curve is then fitted to the-
lower end of the recession side of the stage hydrograph
for the storm in question.
c. The time at which the depletion curve departs from the
storm hydrograph is considered the end of the storm.
The method is illustrated on plate 5«
2/ If it is necessary to obtain the end point of storms before aparticular six-month record is available, it may be done by using anaverage depletion curve obtained from past records for the dormantor growing periods.
-35-
Form 6 is designed to permit accurate reproduction of the stream
hydrograph. To keep the runoff error small, the time interval is limited
by two factors: 1. the curvature of the stage hydrograph, and 2, the
curvature of the stage-discharge relation. Both factors produce a cumu-
lative error, the net result of which is usually over-estimated discharge.
The error due to curvature of the stage hydrograph is eliminated by break-
ing the hydrograph into segments which do not have appreciable curvature
while the error due to curvature of the stage-discharge relation is
reduced by breaking the hydrograph into short intervals. An allowable
error of one percent has been designated for runoff computations and to
obtain this degree of accuracy, charts similar to plate 4 have been
prepared. Referring to plate 4 for a 90 degree V-notch weir, the mean
of the discharge at the beginning and at the ending of the interval
is the mean discharge for the interval within one percent error if the
curve of the interval (for 10, 20, etc. minutes) lies above the given
combination of slope and mean head.
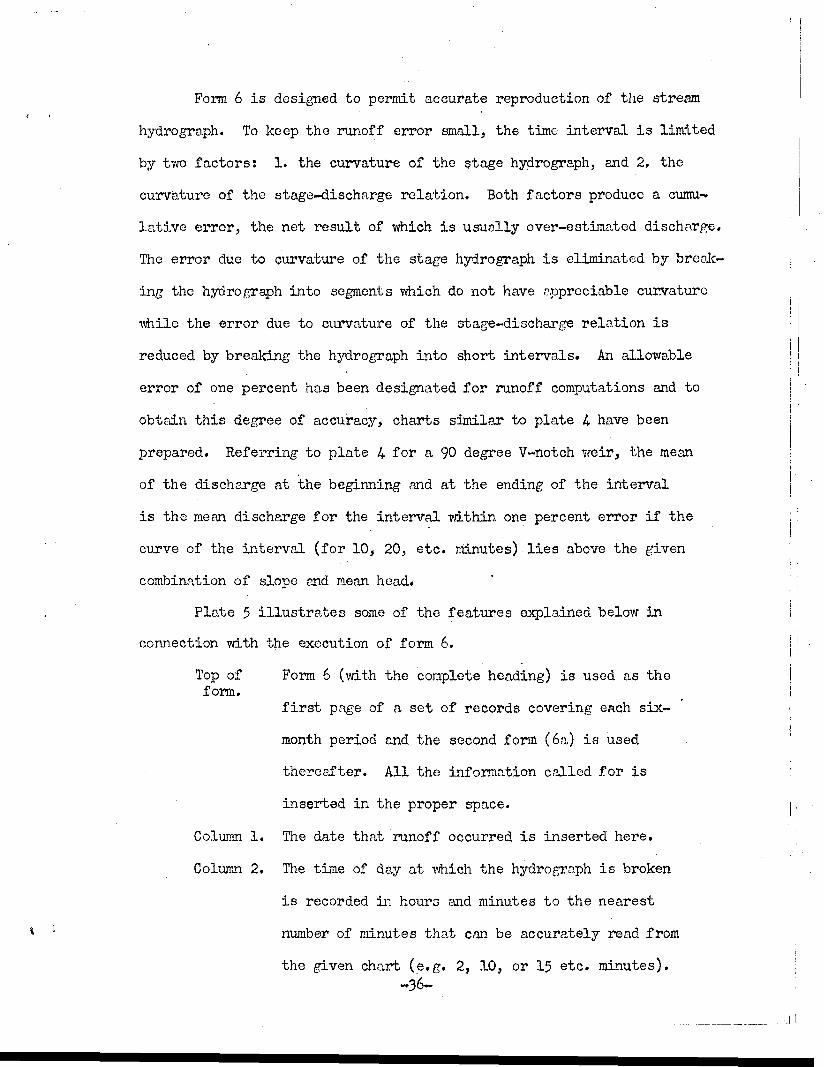
Plate 5 illustrates some of the features explained below in
connection with the execution of form 6.
Top of Form 6 (with the complete heading) is used as theform.
first page of a set of records covering each six-
month period and the second form (6a) is used
therec?,fter. All the information called for is
inserted in the proper space.
Column 1. The date that runoff occurred is inserted here.
Column 2, The time of day at which the hydrograph is broken
is recorded in. hours and minutes to the nearest
number of minutes that can be accurately read from
the given chart (e.g. 2, 10, or 15 etc. minutes).
-36-

A break in the hydrograph is always made at
midnight,, at all peaks> at all troughs, and at
definite changes in the slope of the hydrograph.
In listing the times, a line is left blank preced-
ing the time of the beginning of stormflow, likewise
after midnight and after the end of stormflow.
Column 3- The time intervals in minutes between successive
breaks (or between the times of col. 2) of the
hydrograph are tabulated.
Column 4« Gage heights at the breaks of the hydrograph (or
at the times shown in col. 2) are read from the
hydrograph and recorded in column 4«
Column 5« Discharge rates in cubic feet per second for the
gage heights of column 4 are obtained, from the
stage-discharge table for the measuring device /
employed, and are inserted in column 5«
Column 6. In column 6 are recorded the average discharge
rates in c.f.s. for the time intervals of column 3-
These values are obtained by averaging the successive
discharge rates of column 5«
Column ?• The discharge rates of column 6 are converted into
inches per hour and tabulated in column ?• These
values are obtained by multiplying each of the
column 6 figures by the conversion factor shown
in the heading of form 6. The conversion factor =
3600 x 12433560 x drainage area in acres
2/ For the 90 degree V-notch weir used in the following example seeH. W. King, Handbook of Hydraulics, table 48, pp. 141-14-4.
-37-
Column 8, Column 8 is usod to record the runoff from the
drainage basin in cubic feet for the tine intervals
of column 3. Column 8 = column 3 x column 6 x 60 sec. ,
Column 9» The runoff from the drainage basin in inches for the
tine intervals of column 3 are listed in column 9.
Column 9 - column 7 x co P 3 or60
Column 8 x 12drainage area in acres x 43,560
Column 10. Column 10 shows the accumulated runoff from the
drainage basin in cubic feet. It is obtained by
adding the values in column 8 and recording the sum
opposite the last figure added. Thus, any value in
column 10 represents the total runoff from the
starting point to the time shown in column 2. In
order to show total runoff by storms as well as
by days, starting points for accumulated runoff are
always taken at the beginning and ending of storm
runoff. They are also taken at each midnight when
there is no stormflow. Accumulated runoff during
a storm is carried beyond midnight to the end of
stormflow in which case the daily total runoff is
recorded on the blank line -which follows each mid-
night. Total stom runoff is similarly recorded.
Column 11. The values in column 10 are converted .into inches
and recorded in column 11.
Column 11 = Column 10 x 12drainage area in acres x 43,560
Column 12. Column 12 is used for shovdng the nean daily
discharge in cubic feet per second per square
A/mile (c.s.m.) ^
P~I I IT™ T O - Column 10 (daily total) x 640OOJ.UUU1 _L<£ — — . rt./ i r\r\drainage area in acres x 86,400
The maxima peak discharge rate in c.f.s. is
converted to c.s.iru and also recorded in column 12.
Column 13. The remarks inserted in column 13 must include the
following:
Storm (or surface) runoff begins (S.R.B.)
Peak (P) noted at each point where the hydrograph
changes from a rising to a falling stage.
Maximum Peak (M.P.) the highest peak of the entire
storm.
Trough (T) noted at each point where the hydrograph
changes from a falling to a rising stage.
Storm (or surface) runoff ends (S.R.E.)
Column 13 is also used for recording any observations, remarks,
or notes pertaining to the chart record or to any of the computations
required in executing the form*
y The heading of this column is left blank so that any conversionsor data required by other agencies may be inserted.
-39-
FOR -FROM IJCAN OF |SJWSS *T BEGINNING
: f f.Ai i luikni; n catma :nic- rywr bee
^ RI1MDFF
WATER LEVEL RECORDER EIGHT DAY CHART - VERTICAL SCALE \ • 2.
OCT. 3. - . t I- t
SEPT. 30 \
APPALACHIAN FOREST EXPERIMENT STATIONASHEVILLE. NORTH CAROLINA
STAGE HYDROGRAPH
90" V-NOTCH WEIRSEPT. 28 - OCT . 3, 1936
DRAINAGE NO . 7 - 145.5 ACRESCOWEETA EXPERIMENTAL FOREST
FOREST INFLUENCE INVESTIGATIONS
PLATE 5
RI-APForests on StrearaflowRunoff
U. S. Department of AgricultureForest Service
RECORD OF RUNOFF
Form 6File No.
Station type: Elevation:(Current meter, flume, etc.
Time Standard: SST GST MST PST(Cross out others)
Station description is - is not - avail-able upon request. (Cross out one)
Gage datum elev. of zero flow fj
Conversion factor: 1 c .1
Date
1
|!
Time
2Hr:min.
Timeinter-val
3Min.
r a. s. — ij
Gageheight4Ft.
Gage(Gage datum, MSL) (Name of drainage area)
type:1 inch on chart = ft . (Station designation)1 inch on chart = min. or hr. Lat. : ° « ": Long.: ° » "Disc
fc. di./hr.
harge rates from rating table Sec.: , Tp. , Rangeated: Catchment
Discharge rateFor gageheight5
C.f.s.
Average forinterval6 7
C.f.s. In./hr.
Runoff from area
For interval8
Cu. ft.9
Inche s
Tabulated by: Date Checked by:Computed by: . Date Checked by:
Accumulated10
Cu. ft.
,
11Inches
area:(Size: Ac. — Sq.. mi.)(Cross out one)
12C . s.m.
»
Remarks
13
\. ..
DateDate
Sheet of sheets
,, .... ., , ._..,,,„., . .,.,..
RI-APForests on StreamflowRunoff
II. S. Department of AgricultureForest Service
RECORD OF RUNOFF
Form . 6aFile No.
Station designation:
Date
1
-
Tiine .
2Hrimin.
Discharge rates from rating table dated:
Timeinter-nal
3Min.
Gageheight4Ft.
Discharge rateFor gageheight
5C.f.s.
Average forint erval6
C.f.s.7
In./hr .
Runoff from area
For interval8
Cu. ft.9
Inches
Accumulated10
Cu. ft.11
Inches12
C.s.m.
Remarks
13
Tabulated by: Date Checked by: DateComputed by: Date Checked by: Date
Sheet of sheets
.. -. ..
.I- -
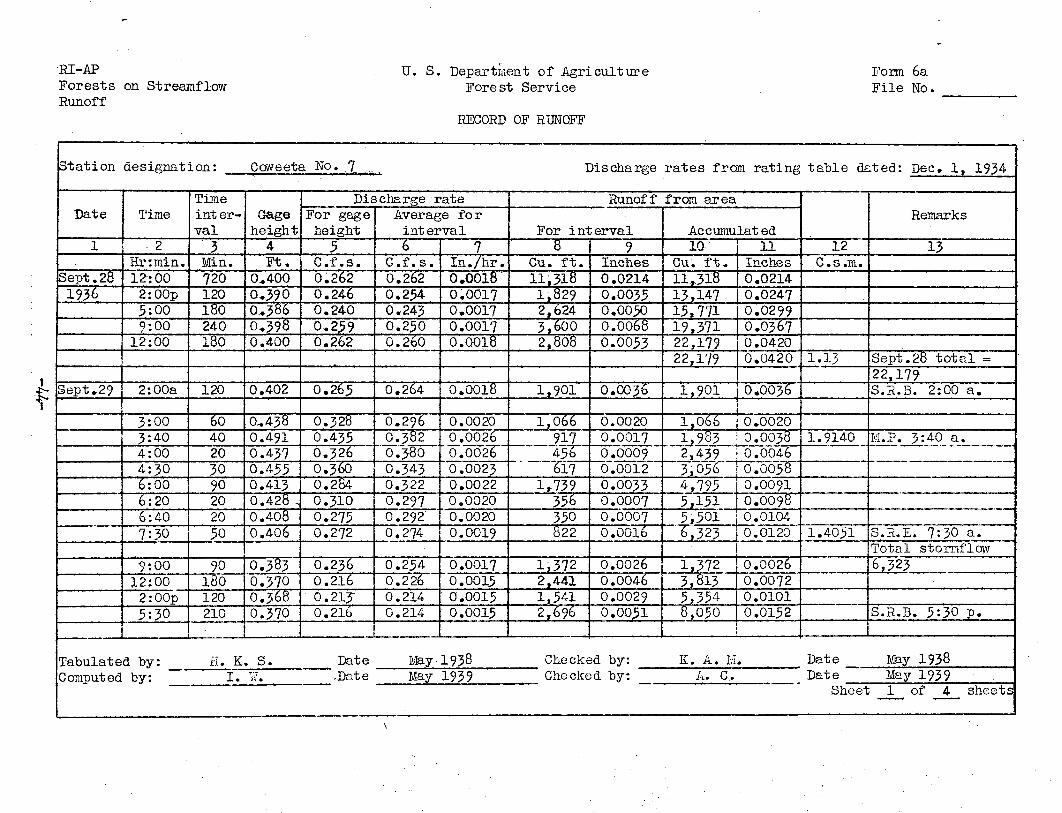
RI-APForestsRunoff
on StreamflowU. S. Department of Agriculture
Forest Service
RECORD OF RUNOFF
Form 6aFile No.
Station designation: Coweeta No. 7 _.
Date
1
Sept. 281936
Sept. 29
Time
2Hr:min.12:002:00p5:009:00
12:00
2:00a
3:00J:404:004:306:006:206:407:30
9:0012:00
2:00p5:30
Discharge rates from rating table dated: Dec. 1, 1934
Timeint er-val
3Min.720120180240
L180
120
6040203090202050
90180120210
Gageheight
4Ft.
0.4000.3900..3860,3980.400
0.402
0..4380.4910.4370.4550.4130.428 ,0.4080.406
0.3830.3700.3680.370
Discharge rateFor gageheight
5C.f.s.0.2620.2460.2400.2590.262
0.265
0.3280.4350.3260.3600.2840.3100.2750.272
0.2360.2160.213-0.216
Average f o rinterval6
C.f.s.0.2620.2540.2430.2500.260
0.264
0.2960.382
r O.~3800.3430.3220.2970.292"0.274
0.2540.2260.2140.214
7In./hr.0.00180.00170.00170.00170.0018
0.0018
0.00200.00260.00260.00230.00220.00200.00200.0019
0.00170.00150.00150.0015
Runoff from area
For interval8
Cu. ft.11,3181,8292,6243,6002,808
1,901
1,066917456
h 6T71,739
356350822
1,3722,4411,5412,696
9Inches0.02140.00350.00500.00680.0053
0.0036
0.00200.00170.00090.00120.00330.00070.00070.0016
0.00260.0046
L 0.00290.0051
Accuraulat ed1Q-
Cu. ft.11,31813,14715,77119,37122,17922,179
1,901
1,0661,933
L_ 2>439 _^^3,056 ^
4,7955,1515,5016,323
•1,3723,8135,3548,050
11Inches
J3.0214.0.02470.02990.03670.04200.0420
0.0036
0.00200.00380.00460.00580.00910.00980.01040.0120
^.00260.00720.01010.0152
12C.s.m.
1.13
1.9140
1.4051
Remarks
13
Sept. 28 total =22,179S.R.B. 2:00 a.
M.P. 3:40 a.
S.R.E. 7=30 a.Total stormflow6,323
S.R.B. 5:30 p.
Tabulated by: H. K, S. Date May 1938 Checked by: K. A. M. Date May 1938Computed by: I. W. .Date May 1939 Checked by: A. C.. Date May 1939
Sheet 1 of 4 sheets
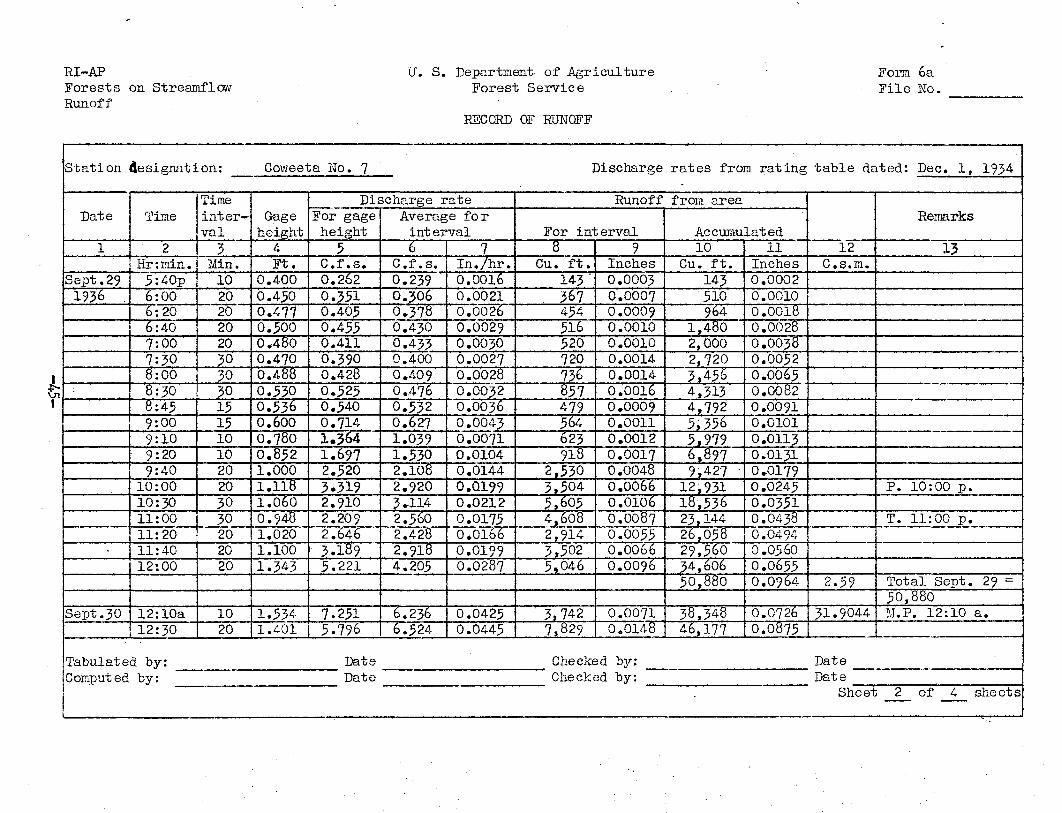
RI-APForestsRunoff
on StreamflowJ. S. Department of Agriculture
Forest Service
RECORD OF RUNOFF
Form 6aFile No.
Station designation: Coweeta Ho. 7
Date
1
Sept. 291936 .
Sept. 30
Time
2hHr:nin.
5:40p6:006:206:407:007:308:008:308:459:009:109:209:40
10:0010:3011:0011:2011:4012:00
12:10aL 12:30
Discharge rates from rating table dated: Dec. 1, 1934.
Timeinter-val
3Min.10202020203030301515101020203030202020
1020
Gageheight
4Ft.
0.4000.4500.4770.5000.4800.4700.4880.5300.5360.6000.7800.8521.0001.1181.0600.9481.0201.1001.343
1.5341.401
Discharge rateFor gageheight
5C.f.s.0.2620.3510.4050.4550.4110.3900.4280.5250.5400.7141.3641.6972.5203.3192.910
L_2.2092.6T63.1895.221
7.2515.796
Average forint erval6
C.f.s.0.2390.3060.3780.4300.4330.4000.4090.4760.5320.6271.0391.5302.1082.9203-1142.5602.4282.9184.205
6.2366.524
7In./hr.0.00160.00210.00260.00290.00300.00270.00280.00320.00360.00430.00710.01040.01440.0.1990.02120.01750.01660.01990.0287
0.04250.0445
Runoff from area
For interval8
Cu. ft.14336?454516520720736857479564623918
2,5303,5045,6054,6082,9143,5025,046
3,7427,829
9Inches0.00030.00070.00090.00100.00100.00140.00140.00160.00090.00110.00120.00170.00480.00660.01060.0087
ro.6o55l0.00660,0096
0.00710.0148
Accumulated10
Cu. ft.143510964
1,4802,0002,7203,4564,3134,7925,3565,9796,8979,427 •
12,93118,53623,14426,05829,56034,60650,880
38,34846,177
11Inches0.00020.00100.00180.00280.00380.00520.00650.00820.00910.01010.01130.01310.01790.02450.03510.04380.04940.05600.06550.0964
0.07260.0875
12C.s.m.
2.59
31.9044
Remarks
13
P. 10:00 p.
T. 11:00 p.
Total Sept. 29 =50,880M.P. 12:10 a.
Tabulated by: Date Checked by: DateComputed by: Date Checked by: Date
Sheet 2 of 4 sheets
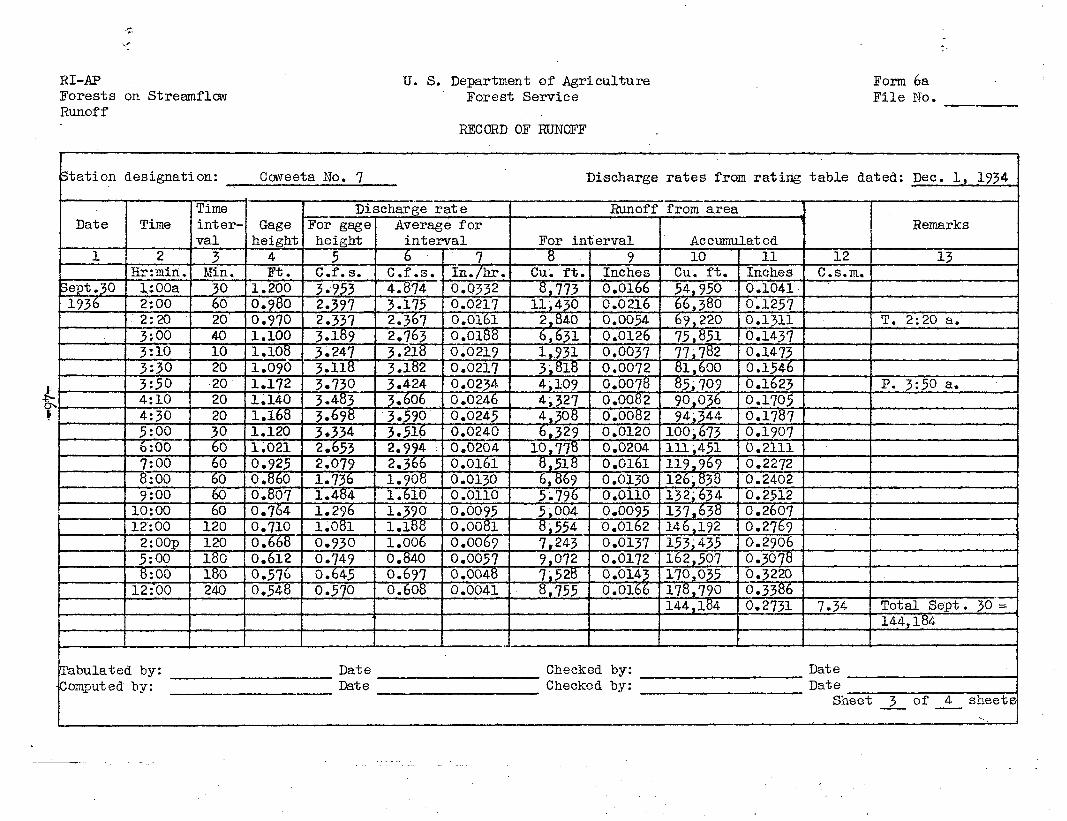
RI-APForestsRunoff
on StreamflowU. S. Department of Agriculture
Forest Service
RECORD OF RUNOFF
Form 6aFile No.
£T
Station designation: Coweeta No. 7
Date
1
Sept. JO1936
Time
2Hr:miri.l:00a2:002:203:003:103:303:504:104:305:006:007:008:009:00
10:0012:00
2:00p5:008:00
12:00
Timeinter-val
3Min.
306020401020202020306060606060
120120180180240
Discharge rates from rating table dated: Dec. 1, 1934
Gageheight
4Ft.
1.2000.9800.9701.1001.1081.0901.1721.1401.1681.1201.0210.9250.8600.8070.7640.7100.6680.6120.5760.548
Discharge rateFor gageheight
5C.f.s.3.9532.3972.3373.1893.2473.1183-7303.4833.6983.3342.6532.0791.7361.4841.2961.0810.9300.7490.6450.570
Average forinterval6
C.f.s.4.8743.1752.3672.7633.2183.1823.4243.6063.5903.5162.9942.3661.9081.6101.3901.1881.0060.8400.6970.608
7In./hr.0.03320.02170.01610.01880.02190.02170.02340.02460.02450.02400.02040.01610.01300.01100.00950.00810.00690.00570.00480.0041
Runoff from area
For interval8
Cu. ft.8,773
11,4302,8406,6311,9313,8184,1094,3274,308.6,329
10,7788,5186,8695.7965,0048,5547,2439,0727,5288,755
9Inches0.01660.02160.00540.01260.00370.00720.00780.00820.00820.01200.02040.01610.01300.01100.00950.01620.01370.01720.01430.0166
Accumulated10
Cu. ft.54,95066,38069,22075,85177,78281,60085,70990,03694,344
100,673in, 451119,969126,838132,634137,638146,192153,435162,507170,035178,790144,184
11Inches0.10410.12570.13110.14370.14730.15460.16230.17050.17870.19070.21110.22720.24020.25120.26070.27690.29060.30780.32200.33860.2731
12C.s.m.
7.34
Remarks
13
T. 2:20 a.
P. 3:50 a.
Total Sept. 30 =144,184
Tabulated by: Date Checked by: DateComputed by: Date Checked by: Date
Sheet 3 of 4 sheets
RI-APForestsRunoff
on StreamflowII» S. Department of Agriculture
Forest Service
RECORD OF RUNOFF
Form 6aFile No.
Station designation: Coweeta No, 7
Date
1
Oct. 11936
Oct. 2
Oct. 3
Time
2Hrcrain.
6:00a12:0012:00
ll:00a3:00p
12:00
10:00a3:00p
12:00
i
Discharge rates from rating table dated: Dec. 1, 1934
Timeinter-val
3Min.360360720
660240540
600300540
Tabulated by:Computed
Gageheight
4Ft.
0.5160.4930.465
0.4500.4390.438
0.4310.4200.422
Discharge rateFor gageheight
5C.f .s.0.4920.4390.380
0.3510.3300.328
0.3150.2960.299
Average forinterval6
C.f.s.0.5310.4660.410
0.3660.3400.329
0.3220.3060.298
7In./hr.0.00360.00320.0028
0.00250.00230.0022
0.00220.00210.0020
Runoff from area
For interval8
Cu. ft.11,47010,06617,712
14,4944,896
10,660
11,5925,5089,655
9Inche s0.02170.01910.0335
0.02750.00930.0202
0.02200.01040.0183
Accumulated10
Cu. ft.190,260200,326218,038218,03839,248
14,49419,39030,05030,050
11,59217,10026,75526,755
11Inches0.36040.37940.41300.41300.0743
0.02740.03670.05690.0569
0.02200.03240.05070.0507
12C.s.ia.
5.53942.00
1.53
1.36
Remarks
13
S.R.E. 12:00 mdt.Stormflow=:2l8,038Total Oct.l =39,248
Total Oct. 2 =30,050
Total Oct. 3 =26,755
Date Checked by: Dateby: Date Checked by: Date
Sheet 4 of 4 sheets
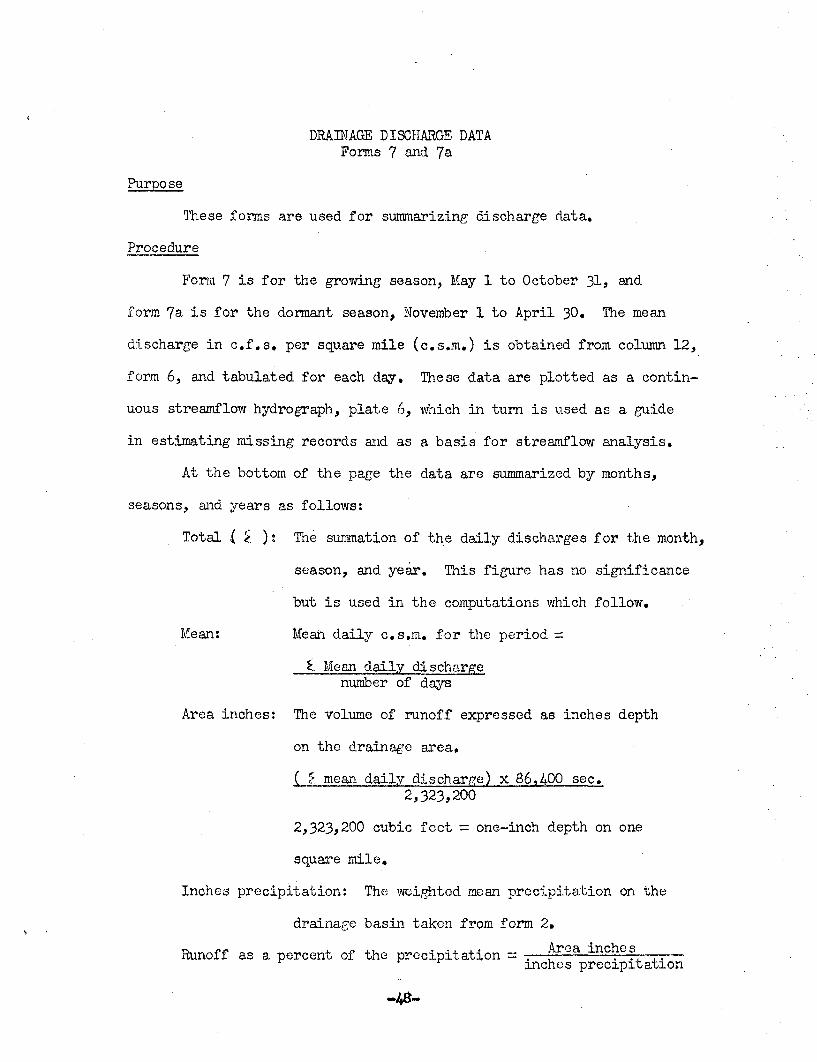
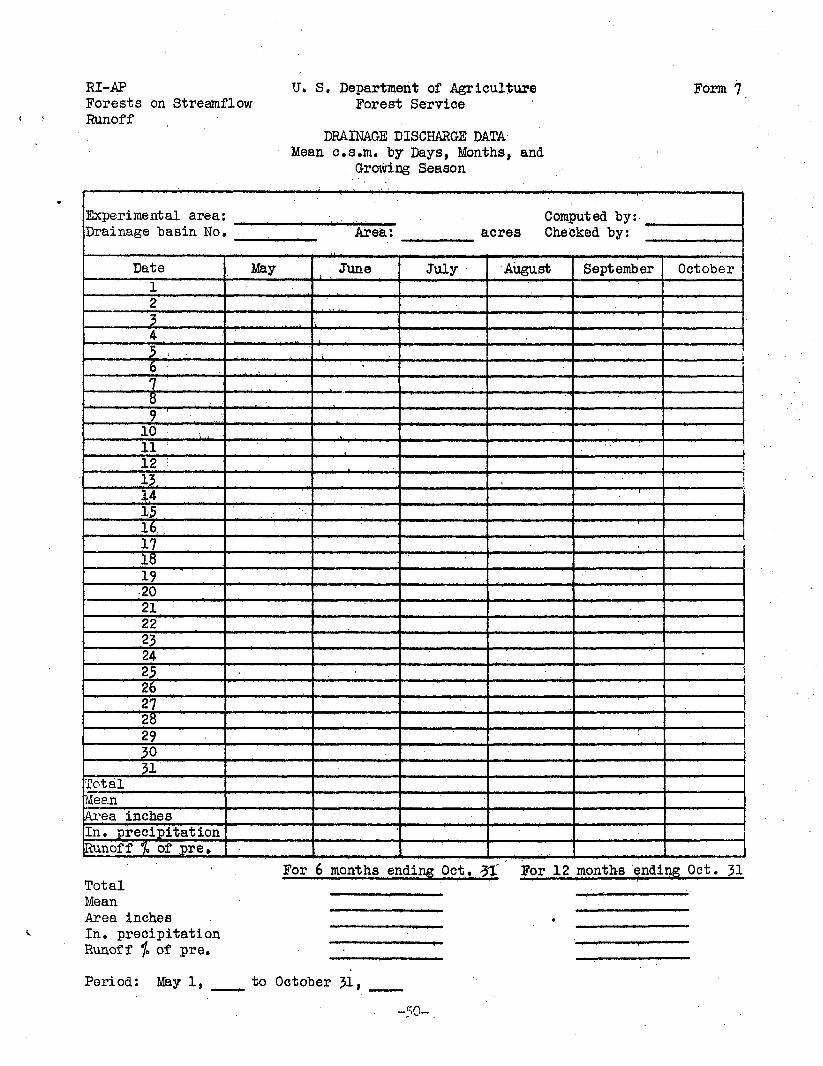
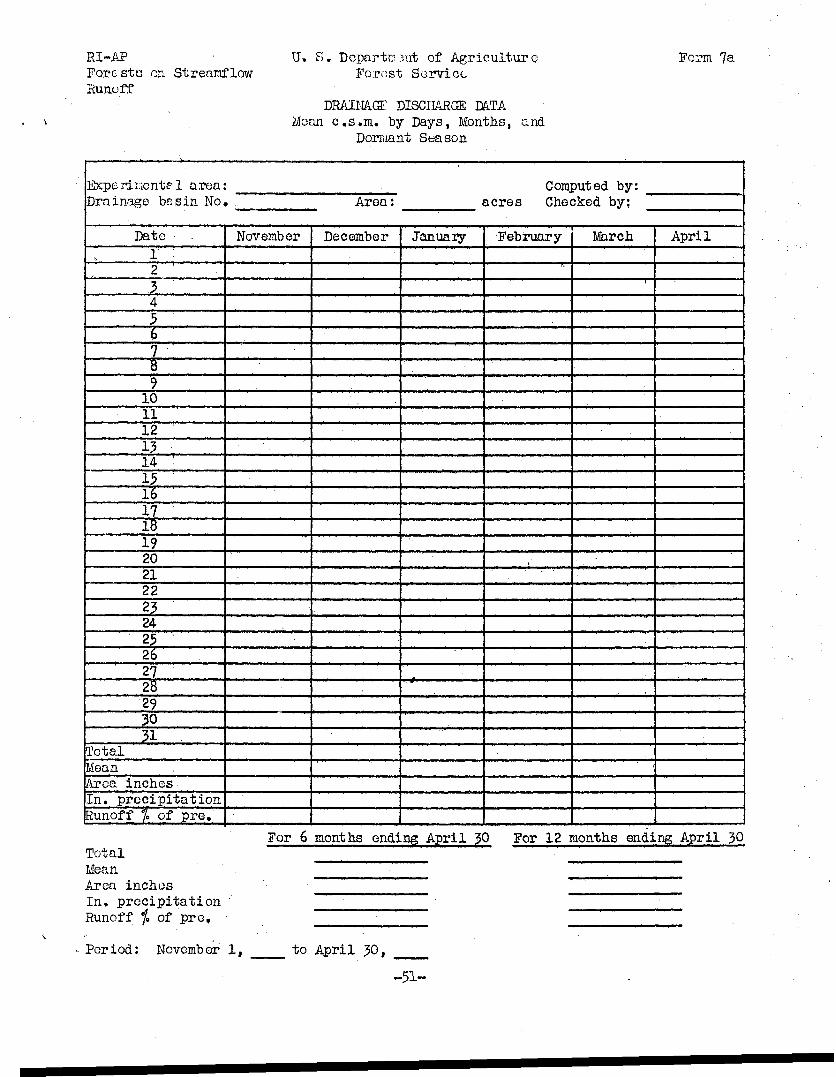
DRAINAGE DISCHARGE DATAForms 7 and 7a
Purpose
These forms are used for summarizing discharge data,
Procedure
Form 7 is for the growing season, May 1 to October 31, and
form 7a is for the dormant season, November 1 to April 30. The mean
discharge in c.f.s. per square mile (c.s.m.) is obtained from column 12,
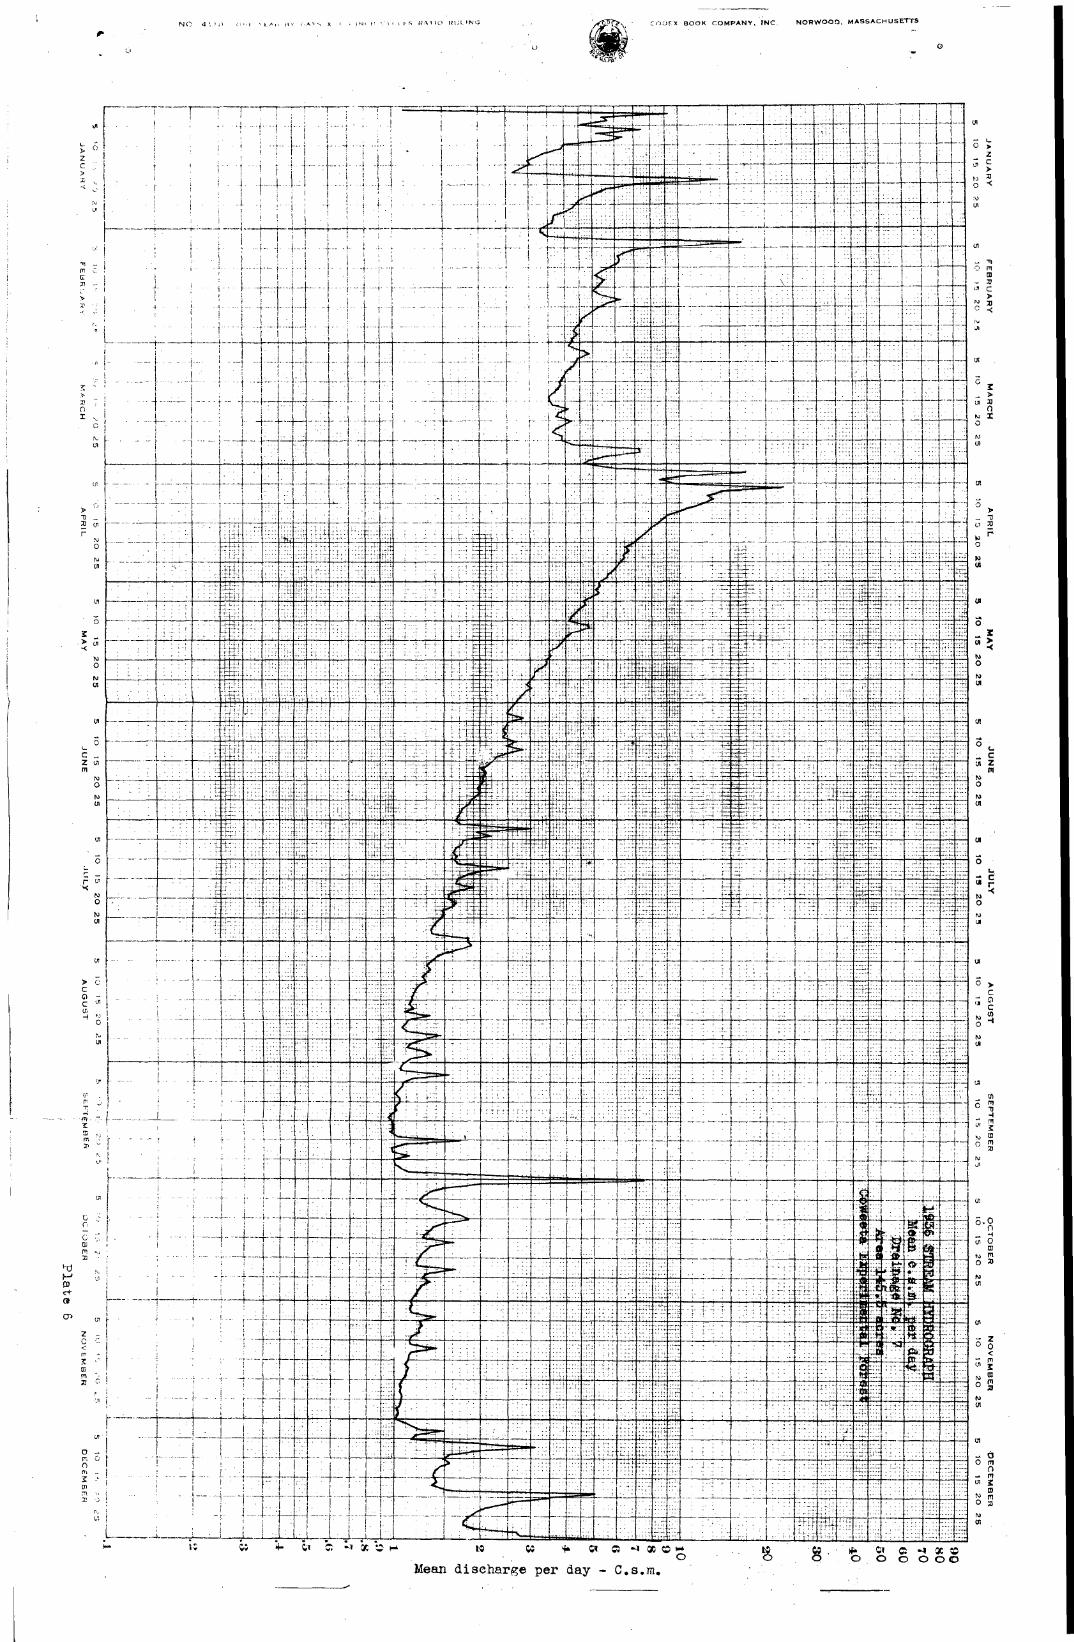
form 6, and tabulated for each day. These data are plotted as a contin-
uous streamflow hydrograph, plate 6, which in turn is used as a guide
in estimating missing records and as a basis for streamflow analysis.
At the bottom of the page the data are summarised by months,
seasons, and years as follows:
Total { >. )t The summation of the daily discharges for the month,
season, and year. This figure has no significance
but is used in the computations which follow.
Mean: Mean daily c.s.m. for the period =
£. Mean daily dischargenumber of days
Area inches: The volume of runoff expressed as inches depth
on the drainage area,
( 5 mean daily discharge) x 86, 00 sec.2,323,200
2,323,200 cubic feet =; one-inch depth on one
square mile.
Inches precipitation: The weighted mean precipitation on the
drainage basin taken from form 2.
Area inchesRunoff as a percent of the precipitation = -inches precipitation
-48-
K\i 'o it\; i- IN ' -^ C O O E X BOOK COMPANY, INC. NORWOOO. MASSACHUSETTS
L-1 « C H «« 05
Mean discharge per day - C.s.ra.
RI-APForestsRunoff
on StreamflowU» S. Department of Agriculture
Forest Service
DRAINAGE DISCHARGE DATAMean c.s.m. by Days, Months, and
Growing Season
Form 7
Experimental area: . . . . . . Computed by:Drainage basin No. Area:
Date
12
34
5678
9 V. ...':
10 . L. '1112 I
13.'14
15161718
19-202122
2324
2526
2728
293031
TotalMeanArea inchesIn. precipitationRunoff % of pre.
acres Checked by:
May
, -I,
June
4
;
v
July August September
1
1
October
i:
1
TotalMeanArea inchesIn. precipitationRunoff f. of pre.
For 6 months ending Oct.. l' For 12 months ending Oct. 31
Period: May 1, to October 31,
RI-APFore sta onRunoff
U. R. Departs'3ut of AgricultureStreamflow Fcrnst Service,
DRAIIIAGE DISCHARGE DATAMean c.s.m. by Days, Months, and
Dormant Season
Form
Expert, ncntel area:Drainage basin No
Date1' '
2
!>4
5 ' .6789
1011121314 '1516171819202122232425262728293031
TotalMeanArea inchesIn. precipitationRunoff % of pre.
Computed by:, Area: acres Checked by:
November December January February March
1
April
TotalMeanArea inchesIn. precipitationRunoff fo of pre.
Period: November 1,
For 6 months ending April 30 For 12 months ending April 30
to April 30,
-51-
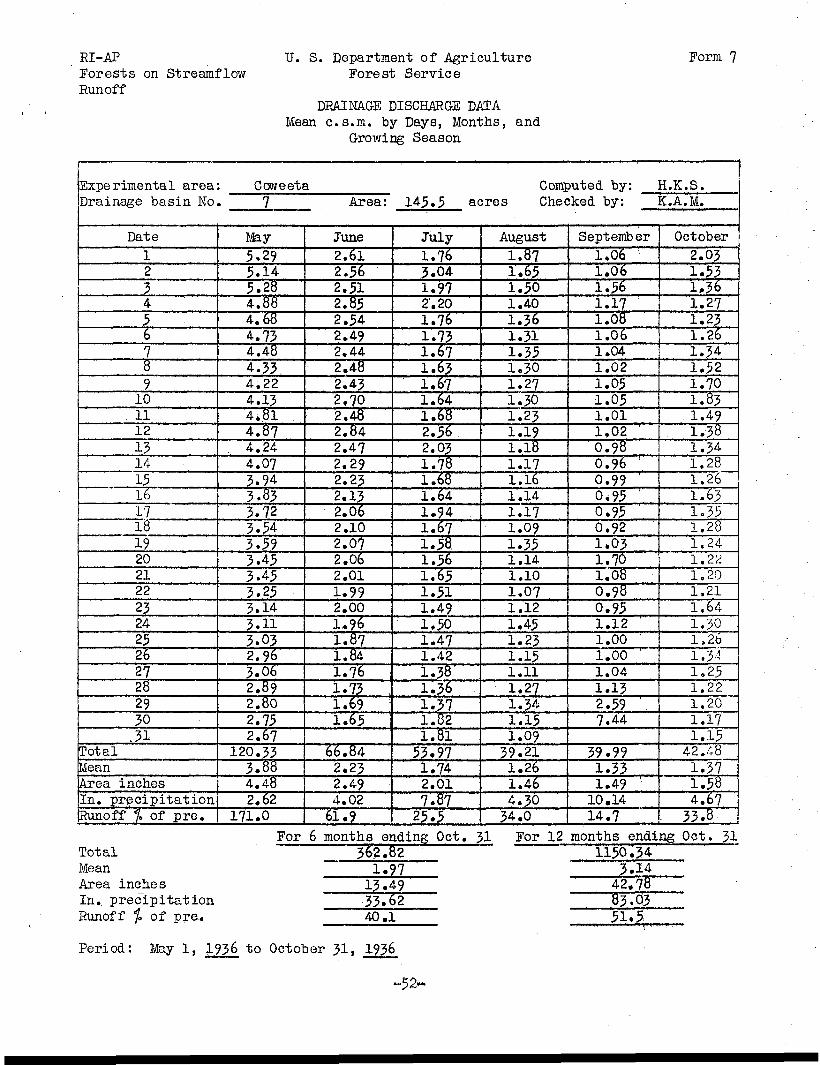
EI-APForests on StreamflowRunoff
U. S. Department of AgricultureForest Service
DRAINAGE DISCHARGE DATAMean c.s.m. by Days, Months, and
Growing Season
Form 7
Experimental areaDrainage basin No
Date
12345678
910111213141516
171819202122
2324252627282930
.31TotalMeanArea inchesIn. precipitationRunoff % of pre.
Coweeta7 Area:
Computed by: H.K.S.145.5 acres Checked by: K.A.M.
May
5.295.145.284.884.684.734.484.334.224.134.814.874.244.073.943.833.723.543.593.453.453.253.143.113.032.963.062.892.802.752.67
120.333.884.482.62
171.0
June
2.612.562.512.852.542.492.442.482.432,702.482.842.472.292.232.132.062.102.072.062.011.992.001.961.871.841.761.73 ,1.691.65
66.842.232.494.02
61.9
July
1.763.041.972'. 201.761.731.671.631.671.641.682.562.031.781.681.641.941.671.581.561.651.511.491.501.471.421.381.361.371.821.81
53.971.742.017.87
25.5
August
1.871.651.501.401.361.311.351.301.271.301.231.191.181.171.161.141.171.091.351.141.101.071.121.451.231.151.111.271.341.151.09
39.211.261.464.30
34,0
September
1.061.061.561.171.081.061.041.021.051.05 ;
1.011.020.980.96 '0.990*950.950.921.031.70 !
1.080.980.951.121.001.001.041.132.597.44
39.991.331.49 '
10.1414.7
October2.031.531,361.271.231.261.341.521.701.831.491.381.341.281.261.631.351.281.241.221.201.211.641.301.2t>1.5-11.251.221.201.171.15
42.481.371.584.67
- 33.8
TotalMeanArea inchesIn. precipitationRunoff fo of pre..
For 6 months ending Oct. 31 For 12 months ending Oct. 31362.82 1150.34
1.97 3.1413.49 42.7833T6240.1 51.5
Period: May 1, 1936 to October 31, 1936
-52-
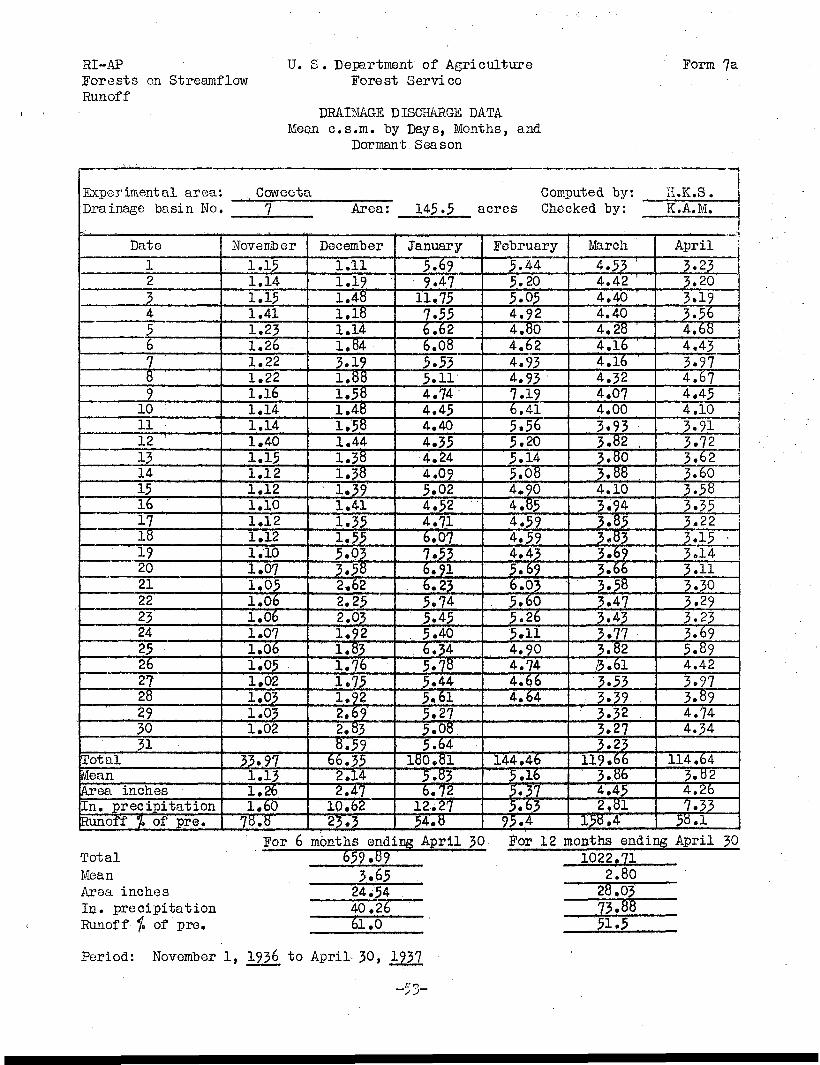
RI-APForests on StreamflowRunoff
U. S. Department of AgricultureForest Service
DRAINAGE DISCHARGE DATAMean c.s.m. by Days, Months, and
Dormant Season
Form 7a
Experimental area: CoweetaDrainage basin No. , 7 Area:
Date
1234567 '89
10 :
11121314 '1516171819202122232425262?28293031
TotalMeanArea inchesIn. precipitationRunoff '/. of pre.
Computed by: H.K.S.145.5 acres Checked by: K.A.M.
November
1.151.141.151.411.231.261.221.221.161.141.141.401.151.121.121.101.121.121.101..0?1,051.061.061.071.061.051.021.031.031.02
33,971.131.261.60
78.8
December
1.111.191.481.181.141.843.191.881.581.481.581.441.381.381.391.411.351,555.033.582,622.252.031.921.831.761.751.922.692.838.59
66.352.142.47
10.6223.3
January
5.699.^7
11,757.556.626.085.535.114.744.454.404.354.244.095.024.524.716.077.536.916.235.745.455,406.345,785,445.615.275,085.64
180.815.836.72
12.2754.8
February
5.445.205.054.924.804.624.934.937.196.415.565.205.145.084.904.854.594.594.435.696.035.605.265*114.904.744.664.64
144.465.165.375.63
95,4
March
4.53 '4.42 '4.404.404.28 '4.164.164.324.074.003.933.82 ,3.803.884.103.943.853.833.693.663.583.473.433.773.82/3.613.533.393.32 .3.27 .3.23
119.663.864.452 f«l
158.4
April
3.233.203.193.564.68 ,4.433.974.674.454.103.913.723.623.603.583.353-223.15 •3.143.H3.303.293.233.695.894.423.973.894.744.34
114.643.824.267.33
58.1
TotalMeanArea inchesIn. precipitationRunoff fo of pre.
For 6 months ending April 30-659,89
3.65
For 12 months ending April1022.71
2.8024.54 28.0340.26 73.88
30
51.5
Period: November 1, 1936 to April 30, 1937

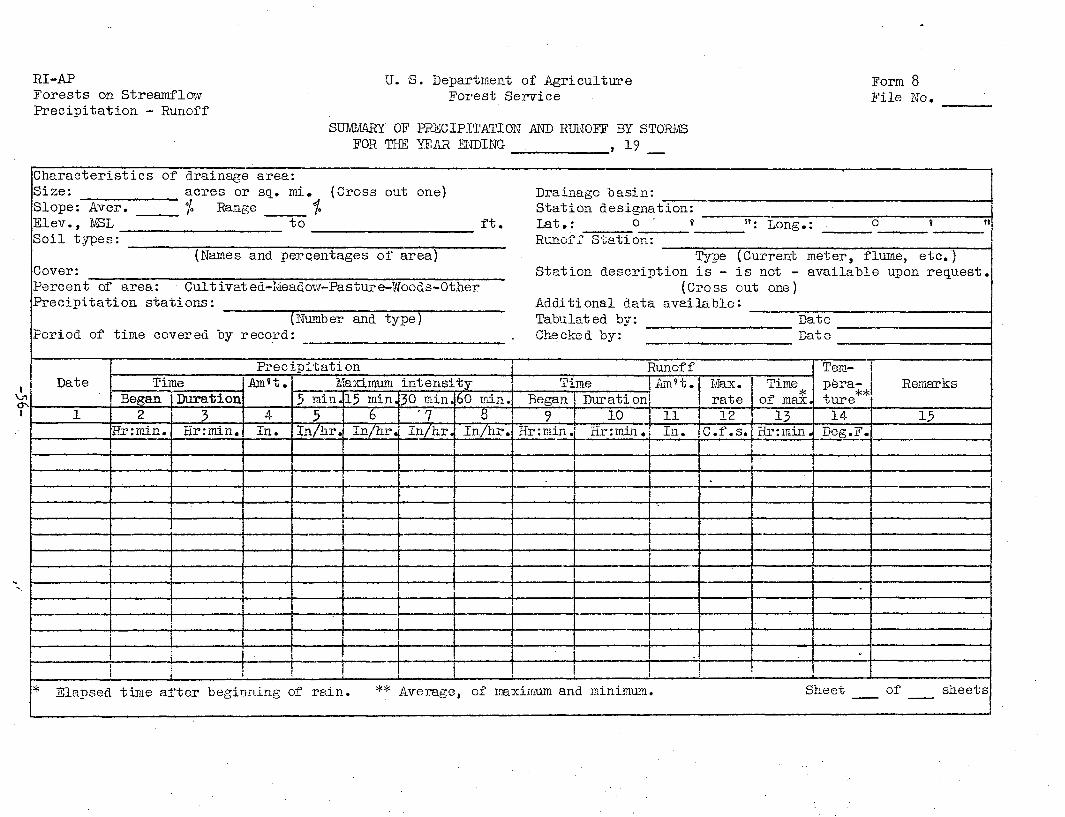
SUMMARY OF PRECIPITATION AND RUNOFF BY STORMSForm 8
Purpose
The purpose of this form is to present an annual summary of
hydrologic data compiled for each drainage basin and arranged by
individual storms. Information so arranged has been exceptionally
useful in selecting storms for individual hydrograph analysis and
also for scientific investigations of runoff characteristics.
Procedure
Form 8 contains a descriptive heading which is completely
filled in from data kept in the drainage basin files. This form
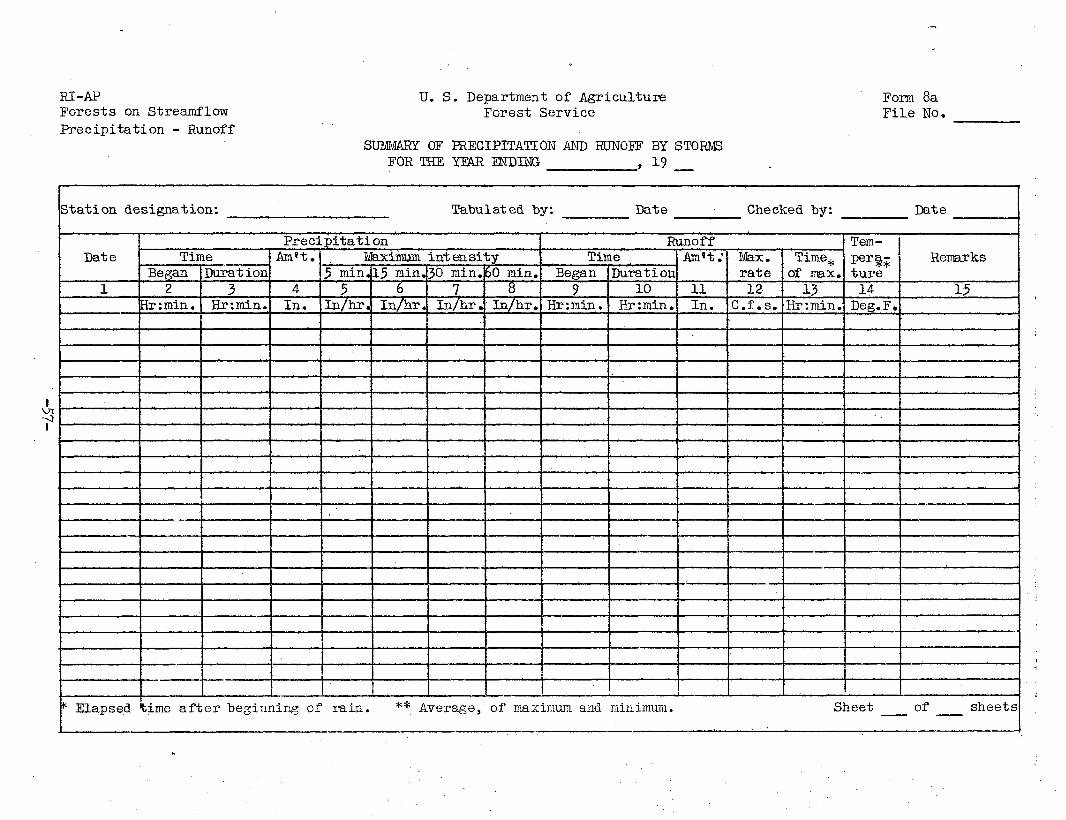
is used as the first sheet of an annual summary; successive sheets
are executed on form 8a which does not contain the detailed heading.
Most of the data for form 8 have been previously recorded and can be
taken from the individual forms. The source of the data is as follows:
HEADING OR DESCRIPTION
Column 1. Date (or dates) of storms
Precipitation
Column 2. Began (time of day tohr. and min.)
Column 3» Duration (hr. and min.)
SOURCE OF DATA
Form 4 or 5> col. 1
Form A (case l) orForm 5 (case 2)
Form l+, col, 2,designated P.B. incol. 8;Form 5, col. 2,designated P.B. incol. 15. (use gagefirst recordingprecipitation)
Form A- or 5, col. 2elapsed time from P.B.to P.E. (first P.B. tolast P.E. on form 5)
-54-
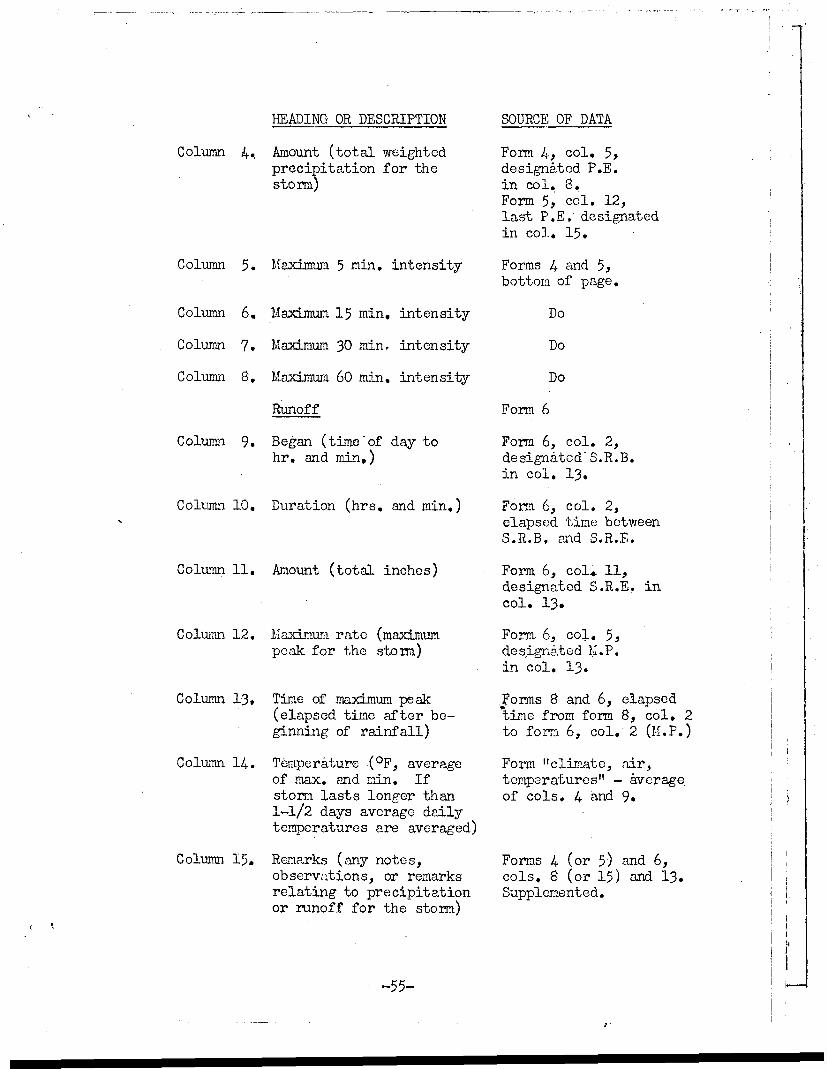
HEADING OR DESCRIPTION SOURCE OF DATA
Column 4, Amount (total weightedprecipitation for thestorm)
Column 5. Maximum 5 nin. intensity
Column 6, Maximum 15 min, intensity
Column 7. Maximum 30 rain- intensity
Column 8. Maximum 60 min. intensity
Runoff
Column 9. Began (time'of day tohr, and min,)
Column 10. Duration (hrs. and min.)
Column 11. Amount (total inches)
Column 12. Maximum rate (maximumpeak for the storm)
Column 13. Time of maximum peak(elapsed time after be-ginning of rainfall)
Column 14. Temperature (°F, averageof max. and min. Ifstorm lasts longer than1-1/2 days average dailytemperatures are averaged)
Column 15. Remarks (any notes,observations, or remarksrelating to precipitationor runoff for the storm)
Form 4, col. 5»designated P.E.in col. 8.Form 5j col. 12,last P.E, designatedin col. 15.
Forms 4 and 5,bottom of page.
Do
Do
Do
Form 6
Form 6, col. 2,designated"S.R.B.in col. 13t
Form 6, col. 2,elapsed time betweenS.R.B, and S.R.E.
Form 6, col* 11,designated S.R.E. incol. 13.
Form 6, col. 5,designated M.P.in col. 13.
Forms 8 and 6, elapsedtime from form 8, col. 2to fora 6, col. 2 (M.P.)
Form "climate, air,temperatures" - averageof cols. 4 and 9.
Forms 4 (or 5) and 6,cols, 8 (or 15) and 13.Supplemented.
-55-
RI-APForests on StreamflowPrecipitation - Runoff
U. S. Department of AgricultureForest Service
SUMMARY OF PRECIPITATION AND RUNOFF BY STORMSFOR THE YEAR ENDING _^ , 19
Form 8File No,
Characteristics of drainage area:Size: acres or sq.. mi. (Cross out one)Slope: Aver. % Range %Elev., MSL to ft.Soil types:
Cover:(Names and percentages of area)
Percent of area: Cultivated-Meadow- Pasture-Woods-OtherPrecipitation stations:
(Number and type)Period of time covered by record
Date
1
Drainage basin.
Station designation:Lat.: o ' ?Runoff Station
it
:: Long . : o ? «•
Type (Current meter, flume, etc.)Station description is - is not - available upon request.
(Cross out one)Additional data available:Tabulated by: DateChecked by: Date
PrecipitationTime
Began2
Hr:min.
Duration
3Hr:min.
t
Am't.
4In.
Maximum intensity5 min.
5In/hrj
15 min.6
In/hrj
30 min.
'7In/hr.|
60 rain.8
LIn/hr.
RunoffTime
Began
9Hr:min.
Duration10
Hrcmin.
Am't.
11In.
Max.rate12
C.f .s.
.
Time,of max.
13Hr:min.
Tem-pera-ture14Deg.F.
•
0
Remarks
15
* Elapsed time after beginning of rain. ** Average, of maximum and minimum. Sheet of sheets
RI-APForests on StreamflowPrecipitation - Runoff
U. S. Department of AgricultureForest Service
SUMMARY" OF PRECIPITATION AND RUNOFF BY STORMSFOR THE YFAR ENDING , 19
Form 8aFile No.
Station designation:
Date
1
Tabulated by: Date Checked by: Date
PrecipitationTime
Began2
Hr:min.
Durat ion
3Hr:min.
Am't.
4In.
Ife.xirn.um intensity5 min.5
In/hr.
15 min.6
In/hr.
30 min.
7In/hr.
60 min.8
In/hr.
RunoffTime
Began
9Hr:min.
Duration10
Hrcmin.
Am't;
11In.
Max.rate12
C.f.s.
Time.,,of max.
13Hr:min.
Tem-
Pera*ture14Deg.F.
Remarks
15
" Elapsed time after beginning of rain. ** Average, of maximum and minimum. Sheet of sheets
-3
RI-APForests on StreamflowPrecipitat ion - Runoff
U. S. Department of AgricultureForest Service
SUMMARY OF PRECIPITATION AND RUNOFF BY STORMSFOR THE YEAR ENDING- April ?0 , 19 J>1
Form 8:File No.
f
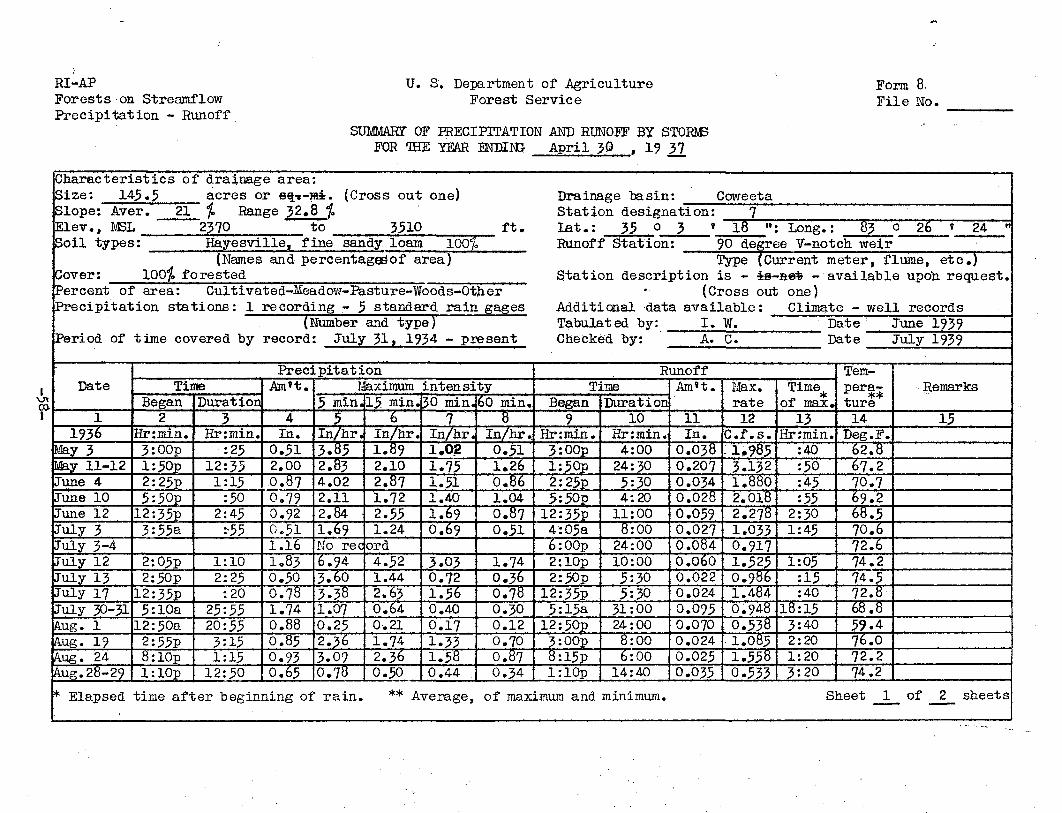
Characteristics of drainagSize: 145.5 acres oSlope: Aver. 21 % RanElev... MSL 2370
e area:r ef»-Ht. (Cross out one)ge 32.8 %
to 3510 ft.Soil types: Hayesville, fine sandy loam 100%
Cover:(Names and percentagesof area)
lOOf. forestedPercent of area: Cultivated-Meadow- Pasture- Woods-OtherPrecipitation stations: 1 recording - 5 standard rain gages
(Number and type)Period of time covered by record: July 31 » 1934 - present
Date
11936
May 3May 11-12June 4June 10June 12July 3July 3-4July 12July 13July 17July 30-31Aug. 1Aug. 19Aug. 24Aug. 28-2?
PrecipitationTime
Began2
Br:min.3:00pl:50p2:25p5:50p
12:35P3:55a
2:05p2:50p
12:35P5:10a
12:50a2:55P8:10pl:10p
Duration3
Hr:min.:25
12:351:15
:502:45
:-55
1:102:25
:2025:5520:553:151:15
12:50
Am't.
4In.
0.512.000.870.790.920.511.161.830.500.781.740.880.850.930.65
Maximum intensity5 min.
5In/hr.3*852.834.022.112.841.69No rec6.943.603.381.070.252.363-090.78
15 min.6
In/hr.1.892.102.871.722.551.24
ord4.521.442.630.640.211.742.360.50
30 min.7
In/hr.1.021.751.511.401.690.69
3.030.721.560.400.171.331.580.44
60 min.8
In/hr.0.511.260.861.040.870,51
1.740.360.780.300.120.700.870.34
Drainage basin: CoweetaStation designation:Lat.: 35 o 3 »Runoff Station
718 »: Long. : 83 o 26 ' 24 "
: 90 degree V-notch weirType (Current meter, flume, etc.)
Station description is - ie-jae* - available upon request.(Cross out one)
Additional data available: Climate - well recordsTabulated by: I. W. Date : June 1939Checked by: A. C. Date July 1939
RunoffTime
Began9
Hr:min.3:00pl:50p2:25p5:50p
12:35P4:05a6:00p2:10p2:50p
12:35p5:15a
12:50p3:00p8:15pl:10p
Duration10
Hr:min.4:00
24:305:304:20
11:008:00
24:0010:005:305:30
31:0024:008:006:00
14:40
Am't.
11In.
0.0380.2070.0340.0280.0590.0270.0840.0600.0220.0240.0950.0700.0240.0250.035
Max.rate12
C.f.s.: 1*9853.1321.8802.0182.2781.0330.9171.5250.9861.4840.9480.5381.0851.5580.533
of max.13
Hr:min.:40:50:45:55
2:301:45
1:05:15:40
18:153:402:201:203:20
Tem-
ture14
Deg.F.62.867.270.769.268.570.672.674.274.572.868.859-476.072.274.2
Remarks
15
* Elapsed time after beginning of rain. ** Average, of maximum and minimum. Sheet 1__ of 2 sheets
RI-APForests on StreamflowPrecipitation - Runoff
U. S. Department of AgricultureForest Service
SUMMARY OF PRECIPITATION AND RUNOFF BY STORMSFOR THE YEAR ENDING April 50 , 19 37
Form 8aFile No.
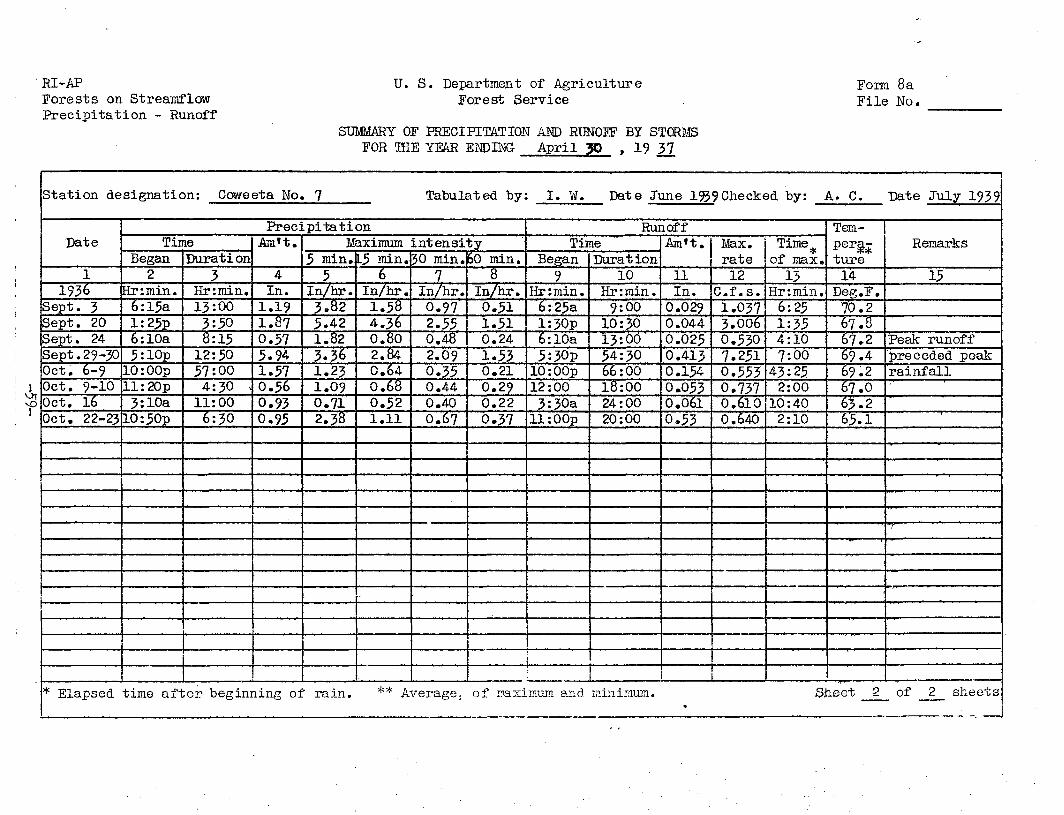
Station designation: Coweeta No. 7
Date
11936
Sept. 3Sept. 20Sept. 24Sept. 29-30Oct. 6-9Oct. 9-10Oct. 16Oct. 22-23
Tabulated by:
PrecipitationTime
Began2
Hr:min.6:15a1:25P6:10a5:10p
10:00pll:20p3:10a
10:50p
Durati on3
Hr:min.13:003:508:15
12:5057:004:30 ,
11:006:30
Am't.
4In.
1.191.870.575.941.570.560.930.95
Maximum intensity5 min.
5In/hr.3.825.421.823.361.231.090.712.38
L5 min.6
In/hr.1.584.360.802.840.640.680.521.11
30 min.7
In/hr.0.972.550.482.090.350.440.400.67
60 min.8
In/hr.0.511.510.241.530.210.290.220.37
I. W. Date June 1939 Checked by: A. C. Date July 1939
RunoffTime
Began9
Hr:min.6:25al:30p6:10a5:30p
10:00p12:003:30a
ll:00p
Durat ion10
Hr:min.9:00
10:3013:0054:3066:0018:0024:0020:00
Am't.
11In.
0.0290.0440.0250.4130.1540.0530.0610.53
Max.rate12
C.f.s.1.0373.0060.5307.2510.5530.7370.6100.640
Time*of max.13
Hr:min.6:251:354:107:00
43:252:00
10:402:10
Tem-
ture14
Deg.F.70.267.867.269.469.267.063.265.1
Remarks
15
Peak runoffpreceded peakrainfall
T~
* Elapsed time after beginning of rain. ** Average; of maximum and minimum. Sheet 2 of 2 sheets•
f