Embed Size (px)
Citation preview

SPEAKER: George Boubouras, UBS
LOCATION: Melbourne
DATE: July 2012
ASX INVESTMENT TALKS
UBS Investment summary, forecasts and sample portfolios
DISCLAIMER: The views, opinions or recommendations of the presenters are solely their own and
do not in any way reflect the views, opinions, recommendations, of ASX Limited ABN 98 008 624 691
and its related bodies corporate (“ASX”). Information and material presented at the seminar is for
educational purposes only and does not constitute financial product advice. Investors should obtain
independent advice from an Australian financial services licensee before making investment decisions.
No responsibility is accepted by ASX for any loss or damage arising in any way (including due to
negligence) from anyone acting or refraining from acting as a result of this information or material.
© Copyright 2012 ASX Operations Pty Limited ABN 42 004 523 782. All rights reserved 2012.
UBS Investment summary, forecasts
and sample portfolios
- Cautious stance recommended for the
September quarter
July 2012
ASX Investment talks
George Boubouras
Head of Investment Strategy & Consulting
Email: [email protected]

ASX Investment talks George Boubouras provides us with a sense of perspective on the current status of domestic and global markets. George argues that whilst we should diversify across sectors and within sectors, the profile we choose for our investment portfolio depends on individual risk appetite. George presents a range of options for our investment portfolios and concludes by sharing some of UBS’s sample portfolios such as defensive and aggressive dividend optimisation.
2

3
Table of contents
SECTION 1 Investment Summary and Forecasts 2
SECTION 2 Market Macro & Risk Indicators 4
SECTION 3 Interest Rates & Credit 10
SECTION 4 Commodity Market & Australian Dollar 15
SECTION 5 Equity Market Indicators 21
SECTION 6 Domestic (& Global) Stock Picks, Bond & Hybrid Portfolios 30
SECTION 7 Portfolio Construction Themes 49
SECTION 8 Behavioural Finance Implications 56
SECTION 9 Summary 59

SECTION 1
Investment Summary

5
One Page Summary: Core theme for H2 2012 => cautiously
optimistic
Economic Update
Global growth forecasts revised lower to 2.8% (from 3.0%) for 2012 following softer data profile in recent months. No hard landing in China,
recent data consolidated following a softer phase. Significant capacity to stimulate further. Domestic demand and infrastructure to be a larger
driver of China activity going forward. Overall, composition of global growth will remain very uneven. Emerging economies will continue to be
large growth drivers. European progress is a positive in June. There is a blueprint but markets require more detail. ECB has capacity to
stimulate further. The US data profile slowing. Anticipate slower earnings growth in Q3 therefore additional stimulus required.
Asset Allocation Strategy
Our Core Model Portfolios for Conservative/Moderate/Aggressive risk profiles remain neutral both domestic & international equities vs strategic
benchmarks. Within our global equity allocation we remain overweight the US and Emerging Markets, underweight Europe, UK and Japan.
Neutral fixed income (underweight sovereign, short duration & strong focus on quality credit). Underweight A-REITs & Alternatives. Overweight
Cash remains. Defensives are doing what they should.
Equities
Neutral allocation to equities vs benchmarks with a focus on defensives and dividend strategy for conservative through to increased exposure
towards cyclicals for more aggressive risk appetite. Australian equities will benefit from further rate cuts. US earnings have grown more vs
expectations in recent quarters and are robust vs other developed markets. However recent run of softer data will imply a slower earnings growth
profile in H2 2012. While equity valuations remain discounted on most measures (1 year forward P/E, trailing PE, P/B, Earning Yield vs
Bond) there are ongoing macro risks. Investor confidence is set to remain challenged. Year-end ASX200 target 4450. Your risk appetite drives
your strategy.
Cash & Fixed Income
Cash rate futures now pricing in 2.75% by March 2013. Very stimulatory and below GFC levels. We expect 3.0%-3.25% to be low in current
cycle. Neutral tactical tilt for fixed income vs strategic benchmarks with a focus on quality investment grade corporate bonds. We prefer
shorter duration positions. For more aggressive investors, higher yielding emphasis is recommended (in local & non-AUD). Ranking in the
capital structure to reflect risk appetite. Further, some listed higher yielding hybrids offer attractive yields. A diversified approach always
recommended. UBS Composite Bond Index up 12.41% annually illustrating that fixed income is a defensive asset class.
Commodities & Australian Dollar
Ongoing weakness anticipated in the Sept quarter with higher volatility in broad commodity prices to persist. Energy price correction has been
aggressive. No catalyst for sharp rise in energy prices in July. Commodity currencies impacted with weaker commodity prices. AUD forecast
unchanged vs last month, 0.97, 1.00 and 1.05 for 3, 6 and 12-months respectively. Despite softer recent commodity profile the AUD has seen
some support via global investor demand for Australian government debt.
Please see important disclaimer and disclosures at the end of the document.

SECTION 3
Market Macro & Risk Indicators

7
Global growth revised higher vs late 2011 but marginally lower over past few months. The growth premia
from the emerging economies has been the core global growth driver of economic activity and therefore
earnings. Growth is uneven by region but now expanding at a slower pace.
Global growth pulse slowing. Expect slower earnings growth in Q3
(6.0)
(4.0)
(2.0)
0.0
2.0
4.0
6.0
8.0
10.0
2001 2002 2003 2004 2005 2006 2007 2008 2009 2010 2011E 2012E 2013E
World Developed Economies Developing/Emerging Economies
Source: UBS
Forecasts
Global Grow th Composit ion. Developed vs Developing Economies Real GDP, Annual %. World growth compared to Developed and Developing Economies

8
Market volatility lower in late June as the full catastrophe was averted…
Investors with moderate risk profile balanced funds would have had a positive financial year performance.
Rule of thumb => investors should expect volatility is a normal event. Excessive volatility is not. Greek
elections, Spanish banking loans and EU Summit were all positive vs expectations. Hence volatility finished
the month lower. But it will rise again therefore understand your risk appetite…
0
10
20
30
40
50
60
70
80
90
Jan-90 Jan-92 Jan-94 Jan-96 Jan-98 Jan-00 Jan-02 Jan-04 Jan-06 Jan-08 Jan-10 Jan-12
M arket Volat ility (VIX) IndexImplied Volatility Index, daily data
Source: Bloomberg, CBOT, UBS WM
Asia Crisis
LTCM Global Balance Sheet Recession
Enron & WorldCom
default
Period of decreased volat ility as
leverage is increased
Credit Crunch
Global Bond &
Equity Bear M arket
Mexian Peso
Crisis
* Data as of 29 June 2012
Sovereign
Debt issues,
growth
concerns...
Japan
Tragedy
Market volatility
low

9
Terms of Trade since 1870 – supportive structurally… Australian Terms-of-Trade (ToT) simply reflects our report card vs the world over the long run. Australia is a
small, open economy that is effectively a net energy/soft commodity exporter. We are in the middle of a
super cycle of mining CAPEX investment – which looks set to continue – but there will be short term
volatility along the way. Therefore, investors need to be conditioned for short term volatile cycles.
60
70
80
90
100
110
120
130
140
150
160
170
180
190
200
1870 1880 1890 1900 1910 1920 1930 1940 1950 1960 1970 1980 1990 2000 2010 2020
60
70
80
90
100
110
120
130
140
150
160
170
180
190
200
Average since 1870* Terms of trade*
Index: average 1870 to 2010 = 100
* Goods only pre 1959; Goods & services post 1959
Terms of Trade - Australia
Source: UBS
1920's soft
commodity boom
Wool boom - Korean War
Bulk, metals,
energy, precious
metals, soft
commodity
boom

10
Aussie household still not happy => recent rate cuts having limited impact…
A reading above 100 implies optimism, below 100 indicates pessimism. Rebound in the May Consumer
Sentiment Index following May rate cut did not occur. Clearly more rate cuts required…
60
70
80
90
100
110
120
130
140
Jul-78 Jul-80 Jul-82 Jul-84 Jul-86 Jul-88 Jul-90 Jul-92 Jul-94 Jul-96 Jul-98 Jul-00 Jul-02 Jul-04 Jul-06 Jul-08 Jul-10 Jul-12
Consumer Sentiment Index, Australia Index above 100 = optimistic
Source: Melbourne Institute, UBS Wealth Management
Last recession in Australia Weaker credit conditions reflects the
household is going through some challenges.
11
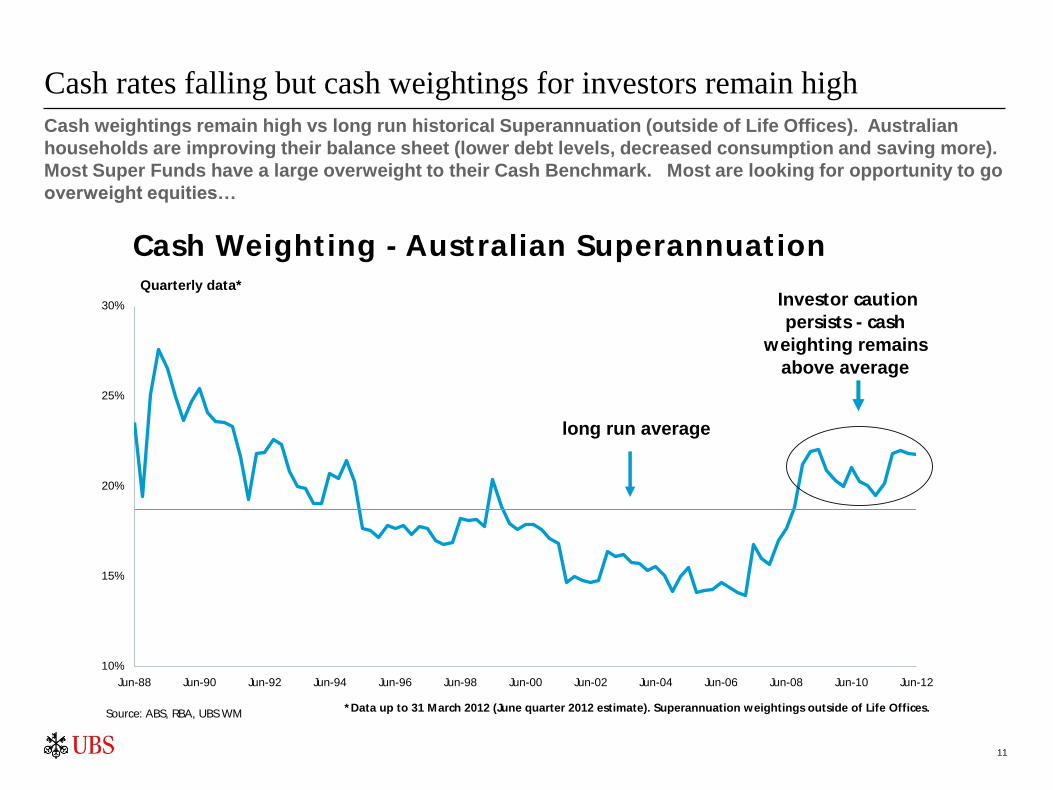
Cash rates falling but cash weightings for investors remain high
Cash weightings remain high vs long run historical Superannuation (outside of Life Offices). Australian
households are improving their balance sheet (lower debt levels, decreased consumption and saving more).
Most Super Funds have a large overweight to their Cash Benchmark. Most are looking for opportunity to go
overweight equities…
10%
15%
20%
25%
30%
Jun-88 Jun-90 Jun-92 Jun-94 Jun-96 Jun-98 Jun-00 Jun-02 Jun-04 Jun-06 Jun-08 Jun-10 Jun-12
long run average
Cash Weighting - Australian Superannuation Quarterly data*
Source: ABS, RBA, UBS WM * Data up to 31 March 2012 (June quarter 2012 estimate). Superannuation weightings outside of Life Offices.
Investor caution
persists - cash
weighting remains
above average

SECTION 4
Interest Rates & Credit

13
Futures market now pricing in 2.80% by year end…
The 30 day interbank cash rate futures forward curve is higher in yield over past month. The Dec 2012 rate
has moved from 2.25% to 2.80%. Therefore implies 2.75% by year end in now the market target, still under
GFC lows. Target remains ambitious. We are still targeting a 3.0%-3.25% Cash Rate as a low in current
cycle...
0
1
2
3
4
5
6
7
8
9
10
Jun-92 Jun-94 Jun-96 Jun-98 Jun-00 Jun-02 Jun-04 Jun-06 Jun-08 Jun-10 Jun-12
30 day Cash Futures Official RBA Cash Rate
Source: ASX, Bloomberg, UBS WM
Off icial RBA Cash Rate and Implied Cash Futures Curve %, Monthly Data
Futures market now pricing in 2.75%
cash rate by year end
Cash
Rate
Futures
Curve*
* Cash rate futures curve as of 29 June 2012
Actual

14
Bonds are a defensive asset class with low correlation to equities. Chart shows rolling 12-month returns. It
clearly illustrates bonds out-performing in the GFC & in 2011. The 1-year return for the bond index is now
12.4%. Expected return for a diversified bond portfolio is 6.0-6.5% p.a. on average through a cycle…
Bonds belong in all portfolios => the classic traditional defensive asset class…
-10%
-5%
0%
5%
10%
15%
20%
25%
30%
Jun-92 Jun-94 Jun-96 Jun-98 Jun-00 Jun-02 Jun-04 Jun-06 Jun-08 Jun-10 Jun-12
Expected return Rolling 12-month return, %
UBS Composite Bond Index Rolling 12-month returns Monthlty Data
Bonds out-performed in
the GFC. It is a defensive
asset class
Source: UBS WM
Bonds are
defensive

15
Australian credit spreads improve
The Australian Markit iTraxx Index shows 25 equally weighted CDS spreads for Australian investment grade
companies. Core corporate balance sheet remains sound vs pre-GFC but global macro risks dominate. The
worst of the European Credit Crunch (in 2011) looks to be behind us but there are challenges ahead. Focus
on quality debt and the ranking in the capital structure should reflect your risk appetite.
0
50
100
150
200
250
300
350
400
450
500
Jan-07 Jul-07 Jan-08 Jul-08 Jan-09 Jul-09 Jan-10 Jul-10 Jan-11 Jul-11 Jan-12 Jul-12
Australian Credit Spreads - M arkit iTraxx Index Daily Data, Basis Points
Source: Bloomberg, Markit iTraxx, ASX, USB WM * Daily data as of 2 July 2012
2011 European
Credit Crunch behind
us?
The GFC was
unforgiving

16
US long bond yields to remain low for now…
Decoupling re bonds & equities. The US long bond at 1.55% with inflation around 2.0% implies negative real
10-year bond yields. Earnings yields looks more compelling vs bond yields…
0
2
4
6
8
10
12
14
16
18
Jan-19 Jan-26 Jan-33 Jan-40 Jan-47 Jan-54 Jan-61 Jan-68 Jan-75 Jan-82 Jan-89 Jan-96 Jan-03 Jan-10
US 10 Year Bond Yield Monthly Data, Jan 1919 through to present (%)
Source: Bloomberg, Global Financial Data Inc, UBS WM
LR mthly average Jan 1919 through to present: 5.08%
* Data as of 30 June 2012
Inflation Era

SECTION 5
Commodity Markets & the Australian Dollar

18
Commodity cycle weakness to continue in Q3…
Australia is a small open economy, a net energy/commodity, food exporter. In the shorter term weaker
commodity prices to continue but some consolidation in the Sept quarter. Longer term the structural cycle (ie
ToT) positive for global commodity currencies (AUD, NZD, BZL, NOK, ZAR..)…
0
20
40
60
80
100
120
140
160
Jun-86 Jun-88 Jun-90 Jun-92 Jun-94 Jun-96 Jun-98 Jun-00 Jun-02 Jun-04 Jun-06 Jun-08 Jun-10 Jun-12
RBA Commodity Prices (All Items )
Source: RBA Bulletin, UBS Wealth Management
RBA Commodity Index - All Items, SDR Terms
Emerging world contributing increasingly to
global growth (nearly 10 years now) underpins
commodity prices. Prices remain well above
past 30 year average
Long Run Average

19
AUD holding up as global investors buy Aussie bonds…
Commodities structurally well supported (but volatile), higher relative Aussie cash rates, AAA rated status of
Australia remain supportive for AUD. Any further spike in market volatility & signs of US recovery will be a
negative for AUD. Negative real yields in the US supportive for commodities therefore underpin commodity
currencies over the longer term but volatility (& weaker commodity prices) in shorter term…
0.4
0.5
0.6
0.7
0.8
0.9
1.0
1.1
1.2
Jun-86 Jun-88 Jun-90 Jun-92 Jun-94 Jun-96 Jun-98 Jun-00 Jun-02 Jun-04 Jun-06 Jun-08 Jun-10 Jun-12
120
160
200
240
280
320
360
400
440
480
AUD, LHS CRB Index, RHS
AUD & Commodity Prices (CRB* ) AUD CRB Index
Source: Bloomberg, RBA Bulletin, UBS WM
* Commodity Research Bureau (CRB) Index includes Grains, Soft
Commodities, Energy, Industrials, Precious Metals & Livestock

20
Gold prices consolidated June. There was some price
recovery as markets considered possibility of QE3.
Forecast remains bearish in the next 3 months but more
bullish on a 12-month outlook. Higher gold supply in
March quarter 2012 which was in line with market
expectations. Catalyst in July for a spike in prices will
be further central bank intervention or prospect of
further QE in September quarter (not our core view).
Gold: still remain bearish 3-months & bullish 12-months
400
600
800
1,000
1,200
1,400
1,600
1,800
2,000
Jun-06 Dec-06 Jun-07 Dec-07 Jun-08 Dec-08 Jun-09 Dec-09 Jun-10 Dec-10 Jun-11 Dec-11 May-
Gold - Spot 55-Day MA 200-Day MA
Gold Price USD/Ounce, Daily Data
Source: Bloomberg, UBS WM * Data to 30 June 2012
Gold Price and Forecast (USD/Ounce)
Spot* 1,558
3-Month Futures Contract* 1,560
3-Month Forecast Bearish 1,520
12-Month Forecast Bullish 1,820
Source: UBS WMR, Bloomberg. * 30 June 2012

21
Weaker energy prices on growth concerns, will continue in July…
Weaker demand, higher supply combined
with rising inventories => lower short-term
trading ranges for the Sept quarter. In
general global growth needs to be revised
higher as a catalyst for energy prices to
move higher. WTI is heading towards the
$70-$80 USD/BBL band with Brent remaining
around the US$10-15 premium.
Forecast for Brent is $80-$99 USD/BBL for 3-
month trading range. 12-month forecast $110
USD/BBL.
0
25
50
75
100
125
150
Jun-00 Jun-01 Jun-02 Jun-03 Jun-04 Jun-05 Jun-06 Jun-07 Jun-08 Jun-09 Jun-10 Jun-11 Jun-12
Oil Spot Price - West Texas Intermediate (WTI) USD/Barrel. Weekly Data
Source: Bloomberg, UBS WM
Ideal oil price range as identified by
OPEC's largest producer
* Data up to 30 June 2012
0
2
4
6
8
10
12
14
16
Jan-00 Jan-01 Jan-02 Jan-03 Jan-04 Jan-05 Jan-06 Jan-07 Jan-08 Jan-09 Jan-10 Jan-11 Jan-12
Natural Gas - NYM EX Futures Contract 10,000m Thermal Units (mmBtu). Weekly Data
Source: Bloomberg, UBS WM
Natural gas accounts for almost a
quarter of US energy consumption
Higher US inventories
+ LNG alternative
options not enough to
drive a strong rebound
despite recent
production cuts
* Data up to 30 June 2012
0
100
200
300
400
500
600
700
800
Jan-00 Jan-01 Jan-02 Jan-03 Jan-04 Jan-05 Jan-06 Jan-07 Jan-08 Jan-09 Jan-10 Jan-11 Jan-12
Energy 3-M onth Forw ard Commodity Index Index. Jan 1996 = 100. Weekly Data
Source: Bloomberg
* Bloomberg 3-Month Forward
Global Energy Index
* Data up to 30 June 2012

22
No major catalyst for bulk prices to accelerate in short term…
Iron ore spot prices not as cyclical (or as volatile) as base metals. China 5 year plan will be more sustainable
pro-growth outlook. Demand for bulk commodities remains structurally strong, but shorter term more
volatile. Further, iron ore does not only come from the Pilbara region. The marginal CAPEX dollar for bulks
can (& is) going elsewhere. Ultimately, Australia will always be a price taker re commodity exports…
0
25
50
75
100
125
150
175
200
225
Dec-08 Mar-09 Jun-09 Sep-09 Dec-09 Mar-10 Jun-10 Sep-10 Dec-10 Mar-11 Jun-11 Sep-11 Dec-11 Mar-12 Jun-12
Source: Bloomberg, The Steel Index (TSI), UBS WM
Iron Ore Prices - China Import Fines 62% Fe spot USD/metric tonne, Tianjin port. Daily data
Price index is volume weighted average of transaction spot
* Data up to 30 June 2012

SECTION 6
Equity Market Indicators

24
US valuations not expensive
Simple US equity market multiples show valuations not very demanding vs. historical benchmarks. US
earnings recovery has been strong year-to-date but anticipate slower earnings growth in H2 2012. Limited
multiple expansion in current cycle. Current market correction challenging investor confidence. On balance,
reward for risk remains compelling over the cycle…
8.0
10.7
13.3
16.0
18.7
21.3
24.0
26.7
Jun-94 Jun-96 Jun-98 Jun-00 Jun-02 Jun-04 Jun-06 Jun-08 Jun-10 Jun-12
5-year average
Long run average
Market valuations - forward P/E
Source: Bloomberg, IBES, UBS WM
US Equity Valuat ions: S&P 500 1 Year Forward P/E. I/B/E/S. End-month Data
recent 5-year
average

25
S&P 500 Earnings Yield vs Credit Yield – Mind the Gap
The correlation between the S&P 500 earnings yield & corporate (Baa) bond index historically high until GFC.
Current Baa index yield suggests P/E should be greater than 16.0x – not the current 12.2x. Earnings
momentum will slow in 2012 vs 2011 but gap “should” converge further by year-end (non linear of course).
4.0%
5.0%
6.0%
7.0%
8.0%
9.0%
10.0%
Jun-04 Jun-05 Jun-06 Jun-07 Jun-08 Jun-09 Jun-10 Jun-11 Jun-12
Baa Index Yield S&P 500 Earnings Yield
Source: Bloomberg, Moodys, IBES, UBS WM
S&P 500 Earnings Yield vs Credit Yield (Baa)End-month Data
Mind the Gap - Correlation between earning yield
& credit yield has remained high over time. Recent
years the breakdown in relationship an
opportunity to accumulate risk. Current credit
spreads indicate a "higher" multiple vs current.
The Gap remains wide!
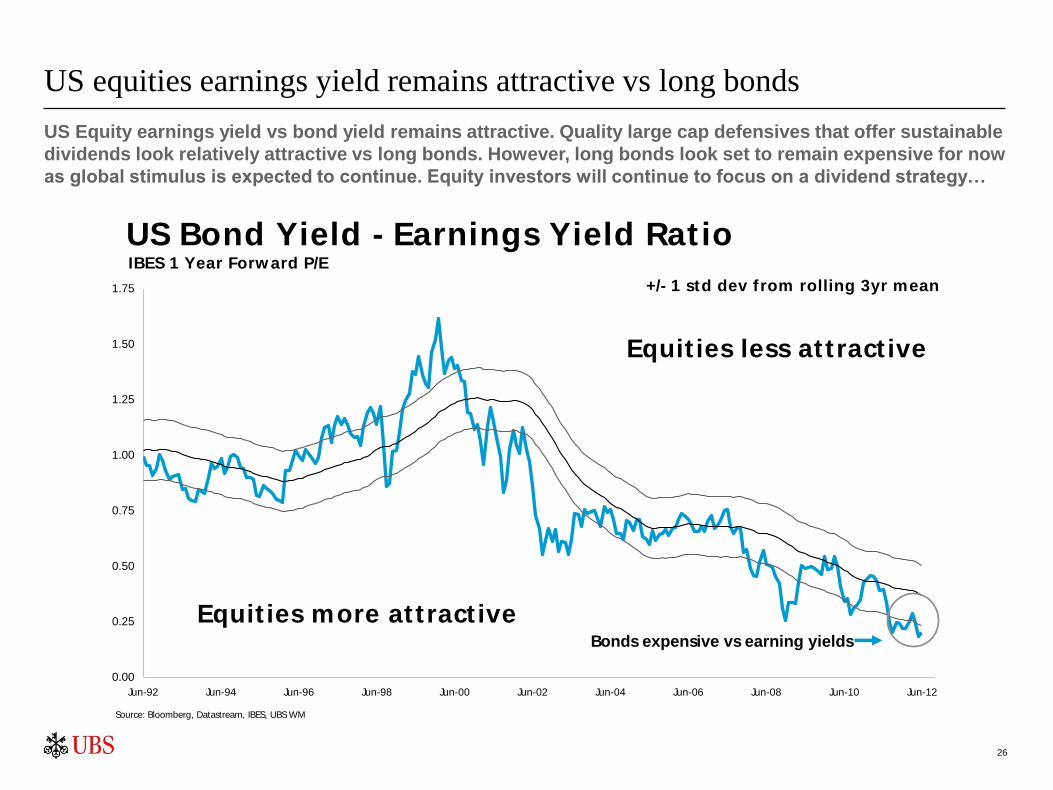
26
US equities earnings yield remains attractive vs long bonds
US Equity earnings yield vs bond yield remains attractive. Quality large cap defensives that offer sustainable
dividends look relatively attractive vs long bonds. However, long bonds look set to remain expensive for now
as global stimulus is expected to continue. Equity investors will continue to focus on a dividend strategy…
0.00
0.25
0.50
0.75
1.00
1.25
1.50
1.75
Jun-92 Jun-94 Jun-96 Jun-98 Jun-00 Jun-02 Jun-04 Jun-06 Jun-08 Jun-10 Jun-12
US Bond Yield - Earnings Yield Ratio
Equit ies less attract ive
Equit ies more attract ive
Source: Bloomberg, Datastream, IBES, UBS WM
+/- 1 std dev from rolling 3yr mean
IBES 1 Year Forw ard P/E
Bonds expensive vs earning yields

27
Aust equity market valuations remain compelling
Multiple shows Australian equity valuations cheap on a 12-month forward estimate. Australian market offers
value. Dividend strategy has delivered. Recent rates cuts a positive for earnings in second half 2012…
6.0
8.0
10.0
12.0
14.0
16.0
18.0
20.0
22.0
Jun-94 Jun-96 Jun-98 Jun-00 Jun-02 Jun-04 Jun-06 Jun-08 Jun-10 Jun-12
5-year average
Long run average
Market valuations - forward P/E
Source: Bloomberg, IBES, UBS WM
ASX 200 12 M onth Forw ard P/E Ratio 1 Year Forward P/E. I/B/E/S. End-month Data
28
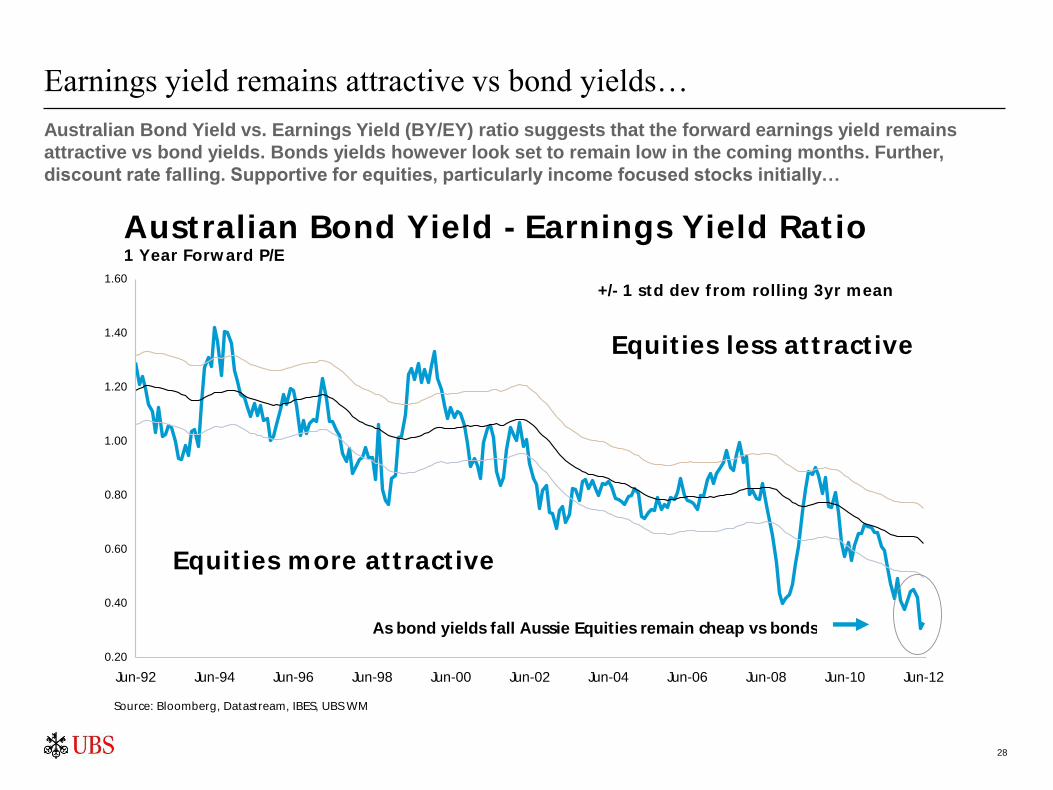
Earnings yield remains attractive vs bond yields…
Australian Bond Yield vs. Earnings Yield (BY/EY) ratio suggests that the forward earnings yield remains
attractive vs bond yields. Bonds yields however look set to remain low in the coming months. Further,
discount rate falling. Supportive for equities, particularly income focused stocks initially…
0.20
0.40
0.60
0.80
1.00
1.20
1.40
1.60
Jun-92 Jun-94 Jun-96 Jun-98 Jun-00 Jun-02 Jun-04 Jun-06 Jun-08 Jun-10 Jun-12
Australian Bond Yield - Earnings Yield Ratio
Equit ies less attract ive
Equit ies more attract ive
Source: Bloomberg, Datastream, IBES, UBS WM
+/- 1 std dev from rolling 3yr mean
1 Year Forw ard P/E
As bond yields fall Aussie Equities remain cheap vs bonds
29
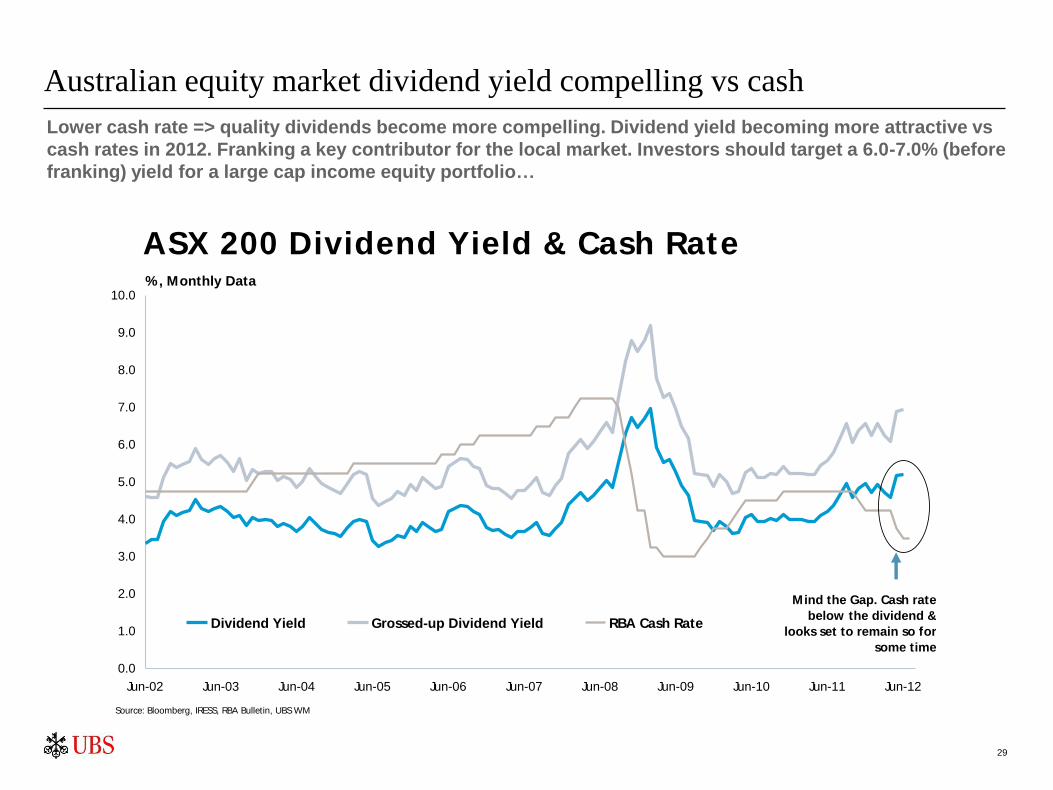
Australian equity market dividend yield compelling vs cash
Lower cash rate => quality dividends become more compelling. Dividend yield becoming more attractive vs
cash rates in 2012. Franking a key contributor for the local market. Investors should target a 6.0-7.0% (before
franking) yield for a large cap income equity portfolio…
0.0
1.0
2.0
3.0
4.0
5.0
6.0
7.0
8.0
9.0
10.0
Jun-02 Jun-03 Jun-04 Jun-05 Jun-06 Jun-07 Jun-08 Jun-09 Jun-10 Jun-11 Jun-12
Dividend Yield Grossed-up Dividend Yield RBA Cash Rate
ASX 200 Dividend Yield & Cash Rate %, Monthly Data
Source: Bloomberg, IRESS, RBA Bulletin, UBS WM
Mind the Gap. Cash rate
below the dividend &
looks set to remain so for
some time

30
Australian equity market dividend yield vs bond yields
Lower bond rates => quality dividends become more compelling. Dividend yield remains compelling vs bond
yields. Franking a key contributor for the local market. Investors should target a 6.0-7.0% (before franking)
yield for a large cap income equity portfolio. Focus on a quality dividend targeting equity portfolio…
0.0
1.0
2.0
3.0
4.0
5.0
6.0
7.0
8.0
9.0
10.0
Jun-02 Jun-03 Jun-04 Jun-05 Jun-06 Jun-07 Jun-08 Jun-09 Jun-10 Jun-11 Jun-12
Dividend Yield Grossed-up Dividend Yield 10 Year Bond Yield
ASX 200 Dividend Yield & Bond Yield %, Monthly Data
Source: Bloomberg, IRESS, RBA Bulletin, UBS Wealth Management
long bond yields look
set to remain lower in
the short run

31
Australian equity market performance over the long run
Year-to-date total return marginally positive (up 2.86% as of 30 June). The dividend has been a large
contributor. Australian equity market averages a negative annual return once every 3.4 years in the past 50
years. Annual expected returns going forward for domestic equities are around 10.0%. This does not include
franking. Can you handle negative returns through your lifecycle? If not => diversify…
-60%
-40%
-20%
0%
20%
40%
60%
80%
1958 1964 1970 1976 1982 1988 1994 2000 2006 2012
All Ordinaries Accumulat ion Index - Annual Performance
Source: Bloomberg, Datastream, RBA Bulletin, UBS WM Australia * Accumulation data. 2012 reading is data as of 30 June (YTD%)
Long-run average
More rate cuts
required to drive
market higher

SECTION 7.1
Sample equity portfolios & metrics

33
Australian Core Equity Portfolio
Aims of the Australian Core Equity Portfolio
For investors looking for a balanced, blue-chip core Australian portfolio, UBS WM offers the Australian Core Equity Portfolio. This
Portfolio gives the starting investments for every Australian portfolio.
When determining companies to add to the Australian Core Equity Portfolio, some of the metrics we consider include :
Potential for long term outperformance, and a history of stable growth and income distribution
A beta close to the market beta
Generally, the company should have a large market capitalisation, and companies on should be part of the ASX 50 index
The company must carry either a Buy or Neutral rating from UBS IB
The Australian Core Equity Portfolio
Source: UBS, Iress. Prices as at 29 June 2012.
Code Company Sector Market
Price UBS Rating
UBS Price
Target
Upside
/Downside P/E 12e Yield 12e %
Franking %
12e
Grossed
Up Yield
12e %
Market
Cap ($m)
AMP AMP Financials 3.85 Neutral 4.15 7.8% 12.1 6.36 0 6.36 10,990
BHP BHP Billiton Limited Materials 31.45 Buy 47.00 49.4% 9.7 3.39 100 4.84 167,408
CBA Commonwealth Bank Financials 53.10 Buy 53.50 0.8% 12.2 6.14 100 8.77 83,966
NAB National Australia Bank Financials 23.54 Neutral 24.50 4.1% 9.4 7.73 100 11.05 52,713
ORG Origin Energy Energy 12.20 Buy 17.00 39.3% 14.9 4.10 100 5.85 13,251
RIO Rio Tinto Limited Materials 56.50 Buy 103.00 82.3% 8.3 2.90 100 4.15 104,422
TCL Transurban Group Industrials 5.69 Buy 6.25 9.8% 50.9 5.18 24 5.58 8,049
TLS Telstra Corporation Limited Telecoms 3.69 Buy 4.00 8.4% 12.8 7.59 100 10.84 45,915
WOW Woolworths Limited Consumer Staples 26.80 Buy 28.00 4.5% 15.0 4.66 100 6.66 32,935
WPL Woodside Petroleum Limited Energy 31.02 Buy 43.05 38.8% 13.4 3.73 100 5.33 24,992
Average Yield: 5.18 6.94

34
Australian Core Equity Portfolio
Additions:
None this month
Portfolio Analytics
Removals:
None this month
Recent Changes
Source: UBS PAS.
PAS Metrics Model Portfolio ASX 200 Difference
Risk
Tracking Error 5.27
Beta 0.91 1.00 -0.09
Number Of Stocks 10 200 10 ex 200
Aggregate Statistics: Value
P/E 12.5 12.0 0.4
Yield 5.2 5.0 0.2
Price / Book 2.0 1.8 0.2
EV/EBIT 9.0 9.5 -0.5
Growth
Historic Earnings Growth 3.2 -3.5 6.6
Forecast Earnings Growth 5.1 9.3 -4.2
Forecast Dividend Growth 5.0 5.8 -0.8
Quality
Return On Equity 16.3 15.0 1.3
Dividend Cover 1.5 1.7 -0.1
Debt / Equity Ratio 39.7 30.7 9.0
PAS Metrics Model Portfolio ASX 200 Difference
Group Weights (%)
Energy 100.0 100.0 0.0
Materials 0.0 0.0 0.0
Industrials 0.0 0.0 0.0
Consumer Discretionary 20.0 7.4 12.6
Consumer Staples 20.0 23.9 -3.9
Health Care 10.0 7.2 2.8
Financials 0.0 3.4 -3.4
Information Technology 10.0 7.8 2.2
Telecommunication Services 0.0 3.7 -3.7
Utilities 30.0 39.9 -9.9

35
Australian Core Equity Defensive Portfolio
Aims of the Core Equity Defensive Portfolio
For conservative equity investors, or investors looking for more defensive equity holdings, UBS WM offers the Core Equity Defensive
Portfolio. The aim is to encourage investors to look at companies with defensive cash flows to be adequately represented in portfolios.
When determining companies to add to the Core Equity Defensive Portfolio, some of the metrics we consider include :
Quality dividends through a cycle. The dividend target of the Core Equity Defensive Portfolio is higher than the Core
Equity Portfolio
The portfolio is intended to be less volatile vs the broader equity market, so the aim is for a lower than market beta value
The company must carry either a Buy or Neutral rating from UBS IB
Generally, the company should have a large market capitalisation, and companies should be part of the ASX 100 index
The Core Equity Defensive Portfolio
Source: UBS, Iress. Prices as at 29 June 2012.
Code Company Sector Market
Price UBS Rating
UBS Price
Target
Upside
/Downside P/E 12e Yield 12e %
Franking %
12e
Grossed Up
Yield 12e %
Market
Cap ($m)
AGK AGL Energy Limited Utilities 14.77 Buy 16.20 9.7% 14.7 4.06 100 5.80 8,061
CBA Commonwealth Bank Financials 53.10 Buy 53.50 0.8% 12.2 6.14 100 8.77 83,966
CCL Coca-Cola Amatil Limited Consumer Staples 13.38 Neutral 12.45 -7.0% 17.7 4.25 100 6.07 9,935
NAB National Australia Bank Financials 23.54 Neutral 24.50 4.1% 9.4 7.73 100 11.05 52,713
NCM Newcrest Mining Limited Materials 22.61 Neutral 30.00 32.7% 15.5 1.11 0 1.11 17,297
TAH Tabcorp Holdings Limited Consumer Discretionary 2.93 Buy 3.50 19.5% 5.9 8.53 100 12.19 2,016
TCL Transurban Group Industrials 5.69 Buy 6.25 9.8% 50.9 5.18 24 5.58 8,049
TLS Telstra Corporation Limited Telecoms 3.69 Buy 4.00 8.4% 12.8 7.59 100 10.84 45,915
WES Wesfarmers Limited Consumer Staples 29.90 Neutral 31.40 5.0% 16.3 5.45 100 7.79 34,849
WOW Woolworths Limited Consumer Staples 26.80 Buy 28.00 4.5% 15.0 4.66 100 6.66 32,935
Average Yield: 5.47 7.59

36
Australian Core Equity Defensive Portfolio
Removals:
ANZ – Since the initiation of the portfolio on 22 August 2011, ANZ
has returned 15.34% versus the ASX 200 Accum return of 2.93%.
In light of the UBS IB Sell recommendation at current price levels,
we have decided to take profit in ANZ.
Portfolio Analytics
CSL – Since the initiation of the portfolio on 22 August 2011, CSL
has returned 34.20% versus the ASX 200 Accum return of
2.93%.
In the current market climate, we have decided to lock in this
profit. We continue to believe that CSL is a quality defensive
position for portfolios.
Recent Changes
Source: UBS PAS.
PAS Metrics Model Portfolio ASX 200 Difference
Risk
Tracking Error 6.77
Beta 0.74 1.00 -0.26
Number Of Stocks 10 200 10 ex 200
Aggregate Statistics: Value
P/E 13.1 12.0 1.1
Yield 5.8 5.0 0.7
Price / Book 1.9 1.8 0.1
EV/EBIT 10.6 9.5 1.2
Growth
Historic Earnings Growth -0.4 -3.5 3.1
Forecast Earnings Growth -0.5 9.3 -9.8
Forecast Dividend Growth 0.9 5.8 -4.9
Quality
Return On Equity 14.5 15.0 -0.5
Dividend Cover 1.3 1.7 -0.3
Debt / Equity Ratio 40.2 30.7 9.5
PAS Metrics Model Portfolio ASX 200 Difference
Group Weights (%)
Energy 100.0 100.0 0.0
Materials 0.0 0.0 0.0
Industrials 0.0 0.0 0.0
Consumer Discretionary 0.0 7.4 -7.4
Consumer Staples 10.0 23.9 -13.9
Health Care 10.0 7.2 2.8
Financials 10.0 3.4 6.6
Information Technology 30.0 7.8 22.2
Telecommunication Services 0.0 3.7 -3.7
Utilities 20.0 39.9 -19.9

37
Australian Core Equity Income Portfolio
Aims of the Core Equity Income Portfolio
For equity investors looking to maximise the income from investments, UBS WM offers the Core Equity Income Portfolio. The target of
this portfolio is to provide a yield significantly in excess of the benchmark, without necessarily being exposed to greater levels of risk and
earnings uncertainty.
When determining companies to add to the Core Equity Income Portfolio, some of the metrics we consider include:
• A dividend yield above that average yield of the ASX 200, and above the 10 year bond yield
• A lower than market beta value
• A dividend coverage ratio above 1.00
• Generally, the company should have a market capitalisation of over $500 million
The Core Equity Income Portfolio
Source: UBS, Iress. Prices as at 29 June 2012.
Code Company Sector Market
Price UBS Rating
UBS Price
Target
Upside
/Downside P/E 12e Yield 12e %
Franking %
12e
Grossed Up
Yield 12e %
Market
Cap ($m)
AMP AMP Financials 3.85 Neutral 4.15 7.8% 12.1 6.36 0 6.36 10,990
CBA Commonwealth Bank Financials 53.10 Buy 53.50 0.8% 12.2 6.14 100 8.77 83,966
CCL Coca-Cola Amatil Limited Consumer Staples 13.38 Neutral 12.45 -7.0% 17.7 4.25 100 6.07 9,935
DUE Diversified Utility & Energy Utilities 1.84 Neutral 1.82 -1.1% 11.7 8.70 0 8.70 2,070
NAB National Australia Bank Financials 23.54 Neutral 24.50 4.1% 9.4 7.73 100 11.05 52,713
TAH Tabcorp Holdings Limited Consumer Discretionary 2.93 Buy 3.50 19.5% 5.9 8.53 100 12.19 2,016
TLS Telstra Corporation Limited Telecoms 3.69 Buy 4.00 8.4% 12.8 7.59 100 10.84 45,915
TTS Tatts Group Limited Consumer Discretionary 2.62 Neutral 2.50 -4.6% 11.4 8.02 100 11.45 3,513
WBC Westpac Banking Corporation Financials 21.13 Neutral 23.00 8.8% 10.6 7.86 100 11.22 64,531
WES Wesfarmers Limited Consumer Staples 29.90 Neutral 31.40 5.0% 16.3 5.45 100 7.79 34,849
WRT Westfield Retail Trust Financials 2.85 Buy 2.90 1.8% 15.2 6.59 0 6.59 8,704
Average Yield: 7.02 9.18

38
Australian Core Equity Income Portfolio
Additions:
CCL - CCL is the Australasian anchor bottler in the Coca-Cola
system, with Australia contributing approximately 68% of group
earnings.
Last month, we added CCL to the Core Defensive Portfolio. We are
now adding to the Core Income Portfolio, as even at current
historical high share prices, CCL delivers a yield of 8.41% (fully
franked). Portfolio Analytics
Removals:
None this month
Recent Changes
Source: UBS PAS.
PAS Metrics Model
Portfolio ASX 200 Difference
Risk
Tracking Error 6.31
Beta 0.85 1.00 -0.15
Number Of Stocks 11 200 11 ex 200
Aggregate Statistics: Value
P/E 12.4 12.0 0.3
Yield 7.0 5.0 1.9
Price / Book 1.5 1.8 -0.3
EV/EBIT 9.3 9.5 -0.1
Growth
Historic Earnings Growth -1.9 -3.5 1.5
Forecast Earnings Growth -7.5 9.3 -16.8
Forecast Dividend Growth -3.5 5.8 -9.3
Quality
Return On Equity 12.2 15.0 -2.8
Dividend Cover 1.2 1.7 -0.5
Debt / Equity Ratio 124.7 30.7 94.0
PAS Metrics Model Portfolio ASX 200 Difference
Group Weights (%)
Energy 100.0 100.0 0.0
Materials 0.0 0.0 0.0
Industrials 0.0 0.0 0.0
Consumer Discretionary 0.0 7.4 -7.4
Consumer Staples 0.0 23.9 -23.9
Health Care 0.0 7.2 -7.2
Financials 18.2 3.4 14.8
Information Technology 18.2 7.8 10.3
Telecommunication Services 0.0 3.7 -3.7
Utilities 45.5 39.9 5.5

SECTION 7.2
Sample International Equity Satellite Portfolio Themes

40
International Equity Satellite Portfolio
Aims of the International Equity Satellite Portfolio
For equity investors looking to add direct Global equities to portfolios, UBS WM offers the International Equity Satellite Portfolio. The
target of this portfolio is to provide a Satellite portfolio of mega-cap, International companies with solid future growth prospects. The
holdings are determined in consultation with Specialists in both Australia and APAC.
When determining companies to add to the International Equity Satellite Portfolio, some of the metrics we consider include:
• A focus on sector representation that is not adequately represented on the Australian market, e.g. Information
Technology, Global Industrials and Telecommunications.
• Companies with a globally recognised business line that provide an opportunity to participate in earnings upside.
• Any company that becomes part of the Portfolio must be included in the Global Top Pick List, the UBS IB Key Calls List,
or the WMR Top 25 Stock List. If the company is subsequently removed from all of these lists, it is also automatically
removed from the Portfolio.
International Equity Satellite Portfolio
Source: UBS, Iress. Prices as at 29 June 2012.
Code Company Base Currency Market Price UBS Rating UBS Price
Target Price Upside P/E 12e Yield 12e %
Market
Cap ($B USD)
DE Deere and Co USD 80.87 Buy 115.00 42.2% 9.7 2.03 30.9
CSX CSX Corporation USD 22.36 Buy 29.00 29.7% 12.8 2.37 22.3
EBAY EBay Inc USD 42.01 Buy 45.00 7.1% 17.8 0.00 52.2
GE General Electric Company USD 20.84 Buy 23.00 10.4% 13.4 3.26 196.3
GOOG Google Inc USD 580.07 Buy 825.00 42.2% 13.1 0.00 201.0
KO Coca Cola Company USD 78.19 Neutral 77.00 -1.5% 19.0 2.74 176.1
NESN NESTLE N CHF 56.55 Buy 58.00 2.6% 17.4 3.63 174.0
NOVN NOVARTIS N CHF 52.90 Buy 60.00 13.4% 9.7 4.54 143.1
Average Yield: 2.32

SECTION 7.3
Sample Australian Listed Property
42
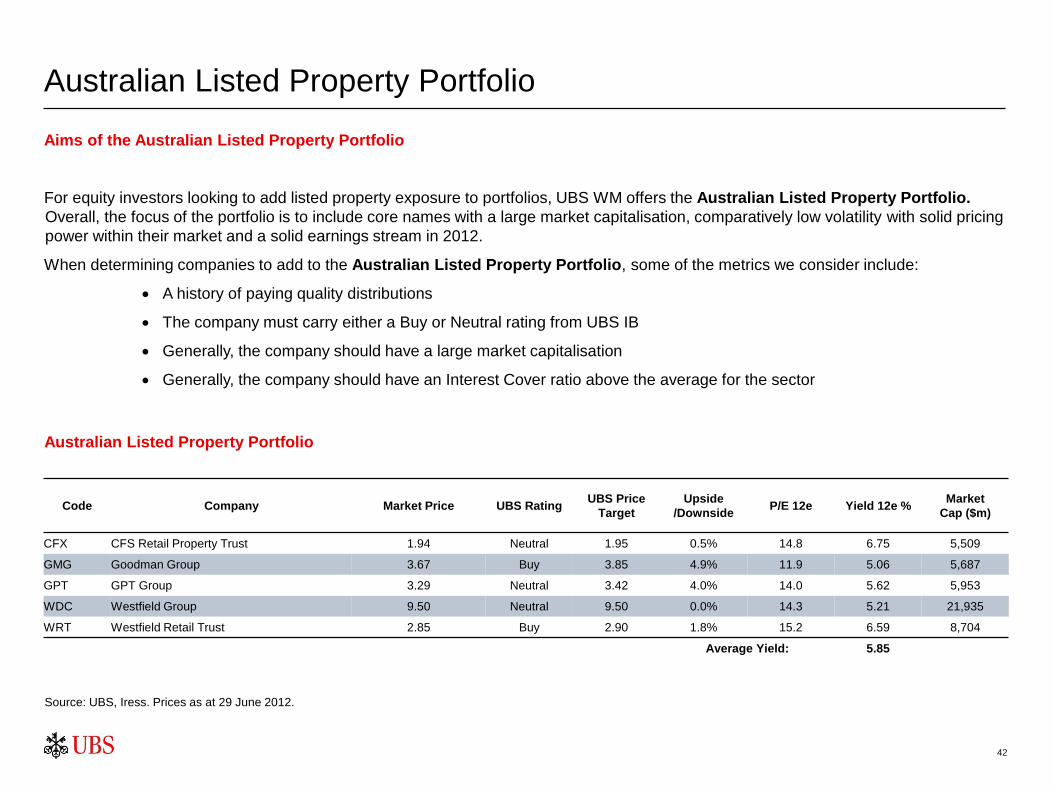
Australian Listed Property Portfolio
Aims of the Australian Listed Property Portfolio
For equity investors looking to add listed property exposure to portfolios, UBS WM offers the Australian Listed Property Portfolio.
Overall, the focus of the portfolio is to include core names with a large market capitalisation, comparatively low volatility with solid pricing
power within their market and a solid earnings stream in 2012.
When determining companies to add to the Australian Listed Property Portfolio, some of the metrics we consider include:
A history of paying quality distributions
The company must carry either a Buy or Neutral rating from UBS IB
Generally, the company should have a large market capitalisation
Generally, the company should have an Interest Cover ratio above the average for the sector
Australian Listed Property Portfolio
Source: UBS, Iress. Prices as at 29 June 2012.
Code Company Market Price UBS Rating UBS Price
Target
Upside
/Downside P/E 12e Yield 12e %
Market
Cap ($m)
CFX CFS Retail Property Trust 1.94 Neutral 1.95 0.5% 14.8 6.75 5,509
GMG Goodman Group 3.67 Buy 3.85 4.9% 11.9 5.06 5,687
GPT GPT Group 3.29 Neutral 3.42 4.0% 14.0 5.62 5,953
WDC Westfield Group 9.50 Neutral 9.50 0.0% 14.3 5.21 21,935
WRT Westfield Retail Trust 2.85 Buy 2.90 1.8% 15.2 6.59 8,704
Average Yield: 5.85

SECTION 7.4
Sample Australian Fixed Income & Hybrids

44
Government Bond Portfolio
Aims of the Government Bond Portfolio
The Government Bond Portfolio provides a regular income with minimal credit risk and capital preservation. The bonds pay semi
annual coupons, offer a range of maturities from 1 to 12 years, are highly liquid and can be traded in minimum parcel sizes of $5,000 and
in $1,000 increments.
When determining bonds to add to the Government Bond Portfolio, some of the metrics we consider include:
The Government Bond Portfolio
• The number of securities varies between 6 and 12 in
order to give a representative spread of the curve.
• Client suitability – the Portfolio is suitable as a starting
point for all fixed income clients but is specifically
designed with the risk-averse investor in mind. It is a
―AAA‖ portfolio.
• The duration of the chosen bonds varies according to the
current duration strategy.
• Duration management relies more on the weightings applied to
particular bonds rather than using all the securities available
across the curve from the benchmark index.
Source: UBS, Iress. Prices as at 29 June 2012.
Issuer Coupon Rate
%
Call/Maturity
Date
Duration
(Years)
Running Yield
%
Yield to
Call/Maturity %
Face Value
$AUD
Gross Price
$AUD
Consideration
$AUD
Portfolio
Weight
CGL 6.50 15-May-13 0.84 6.25 2.87 145,000 103.96 150,735 15%
CGL 6.25 15-Jun-14 1.84 5.81 2.46 235,000 107.50 252,623 25%
CGL 6.25 15-Apr-15 2.55 5.60 2.39 180,000 111.69 201,040 20%
CGL 6.00 15-Feb-17 4.01 5.11 2.50 85,000 117.47 99,851 10%
CGL 5.25 15-Mar-19 5.66 4.49 2.73 130,000 116.89 151,962 15%
CGL 4.50 15-Apr-20 6.57 4.00 2.84 90,000 112.53 101,280 10%
CGL 5.75 15-May-21 7.12 4.69 2.93 40,000 122.63 49,052 5%
Total 3.36 5.33 2.66 905,000 1,006,543 100%
Index duration: 4.23
Active duration: -0.88

45
Semi Government Bond Portfolio
Aims of the Semi Government Bond Portfolio
The Semi Government Bond Portfolio provides a regular income with minimal credit risk and capital preservation. The bonds are
issued by all Australian States and Territories, pay semi annual coupons and offer a range of maturities from 1 to 23 years. They are
highly liquid and can be traded in minimum parcel sizes of $5,000 and in $1,000 increments.
When determining bonds to add to the Semi Government Bond Portfolio, some of the metrics we consider include:
The Semi Government Bond Portfolio
• The number of securities varies between 6 and 12 in
order to give a representative spread of the curve.
• Client suitability – the Portfolio is suitable as a starting
point for all fixed income clients but is specifically
designed with the risk-averse investor in mind. It is
representative of the UBS Semi-Government benchmark
index.
• The duration of the chosen bonds varies according to the
current duration strategy.
• Duration management relies more on the weightings applied to
particular bonds rather than using all the securities available
across the curve from the benchmark index.
• Lower coupons are usually selected in order to prevent
investors having to pay any significant premiums
Source: UBS, Iress. Prices as at 29 June 2012.
Issuer Coupon Rate
%
Call/Maturity
Date
Duration
(Years)
Running Yield
%
Yield to
Call/Maturity %
Face Value
$AUD
Gross Price
$AUD
Consideration
$AUD
Portfolio
Weight
QTC 6.00 21-Aug-13 1.07 5.70 3.16 45,000 105.34 47,402 5%
TCV 4.75 15-Oct-14 2.14 4.54 3.07 95,000 104.71 99,473 10%
QTC 6.00 21-Oct-15 2.97 5.51 3.52 185,000 108.87 201,400 20%
TCV 5.75 15-Nov-16 3.85 5.22 3.41 225,000 110.20 247,952 25%
WATC 8.00 15-Jul-17 4.12 6.43 3.50 200,000 124.36 248,720 25%
QTC 6.00 21-Feb-18 4.71 5.36 4.04 135,000 111.99 151,184 15%
Total 3.57 5.56 3.56 885,000 996,131 100%
Index duration: 4.46
Active duration: -0.89

46
Corporate Fixed Rate Bond Portfolio
Aims of the Corporate Fixed Rate Bond Portfolio
The Corporate Fixed Rate Bond Portfolio consists of the best value fixed rate bonds from the current available corporate issues. The
chosen bonds have had their liquidity confirmed and can be traded in minimum parcel sizes of $500,000. We look to ensure that the
portfolio is diversified across all the sectors of the issuers.
When determining bonds to add to the Corporate Fixed Rate Bond Portfolio, some of the metrics we consider include:
The Corporate Fixed Rate Bond Portfolio
• The bond must exist on the Universe of Approved
issuers.
• The duration of the chosen bonds varies according to the
current duration strategy. Our current core duration
recommendation is a shorter than benchmark position.
• Client suitability – the Portfolio is suitable as a starting point for
all fixed income clients.
• The bond must have at least $3m of the issue currently
available to meet liquidity requirements.
Source: UBS, Iress. Prices as at 29 June 2012.
Issuer Coupon Rate
%
Call/Maturity
Date
Duration
(Years)
Running Yield
%
Yield to
Call/Maturity %
Face Value
$AUD
Gross Price
$AUD
Consideration
$AUD
Portfolio
Weight
NAB SUB 7.25 21-Dec-12 0.46 7.15 4.58 500,000 101.46 507,310 10%
UBSAGAU 6.25 26-Aug-13 1.08 6.00 4.46 500,000 104.18 520,905 10%
CBA# 6.25 10-Sep-13 1.12 5.96 3.73 500,000 104.86 524,305 10%
WESFARMERS 8.25 11-Sep-14 1.96 7.48 4.50 500,000 110.30 551,475 10%
GECAPITAL 7.00 8-Oct-15 2.88 6.42 4.55 500,000 109.02 545,100 10%
WOOLWORTHS 6.75 22-Mar-16 3.24 6.13 4.31 500,000 110.19 550,970 10%
ING 7.00 22-Mar-16 3.19 6.66 6.06 500,000 105.05 525,245 10%
WESTF RET 7.00 18-Oct-16 3.66 6.45 5.15 500,000 108.51 542,565 10%
CB CBA 5.75 25-Jan-17 3.91 5.32 4.37 500,000 108.18 540,905 10%
CB WESTPAC 5.75 6-Feb-17 3.94 5.32 4.37 500,000 108.02 540,080 10%
Total 2.56 6.29 4.69 5,000,000 5,348,860 100%

47
Corporate Floating Rate Note Portfolio
Aims of the Corporate Floating Rate Note Portfolio
The Corporate Floating Rate Note Portfolio consists of the best value FRNs from the current available corporate issues. The chosen
bonds have had their liquidity confirmed and can be traded in minimum parcel sizes of $500,000. We look to ensure that the portfolio is
diversified across all the sectors of the issuers.
When determining bonds to add to the Corporate Floating Rate Note Portfolio, some of the metrics we consider include:
The Corporate Floating Rate Note Portfolio
• The bond must exist on the Universe of Approved
issuers.
• The duration of the chosen bonds varies according to the
current duration strategy. Our current core duration
recommendation is a shorter than benchmark position.
• Client suitability – the Portfolio is suitable as a starting point for
all fixed income clients.
• The bond must have at least $3m of the issue currently
available to meet liquidity requirements.
Source: UBS, Iress. Prices as at 29 June 2012.
Issuer Coupon
Margin bps
Call/Maturity
Date
Duration
(Years)
Running
Yield %
Yield to
Call/Maturity
%
Face Value
$AUD
Gross Price
$AUD
Consideration
$AUD
Trading
Margin %
Next Coupon
Date
Portfolio
Weight
NAB SUB 26 21-Dec-12 0.22 3.81 4.75 500,000 99.64 498,180 1.30 21-Sep-12 10%
BKQLD 150 6-Jun-13 0.18 4.90 4.96 500,000 100.11 500,550 1.75 6-Sep-12 10%
UBSAGAU 148 26-Aug-13 0.15 4.98 4.45 500,000 100.69 503,445 1.30 27-Aug-12 10%
GECAPITAL 110 18-Feb-14 0.13 4.69 4.02 500,000 100.92 504,610 0.90 20-Aug-12 10%
WESTPAC 110 18-Aug-14 0.13 4.69 4.00 500,000 101.08 505,375 0.87 20-Aug-12 10%
HSBC 115 6-Mar-15 0.18 4.54 4.32 500,000 100.36 501,795 1.13 6-Sep-12 10%
ANZ 135 26-Oct-15 0.06 5.40 4.55 500,000 101.43 507,150 1.23 26-Jul-12 10%
WESTPAC 110 9-Nov-15 0.10 4.80 4.63 500,000 100.28 501,410 1.25 9-Aug-12 10%
AMP SUB 250 26-Mar-16 -0.02 6.92 6.35 500,000 100.01 500,050 2.85 26-Jun-12 10%
CB WESTPAC 165 6-Feb-17 0.10 5.29 4.44 500,000 103.27 516,360 1.07 7-Aug-12 10%
Total 0.12 5.00 4.64 5,000,000 5,038,925 1.20 100%

48
Conservative Hybrid Portfolio
Aims of the Conservative Hybrid Portfolio
The Conservative Hybrid Portfolio focuses on issuers with investment grade ratings that display minimum volatility in normal market
conditions. The issuer must be a financial institution and be highly liquid relative to other hybrid securities listed on the ASX. We
recommend no more than a 10% weighting to listed subordinated hybrids within the fixed income asset class for conservative
investors.
When determining companies to add to the Conservative Hybrid Portfolio, some of the metrics we consider include:
The Conservative Hybrid Portfolio
• S&P security rating of investment grade (BBB- and above)
• Minimum Issue size of $500m
• Included in the top fifteen hybrid securities by monthly turn
over
• The hybrid must have limited extension risk, based on
market expectations and UBS analysis
• The issuer must have a strong, stable cash flow and
balance sheet, and must be listed on the ASX 200
Source: UBS, Iress. Prices as at 29 June 2012.
ASX Code Security - Franking Dividend Rate First call/reset
date
Yield to call /
reset
Trading
Margin over
BBSW
Running
Yield
Duration
(Years)
Call Date
(years)
Market
Price Weight
ANZHA ANZ Sub Notes - Unfranked BBSW + 2.75% 20-Jun-17 6.24% 2.65% 6.23% 0.18 4.98 $100.65 10.0%
ANZPA ANZ CPS2 - Franked BBSW + 3.10% 15-Dec-16 6.89% 3.39% 6.77% 0.15 4.47 $99.25 10.0%
ANZPC ANZ CPS3 - Franked BBSW + 3.10% 01-Sep-17 7.52% 3.92% 7.81% 0.11 5.18 $98.99 10.0%
CBAHA CBA Retail Bond - Unfranked BBSW + 1.05% 24-Dec-15 5.18% 1.84% 5.39% 0.00 3.49 $98.78 10.0%
CBAPA CBA PERLS V - Franked BBSW + 3.40% 31-Oct-14 6.34% 3.10% 7.37% 0.04 2.34 $203.99 10.0%
CNGHA Colonial Group Sub Notes - Unfranked BBSW + 3.25% 31-Mar-17 6.95% 3.40% 7.65% -0.05 4.76 $99.50 10.0%
IAGPC IAG CPS - Franked BBSW + 4.00% 01-May-17 8.36% 4.79% 8.22% 0.29 4.84 $98.10 10.0%
SBKPB Suncorp-Metway CPS - Franked BBSW + 3.20% 14-Jun-13 8.88% 5.66% 6.90% 0.15 0.96 $98.15 10.0%
TAHHA Tabcorp Bonds - Unfranked BBSW + 4.25% 01-May-14 5.94% 2.72% 7.81% 0.08 1.84 $103.80 10.0%
WOWHC WOW Notes II - Unfranked BBSW + 3.25% 24-Nov-16 5.99% 2.50% 6.53% 0.10 4.41 $103.60 10.0%
Total 6.79% 3.31% 7.07% 0.11 3.73 100.0%

49
Moderate Hybrid Portfolio
Aims of the Moderate Hybrid Portfolio
The Moderate Hybrid Portfolio focuses on issuers with investment grade ratings that may display some volatility. The issuer must be a
recognised, regular user of debt and/or hybrid markets, and the issue must be moderately liquid, relative to other hybrid securities listed
on the ASX. We recommend no more than a 20% weighting to listed subordinated hybrids within the fixed income asset class for
moderate investors.
When determining companies to add to the Moderate Hybrid Portfolio, some of the metrics we consider include:
• S&P security rating of investment grade (BBB- and above)
• Minimum Issue size of $250m
• Included in top twenty hybrid securities by monthly turn over
• The issuer must have a strong, stable cash flow and balance sheet
The Moderate Hybrid Portfolio
Source: UBS, Iress. Prices as at 29 June 2012.
ASX Code Security - Franking Dividend Rate First call/reset
date
Yield to call /
reset
Trading
Margin over
BBSW
Running
Yield
Duration
(Years)
Call Date
(years)
Market
Price Weight
AGKHA AGL Notes - Unfranked BBSW + 3.80% 08-Jun-19 7.66% 3.91% 7.39% 0.15 6.95 $99.92 10.0%
ANZHA ANZ Sub Notes - Unfranked BBSW + 2.75% 20-Jun-17 6.24% 2.65% 6.23% 0.18 4.98 $100.65 10.0%
ANZPC ANZ CPS3 - Franked BBSW + 3.10% 01-Sep-17 7.52% 3.92% 7.81% 0.11 5.18 $98.99 10.0%
CBAHA CBA Retail Bond - Unfranked BBSW + 1.05% 24-Dec-15 5.18% 1.84% 5.39% 0.00 3.49 $98.78 10.0%
IAGPC IAG CPS - Franked BBSW + 4.00% 01-May-17 8.36% 4.79% 8.22% 0.29 4.84 $98.10 10.0%
ORGHA Origin Notes - Unfranked BBSW + 4.00% 22-Dec-16 7.57% 4.07% 7.55% 0.19 4.48 $99.99 10.0%
SBKPB Suncorp-Metway CPS - Franked BBSW + 3.20% 14-Jun-13 8.88% 5.66% 6.90% 0.15 0.96 $98.15 10.0%
TAHHA Tabcorp Bonds - Unfranked BBSW + 4.25% 01-May-14 5.94% 2.72% 7.81% 0.08 1.84 $103.80 10.0%
WCTPA Westpac TPS - Franked BBSW + 1.00% 30-Jun-16 8.27% 4.85% 6.00% -0.07 4.01 $87.75 10.0%
WOWHC WOW Notes II - Unfranked BBSW + 3.25% 24-Nov-16 5.99% 2.50% 6.53% 0.10 4.41 $103.60 10.0%
Total 7.16% 3.63% 6.98% 0.12 2.05 100.0%

50
Aggressive Hybrid Portfolio
Aims of the Aggressive Hybrid Portfolio
The Aggressive Hybrid Portfolio focuses on issuers which may provide significant capital upside from opportunities that may arise, for
reasons including, but not limited to, speculation regarding time to maturity, earnings outlook of the underlying issuer, market and
economic conditions. We recommend no more than a 25% weighting to listed subordinated hybrids within the fixed income asset class
for aggressive investors.
When determining companies to add to the Aggressive Hybrid Portfolio, some of the metrics we consider include:
• No rating of the issuer or issue is required
• Minimum Issue size of $100m
• Liquidity available to facilitate entry
• Displays a yield to call date significantly higher than the average weighted yield of the major bank convertible hybrids
The Aggressive Hybrid Portfolio
Source: UBS, Iress. Prices as at 29 June 2012.
ASX Code Security - Franking Dividend Rate First call/reset
date
Yield to call /
reset
Trading
Margin over
BBSW
Running
Yield
Duration
(Years)
Call Date
(years)
Market
Price Weight
AAZPB Australand ASSETS - Unfranked BBSW + 4.80% Perp 9.79% 5.85% 10.15% -0.02 - $89.00 8.3%
AGKHA AGL Notes - Unfranked BBSW + 3.80% 08-Jun-19 7.66% 3.91% 7.39% 0.15 6.95 $99.92 8.3%
IAGPC IAG CPS - Franked BBSW + 4.00% 01-May-17 8.36% 4.79% 8.22% 0.29 4.84 $98.10 8.3%
HLNG Healthscope Notes - Unfranked 11.25% Fixed 17-Jun-16 10.68% 7.26% 11.01% 3.97 3.97 $102.50 8.3%
NFNG Nufarm Step-up Securities - Unfranked BBSW + 3.90% Perp 10.78% 6.84% 11.13% 0.25 - $74.60 8.3%
MQCPA Macquarie Group CPS - Unfranked 11.10% Fixed 30-Jun-13 3.96% 0.77% 10.83% 1.00 1.00 $102.50 8.3%
ORGHA Origin Notes - Unfranked BBSW + 4.00% 22-Dec-16 7.57% 4.07% 7.55% 0.19 4.48 $99.99 8.3%
SBKPB Suncorp-Metway CPS - Franked BBSW + 3.20% 14-Jun-13 8.88% 5.66% 6.90% 0.15 0.96 $98.15 8.3%
SVWPA Seven Telys 4 - Franked BBSW + 4.75% Perp 11.23% 7.29% 10.34% 0.36 - $77.99 8.3%
TAHHB Tabcorp Subordinated Notes - Unfranked BBSW + 4.00% 22-Mar-17 8.23% 4.68% 7.73% 0.19 4.73 $97.60 8.3%
WCTPA Westpac TPS - Franked BBSW + 1.00% 30-Jun-16 8.27% 4.85% 6.00% -0.07 4.01 $87.75 8.3%
WOWHC WOW Notes II - Unfranked BBSW + 3.25% 24-Nov-16 5.99% 2.50% 6.53% 0.10 4.41 $103.60 8.3%
Total 7.95% 4.42% 8.65% 0.55 1.63 100.0%

SECTION 8
Strategic Asset Allocation (SAA)
Tactical Asset Allocation (TAA)
Reference Portfolios – risk metrics and expected returns. Sample only

52 52
The importance of Strategic Asset Allocation
Strategic Asset Allocation:
The appropriate mix of asset classes based on long-term market assumptions (10+ years) given an
investor's objectives and risk tolerance. The optimal portfolio depends on the preferences and the risk
profile of the investor.
Sub-
optimal
portfolio
Optimal
portfolio
Efficient frontier
line
Risk
Re
turn
Strategic Asset Allocation of an initial and optimized
portfolio.
The efficient frontier line represents the portfolios
with the lowest risk for each given return level.
These portfolios are called "efficient" portfolios.
Equity
Bonds
Real Estate
Cash
Sub-optimal
portfolio
Optimal
portfolio
Equity
Bonds
Commodities
Real Estate
Cash
Hedge Funds
Private Equity
Please refer to the disclaimer at the end of this presentation
For illustrative purposes only
The most important
decision, in the long
term, is the Strategic
Asset Allocation ...
… as it accounts for
up to 90% of asset
returns

53
Comparison of Sample Portfolios reflecting different risk appetites
Generated by QIS
3
2
1
5.3%
5.8%
6.3%
6.8%
7.3%
7.8%
8.3%
0.0% 2.0% 4.0% 6.0% 8.0% 10.0% 12.0%
Annualised Est imated Risk %
An
nu
alise
d E
stim
ate
d R
etu
rn %
1 = Conservative 2 = Moderate 3 = Aggressive
Risk p.a Return p.a
1 4.8% 6.3%
2 7.5% 6.9%
3 9.6% 7.4%
Portfolio forward-looking estimated risk and return scatter
Data as of 31/05/2012
For illustrative purposes only. Markets are subject to change and returns may vary. See explanation under "Ex-Ante Estimates" at the end of this document. Please note that this page
is always to be read in conjunction with the risk information and explanations of terms appended to this presentation.

54
Comparison of Portfolios
Generated by QIS
-40.0%
-30.0%
-20.0%
-10.0%
0.0%
10.0%
20.0%
30.0%
40.0%
Re
turn
Conservat ive 9.7% 24.9%10.9%23.7%-7.8% 19.0%10.6% 21.1% 15.7% 4.2% 14.7% 8.7% 0.0% 1.1% 11.3% 10.4% 9.0% 2.6% -8.1% 3.3% 1.0% 2.6% 5.6%
M oderate 2.0% 26.5% 9.2% 27.4%-8.2%19.2% 9.9% 23.4%17.8% 8.6% 12.3% 8.3% -6.6% 2.3% 14.4% 14.5% 13.2% 3.8% -20.7 9.2% -0.4%-3.2% 5.2%
Aggressive -3.3%29.1% 6.9% 30.1% -8.2%19.7% 10.1% 23.1%18.3% 11.3% 8.9% 6.4% -10.8%4.9% 16.9% 17.7% 15.8% 5.8% -27.5%15.0% -0.3% -5.7% 4.6%
1990 1991 1992 1993 1994 1995 1996 1997 1998 1999200
02001
200
2
200
3
200
42005
200
62007
200
8
200
92010 2011 2012
Simulated historic annual returns
The chart shows the
performance of the chosen
asset allocations in each
calendar year.
Data as of 31/05/2012. Time horizon: 29/12/1989 - 31/05/2012
For illustrative purposes only. Markets are subject to change and returns may vary. See explanation under "Simulated Historical Performance" at the end of this document. Please
note that this page is always to be read in conjunction with the risk information and explanations of terms appended to this presentation.

55
Comparison of Portfolios
Generated by QIS
-30.0%
-25.0%
-20.0%
-15.0%
-10.0%
-5.0%
0.0%
5.0%
10.0%
15.0%
Re
turn
Conservat ive -2.7% -7.1% 1.7% 1.7% -0.4% 9.2% 1.3% -0.1% -1.5% -4.6% -5.7% 7.3%
M oderate -7.1% -7.3% -0.6% -1.0% -3.1% 6.0% -0.6% -5.6% -4.8% -8.5% -18.0% 0.7%
Aggressive -10.1% -7.7% -1.9% -3.4% -5.2% 2.1% -2.6% -9.7% -6.9% -11.0% -25.7% -3.3%
1st Gulf
War '90
Fed Hike
'94
Tequila
Crisis
'94/95
Asia Crisis
'97
Russian
Crisis '98
Tech
Bubble
'00/01
Sept 11 '01
Corp.
Scandals
'02
2nd Gulf
War '03
Sub Prime
'08
Credit
Crunch
'08/09
Euro Zone
Crisis
'11/12
1st Gulf War '90
Fed Hike '94
Tequila Crisis '94/95
Asia Crisis '97
Russian Crisis '98
Tech Bubble '00/01
Sept 11 '01
Corp. Scandals '02
2nd Gulf War '03
Sub Prime '08
Credit Crunch '08/09
Euro Zone Crisis '11/12
7/1990-9/1990
1/1994-5/1994
10/1994-2/1995
7/1997-10/1997
7/1998-9/1998
8/2000-3/2001
8/2001-9/2001
5/2002-9/2002
11/2002-3/2003
10/2007-1/2008
5/2008-2/2009
4/2011-5/2012
Simulated historic stress tests
The chart shows the impact
(gains and losses) of different
financial crises on the value of
the asset allocations.
Impact is shown in percentage
decrease in value.
Data as of 31/05/2012. Time horizon: 29/12/1989 - 31/05/2012
For illustrative purposes only. Markets are subject to change and returns may vary. See explanation under "Simulated Historical Performance" at the end of this document. Please
note that this page is always to be read in conjunction with the risk information and explanations of terms appended to this presentation.
56
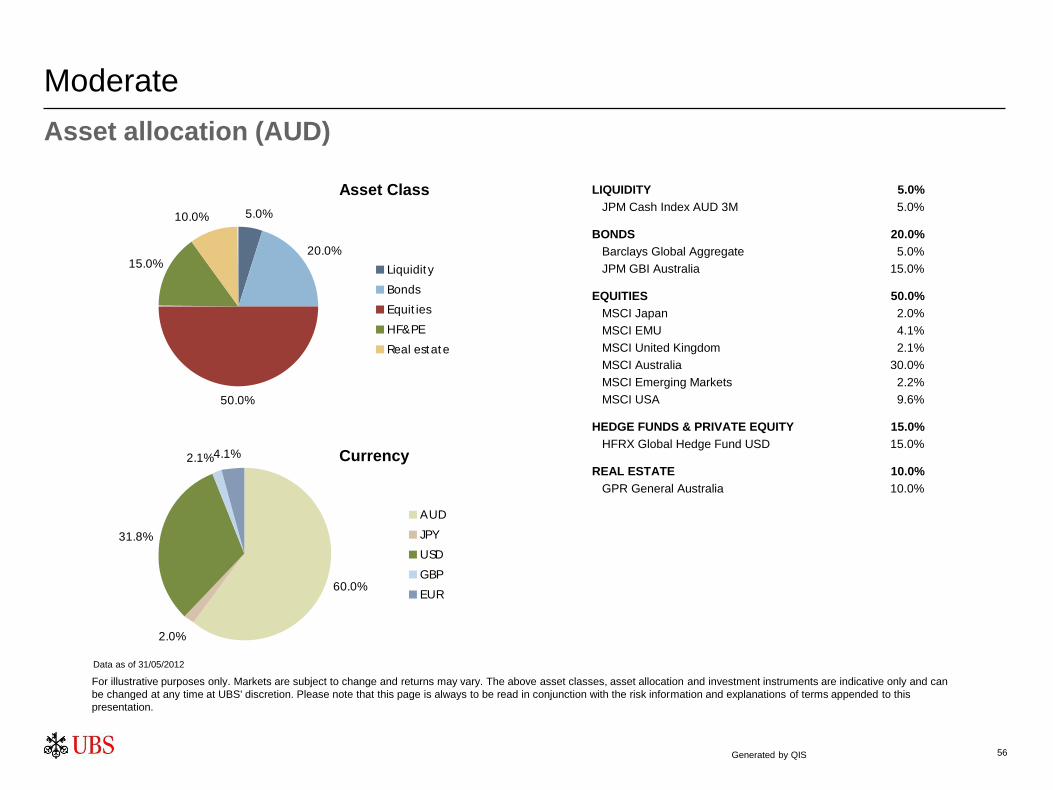
Moderate
Generated by QIS
10.0%
15.0%
50.0%
20.0%
5.0%
Liquidit y
Bonds
Equit ies
HF&PE
Real estate
Asset Class
4.1%2.1%
31.8%
2.0%
60.0%
AUD
JPY
USD
GBP
EUR
Currency
LIQUIDITY 5.0%
JPM Cash Index AUD 3M 5.0%
BONDS 20.0%
Barclays Global Aggregate 5.0%
JPM GBI Australia 15.0%
EQUITIES 50.0%
MSCI Japan 2.0%
MSCI EMU 4.1%
MSCI United Kingdom 2.1%
MSCI Australia 30.0%
MSCI Emerging Markets 2.2%
MSCI USA 9.6%
HEDGE FUNDS & PRIVATE EQUITY 15.0%
HFRX Global Hedge Fund USD 15.0%
REAL ESTATE 10.0%
GPR General Australia 10.0%
Asset allocation (AUD)
Data as of 31/05/2012
For illustrative purposes only. Markets are subject to change and returns may vary. The above asset classes, asset allocation and investment instruments are indicative only and can
be changed at any time at UBS' discretion. Please note that this page is always to be read in conjunction with the risk information and explanations of terms appended to this
presentation.

57
Moderate
Generated by QIS
0
100
200
300
400
500
600
700
1989 1991 1993 1995 1997 1999 2001 2003 2005 2007 2009 2011
AU
D
1st Gulf War '90 Fed Hike '94 Tequila Crisis '94/95
Asia Crisis '97 Russian Crisis '98 Tech Bubble '00/01
Sept 11 '01 Corp. Scandals '02 2nd Gulf War '03
Sub Prime '08 Credit Crunch '08/09 Euro Zone Crisis '11/12
History
1st Gulf War '90
Fed Hike '94
Tequila Crisis '94/95
Asia Crisis '97
Russian Crisis '98
Tech Bubble '00/01
Sept 11 '01
Corp. Scandals '02
2nd Gulf War '03
Sub Prime '08
Credit Crunch '08/09
Euro Zone Crisis '11/12
7/1990-9/1990
1/1994-5/1994
10/1994-2/1995
7/1997-10/1997
7/1998-9/1998
8/2000-3/2001
8/2001-9/2001
5/2002-9/2002
11/2002-3/2003
10/2007-1/2008
5/2008-2/2009
4/2011-5/2012
Simulated historical stress test
The chart shows the simulated
historical performance of the portfolio.
The time periods of the historical
financial crises are highlighted, to show
the impact of each crisis on the
portfolio.
Data as of 31/05/2012. Time horizon: 29/12/1989 - 31/05/2012
For illustrative purposes only. Markets are subject to change and returns may vary. See explanation under "Simulated Historical Performance" at the end of this document. Please
note that this page is always to be read in conjunction with the risk information and explanations of terms appended to this presentation.

SECTION 8
Behavioural Implications for Investors

59
Behavioral Finance – 7 Traps for Investors
Selective Perception: Ignoring information that contradicts our opinion
Herd Instinct: Doing what everybody else is doing
Overconfidence: Trading too much
Loss Aversion: Selling winners too soon and losers too late
Ignoring Lessons from the Past: "This time it is different"
Home Bias: Investing only in what we know
Lack of Diversification: Too concentrated portfolios

60
Remember: stay in the game—it never ever pays to panic
Maximum Financial Risk
Maximum Financial Opportunity Optimism
Optimism
Euphoria
Panic
Despondence
Hope Fear
Source: UBS
Behavioural Finance tells us emotions get in the way of wealth accumulation. What is getting in the way of
your wealth accumulation plan?

SECTION 9
Summary
62
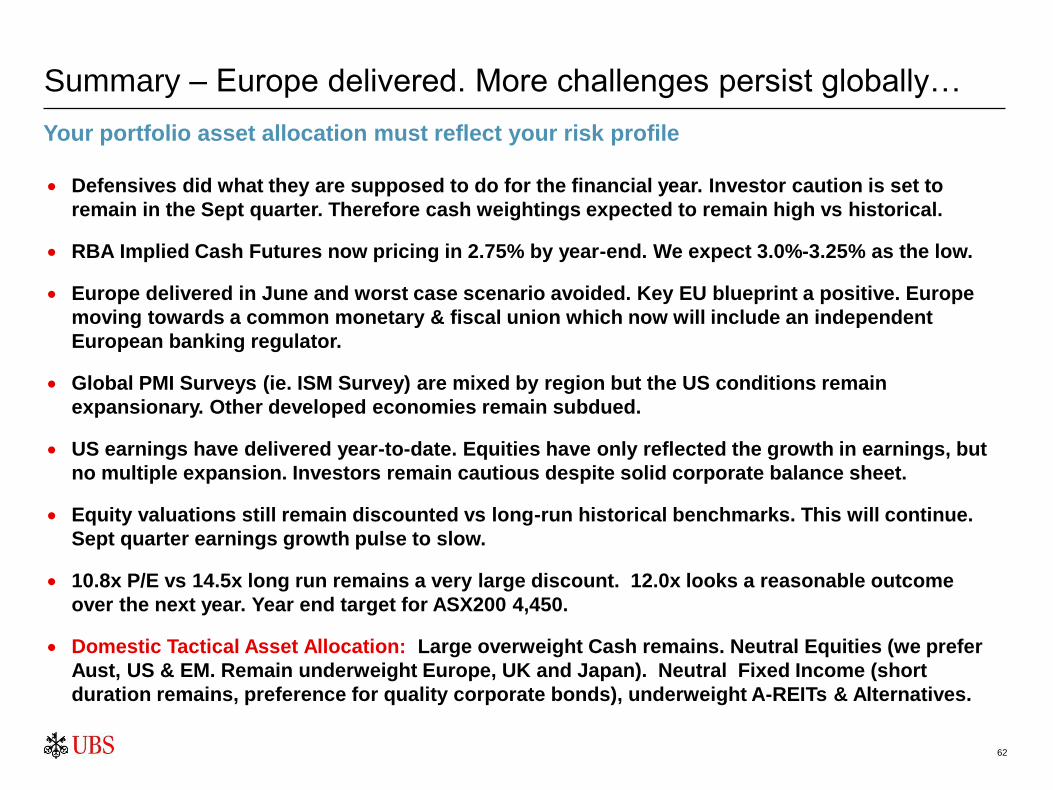
Summary – Europe delivered. More challenges persist globally…
Defensives did what they are supposed to do for the financial year. Investor caution is set to
remain in the Sept quarter. Therefore cash weightings expected to remain high vs historical.
RBA Implied Cash Futures now pricing in 2.75% by year-end. We expect 3.0%-3.25% as the low.
Europe delivered in June and worst case scenario avoided. Key EU blueprint a positive. Europe
moving towards a common monetary & fiscal union which now will include an independent
European banking regulator.
Global PMI Surveys (ie. ISM Survey) are mixed by region but the US conditions remain
expansionary. Other developed economies remain subdued.
US earnings have delivered year-to-date. Equities have only reflected the growth in earnings, but
no multiple expansion. Investors remain cautious despite solid corporate balance sheet.
Equity valuations still remain discounted vs long-run historical benchmarks. This will continue.
Sept quarter earnings growth pulse to slow.
10.8x P/E vs 14.5x long run remains a very large discount. 12.0x looks a reasonable outcome
over the next year. Year end target for ASX200 4,450.
Domestic Tactical Asset Allocation: Large overweight Cash remains. Neutral Equities (we prefer
Aust, US & EM. Remain underweight Europe, UK and Japan). Neutral Fixed Income (short
duration remains, preference for quality corporate bonds), underweight A-REITs & Alternatives.
Your portfolio asset allocation must reflect your risk profile
63

64
Contact information
George Boubouras
Executive Director
Head of Investment Strategy & Consulting
Tel: +61 (3) 9242 6747
Mobile: +61 (0) 411 285 577
E-mail: [email protected]
Important: This document has been prepared by UBS Wealth Management Australia Limited ABN 50 005 311937, holder of AFSL 231127, which is a subsidiary of UBS AG (together, "UBS").
This document contains general information and general advice only and does not constitute personal financial product advice. As such, the material does not take into account the personal
investment objectives, financial situation, tax position or particular needs of any specific recipient. Prior to any investment decision, we recommend that you seek personal investment advice
from your Client Advisor, based on your personal situation and consider the relevant offer document (including the product disclosure statement) before making any investment decision.
No representation or warranty, either express or implied, is provided in relation to the accuracy, completeness or reliability of the information contained herein, nor is it intended to be a complete
statement or summary of the securities, markets or developments referred to in the materials. It should not be regarded by recipients as a substitute for the exercise of their own judgement. Any
opinions expressed in this material are subject to change without notice and may differ or be contrary to opinions expressed by other business areas or divisions of UBS as a result of using
different assumptions and criteria. UBS, its directors, officers and employees' or clients may have or have had interests or long or short positions in the securities or other financial instruments
referred to herein and may at any time make purchases and/or sales in them as principal or agent. UBS may act or have acted as market-maker in the securities or other financial instruments
discussed in this material. Furthermore, UBS may have or have had a relationship with or may provide or has provided investment banking, capital markets and/or other financial services to the
relevant companies. Neither UBS nor any of its affiliates, nor any of UBS' or any of its affiliates, directors, employees or agents accepts any liability for any loss or damage arising out of the use
of all or any part of this material.
Options, derivative products and futures are not suitable for all investors, and trading in these instruments is considered risky. Past performance is not necessarily indicative of future results.
Foreign currency rates of exchange may adversely affect the value, price or income of any security or related instrument mentioned in this document. Before making an investment decision, you
should consider whether the information is appropriate in light of your particular investment needs, objectives and financial circumstances, and seek your own legal, regulatory, tax, financial and
accounting advice.
This material is for distribution only under such circumstances as may be permitted by applicable law. To the extent that UBS has sourced any material in this document from a third party, UBS
accepts no liability for the accuracy, currency or completeness of that material. All information is correct at the time of publication only and is subject to change without notice. UBS Wealth
Management Australia Limited, Registered Office: Level 16, Chifley Tower, 2 Chifley Square, Sydney NSW 2000.
© UBS 2012. All rights reserved. UBS specifically prohibits the redistribution of this material and accepts no liability whatsoever for the actions of third parties in this respect.

• Take a short online course
• Subscribe to the Investor Update e-newsletter
• Play the ASX Sharemarket Game
• Watch another ASX Investment talks presentation
KEEP LEARNING
VISIT www.asx.com.au/education