Embed Size (px)
Citation preview

UniCredit Group
Presentation to Fixed Income Investors
November 2012

2
Disclaimer
� This Presentation may contain written and oral “for ward-looking statements”, which includes all statem ents that do not relate solely to historical or current facts and which are therefore inherently uncertain. All forward-looking stateme nts rely on a number of assumptions, expectations, projections and provisional data conc erning future events and are subject to a number of uncertainties and other factors, many of which are outside the control of UniCredit S.p.A. (the “Company”). There are a variety of fact ors that may cause actual results and performance to be materially different from the explicit or implicit contents any forward-looking statements and thus, such forward-looking statements are not a reliable indicator of future performance. The Company undertakes no oblig ation to publicly update or revise any forward-looking statements, whether as a result of new information, future events or otherwise, ex cept as may be required by applicable law. The information and opinions contai ned in this Presentation are provided as at the dat e hereof and are subject to change without notice.
� The information, statements and opinions contained in this Presentation are for information purposes o nly and do not constitute a public offer under any applicable legislation or an offer to sell or solicitation of an offer to purch ase or subscribe for securities or financial instruments or any advice or recommendation with re spect to such securities or other financial instrume nts.
� Pursuant the consolidated law on financial intermed iation of 24 February 1998 (article 154-bis, paragr aph 2) Marina Natale, in her capacity as manager responsible for the preparation of the Company’s financial reports declares that t he accounting information contained in this Presentation reflects the UniCred it Group’s documented results, financial accounts a nd accounting records.
� None of the Company’s securities have been, nor wil l be, registered under the U.S. Securities Act of 1 933, as amended or the securities laws of any state or other jurisdiction of the Unit ed States or in Australia, Canada or Japan or any o ther jurisdiction where such an offer or solicitation would be unlawful (the “Other Count ries”), and there will be no public offer of any su ch securities in the United States. This Presentation does not constitute or form a part of any offer or solicitation to purchase or subscribe for securities in the United States or the Other Countries.
� Neither the Company nor any member of the UniCredit Group nor any of its or their respective represent atives, directors or employees accept any liability whatsoever in connection with this Presentation or any of its contents or in rela tion to any loss arising from its use or from any reliance placed upon it.
� The information in this document is confidential an d may not be disclosed to any other person without prior approval. This document has been prepared based upon information believed t o be reliable but does not make any representation o r warranty, express or implied, that it is accurate, complete or up to date or acce pts any liability, other than for fraudulent misrep resentation, if it is not.

3
Agenda
Introduction & Strategy
3Q 2012 Results
Liquidity & Funding
Annex

4
A clear international profile based on a strong Europe an identity
(1) Based on last available data at July 2012. Source: Sodali(*) It includes unidentified shares owned by the Group and cashes
Shareholders’ structure (1)
� Strong local roots in 22 European countries
� Over 157,000 employees
� About 9,400 branches
� One of the most important bank in Europe
with EUR 969 bln of total assets
� Part of the 28 global systemically
important banks (G-SIBs) worldwide.
European G-SIBs as of November 2012 in
the first 1%-bucket: BBVA, BPCE, Crédit
Agricole, ING, Nordea, Santander, Société
Générale, Standard Chartered, UniCredit
� Core Tier 1 Ratio at 10.67% under Basel
2.5 and 9.3% under Basel 3 fully loaded
UniCredit at a glance
EUR 7.5 bn capital increase in 2012
Strong response from all investor clusters:
� Stable shareholders, e.g. SWF, Foundations
� Institutional investors, e.g. Aabar
� Retail investors
3.4%
22.5%
38.2%
32.7%
3.2%
Retail
Domestic Institutional Investors
International Istitutional Investors
Stable shareholders
Other*

5
UniCredit is a well diversified pan-European Commercia l BankA unique positioning in mature Western European marketsand fast growing CEE economies
Germany (AAA rating)Rank & Market Share #3 with c. 3%Loans (bn) 130.6
Direct Funding (bn) 148.9
Italy (BBB+ rating)Rank & Market Share #2 with c. 13%
Loans (bn) 277.3Direct Funding (bn) 278.3
Rank & Market Share #1 with c. 7%
Loans (bn) 97.3
Direct Funding (bn) 91.7
Austria (AA+ rating)
Rank & Market Share #1 with c. 16%
Loans (bn) 63.0Direct Funding (bn) 67.9
Data as of Sept 2012, Market share calculated on Loans (as of December 2011), Ratings Standard &Poor’s
(1) Including Foreign subsidiaries consolidated in Italy (e.g. Leasing, Pioneer) and excluding Governance Functions
(2) Direct funding: customer deposits + securities in issue (customer & wholesale)
CEE Countries & Poland
RWA composition (%)
Total = 436.8 bn
26%
24%
Other
8%
CEE & Poland
Austria7%
Germany
Italy35%

6
Czech Rep., #4
Hungary, #7
Slovenia, #4
Croatia, #1
Slovakia, #5
Bosnia, #2
Baltics, #7- #10�200 employees�7 branches
Russia, #8�
�123 branches
Ukraine, #5�7,964 employees�506 branches
Romania, #6�2,967 employees�253 branches
Bulgaria, #1�3,835 employees�243 branches
Kazakhstan, #5�4,340employees�146 branches
Turkey, #6�16,441 employees�889 branches
’s Markets, #2
Serbia, #3
�914 employees�77 branches
Presence also in: Kyrgyzstan & Azerbaijan
Czech Rep., #4�1,959 employees�104 branches
Hungary, #7�1,866 employees�122 branches
Slovenia, #5�560 employees�35 branches
Croatia, #1�4,571 employees�141 branches
Slovakia, #5�1,165 employees�78 branches
Bosnia, #1�1,718 employees�134 branches
Baltics, #8 -#10�185 employees�8 branches
Russia, #8�3,700 employees�109 branches
Ukraine, #5�6,302 employees�379 branches
Romania, #6�2,822 employees�221 branches
Bulgaria, #1�3,810 employees�219 branches
Kazakhstan, #5�3,281employees�139 branches
Turkey, #5�17,485 employees�981 branches
Poland #2�19,231 employees�1,041 branches
8.7%
6.4%
25.4%
7.5%
20.6%
8.1%10.0%
8.5%
--1.5%1.7%
7.3%
4.3%
16.1%
10.0%
7.6%
CEE Region: market leading franchise with a full cov erage
� The leading player in the Region , #1 by assets and branches
� Strong revenue generation capabilities confirmed throughout the crisis and high contribution to UniCredit profitability (Revenues represents around 30% of the Group in the 3Q12)
# 1 Franchise in CEE
� ~87 bn depositsfrom customers
� ~ 3,800 branches
� ~70,000 employees
� Within top 5 in 11Countries
% Loans mkt share
Ranking, Employees and Branches by Country
Data as of September 2012, Market share calculated as of August 2012

77
UniCredit built on strong foundationsSuccessful consolidation domestically, in Western Europe and CEE as well
Selective GrowthConsolidation
Reorganization of the Group’s customer service model
(segmentation ) and the introduction of new
incentive systems
Integration of seven Italian banks, centralization of IT systems and back office activity, start of international
acquisitions
Continued expansion into international markets with
HVB and BA-CA, strengthening of domestic
markets with Capitalia
Privatization Federal Group S3
Central and Eastern Europe (CEE)
Pioneer Investments
19931993 19981998 20012001 20052005 20072007
CAPITALIAHVB, BA-CA
Turnaround
Asset Management
2009-112009-11
Strengthening
� Balance sheetde-leveraging and de-risking
� Merger of Italian subsidiaries(One4C)
� Capital strengthening

8
UniCredit vision 2015 …as part of the Strategic Plan presented in 2011
A rock solid European commercial bankStrengthened core client franchises with a unique geographical spread, focusedon diversified Western European countries and high growth CEE economies
Strong balance sheet A sound capital base, further reinforced liquidity buffer, continued access to diversifiedfunding sources
Operational efficiency A leaner customer centric operational structure benefiting from increased efficiencies,stringent cost management and simplified support and HQ functions
Commercial banking activities core A comprehensive product portfolio and added value services throughout the franchises,underpinned by increased cross selling
Sustainable returnsA robust business model with a low risk framework delivering sustainable profits anda return on equity above cost of capital

UniCredit Strategic Plan The implementation is well on track as proven by several successful actions in all four pillars
BALANCE SHEET
STRUCTURE
SIMPLIFICATION& COST
MANAGEMENT
Action/Event
BUSINESS REFOCUSING
Capital Increase
Capital Efficiency
CIB run-off portfolio and RWA management
Focus on highly attractiveCEE countries
On-going branchnetwork re-shaping in
Italy and FTE reduction
Strict cost control
ITALYTURNAROUND
Cost Reduction
Liquidity Improvement
Liquidity / Funding Gap
Proposed new business organisation
9
▲
Vs Plan/Expectation
=
▲
=
▲
=
▲
= / ▲
▲
=

10
Agenda
Introduction & Strategy
3Q 2012 Results
Liquidity & Funding
Annex

1111
Executive SummaryProfitability holding up despite a difficult macroeconomic environmentBalance sheet repositioning and effective cost management confirmed
� Net Profit recovering although still affected by di fficulties in European economies, mostly in Italy. Net Operating Profit held up well thanks to resilie nt revenues, strict cost control as well as slightl y lower provisions
�Overall resilient revenues, despite further decreasing interest rates, driven by CEE & Poland
�Effective cost management actions brought costs further down by 0.4% q/q and 3.7% y/y
�Loan Loss Provisions still at high level affected by a deteriorating macro environment in Italy
� Sound balance sheet with improved liquidity positio n and a strong capital base
�Funding gap further improving, with direct funding up (+1.1% q/q), notably in Italy, CEE and Austria
�2012 Group Funding plan completed (about 120% of Italian plan executed), implemented through high quality and diversified issuances
�Risk Weighted Assets down q/q driven by a sharp reduction in Credit and Market RWA
�Basel 2.5 Core Tier 1 ratio at 10.7%; Basel 3 fully-loaded CET1 ratio at 9.3% as at September 2012
� One year after the launch of the Strategic Plan all key actions are being implemented
12
847
9M12
1,418
517
901
9M11
-9,320
-10,167
Net Profit (mln) Net Operating Profit (1) (mln)
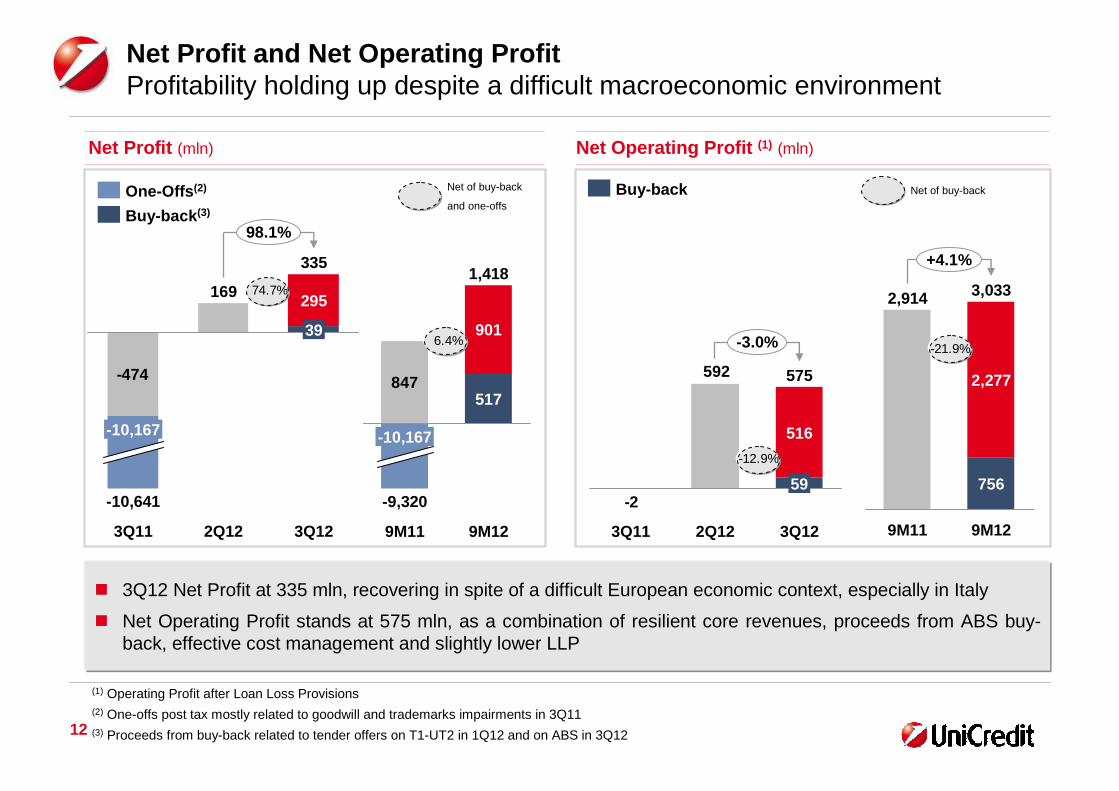
� 3Q12 Net Profit at 335 mln, recovering in spite of a difficult European economic context, especially in Italy
� Net Operating Profit stands at 575 mln, as a combination of resilient core revenues, proceeds from ABS buy-back, effective cost management and slightly lower LLP
Net Profit and Net Operating ProfitProfitability holding up despite a difficult macroeconomic environment
-2
592
-3.0%
3Q12
575
59
516
2Q123Q11
+4.1%
9M12
3,033
756
2,277
9M11
2,914
-474
169
98.1%
3Q12
335
39
295
2Q123Q11
-10,641
-10,167
(1) Operating Profit after Loan Loss Provisions(2) One-offs post tax mostly related to goodwill and trademarks impairments in 3Q11(3) Proceeds from buy-back related to tender offers on T1-UT2 in 1Q12 and on ABS in 3Q12
Buy-back
-21.9%
Net of buy-backNet of buy-back
and one-offs
-12.9%
Buy-back (3)
One-Offs (2)
74.7%
6.4%

-3.894 -3.764 -3.748
-1.844 -1.910 -1.811
5,737
3Q12
59
6,075
2Q12
6,266
3Q11
13
9M12
756
18,761
-5,119
-11,365
9M11
19,143
-4,522
-11,707
-633
-148
576
3Q12
575
59
664
2Q12
59217
3Q11
-2
631
Net Operating Profit Composition (mln)
Net Operating Profit Breakdown Effective cost management and resilient core revenues underpin resultsDeteriorating credit environment resulting in high levels of LLP
� Overall resilient core revenues despite adverse macroeconomic environment
� CEE & Poland actively support the underlying Group profitability
� Effective cost management
� LLP still high mirroring a deteriorating credit environment
Net Operating Profit by region (mln)
LLP
Costs
Revenues
NOP
475
9M12
3,033
1,802
756
9M11
2,914
1,775
1,138
Net of buy-back Net of buy-back
-0.4%
Buy-back (1)
-2.9%
+13.2%
-2%
3,0332,914575592-2
n.m.
+15%
-58.3%
+1.5%-3.1%
-5.2%
CEE & Poland
Buy-back
Western Europe
(1) Proceeds from buy-back related to tender offers on T1-UT2 in 1Q12 and on ABS in 3Q12
14
Loan Loss Provisions (mln) – Group COR (bps) Cost of Risk (bps)
140114146 146139
165133119132
CEEF&SMECIB
3Q122Q123Q11
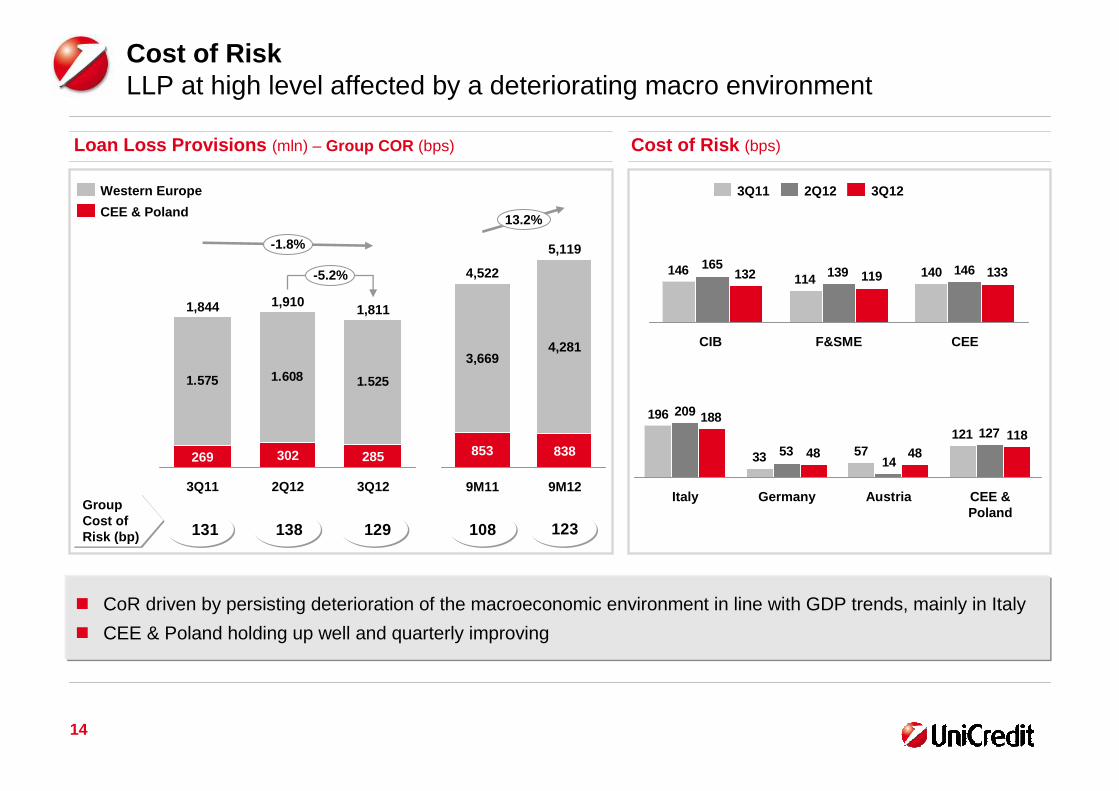
� CoR driven by persisting deterioration of the macroeconomic environment in line with GDP trends, mainly in Italy
� CEE & Poland holding up well and quarterly improving
Cost of RiskLLP at high level affected by a deteriorating macro environment
Group Cost of Risk (bp)
1.575 1.608 1.525
-1.8%
-5.2%
3Q12
1,811
285
2Q12
1,910
302
3Q11
1,844
269
CEE & Poland
Western Europe
1215733
196127
1453
209
1184848
188
CEE &Poland
AustriaGermanyItaly
13.2%
9M12
5,119
838
4,281
9M11
4,522
853
3,669
131 138 129 108 123

15
Gross Impaired Loans (bn)
+3.5%
Sept. 12
80.4
Jun. 12
77.7
Sept. 11
71.6
NPLs (bn)
Other Impaired Loans (bn)
Asset QualityStock grew mainly driven by Past Due loans inflows which explain most of the decline in coverage ratio (mix effect)
Net impaired loans ratio
Coverage ratio
+1.8%
Sept. 12
45.6
Jun. 12
44.8
Sept. 11
42.1
Coverage ratio
+5.7%
Sept. 12
34.8
Jun. 12
32.9
Sept. 11
29.6
Coverage ratio
8.1%7.8%6.9%
43.1%43.8%45.5%
55.7%56.5%58.3%
26.5%26.5%27.3%

16
Securities in issue (bn)
Balance Sheet structureSecurities in issue up, with customers representing the bulk
� Securities in issue up, with customers representing about 46% of the total securities placed by the Group
� Net interbank position(3) improved by 21.2 bn, mainly thanks to a switch from o/n Deposits in “Cash and Cash Balances” to Compulsory Reserve in “Loans to Banks”
� ECB gross funding represents 27.6 bn, o.w. 26 bn 3Y LTRO
� Financial Investments up, mostly driven by AFS portfolio
Financial investments (2) (bn)Net Interbank Position (bn)
62 66 73
89
+2.5 bn
Customers
Wholesale
Sept 12
165
76
Jun 12
163
90
Dec 11
163
97
Sept 11
167
105
102,399,599,496,9
+2.7 bn
Sept 12Jun 12Dec 11Sept 11
(1) Overnight deposits with Central Banks includes all overnight deposits with Central Banks as of Jun 30, while it is referred only to Central Banks with no compulsory reserve requirements as of Sept ‘12. Accounting data for Sept 11 and Jun ‘12, Managerial figures for Sept 12
(2) Financial Investments include AFS, HtM, Fair Value portfolios(3) Loans to banks – deposits from banks
-40,5
-61,7-67,0
Sept 12Jun 12Sept 11
Including Overnight deposits with Central Banks (1)
-65.2
-34.1-39.3

17
313.027 333.743 334.015
+7.1%
+0.7%
CEE &Poland
Western Europe
3Q12
420,370
86,355
2Q12
417,641
83,898
3Q11
392,517
79,490
474.076 460.926 464.601
-0.1%
+0.9%
CEE &Poland
Western Europe
3Q12
561,875
97,274
2Q12
556,815
95,889
3Q11
562,447
88,370
Customer loans (mln)
VolumesDirect Funding steadily increase
+97.4%
+-200%
� Direct Funding(1) up to 496.3 bn in the quarter (+1.1% q/q), mostly from business divisions with strong contribution from CEE, Italy and Austria
� Loans up due to market counterparties(2), while Western Europe continued to record weak commercial loan demand in particular in Italy and Germany
Customer deposits (mln)
(1) Direct funding: customer deposits + customer securities in issue (excl. wholesale)
(2) Market counterparties include mostly Clearing Houses like Cassa Compensazione e Garanzia, Euroclear, Clearstream
+0.8%
+1.4%
+0.1%
+2.9%
Customer securities, bn 62.0 73.1 75.9
Direct Funding, bn 454.5 490.7 496.3
+1.1%

18
-2.5%
Floor
Credit
Market
436.8
365.3
19.1
Operat.52.4
Jun 12
447.7
371.7
23.7
52.4
Sept 11
450.0
4.5
383.0
11.6
50.8
Sept 12
RWA, eop (bln)
(1)
Capital position (1/2)Sizeable RWA reduction offsetting the regulatory impact of CRD3
Credit RWAs / Loans
� RWA declined mainly driven by Credit and Market RWA, thanks to the on-going optimization of CIB allocated capital
(1) Bank of Italy requires that RWA calculated under the BIS 2 framework cannot exceed a certain percentage of the same RWA calculated under the previous BIS 1 framework (“the floor”)
68.1% 66.8% 65.0%
0%
-19.4%
-1.7%
Bis 2 Bis 2.5 Bis 2.5
RWA by risk category, bn
Dec. 11
-12.4
-12.2
CreditRWA
460.4
440.5
19.9
OperationalRWA
MarketRWA
+0.9 436.8
Sept 12
CRD3 impact
� Sizeable reduction in RWA (-5.1% since December 2011) fully offsetting the impact of CRD3 (‘Basel 2.5’)
� CIB de-leveraging and RWA optimization lead to decrease year-to-date including the impact of CRD3

19
Capital position (2/2) UniCredit confirms its capital strength: CT1 at 10.67% under BIS 2.5, at 9.86% under EBA rules
� UniCredit’s capital strength confirmed
� Core Tier 1 at 10.67% under BIS 2.5, at 9.86% at June 2012 under EBA rules -well above the required levels
� Basel 3 Common Equity Tier 1 fullyloaded with 9.3% above the 2012 9.1% previous guidance
� Sound Total Capital Ratio (TCR) at 13.83%
� It is UniCredit’s intention to keep a strong TCR position
� The recent 1.25 bn Lower Tier II issuance supports this. Demand wasvery strong with c. 4.4 bn from around360 accounts involved
Core Tier I
Tier I
Total Capital
Sept 12
10.67%
11.26%
13.83%
Jun 12
10.39%
10.94%
13.50%
Sept 11
8.74%
9.68%
12.80%
Capital Ratios
Bis 2 Bis 2.5 Bis 2.5
+28bp
20
Agenda
3Q 2012 Results
Liquidity & Funding
Annex
Introduction & Strategy
21
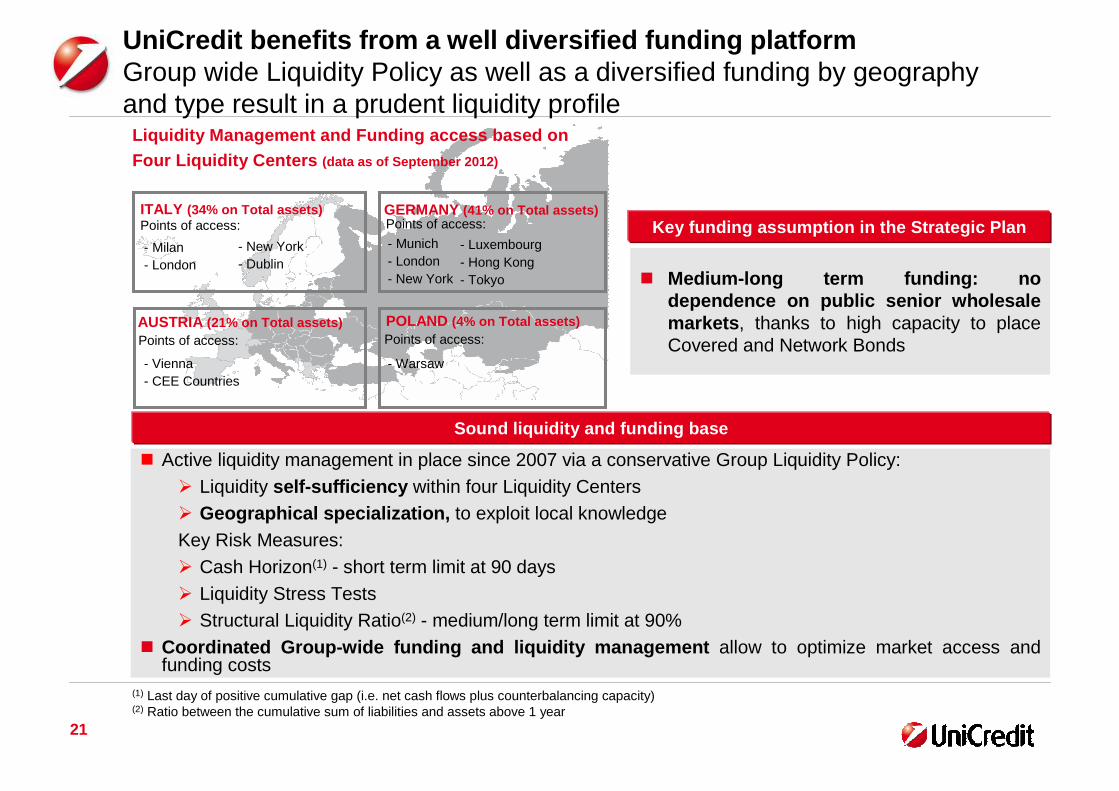
� Medium-long term funding: no dependence on public senior wholesale markets , thanks to high capacity to place Covered and Network Bonds
Sound liquidity and funding base
UniCredit benefits from a well diversified funding pla tform Group wide Liquidity Policy as well as a diversified funding by geography and type result in a prudent liquidity profile
POLAND (4% on Total assets)
- Luxembourg- Hong Kong - Tokyo
ITALY (34% on Total assets)
AUSTRIA (21% on Total assets)
Points of access:
- Milan - London
- Munich- London- New York
- Vienna- CEE Countries
- Warsaw
- New York - Dublin
Liquidity Management and Funding access based on Four Liquidity Centers (data as of September 2012)
Points of access:
Points of access: Points of access:
Key funding assumption in the Strategic PlanGERMANY (41% on Total assets)
(1) Last day of positive cumulative gap (i.e. net cash flows plus counterbalancing capacity)(2) Ratio between the cumulative sum of liabilities and assets above 1 year
� Active liquidity management in place since 2007 via a conservative Group Liquidity Policy:� Liquidity self-sufficiency within four Liquidity Centers � Geographical specialization, to exploit local knowledge Key Risk Measures:� Cash Horizon(1) - short term limit at 90 days � Liquidity Stress Tests� Structural Liquidity Ratio(2) - medium/long term limit at 90%
� Coordinated Group-wide funding and liquidity manage ment allow to optimize market access and funding costs

2222
14%
Italy
70%
Austria
16%
Germany
Funding Mix % of MLT funding run-offs by Region (1)
9%
11%29%
7%
8%
2012 (realized)
31 bn
37%
12%
9%
6%
2012 (planned)
31 bn
2011
42 bn
36%
29%
7%
(1) Run-offs refer only to UCG securities placed on external market. InterCompany are not included (2) The Network Bonds have been reclassified according to a definition based upon their origination (i.e. bonds originated through
the Network only)
Public Sec. & Mort. CBs
Supranational Funding
Priv. Place. & Schuld.
Bank Cap. Bonds
Public Market and Wholesale MLT
Group Retail Network
Medium-Long Term Funding Plan2012 Funding Plan implemented through high quality and diversified issuances
Austria
Germany
Italy
2014
24.9
16%
31%
53%
2013
28.2
18%
33%
49%
4Q12
8.0
14%26%
60%
9M12
30.0
12%
28%
60%
% MLT Network Bonds run-offs (2)
24% 22% 32%
� As of today, medium-long term funding plan of 2012 realized
� Despite Sovereign tensions, about 120% of Italy’s funding plan executed
� Building on this strong position, the Group will continue to take advantage of any po tential opportunities to access the funding market
� Network bonds still represent only about 7.2% of cu stomer’s TFA , providing room for further securities placement
23%

79.8%72.6%
66.2%58.9%58.5%56.4%
46.5%40.4%
Peer 7Peer 6Peer 5Peer 4Peer 3Peer 2Peer 1UCGItaly
(1) Italian Peers: Intesa Sanpaolo, MPS, UBI, Banco Popolare, Carige, BPM, BPER
Network bonds Dec 11, % of TFA (1) Retail MLT Funding as % of Total Securities, Dec 11
� Still ample capacity to issue network bonds due to limited penetration of Group network clients (9.1% of TFA for UCG Italy)
� UniCredit relies less on network bonds than main Italian peers allowing for considerable additional capacity due to a significant untapped potential
� As of Sept. 2012, total Group Network bonds outstanding are 59.8 bn
Strong and stable retail and private banking customer f unding…with a still ample untapped capacity
22.0%
18.0%17.1%16.8%16.3%
12.8%10.7%
9.1%
Peer 7Peer 6Peer 5Peer 4Peer 3Peer 2Peer 1UCGItaly
23

24
Liquidity buffer (1) (12 months), as of Sept ‘12, bn
Liquidity Sound position: 1Y Liquidity buffer exceeds 12m wholesale funding
Unencumbered assets(immediately available)
Cash and Deposits with Central Banks
Additional eligible assetsavailable within 12 months
Liquidity buffer (12M)
89.3
42.3
30.4
� Liquid assets immediately available amount to 131.6 bn net of haircut and well above 100% of wholesale funding maturing in 1 year
(1) Unencumbered assets are represented by all the assets immediately available to be used with Central Banks; Additional eligible assets (available within 12 months) consist of all the other assets eligible within 1 year time (by the end of Sept 2013)
131.6
162

25
UniCredit has continuous wholesale market accessStrong debt market franchise confirmed
� During the financial crisis UniCredit has maintained a highly diversified and continuous wholesale acces s to the market
� Latest issuances in the Aug-Oct period, all with strong demand from investors, include: 750 mln OBG , thentapped to 1 bn ; 1 bn of 3Y Senior bond, then tapped to 1.35 bn; two CHF deals, 150 mln 10Y and 185 mln5Y Senior bond; 1.25 bn 10Y LT2
Oct DecNov FebJan Mar Apr May Jun
5y Pfand(500)
5y Sen(500 USD)
Jul Aug
5y Sen (1.500)
Sep Oct
7y Pfand(500)
UniCredit has a constant market access even in a di fficult environment
3y Sen (10 blnRUB)
5.5y OBG
(1.000)
3y Sen (1.350)
10y Pfand(500)
10y Sen (150 CHF)
5y Sen (185 CHF)
10y LTII (1.250)
3y Sen (10 blnRUB)

26
Agenda
3Q 2012 Results
Liquidity & Funding
Annex
Introduction & Strategy

GROUP P&L
27
Q3 Q2 Q1 Q4 Q3 Q2 Q1 9M 9M Var. %
(mln Euro) 2012 2012 2012 2011 2011 2011 2011 q/q y/y 2012 2011 y/y0 0
Net interest 3,594 3,690 3,790 3,817 3,827 3,900 3,880 -2.6% -6.1% 11,073 11,607 -4.6%
Dividends and other income from equity investments 68 169 54 47 91 126 117 -59.9% -25.4% 291 333 -12.8%
Net fees and commissions 1,932 1,946 1,997 1,989 1,948 2,042 2,118 -0.7% -0.8% 5,876 6,109 -3.8%
Net trading, hedging and fair value income 449 407 1,232 255 -229 344 750 +10.3% n.m. 2,088 864 +141.6%
Net other expenses/income 92 55 43 4 100 55 75 +66.9% -8.8% 189 229 -17.4%
OPERATING INCOME 6,134 6,266 7,117 6,110 5,737 6,467 6,939 -2.1% +6.9% 19,517 19,143 +2.0%
Payroll costs -2,253 -2,271 -2,309 -2,177 -2,357 -2,342 -2,333 -0.8% -4.4% -6,833 -7,032 -2.8%
Other administrative expenses -1,337 -1,369 -1,389 -1,505 -1,406 -1,433 -1,360 -2.3% -4.9% -4,095 -4,199 -2.5%
Recovery of expenses 109 135 109 164 143 113 104 -19.8% -24.2% 353 361 -2.0%
Amortisation & depreciation -267 -260 -263 -298 -275 -279 -284 +2.5% -2.8% -790 -838 -5.7%
Operating costs -3,748 -3,764 -3,852 -3,816 -3,894 -3,940 -3,873 -0.4% -3.7% -11,365 -11,707 -2.9%
OPERATING PROFIT 2,385 2,502 3,265 2,295 1,842 2,527 3,066 -4.7% +29.5% 8,153 7,436 +9.6%
Net write-downs of loans -1,811 -1,910 -1,398 -1,493 -1,844 -1,178 -1,500 -5.2% -1.8% -5,119 -4,522 +13.2%
NET OPERATING PROFIT 575 592 1,867 801 -2 1,349 1,566 -3.0% n.m. 3,033 2,914 +4.1%
Provisions for risks and charges -46 -61 -16 -48 -266 -244 -161 -24.0% -82.6% -122 -671 -81.8%
Integration costs -4 -15 -5 -90 -174 -3 -3 -73.6% -97.7% -24 -180 -86.6%
Net income from investments 232 81 29 -123 -612 -15 84 n.m. n.m. 342 -543 n.m.
PROFIT BEFORE TAX 756 598 1,875 541 -1,054 1,087 1,486 +26.5% n.m. 3,229 1,519 +112.5%
Income tax for the period -190 -252 -746 -248 -149 -463 -555 -24.6% +27.4% -1,188 -1,167 +1.8%
Profit (Loss) from non-current assets held for sale, after tax 0 0 0 0 0 0 0 n.m. n.m. 0 0 n.m.
PROFIT (LOSS) FOR THE PERIOD 567 346 1,129 292 -1,203 624 932 +63.7% n.m. 2,042 352 n.m.
Minorities -119 -68 -98 -78 -81 -99 -107 +74.7% +46.8% -286 -287 -0.3%
NET PROFIT ATTRIBUTABLE TO THE GROUP BEFORE PPA 447 278 1,031 214 -1,284 525 825 +61.0% n.m. 1,756 66 n.m.
Purchase Price Allocation effect -107 -106 -117 -92 -687 -14 -15 +0.4% -84.5% -330 -716 -53.9%
Goodwill impairment -6 -2 0 -8 -8,669 0 0 +136.8% -99.9% -8 -8,669 n.m.
NET PROFIT ATTRIBUTABLE TO THE GROUP 335 169 914 114 -10 ,641 511 810 +98.1% n.m. 1,418 -9,320 n.m.
Var. %

GROUP BALANCE SHEET
28
September June March December September June March Decembe r Var.
(mln Euro) 2012 2012 2012 2011 2011 2011 2011 2010 y/y %
Cash and cash balances 6,160 31,477 19,669 9,728 5,566 6,596 5,982 6,414 +10.7%
Financial assets held for trading 128,825 126,175 119,109 130,985 140,008 107,203 106,400 122,551 -8.0%
Loans and receivables with banks 91,349 65,463 65,033 56,365 72,474 71,544 67,319 70,215 +26.0%
Loans and receivables with customers 561,875 556,815 553,658 559,553 562,447 561,792 558,825 555,653 -0.1%
Financial investments 102,294 99,550 103,337 99,364 96,886 97,352 96,373 96,148 +5.6%
Hedging instruments 24,558 21,948 19,537 18,069 18,626 10,718 9,828 13,616 +31.8%
Property, plant and equipment 11,846 11,947 12,214 12,198 12,288 12,345 12,629 12,611 -3.6%
Goodwill 11,691 11,665 11,664 11,567 11,529 20,244 20,293 20,428 +1.4%
Other intangible assets 4,057 4,081 4,056 4,118 4,034 5,007 5,061 5,164 +0.6%
Tax assets 13,306 13,626 13,649 14,346 13,519 12,329 12,797 12,961 -1.6%
Non-current assets and disposal groups classified as held for sale 357 316 329 345 376 798 726 776 -4.9%
Other assets 12,834 11,886 10,808 10,130 12,544 12,845 14,744 12,949 +2.3%
Total assets 969,152 954,950 933,063 926,769 950,296 918,772 910,977 929,488 +2.0%
September June March December September June March Decembe r Var.
(mln Euro) 2012 2012 2012 2011 2011 2011 2011 2010 y/y %
Deposits from banks 131,825 127,122 124,876 131,807 139,476 115,688 112,908 111,735 -5.5%
Deposits from customers and debt securities in issue 585,695 580,427 570,472 561,370 559,230 585,936 582,369 583,239 +4.7%
Financial liabilities held for trading 125,548 122,767 117,050 123,286 137,734 98,035 97,016 114,099 -8.8%
Financial liabilities designated at fair value 842 787 857 786 912 1,065 1,156 1,268 -7.8%
Hedging instruments 22,562 20,641 18,307 18,050 17,265 10,040 8,447 12,479 +30.7%
Provisions for risks and charges 8,180 8,241 8,370 8,496 8,615 8,252 8,156 8,088 -5.0%
Tax liabilities 6,224 6,217 6,465 6,210 5,873 5,356 5,821 5,837 +6.0%
Liabilities included in disposal groups classified as held for sale 42 96 107 252 260 976 761 1,395 -83.8%
Other liabilities 22,069 24,175 21,152 21,715 25,367 25,302 26,153 23,645 -13.0%
Minorities 3,608 3,445 3,542 3,318 3,271 3,397 3,502 3,479 +10.3%
Shareholders' equity 62,557 61,031 61,865 51,479 52,292 64,726 64,686 64,224 +19.6%
- Capital and reserves 61,178 60,982 61,115 62,417 62,621 63,384 64,259 63,237 -2.3%
- Availab le-for-sale assets fair value reserve and
cash-flow hedging reserve -39 -1,034 -164 -1,731 -1,008 20 -384 -336 -96.1%
- Net profit 1,418 1,083 914 -9,206 -9,320 1,321 810 1,323 n.m.
Total liabilities and shareholders' equity 969,152 95 4,950 933,063 926,769 950,296 918,772 910,977 929,488 +2.0%

29
UniCredit Ratings OverviewUniCredit’s excellent diversification is a key rating strength, but the tough operating environment and Eurozone sovereign crisisare key concerns – UC SpA is somehow constrained by Italy’s ratings, but German and Austrian subsidiaries are rated higher
Ratings
LT/ST
Outlook
Stand-alone
Lower Tier II
Upper Tier II
Tier I
Italy
Baa2/P-2
Neg
Baa2
Baa3
Ba1
Ba2
Baa2
� Key drivers: operating environment and Eurozone crisis , weakprofitability and asset quality, restricted market funding access
� Moody's views our "...well diversified activities both by business line and geography ” as a key rating strength
� UC SpA downgraded twice as part of a broader European review (14th May ) and following Italy’s downgrade to ‘Baa2’ (from ‘A3’) on the 13th July
� Key drivers: Eurozone financial debt crisis and execution risk of strategicplan
� Fitch highlights that “the group’s geographically diverse presence is beneficial for its access to funding and revenue diversification”
� Despite Italy’s downgrade to A-/F2 from A+/F1 (27th Jan), Fitch confirmedUC SpA’s rating of A-/F2
Comments
LT/ST
Outlook
Stand-alone
Lower Tier II
Upper Tier II
Tier I
Italy
A-/F2
Neg
a-
BBB+
BBB-
BB+
A-
� Key drivers: sovereign risk and economic & banking industryconditions plus asset quality and profitability
� S&P states: “Diversification is significantly helping to limit deterioration in profitability and asset quality at group level”
� The UC SpA rating is capped at Italy’s BBB+/A2 due to S&P’s methodology
� As a particular case among European banks, SP’s rates the “core “subsidiaries UC Bank AG and UC Bank Austria at the higher A/A1
LT/ST
Outlook
Stand-alone
Lower Tier II
Upper Tier II
Tier I
Italy
BBB+/A-2
Neg
bbb+
BBB
BBB-
BB+
BBB+

3030
Italy’s Macro Picture 1/3Despite negative GDP growth, Deficit and Debt to GDP ratios under control
� Third largest economy in the Euro-zone; no housing sector bubble burst
� Deficit/GDP ratio is under control : 2011 stood at -3.8%, lower than the Euro-zone (4.1%)(1); 2012E improving at -2.7%, 2013E further shrinking at -1.8%(1)
� Primary budget surplus at 0.8% (see slide 37), expected to grow significantly in next years (at 2.6% and 3.6% in 2012 and 2013 respectively)(1)
� Debt/GDP ratio has been stabilizing : despite negative GDP growth, the Debt/GDP ratio isexpected to peak at 123.3% both in 2012 and 2013 (2)
� However, non-financial private sector debt at 135% of GDP is much below the Euro-zone average of 170% (see slide 37)
� Low foreign debt : ~60% of Italian sovereign bonds held by domestic investors(3)
� Households’ low indebtedness goes along with large financial wealth: net financial wealth over GDP at 165% is higher than European peers(4) (see slide 38)
� Deposit Growth: banks’ deposits in Italy from private customers advanced in August by 3.9% yoy (5)
(1) Source: IMF WEO Oct ’12(2) Source: MEF; data are adjusted to take into account Italian State contribution to European Stabilization Funds(3) Source: Brugel data as of March ‘12(4) Household net financial wealth defined as financial wealth minus liabilities, source: ECB, ‘Euro Area Accounts’ 2011YE(5) Bank of Italy’s data

31
Italy’s Macro Picture 2/3Italian total indebtedness is much lower than Spain’s and in line with Austria and France, yet with a sounder primary balance
336
250217
135 162 140 137170
293
118
253 248
9786
237
93
Spain
77
Ireland
440
104
Euro AreaAustriaPortugal
359
France
109
Italy
263
Germany
81
217
Non Financial Private
Public
Deb
t / G
DP
(%
)(1)
(1)Debt (loans, debt securities and pension fund reserves), source: ECB, ‘Euro Area Accounts’ 2011YE; for GDP data & German Public debt only source: IMF WEO 2011YE
(2)General government primary net lending/borrowing (source: WEO 2011YE)
-1.5
0.9
-2.7-0.4
0.8
-7.0
-0.6
-9.6Prim
ary
bala
nce
/ G
DP
(%
)(2)

32
30 40 50 60 70 80 90 100 110 120 130 140 150
NF
C d
ebt (
1) /
GD
P
240
220
200
180
160
140
120
100
80
60
40
Household debt (1) / GDP
GermanyFrance
Italy
Austria
Spain
Portugal
Ireland
(1)Debt (loans, debt securities and pension fund reserves), source: ECB, ‘Euro Area Accounts’ 2011YE(2)Household net financial wealth defined as financial wealth minus liabilities, source: ECB, ‘Euro Area Accounts’ 2011YE
Italy’s Macro Picture 3/3Italian private sector debt is low when compared to EU peers
� Italian private sector debt with respect to GDP is unimpressive, with the household sector among the least indebted among peers
� Italian households’ low indebtedness goes along with large financial wealth to show conservative behaviour (“a buffer for hard times”)
114
74
70
122
122
135
165
Ireland
Spain
Austria
Germany
Portugal
France
Italy
Household net financial wealth(2)/ GDP (%)