Embed Size (px)
Citation preview
A-19995 GE ILAAL ELECYTRICCCOZA CIN4C INAT1 ON AIRCRAFT ENGINE BU--ETC F/0 11/6MATERIAL CmAACTEI IIITO0. PART A- MECMANZCAL PROPERTIES OF TWO-ETC113MAY 82 S A EMERY F33615-7?-C-5221
UCASSIFIED tuuR-Ta-7q-g9A AFVAL-T1S.SZ-1O42-VOL-1 NL
*,alumu oil.11-I'.*MENNENflflflflK
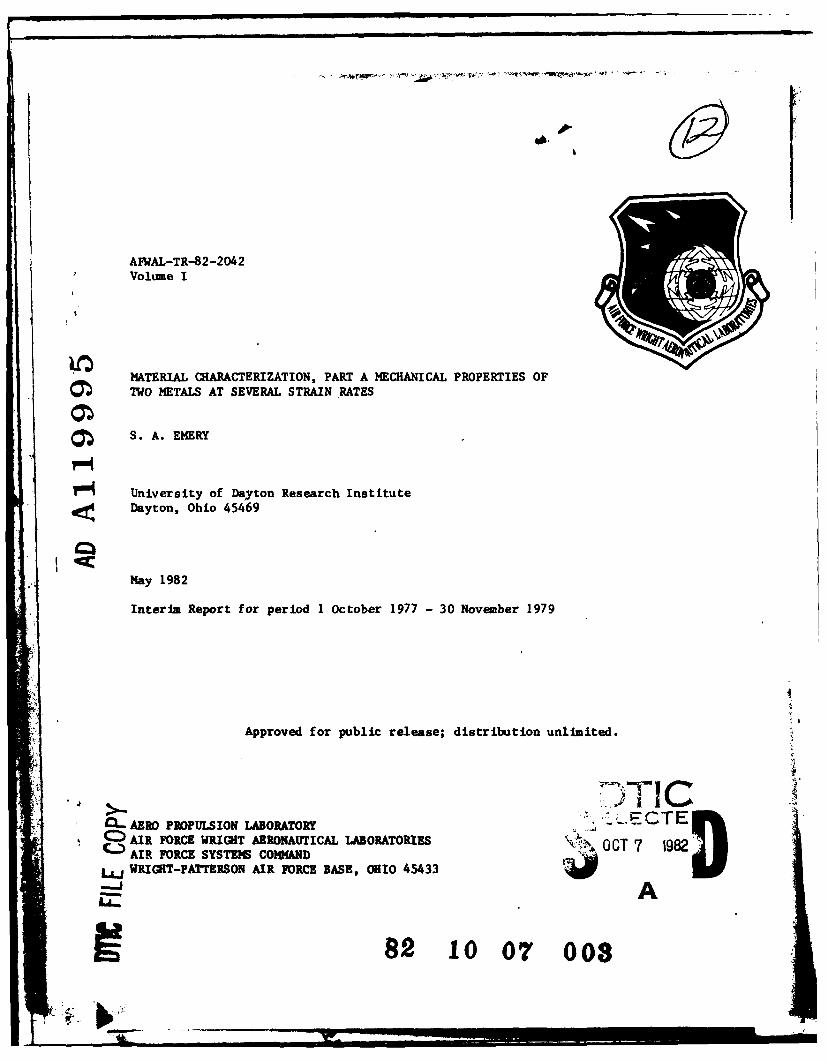
APWAL-TR-82-2042
Volume I
MATERIAL CHARACTERIZATION, PART A MECHANICAL PROPERTIES OFTWO METALS AT SEVERAL STRAIN RATES
O S. A. EMERY
University of Dayton Research InstituteDayton, Ohio 45469
May 1982
Interim Report for period I October 1977 - 30 November 1979
Approved for public release; distribution unlimited.
Q.L AERO PROPULSION LAOATR -ETCAIR FORCE WRIGHT AERONAUTICAL LABORATOES A OCT 7 1982AIR FORCE SYSTEM COMMAND
Lpj WRIGHT-PATTERSON AIR FORCE BASE, OHIO 45433
82 1A
82 10 07 0 03"
N&IXCE
When Government drawings, specifications, or other data are used for anypurpooe" other than in connection with a definitely related Government procure-mnnt operation, the United States Governm Lnt thereby incurs no responsibilitynor any obligation whatsoever; and the fact that the government may have formu-lated, furnished, or in any way supplied the said drawings, specifications, orother data, is not to be regarded b y i,pZication or otherwise as in any mannerlicensing the holder or any other percn or corporation, or conveying any rightsor permission to manufacture, uce, or sell any patented invention that may inany way be related thereto.
This report has been reviewed by the Office of Public Affairs (ASD/PA) andis reZeasable to the NationaZ Technical Information Service (NTIS). At 1T47S, itwill be available to the general public, including foreign nations.
This technical report has been reviewed and is approved for pubZicatio, .
SANDRA K. DRAKE ISAK J."GERSHONProject Engineer Technical Area Manager,
Propulsion Mechanical Design
FOR THE COMANDER
J. NI PMAN, MAJ, USAFDeputy Director, Turbine Engine Division
"Zf your address has changed, if You wish to be removed from our mailing list,or if the addressee in no longer rployed by your organization, please notifyA WPAPB 011 45433 to Welp us maintain a ourcnt mailing list."
Copies of this report should not be returnd 10Zsco return in required by ocurityoosidcrations, oontractual obtigationn, or notioe on a opccifio doawnent.
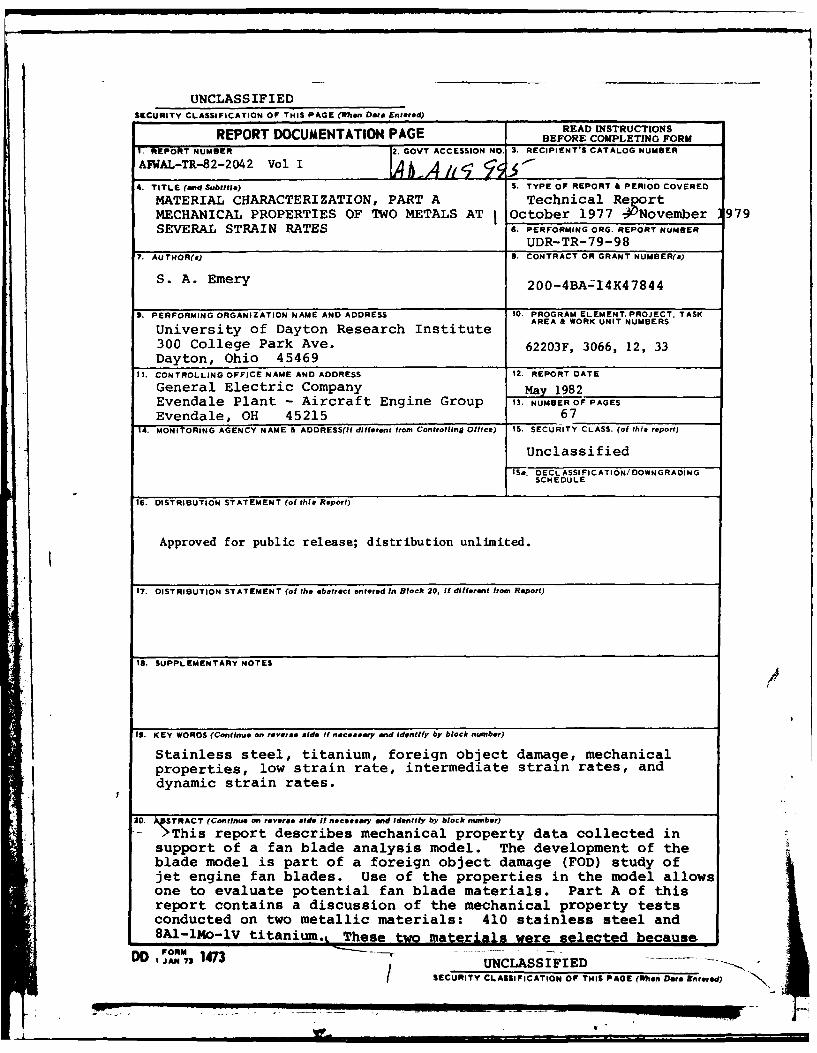
UNCLASSIFIEDSECURITY CLASSIFICATION OF THIS PAGE (ohen Date Entered)
READ INSTRUCTIONSREPORT DOCUMENTATION PAGE BEFORE COMPLETING FORM
1. REPORT NUMBER 2. GOVT ACCESSION NO. 3. RECIPIENT'S CATALOG NUMBER
AFWAL-TR-82-2042 Vol I 3-4. TITLE (and Subtitle) 5. TYPE OF REPORT & PERIOD COVERED
MATERIAL CHARACTERIZATION, PART A Technical ReprtMECHANICAL PROPERTIES OF TWO METALS AT IOctober 1977 )ONovernber 979SEVERAL STRAIN RATES 6. PERFORMING ORG. REPORT NUMBER
UDR-TR-79-987. AUTHOR(&) S. CONTRACT OR GRANT NUMBER(&)
S. A. Emery 200-4BA-I4K47844
9. PERFORMING ORGANIZATION NAME AND ADDRESS I0. PROGRAM ELEMENT. PROJECT. TASKAREA & WORK UNIT NUMBERS
University of Dayton Research Institute
300 College Park Ave. 62203F, 3066, 12, 33Dayton, Ohio 45469
11. CONTROLLING OFFICE NAME AND ADDRESS 12. REPORT DATE
General Electric Company May 1982Evendale Plant - Aircraft Engine Group 13. NUMBER OF PAGES
Evendale, OH 45215 6714. MONITORING AGENCY NAME & ADDRESS(It different from Controlling Office) 15. SECURITY CLASS. (of this report)
Unclassified15I. DECL ASSI FICATION/ DOWNGRADING
SCHEDULE
I6. DISTRIBUTION STATEMENT (of thie Report)
Approved for public release; distribution unlimited.
17. DISTRIBUTION STATEMENT (of the ebstract entered in Block 20, if different from Report)
IS. SUPPLEMENTARY NOTES 4
I. KEY WORDS (Continue on reverse side it neceesary and Identfy by block number)
Stainless steel, titanium, foreign object damage, mechanicalproperties, low strain rate, intermediate strain rates, anddynamic strain rates.
20. AISTRACT (Continue on reverse side If neceeeary and Identify by block number)- This report describes mechanical property data collected in
support of a fan blade analysis model. The development of theblade model is part of a foreign object damage (FOD) study ofjet engine fan blades. Use of the properties in the model allowsone to evaluate potential fan blade materials. Part A of thisreport contains a discussion of the mechanical property testsconducted on two metallic materials: 410 stainless steel and8A1-lMo-lv titanium.L These two materials were selected because
D ORI. 1473 /OSECURITYUNCLASSIFIEDSECURITY CLASSIFICATION OF THIS PACE ("*. Date Entered) N\

.- UNCLASSIFIEDSECURITY CLASSIFICATION O THIS PAGE(Wee Date Ratetad)
of-hteir use in the J-79 blade and the F-101 blade respective-ly.-3 Part B of the report contains a discussion of mechanicalproperty tests conducted on the two composite components ofa hybrid composite blade: boron/2024 aluminum and stainlesssteel wire mesh. These two composites are used in the hybridcomposite APSI blade.
Static, quasi-static and dynamic tensile tests were con-ducted on the metallic materials because (1) studies indicatethat metallic mechanical properties exhibit strain rate depen-dence and (2) tests conducted on full scale blade_, show thatvarious locations on the fan blades load at different rates.The mechanical properties mecsured include Young's Modulus(when obtainable), Poisson's ratio (when obtainable), theyield strength, the ultimate strength, and the ultimatestrain. The density of the materials was also measured
UNCLASSIFIED8 SSCUftITY CLASSIICATION OF THI2 PA@IEfWo ba n te
FOREWORD
This repor- describes a contractual work effort conducted
for the General Electric Company, Aircraft Engine Group under
Purchase Order No. 200-FBA-14K-47844 which is a subcontract
of F33615-77-C-5221.
This report covers work conducted during the period of
October 1977 to November 1979 and is part of Task IV-A.
The GE Program Manager was Mr. Joe McKenzie and the
Principal Investigator was Mr. Al Storace. The work reported
herein was performed under the direction of Susan A. Emery,
Experimental and Applied Mechanics Division, University of
Dayton Research Institute.
Technical support was provided by Mr. E. C. Klein. Program
management for the University was provided by Mr. Robert Bertke.
This report covers work conducted for project 3066, task 12,
entitled Foreign Object Impact Design Criteria. The contract
was sponsored by the Aero Propulsion Laboratory, Air Force Systems
Command, Wright-Patterson AFB, Ohio 45433 under the direction of
Sandra K. Drake (AFWAL/POTA), Project Engineer.
~Gpk
iii
.'T
TABLE OF CONTENTS
SECTION PAGE
I INTRODUCTION 1
II EXPERIMENTAL PROCEDURES 3
2.1 LOW AND INTERMEDIATE STRAIN RATE TESTS 3
2.1.1 Test Specimen and SpecimenInstrumentation 4
2.1.2 Test Procedures and Test System 4
2.1.2.1 Test System 4
2.1.2.2 Test Procedure 7
2.2 HIGH STRAIN RATE TESTS 7
2.2.1 Experimental Apparatus 7
2.2.2 Instrumen'..ation 9
2.2.3 Test Procedures and Mechanisms 11
III ANALYSIS 15
3.1 LOW AND INTERMEDIATE STRAIN RATE TESTS 15
3.2 HIGH STRAIN RATE TESTS 17
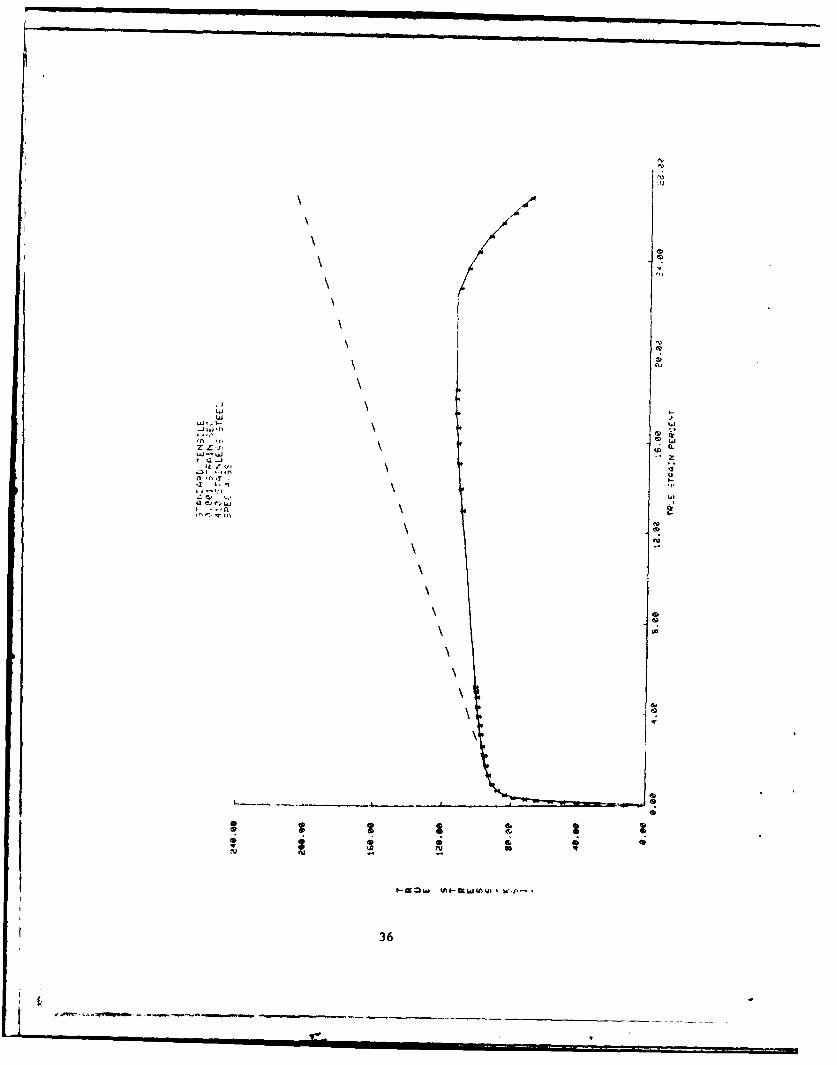
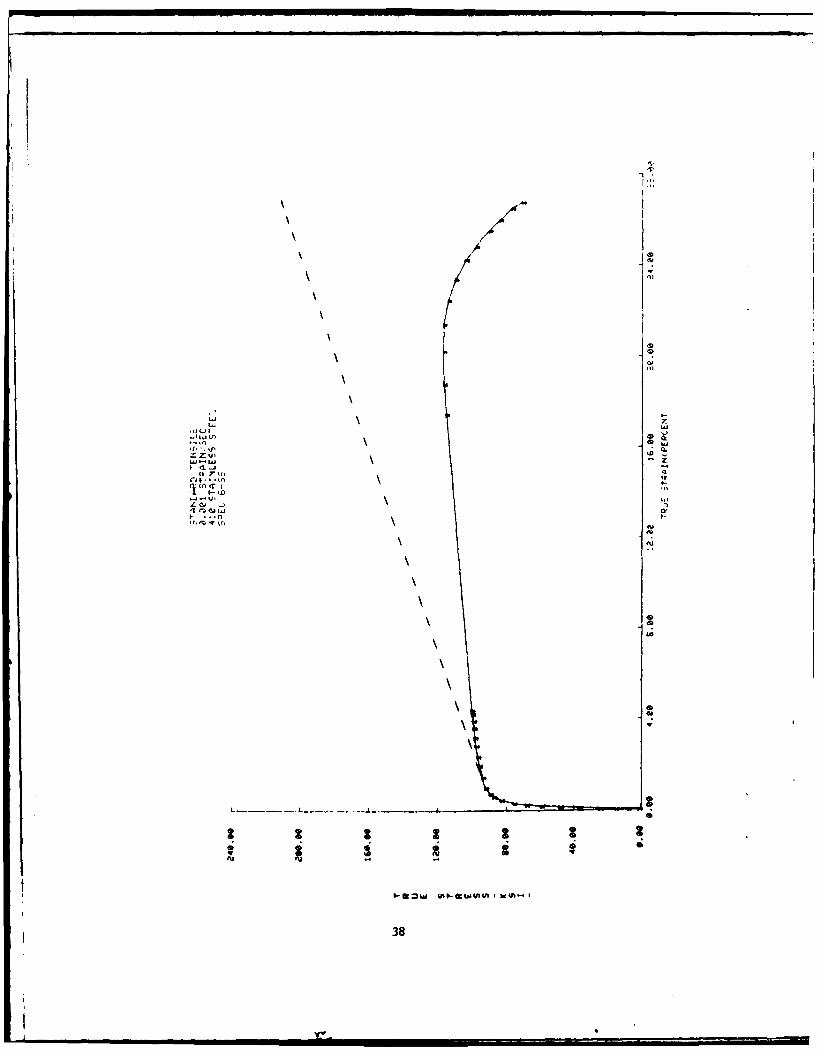
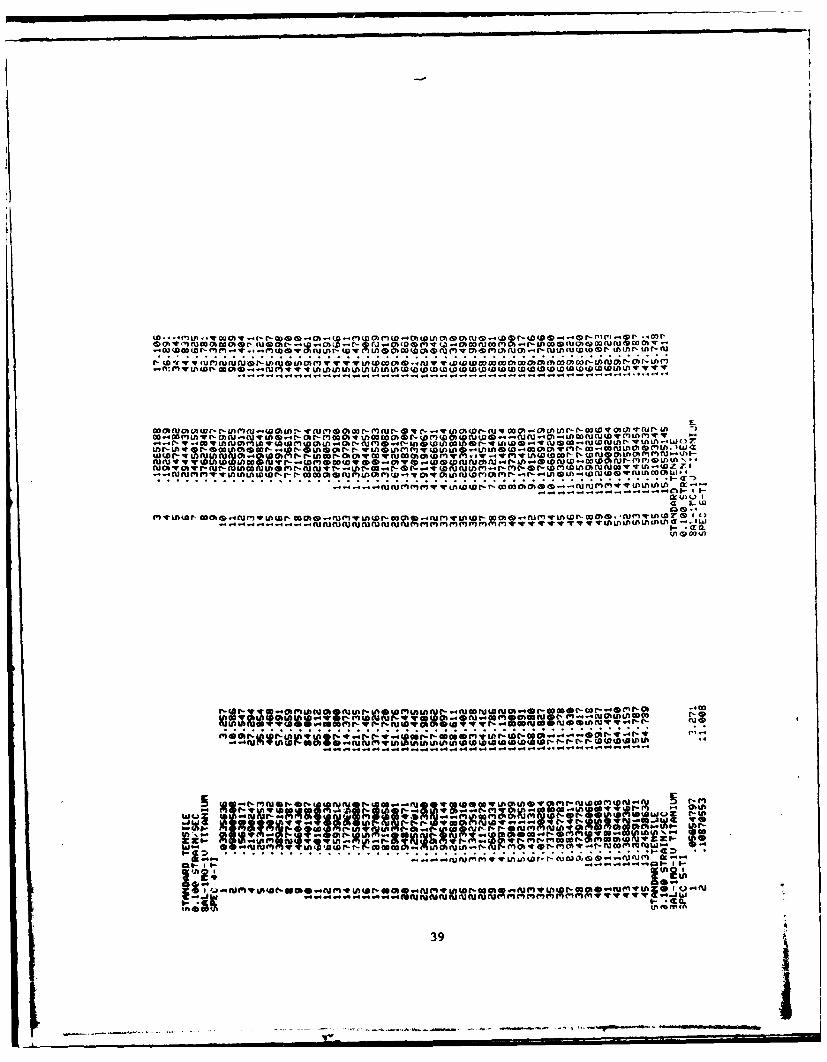
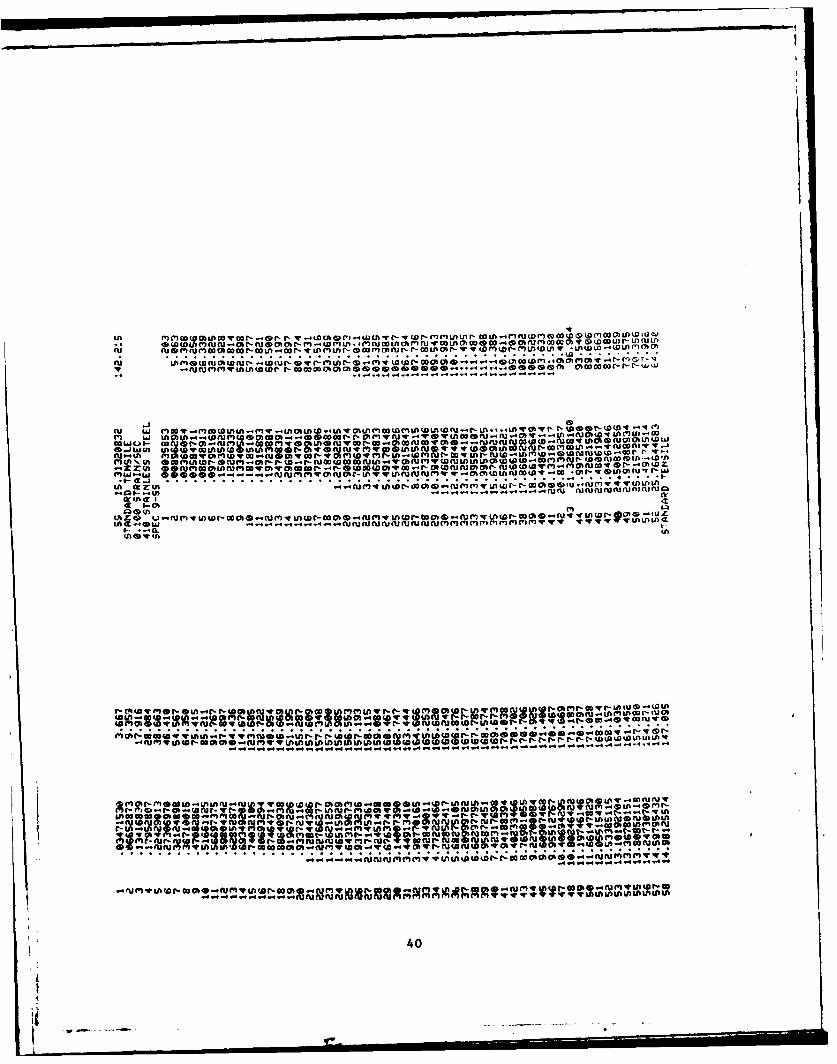
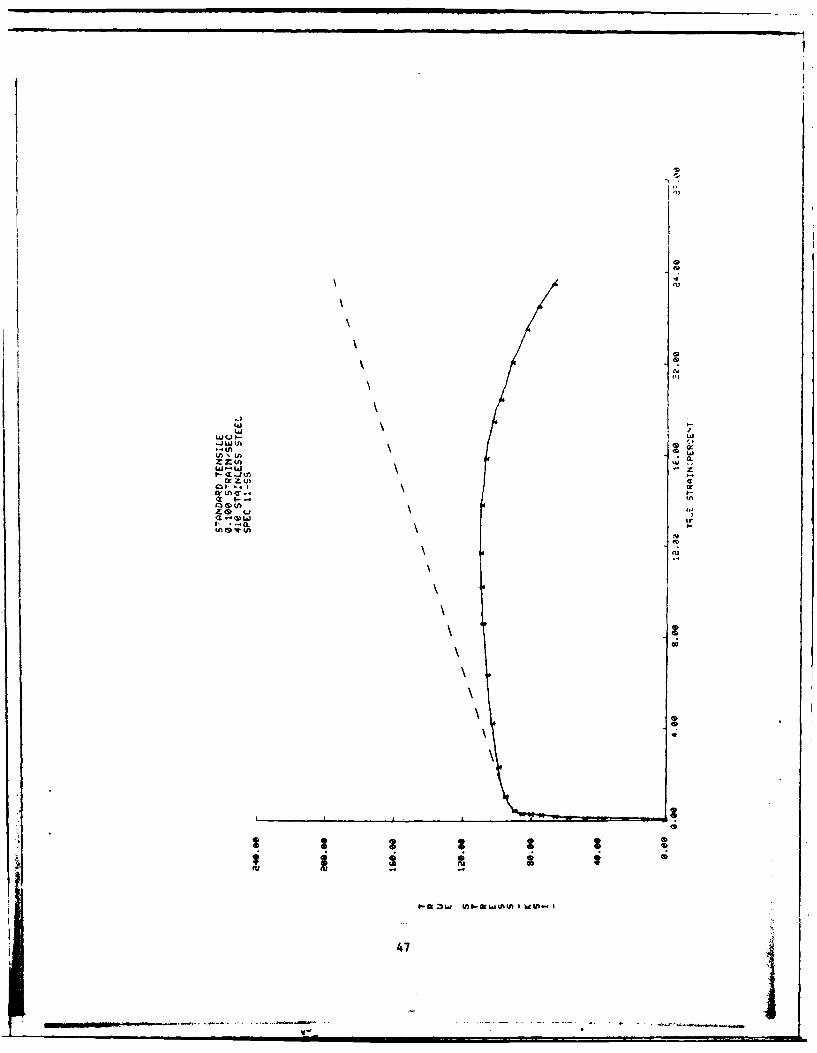
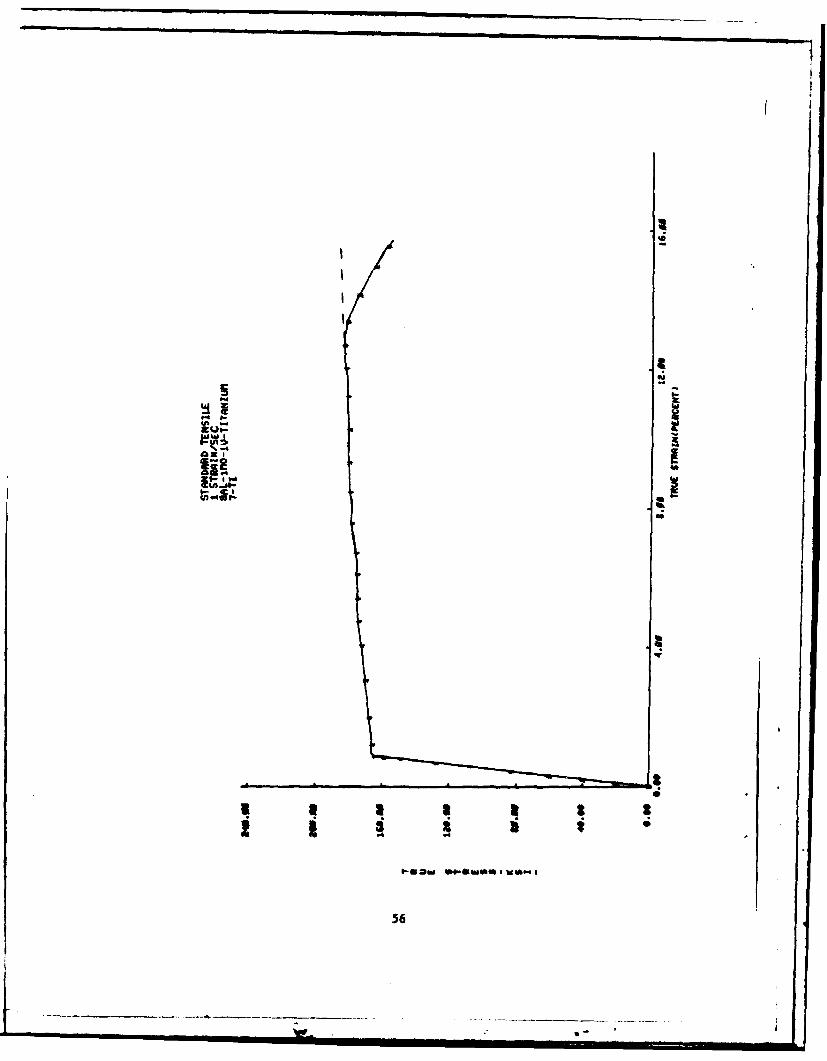
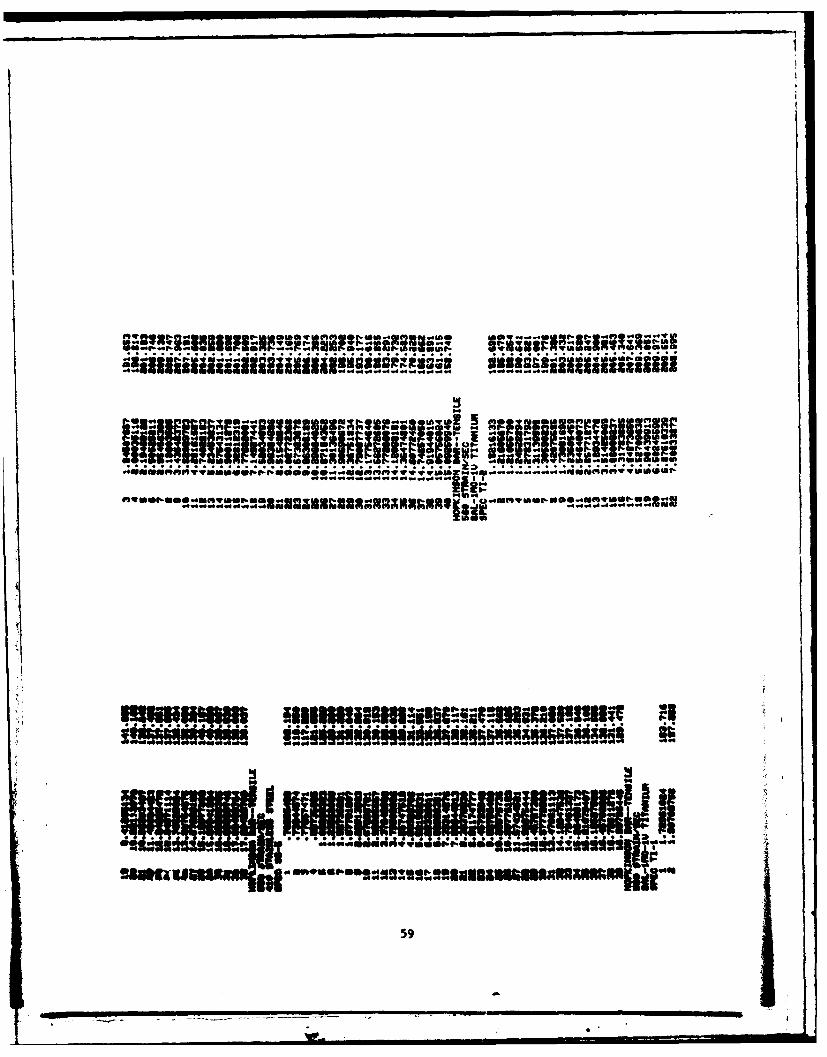
IV RESULTS AND DISCUSSION 19
REFERENCES 27
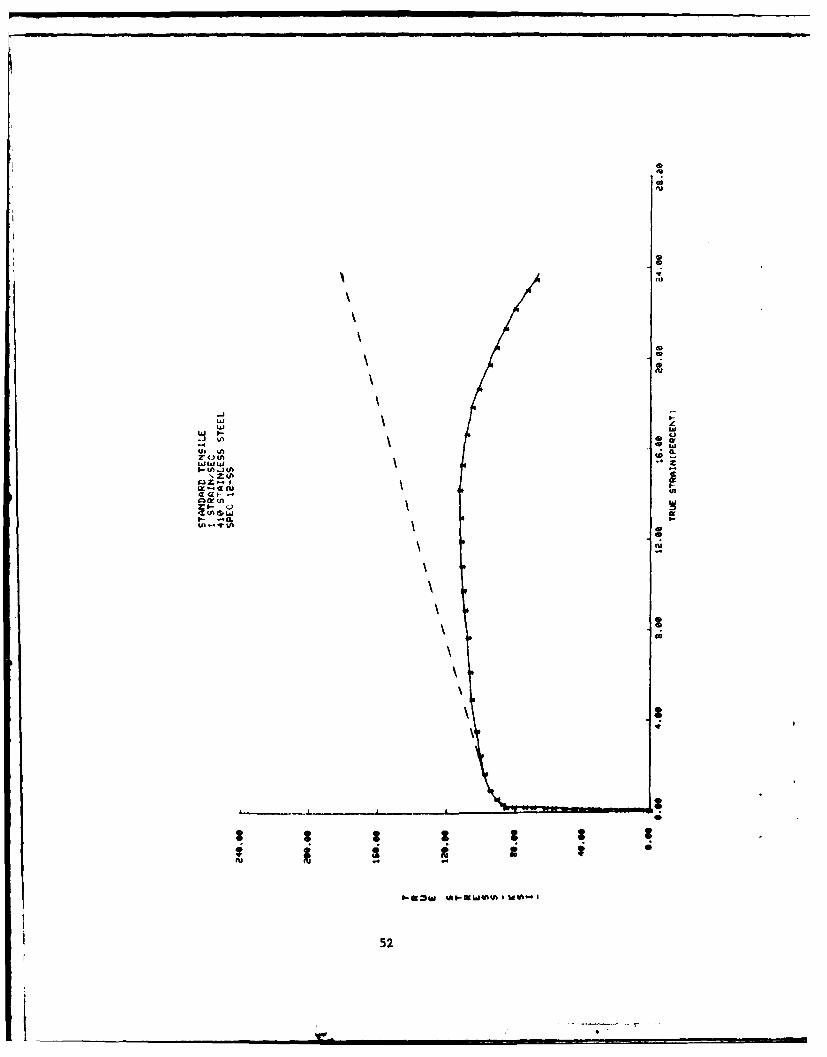
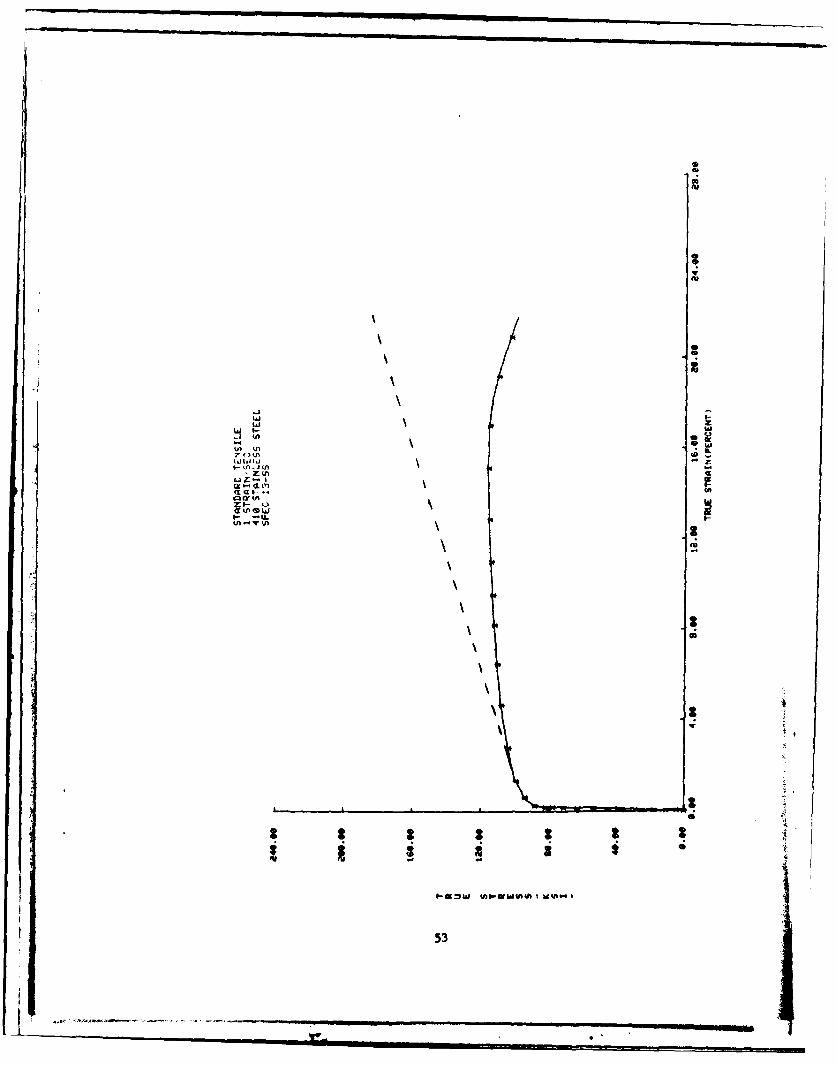
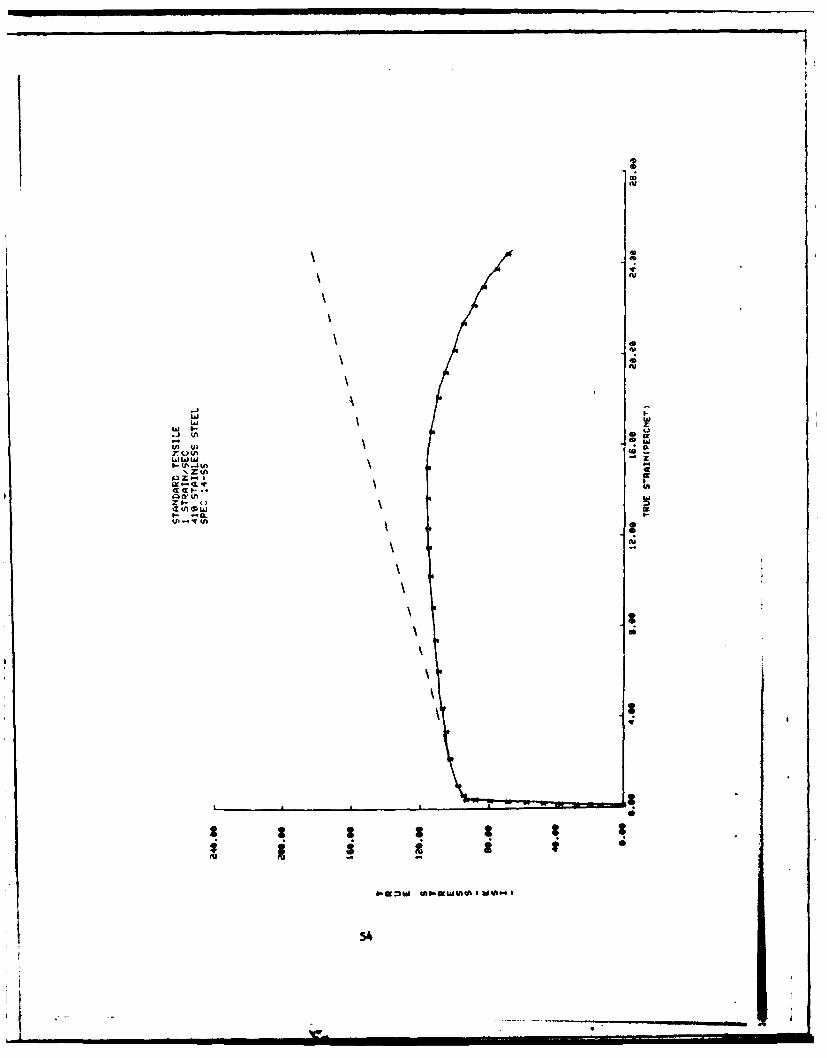
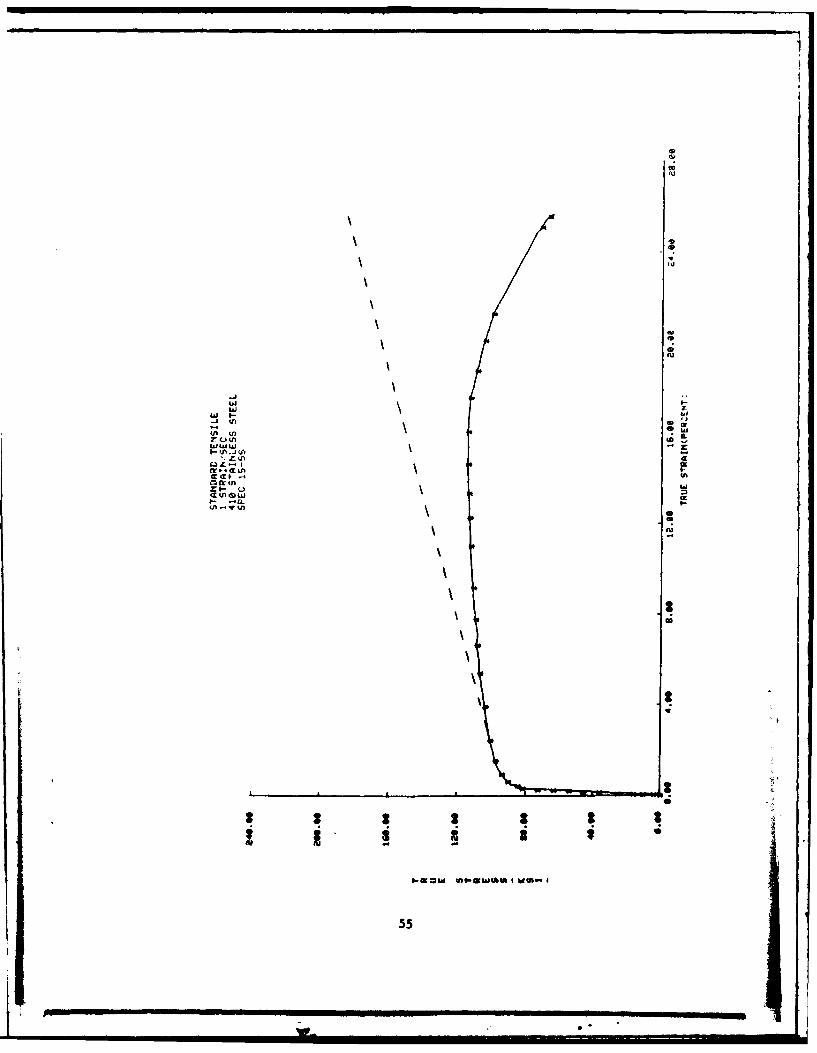
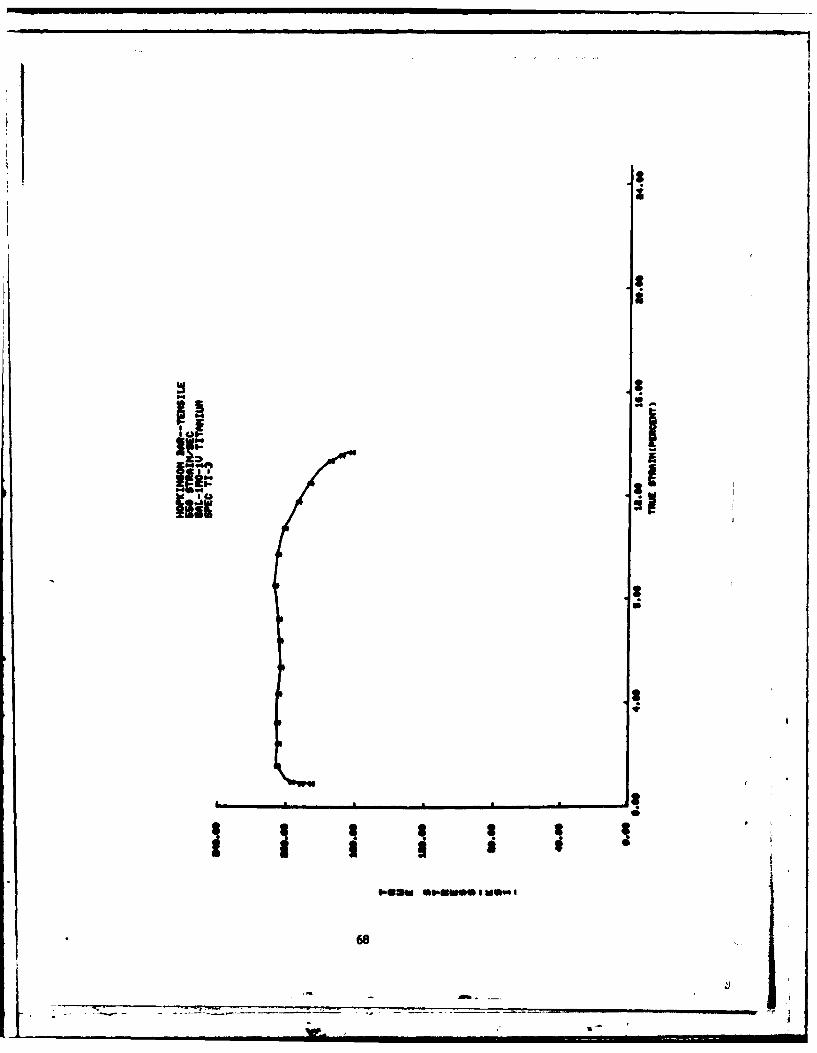
APPENDIX A: LOW AND INTERMEDIATE STRAIN RATECURVES AND DIGITAL DATA 28
APPENDIX B: HIGH STRAIN RATE CURVES ANDDIGITAL DATA 57
Iv

LIST OF ILLUSTRATIONS
FIGURE PAGE
I Specimen for Low and Intermediate StrainRate Tests. 5
2 Location of Measurement Instrumentation on theLow and Intermediate Strain Rate Specimens. 6
3 Schematic of Apparatus and Instrumentationfor High Strain Rate Tests. 8
4 Specimen for High Strain Rate Tests. 10
5 Typical Oscilloscope Traces. 12
6 Lagrangian Displacement - Time Plot for HighStrain Rate Tests. 13
7 Young's Modulus VS. Strain Rate. 23
8 Yield Stress VS. Strain Rate. 24
9 Ultimate Stress VS. Strain Rate. 25
10 Ultimate Strain VS. Strain Rate. 26
vi.

LIST OF TABLES
TABLE PAGE
1 STRAIN RATES OF METALLIC MATERIAL CHARACTERIZA-TION TESTS 3
2 MECHANICAL PROPERTIES OBTAINED FOR 8A1-lMo-IVTITANIUM 20
3 MECHANICAL PROPERTIES OBTAINED FOR 410 STAIN-LESS STEEL 21
4 DENSITY 22
vil
I _ i

I I I
SECTION I
INTRODUCTION
The material characterization tests discussed in this report
are part of a foreign object damage (FOD) study of jet engine fan
blades. The tests constitute a portion of the gross structural
damage subtask of that study. The FOD study is designed to pro-
vide two resources necessary for the successful development of
FOD resistant fan blades: (1) an analysis capability for pre-
dicting jet engine response to FOD impacts and (2) an under-standing of the mechanisms of FOD failures. The fan blade
analytical model uses inputs such as mechanical property data
(of the material under consideration) and impact loads (repre-
sentative of ice balls, ice spears, or small birds) to
predict the fan blade response to the foreign object damage
impacts. The model allows considerable evaluation of the blade
design and material prior to the manufacturinc and testing of
a full stage of blades. This eliminates many costly experiments
that have been necessary in the past.
The material characterization tests provide mechanical
properties for use in the blade model discussed above. The
materials tested include two metals, 410 stainless steel and
8A-lMo-lV titanium (used in the J-79 blade and F-101 blade,
respectively) and two composites, boron/2024 aluminum and
stainless steel wire mesh (used in the hybrid composite APSI
blade). Part A of this report contains the description of the
material chracterization tests on the metals. Part B contains
the discussion of the material chracterization tests on the
composite materials.
The mechanical properties of metals usually exhibit some
strain rate dependence.(1,2,3) In addition, experiments have
shown that the FOD impacts load various sections of the blades
at different rates. For these reasons, tensile tests were3
conducted on the metals at strain rates ranging from 10 to i1

about 10 3strain/second. The quasi-static and intermediate rate
tests (10- to 1 strain/second), conducted with an MTS closed-
loop hydraulic system, provide the following elastic and plastic
region parameters: Young's modulus, Poisson's ratio (in the
elastic region), 0.2 percent offset yield stress, ultimate stress,
and ultimate strain. The dynamic tests (500 to 700 strain/second),
conducted on a split-Hopkinson bar apparatus, provide only the
plastic region parameters: yield stress, ultimate stress, and
ultimate strain. The mechanical properties are summarized in
this report as plots of the various parameters versus strain
rate.
2
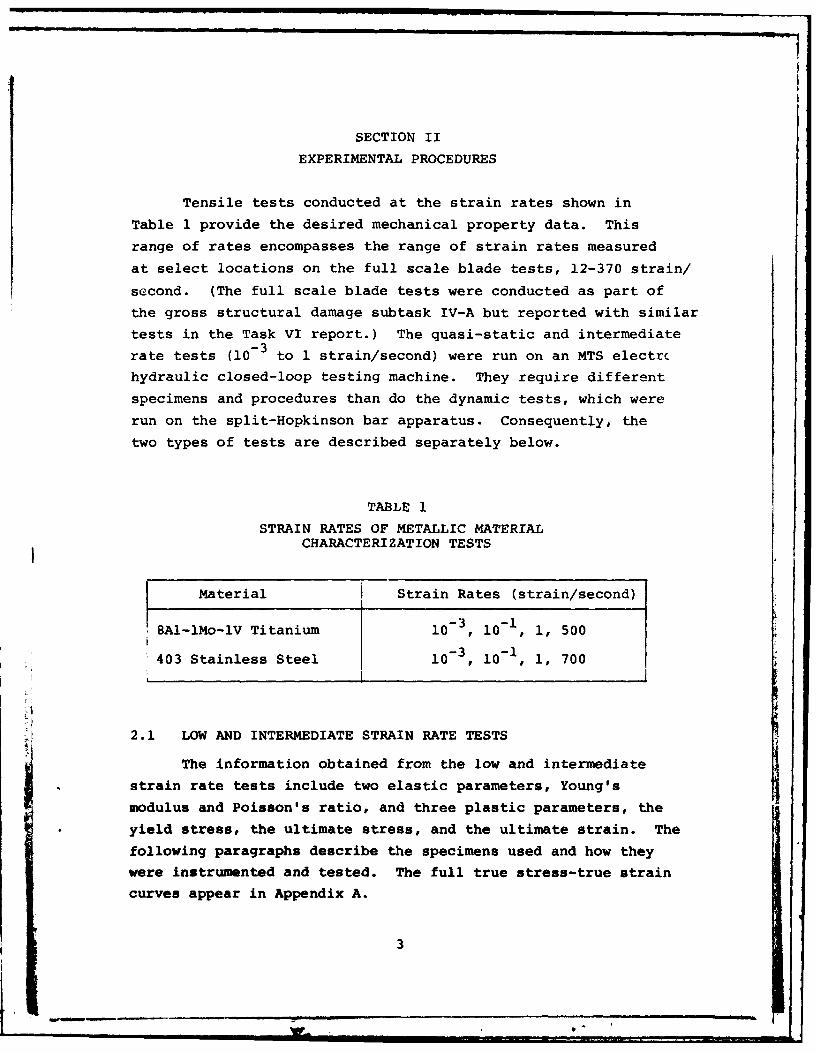
SECTION II
EXPERIMENTAL PROCEDURES
Tensile tests conducted at the strain rates shown in
Table 1 provide the desired mechanical property data. This
range of rates encompasses the range of strain rates measured
at select locations on the full scale blade tests, 12-370 strain/
second. (The full scale blade tests were conducted as part of
the gross structural damage subtask IV-A but reported with similar
tests in the Task VI report.) The quasi-static and intermediate
rate tests (10- to 1 strain/second) were run on an MTS electrchydraulic closed-loop testing machine. They require different
specimens and procedures than do the dynamic tests, which were
run on the split-Hopkinson bar apparatus. Consequently, the
two types of tests are described separately below.
TABLE 1
STRAIN RATES OF METALLIC MATERIALCHARACTERI ZATION TESTS
Material I Strain Rates (strain/second)
18A1-lMo-lV Titanium 10, 101 1, 500
403 Stainless Steel 10-, 10l, 1, 700
2.1 LOW AND INTERMEDIATE STRAIN RATE TESTS
The information obtained from the low and intermediate
strain rate tests include two elastic parameters, Young' s
modulus and Poisson's ratio, and three plastic parameters, the
yield stress, the ultimate stress, and the ultimate strain. The
following paragraphs describe the specimens used and how they
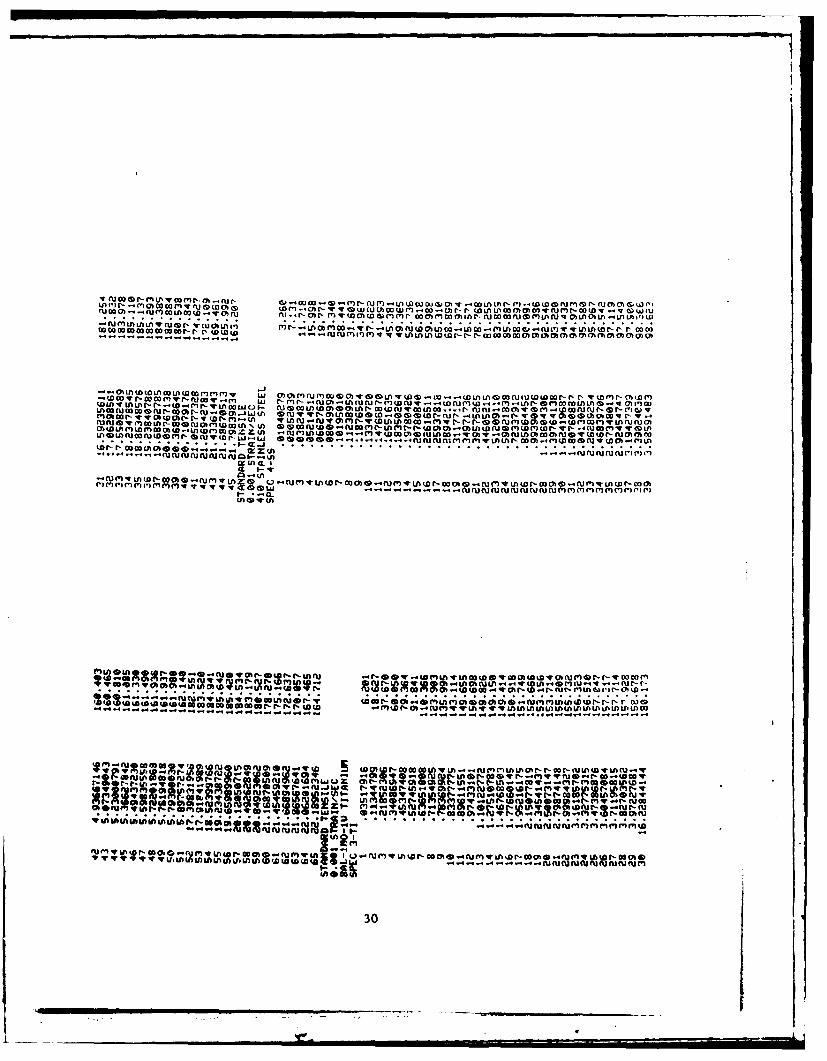
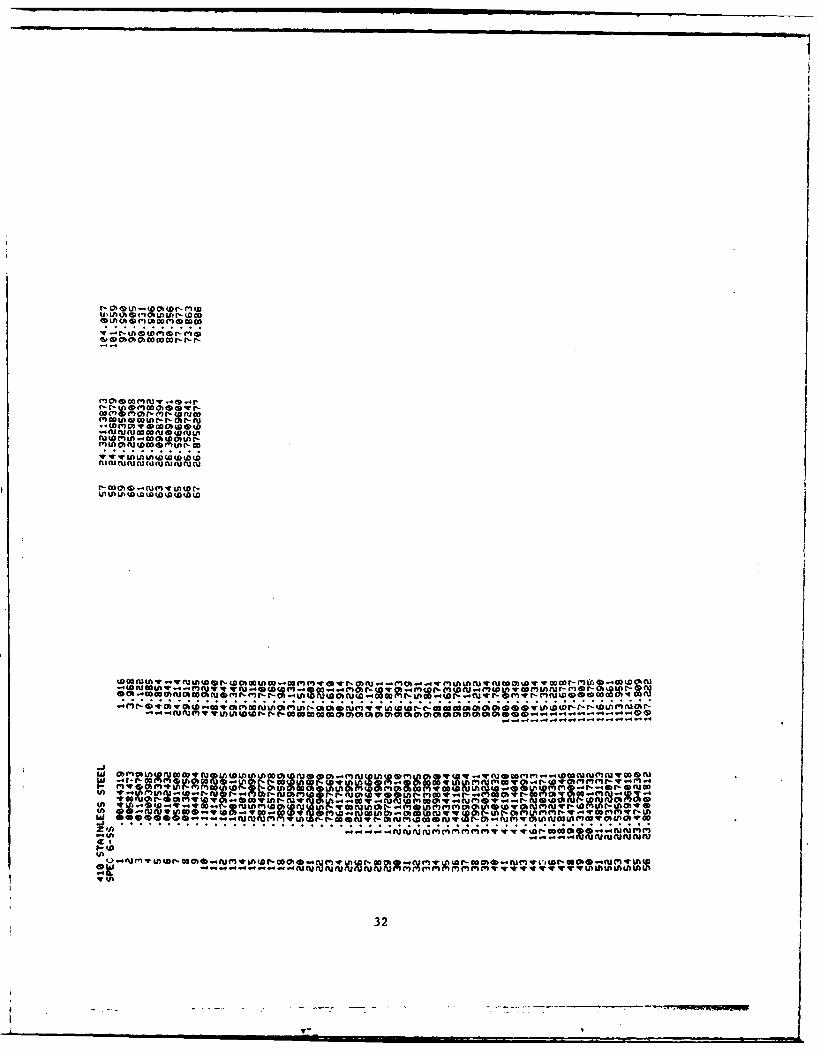
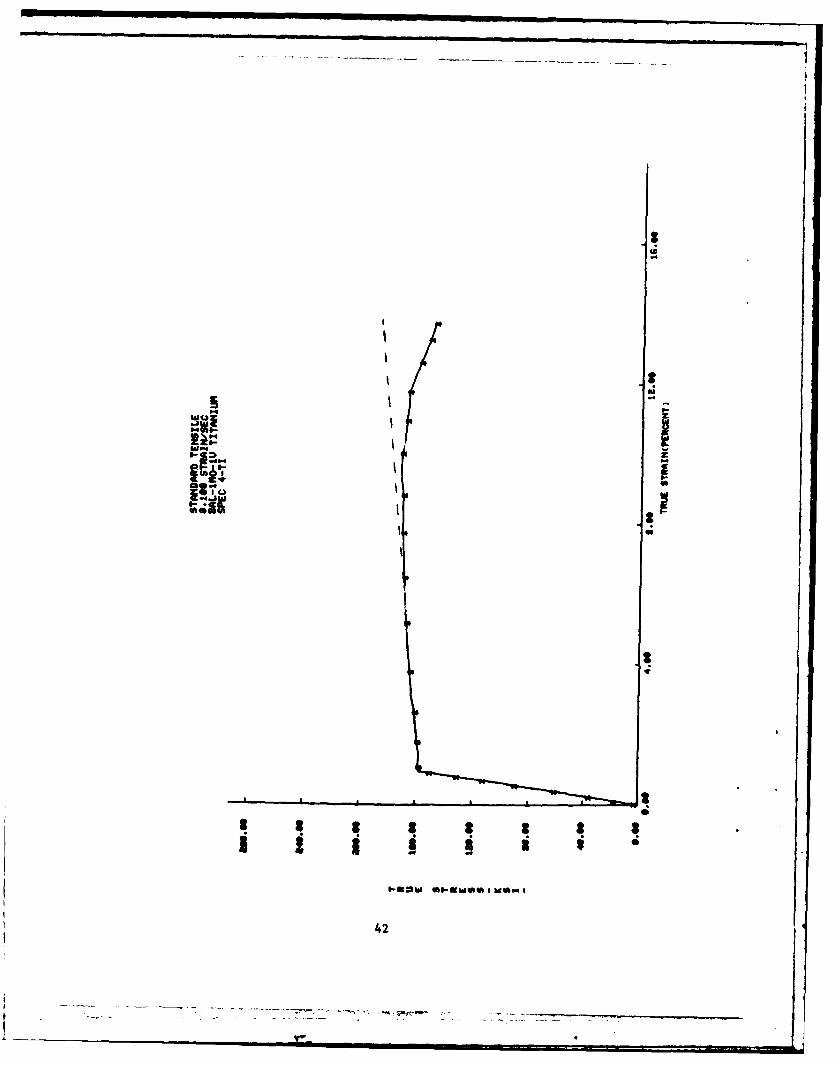
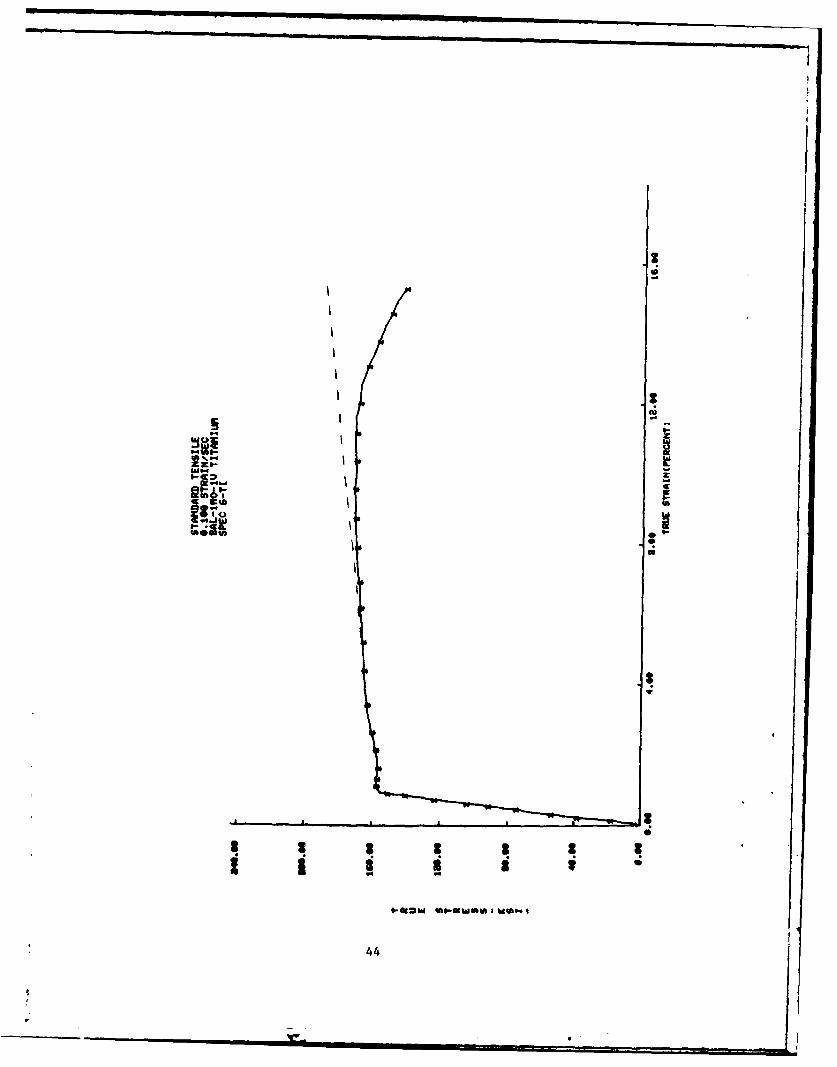
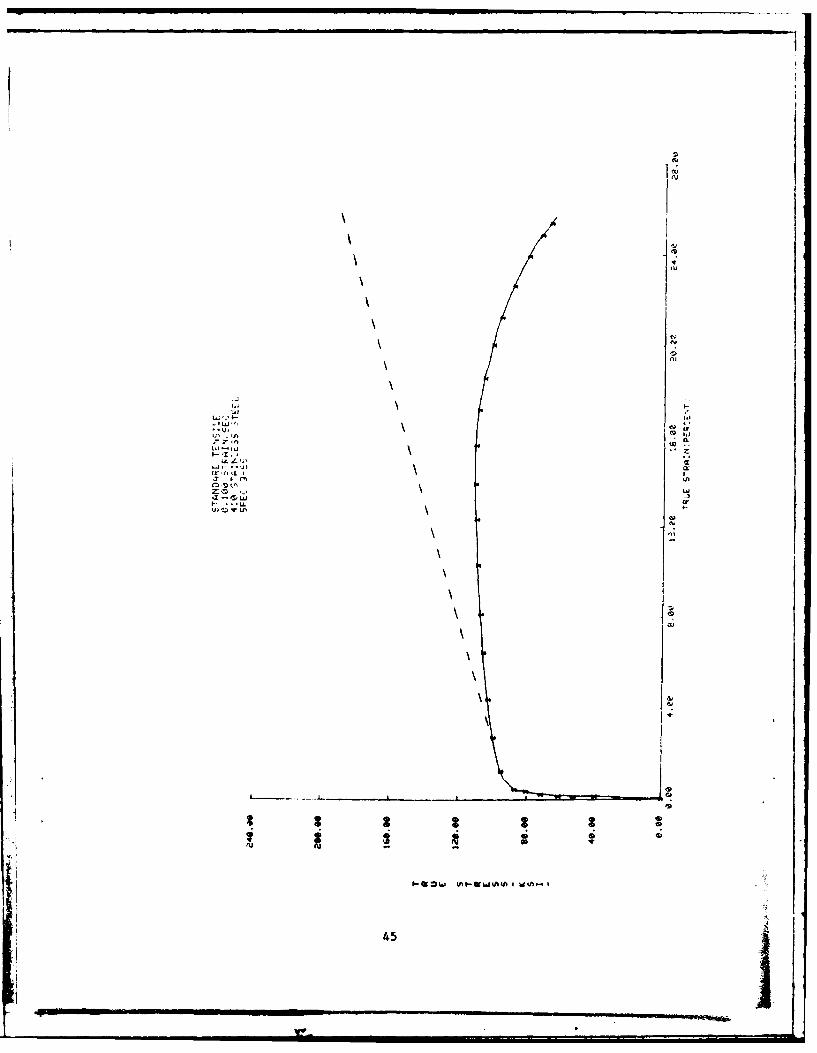
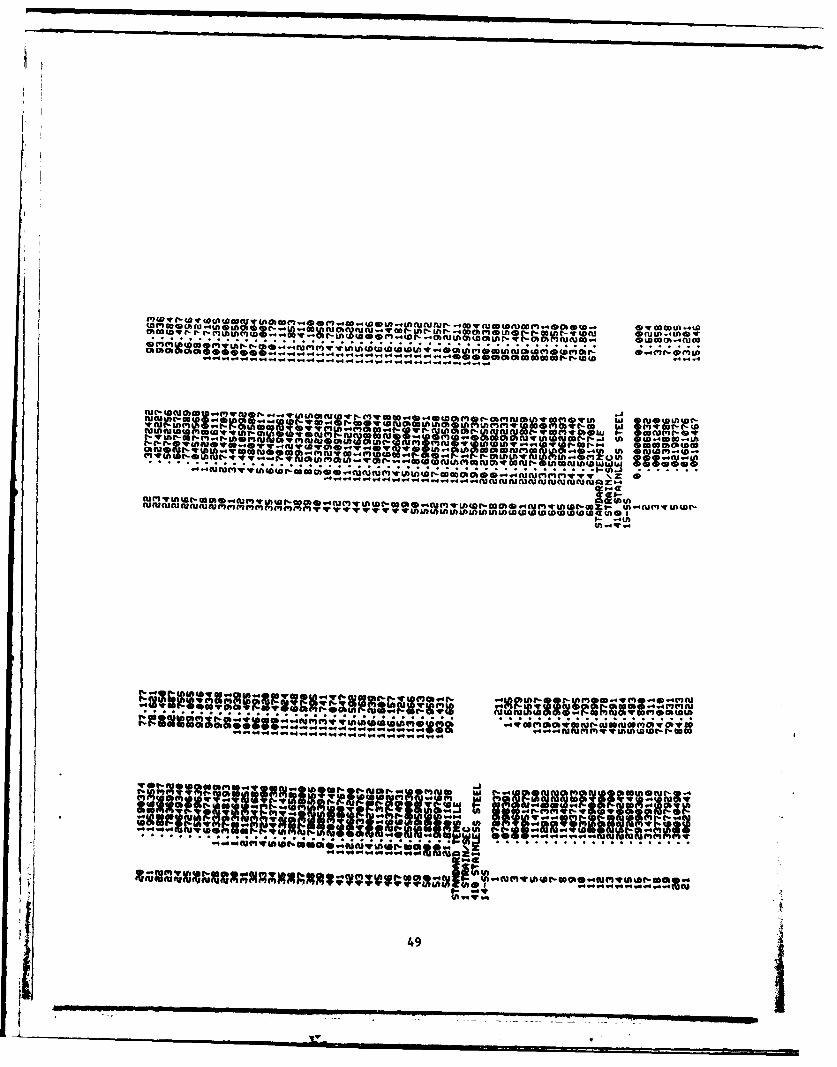
were instrumented and tested. The full true stress-true straincurves appear in Appendix A.
3
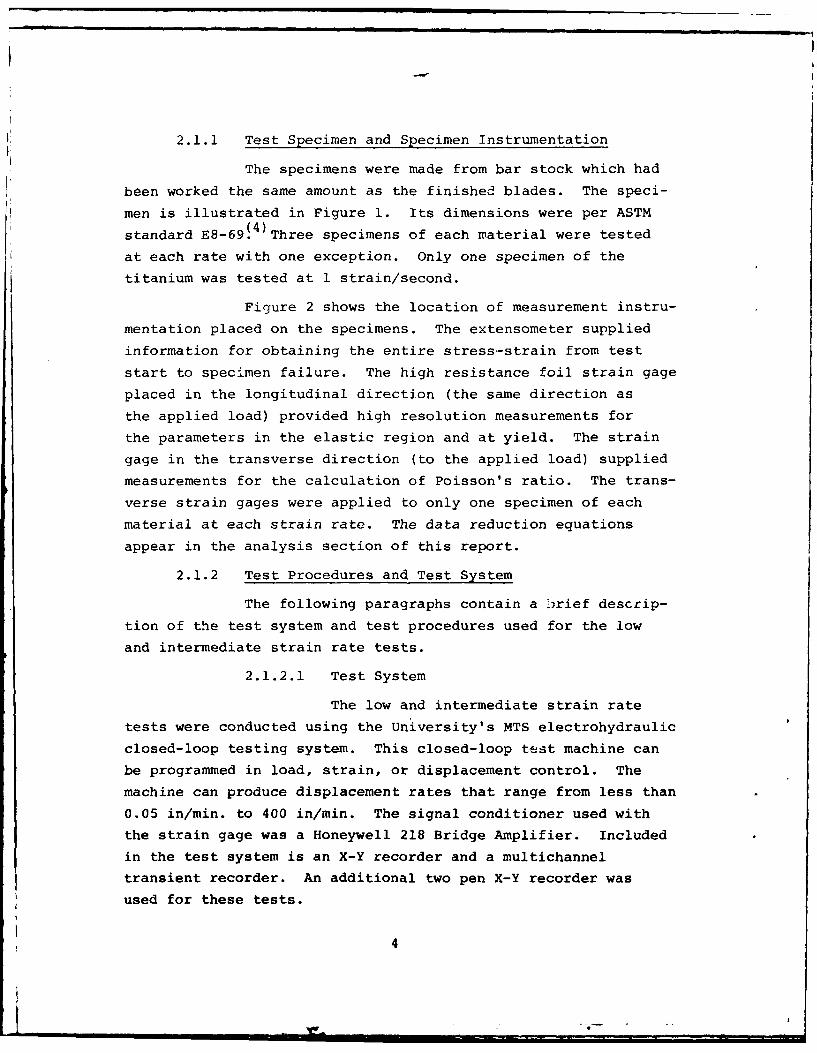
2.1.1 Test Specimen and Specimen Instrumentation
The specimens were made from bar stock which had
been worked the same amount as the finished blades. The speci-
men is illustrated in Figure 1. Its dimensions were per ASTM
standard E8-69 4~ )Three specimens of each material were tested
at each rate with one exception. Only one specimen of the
titanium was tested at 1 strain/second.
Figure 2 shows the location of measurement instru-
mentation placed on the specimens. The extensometer supplied
information for obtaining the entire stress-strain from test
start to speci.men failure. The high resistance foil strain gage
placed in the longitudinal direction (the same direction as
the applied load) provided high resolution measurements for
the parameters in the elastic region and at yield. The strain
gage in the transverse direction (to the applied load) supplied
measurements for the calculation of Poisson's ratio. The trans-
verse strain gages were applied to only one specimen of each
material at each strain rate. The data reduction equations
appear in the analysis section of this report.
2.1.2 Test Procedures and Test System
The following paragraphs contain a ;',rief descrcip-
tion of the test system and test procedures used for the low
and intermediate strain rate tests.
2.1.2.1 Test System
The low and intermediate strain rate
tests were conducted using the University's MTS electrohydraulic
closed-loop testing system. This closed-loop ttst machine can
be programmed in load, strain, or displacement control. The
machine can produce displacement rates that range from less than
0.05 in/min. to 400 in/min. The signal conditioner used with
the strain gage was a Honeywell 218 Bridge Amplifier. Included
in the test system is an X-Y recorder and a multichannel
transient recorder. An additional two pen X-Y recorder was
used for these tests.
4
1.00 inches
4 inches0.250 + 0.005
inchesdiameter
0.1875 R
Figure 1. Specimen for Low and Intermediate Strain
Rate Tests.
5
IlL i O W
-- ,,. o . L , _ _ W - _ . - - . . . . . .. .• -

Specimen instrumentedFoil for axial strain andStrain I Extensometer displacementGage measurement
Specimen instrumented! for axial strain and
Foil Extensometer displacement measure-Strain ments and transverseGage JujI strain measurements
Figure 2. Location of Measurement Instrumentation on the Lowand Intermediate Strain Rate Specimens.
6
2.1.2.2 Test Procedure
After tightening the strain gaged
specimen in the grips, the extensometer was attached and adjusted
to give the proper output voltage for the desired gage length.
With the test machine in the load control mode a linear ramp
function loaded the specimen to failure. Load and displacement
were recorded directly on the qystem X-Y recorder for the lowest
strain rate tests (10- strain/second). Load and strain were
recorded directly on the additional X-Y recorder. For the
higher strain rate tests (10-1 and 1 strain/second) the three
parameters, load, strain, and displacement were recorded on
three channels of the transient recorder for playback at slower
speeds into the X-Y recorder.
2.2 HIGH STRAIN RATE TESTS
Mechanical properties obtained from the high strain rate
tests include the following three plastic parameters: the yield
stress, the ultimate stress, and the ultimate strain. Plastic
region true stress-true strain curves were also acquired fromthe tests. (Elastic properties cannot be obtained from these
tests because the pressure waves in the Hopkinson bar are not
considered to be in equilibrium in the elastic region). The
method (and apparatus) used is the same as that used in a study
of the high strain rate tensile mechanical properties study of
beryllium.~5 The subsequent paragraphs provide a detailed
description of the experimental apparatus, the instrumentation,
and the test procedures and mechanisms. The analysis section
of this report contains the brief explanation of the data
reduction process. The results appear in Appendix B.
2.2.1 Experimental Apparatus
A schematic of the split Hopkinson bar apparatus
and the associated instrumentation appears in Figure 3. Three
parts of the apparatus are of major interest: two Hopkinson
pressure bars (bar No. 1 and bar No. 2) and the striker bar.
7
z4J
4 0'
(I4)
4r 4.LE
0~ 4-4
z 0U0
4)
CC)
zz
c2
4c 4-4
II1
Bar No. 1 must be twice the length of bar No. 2 and the striker
bar must be shorter than bar No. 2. For these experiments the
bars are 0.06, 0.15, and 0.30 m lengths of 12.7 mm diameter
AISI 4130 steel. They are mounted and aligned on a rigid base.
Detail "A" of Figure 3 shows an enlargement of a
longitudinal section of the apparatus at the location of the
specimen. To prepare for the test, the threaded tensile speci-
ment, shown in Figure 4, is screwed partially into the pressure
bars. Then a split shoulder is placed over the specimen, and
the specimen is screwed in until the shoulder is snug against
the pressure bars. The shoulder has the same outer diameter
as the pressure bars (12.7 mm) and it has an inner diameter of
6.4 mm, just large enough to clear the specimen. The shoulder
is made of the same material as the pressure bars, AISA 4130
steel. The ratio of the cross-sectional area of the shoulder
to that of the pressure bar is 3:4, while the ratio of the area
of the shoulder to the net cross-sectional area of the specimen
is 12:1.
2.2.2 Instrumentation
The recording circuitry consists primarily of
strain gages, two oscilloscopes, and a counter. See Figure 3.
The recording system is triggered when the striker bar impacts
bar No. 1. A brief review of the major parts of the recording
system follows.
Bars No. 1 and 2 are instrumented with high resis-
tance foil strain gages. The gages on eacn bar are placed
equidistant from the specimen so that the reflected and trans-
mitted wave signals are time coincident. They are far enough
from the specimen that no spurious reflections interfere with
the pulses being recorded. Gages are placed diametrically
opposite each other on the pressure bars to cancel bending.
The two oscilloscopes record data. One, a dual
beam Tektronix type 565 oscilloscope, records the complete
9
.. . . . . e
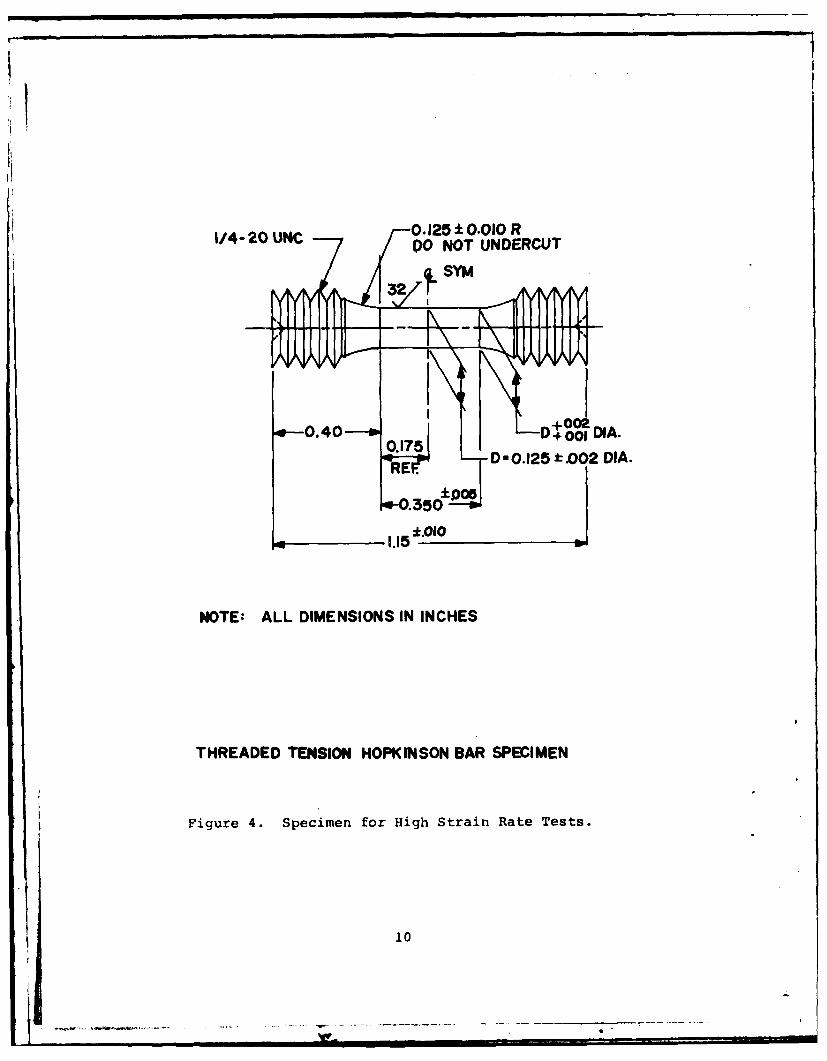
1/4-2 UHC0. 125 10.010 R1/4 - 0 UNC O NOT UNDERCUT
D-0-15tDODIA.
1.1512 1.000 DIA
NOTE: ALL DIMENSIONS IN INCHES
THREADED TENSION HOPKINSON BAR SPECIMEN
Figure 4. Specimen for High Strain Rate Tests.
10

strain time history of the test. One beam records the incident
pulse as it passes the first gage. The second beam is used in
chopped mode to record both the transmitted pulse (which is
proportional to load) and the reflected pulse (which is propor-
tional to strain rate). Figure 5(a) shows a photo of typical
traces.
The second oscilloscope, an X-Y Tektronix, records
a load-deflection curve. The reflected pulse (from gage No. 2)
passes through an electronic integrator and is fed into the X
axis of the scope. The signal is proportional to the displacement
of the specimen. The signal from gage No. 1, proportional to
the load in the specimen, is fed to the Y axis. Figure 5(b)
shows the load-deflection trace.
2.2.3 Test Procedures and Mechanisms
The experiment begins when the striker bar is
accelerated so that it impacts bar No. 1. The compression pulse
generated travels down bar No. 1 to the specimen-shoulder junc-
tion. The pulse passes almost exclusively through the shoulder
because of (1) the large area ratio of shoulder to specimen
mentioned above and (2) the loose fit of the threaded joints
(specimen and pressure bars). The portion of the pulse that
passes through the specimen is below the elastic limit of the
material. Then the compressive pulse travels through bar No.
2 to the free end, where it reflects as a tensile pulse. When
this reflected pulse reaches the specimen, part of it is trans-
mitted through the specimen and part is reflected back into bar
No. 2 (because the shoulder doesn't carry the tensile pulse).
The incident, transmitted and reflected pulses are recorded
and analyzed for the required information.
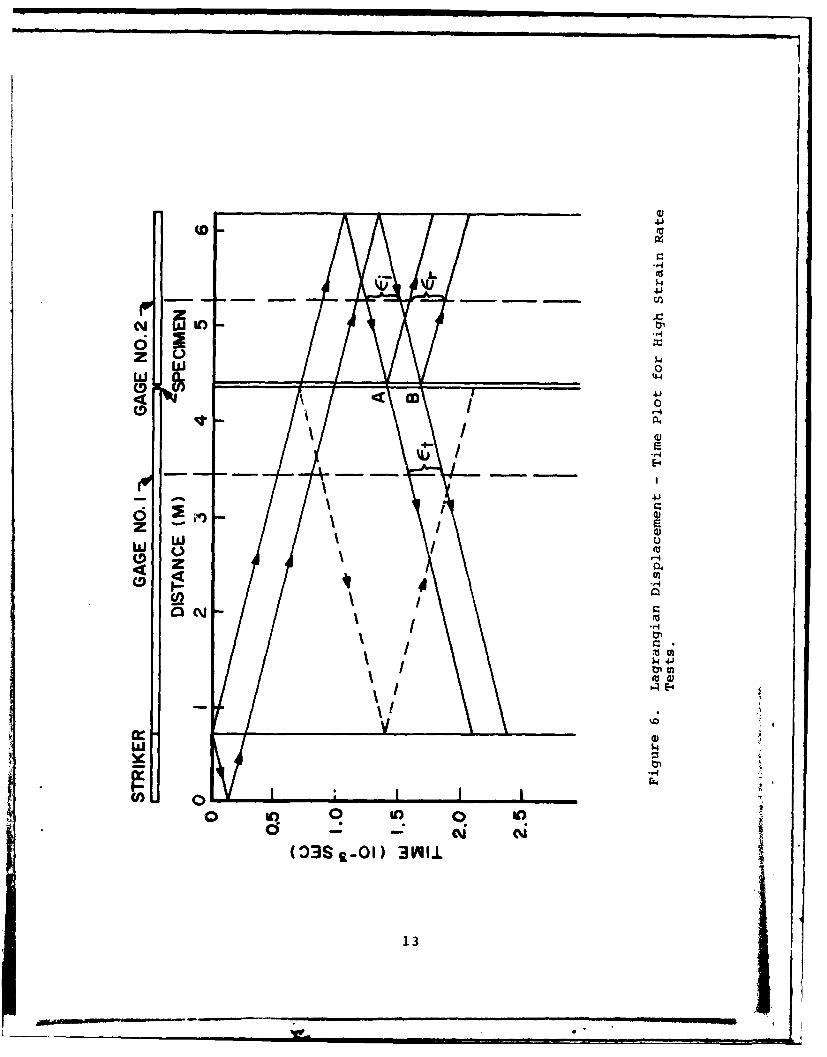
Figure 6 shows a Lagrangian x-t plot which illus-
trates the path of the pressure pulse during the test. The
amplitude of the incident pressure pulse, generated by the
striker bar impacting bar No. 1 is dependent on the striker bar
velocity. Its length is twice the longitudinal elastic wave

E.
Er
E
a Specimen: Ti-3
Vert: 465 lb/div.
fforiz:0.00155 in/div.
b
Figure 5. Typical Oscilloscope Traces.
12
CD
z C
E
- -% 41J
z200
U)
Q4 -
-4
I
cc4)w/Y..
H
(33S 2-01) 3v111
13
transit time in the striker bar. The plot shows that the com-
pressive pulse passes through the entire apparatus and is
reflected from the free end of bar No. 2 as a tensile pulse,
E:i . The plot also illustrates the tensile pulse splitting
when it reaches the specimen-shoulder junction and part of it,
EV being transmitted through the specimen while part, Enr is
reflected back into bar No. 2.
14
SECTION III
ANALYS IS
This section outlines the data reduction techniques and
equations used to obtain the desired true stress-true strain
curves and specific elastic and plastic parameters. All of
the test data began as analog load-displacement curves that
were then analyzed by various computer routines particular to
the test type (low and intermediate, or high strain rate).
The results appear in the appendices in analog and digital form.
3.1 LOW AND INTERMEDIATE STRAIN RATE TESTS
The low and intermediate strain rate tests resulted in
(1) load-displacement curves from the extensometer and (2) load-
strain curves from the strain gages. Converting the displacement
measurement to true strain is relatively simple. Using u as
displacement and k as the initial gage length, one obtains the
following:
E u (engineering strain) (1)
0
E= ln (I + cE (true strain) (2)
where In is the natural logarithm.
pThe extensometer gage length, k was 1 inch for thesetests. Consequently, the digitized displacement value could
4. be used directly in calculations as engineering strain.
The strain gage data was also simple to reduce. A correc-
tion factor was applied to the strain reading to account for
the nonlinearity of the bridge circuit. The incremental error,
n, is added to the indicated, C, to obtain the actual strain,
c, causing the resistance change in the gage. For this case,
a single active gage in a quarter-bridge arrangement, the
15
correction is
F()2 xl 1- 6(3
2 -F (9) x 1
where F is the gage factor. Equation 2 is then used to obtain
true strain.
Obtaining true stress values for the low and intermediate
strain rate tests is more complicated. True stress, 0T' is
proportional to engineering stress, a." by the ratio of the
initial area, A 0 , to the current area, A. In the elastic region,
where one has small strains, the ratio of areas can be expressed
in terms of the longitudinal engineering strain so that
a Cy E(1 + E:E (elastic regionT 1 + E U1- 2v) true stress) (4)
In the plastic region one assumes the material is incompressible,
consequently the volume remains constant. Based on this assump-
tion the true stress in the plastic region becomes
UT = a ( E) (plastic region (51+E l 2v) true stress)
where U E is the engineering strain evaluated at the yield point
of the material.
Three elastic region parameters were calculated from the
strain gage data. Young's modulus is the slope of the linear
part of the curve. Poisson's ratio, v, was obtained for one
test per material per strain rate with the following relationship:
V +C transverse/ longitudinal
16
7S 7"-=7

The shear modulus, G, was calculated with the equation
G = 2 (1 E+ v)
The values of these mechanical properties appear in the results
section. An additional parameter, the yield stress, was obtained
from these curves. It was evaluated using the 0.2 percent (strain)
offset method because neither of the metals exhibits a definite
yield point. The load-displacement curves were analyzed using
Equations 2,4, and 5 to produce the full true stress-time strain
curves. The ultimate strain was taken as the final strain value
of the curve. However, the ultimate stress was calculated
using the final load divided by the final reduced area of the
specimens because Equation 5 is not accurate (complete) for
large amounts of plasticity.
These curves were all digitized on the University of
Dayton's Tektronix 4014-1 computer graphics terminal and
associated digitizing board.
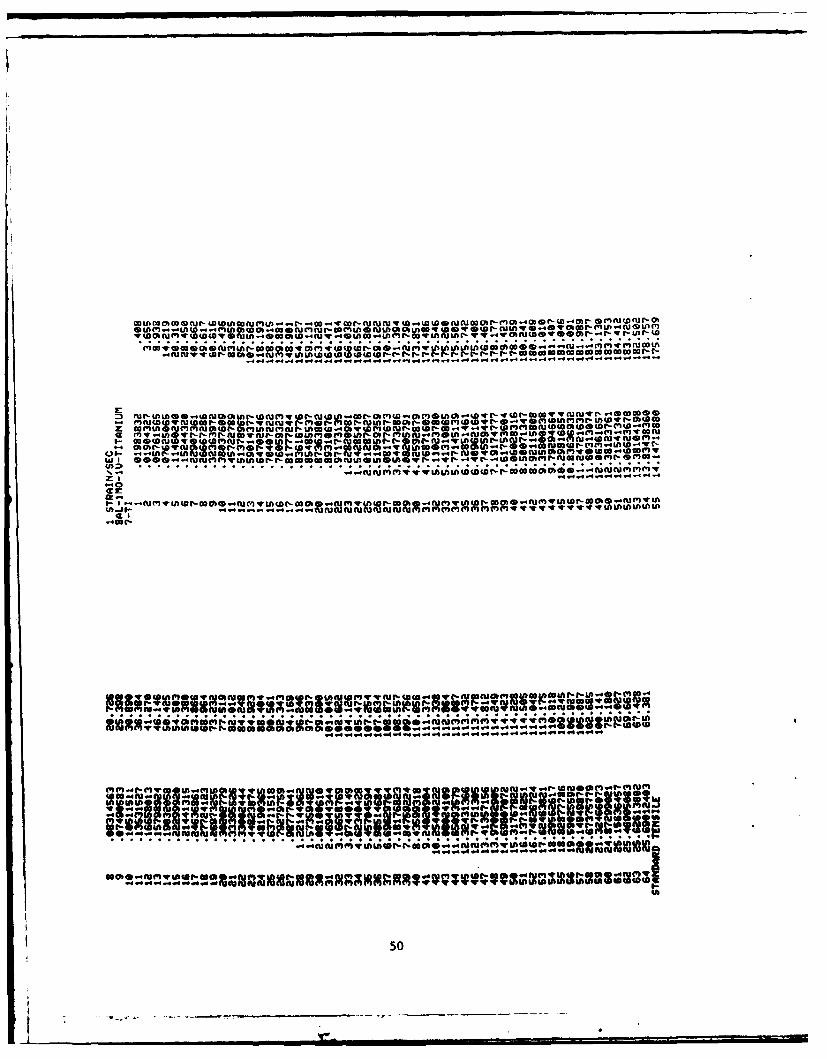
3.2 HIGH STRAIN RATE TESTS
The polaroid photographs of the load-deflection traces
obtained from the high strain rate tests were digitized using
a Hewlett Packard 9800 series calculator and digitizer (located
at the AFML) to produce true stress-engineering strain curves.
Those curves were then digitized on the Tektronix 4 014-1 com-
puter graphics terminal and digitizing board (located at the
University) to produce true stress-true strain curves. A brief
review of the analysis in the two data reduction programs
follows. Details of the theory of the measurements appear in
documents by U. S. Lidom and by Lindholm and L. M.
Yeakley.(7 )
The average stress in the specimen is:
as E (A/As) Ct (6)
17j

where E and A are the elastic modulus and cross-sectional area
of the pressure bars, A sis the cross-gectional area of the
specimen and c is the transmitted wave. Using the assumption
of no volume change after first yield, Equation (6) is modified
to:
GT E(A/A ) F_ 1+ (7)
for true stress.
Engineering strain was obtained from the deflection values
using the following relationship:
E =0.265 6 -0.5 (1l-exp-056
where c represents strain in percent and 6 represents the deflec-
tion in mils between the grips.(5 This equation results from
least-squares fitting many deflection-strain plots from several
different materials. It is particular to the specimen size used,
not to a material.
The yield stress was determined as the point on the stress-
strain curve at which the increase in applied load essentially
ceased. The ultimate stress and ultimate strain were selected
as the final point on the stress-strain curve. Reasons for
this selection procedure appear in the results and discussion
section.
18
-V

SECTION IV
RESULTS AND DISCUSSION
The mechanical properties acquired from the various strain
rate tests on 8A1-lMo-lV titanium and 410 stainless steel appear
in Tables 2 and 3, respectively. Table 4 shows the measured
density of each material. Figures 7 through 10 are plots of the
mechanical properties versus strain rate. The points lacking
standard deviation marks either represent one data point or they
represent averaged data having a standard deviation smaller
than the data symbol. The true stress-true strain curves for
the low and intermediate tests (Appendix A) have two parts to
the curve in the plastic region. The solid line represents the
test data analyzed with the pla'stic region equations given in
the analysis section. Obviously these are not complete for
large strains. The dotted line joins the ultimate stress
(calculated with the final load and reduced cross-sectional
area)-ultirnate strain point to the test curve.
Studying Figures 7 through 10, one concludes that all of
the tensile mechanical properties determined by these tests
vary with strain rat,: with the exception of the elastic modulus
of titanium. Perhaps additional testing of the stainless steel
would reveal that its elastic modulus also does not vary with
strain rate. It is important to consider the coxmments in the
following paragraphs when using the curves shown as data for
calculations.
A very small specimen must be used for high strain rate
tests to satisfy assumptions made in the Hopkinson bar theory
equations. This presents problems in obtaining accurate data
* from the tests, particularly in the elastic region. one problem
is that achievable machining tolerances on the specimen in
* relation to load surface alignment make it difficult to resolve
small strains accurately. Secondly, an assumption made in
developing the Hopkinson bar equations is that many stress
19
* I* --.- - -- ----L------,,--,-** *.-~.
41 4
cd-H () (N (N4 oo r- o m N r- r LA m-H Co W w r 4M LA LA LAML4J 4) ) -1 (N (N r-I -4 r-I4 H -. -I H -H
4J2~ LA oLU-Ll.4 N
r " 4 (DO ch 0 C l .0 w --I qw 00 4)4J4-) 00 (D o)cooo (y o o LA LA UHCI4 En N (N4 H -4 Hl Hq 0) 1 - r4
HD 4)
00
-4w
0oCa~~1 OnM0 ~ 0 0
Do 0
E-1. U) 00
0 4) 44
0U .0
LAN0 C O C 4)4Jg -L.
.0
100
U) 4)H 0 £0
'u
o) 0% Lo 't'Co O -(
0
-4r
00-4-4-40000H 4 --4 04 mO V O % - E- - r
200

Q) 4J
0 -H Q N m 0N w LO w D v %0 w N 0
-1 ~ ~ D t4 r o Lo tO('m m~ L ~f~ -w 1 9 * *k4-)4) r4 C4 04 (N 04 (N N (N (N C4 -I H- r-
4-) 0)-co ?A -4q c %4a rn mN r,( ( N LA ~r, LAO a w5 0) Ul . . . . .J .
E-4N H- 4.) CDN C).2 r- 00% 00H000 0 N e n (4)
(12 ,.4 (/) N C ( -4r- H r- H H4H H4 H H4 41)
'(4zN
10-4 %( ( D ~A ~ 0 0 0-
(14 -W IV -0 r, r- ON WO Hi 10 ( 4 H4 44J 0 0coCo0 00 0 Ch ( 0 N N4 M~ (N (N 4-)
H 0)
0~0D4
p4 -4 4
440220
HH H HH H 0
E-40
0/ 0 4J
%4 0 r- 4
r 10200 4-
a) 0
HOH~~~~4 (N()M ( N N N (
o4 -4 1- iHi 00w0 C 4 40 0 0 4 ( )0 0 0$
w to IN). .- 0Go w) a m "T -4
40
212
TABLE 4
DENSITY
Material Density
8A1-lMo-lV Titanium 4.32 g/cm 3
410 Stainless Steel 7.57 gm/cm3
wave reflections occur in the specimen before a state of dynamic
equilibrium exists. This does not happen until some plastic
deformation has taken place. In addition, once necking occurs
in the specimen a uniform stress field no longer exists making
the equations for stress and strain invalid. This is a signifi-
cant factor for the small specimens.
However, the split-Hopkinson bar apparatus represents
the state-of-the-art technique for obtaining stress-strain
information at high strain rates. The curves are considered
most accurate in the range of 2 to 10 percent strain. The
yield stress values reported represent the point on the curves
where the load ceases to increase significantly for a rather
large increase in displacement. (The 0.2 percent offset method
obviously cannot be used because of the lack of data in the
elastic region.) The ultimate stress and ultimate strain values
from these tests were the final point of the curve. Although
the values front the iiigh strain rate tests cannot be used as
exact data points they are useful in establishing the trend
of the strain rate dependence of the subject materials over
nearly seven decades of strain rate.
22

(M .2 0o0
0W Z
4
0. 4-)
IJ >
U,
T
-0
44
52-
(ISd ,oi x) srninaov4 S. ONfloA
23

N4,
w
)>
Z (oW
U)
w vo
0 a cc~z >
44
>C' 2
0 0 0
24z

Ecg
0
0 c0
-j 0 06-4
ow21
I-cc) (1
252
VW4
c
0 40
ODU)w Z:
0 41
4J
- 4J
0z )
54
0 w0
0 0
(±N3383d) NIVNIS 3J.vcb iU.n
26
REFERENCES
1. Mardirosian, M.M., "Strain Rate Effects in Brittle and ToughMaterials," AMMRC-TR-74-34, December 1974.
2. Green, S.J. and S.G. Babcock, "Response of Materials toSuddenly Applied Stress Loads: Part I: High Strain-rateProperties of Eleven Reentry-vehicle Materials at ElevatedTemperatures," TR66-83 Part I, November 1966.
3. Eleiche, Abdel-Salam M., "A Literature Survey of the CombinedEffects of Strain Rate and Elevated Temperature on theMechanical Properties of Metals," AMFL-TR-72-125, September 1972.
4. 1977 Annual Book of American Society for Testing and MaterialsStandards, Part 10: Metals Physical, Mechanical, CorrosionTesting, pp. 154-173.
5. Nicholas, T., "Mechanical Properties of Structural Grades ofBeryllium at High Strain Rates," AFML-TR-75-168, October 1975.
6. Lindholm, U.S., "Some Experiments with the Split HopkinsonPressure Bar," Journal of the Mechanics and Physics of Solids,1964, Vol. 12, pp. 317-335.
7. Lindholm, U.S. and L.M. Yeakley, "High Strain-rate Testing:Tension and Compression, Experimental Mechanics, January 1968,pp. 2-9.
27
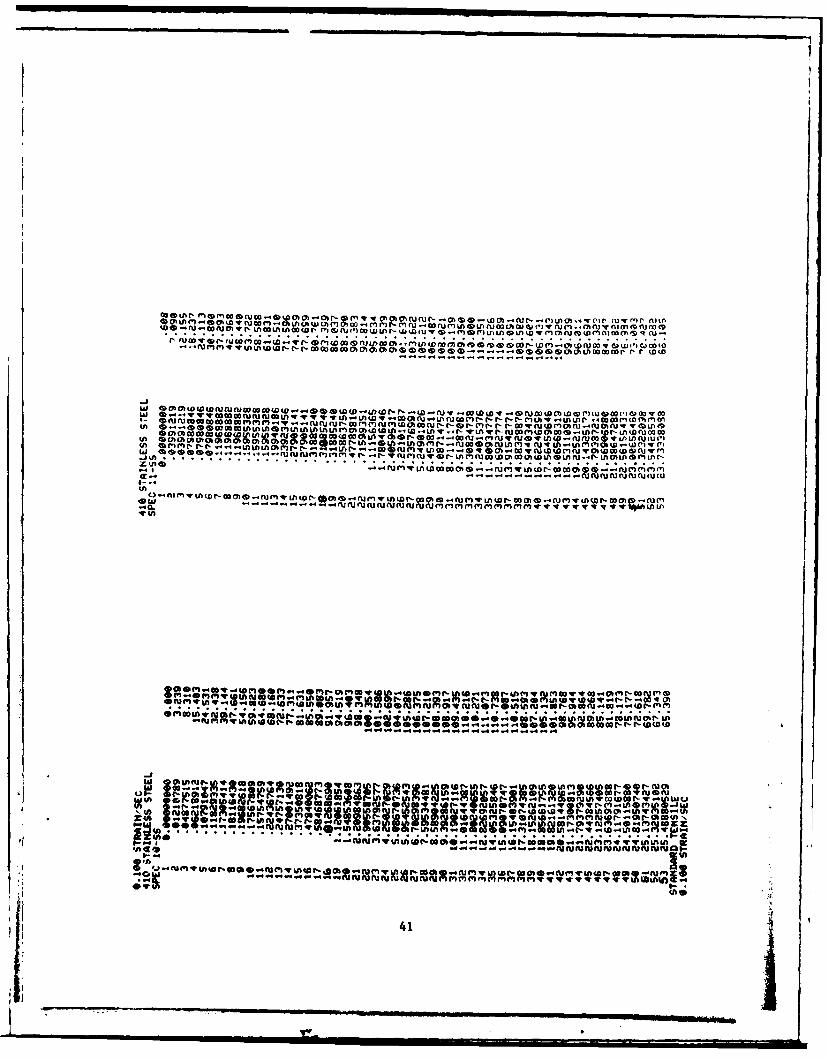
APPENDIX A
LOW AND INTERMEDIATE STRAIN RATECURVES AND DIGITAL DATA
28

WE4 - -- 1.44.
MUJQZru~~w,* UNo.wm ~ ~ www wwo mmm .r.W
LA( Ac n hc omwwo - F.- W " Nm t w
Ch~r 0000w w~~w m4arrh1 ! l fi 0 0!ii~5s- C 3U r? - .4% 11 P: W~0! M IT
SMmmv.S~ nwOOh q anpm .o
_FAISII MINw ;M =pan=h IM n . *,r-do IVuwhfi0J3
. ... . . . . .-- m
N"gool.A
Lou m ~ q& v AN f Mwh~-S Nv
29*lC~blm- MDj;b LM ii
-wo t-MM r ru MG-tI
L~f.I r l:ow0 l...qNOfl l~r (3h (Dw~r~ wo0q.Iwr~- nmoo ch', onJ~ ii wo v lO v wkui',chfawor fnmrWs o FAioruflwuvpo~ nm
~~~OoO~cow '-r WW -MM mommmm mmm Chou
Wu ' M W U ~m~wr'McW t'nWOO~r M W WO -0 Nw o y 0D-..J W Q Q -mclQ W m-t*r u tnjm-o I
.,'~~~~~~~ .. .- .. .. .- . .U .U .U .U .U .U .U .U . . .h . .. .( . . . . . . ..
MPM~mn q-~-~ V' eL l _ r'Lw
w ~~~- - - - - - - - -4 UNC l u() ne np -
MMI MIa.",w WO wr CU Mnrcoc l~aoww alvumna.
Y~n~nWW~n~n~n~g~.*C~*S~~ .- - - -k -U - -M - -M M -M-
V0 v a InMl LA Ml M 'w r- Ir A LA MA LA 'A to C~ Ir
wwm ux or CA c%30A~
lie V __M.wa o Mw

ch.- m m v I n L Lf n ciW 00 m 01 NW 0 as r-a 0- 0; W f ft) r' rn meD ch Il w (10 r- 01 EU) -1 aw r -N0 00 LA P04 (U rn 4 0p in 11
ODOWWa;Z -OOu f m m v k~ r f*In01WE~nj~mm01jmw~rlJW~u..- --0MW-1~ - - - - - - - - - - mo-womWWW~wuWw-. Om onmq~towr' r~~' 00 M'rn 000VWEQWLEM yW mO-U0
WWNNWW001001011011011OtOO100100101.4 OO0101wW-W ('- I')
* W e n. -0OW~W001.W N EU WQ N m (n~'? N W mN - 'I WEU t') ((1 f' ('110- I'l W W EUW (
N)WN WZEUI mI' mow ruj' mw m mUW m mW W t W m 0 S ru Wm (nfnIUw I m h o o(DIO r - , .WLEU1WfJWOIW01000U01-.m .- WEQj' ru ru ruu~' rumm 4u cuWO~ fuF 4404 r urur
( n
E Jsgv-00-r cc...E mgmWnOeO.m W O) 4Ep UWI e010..EU'WLW( 0 0 (.U L WrWm DLntr W0
A(WON1U ?I04W-"
--------- ----- -------
-Jw
W01W WW~l0E1Inf59N -WOvnwmm0(a,-r-( W CUQWWm
VWor OUftIW(*u? .01N r- O~ WM(X MINOO@ W1N0EUW
gWW2n WNN-Um 40mgf AMIRTOO~St"MM ~ wrSO NAM mgicVOO0 tvwooIMMOWU~~~~*( &cumUU S U..tA~M
u;-O~- u; 3; &A kAt Wir:r ;a ;4t 46 ;t WMt0 sWWN czoCKOCM((W 44 ~ ~W 1Z(J
-S-WMVW.WNW 11a.40-Uoe-mm*O ~ ~ qfl 0Imo
31
St-.N no W rMO NO
NWW- M IVf
O NO MW M S M - 'Mo me Inww mw WON
onfl *"omw 2-~n In In Wn I
VWMlM a F=cvkr
R! n! . c! M. w-WHEUM ...... & ;; q.4
-32

Pei
tilt
33INNE

da""
i
10.- 1 1 1
1.-i wm* ofae I we
34
" ' ' I I . ... ..... . . . . .. . .

3U
3U
3
6-
z
W4S.4SI-i
3U
3
3
2 3 2 2t 3 3
-. 3w *6-mm.aeewe...,
35
Zw:UJ Lj
EA o
I' (1.u
P.- a nI-a n4
*~I *~~t36

L'
'' I
I. •
\r,
n*
-- -- ----
- f,
0.fm "@-&wo wo
\ 37
n\
- 02.=
\ 0
37l
nw
$-Now
I I II II I I I 1. .
I,
/38\ 7
\ 'U
-- J~u0
,..-,.-., , \0I'- • La
., ,,-,0\5
\0
\ ,,
38
4-* -. -- -- -- ---------------- - - - - - - -- - - - - - - -4 -4 .-- - - -4
~W~02'O)O 1'c~'.& -)
rdflW~ M~ mmftW r'-r' to r--r W004 llpm
(two I<E Lw
- 'C .
Mflq-*-I Ilr1- OUnsiv &wo v omo W WWMWM.
0-00m r1 dum 9 rfrrou OCII m- n0fnj(-
I~r rU IM qr-n. r-' r
14~~i In
MWIl
r- m
r.~3 1 M0 a-ccIeua
~ wwWWMMM
ru O.MWMMmr- Gwwc' -m)I- 0-M V WW o 4-..o W M., rt'
4u 0cow uI- w S .W e n ; c vi nu.-.00 IQ ~ ~ .( NWfugla-LUWLUft-l- LA AAO LM CM liAMAIW m6WWiIWU NITAU 0~Ufi*1~ C ~ ~ .. WfI
w.-.i. O~ W~vWWN MW4WMWWWCIWMWWL .6 .
I- j. . . . . . . .t
-~~ - --~W4.. - 4-..-..-.-.- .m rEulurumfl"ntucfi
0O ) (v 17
LAZO Q w fr-eU)LA- ok Vwar-wm~q ~ 0WO -IM Ma nqr r-~ (M0 ow- n qIs A -0oe uI v LoJr COM CIPAI u0 Z.LAC Ok .44Wvvwk 0 VOS( Ok. Dq qr . ola-a WT ~ OW h(1U I11C
f PA.. 0 i " m, 0 W runaoot U0 All~-o- M
.. ~~~~"i -I r -).fJ~nr f0)0 OVIC')-mA6*rM M.tfAusimn
f~rdASM fi V , ; r- ! ?a40
t._D DIM.- -~M01 --.W f--M - -
4DL~l M M CO fp w -! %aa, mr-n v wmcn rurr- (P~ ;W0,;(Ur,7. ,I pO~-Tr~ C~rnrnl1
W OOfJUN-O O ll-AU .t'I Wr)'fI
in ~ ww w ww o VOUOO~OO V~ V~O V O W-n- -CON -N M r- W 0 -r MO( Winr -R~n4ipOW~WW'
tn w ew wm wm wo "v -Ln w .r- .mm wz m w 0 w w r- -. i r- m n c- r- - co v m w m mi mM - mI mU mI vU vU RI (
fte- r .40 Cc
ow - -- - -mNM w -u - -- n--
4.r 00 -cu~ u (U in NW 0 4 bO
~m m w w I'momm &*sW 00 00 -n -lWI4 ~ i-R
w OWMMA m *-i -i n- t -- nN.w--.q ,...... DEP H M WQnh rW *.in~ m~qiiPI I4Ivfu 0M I
1! : --
41
VWU
I- 2 of we I wo I
42 i -
I
I I 3 1
42
J i i _ _ _ _ _ _ _ _ _ _ _ _ _ _ _ _ _ _ _ _ _

II
2n
zzz
IU
43
Iq
dI I
43
2j0
2Oh
zz.-IaJ..4
£UI-I 0
U
0
3 3 22 £ 1 1 3 S
,.~w 0~EW0SIhgVh.,
44
I. El.
4 n
ww-Lj 4'
4-. -TI
rr
454

w ww
m 1) I-ca w u)
z w Q(E \U j
II I--zQ fu)
I- ... fl46
-4D
I-- j -lz f- -
I L
<X -WL) I-
0 n;
0;
JC
4.7

LAWuw~ v wQWrODt ONO~ WwVWr111
OW 0 711 1 ! i:0' A r M W0! qOD r ti! 1 -Wh ni r! W'tfIrl(
&MOM Wm Nr MVVIALAM o-
C_ wM ML U) iflJW!(MU 0 0 v*w m -&r- w w OLDU(1 w
(nu) v -mMOm mqurww v'~ 0Q,-0C M I) r_ 'w.27 w w-Dvo w,- m w .o m mCr- ma coo r- vu rum -u 0U mU 0 010 w - 0U ,-( -q(1 oU A; rn
MV-nwImbmflwmWWWWWCoWwwmwm-e r'c kr-r 'omrmm nAv of, - Coco
.wwv-m*q crw OMMqww.-q 009 M M
'Woww wwr)M'mo NNW-,00 MLMWW WOZr' donjv w
Oor-r-wck'cu r~ w~ vCr~rV wn 01J)(DL0U-. r' woo wta"D 00we u'r -. WWOO %Z
M ~ ~ ~ ~ . C.r OI W..D.Q WM-
Aj" LA f W OV A r *i.1'4~'Or-~qA rC~*Wo .1lU t-O U Q Mt w r.-
q MCO MI -lt -- -'~t W C~ L W
'a UM mum uloLC49- uv~~r48rq
O fgU-I.. ub.,J-420 "CM" v V LA4. WW W O - .O Ube] -0L W.4.4-4lf- -CNO
MIA MO W04D 0 flJ@WW-W . -
rujcw WWW4M~x4 OO*SUe Lam-JmNwWMw~0. -'. a~9 cs 1 W~ I- OUt',rD-'Dcuc' cu 2W *W. 40 00- 1
-~qq o -. ewwte
r .44..44.. tvna vvn mvwwa '.0in "M ( A c Z '-4
MUM~ p4 OW Co
M v, It' , I WWWC!,V? . rv . 0!. p. . . .-"C C M V l i fA ,co a e 0 C cu u w wr W I M S 0 . mm- v %IScccctdcrcca -
I- LI
Mflwwmo( m oWW w4@ mi.400w wWA, r .0n0 mwamciUngw,-ww-rsr-ca uuq r4hU 00 O F- M wO0
Cc 40000nfohO00Oh0h M4WntuO Wr- Oh0.4ovwnqcu M4w c U ,v inin- r) en 0 w ob 0.4r(nop 'mI.- W4W04ml . U W n n n i i i i F . - - -( - - - -F-F-F-F-00000 00000000F-F
h-~~~- UU M OhW(WWOiOMUF.4OIO-4OIz ohh-n( hiM -M-4 FF .)- 4W UFWF O M(W U(0.
"-I0
a I
................................... .
~r-r-lin as
.D . ....... ........ . .U4A4 .4 . . . . . . . . . .
."-ICU cI')f v~A-Oh totooM d. 4 -I O~
~ P144so
51
- -- --
0
40u
wi IA.J- tn
a Ow4
I-l -iUU5-
fu(J
Vol 0
C
U.U
-No=-
op1
t9
fu
.jS
w0
uAJ u
l 0j w
6AX4-LK . (
ab Or .o-
Ln If 0
0;
1.1
f'r., a 0
act-
Cl oc(A L
lox
no
Ji --
II
zu,-/
O,, Ii
I ,,.Il-,
56
U-i
APPENDIX B
HIGH STRAIN RATE CURVES ANDDIGITAL DATA
57
l-4

. . ... .
I. . .
1111 iNiiI - III- 1II II i -
......... ........ ......... .. ..... . ..........
I-- - -
58
________________________________ ________________________
&I Ifi iffliiffiI2 l 'isi
1! 2I
V.wt.. , m . , 0,"-...
ma !Etrii'-
. .u~~ish .. .......................... ............-memeegq.... .... ,, ... +....
+ tI
eI a. ;*El ~ ~ ~ ~ ZO irnasuu w UefEE
59
60
3*
II
3U
101 .4- I
I
1~
p - p p 3 r
*3.3 3.3. q q 3 3
4 1 3 Iii'
S-Saw *~muS.u*mI
61

JIM.4
HI- !
4
l laad
"nol ""l UM* I mo a
623 £ i
.41P' l mR -1 t -t. 0 t
.iII
3
*igm
63
M I I I I I I

I
3
i
3U.4-
1!j =
3U
3S; q 3 S q q 3 3 q
1 3 8 Ii
s-maw S..SwS.sw..ue
64
I _______ _________0
II i i i II3
I II i • i I il 3
3
!
i lJ 3
prE .4
Iii
iE ,It
tI
S" i i i i ai .
65
i.
ini
"-i n I.• I •
lii 1
3U
g 3 a
66

3i
3i
S _
.4-
Iiii: .4
3U
3
p p p qS
q q a S q a4 3 3 S
~.S3w S.SMSgWS.41
67
, . I - --
I3
q3
2
*31iii.
.43S
3
p p 20
i q 3 3 3 qa 4 i *
.*3u S.muw~,uS~s
68
Is-- - 7LA _____ - - - ----- '---~.--- ___ -
a