Embed Size (px)
Citation preview

UCB Inspired by patients.Driven by science.
9 month interim report
Brussels, 20 October 2017

9M 2017 reportDisclaimer and safe harbor 2
Forward-looking statementsThis presentation contains forward-looking statements, including, without limitation, statements containing the words “believes”, “anticipates”,“expects”, “intends”, “plans”, “seeks”, “estimates”, “may”, “will”, and “continue” and similar expressions. These forward-looking statements are basedon current plans, estimates and beliefs of management. By their nature, such forward-looking statements are not guarantees of future performanceand are subject to known and unknown risks, uncertainties, and assumptions which might cause the actual results, financial condition, performance orachievements of UCB, or industry results, to be materially different from any future results, performance, or achievements expressed or implied bysuch forward-looking statements contained in this presentation.
Important factors that could result in such differences include but are not limited to: changes in general economic, business and competitiveconditions, the inability to obtain necessary regulatory approvals or to obtain them on acceptable terms, costs associated with research anddevelopment, changes in the prospects for products in the pipeline or under development by UCB, effects of future judicial decisions or governmentalinvestigations, product liability claims, challenges to patent protection for products or product candidates, changes in laws or regulations, exchangerate fluctuations, changes or uncertainties in tax laws or the administration of such laws and hiring and retention of its employees. There is noguarantee that new product candidates in the pipeline will progress to product approval or that new indications for existing products will be developedand approved. Products or potential products which are the subject of partnerships, joint ventures or licensing collaborations may be subject todifferences between the partners. Also, UCB or others could discover safety, side effects or manufacturing problems with its products after they aremarketed. Moreover, sales may be impacted by international and domestic trends toward managed care and health care cost containment and thereimbursement policies imposed by third-party payers as well as legislation affecting biopharmaceutical pricing and reimbursement.
Given these uncertainties, the public is cautioned not to place any undue reliance on such forward-looking statements. These forward-lookingstatements are made only as of the date of this presentation. UCB expressly disclaims any obligation to update any such forward-looking statementsin this presentation to reflect any change in its expectations with regard thereto or any change in events, conditions, for circumstances on which anysuch statement is based, unless such statement is required pursuant to applicable laws and regulations.
In the event of any differences between this Presentation and the Annual or Half Year Report, the information included in the Report shall prevail.
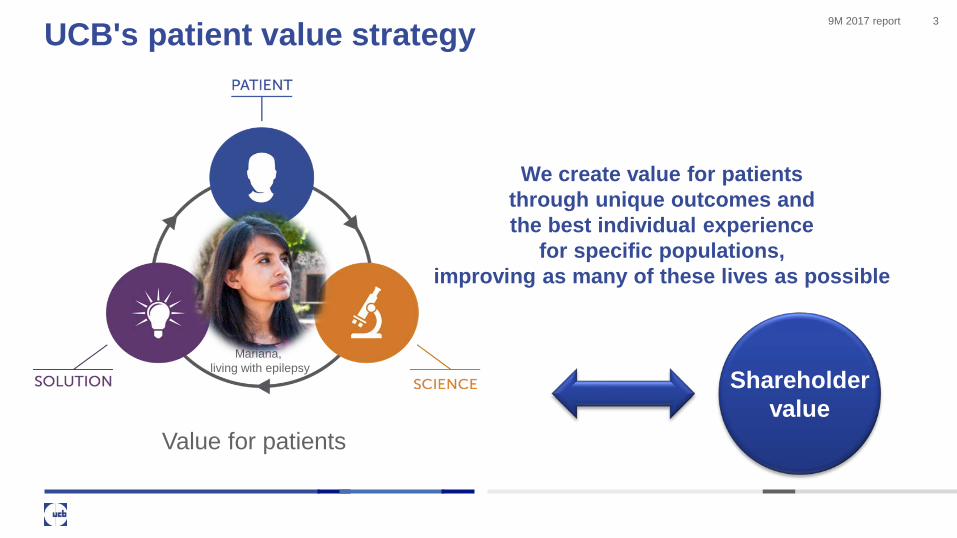
9M 2017 reportUCB's patient value strategy 3
We create value for patients through unique outcomes and the best individual experience
for specific populations, improving as many of these lives as possible
Shareholder value
Value for patients
Mariana, living with epilepsy
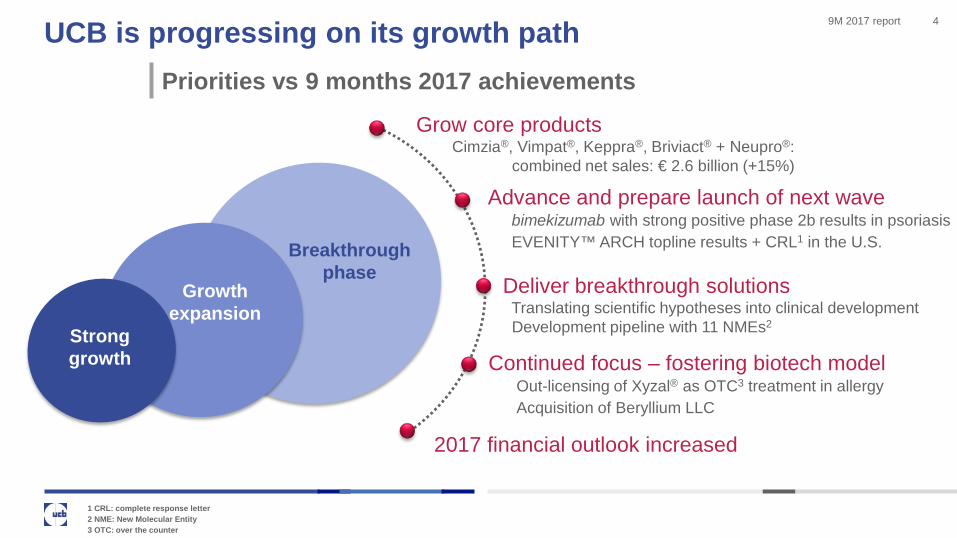
9M 2017 reportUCB is progressing on its growth path 4
1 CRL: complete response letter2 NME: New Molecular Entity3 OTC: over the counter
Grow core productsCimzia®, Vimpat®, Keppra®, Briviact® + Neupro®:
combined net sales: € 2.6 billion (+15%)
Advance and prepare launch of next wavebimekizumab with strong positive phase 2b results in psoriasisEVENITY™ ARCH topline results + CRL1 in the U.S.
Deliver breakthrough solutionsTranslating scientific hypotheses into clinical developmentDevelopment pipeline with 11 NMEs2
Continued focus – fostering biotech modelOut-licensing of Xyzal® as OTC3 treatment in allergyAcquisition of Beryllium LLC
Stronggrowth
Growth expansion
Breakthrough phase
2017 financial outlook increased
Priorities vs 9 months 2017 achievements

9M 2017 report9 months 2017 key financial highlights 5
On track to deliver FY 2017 guidance
* 2016 figures have been restated reflecting IFRS 15 implementation in 2017Numbers may not add due to roundingCER: constant exchange rate
€ million 9M 2017 9M 2016* Actual CER
Revenue 3 331 3 042 9% 9%
Immunology / Cimzia® 1 022 927 10% 10%
Neurology 1 601 1352 18% 19%
Vimpat® 707 586 20% 20%
Keppra® 607 538 13% 14%
Briviact® 57 11 > 100% > 100%
Neupro® 230 217 6% 6%

9M 2017 report
Translating scientific hypotheses into clinical development6
1 APDS - Activated PI3K Delta Syndrome2 MG – myasthenia gravis
bimekizumab (IL17A/F)
psoriasis
psoriatic arthritis
ankylosing spondylitis
Phase 3 start: end 2017
Phase 2b results: Q1 2018
Phase 2b results: Q1 2018
dapirolizumab pegol (CD40L antibody)systemic lupus erythematosus Phase 2b results: H2 2018 (Partner: Biogen)
padsevonil (PPSI)highly drug resistant epilepsy Phase 2b start: Q1 2018
seletalisib (PI3K δ inhibitor)Sjögren’s syndrome + APDS1 (Phase 1b) Phase 2a results: end 2017
rozanolixizumab (FcRn)immune thrombocytopenia + MG2 Phase 2a results: Q1 2018 / H2 2018
UCB4144 / VR942 - asthma Phase 2a start: 2018 (Partner: Vectura)
UCB6673 ; UCB7858 ; UCB0159
UCB3491 ; UCB0599neurology
immunology
FilingPhase 3Phase 2Phase 1

9M 2017 report
2017 financial targets
2017 financial outlook 7
…increased cross all key performance indicators…
rEBITDA: recurring Earnings Before Interest, Taxes, Depreciation and Amortization charges* Based on ~188 million weighted average shares outstanding
Revenue € 4.4 - 4.5 billion
rEBITDA € 1.25 – 1.35 billion
Core EPS* € 4.10 – 4.50
Guidance beyond 2017unchanged
rEBITDA / revenue ratio 30% in 2018
'CVN' net sales ≥ € 3.1 billion by 2020
Briviact® net sales ≥ € 450 million by 2026

9M 2017 reportUCB's patient value strategy 8
We create value for patients through unique outcomes and the best individual experience
for specific populations, improving as many of these lives as possible
Shareholder value
Value for patients
Mariana, living with epilepsy

Further factsand figures
9

9M 2017 report 10Strong Cimzia® performance across all regions
Net sales1
R&D milestones
1 2016 figures have been restated reflecting IFRS 15 implementation in 2017 2 nr axSpA: non-radiographic axial spondyloarthritisNumbers may not add due to rounding CER: constant exchange rates
• Crohn’s disease• rheumatoid arthritis• psoriatic arthritis• axial spondyloarthritis /
ankylosing spondylitis
2024 patent expiry (U.S. & EU) 2026 (Japan)
• Astellas (Japan - 2012)• Dermira (psoriasis - 2014)
1 307 million 2016 net sales≥ 1.5 billion peak sales by 2020
Cimzia®
psoriasisPhase 3 results
(Jan 2017)
nr axSpA²Phase 3 results
(U.S. - mid 2018)
CRIBPhase 4 results
(Jan 2017)
psoriasis + psoriatic arthritis
Phase 3 start(Japan - Feb 2017)
psoriasis + psoriatic arthritis
Phase 3 results(Japan - Q4 2018)
€ million 9M 2017 9M 2016 Act CER
U.S. 656 590 11% 11%
Europe 271 250 8% 9%
Japan 25 25 2% 5%
International markets 70 62 13% 13%
Total Cimzia® 1 022 927 10% 10%
CRIB & CRADLEFiling
(EU - May 2017)
JIAComplete
Response Letter (U.S. - Mar 2017)
CRIB & CRADLEFiling
(U.S. - June 2017)
psoriasisFiling
(EU - Aug 2017)
psoriasisFiling
(U.S. - Oct 2017)

9M 2017 report
4.1%
3.0%
3.5%
4.0%
4.5%
5.0%
Aug-16 Nov-16 Feb-17 May-17 Aug-17
Cimzia® RA R3M Patient Share
8.9% 9.8%
17.7%
0%
5%
10%
15%
20%
Anti TNF Biologics Cimzia®
Cimzia® vs. RA Market Growth
10.2%12.9%
6.3%
0%
5%
10%
15%
20%
Anti TNF Biologics Cimzia®
Cimzia® vs. Rheumatology1
Market Growth
5.9%
4.5%
5.0%
5.5%
6.0%
6.5%
Jul-16 Sep-16 Nov-16 Jan-17 Mar-17 May-17 Jul-17
Cimzia® RheumatologyR3M Patient Share
-4.3%
-2.1%
0.7%
-6%
-4%
-2%
0%
2%Anti TNF Biologics Cimzia®
Cimzia® vs. Rheumatology1
Market Growth
Cimzia® in-market performance 11
1 Rheumatology market = rheumatoid arthritis (RA) + psoriatic arthritis (PsA) + ankylosing arthritis (AS) in the U.S. or axial spondylitis (AxSPA) in EU.For the U.S., the Cimzia® and market growth are based on MAT 2017 vs MAT 2016For Europe & Japan, the Cimzia® and market growth are calculated for Aug ’17 versus Aug ’16, the patient share trend is based on R3M
U.S.
+5.0%
+0.4%
Europe Japan
Source: U.S: IMS Source of Business Report May 2017
8.4%
7.5%
8.0%
8.5%
9.0%
9.5%
Aug-16 Nov-16 Feb-17 May-17 Aug-17
Cimzia® Rheumatology1
R3M Patient Share
-0.1%
Source: IMS MIDAS - In-Market KPI’s are based on Exit Patients (Aug 2017)
+8.8%
+0.3%
Source: IMS MIDAS; Cimzia® patients are considered 100% in RA - In-Market KPI’s are based on Exit Patients (Aug 2017)
-3.9%

9M 2017 reportVimpat® performance 12
Robust growth in all markets, launch in Japan
1 2016 figures have been restated reflecting IFRS 15 implementation in 2017 2 POS: Partial-onset seizures, also known as focal seizuresNumbers may not add due to rounding 3 CHMP: Committee for Medicinal Products for Human UseCER: constant exchange rate 4 PGTCS: Primary Generalized Tonic-Clonic Seizures
epilepsy POS2
2022 patent expiry (U.S. & EU) 2024 (Japan)
Daiichi Sankyo (Japan -2014)
814 million 2016 net sales> 1.2 billion peak sales by 2020
Vimpat® Net sales1
R&D milestonesepilepsy POS2
pediatricFiling
(U.S. – Mar 2017)
epilepsy POS2
ped. adj. therapyPhase 3 results
(Mar 2017)
epilepsy PGTCS3
adj. therapyPhase 3 results
(2019)
€ million 9M 2017 9M 2016 Act CER
U.S. 540 446 21% 20%
Europe 128 111 15% 16%
Japan 8 3 > 100% > 100%
International markets 31 26 18% 15%
Total Vimpat® 707 586 20% 20%
epilepsy POS –pediatric Approval
(EU - Sep 2017)
epilepsy POS –monotherapy
Approval(Japan - Aug 2017)

9M 2017 report
3.3%
2.5%
2.7%
2.9%
3.1%
3.3%
3.5%
Aug-16 Nov-16 Feb-17 May-17 Aug-17
Vimpat® – R3M TDx Share
4.1%
3.5%
3.7%
3.9%
4.1%
4.3%
4.5%
Aug-16 Nov-16 Feb-17 May-17 Aug-17
Vimpat® – R3M TRx Share
1.5%
10.1%
0%
5%
10%
15%
20%
AED Market Vimpat®
Vimpat® vs. AED Market Growth (TRx)
7.4%
0%
5%
10%
15%
20%
AED Market Vimpat®
Vimpat® vs. AED Market Growth (TDx)
0.6%
15.1%
0%
5%
10%
15%
20%
AED Market Vimpat®
Vimpat® vs. AED Market Growth (TDx)
Vimpat® in-market performance 13
AED market: All molecules in ATC3= N3A + Phenobarbital in N5B. In Europe and Japan, the TDx of all these molecules are factored for epilepsy usage. In the U.S., the TRx of 26 of these molecules are factored for epilepsy usage.
U.S.
+8.6%
+0.3%
Europe Japan
Source data U.S.: U.S. IMS NPA - In-Market KPIs are based on TRx
+14.5%
+0.4%
Source data EU: IMS MIDAS - In-Market KPI’s are based on TDx
Numbers to be populated when sufficient data is
available
0.57%
0.0%0.1%0.2%0.3%0.4%0.5%0.6%
Aug-16 Oct-16 Dec-16 Feb-17 Apr-17 Jun-17 Aug-17
Vimpat® – R3M TDx Share
Source data JP: IMS MIDAS - In-market KPI’s are based on TDx
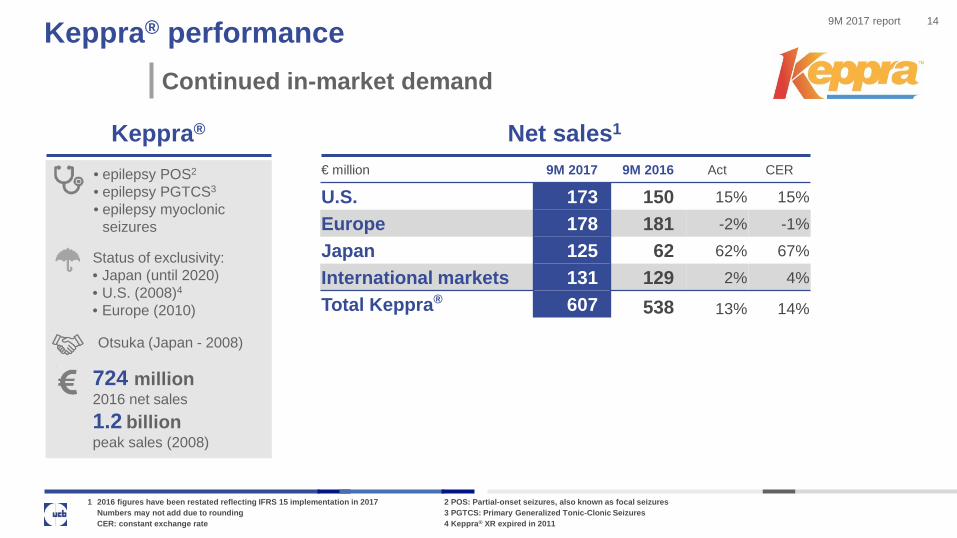
9M 2017 report 14
Continued in-market demand
1 2016 figures have been restated reflecting IFRS 15 implementation in 2017 2 POS: Partial-onset seizures, also known as focal seizuresNumbers may not add due to rounding 3 PGTCS: Primary Generalized Tonic-Clonic SeizuresCER: constant exchange rate 4 Keppra® XR expired in 2011
Keppra® performance
Keppra® Net sales1
• epilepsy POS2
• epilepsy PGTCS3
• epilepsy myoclonic seizures
Status of exclusivity:• Japan (until 2020)• U.S. (2008)4
• Europe (2010)
Otsuka (Japan - 2008)
724 million 2016 net sales1.2 billion peak sales (2008)
€ million 9M 2017 9M 2016 Act CER
U.S. 173 150 15% 15%
Europe 178 181 -2% -1%
Japan 125 62 62% 67%
International markets 131 129 2% 4%
Total Keppra® 607 538 13% 14%

9M 2017 report
12.6%
10.0%
12.0%
14.0%
16.0%
Aug-16 Nov-16 Feb-17 May-17 Aug-17
Keppra® – R3M TDx Share
7.4%
39.4%
0%
10%
20%
30%
40%
50%
AED Market Keppra®
Keppra® vs. AED Market Growth (TDx)
0.6%
3.2%
0.0%
1.0%
2.0%
3.0%
4.0%
5.0%
AED Market Keppra®
Keppra® vs. AED Market Growth (TDx)
0.8%0.0%
0.5%
1.0%
1.5%
2.0%
Aug-16 Nov-16 Feb-17 May-17 Aug-17
Keppra® – R3M TRx Share
1.5%
-12.5%-15.0%
-10.0%
-5.0%
0.0%
5.0%
AED Market Keppra®
Keppra® vs. AED Market Growth (TRx)
15.0%
10.0%
12.0%
14.0%
16.0%
Aug-16 Nov-16 Feb-17 May-17 Aug-17
Keppra® – R3M TDx Share
Keppra® in-market performance 15
AED market: All molecules in ATC3= N3A + Phenobarbital in N5B. In Europe, the TDx of all these molecules are factored for epilepsy usage. In the U.S., the TRx of 26 of these molecules are factored for epilepsy usage. For U.S., Keppra® includes Keppra® XR. For EU, Keppra® does not include UCB levetiracetam.
U.S.
-14.0%
-0.1%
Europe Japan
Source data U.S.: U.S. IMS NPA - In-market KPI’s are based on TRx
+2.6%
+0.1%
Source data EU: IMS MIDAS - In-market KPI’s are based on TDx
+32.0%
Source data JP: IMS MIDAS - In-market KPI’s are based on TDx
+2.9%

9M 2017 report 16
New treatment option for patients living with epilepsy
Briviact® launch
Net sales1
R&D milestones
Briviact®
1 2016 figures have been restated reflecting IFRS 15 implementation in 2017 2 POS: Partial-onset seizures, also known as focal seizuresNumbers may not add due to rounding CER: constant exchange rate
epilepsy POS2 –monotherapy
Filing(U.S. – Jan 2017)
epilepsy POS2
2026 patent expiry (U.S. & EU)
18 million 2016 net sales> 450 million peak sales by 2026
Available to patients in:• Some EU countries• North America
€ million 9M 2017 9M 2016 Act CER
U.S. 40 5 > 100% > 100%
Europe 16 6 > 100% > 100%
International markets 1 0 > 100% > 100%
Total Briviact® 57 11 > 100% > 100%
epilepsy POS2 –ped. adj. therapy
Filing(EU – Jul 2017)
epilepsy POS2 –pediatricFiling
(U.S. – Jul 2017)
epilepsy POS2 –adj. therapy
Phase 3 start(Japan – Aug 2017)
epilepsy POS2 –monotherapy
Approval(U.S. – Sep 2017)

9M 2017 reportBriviact® in-market performance 17
A new therapeutic option in the AED market
AED market: All molecules in ATC3= N3A + Phenobarbital in N5B. In EU, the TDx of all these molecules are factored for epilepsy usage. In the US, the TRx of 26 of these molecules are factored for epilepsy usage.
U.S. Europe
Source data U.S.: U.S. IMS NPAIn-Market KPIs are based on TRx
Source data EU: IMS MIDASIn-Market KPI’s are based on TDx
0.20%
0.00%
0.10%
0.20%
0.30%
0.40%
0.50%
May-16 Aug-16 Nov-16 Feb-17 May-17 Aug-17
Briviact® – R3M TRx Share 0.46%
0.00%
0.10%
0.20%
0.30%
0.40%
0.50%
May-16 Aug-16 Nov-16 Feb-17 May-17 Aug-17
Briviact® – R3M TDx Share

9M 2017 reportNeupro® performance 18
1 2016 figures have been restated reflecting IFRS 15 implementation in 2017 Numbers may not add due to rounding CER: constant exchange rate
• Parkinson’s disease• restless legs syndrome
2021 patent expiry (U.S. & EU) 2024 (Japan)
Otsuka (Japan - 2002)
302 million 2016 net sales≥ 400 million peak sales by 2020
Neupro® Net sales1
€ million 9M 2017 9M 2016 Act CER
U.S. 72 58 24% 23%
Europe 122 118 3% 4%
Japan 26 30 -15% -15%
International markets 10 10 -1% -4%
Total Neupro® 230 217 6% 6%

9M 2017 report
28.8%
25%
26%
27%
28%
29%
30%
Aug-16 Nov-16 Feb-17 May-17 Aug-17
Neupro® PD – R3M TDx Share
6.7%
6.0%
6.5%
7.0%
7.5%
8.0%
8.5%
Aug-16 Nov-16 Feb-17 May-17 Aug-17
Neupro® PD – R3M TRx Share
1.1% 0.6%
6.5%
-2.0%0.0%2.0%4.0%6.0%8.0%
10.0%12.0%14.0%
PD Market PD KeyCompetitors
Neupro®
Neupro® PD vs. PD (KC) Market Growth (TDx)
17.7%
16.0%
16.5%
17.0%
17.5%
18.0%
18.5%
Aug-16 Nov-16 Feb-17 May-17 Aug-17
Neupro® PD – R3M TDx Share
0.0% -1.2%
12.7%
-2%0%2%4%6%8%
10%12%14%
PD Market PD KeyCompetitors
Neupro®
Neupro® PD vs. PD (KC) Market Growth (TDx)
0.1% 0.1%
-2.0%-2.0%0.0%2.0%4.0%6.0%8.0%
10.0%12.0%14.0%
PD Market PD KeyCompetitors
Neupro®
Neupro® PD vs. PD (KC) Market Growth (TRx)
Neupro® in-market performance 19
PD market: All molecules in ATC3= N4A. In the Europe and Japan, the TDx of all these molecules are factored for PD usage. In the U.S., only the TRx of Rotigotine, Pramipexole and Ropinirole are factored for PD usagePD Key Competitors (KC) market: The 8 DA’s (Dopamine Antagonists): Bromocriptine, Cabergoline, Lisuride, Pergolide, Rotigotine, Pramipexole, Piribedil, Ropinirole. In the US, only Rotigotine, Pramipexole and Ropinirole are factored for PD usage, hence the PD market and PD KC market are the same.
U.S.
-2.1%
+0.1%
Europe Japan
Source data U.S.: U.S. IMS NPA - In-market KPI’s are based on TRx
+5.9%
+0.8%
Source data EU: IMS MIDAS - In-market KPI’s are based on TDx
+13.9%
+3.0%
Source data JP: IMS MIDAS - In-market KPI’s are based on TDx

9M 2017 reportEVENITY™ (romosozumab) 20
An innovative investigational bone-building therapy
STRUCTURE, FRAME, BRIDGE and ARCHPhase 3 studies completed
Opportunity to build bone in high-risk osteoporosis patients, especially post-fracture
Uniquely increase bone formation and decrease bone resorption
Under regulatory review in the U.S., Canada and JapanComplete Response Letter in the U.S. (July 2017)
™
Manorama,living with osteoporosis
EVENITY™ is the trade name of romosozumab which has been provisionally approved by the U.S. Food & Drug Administration (FDA) and the European Medicines Agency (EMA). EVENITY™ (romosozumab) is developed in partnership with Amgen globally.

9M 2017 reportTranslating scientific hypothesis into clinical differentiation 21
Bimekizumab
Specific targeting both IL-17A and IL-17F
will improve therapeutic efficacy versus targeting IL-17A alone
IL-17F
IL-17RAIL-17RC
IL-17A
Skin and joint inflammation
Partial blockade anti-IL-17A therapeutics
Bimekizumab complete and specific blockade IL-17A & IL-17F
Innovative breakthrough molecules

9M 2017 reportBimekizumab: Strong positive results from BE ABLE 22
Demonstrates skin clearance in phase 2b psoriasis study
* Affected body surface area of at least 10% and PASI of at least 12
250 patientsModerate to severe chronic
plaque psoriasis*
placebo12 weeks
bimekizumab12 weeks
Up to 79% of patients achieved at least 90%
skin clearance (PASI90)
Up to 60% of patients achieved complete skin
clearance (PASI100)

9M 2017 report
• 159 patients with moderate to severe rheumatoid arthritis
• 44 weeks
• placebo
• safety and tolerability + efficacy of bimekizumab as an add-on therapy to Cimzia®
Add on to Cimzia®
(NCT02430909)
Phase 2a results June 2017
Bimekizumab current development program 23
First monoclonal antibody neutralizing both IL-17A and IL-17F
* Defined as a patient who achieves 90% reduction from baseline in the PASI scoreSource: www.clinicaltrial.gov
• 200 patients with active psoriatic arthritis
• 48 weeks
• placebo
• ACR50 response @ week 12
Psoriatic arthritis(NCT02969525)
Phase 2b results Q1 2018
• 250 patients moderate to severe chronic plaque psoriasis
• 48 weeks
• placebo
• PASI90* response@ week 12
Psoriasis(NCT02905006)
Phase 2b results July 2017
Duration
Comparator
Endpoint
Results
• 285 patients with active ankylosing spondylitis
• 48 weeks
• placebo
• ASAS40 response @ week 12
Ankylosing spondylitis(NCT02963506)
Phase 2b results Q1 2018
Phase 3 to start end 2017

9M 2017 reportBimekizumab Ambition: Complete skin clearance together with profound effects on articular and non-articular symptoms
24
Patient unmet need emerges at the interface between psoriatic skin disease and the debilitating impact of inflammation in joints and other tissues, warranting an integrated resolution of the diverse disease manifestations
Therapeutic hypothesis: Specific targeting of both IL-17A and IL-17F will improve therapeutic efficacy versus targeting IL-17A alone
Bimekizumab: the first humanized monoclonal IgG1 antibody that potently and selectively neutralizes both IL-17A & IL-17F
Clinical experience to date: Psoriasis Ph2b study and early clinical studies in Psoriatic Arthritis and mild Psoriasis support that IL-17F neutralization is differentiating:• Speed of clinical response• Depth of clinical response • Maintenance of clinical response1,2
IL-17F
IL-17RAIL-17RC
IL-17A
Skin and Joint inflammation
Partial blockade anti- IL-17A therapeutics
Bimekizumab complete and specific blockade IL-17A & IL-17F
1. Glatt et al. Br J Clin Pharmacol. 201705;83(5):991-1001.2. Glatt et al. Ann Rheum Dis. 2016;75(Suppl 2):95-95.

9M 2017 report
UCB0159immunologyPhase 1 start
rozanolixizumabmyasthenia gravis
Phase 2a start
Vimpat®
epilepsy POS –ped. adj. therapy
Filing (U.S.)
bimekizumab add on to Cimzia®
rheumatoid arthritisPhase 2a results
R&D milestones in 2017
POS: Partial-Onset Seizures, also known as focal seizures CRL: complete response letterCHMP: Committee for Medicinal Products for Human Use ITP: immune thrombocytopenia
25
neurologyimmunologybone
romosozumabosteoporosis in
post-menopausal women (ARCH)Phase 3 results
padsevonilhighly drug
resistant epilepsyPhase 2a results
Vimpat®
epilepsy POS –ped. adj. therapy Phase 3 results
Cimzia®
psoriasisPhase 3 results
bimekizumab psoriasis
Phase 2b results
seletalisibSjögren’s syndrome
Phase 2a results
Cimzia®
psoriasis / psoriatic arthritis - Phase 3
start (Japan)
Briviact®
epilepsy POS –monotherapyFiling (U.S.)
Briviact®
epilepsy POS –ped. adj. therapy
Filing (EU & U.S.)
Vimpat®
epilepsy POS –pediatric
CHMP opinion (EU)
radiprodil / UCB3491
infantile epilepsyPhase 1b start
Cimzia®
juvenile idiopathic arthritis
CRL (U.S.)
romosozumabosteoporosis in
post-menopausal women
CRL (U.S.)
Cimzia®
psoriasisFiling (EU)
Vimpat®
epilepsy POS –monotherapy
Approval (Japan)
Briviact®
epilepsy POS –adj. therapy
Phase 3 start(Japan)
Vimpat®
epilepsy POS –pediatric
Approval (EU)
Briviact®
epilepsy POS –monotherapy
Approval (U.S.)
Cimzia®
psoriasisFiling (U.S.)
bimekizumab psoriasis
Phase 3 start

9M 2017 report
2018 2019
R&D milestones
nr axSpA: non-radiographic axial spondyloarthritisSLE: Systemic Lupus ErythematosusPGTCS: Primary generalized tonic-clonic seizures
26
neurologyimmunologybone
Cimzia®
nr axSpA (U.S.)Phase 3 results
dapirolizumab pegolSLE
Phase 2b results
Vimpat®
epilepsy PGTCS –adj. therapy
Phase 3 results
bimekizumab psoriatic arthritisPhase 2b results
bimekizumab ankylosing spondylitis
Phase 2b results
Cimzia®
psoriasis / psoriatic arthritis - Phase 3
results (Japan)
rozanolixizumab / UCB7665
myasthenia gravisPhase 2a results
radiprodil / UCB3491
infantile epilepsyPhase 1b results
rozanolixizumab / UCB7665
ITPPhase 2a results
UCB4144 / VR942asthma
Phase 2a start
Briviact®
epilepsy POS –adj. therapy
Phase 3 results(Japan)

9M 2017 report"Biotech model" - partnering examples 27
INN Indication Partner Status today
vedolizumab moderate to severe: • ulcerative colitis (UC)• Crohn’s disease (CD)
Takeda available to patients since 2014
reslizumab eosinophilic asthma Teva available to patients since 2016
inotuzumab ozogamicin(CMC544)
acute lymphoblastic leukemia (ALL)
Pfizer Approved in EU (June 2017)Approved in the U.S. (August 2017)
olokizumab rheumatoid arthritis (RA) R Pharm Phase 3 ongoing

9M 2017 reportUCB HY 2017 financial highlights 28
Core product growth drive top and bottom line
CER: constant exchange rate*one-time other revenue of € 56 million for out-licensing the OTC-allergy drug Xyzal® (levoceterizine)
CER
+10%
+32%+35%
Actual
Revenue• Revenue adjusted for divestitures and one-time revenue*• Net sales up by 10% (+9% CER) to € 2 billion• Net sales adjusted for divestitures +14% (+13% CER)
€ 2.2 billion
Total operating expenses • Overall operating expense ratio improved to 47%• R&D expense phasing
€ 1.05 billion
Recurring EBITDA • Higher gross profit • Improved operating expenses ratio
€ 742 million
Profit of the Group• € 431 million attributable to UCB shareholders (+44%)
€ 451 million
Core earnings per share Based on 188 million weighted average shares outstanding (2016: 188 million)
€ 2.53
+12%
+43%
+47% +42%
+6% +5%
+13%
adjusted
+38%

9M 2017 reportContinuously improved product mix 29
Cimzia®, Vimpat®, Keppra®, Briviact® + Neupro® = 85% of net sales
CER = constant currency exchange rates* Excluding € 8 million hedging
Cimzia® +11% (+9% CER)• Sustainable growth in a competitive
environmentVimpat® +25% (+22% CER)
• Robust growth in all markets
Keppra® +17% (+16% CER)• Driven by Japan, international
markets and stocking effects
Briviact® € 36 million• Solid launch curve
Neupro® +9% (+8% CER)• Continued growth
HY 2017 net sales*€ 2 043 million
(+10%; CER: +9%)

9M 2017 report 302017 HY - Top line growth leads to improved ratios*Sustainable growth and margin improvement
69% 69% 70% 71%75%
FY 2013 FY 2014 FY 2015 FY 2016 HY 2017
60% 57% 55% 52%47%
FY 2013FY 2014FY 2015FY 2016 HY2017
* versus revenue
Gross margin ratio* Operating expense ratio*
rEBITDA ratio tracking towards 30% target
FY 2013 FY 2014 FY2015 FY2016 2018e
30%
21%
18%17%
25%

9M 2017 reportUCB - A global networked player 31
Recent investments and partnerships in technology platforms
The RNA-Medicines Company
Research collaboration for stratified-medicine approach to the development of novel therapeutics for epilepsy
Research collaboration generating unprecedented understanding of the cellular composition of complex tissues, and to assess responses to therapies
Acquisition of leadingcapabilities for proteinexpression and structuralbiology
Acquisition of discovery platform targeting RNA with small molecules
Research collaboration to advance the development of multi-specific therapeutic antibodies in I-O
And "UCB Ventures Fund" to capture external innovation

9M 2017 report2017 HY recurring EBITDA 32
Solid growth - Improved operating expenses ratio
CER: constant exchange rate * 2016 figures have been adjusted reflecting IFRS 15 implementation in 2017EBIT: Earnings before interest and taxesEBITDA: Earning before interests, taxes, depreciation and amortization charges
For the six months ended 30 June Actual Variance € million 2017 2016 Actual rates CER
Revenue 2 230 1 996 10% 9% Net sales 2 036 1 853 10% 9% Royalty income and fees 58 51 14% 15% Other revenue 136 92 48% 45%
Gross profit 1 666 1 424 17% 15% Marketing and selling expenses -464 -448 3% 2% Research and development expenses -474 -458 4% 4% General and administrative expenses -93 -87 6% 6% Other operating income / expenses (-) -16 1 n/a n/a
Total operating expenses -1 047 -992 6% 5%
Recurring EBIT (REBIT) 619 432 43% 39% Amortization of intangible assets -78 -82 -5% -5% Depreciation charges -45 -36 28% 28%
Recurring EBITDA (REBITDA) 742 549 35% 32%

9M 2017 report2017 HY profit 33
CER: constant exchange rateEBIT: Earnings before interest and taxes
For the six months ended 30 June Actual Variance
€ million 2017 2016 Actual rates CER
Recurring EBIT 619 432 43% 39% Impairment charges 4 -11 n/a n/a Restructuring expenses -7 -9 -24% -23% Gain on disposals 0 77 n/a n/a Other non-recurring income / expenses (-) 3 -7 7% 6%
Total non-recurring income / expenses (-) 1 50 -99% -98%
EBIT (operating profit) 619 482 28% 24% Net financial expenses (-) -55 -65 -15% -15% Result from associates 0 0 n/a n/a
Profit before income taxes 564 417 35% 31% Income tax expense (-) / credit -114 -91 25% 21%
Profit from continuing operations 450 325 38% 34% Profit / loss (-) from discontinued operations 1 -9 n/a n/a
Profit 451 316 43% 38% Attributable to UCB shareholders 431 300 44% 39% Attributable to non-controlling interests 20 16 47% 42%

9M 2017 report2017 HY core earnings per share 34
Strong growth of core net profit
For the six months ended 30 June Actual Variance
€ million 2017 2016 Actual rates CER
Profit 451 316 43% 38% Attributable to UCB shareholders 431 300 44% 39% Attributable to non-controlling interests 20 16 47% 42%
Profit attributable to UCB shareholders 431 300 44% 39% Total non-recurring income (-) / expenses -1 -50 n/a n/a Income tax on non-recurring expenses (-) / credit -1 -9 n/a n/a Financial one-off income (-) / expenses 0 28 n/a n/a Income tax on financial one-off income / expenses (-) 0 0 n/a n/a Profit (-) / loss from discontinued operations -1 9 n/a n/a Amortization of intangibles linked to sales 61 62 n/a n/a Income tax on amortization of intangibles linked to sales -12 -16 n/a n/a
Core profit attributable to UCB shareholders 477 325 47% 42% Weighted average number of shares (million) 188 188 0% n/a
Core EPS attributable to UCB shareholders 2.53 1.72 47% 42%

9M 2017 report
590
- -
250 176
75
350 350168
118
29 18
243
368 368 350
176
Liquidassets
2017 2018 2019 2020 2021 2022 2023 2024 beyond
EIB loanInstitutional eurobondBelgian retail bondOther loans
Debt maturity schedule (@ 30 June 2017)35
EIB: European Investment Bank
€ m
illion

9M 2017 reportOne UCB today: A global player 36
Presence in 38 countries complemented by a robust network of partners
As at December 2016
7 527employees
globally

9M 2017 reportOne UCB today: A global player 37
Presence in 38 countries complemented by a robust network of partners
• Atlanta, GA• Raleigh, NC
• 1 143 employees• 15% of global workforce
• € 983 million • 48% of global sales*
U.S.
• Tokyo• Saitama
• 405 employees• 5% of global workforce
• € 177 million• 9% of global sales*
Japan
• Braine-l’Alleud & Brussels, Belgium
• Monheim, Germany• Bulle, Switzerland• Slough, U.K.
• 4 352 employees• 58% of global workforce
• € 629 million• 31% of global sales*
Europe
Net sales
Major sites • Shangai & Zuhai, China
• 1 627 employees• 22% of global workforce
• € 255 million• 12% of global sales*
International markets
Employees
* Net sales before hedging

9M 2017 report 38Stable shareholder base with free-float of 60%Weighted average shares outstanding in 2017: 188 million
“Free float” investors by region
Source: Notifications and UCB underlying ownership analysis

9M 2017 report 39
ן Antje Witte, Vice President Investor Relations• Phone: +32 2 559 9414• E-mail: [email protected]
ן Isabelle Ghellynck, Director Investor Relations• Phone: +32 2 559 9588• E-mail: [email protected]
ן Nathalie Deldime, Investor Relations Manager• Phone: +32 2 559 9291• E-mail: [email protected]
ן Check out our new IR App – stay tuned wherever you go
Your UCB Investor Relations team