Embed Size (px)
Citation preview
Simon Wainwright, Head of Retail Insight June 17
UK Grocery Market Update: BFFF
Insight from IGD: Retail Analysis and ShopperVista
© IGD 2017
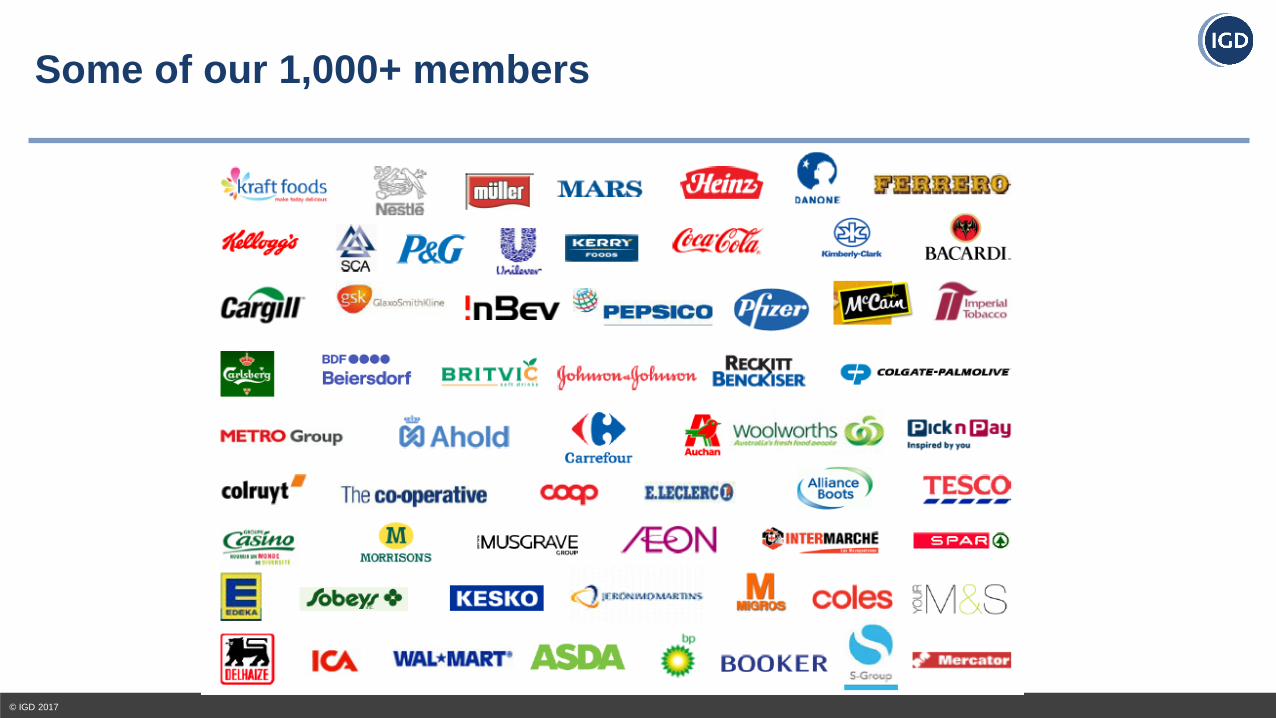
IGD – What we do: Delivering insights and best practice
© IGD 2017 Page 3
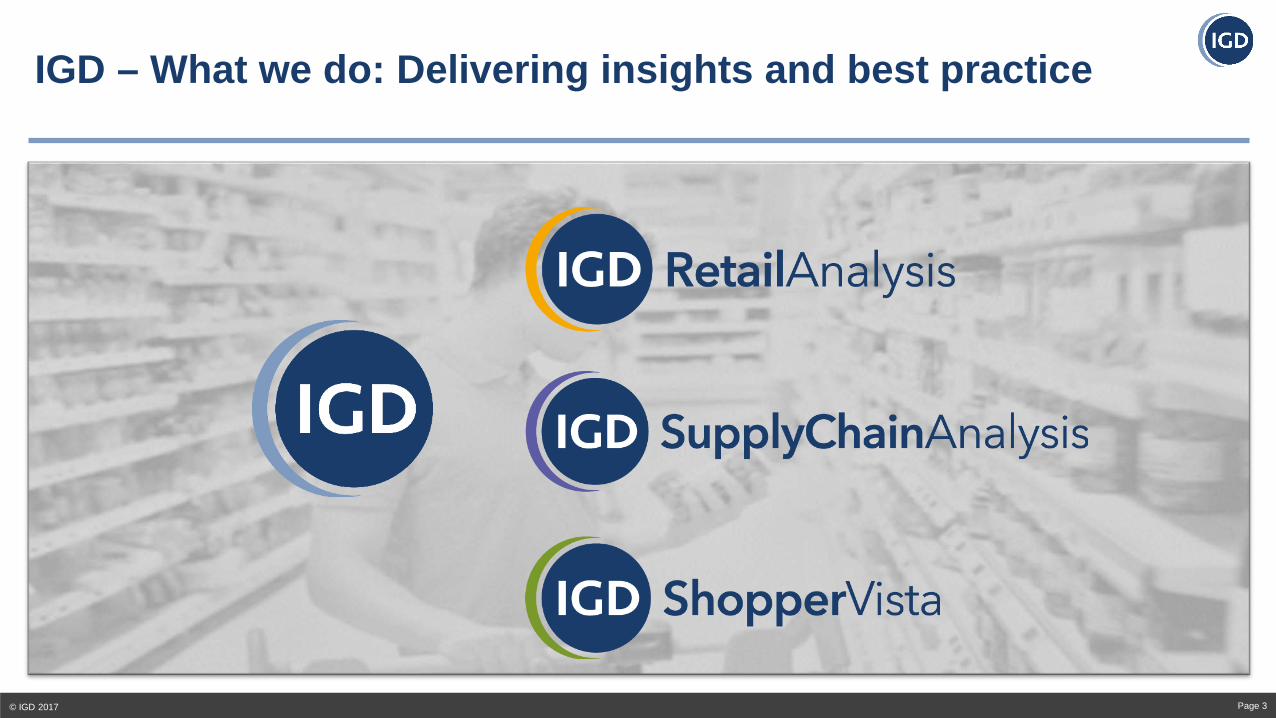
Contents
© IGD 2017 Page 5
Shopper Confidence & Inflation
Grocery Shifting Dynamics & Channel Implications
Future View
Challenge 1: The economy and the impact on cost of goods
© IGD 2017 Page 6
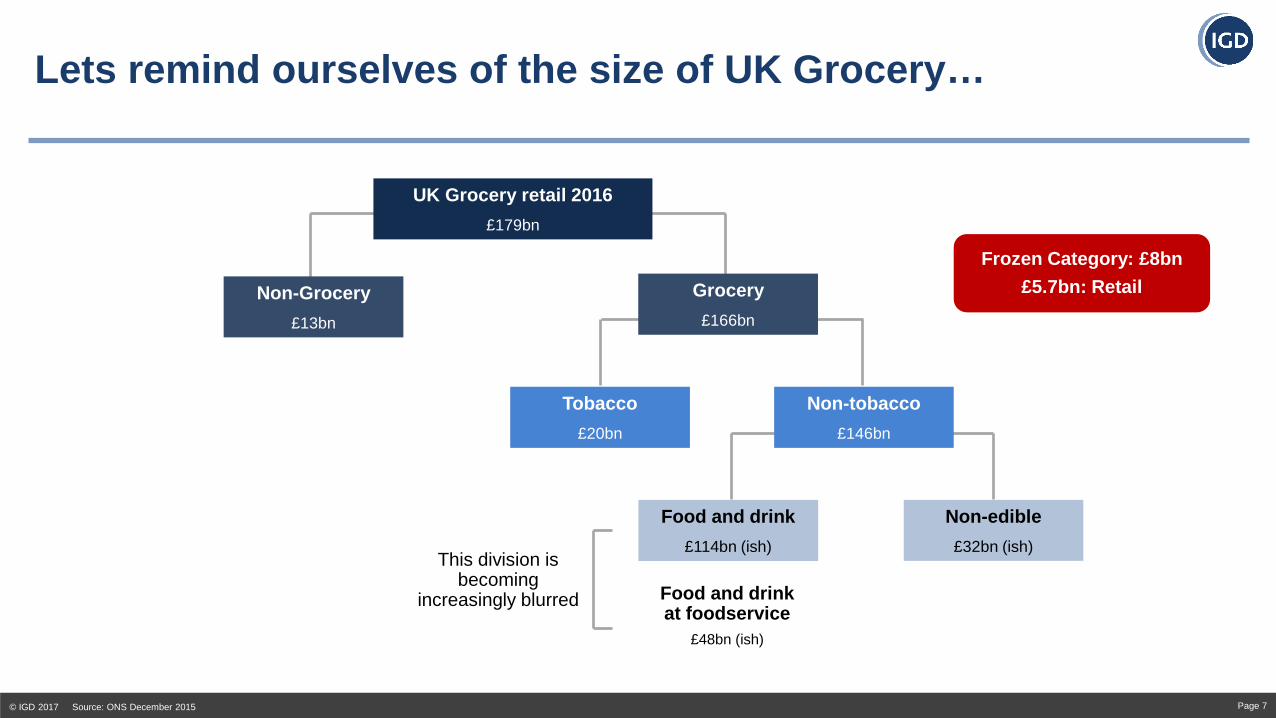
Lets remind ourselves of the size of UK Grocery…
© IGD 2017 Source: ONS December 2015 Page 7
UK Grocery retail 2016 £179bn
Non-Grocery £13bn
Grocery £166bn
Non-tobacco £146bn
Tobacco £20bn
Non-edible £32bn (ish)
Food and drink £114bn (ish)
Food and drink at foodservice
£48bn (ish)
This division is becoming
increasingly blurred
Frozen Category: £8bn £5.7bn: Retail
370000
380000
390000
400000
410000
420000
430000
440000
450000
460000
470000
480000
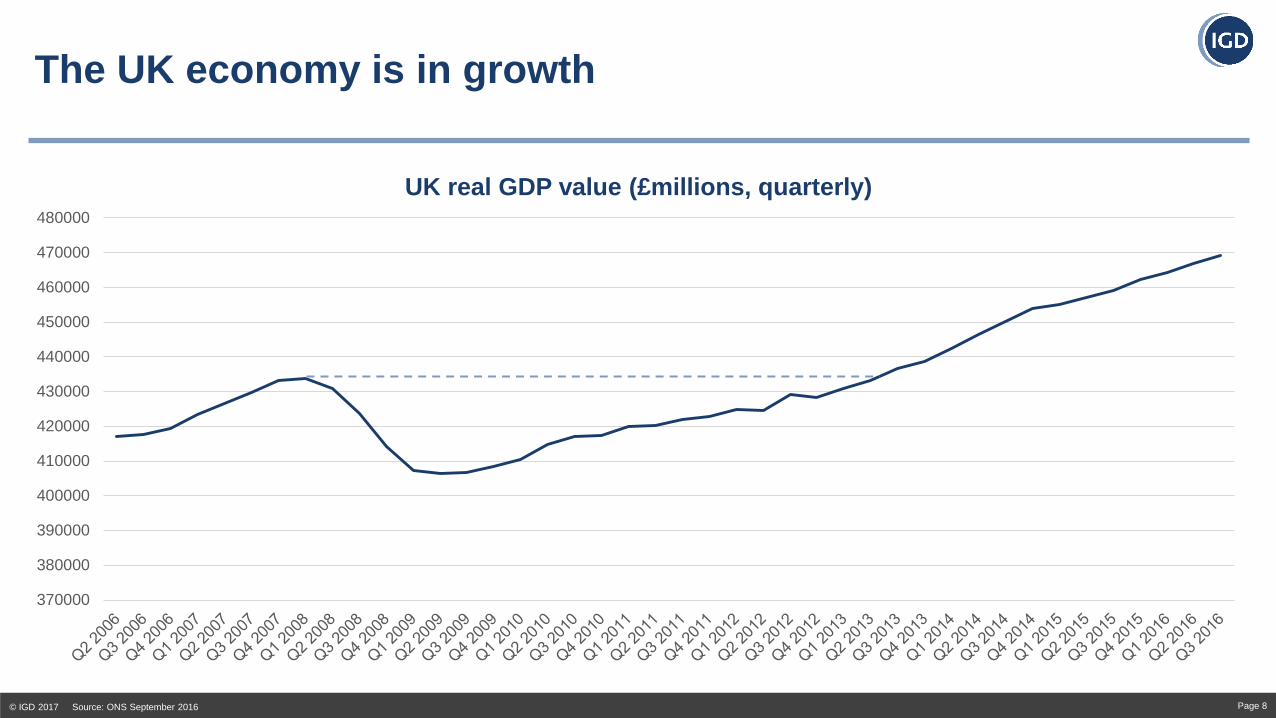
UK real GDP value (£millions, quarterly)
The UK economy is in growth
© IGD 2017 Source: ONS September 2016 Page 8
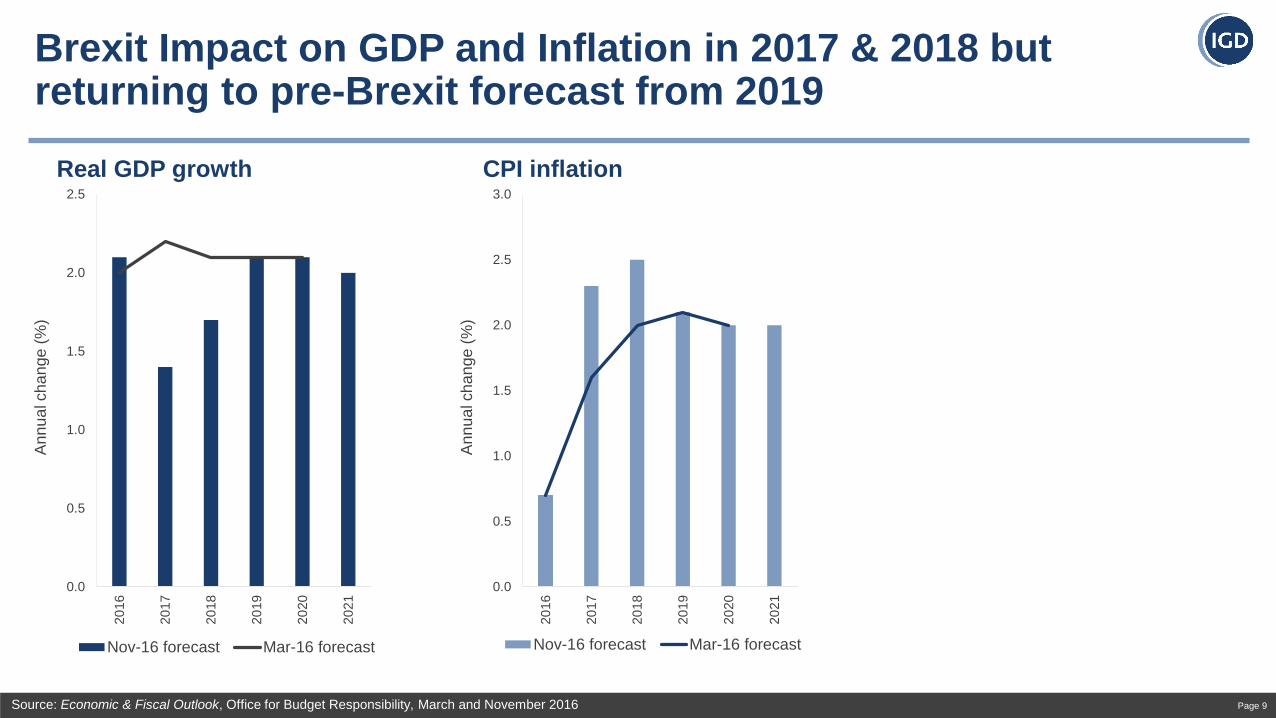
Brexit Impact on GDP and Inflation in 2017 & 2018 but returning to pre-Brexit forecast from 2019
Page 9
0.0
0.5
1.0
1.5
2.0
2.5
2016
2017
2018
2019
2020
2021
Ann
ual c
hang
e (%
)
Real GDP growth
Nov-16 forecast Mar-16 forecast
0.0
0.5
1.0
1.5
2.0
2.5
3.0
2016
2017
2018
2019
2020
2021
Ann
ual c
hang
e (%
)
CPI inflation
Nov-16 forecast Mar-16 forecast
Source: Economic & Fiscal Outlook, Office for Budget Responsibility, March and November 2016
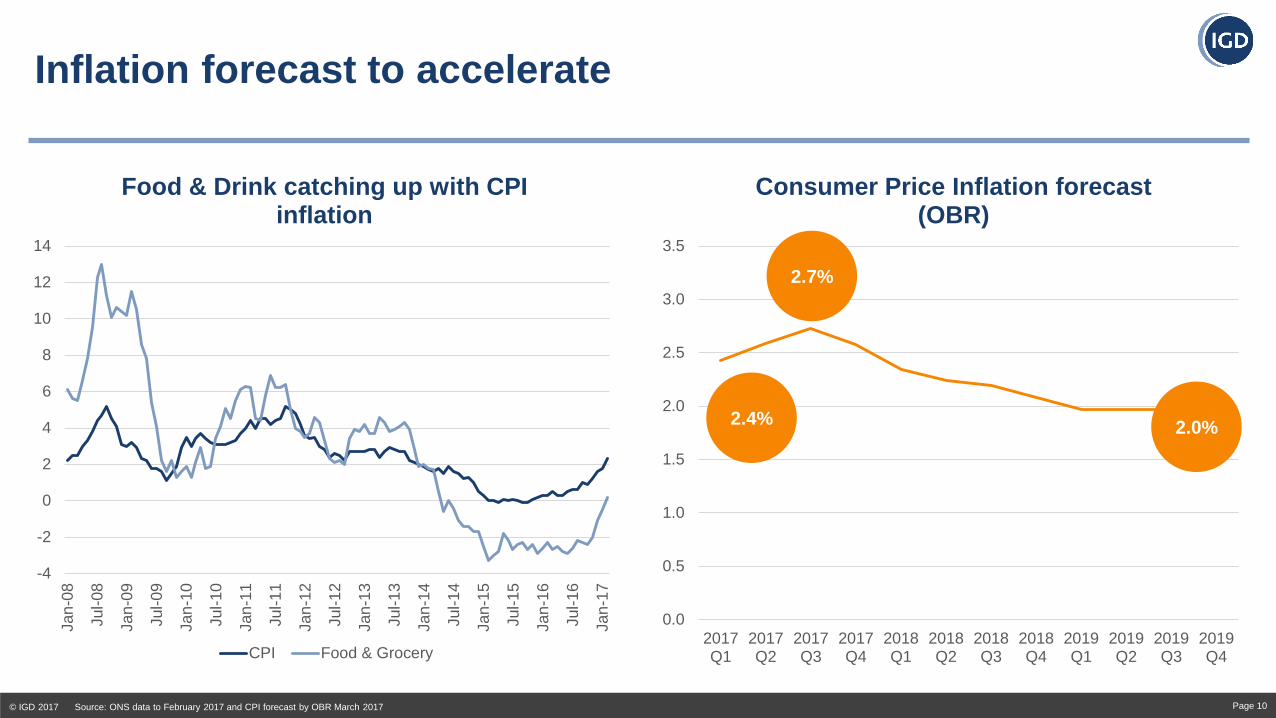
Inflation forecast to accelerate
© IGD 2017 Source: ONS data to February 2017 and CPI forecast by OBR March 2017 Page 10
0.0
0.5
1.0
1.5
2.0
2.5
3.0
3.5
2017Q1
2017Q2
2017Q3
2017Q4
2018Q1
2018Q2
2018Q3
2018Q4
2019Q1
2019Q2
2019Q3
2019Q4
Consumer Price Inflation forecast (OBR)
2.7%
2.0% 2.4%
-4
-2
0
2
4
6
8
10
12
14
Jan-
08
Jul-0
8
Jan-
09
Jul-0
9
Jan-
10
Jul-1
0
Jan-
11
Jul-1
1
Jan-
12
Jul-1
2
Jan-
13
Jul-1
3
Jan-
14
Jul-1
4
Jan-
15
Jul-1
5
Jan-
16
Jul-1
6
Jan-
17
Food & Drink catching up with CPI inflation
CPI Food & Grocery
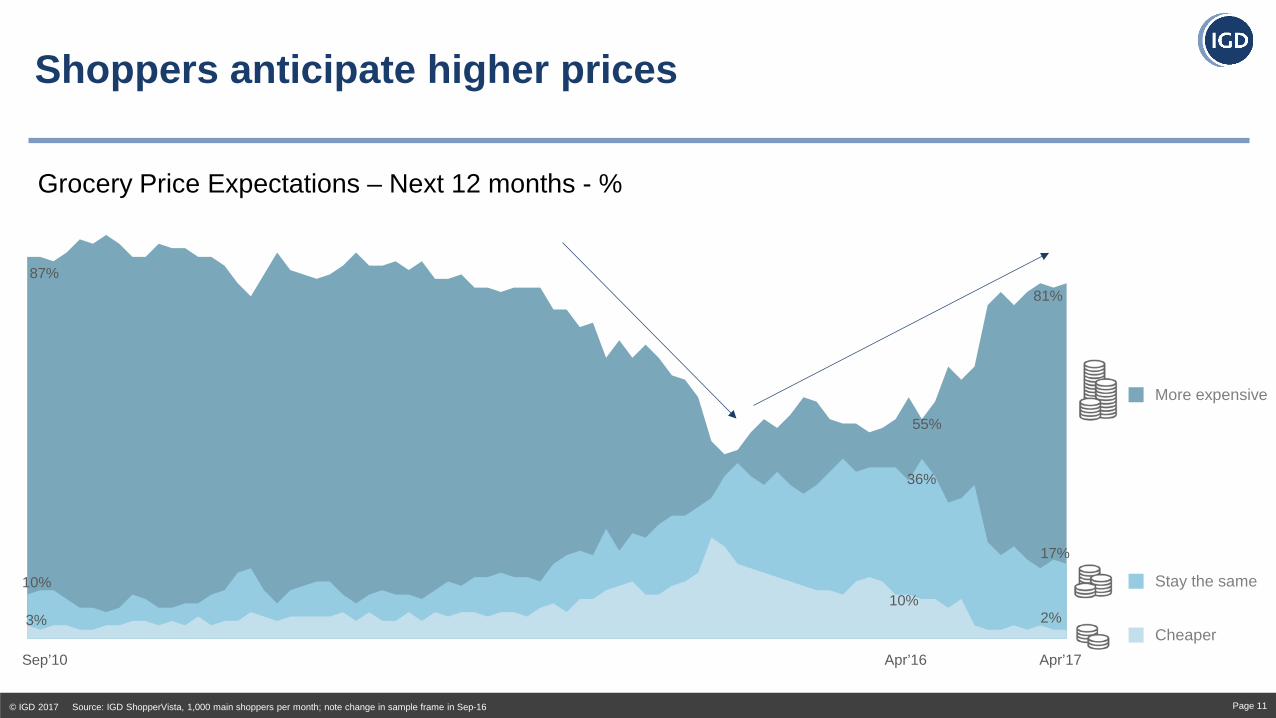
Shoppers anticipate higher prices
© IGD 2017 Source: IGD ShopperVista, 1,000 main shoppers per month; note change in sample frame in Sep-16 Page 11
Grocery Price Expectations – Next 12 months - %
More expensive
Stay the same
Cheaper
87%
10%
3%
55%
36%
10%
81%
17%
2%
Apr’17 Apr’16 Sep’10
Page 12
0.0
0.5
1.0
1.5
2.0
2.5
2016
2017
2018
2019
2020
2021
Ann
ual c
hang
e (%
)
Real GDP growth
Nov-16 forecast Mar-16 forecast
0.0
0.5
1.0
1.5
2.0
2.5
3.0
2016
2017
2018
2019
2020
2021
Ann
ual c
hang
e (%
)
CPI inflation
Nov-16 forecast Mar-16 forecast
0.0
0.5
1.0
1.5
2.0
2.5
3.0
2016
2017
2018
2019
2020
2021
Ann
ual c
hang
e (%
)
Disposable h’hold income
Nov-16 forecast Mar-16 forecast
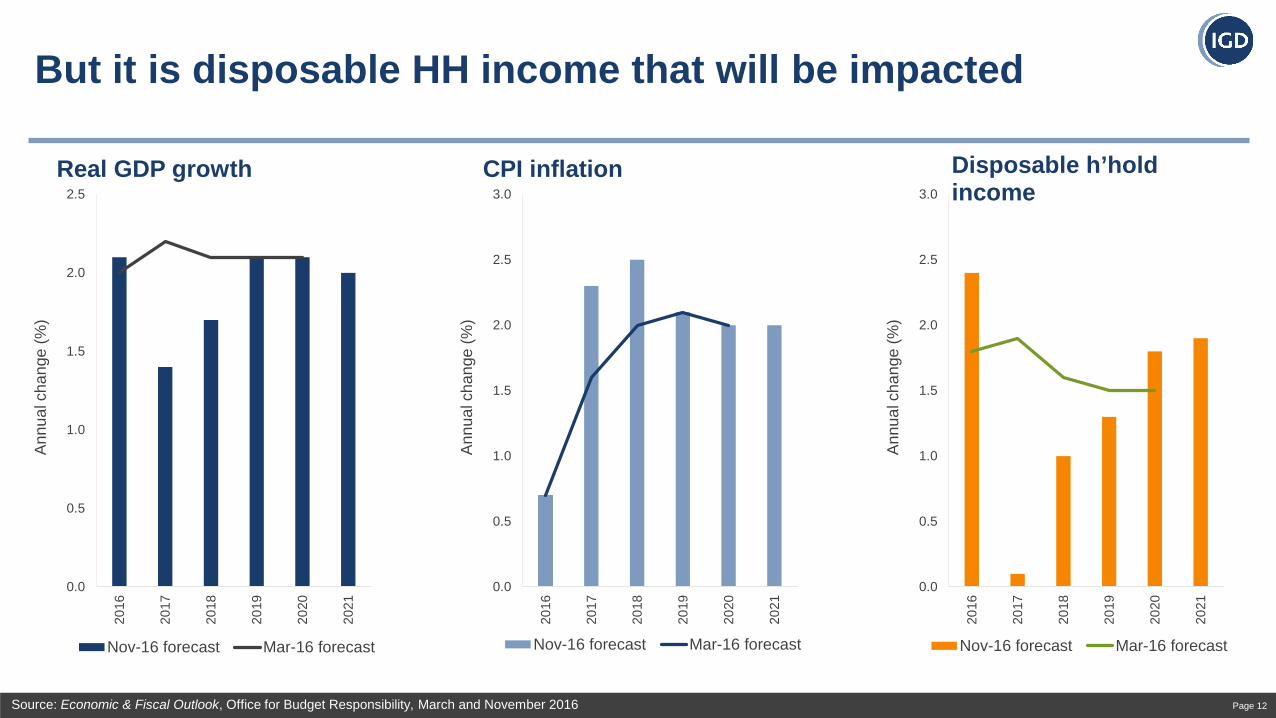
But it is disposable HH income that will be impacted
Source: Economic & Fiscal Outlook, Office for Budget Responsibility, March and November 2016
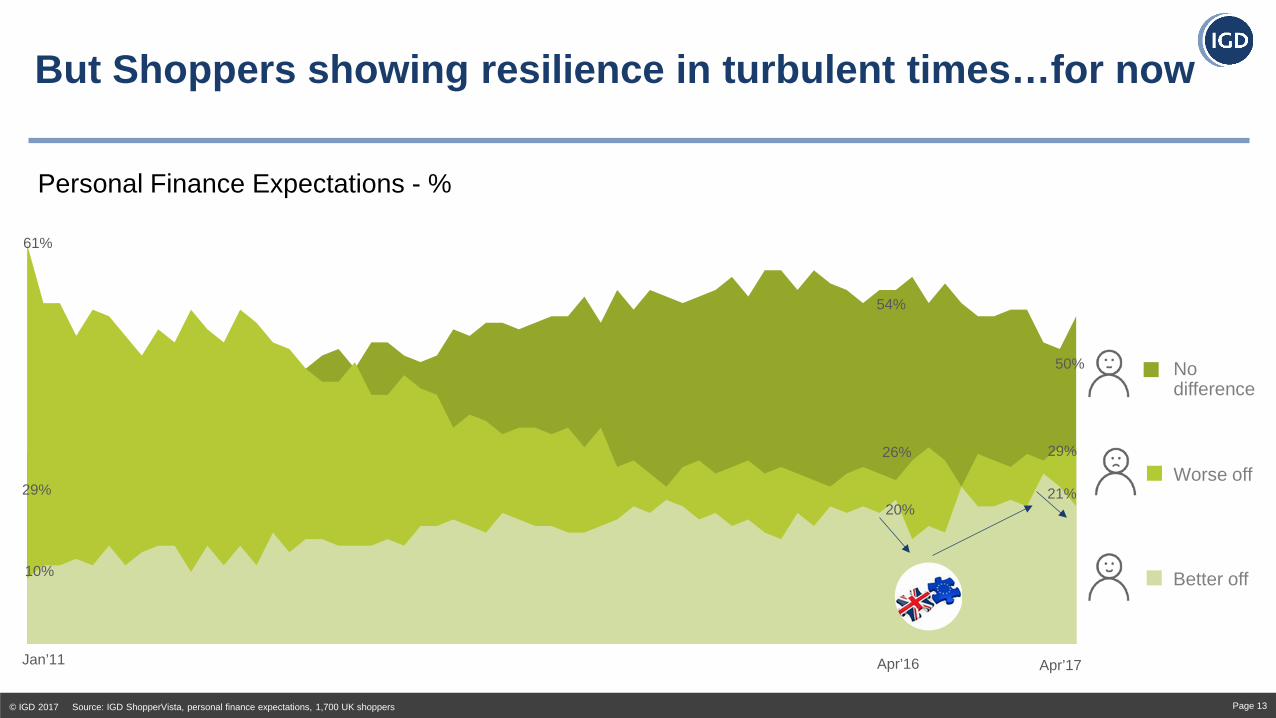
But Shoppers showing resilience in turbulent times…for now
© IGD 2017 Source: IGD ShopperVista, personal finance expectations, 1,700 UK shoppers Page 13
Personal Finance Expectations - %
Better off
Worse off
No difference
Jan’11
21%
29%
50%
20%
26%
54%
61%
29%
10%
Apr’17 Apr’16
Challenge 2: grocery share of wallet is declining
© IGD 2017 Page 14
55
56
57
58
59
60
61
62
63
64
65
2007 2008 2009 2010 2011 2012 2013 2014
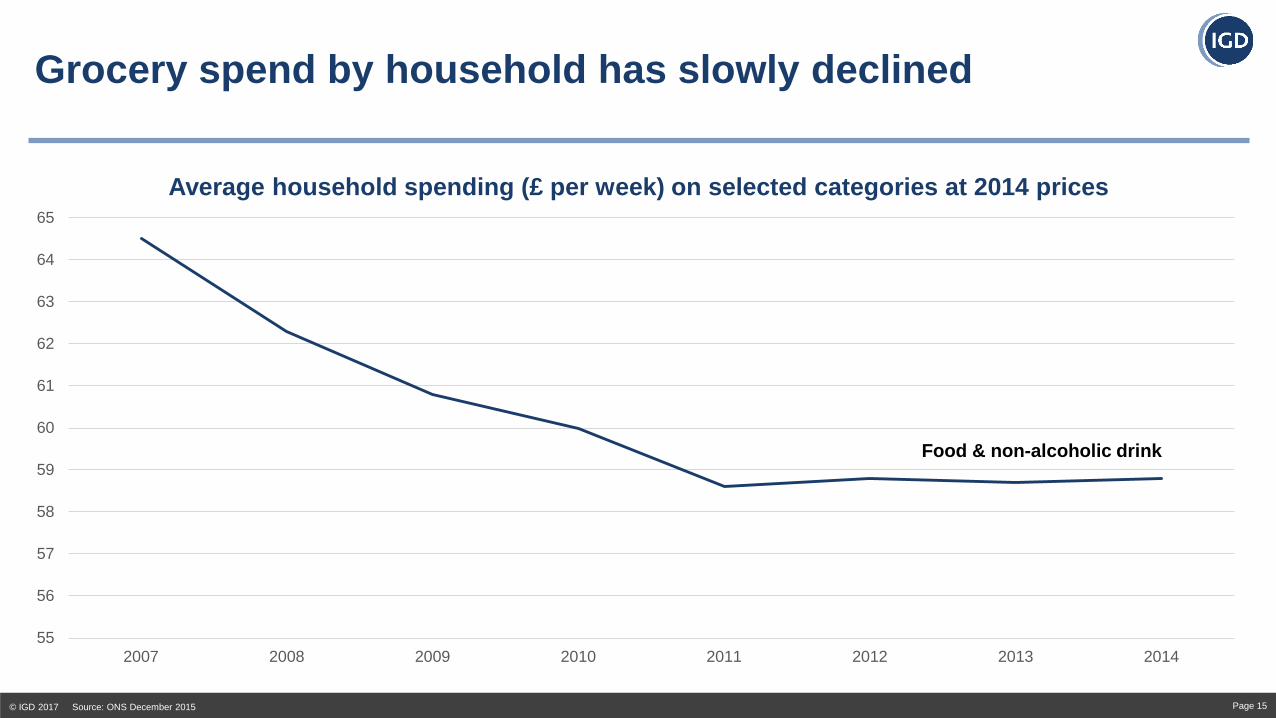
Average household spending (£ per week) on selected categories at 2014 prices
Grocery spend by household has slowly declined
© IGD 2017 Source: ONS December 2015 Page 15
Food & non-alcoholic drink
0
10
20
30
40
50
60
70
80
90
2007 2008 2009 2010 2011 2012 2013 2014
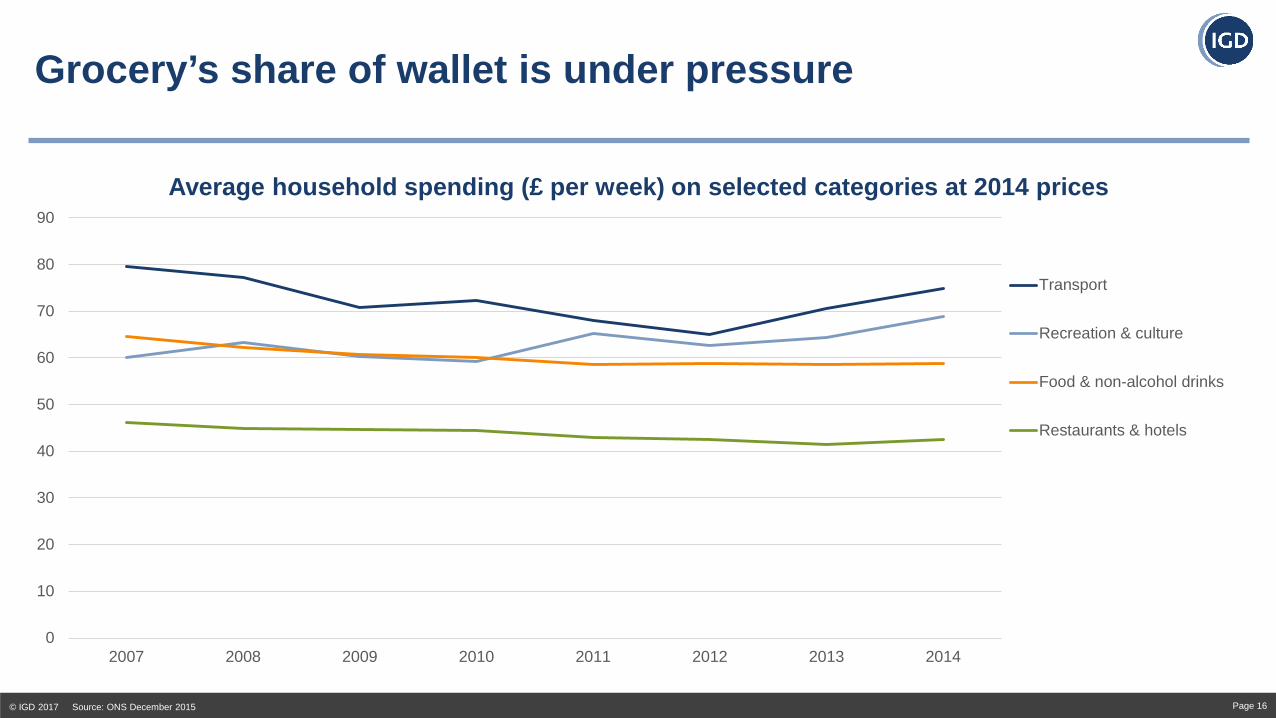
Average household spending (£ per week) on selected categories at 2014 prices
Transport
Recreation & culture
Food & non-alcohol drinks
Restaurants & hotels
Grocery’s share of wallet is under pressure
© IGD 2017 Source: ONS December 2015 Page 16
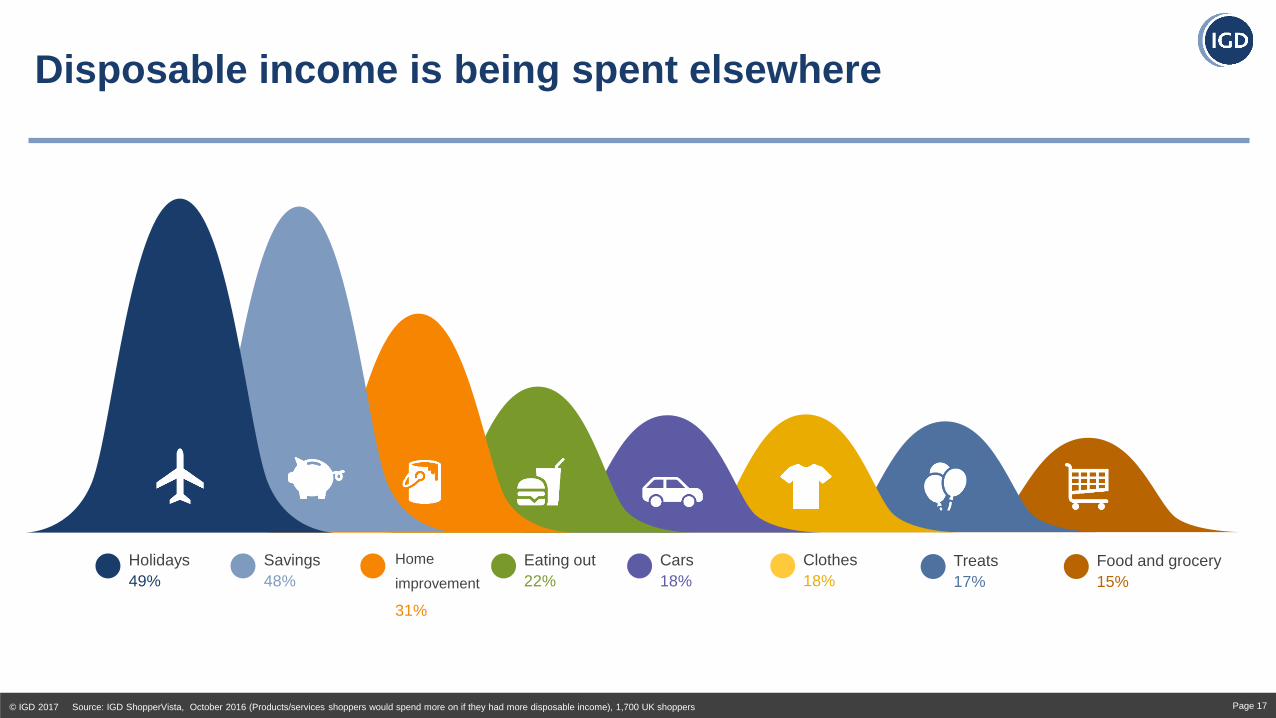
Disposable income is being spent elsewhere
© IGD 2017 Source: IGD ShopperVista, October 2016 (Products/services shoppers would spend more on if they had more disposable income), 1,700 UK shoppers Page 17
Holidays 49%
Savings 48%
Home
improvement
31%
Eating out 22%
Cars 18%
Clothes 18%
Treats 17%
Food and grocery 15%
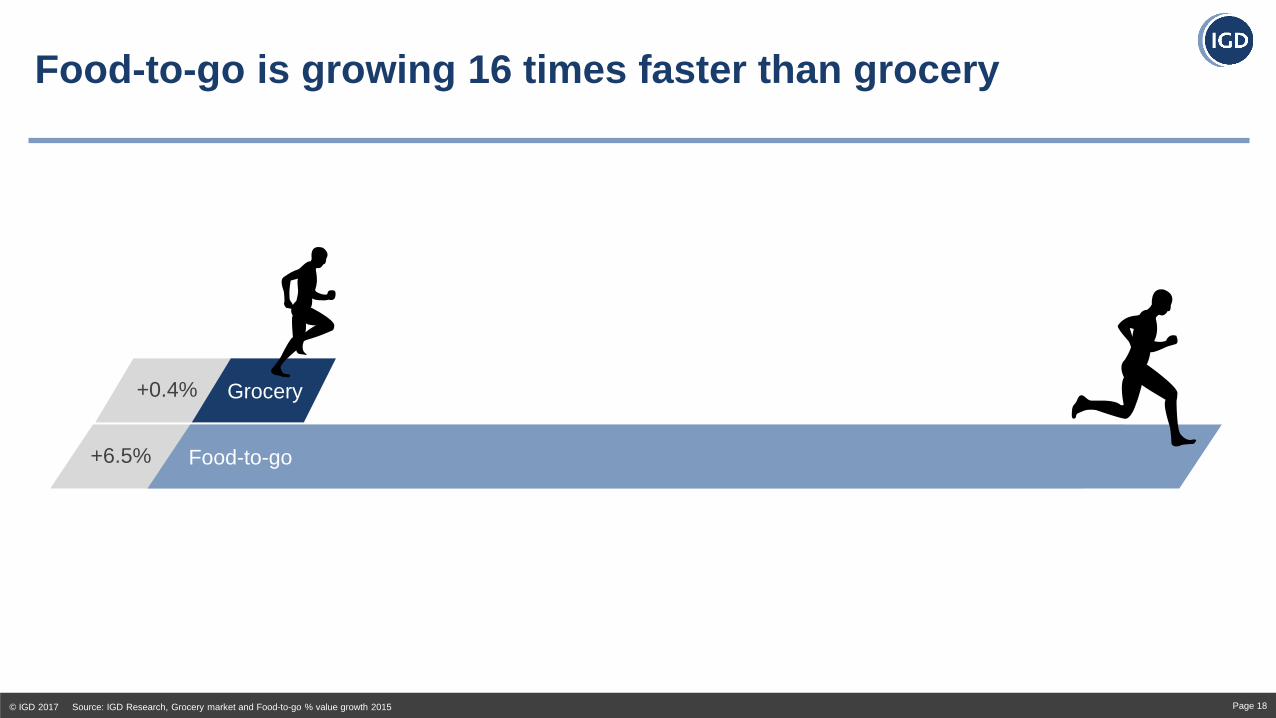
Food-to-go is growing 16 times faster than grocery
© IGD 2017 Source: IGD Research, Grocery market and Food-to-go % value growth 2015 Page 18
Food-to-go +6.5%
Grocery +0.4%
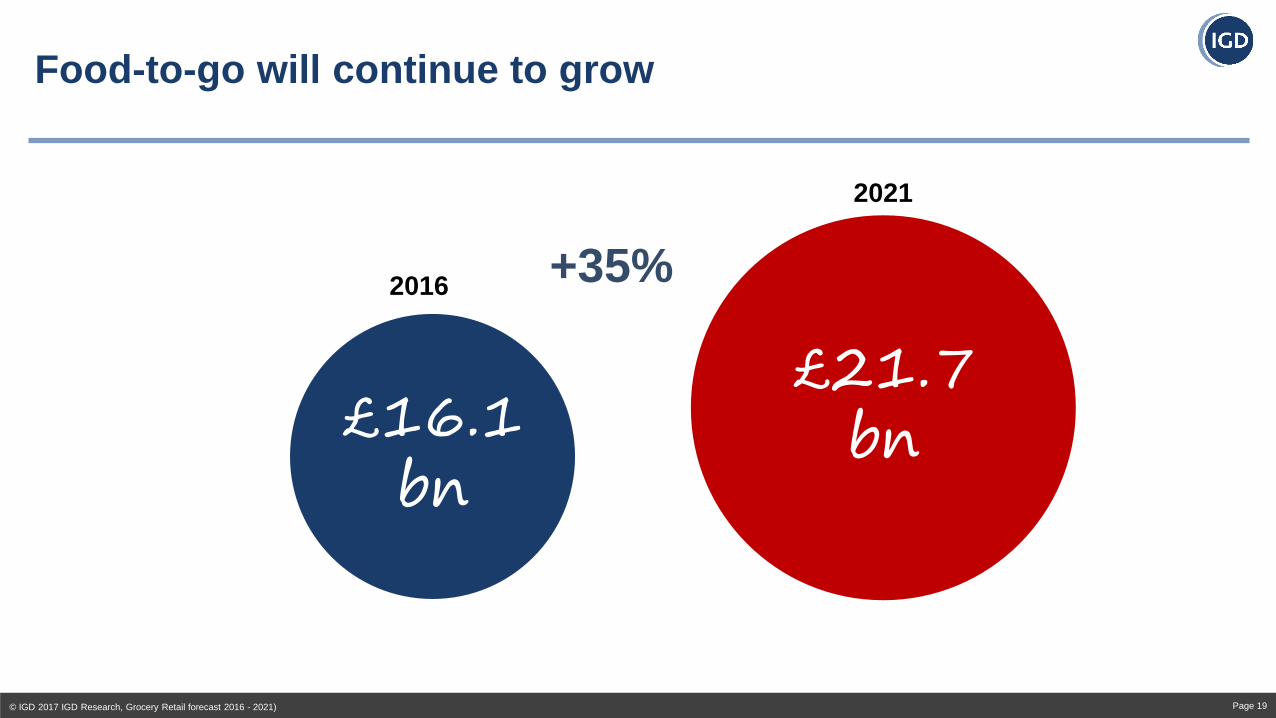
Food-to-go will continue to grow
© IGD 2017 IGD Research, Grocery Retail forecast 2016 - 2021) Page 19
£16.1bn
£21.7 bn
+35% 2016
2021
Contents
© IGD 2017 Page 20
Shopper Confidence & Inflation
Grocery Shifting Dynamics & Channel Implications
Future View
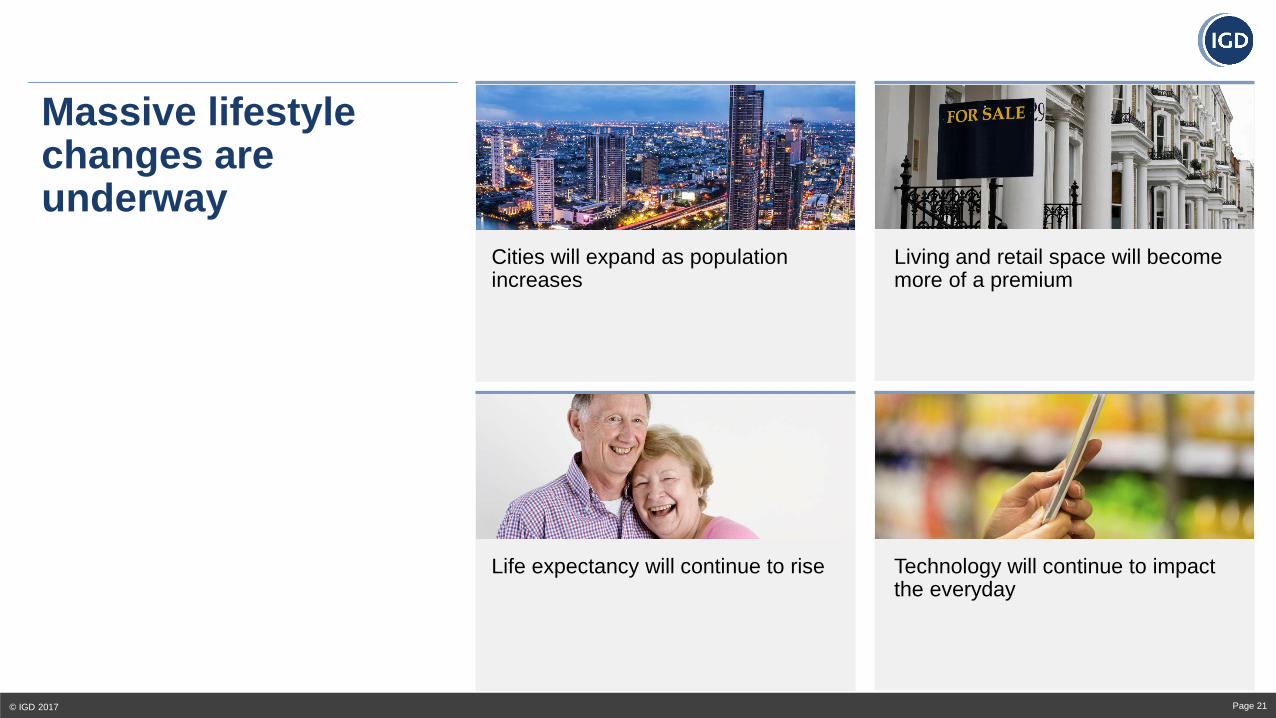
Massive lifestyle changes are underway
© IGD 2017 Page 21
Cities will expand as population increases
Living and retail space will become more of a premium
Life expectancy will continue to rise Technology will continue to impact the everyday
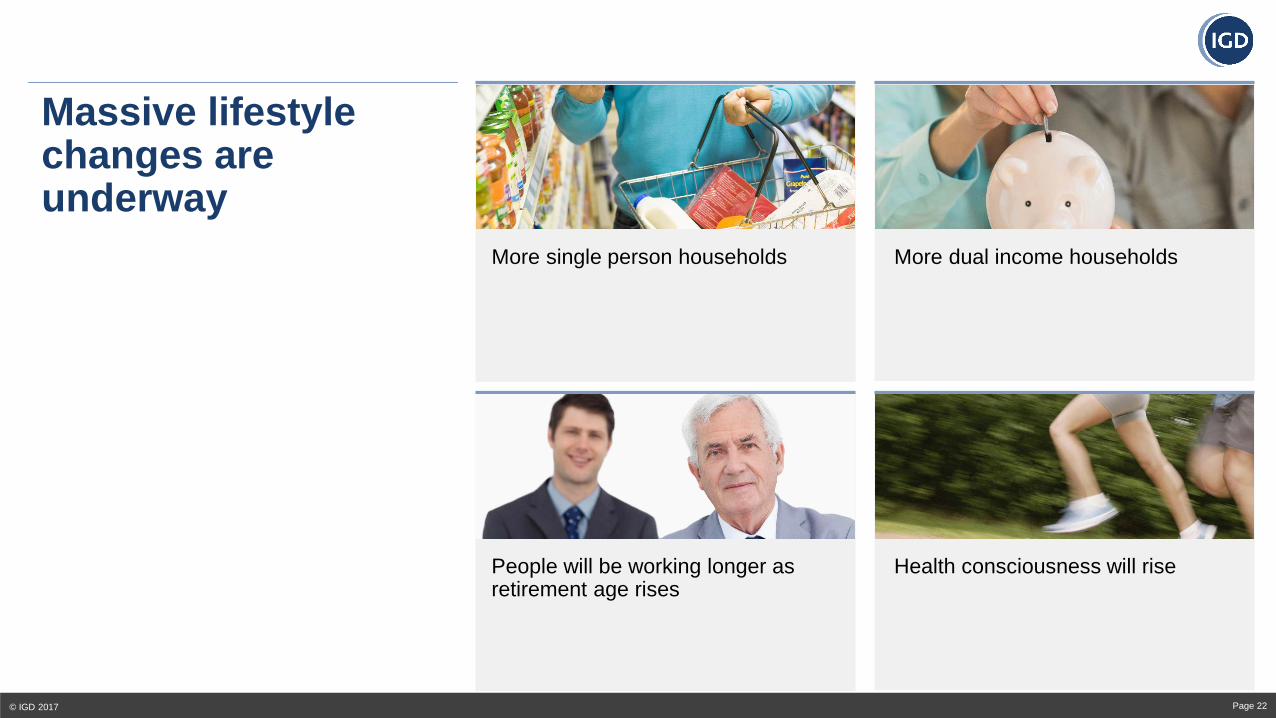
Massive lifestyle changes are underway
© IGD 2017 Page 22
More single person households More dual income households
People will be working longer as retirement age rises
Health consciousness will rise
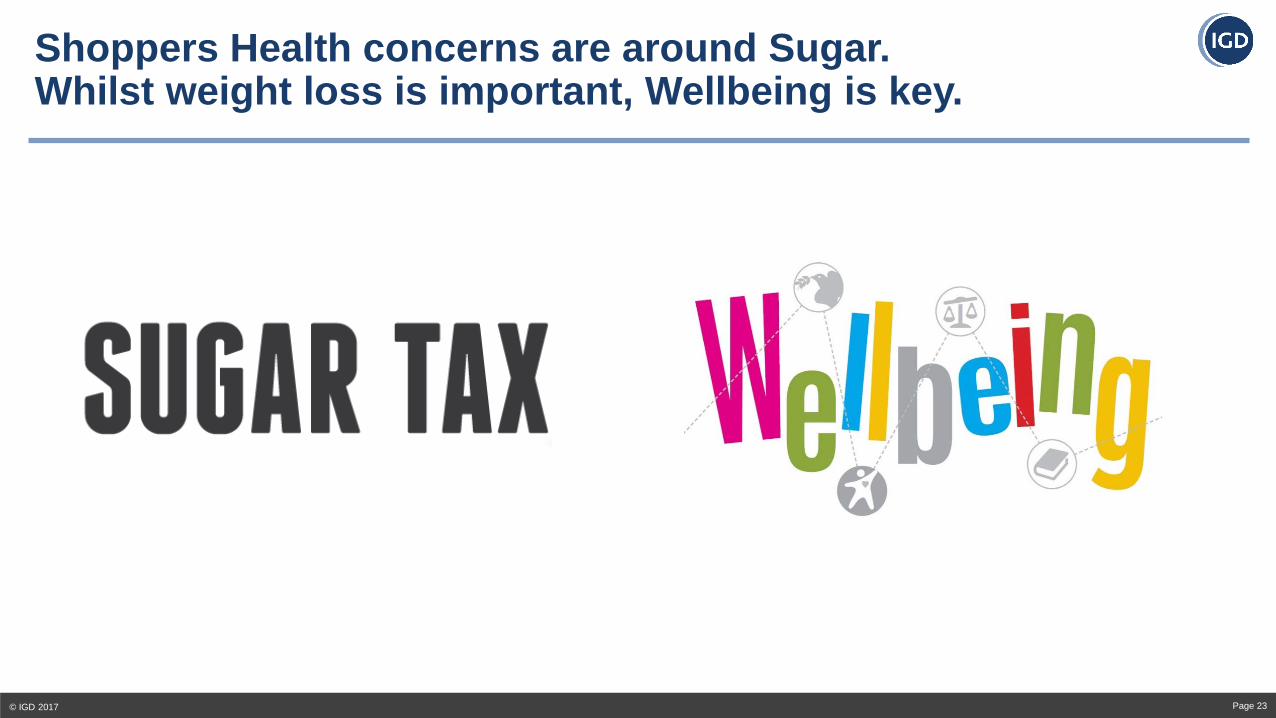
Shoppers Health concerns are around Sugar. Whilst weight loss is important, Wellbeing is key.
© IGD 2017 Page 23
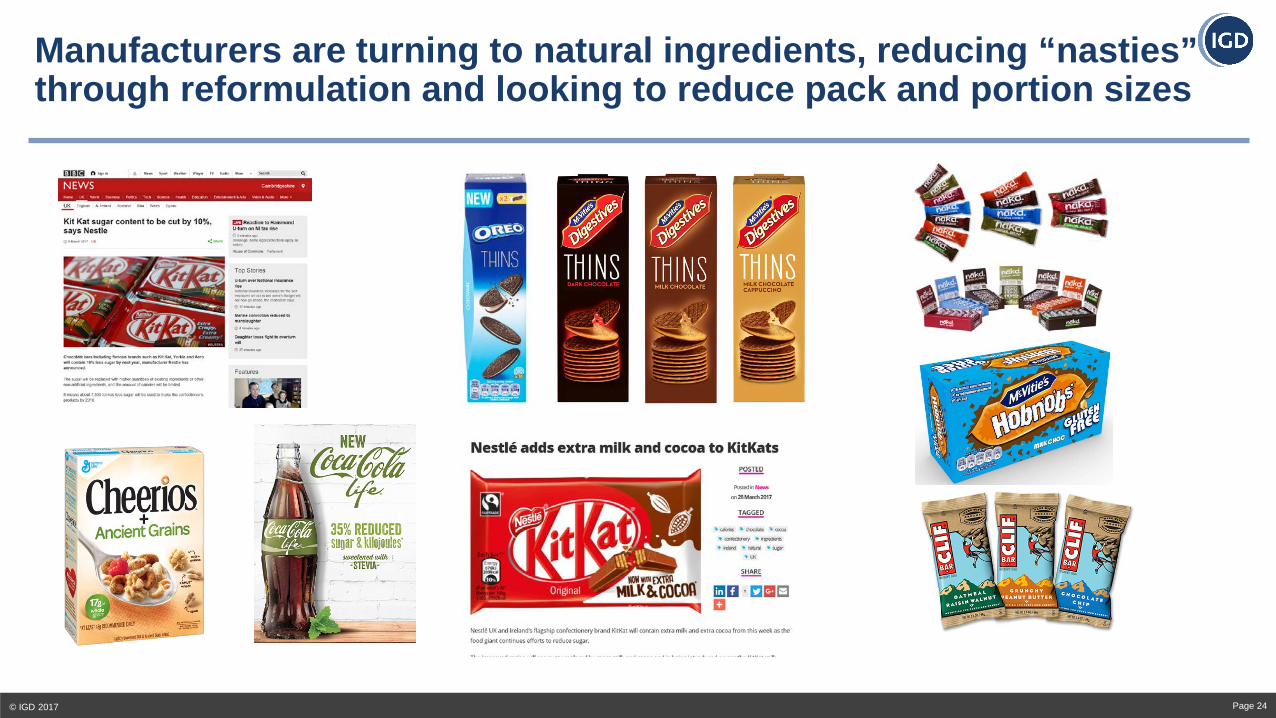
Manufacturers are turning to natural ingredients, reducing “nasties” through reformulation and looking to reduce pack and portion sizes
© IGD 2017 Page 24
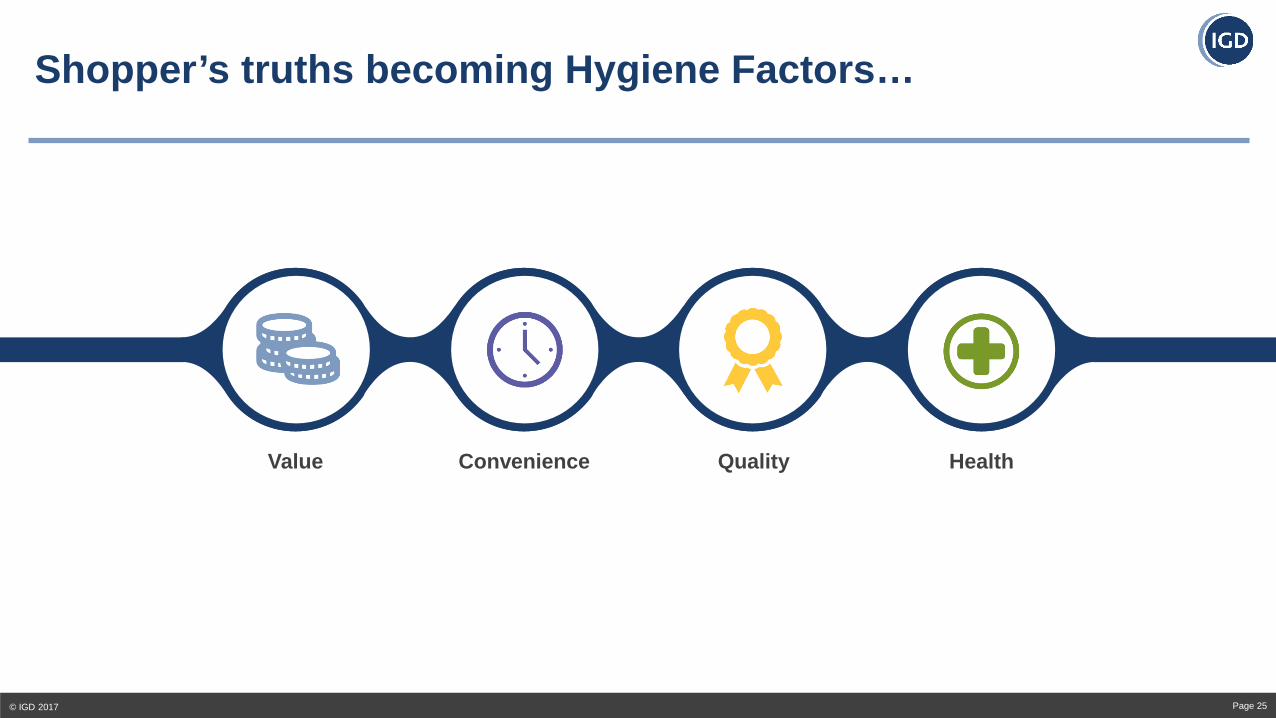
Shopper’s truths becoming Hygiene Factors…
© IGD 2017 Page 25
Value Convenience Quality Health
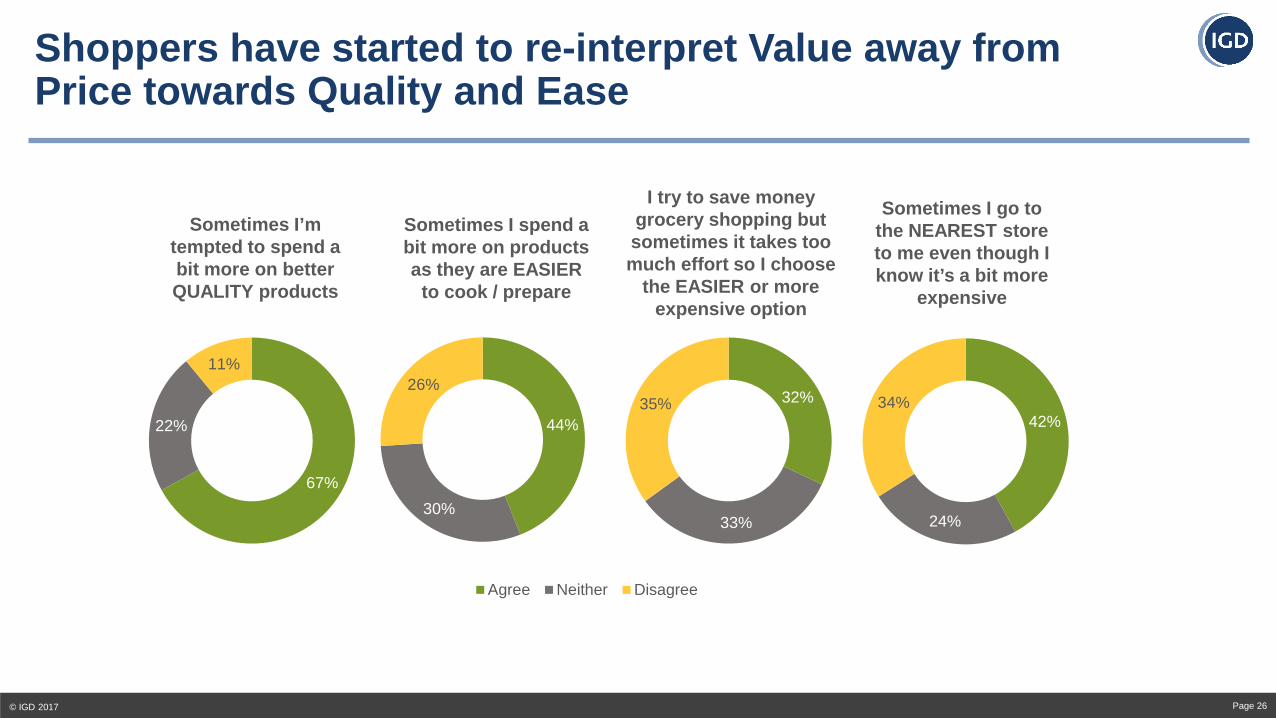
Shoppers have started to re-interpret Value away from Price towards Quality and Ease
© IGD 2017 Page 26
67%
22%
11%
44%
30%
26%
Agree Neither Disagree
32%
33%
35% 42%
24%
34%
Sometimes I’m tempted to spend a bit more on better QUALITY products
Sometimes I go to the NEAREST store to me even though I know it’s a bit more
expensive
I try to save money grocery shopping but sometimes it takes too much effort so I choose
the EASIER or more expensive option
Sometimes I spend a bit more on products as they are EASIER
to cook / prepare
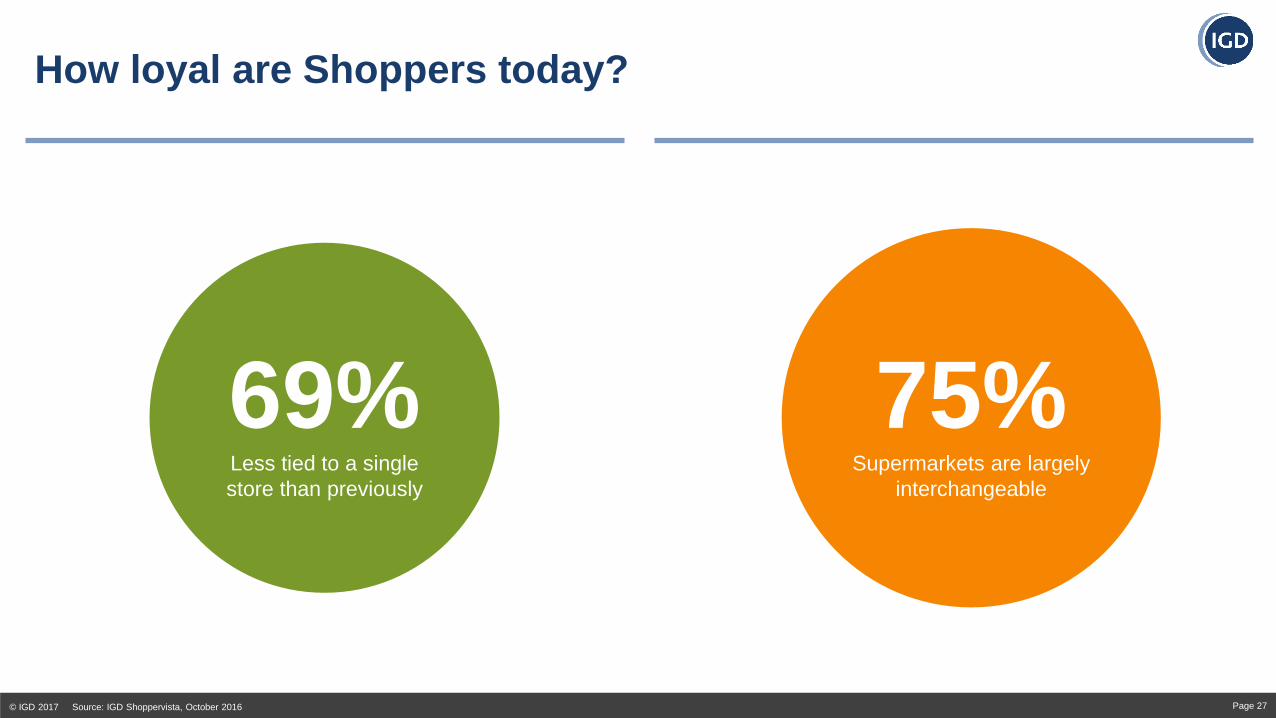
How loyal are Shoppers today?
© IGD 2017 Source: IGD Shoppervista, October 2016 Page 27
75% Supermarkets are largely
interchangeable
69% Less tied to a single store than previously
0
5
10
15
20
25
30
35
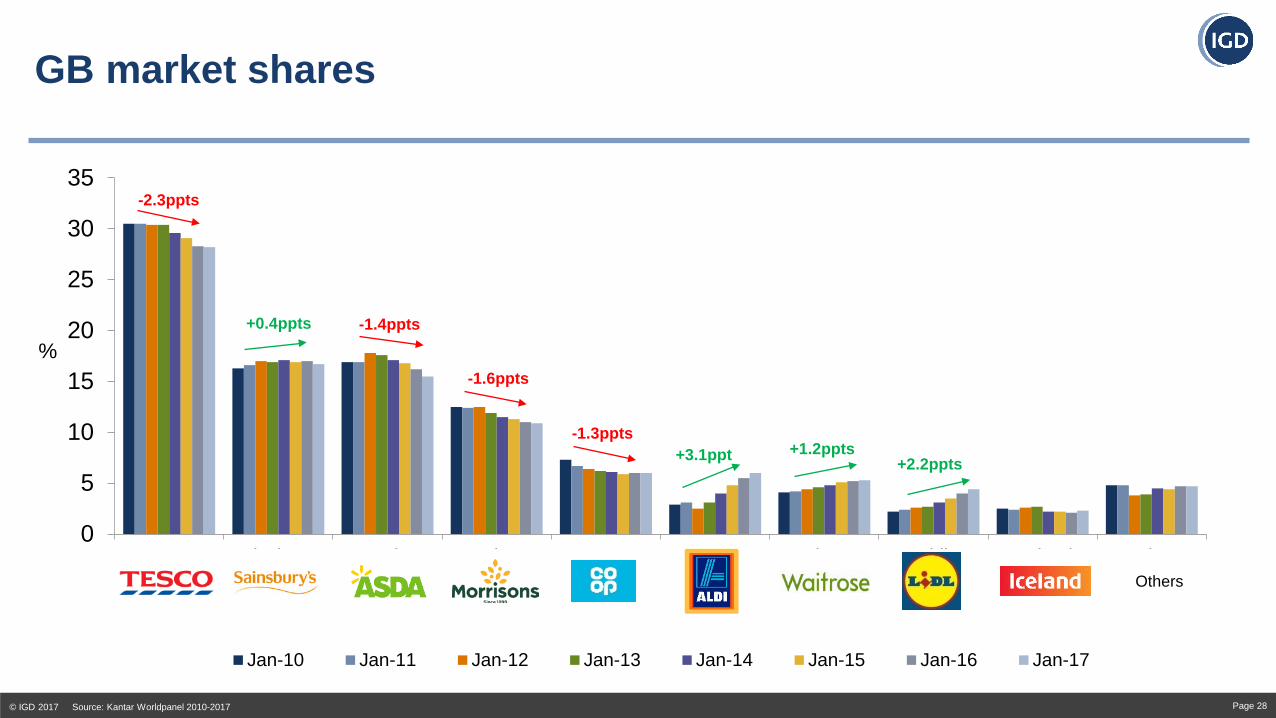
Tesco Sainsbury's Asda Morrisons Co-op Aldi Waitrose Lidl Iceland Other
%
Jan-10 Jan-11 Jan-12 Jan-13 Jan-14 Jan-15 Jan-16 Jan-17
-2.3ppts
-1.4ppts +0.4ppts
-1.6ppts
-1.3ppts +3.1ppt +1.2ppts
+2.2ppts
GB market shares
© IGD 2017 Source: Kantar Worldpanel 2010-2017 Page 28
Others
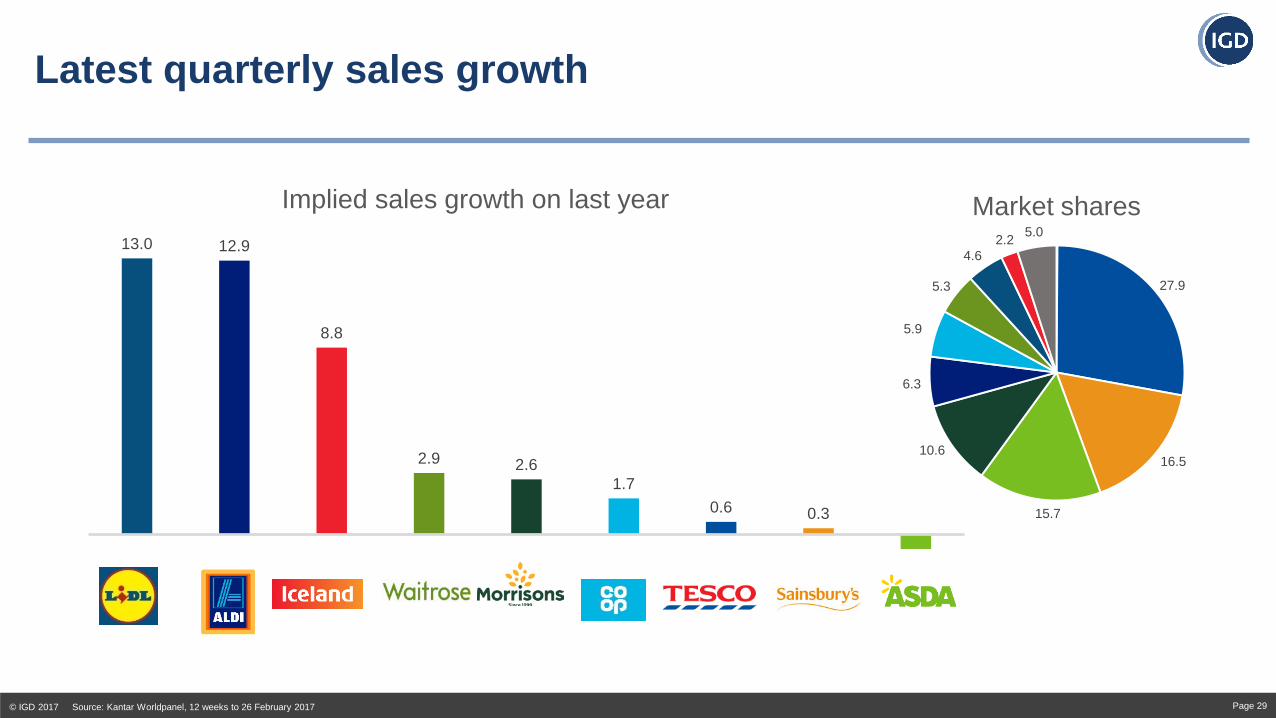
13.0 12.9
8.8
2.9 2.6 1.7
0.6 0.3
-0.8
Lidl Aldi Iceland Waitrose Morrisons Co-op Tesco Sainsbury's Asda
Implied sales growth on last year
Latest quarterly sales growth
© IGD 2017 Source: Kantar Worldpanel, 12 weeks to 26 February 2017 Page 29
27.9
16.5
15.7
10.6
6.3
5.9
5.3
4.6 2.2 5.0
Market shares

Shoppers continue to buy across a variety of formats and channels
© IGD 2017 Page 30
98% 91%
78%
60%
47% 42% 41%
0%
20%
40%
60%
80%
100%
120%
Larger formats Convenience High street discount Food discount Specialist / ethnicstores
Frozen food specialist Online
Monthly claimed usage
4.6 Average number
of channels claimed to be
used in the last month
11.8 Average number
of stores claimed to be
used in the last month
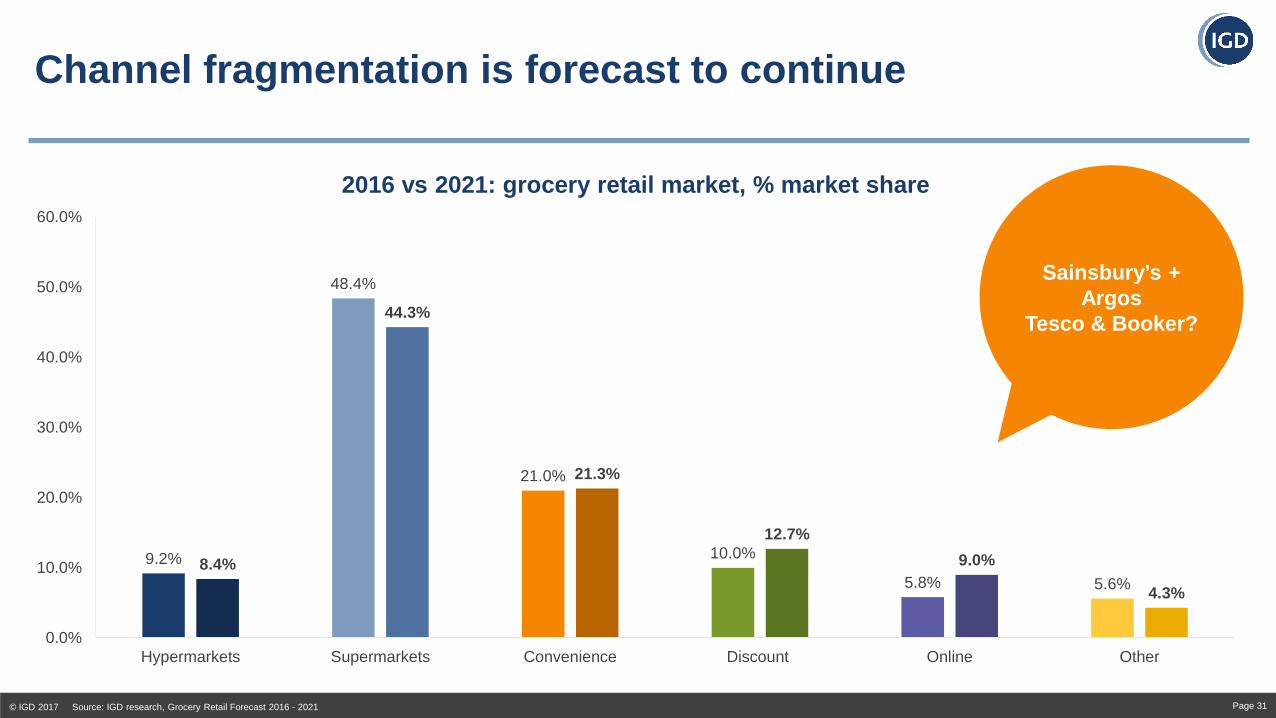
Channel fragmentation is forecast to continue
© IGD 2017 Source: IGD research, Grocery Retail Forecast 2016 - 2021 Page 31
9.2%
48.4%
21.0%
10.0%
5.8% 5.6% 8.4%
44.3%
21.3%
12.7% 9.0%
4.3%
0.0%
10.0%
20.0%
30.0%
40.0%
50.0%
60.0%
Hypermarkets Supermarkets Convenience Discount Online Other
2016 vs 2021: grocery retail market, % market share
Sainsbury’s + Argos
Tesco & Booker?
Contents
© IGD 2017 Page 32
Shopper Confidence & Inflation
Grocery Shifting Dynamics & Channel Implications
Future View
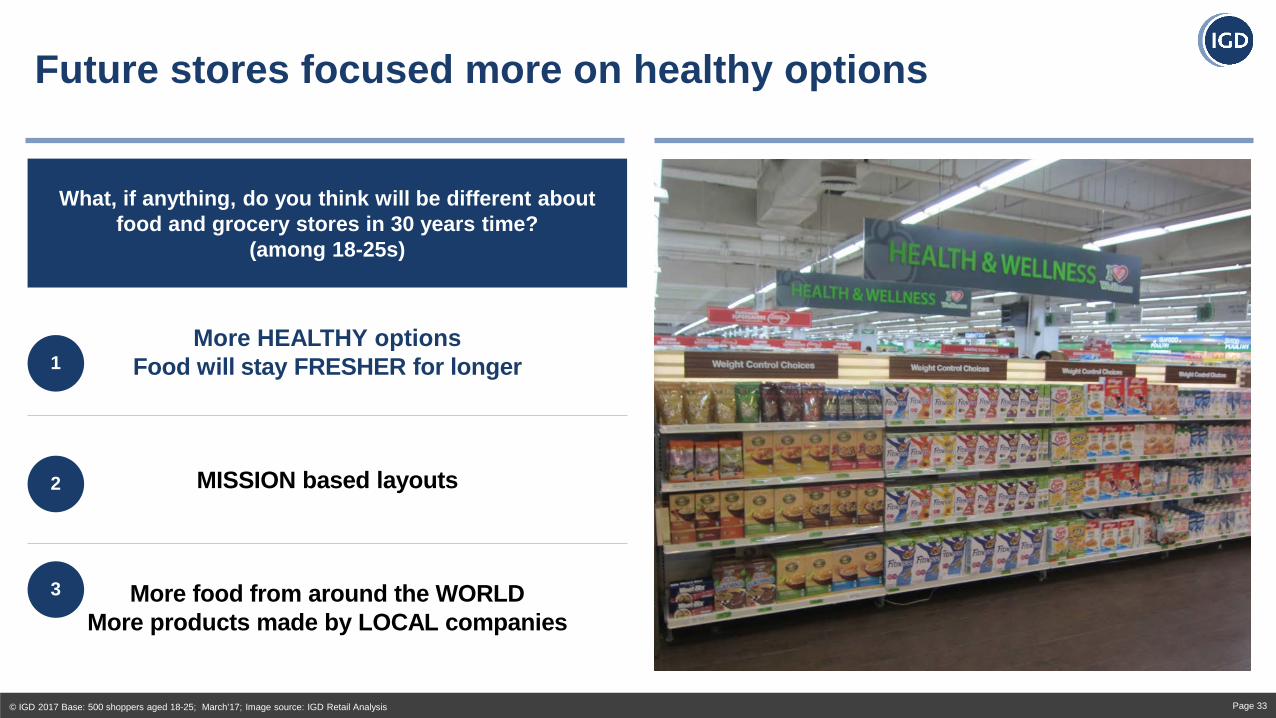
Future stores focused more on healthy options
© IGD 2017 Base: 500 shoppers aged 18-25; March’17; Image source: IGD Retail Analysis Page 33
What, if anything, do you think will be different about food and grocery stores in 30 years time?
(among 18-25s)
More HEALTHY options Food will stay FRESHER for longer
MISSION based layouts
More food from around the WORLD More products made by LOCAL companies
1
3
2
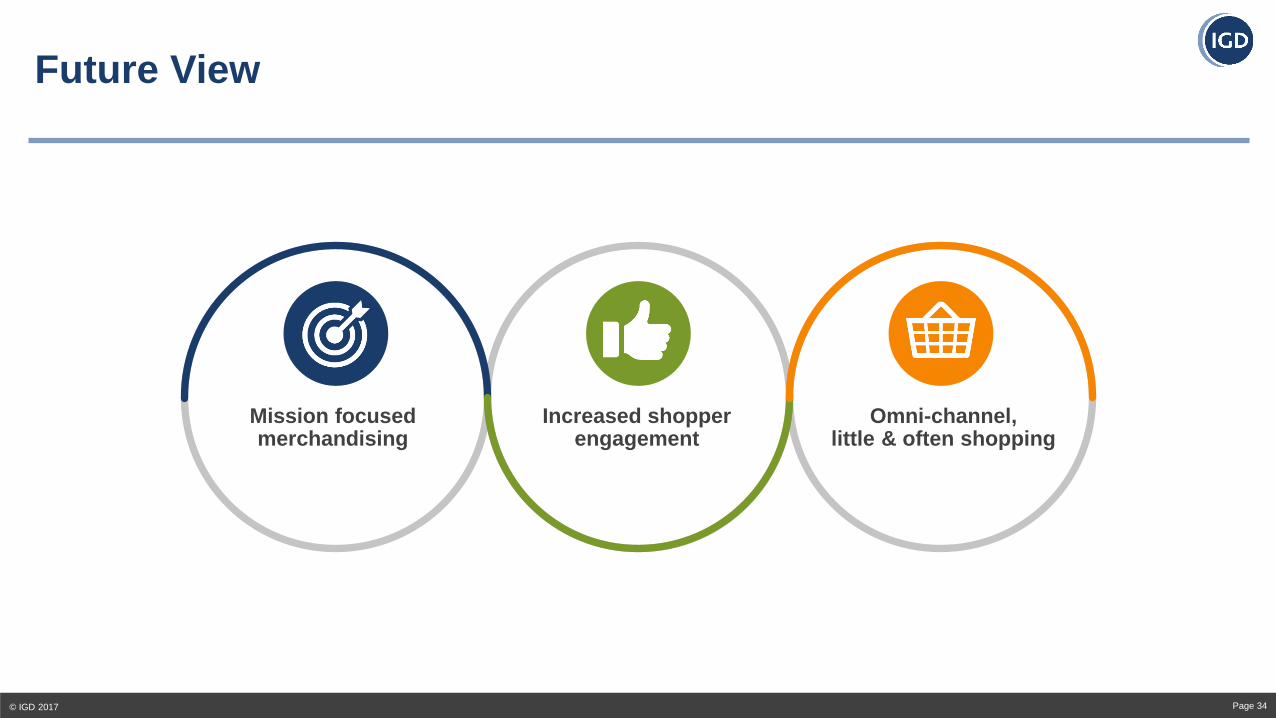
Future View
© IGD 2017 Page 34
Increased shopper engagement
Omni-channel, little & often shopping
Mission focused merchandising
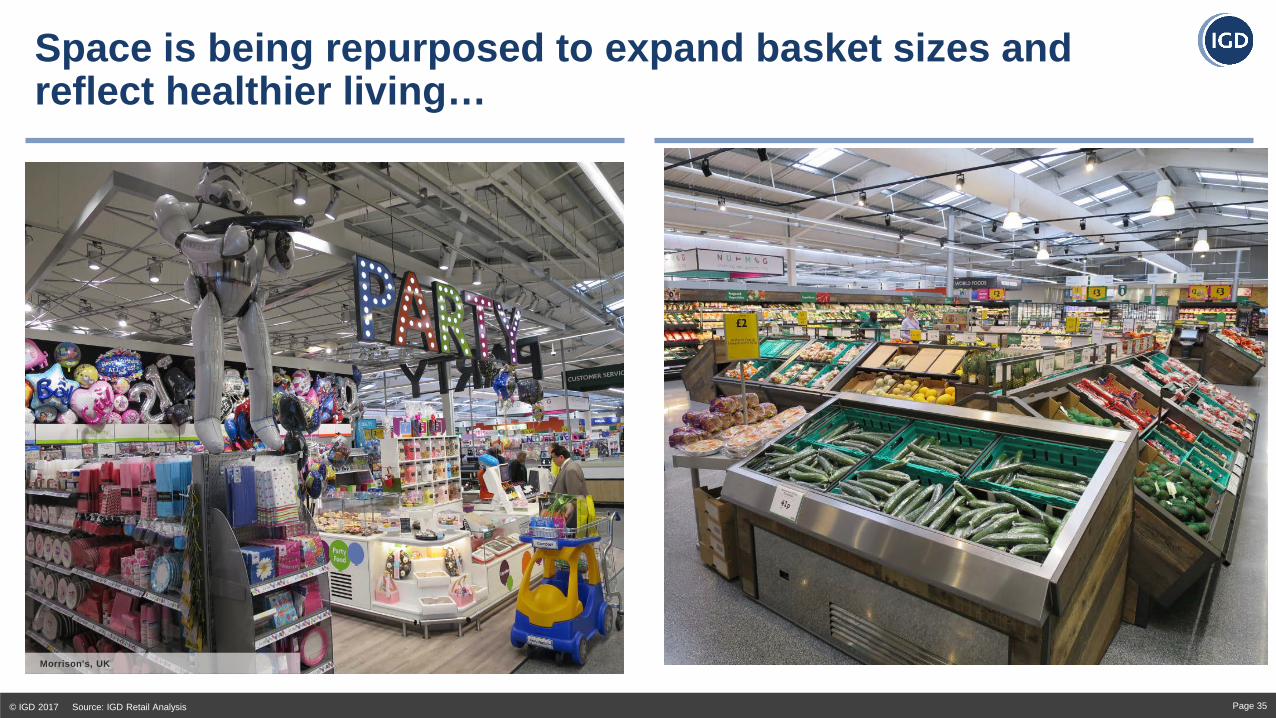
Space is being repurposed to expand basket sizes and reflect healthier living…
© IGD 2017 Source: IGD Retail Analysis Page 35
Morrison's, UK
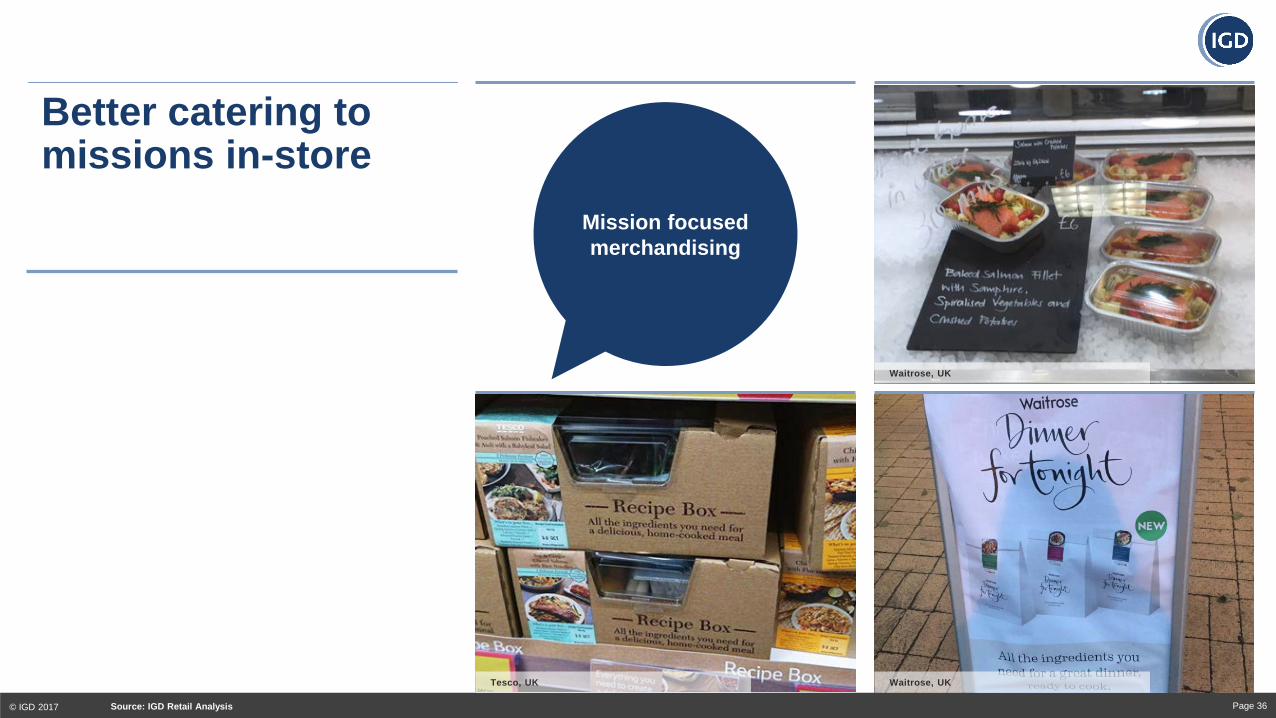
Better catering to missions in-store
© IGD 2017 Page 36 Source: IGD Retail Analysis
Mission focused merchandising
Waitrose, UK
Waitrose, UK
Tesco, UK
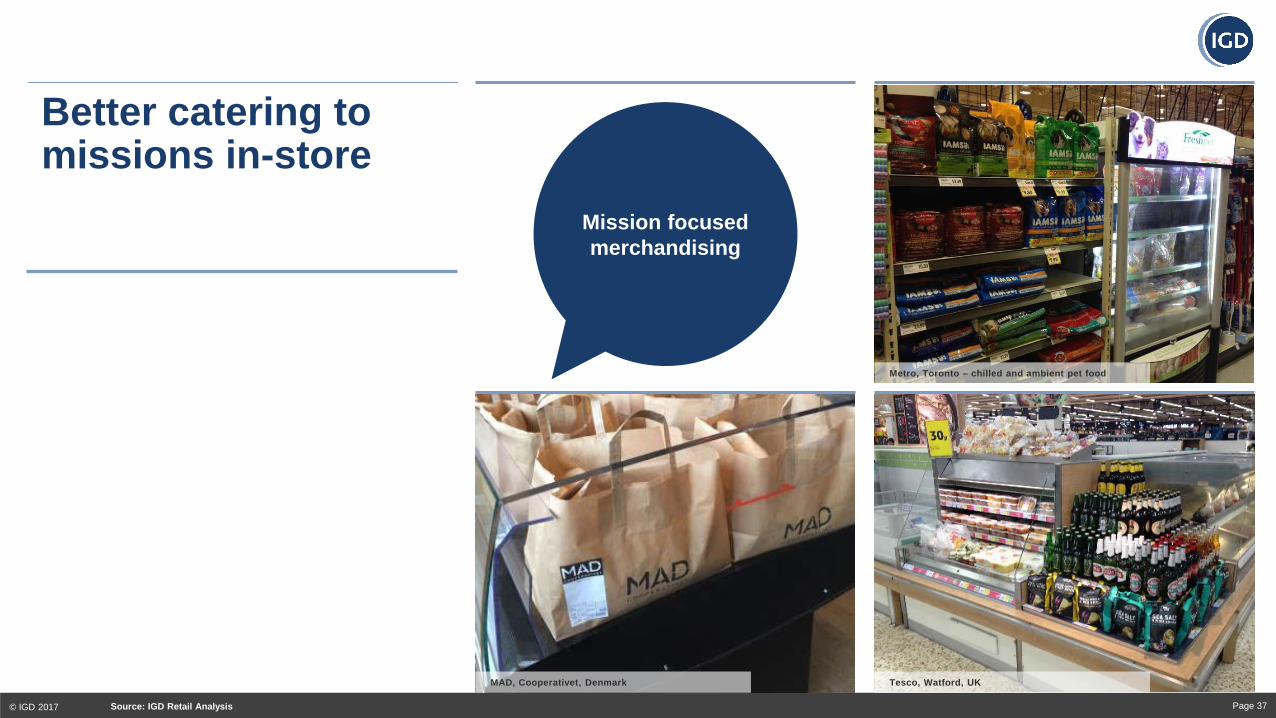
Better catering to missions in-store
© IGD 2017 Page 37 Source: IGD Retail Analysis
Mission focused merchandising
Metro, Toronto – chilled and ambient pet food
MAD, Cooperativet, Denmark Tesco, Watford, UK
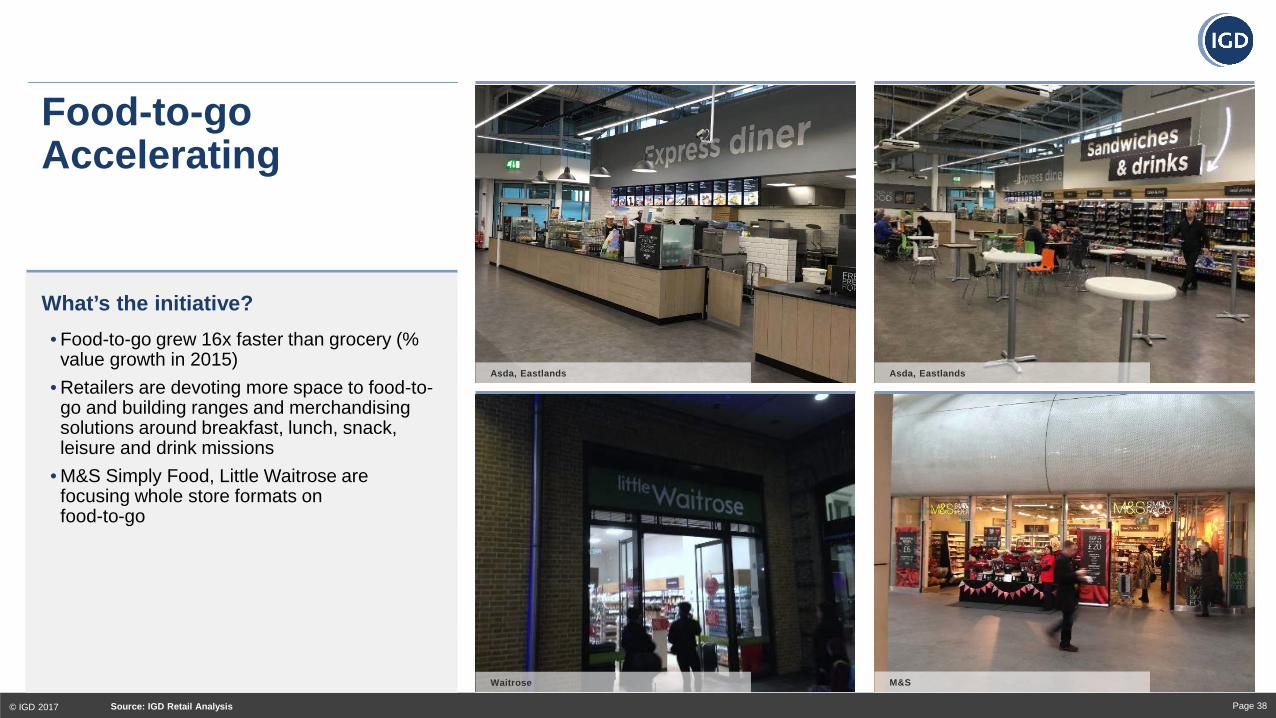
Food-to-go Accelerating
© IGD 2017 Page 38 Source: IGD Retail Analysis
• Food-to-go grew 16x faster than grocery (% value growth in 2015)
• Retailers are devoting more space to food-to-go and building ranges and merchandising solutions around breakfast, lunch, snack, leisure and drink missions
• M&S Simply Food, Little Waitrose are focusing whole store formats on food-to-go
What’s the initiative?
Asda, Eastlands
Waitrose M&S
Asda, Eastlands
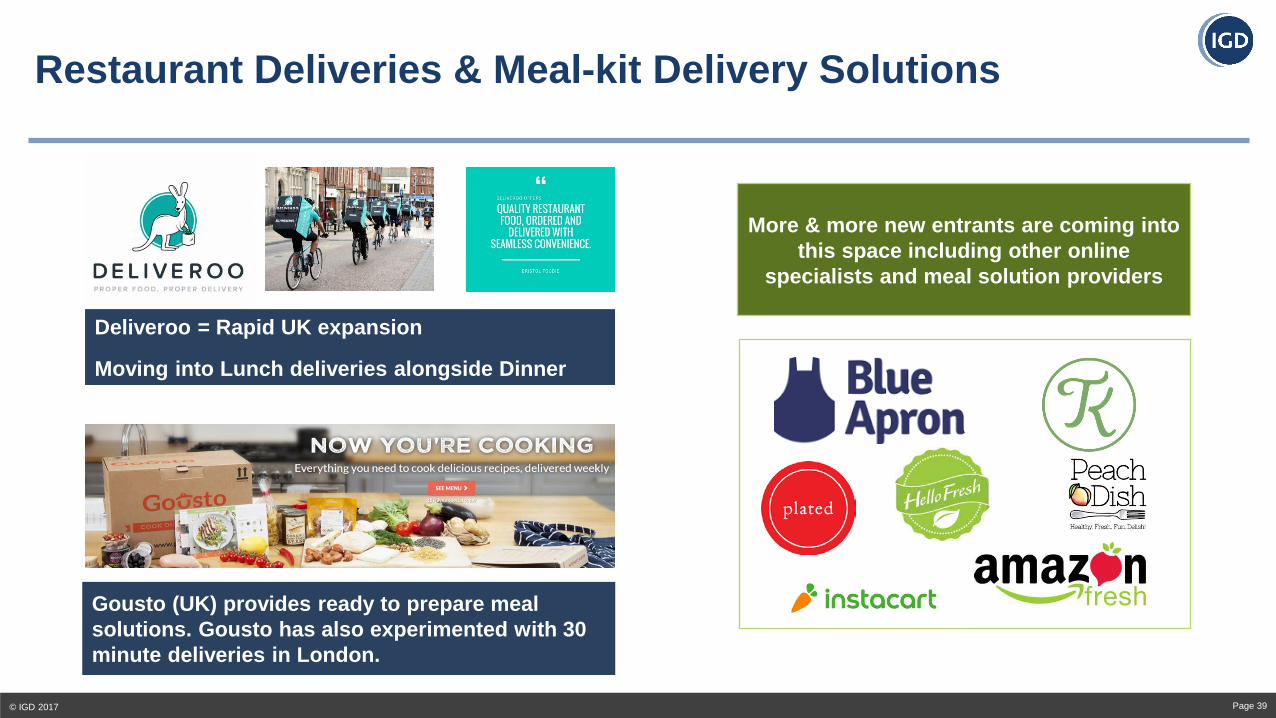
Restaurant Deliveries & Meal-kit Delivery Solutions
© IGD 2017 Page 39
More & more new entrants are coming into this space including other online
specialists and meal solution providers
Gousto (UK) provides ready to prepare meal solutions. Gousto has also experimented with 30 minute deliveries in London.
Deliveroo = Rapid UK expansion
Moving into Lunch deliveries alongside Dinner
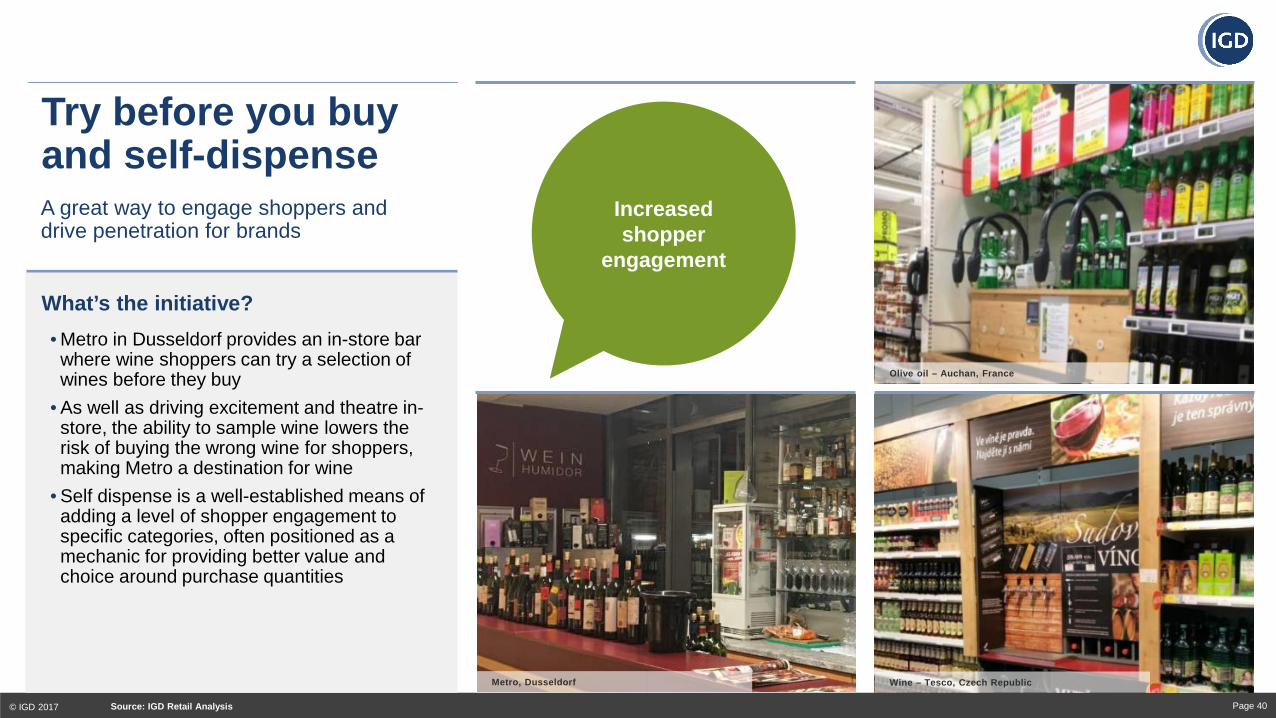
Try before you buy and self-dispense
© IGD 2017 Page 40 Source: IGD Retail Analysis
• Metro in Dusseldorf provides an in-store bar where wine shoppers can try a selection of wines before they buy
• As well as driving excitement and theatre in-store, the ability to sample wine lowers the risk of buying the wrong wine for shoppers, making Metro a destination for wine
• Self dispense is a well-established means of adding a level of shopper engagement to specific categories, often positioned as a mechanic for providing better value and choice around purchase quantities
What’s the initiative?
Olive oil – Auchan, France
Wine – Tesco, Czech Republic Metro, Dusseldorf
A great way to engage shoppers and drive penetration for brands
Increased shopper
engagement
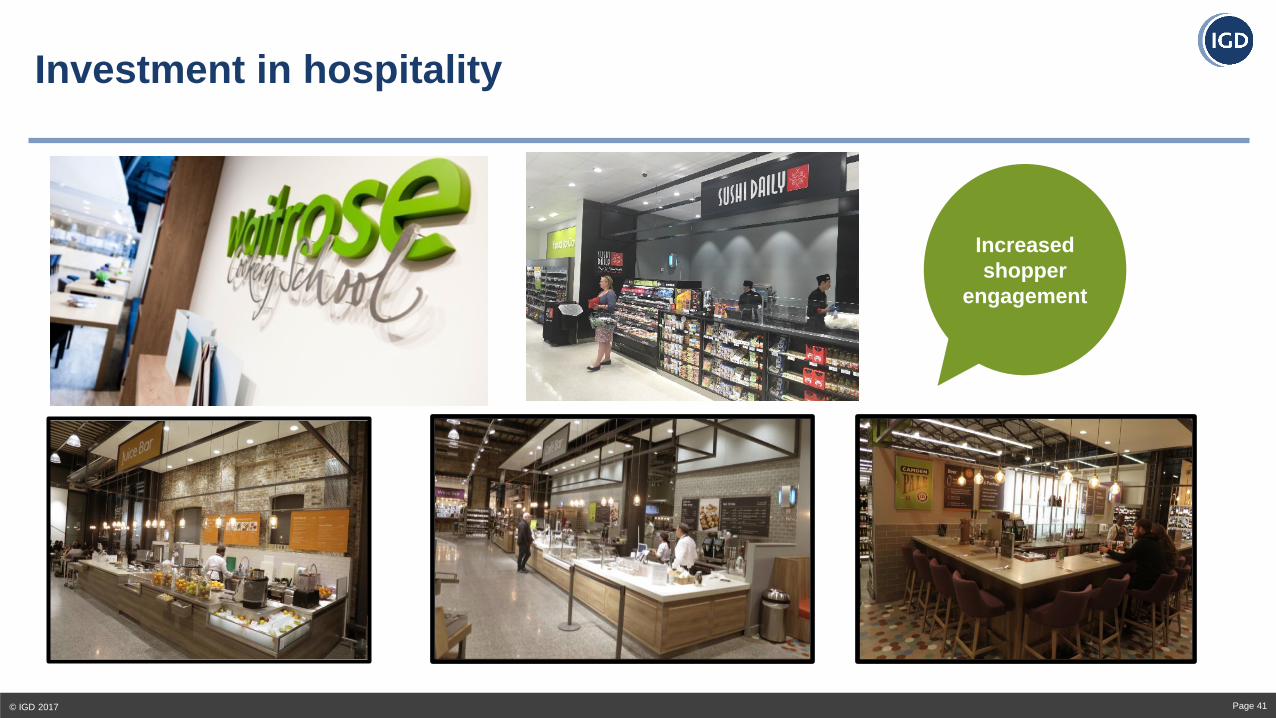
Investment in hospitality
© IGD 2017 Page 41
Increased shopper
engagement

Fulfilling anytime, anywhere purchasing demands, simply
© IGD 2017 Page 42
Omni-Channel
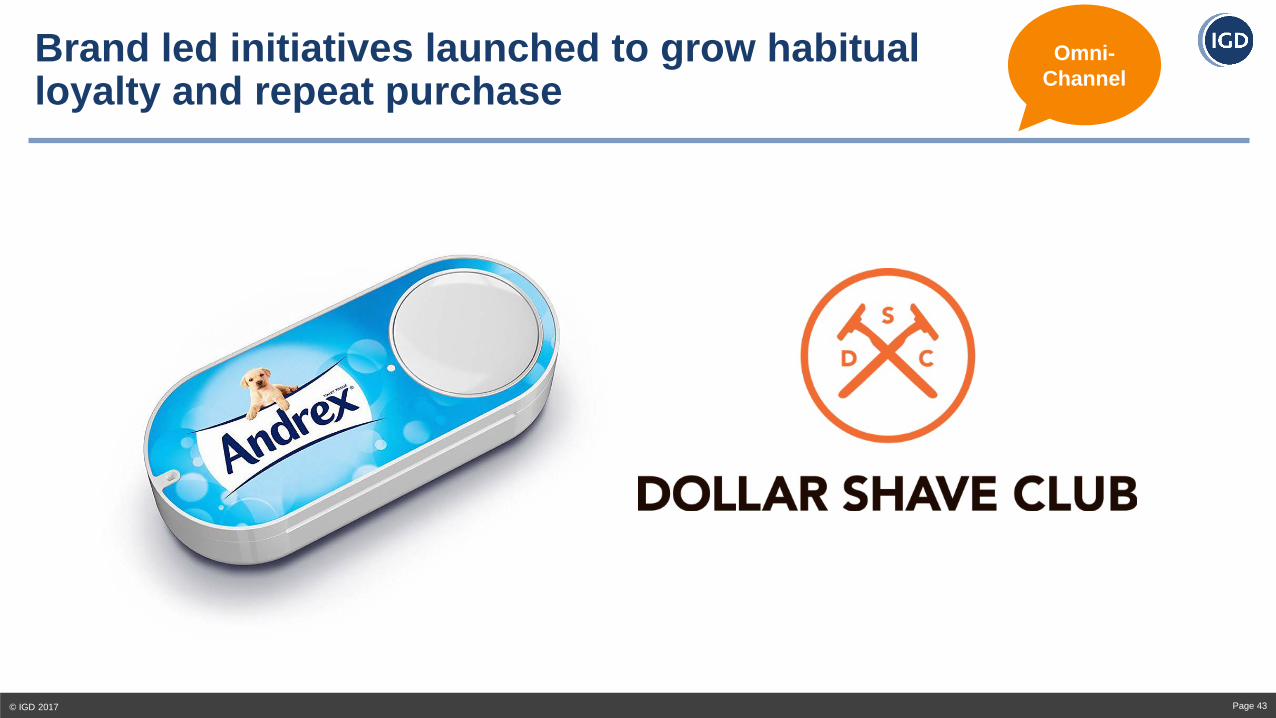
Brand led initiatives launched to grow habitual loyalty and repeat purchase
© IGD 2017 Page 43
Omni-Channel
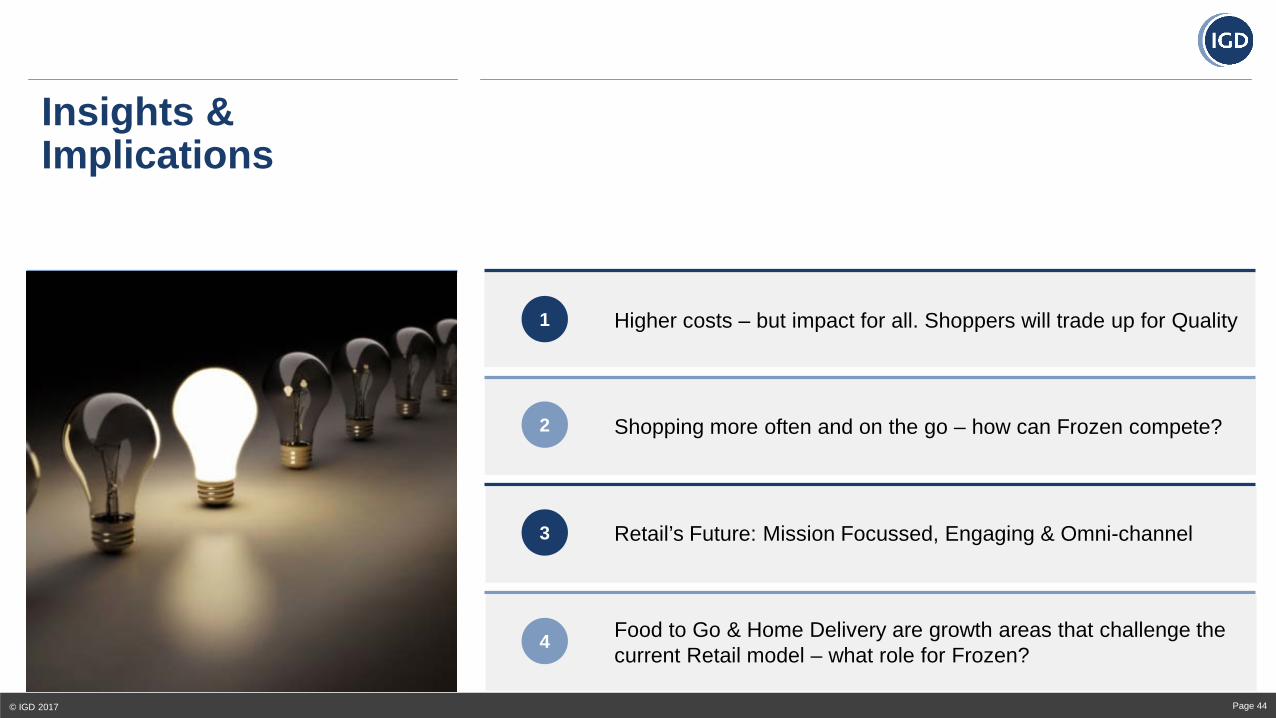
Insights & Implications
© IGD 2017 Page 44
Higher costs – but impact for all. Shoppers will trade up for Quality 1
2
3
4
Shopping more often and on the go – how can Frozen compete?
Retail’s Future: Mission Focussed, Engaging & Omni-channel
Food to Go & Home Delivery are growth areas that challenge the current Retail model – what role for Frozen?