Embed Size (px)
Citation preview

UK real estate insightsIssue 14 – November 2009
02 Introduction
04 The UK economy
08 Financial services sector
10 UK hotels: Not out of the woods yet
13 Do ‘property wrapper’ debt structuresreally work?
16 Opportunities knock for tenants
17 Landlords: The conscripted creditors?
19 The end of UK GAAP?
21 The hedging of finance costs:a suitable strategy?
23 VAT opportunity for landlords andtenants: Revoking the option to tax
26 Largest city economies in the world in2008 and 2025
28 Events
Print Quit
Contents
UK real estate insights Quit Print Home
Introduction
Welcome to the latest edition of UK real estate insights. The observant among you may notice that the October edition is coming out in November. The slight delay was so that we could include the latest data from our UK economic outlook, which was not available until this week. As the performance of real estate has increasingly become a function of deteriorating occupier fundamentals, attention has had to focus on the economic prospects. A detailed commentary on the outlook is included in this edition, but it is fair to say that the messages are mixed. The rear view look back at 2009 is not pleasant, with a GDP fall of nearly 5% and a fall in consumer demand of over 3%.
To contact any of the authors, please click on their names. For details of other real estate contacts in the UK and elsewhere, please email the UK real estate insights team.
Looking forward, despite some positive signs, it could be a tough 2010. The predictions for unemployment in particular remain gloomy. We are predicting GDP growth for 2010 of under 1% and as John Hawksworth, head of economics at PwC, said in the Independent ‘Growth of 1% would not be enough to stop unemployment rising.’ We are expecting unemployment to peak at about three million in the second half of 2010.
Recession over the last year fed through rapidly to a dramatic fall in occupier demand which in turn fed through to a dramatic fall in rents. There are some positive signs. The latest Investment Property Databank (IPD) index for the quarter to 30 September shows rents continuing to fall, but at a significantly lower rate than the preceding two quarters. As well as declining headline rents, we are seeing pressure on landlords to offer significant inducements
to tenants to keep buildings occupied. Some aspects of the incentives on offer are addressed later in this edition of UK real estate insights. Both the weakening headline rents and the cost of inducements and vacancy is increasing the cashflow pressure on landlords as well as the time involved in intensive asset management. Not all assets are performing equally. Some landlords are clearly struggling considerably more than others. There are also signs that the weakening occupier side of the equation is starting to put more pressure on the banks to take action. How long will they be prepared to wait when weakening cash flows turn loan to value covenant breaches into missed interest payments? How long will they be prepared to watch assets sinking in real rather than just notional value as disincentivised, underwater equity is unwilling to commit cash and time? Generally the banks favour an approach that avoids outright sale onto the market and often the solution will be one that does involve the existing equity owners. However, there are signs that in other cases they are losing patience and the outcome is not pleasant for the current management. Look up Matthew 25:30 in the King James Bible to get the general picture.
Continued 2

UK real estate insights Quit Print Home
Introduction Despite the gloom, there are some positive signs too. In our last edition, we noted the increasing signs of buyers from overseas returning to the UK, particularly from Germany and the Middle East, and also some homegrown recovery funds. Generally they are looking for properties with long leases and strong covenant strength tenants. This is now feeding through into yield compression for the top end of the market, and the IPD index for the quarter to 30 September shows capital growth. Overall returns are positive for the first time since 2007. We are also seeing the return of bigger transactions. There were two landmark deals in September, both by PwC clients. Blackstone bought 50% of the Broadgate Centre from British Land plc. The day after this deal was announced, the Australian sovereign wealth fund Future Fund acquired an interest in Birmingham’s Bullring from Land Securities plc.
We held our annual European Real Estate Client Conference in Berlin on 23 October 2009, attended by well over 200 of our clients and contacts. Details can be found elsewhere in this edition. My thanks are due to the participants in our industry panel, George Ochs (JP Morgan), Dr Gerhard Niesslein (IVG Immobilien AG), Stephen Shaw (RREEF), Dr Peter Otto (Eurohypo AG) and Jon Zehner (AREA Property Partners). As with previous panels, the discussion was
lively and insightful. The mood was considerably more optimistic than a year ago, and there was strong interest in the breakout session on investing in the UK. On a less positive note, there is clearly widespread concern as to the direction and impact of regulatory reform in the EU. In September we issued a newsletter on the Alternative Investment Funds Management Directive (AIFM Directive). If you wish to receive regular updates on this, please email the UK real estate insights team.
We are now starting to look forward to 2010. The process of producing the annual Emerging Trends in Real Estate® Europe, the report published by the Urban Land Institute (ULI) and PricewaterhouseCoopers in February each year, has begun. The report is based on facetoface interviews with over 200 senior figures in the real estate industry across Europe, supplemented by 300 online surveys, to give a consensus of over 500 respondents. My thanks are due to all those who have already completed a survey or interview, and to those who will do so over the next month.
Congratulations are due to entrants from the real estate industry who performed excellently in awards sponsored by PricewaterhouseCoopers last month. PwC has been presenting the Building Public Trust Awards for excellence in
corporate reporting since 2003. Throughout that time, it has never been more important than it is today for organisations to build and sustain public trust through clear, honest and accessible reporting of their strategies, activities and future plans. The awards recognise three organisations for their excellence in corporate reporting: one from each of the following sectors – FTSE 100, FTSE 250 and the Public Sector (in association with the National Audit Office). Real estate clients won two out of the three overall awards, Great Portland Estates plc winning the FTSE 250 award and The Crown Estate winning the public sector award. The Crown Estate also won the public sector award for sustainability reporting. Hammerson plc was the runner up in the FTSE 100 sustainability award and SEGRO plc runner up in the FTSE 250 sustainability award. With SEGRO rejoining the FTSE 100 after its acquisition of Brixton plc, we are looking forward to stiff competition in this category next year.
PwC is also a proud sponsor of the AIM Awards, which recognise the achievement of individuals and companies that have made a huge impact on the AIM market over the last year. Congratulations are due to Max Property Group plc, winner of the award for best newcomer.
As usual, the articles in this edition of UK real estate insights cover a broad range of topics. I hope that you find it a useful and interesting read. We are always keen to hear your views on the topics covered and to receive suggestions as to areas that we should cover in the future, either in the publication or through seminars and events, so please share your thoughts with the team.
John Forbes Real Estate Industry Leader Europe, MiddleEast and Africa PricewaterhouseCoopers LLP
3

UK real estate insights Quit Print Home
The UK economy
As discussed in previous editions of UK real estate insights, the nature of the real estate crisis has changed from a valuation crisis to one driven by increasing tenant distress. The prospects for the UK economy are therefore key. Simultaneously with the publication of this edition of UK real estate insights, we are also publishing our UK Economic Outlook. The key findings of the report are set out below.
Highlights
UK GDP is estimated in our main scenario to fall by around 4.75% in 2009, with modest average GDP growth of around 0.75% in 2010 projected in our main scenario.
• Consumer spending is estimated to fall by around 3.25% in real terms in 2009 due to the severe squeeze on consumer spending from high debt levels, tighter credit conditions, falling housing wealth and rising unemployment. We expect real consumer spending to fall by a further 0.25% in 2010 as households seek to reduce their debt burdens and return their savings ratios to more normal levels.
• One of the key factors dampening consumer spending growth in our main scenario is a further projected rise in unemployment to a peak of around three million in the second half of 2010. All regions are projected to see rising unemployment over this period.
• Business investment growth is also expected to remain weak, although this should gradually reverse during the course of 2010.
• Destocking made a major contribution to the depth of the recession, but should now have a more positive
effect on shortterm GDP growth as this process goes into reverse. But this will be only a temporary effect and the question is whether growth can be sustained beyond that point.
• Public spending growth will remain positive in 2009 and 2010, but will need to be cut back sharply in the medium term to bring under control a
budget deficit that looks likely to be at or above the Treasury’s £175 billion projection for 2009/10. Significant tax rises are also likely to be needed from 2011 onwards, over and above what the government has already announced.
Continued 4
UK real estate insights Quit Print Home
The UK economy • Net exports should provide a boost to growth this year and next as the world economy recovers faster than UK domestic demand, helped by the relative weakness of the pound (compared to typical 1996–2007 levels).
• Risks around growth in our main scenario are more balanced than earlier this year, but are still somewhat weighted to the downside. We therefore recommend that businesses should stress test their plans and valuations against an alternative ‘prolonged recession’ scenario in which negative growth continues into 2010. But an upside scenario where growth rebounds to above trend levels by the end of 2010 can also not be ruled out.
• Inflation is projected to be volatile in the short term, but should fall back below target by the end of 2010 given continued excess capacity in the economy. However, there are still considerable uncertainties around this relating to the path of global commodity prices, domestic demand growth and sterling.
• The Bank Rate is assumed to be left at 0.5% until mid2010 in our main scenario and to rise only gradually thereafter. We assume that quantitative easing is not unwound in a significant way until 2011 and beyond.
Recent developments
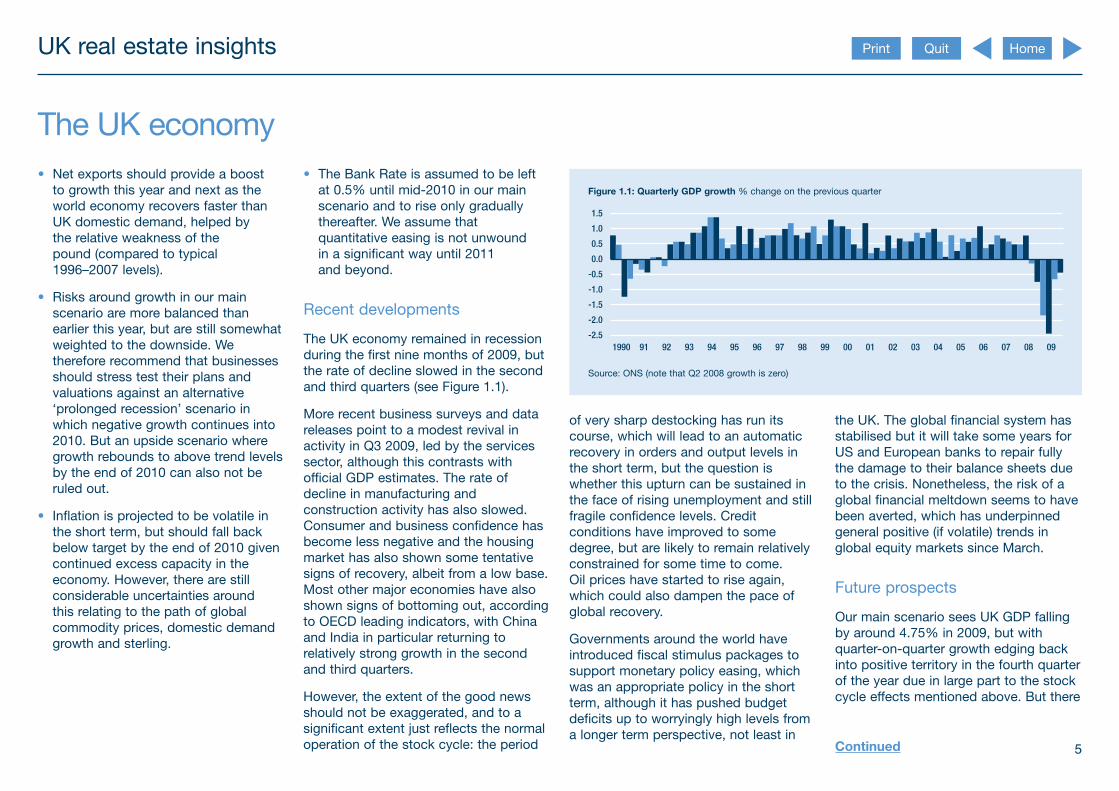
The UK economy remained in recession during the first nine months of 2009, but the rate of decline slowed in the second and third quarters (see Figure 1.1).
More recent business surveys and data releases point to a modest revival in activity in Q3 2009, led by the services sector, although this contrasts with official GDP estimates. The rate of decline in manufacturing and construction activity has also slowed. Consumer and business confidence has become less negative and the housing market has also shown some tentative signs of recovery, albeit from a low base. Most other major economies have also shown signs of bottoming out, according to OECD leading indicators, with China and India in particular returning to relatively strong growth in the second and third quarters.
However, the extent of the good news should not be exaggerated, and to a significant extent just reflects the normal operation of the stock cycle: the period
Figure 1.1: Quarterly GDP growth % change on the previous quarter
Source: ONS (note that Q2 2008 growth is zero)
1990 91 92 93 94 95 96 97 98 99 00 01 02 03 04 05 06 07 08 09 2.5
2.0
1.5
1.0
0.5
0.0
1.5
1.0
0.5
of very sharp destocking has run its course, which will lead to an automatic recovery in orders and output levels in the short term, but the question is whether this upturn can be sustained in the face of rising unemployment and still fragile confidence levels. Credit conditions have improved to some degree, but are likely to remain relatively constrained for some time to come. Oil prices have started to rise again, which could also dampen the pace of global recovery.
Governments around the world have introduced fiscal stimulus packages to support monetary policy easing, which was an appropriate policy in the short term, although it has pushed budget deficits up to worryingly high levels from a longer term perspective, not least in
the UK. The global financial system has stabilised but it will take some years for US and European banks to repair fully the damage to their balance sheets due to the crisis. Nonetheless, the risk of a global financial meltdown seems to have been averted, which has underpinned general positive (if volatile) trends in global equity markets since March.
Future prospects
Our main scenario sees UK GDP falling by around 4.75% in 2009, but with quarteronquarter growth edging back into positive territory in the fourth quarter of the year due in large part to the stock cycle effects mentioned above. But there
Continued 5
UK real estate insights Quit Print Home
The UK economy
Table 1.1: Summary of UK economic prospects
Indicator (% change on previous year)
HM Treasury forecasts (April 2009)
Independent forecasts (October 2009)
PwC Main scenario (November 2009)
2009 2010 2009 2010 2009 2010
GDP 3.75 to 3.25 1 to 1.5 4.3 1.2 4.75 0.75
Consumer spending 3.25 to 2.75 0 to 0.5 3.0 0.1 3.25 0.25
Investment 11.25 to 10.75 3.25 to 2.75 14.5 2.6 16 5
Manufacturing output 12.75 to 12.25 0.25 to 0.75 10.3 1.7 11 0
CPI (Q4) 1 1 1.7 1.8 1.75 1.75
Source: HM Treasury Budget 2009 and Survey of Independent Forecasts (average values), PwC scenario rounded to the nearest quarter of a percent. Investment refers to total fixed investment.
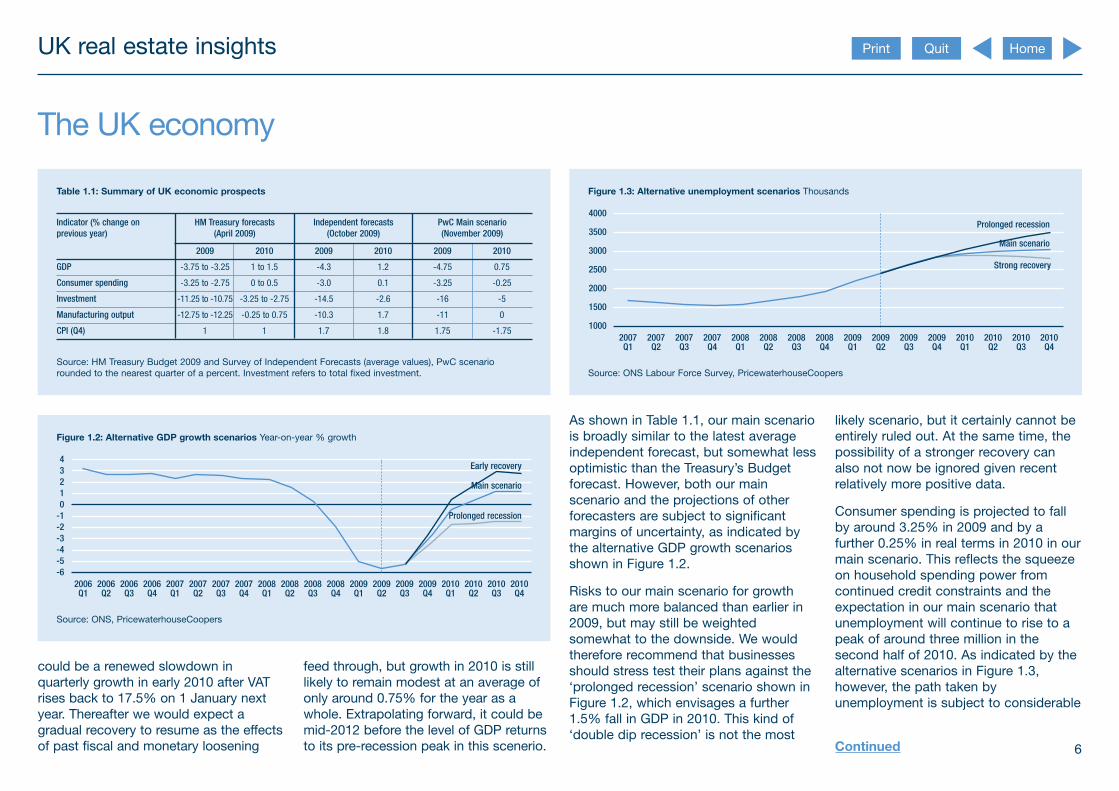
Figure 1.2: Alternative GDP growth scenarios Yearonyear % growth
Source: ONS, PricewaterhouseCoopers
2006 Q1
2006 Q2
2006 Q3
2006 Q4
2007 Q1
2007 Q2
2007 Q3
2007 Q4
2008 Q1
2008 Q2
2008 Q3
2008 Q4
2009 Q1
2009 Q2
2009 Q3
2009 Q4
2010 Q1
2010 Q2
2010 Q3
2010 Q4
6 5 4 3 2
4 3 2 1 0 1 Prolonged recession
Early recovery
Main scenario
could be a renewed slowdown in quarterly growth in early 2010 after VAT rises back to 17.5% on 1 January next year. Thereafter we would expect a gradual recovery to resume as the effects of past fiscal and monetary loosening
feed through, but growth in 2010 is still likely to remain modest at an average of only around 0.75% for the year as a whole. Extrapolating forward, it could be mid2012 before the level of GDP returns to its prerecession peak in this scenerio.
Figure 1.3: Alternative unemployment scenarios Thousands
Source: ONS Labour Force Survey, PricewaterhouseCoopers
4000
1000
1500
2000
2500
3000
3500
2007 Q1
2007 Q2
2007 Q3
2007 Q4
2008 Q1
2008 Q2
2008 Q3
2008 Q4
2009 Q1
2009 Q2
2009 Q3
2009 Q4
2010 Q1
2010 Q2
2010 Q3
2010 Q4
Strong recovery
Prolonged recession
Main scenario
As shown in Table 1.1, our main scenario is broadly similar to the latest average independent forecast, but somewhat less optimistic than the Treasury’s Budget forecast. However, both our main scenario and the projections of other forecasters are subject to significant margins of uncertainty, as indicated by the alternative GDP growth scenarios shown in Figure 1.2.
Risks to our main scenario for growth are much more balanced than earlier in 2009, but may still be weighted somewhat to the downside. We would therefore recommend that businesses should stress test their plans against the ‘prolonged recession’ scenario shown in Figure 1.2, which envisages a further 1.5% fall in GDP in 2010. This kind of ‘double dip recession’ is not the most
likely scenario, but it certainly cannot be entirely ruled out. At the same time, the possibility of a stronger recovery can also not now be ignored given recent relatively more positive data.
Consumer spending is projected to fall by around 3.25% in 2009 and by a further 0.25% in real terms in 2010 in our main scenario. This reflects the squeeze on household spending power from continued credit constraints and the expectation in our main scenario that unemployment will continue to rise to a peak of around three million in the second half of 2010. As indicated by the alternative scenarios in Figure 1.3, however, the path taken by unemployment is subject to considerable
Continued 6

UK real estate insights Quit Print Home
The UK economy uncertainty with possible outcomes at the end of 2010 ranging from 2.8 to 3.5 million (on the Labour Force survey measure).
Business investment is also likely to remain weak in 2010, reflecting both subdued final demand growth and the continued influence of relatively tight credit conditions, even if these continue
to ease over time. Housebuilding is also expected to remain relatively subdued in 2010, even if the worst of the decline in activity in this sector may now have passed.
Net exports are projected to make a positive contribution to GDP growth in 2009 and 2010 in our main scenario. The boost to exports from the fall in the
pound since 2007 should help here, together with the gradual recovery expected in the US and Euroland economies over the next year. Stronger growth in China and other emerging economies will have less direct benefit to the UK, however, as only a small share of UK exports currently go to these fastgrowing markets.
Our main scenario for UK GDP growth would be consistent with inflation (CPI) remaining below target at the end of 2010, although the path of inflation is likely to be volatile in the short run due to the impact of energy price fluctuations and the rise in VAT from 1 January 2010.
In our main scenario, it should be possible for official shortterm interest rates to be held at current low levels until mid2010 with only a gradual rise thereafter. In the medium term, there is a risk that inflation could pick up again as and when the economy recovers, which could eventually cause interest rates to rise quite sharply (perhaps in 2011 or 2012) to preempt this risk. But this is not likely to be an issue in the short term. Looking further ahead, we would expect the pace of recovery in the UK economy in 2011 and beyond to be held back by the need to get the public finances back under control in the medium term. Public spending will need to be tightly constrained in 2011 and beyond as part of a programme of fiscal
austerity, probably also including significant tax rises, that will be needed to bring down the budget deficit. We estimate that a combined additional fiscal tightening of around 1.8% of GDP (around £26 billion per annum at today’s values) could be needed by 2013/14 through some combination of additional tax rises and greater real public spending cuts than included in current Treasury plans.
This issue of UK economic outlook also includes a special article on global city GDP rankings in 2008 and projections to 2025. This is covered elsewhere in this edition of UK real estate insights.
Click here to access the full report
For further information regarding macroeconomic advice for the real estate industry, please contact Yael Selfin, who is Head of Macro Consulting, Economics in our Market & Value Advisory practice.
7
UK real estate insights Quit Print Home
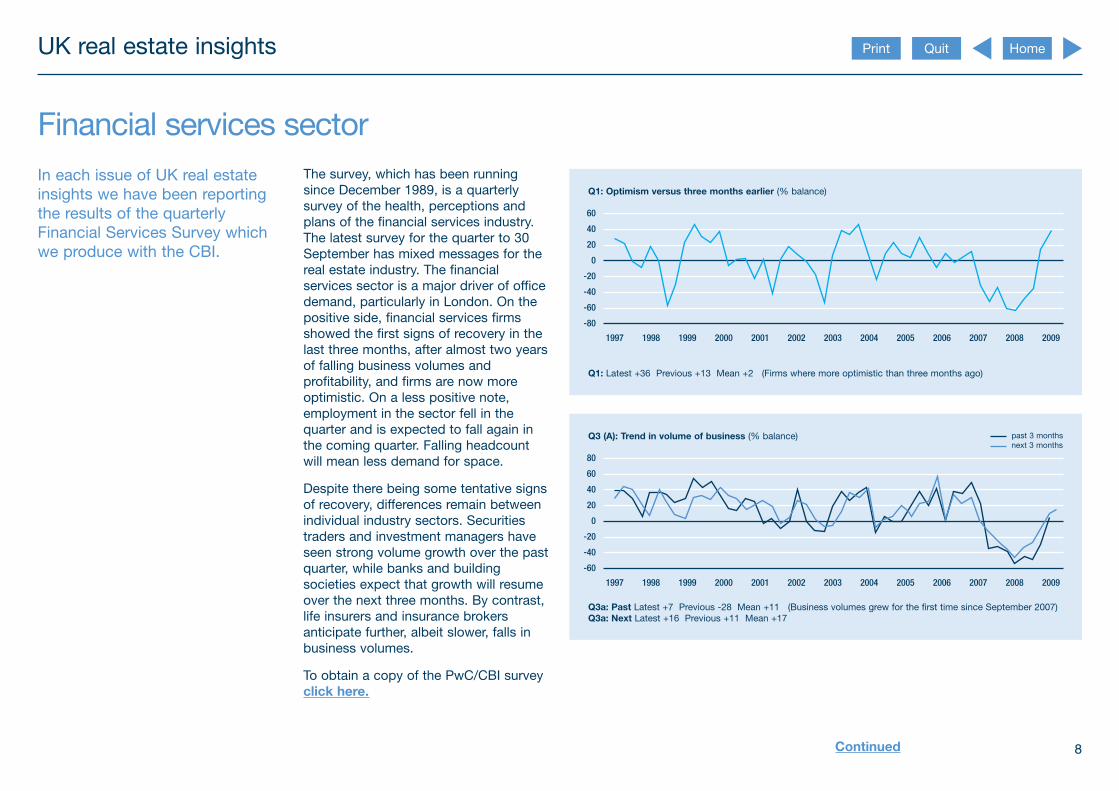
Financial services sector In each issue of UK real estate insights we have been reporting the results of the quarterly Financial Services Survey which we produce with the CBI.
The survey, which has been running since December 1989, is a quarterly survey of the health, perceptions and plans of the financial services industry. The latest survey for the quarter to 30 September has mixed messages for the real estate industry. The financial services sector is a major driver of office demand, particularly in London. On the positive side, financial services firms showed the first signs of recovery in the last three months, after almost two years of falling business volumes and profitability, and firms are now more optimistic. On a less positive note, employment in the sector fell in the quarter and is expected to fall again in the coming quarter. Falling headcount will mean less demand for space.
Despite there being some tentative signs of recovery, differences remain between individual industry sectors. Securities traders and investment managers have seen strong volume growth over the past quarter, while banks and building societies expect that growth will resume over the next three months. By contrast, life insurers and insurance brokers anticipate further, albeit slower, falls in business volumes.
To obtain a copy of the PwC/CBI survey click here.
Q1: Optimism versus three months earlier (% balance)
Q1: Latest +36 Previous +13 Mean +2 (Firms where more optimistic than three months ago)
1997 1998 1999 2000 2001 2002 2003 2004 2005 2006 2007 2008 2009
80
60
60
40
20
0
20
40
Q3 (A): Trend in volume of business (% balance)
1997 1998 1999 2000 2001 2002 2003 2004 2005 2006 2007 2008 2009
60
40
80
60
40
20
0
20
Q3a: Past Latest +7 Previous 28 Mean +11 (Business volumes grew for the first time since September 2007) Q3a: Next Latest +16 Previous +11 Mean +17
past 3 months next 3 months
Continued 8
UK real estate insights Quit Print Home
Financial services sector
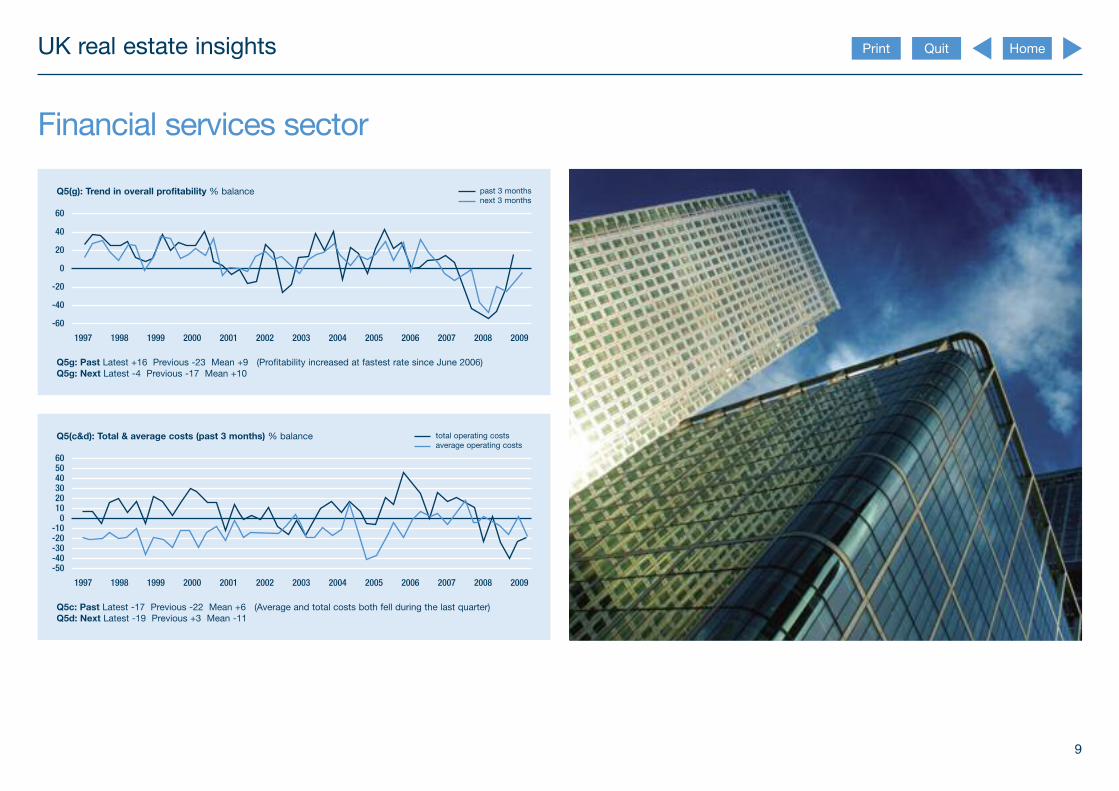
Q5(g): Trend in overall profitability % balance
Q5g: Past Latest +16 Previous 23 Mean +9 (Profitability increased at fastest rate since June 2006) Q5g: Next Latest 4 Previous 17 Mean +10
1997 1998 1999 2000 2001 2002 2003 2004 2005 2006 2007 2008 2009
60
60
40
20
0
20
40
past 3 months next 3 months
Q5(c&d): Total & average costs (past 3 months) % balance
Q5c: Past Latest 17 Previous 22 Mean +6 (Average and total costs both fell during the last quarter) Q5d: Next Latest 19 Previous +3 Mean 11
1997 1998 1999 2000 2001 2002 2003 2004 2005 2006 2007 2008 2009
50
60
10 0
20 30 40
20 30 40 50
10
total operating costs average operating costs
9

UK real estate insights Quit Print Home
UK hotels: Not out of the woods yet In recent years hotels have emerged as an attractive asset class for real estate investors. We therefore cover in UK real estate insights the findings of the PwC UK hotels forecast. The latest edition has been released recently and is covered below.
At last, seeing the wood for the trees?
Our UK hotels forecast tracks the impact on the hotel industry of the seismic events since Lehman’s collapse on the hotel industry and looks at the trading outlook for the rest of 2009 and 2010. Even though the UK economy is
beginning to show some signs of stabilisation and GDP growth is expected to resume in 2010 (albeit modest growth), the aftershocks of the worst recession for 60 years are still being felt as consumers and businesses keep their wallets firmly shut and travel less. If they are travelling, many are not keen to pay the high room rates of the past few years.
Nevertheless, there is talk that there are better times ahead and the mood among consumers and in the hotel sector is now overwhelmingly more optimistic. Our research among 60 hotel groups and investors this summer shows three quarters of hoteliers polled were more optimistic than they were six months ago. But still around 36% of operators told us they have seen no green shoots yet in the hotel sector, more than twice the proportion of those that had.
Despite this, we feel that although the current situation is bad, it could have been much worse. The weak pound has encouraged some domestic travellers to holiday at home, but more importantly, attracted European travellers to London and other tourist ‘traps’ such as Edinburgh.
Improved optimism is reflected in hoteliers’ focus, with attention turning away from managing costs to growing revenues, but it’s a delicate balance between managing occupancy and room rates, and for some businesses balance sheet restructuring is inevitable.
Continued 10

UK hotels: Not out of the woods yet But, we remain cautious for 2010
While the hotel sector has been hit by a myriad of problems, arguably the biggest problem facing the industry is businesses cutting back on corporate travel, conferences and meetings. The business travel market is a high margin business and crucial for a hotel sector recovery. In addition, consumers’ balance sheets have been badly hurt by the recession and they are focusing on price and value. UK consumer spending is expected to decline this year by 3.5%, compared to 2008, and may decline further in 2010; in any event it is unlikely to recover to prerecession levels until 2011 at the earliest.
As rates are set to remain under pressure
As a result, while rate declines should slow in 2010, economic and travel fundamentals remain weak, and despite accelerating costcutting programmes, the evidence points to more difficult trading at the end of this year. A lack of corporate travellers on peak days, trading down, customer mix effects and discounting pressures will continue to suppress room prices. We expect UK hotel average room rates (ARR) will fall by 8.1% to £77.69 a night in 2009, down from a peak of £84.53 last year – the
biggest drop since 2002, when we saw rates fall by almost 6%. In 2010, consumers should find ARR across the country at around £76, a similar rate to that in 2005 (see Table 1). In terms of UK revenues, we do not expect any growth in RevPAR (revenue per available room) for hotels this year but expect the rates of decline to ease next year, to £52.38 in 2010, down from £53.67 forecast this year and over £61 in 2008.
The price is right in London
In London, hoteliers have nimbly replaced missing corporate travellers with lowerpriced overseas and domestic holiday breaks. Aided by the strong euro, London has attracted visitors keen to take advantage of some of the lowest prices for many years. Hoteliers have sacrificed room rates to keep their hotels busy. It proves that if the price is right, London remains a ‘mustsee’ destination for both UK and global travellers. For this reason, occupancy is expected to remain at around 79% for both 2009 and 2010, a drop of only 200 bps from the peak in 2007. A return to growth in room rates, however, is still not on the horizon and falls of almost 10% this year and a further 4.7% in 2010 could take room rates down to £105 – almost £20 lower than they were in 2008.
Table 1: Baseline scenario (premised on 4.6% GDP decline in 2009 and 0.3% GDP growth in 2010) % growth on previous year
2009 2010
UK London Provinces UK London Provinces
Occupancy 4.3 1.2 6.0 0.2 1.0 0.9
ARR 8.1 9.8 6.6 2.2 4.7 0.0
RevPAR 12.1 10.9 12.3 2.4 3.8 1.0
Economic Forecasts: PricewaterhouseCoopers August 2009 Benchmarking Data: STR Global August 2009
UK real estate insights Quit Print Home
A even harder slog outside London
The provinces don’t have London’s universal appeal, except for a few honey pot centres, and are heavily dependent on domestic corporate business demand. As a result, the options for switching business are narrower and we feel further discounting will not be enough to prevent occupancy rates falling to about 64% in both 2009 and 2010, levels not seen since the early 1990s. Coupled with a 6.6% fall in room rates in 2009, our scenario anticipates that RevPAR will fall by 12.3% in 2009 and drop a further 1% in 2010.
Continued 11
UK real estate insights Quit Print Home
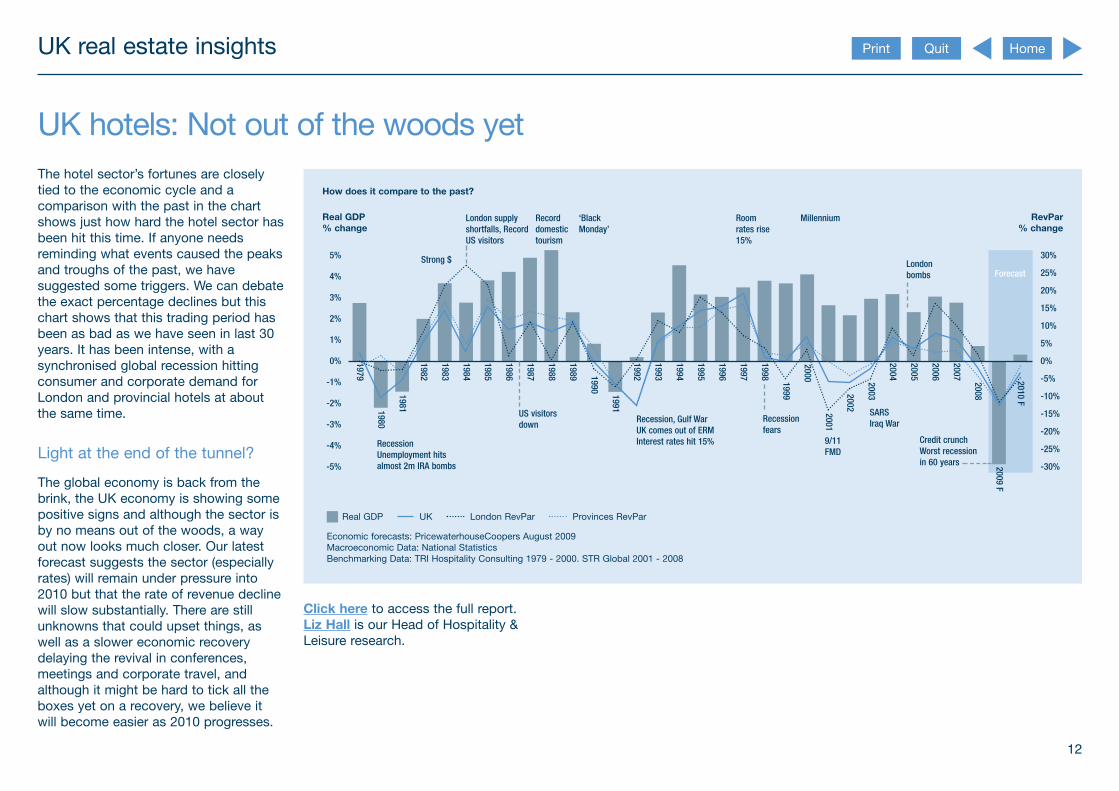
UK hotels: Not out of the woods yet The hotel sector’s fortunes are closely tied to the economic cycle and a comparison with the past in the chart shows just how hard the hotel sector has been hit this time. If anyone needs reminding what events caused the peaks and troughs of the past, we have suggested some triggers. We can debate the exact percentage declines but this chart shows that this trading period has been as bad as we have seen in last 30 years. It has been intense, with a synchronised global recession hitting consumer and corporate demand for London and provincial hotels at about the same time.
Light at the end of the tunnel?
The global economy is back from the brink, the UK economy is showing some positive signs and although the sector is by no means out of the woods, a way out now looks much closer. Our latest forecast suggests the sector (especially rates) will remain under pressure into 2010 but that the rate of revenue decline will slow substantially. There are still unknowns that could upset things, as well as a slower economic recovery delaying the revival in conferences, meetings and corporate travel, and although it might be hard to tick all the boxes yet on a recovery, we believe it will become easier as 2010 progresses.
How does it compare to the past?
Real GDP UK London RevPar Provinces RevPar
Economic forecasts: PricewaterhouseCoopers August 2009 Macroeconomic Data: National Statistics Benchmarking Data: TRI Hospitality Consulting 1979 2000. STR Global 2001 2008
3%
2%
1%
0%
1%
2%
5%
4%
3%
Real GDP % change
4%
5%
20%
15%
10%
5%
0%
5%
30%
20%
10%
RevPar % change
25%
30%
25%
15%
1979
1980
1981
1982
1983
1984
1985
1986
1987
1988
1989 1990 1991
1992
1993
1994
1995
1996
1997
1998 1999
2000
2001
2002
2003
2004
2005
2006
2007 2008
2009 F
2010 F
London supply shortfalls, Record US visitors
Strong $
Record domestic tourism
‘Black Monday’
Room rates rise 15%
Millennium
London bombs Forecast
Recession Unemployment hits almost 2m IRA bombs
US visitors down
Recession, Gulf War UK comes out of ERM Interest rates hit 15%
Recession fears
9/11 FMD
SARS Iraq War
Credit crunch Worst recession in 60 years
Click here to access the full report. Liz Hall is our Head of Hospitality & Leisure research.
12

UK real estate insights Quit Print Home
Do ‘property wrapper’ debt structures really work?
A common structure for financing the acquisition of real estate assets involves the securing of debt finance on individual assets within a specially incorporated entity, termed a ‘property wrapper’ or special purpose vehicle (‘SPV’) which is the sole borrower under a new debt finance agreement.
The intended benefit of this debt structure is that it offers the ultimate owner of the SPV (the ‘Parent’) a degree of flexibility in terms of disposal of the assets and a degree of separation from the SPV’s banking arrangements. Should the time arise when the payment of loan interest and principal becomes more difficult, in theory, the SPV may default on payments on that loan without also triggering a default of other loans held by it, the Parent or other subsidiary companies of the Parent (together the ‘Group’).
However, this critically assumes the absence of crossdefault clauses in the debt finance agreement of the SPV. It is not uncommon to discover such clauses have been historically included in existing debt finance agreements (generally only strong covenant borrowers will have been able to negotiate these out of agreements) and they are now more likely than not to be included in new facilities. Recent experience has seen lenders take a more conservative approach to risk, arguing that they require new facilities to be in line with Loan Market Association standard practice which will enable them to transfer the debt should they wish.
In the current market conditions, using an SPV as borrower, particularly a newly incorporated entity with which the lender is not familiar, will mean that while Know
Your Customer (KYC) requirements for the SPV itself may not be that difficult to manage, the lender will probably want to understand the structure above the SPV and will therefore have extensive KYC requirements in relation to the Parent and even the material ultimate beneficial owners of the Group.
The majority of debt finance agreements include a covenant to pay all amounts due and to comply with the covenants, terms and conditions of the debt finance agreement, but usually have a grace period (of 14 or 21 days) in which to remedy a breach on any of those terms
Continued 13

UK real estate insights Quit Print Home
Do ‘property wrapper’ debt structures really work? so as to avoid a formal event of default being triggered. Where a breach of covenant has occurred (the most common breach currently being the breach of the loantovalue covenant), in the most serious cases it will mean that the SPV will need to either repay part of the principal, provide additional security or place an amount of cash on deposit in escrow so that such a default will be deemed to be cured and no formal default will be called by the lender.
As grace periods are short, realistically the SPV would have to move very quickly to avoid triggering an event of default for a breach of covenant. It is questionable whether most borrowers would be able to act quickly if they need to source cash from alternative sources to be able to pay down the loan or place money on deposit. It is therefore likely that borrowers will only be able to remedy a minor breach of covenant within the given grace period to avoid a formal event of default.
Faced with a choice between cash curing relevant grace period or defaulting on the loan, there are a number of reasons why a borrower should be cautious about following the latter course of action:
• In the event that a default by the Borrower leads to the appointment of
the debt default within the a receiver, the receiver may seek to may have less tolerance towards recover amounts from creditors of the renegotiating or refinancing those Borrower, including other Group arrangements; companies with outstanding inter
• An actual default might have a group balances; detrimental effect on the perception of
• If the same lender has exposure to investors, financiers and other other companies in the Group through stakeholders of the Group – this is other finance arrangements, the lender especially true of public companies
where mandatory announcements to the market are necessary in relation to such matters.
Assuming no crossdefault clauses are included in the debt finance documentation (although this will be rare in practice), there are advantages in securing debt in a property wrapper, in particular:
• It may be possible to sell the shares of the property wrapper (where the debt may be sold with the asset), subject to the negotiation of change of control clauses in commercial contracts and the debt finance agreement and subject to obtaining any other necessary consents;
• It restricts the exposure of shareholders of the parent to individual assets and their associated liabilities;
• The structure may provide an option to troubled landlords in recessions where an interested party may wish to assume ownership of an asset and the associated debt obligation for little or no injection of cash.
When considering whether a property wrapper structure really does limit the recourse of a lender to the Parent and
Continued 14

UK real estate insights QuitPrint Home
Do ‘property wrapper’ debt structures really work? wider Group upon default by an SPVunder the debt finance agreement, it isimportant to note that the SPV will oftenhave few or no assets prior to theacquisition of property for whichfinancing is being obtained. As a result,the lender will often seek to take securityhigher up the structure, for example fromthe Parent or members of a partnership
SPV via debentures or guarantees.For this reason a property wrapper willnot necessarily mean that bankingarrangements will solely involve the SPVwith no further recourse up the corporatestructure. Cross-default provisions areusually drafted to catch defaults by an‘obligor’ which will include the Borrower,as well as any guarantors or other
security providers, so the cross defaultof any other entity giving security will becaught. The wording of cross-defaultprovisions will need to be carefullyconsidered in the drafting.
From a tax perspective, there should beno significant issues associated withimplementing arrangements of this type.However, where lenders enforce securityarrangements, this can potentially havetax consequences for the Borrower(and any guarantor or other securityprovider within the Group) depending onthe tax profile of the Borrower, Parentand the wider Group and the nature ofthe assets secured.
Conclusion
If the aim of implementing a ‘propertywrapper’ structure is to reduce the riskof recourse to the Parent or other Groupcompanies upon an event of defaultoccurring under a debt financeagreement where no subsequent cashcure is possible within specified timeframes, the structure may not have thedesired effect of avoiding such recourse.In addition, Groups may need to altertheir normal practices to ensure they donot ‘taint’ the non-recourse nature of thearrangements. The practical reality ofsuch arrangements is that Groupcompanies will probably be required toprovide security for SPV borrowers, as
risk-adverse lenders are taking a belt-and-braces approach to their securityrequirements.
Where it is possible to structure debtfacility documentation in a way that doesnot provide a lender with recourse to aParent or the wider Group, there remainsome advantages to securing debt onindividual assets in a property wrapper.However, these advantages are mainlytransactional in terms of ease of thesale of the SPV along with its debtarrangements, and will usually be subjectto the negotiation of change of controlclauses in the relevant debt financeagreements.
Sandra Dowling leads our UK RealEstate Assurance team. Grant Lee is asenior manager in the same team.Stephen Taylor is a partner in ourBanking and Capital markets tax team.Peter Churchill is a senior manager inthe same team. Simon Hardwickleads our real estate team at PwC Legal.Annalie Croney is a solicitor in thesame team.
15

UK real estate insights Quit Print Home
Opportunities knock for tenants
In a tenant’s market, the boundaries are being pushed on lease negotiations and the incentives that are being sought to occupy new premises. We are seeing some unprecedented lease inducements being offered by landlords – such as the reported six year rent free period being given to Nomura to take their new lease at Watermark Place.
But whilst the going is good for tenants, it could be improved for the joint benefit of the tenant and the landlord. Detailed consideration of the tax issues surrounding the inducements offered by landlords could provide even greater value to a deal. This must be good news for landlords when the right structuring can give commercial benefit to them as well as the tenant.
Inducements typically come in the form of:
• reverse premiums, being oneoff cash payments from a landlord to a prospective tenant;
• contributions by the landlord to the tenant’s fitout costs; and
• rentfree periods.
Each of these are treated differently for tax purposes and can have tax inefficiencies associated with them, in particular:
• Reverse premiums are generally assessed as taxable income on the tenant but there is no immediate (and possibly no) tax relief for the landlord.
• Contribution to fitout costs may fall outside the taxable income assessment but only if the contribution meets costs which would otherwise qualify for capital allowances, which in turn reduces the allowances that the tenant can claim. Contributions to expenditure which doesn’t qualify for capital allowances will continue to be assessed as taxable income. Furthermore, there are some traps here. For example, payments made by the landlord on behalf of the tenant, to contractors for example, would be a taxable receipt, as could the cost of a fitout met by a landlord that serves the tenant’s particular needs.
• Rentfree periods, whilst appearing to offer the best position, may have hidden catches. There is no immediate cash outflow (a key consideration for landlords in these difficult times), the monetary equivalent of the rentfree period is not taxed and there is a reduced stamp duty land tax liability on the grant of the lease. However, this type of inducement reduces a tenant’s tax relief on rental payments, and the accounting treatment of the rentfree period can mean that landlords may suffer tax before actually receiving any rent.
The optimum solution should take account of the posttax cost of the proposal and will vary depending on the tax attributes of the parties involved. There are ways to manage any tax inequalities and the best solution might well be a variation on one of the three ‘standard’ alternatives referred to above. With some careful structuring, the landlord and tenant may well be able to reach a more taxefficient solution and share the benefit of the savings.
It follows that it is imperative that the tax considerations are incorporated into the negotiation process by both the tenant and landlord at an early stage to maximise the possible winwin solution.
Natalie Pecenicic is a solicitor in the real estate team at PwC Legal. Kevin Leaver is a director specialising in real estate tax.
16

UK real estate insights Quit Print Home
Landlords: The conscripted creditors?
Commercial property landlords and tenants are finding life tough in the current economic climate. This has highlighted the innate tension between landlords and administrators of tenant companies. In this article, a tricky area of law and practice is discussed by two partners of PricewaterhouseCoopers: Amanda Crowe, a lawyer who acts for landlords, and Barry Gilbertson, a surveyor who focuses on business recovery.
Landlords are, in one important respect, different from other creditors. If you supplied components to the car manufacturing industry and one of your customers went into administration, then common sense dictates that you would immediately stop supplying that customer unless and until you could strike a deal with the administrator guaranteeing payment for the new stock. A landlord is not, however, able to take this action. It cannot stop supplying its premises, as the moratorium created by the administration, means that it cannot recover possession of its premises, or the rent for them, without either the consent of the Administrator, or the leave of the Court, which can be difficult and expensive to obtain.
It is easy to see that it is right, given the intention of the legislation, for a company in administration to remain in occupation of premises for a period of time in order that the Administrator can review the business and sell any viable assets or the business itself to optimise returns for the body of creditors as a whole – including the landlord(s). The question to ask is whether a landlord should have the protection of knowing that the rent will be paid for the period of the Administrator’s occupation, and that the length of that occupation must be reasonable? Surprisingly, notwithstanding the experiences of the early 1990s and the advent of the
Enterprise Act 2002, the law is still unclear about such aspects of insolvency.
Some administrators take the view that if premises are used for the purposes of the administration then rent is a priority expense. Others take a different view. Even among those administrators who
view rent as a priority expense there is a lack of consistent approach as to what constitutes ‘use’ for these purposes. Scenarios range, at one end of the spectrum, from an administrator using office premises to run the business, or to collect old debts, or to rationalise stock,
Continued 17

UK real estate insights Quit Print Home
Landlords: The conscripted creditors? where many would agree that the premises are being used for the purpose of the administration, to the other end of the scale where an administrator has removed everything from warehouse premises other than a few unwanted pieces of furniture and some rubbish, where few, if any, impartial observers would think it appropriate to pay rent. Judgement calls are more difficult where
a buyer of part of an insolvent business has been allowed into space as licensee pending an assignment of the lease and perhaps a renegotiation of the lease terms. When does occupation for the purpose of the administration end? When the buyer moves in? When the administrator is paid the whole of the price for the business?
A welladvised landlord asks an administrator to confirm that he will be paying rent but it can be difficult to get the administrator to respond to such a question in the early days of a complex administration, when protecting the business, and the jobs, assumes a naturally greater importance. The premises will still be there in a few weeks’ time, but the value in the business may well have evaporated. It is also true to say that, depending on the date of the administration, the rent may already have been paid by the company for the next three months in advance. Under such circumstances a landlord's only option is to apply to the Court, but the cost of doing so can be prohibitive in the context of the amount of one quarter’s rent.
Difficulties also arise for a landlord where a buyer of a viable part of a business moves into premises as a licensee and an application is made not only for a licence to assign but also to renegotiate the lease terms. The law on consent for assignment is welltrodden and the insolvency of a tenant is immaterial for these purposes. The attempted lease renegotiation is much more of an issue for a landlord. Whilst it does not, as a matter of law, have to agree to any lease changes, its hands are tied by the moratorium created by the administration. In such circumstances, the effect of the moratorium is to shield
the wouldbe new tenant (whose occupation may be in breach of the terms of the lease) rather than to protect the insolvent tenant.
Amanda Crowe is a real estate partner in PwC Legal. Barry Gilbertson is a real estate partner in our Business Recovery team and is a member of the Bank of England Property Forum.
General guidance on insolvency terminology and procedures is included in the following brief guide: http://www.pwc.co.uk/pdf/insolvency in_brief.pdf
18

UK real estate insights Quit Print Home
The end of UK GAAP?
The beginning of the end?
The end of UK GAAP is nigh and will impact virtually all UK companies, as well as offshore vehicles applying UK GAAP.
While the change is unlikely to occur before 2012, we recommend that companies start considering the impact now. The beginning of the end?
On 19 July 2009 the International Accounting Standards Board (IASB) published its reporting standard for companies that are not publicly accountable ('IFRS for Small and Mediumsized Entities'(SMEs)). The standard
provides a simplified version of IFRS, with far less onerous disclosure requirements, but also measurement differences.
The IASB’s intention is that companies can adopt IFRS for SMEs if they meet the relevant scope criteria. These will be if (a) their securities are not listed and (b) they are not a financial institution. IFRS for SMEs is therefore expected to be an option for 99% of private companies globally, as well as unlisted subsidiaries of listed groups.
Application in individual countries will depend upon local company law. In the UK, the Accounting Standards Board (ASB) issued a consultation paper on 11 August 2009, setting out a proposed threetier structure for accounting:
Tier 1: listed companies and all ‘publicly accountable’ entities would apply IFRS as adopted in the EU.
Tier 2: all other UK entities (except those in Tier 3) could apply the IFRS for SMEs.
Tier 3: small entities could choose to continue using the (Financial Reporting Standard for Smaller entities) FRSSE.
The definition of what constitutes a ‘publicly accountable entity’ will be crucially important, and the ASB is seeking views on this.
The ASB is proposing mandatory adoption of IFRS for SMEs for nonpublicly accountable entities from 2012 (with comparatives bringing the transition date forward to 1 January 2011).
The majority of UK property groups will therefore need to make a choice between full IFRS and IFRS for SMEs. For public companies this will be a subsidiary company issue.
How will it impact property companies?
While UKlisted property groups adopt IFRS on consolidation, their subsidiaries generally apply UK GAAP. This is also the case for most privately owned property companies, including fund investments vehicles (UK and offshore based) and subsidiaries of nonUK holding companies.
As individual company accounts drive tax and distributable profits (and hence shareholder returns), and often regulatory returns, the change in UK GAAP could have an even greater impact than the ‘IFRS big bang’ in 2005.
Continued 19
UK real estate insights Quit Print Home
The end of UK GAAP? Tax The finer details of the impact of converting to IFRS for SMEs will need to be worked through, but based on conversions to full IFRS differences generally fall into four categories:
1) No impact on tax;
2) Impact mirrors change in financial statements;
3) Impact differs in timing and amount from impact in financial statements;
4) Impact on transition only.
Recognising which category applies is the key to reaching an informed position on the impact of reporting under the new GAAP.
Distributable profits A PwC survey conducted in 2005 found distributable profits to be the main reason why IFRS was not pushed down by groups into their subsidiaries. Some of these issues have been removed as a result of amendments to IFRS. However, application of full IFRS generally leads to greater volatility (and a reduction in) distributable profits. The same appears true of the SME standard.
Other considerations Both IFRS and IFRS for SMEs have more onerous disclosure requirements than UK GAAP, particularly in relation to relatedparty transactions.
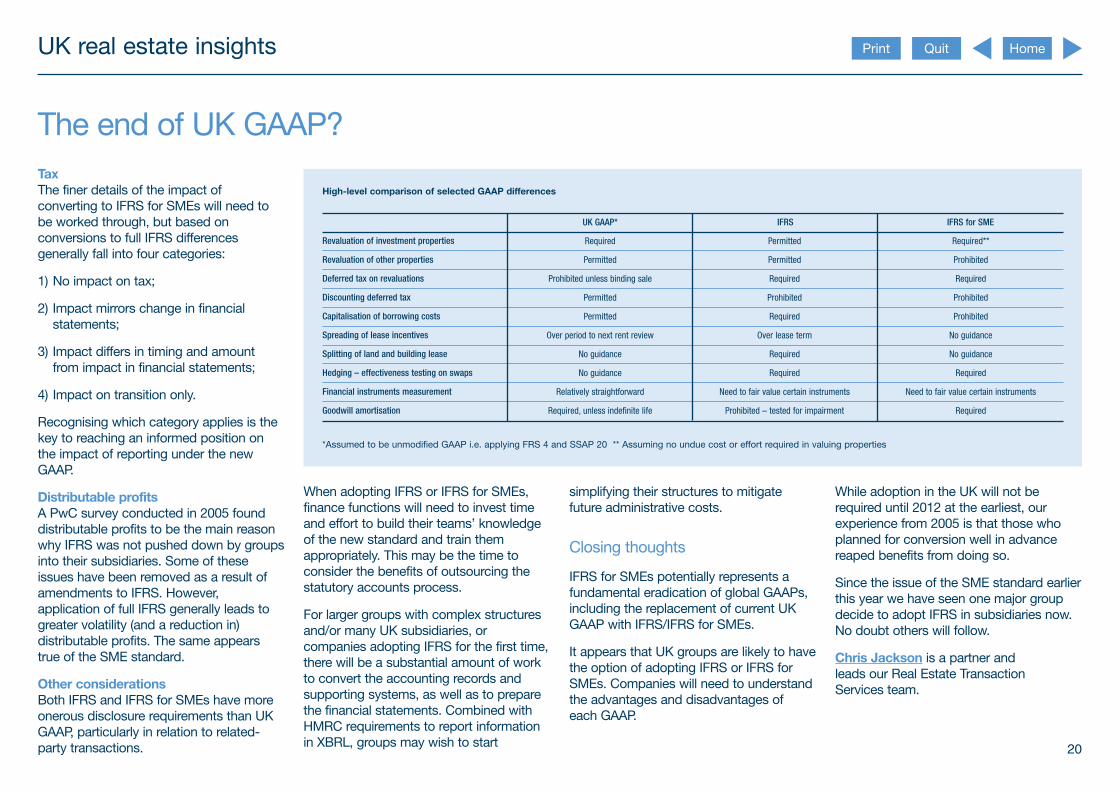
Highlevel comparison of selected GAAP differences
UK GAAP* IFRS IFRS for SME
Revaluation of investment properties Required Permitted Required**
Revaluation of other properties Permitted Permitted Prohibited
Deferred tax on revaluations Prohibited unless binding sale Required Required
Discounting deferred tax Permitted Prohibited Prohibited
Capitalisation of borrowing costs Permitted Required Prohibited
Spreading of lease incentives Over period to next rent review Over lease term No guidance
Splitting of land and building lease No guidance Required No guidance
Hedging – effectiveness testing on swaps No guidance Required Required
Financial instruments measurement Relatively straightforward Need to fair value certain instruments Need to fair value certain instruments
Goodwill amortisation Required, unless indefinite life Prohibited – tested for impairment Required
*Assumed to be unmodified GAAP i.e. applying FRS 4 and SSAP 20 ** Assuming no undue cost or effort required in valuing properties
When adopting IFRS or IFRS for SMEs, simplifying their structures to mitigate finance functions will need to invest time future administrative costs. and effort to build their teams’ knowledge of the new standard and train them Closing thoughts appropriately. This may be the time to consider the benefits of outsourcing the IFRS for SMEs potentially represents a statutory accounts process. fundamental eradication of global GAAPs,
including the replacement of current UK For larger groups with complex structures GAAP with IFRS/IFRS for SMEs. and/or many UK subsidiaries, or
companies adopting IFRS for the first time, It appears that UK groups are likely to have there will be a substantial amount of work the option of adopting IFRS or IFRS for to convert the accounting records and SMEs. Companies will need to understand supporting systems, as well as to prepare the advantages and disadvantages of the financial statements. Combined with each GAAP. HMRC requirements to report information in XBRL, groups may wish to start
While adoption in the UK will not be required until 2012 at the earliest, our experience from 2005 is that those who planned for conversion well in advance reaped benefits from doing so.
Since the issue of the SME standard earlier this year we have seen one major group decide to adopt IFRS in subsidiaries now. No doubt others will follow.
Chris Jackson is a partner and leads our Real Estate Transaction Services team.
20
UK real estate insights Quit Print Home
The hedging of finance costs: A suitable strategy?
It is common practice for Investment Property Companies to hedge their finance interest cost cash flows.
Sometimes this is a contractual requirement – a requisite of the lender or a condition in the terms and conditions of listed debt. Typically this is done through the use of interest rate swaps (‘swaps’ or individually a ‘swap’), where interest costs on floating rate debt are swapped to fixed interest rates until a maturity date written in the contract.
Even where this is not contractually required, commercially it makes sense, given the longterm contractual nature of rental income.
The margin between finance costs and rental income is then ‘locked in’. Any management initiatives to grow the rental income for that property or group of properties, and impose upwardonly rent reviews on those leases, then add further upside to this margin.
In the past this made sense, and especially in times of a more bullish outlook for the UK economy, such as during 2005 and 2006. However, there is doubt as to whether, in the current market and in the short term, this strategy remains beneficial, for the following reasons:
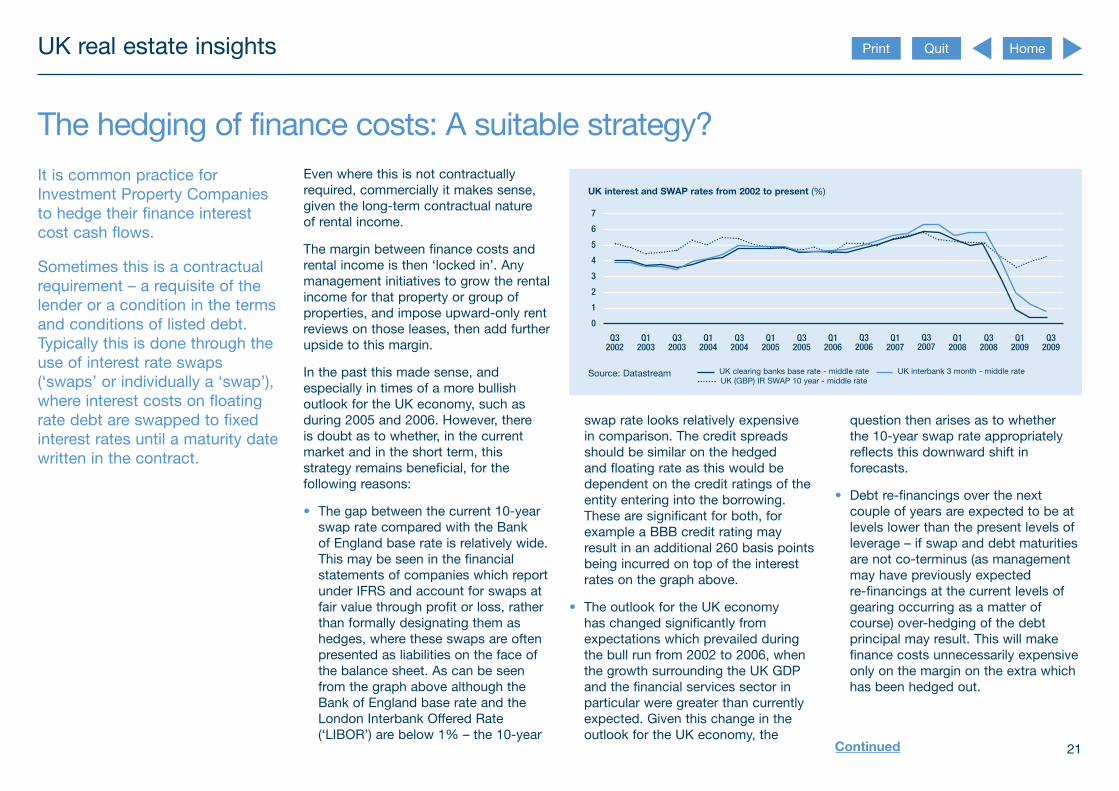
• The gap between the current 10year swap rate compared with the Bank of England base rate is relatively wide. This may be seen in the financial statements of companies which report under IFRS and account for swaps at fair value through profit or loss, rather than formally designating them as hedges, where these swaps are often presented as liabilities on the face of the balance sheet. As can be seen from the graph above although the Bank of England base rate and the London Interbank Offered Rate (‘LIBOR’) are below 1% – the 10year
UK interest and SWAP rates from 2002 to present (%)
Source: Datastream
Q3 2002
Q1 2003
Q3 2003
Q1 2004
Q3 2004
Q1 2005
Q3 2005
Q1 2006
Q1 2007
Q1 2008
Q3 2008
Q1 2009
Q3 2009
0
1
7
6
5
4
3
2
Q3 2007
Q3 2006
UK clearing banks base rate middle rate UK interbank 3 month middle rate UK (GBP) IR SWAP 10 year middle rate
swap rate looks relatively expensive in comparison. The credit spreads should be similar on the hedged and floating rate as this would be dependent on the credit ratings of the entity entering into the borrowing. These are significant for both, for example a BBB credit rating may result in an additional 260 basis points being incurred on top of the interest rates on the graph above.
• The outlook for the UK economy has changed significantly from expectations which prevailed during the bull run from 2002 to 2006, when the growth surrounding the UK GDP and the financial services sector in particular were greater than currently expected. Given this change in the outlook for the UK economy, the
question then arises as to whether the 10year swap rate appropriately reflects this downward shift in forecasts.
• Debt refinancings over the next couple of years are expected to be at levels lower than the present levels of leverage – if swap and debt maturities are not coterminus (as management may have previously expected refinancings at the current levels of gearing occurring as a matter of course) overhedging of the debt principal may result. This will make finance costs unnecessarily expensive only on the margin on the extra which has been hedged out.
Continued 21

UK real estate insights Quit Print Home
The hedging of finance costs: A suitable strategy?
• Options to break the contract may be exercised by lenders (otherwise known as callable interest rate swaps) and may lead to unexpected lump sum cash outflows. However, in practice this will depend on the bank’s assessment of cash flows, the impact on going concern of the business of the borrower and the ongoing relationship between the bank and the borrower.
When considering hedging, management will have a view of risk, which will also include the outlook for the UK economy and the expected recovery of GDP and consumer spending. Although current forecasts vary, some expect rates to remain flat for the remainder of the year and increase only gradually through to 2012. For those able to secure further floating rate debt and therefore thinking
about entering into new swap contracts, it might be worth waiting until the disparity between the relatively expensive 10year swap rate and LIBOR has narrowed. Another consideration would be entering into fixed rate debt rather than floating rate and then swapping this, which may result in a more advantageous rate.
With pressures on the rent roll caused by tenants entering into administration and the renewal of leases at lower levels of passing rent, and therefore no reversions in the market, does it make sense to fix the rate? Reversions will return, but it is a question of when. For now it might make more sense to maintain floating rate and hedge when they return. The payment of debt servicing costs at floating rate rather than a higher swap rate at current market rates is one way to do this.
However, there remain benefits to hedging, the more conspicuous ones being:
• It allows the accurate forecast of finance cash outflows.
• Another consideration is the accounting of fair value changes in the income statement. Under IFRS, there is an option to formally designate interest rate swaps as formal hedges. Although these requirements are
onerous, they do result in less volatility in the income statement and therefore bottom line profit.
• Certainty of finance cash flows when appraising property developments or the issuance of new debt, through the use of forwardstarting swaps.
Conclusion
Whilst the strategy of hedging depends on the investment property companies’ appetite for risk, the large disparity between the 10year swap rate and LIBOR, at least for the short term, may call this strategy into question. This disparity also results in some potentially large cash sum requirements from callable swaps, when the counterparty has an option to break the swaps and in turn leads to pressures on free cash at a time when access to it is limited. However, key benefits of this strategy remain, for instance, the ability to accurately forecast finance cash outflows, especially whilst lenders and other stakeholders are increasingly interested in such forecasts.
Grant Lee is a senior manager in our Real Estate Assurance team. Chris Mutch is a director in our Real Estate Transaction Services team.
22

UK real estate insights Quit Print Home
VAT opportunity for landlords and tenants: Revoking the option to tax
When the ‘Option to Tax’ provisions came into force in the UK on 1 August 1989 as a result of the infraction proceedings by the EU against the UK over the scope of what could, until then, be Zero Rated under UK VAT law, little if any thought was given to the longterm effects of the new provisions.
It was therefore the case that once a property owner had opted to tax, the effect of that decision lasted in perpetuity, and considerable concern was expressed at the time by both landlords and tenants that a twotier property market would be created. Of course, those were the days before we had antiavoidance legislation, which in certain circumstances disapplies the option, and hence renders it as ineffective as if it had not been made in the first place.
But the legislation which introduced the option to tax created something like a virus; once a property became ‘infected’ by the option to tax virus, it was there for ever, and simply could not be got rid of. And that state of affairs was not changed when antiavoidance legislation disapplying the option was introduced. The option to tax is not destroyed when the antiavoidance legislation applies – like many viruses it simply remains dormant, lying in wait for new circumstances (i.e new transactions) to arise which did not trigger the disapplication. When those circumstances arise, the option to tax ‘infection’ reappears. It has never gone away.
The concept of an option, when exercised, having an infinite lifespan quickly proved unpalatable for property owners, who lobbied for something with
a much more finite lifespan, and eventually, Parliament, as part of a wider drive by the government of the day to simplify great tranches of tax legislation, amended the legislation to allow the option to tax to be revoked – but not until at least 20 years after it had been made.
In an article in this publication just over a year ago, we pointed out that in August
2009, 20 years would have passed since the first Option to Tax was made. The summer is now behind us, and therefore some property owners are now in the enviable position of being able to decide whether or not to make their supplies of property nonVATable on a permanent basis by revoking the option.
Continued 23
UK real estate insights Quit Print Home
VAT opportunity for landlords and tenants: Revoking the option to tax Every silver lining has a cloud, and revoking the option to tax means that all further supplies of that property will be VATexempt, and making VATexempt supplies of course means that any VAT incurred on costs will not be recoverable.
So why on earth would a property owner/landlord want to revoke his option to tax given that it will mean that he can no longer recover VAT incurred on costs?
In many cases, landlords will be asked by their tenants to do so. Tenants whose business activities involve making VATexempt supplies – typically such businesses include virtually all finance sector businesses, private sector healthcare suppliers, funeral directors, opticians, book makers, bingo halls casinos and other betting and gaming businesses, universities and other education providers, to name but a few – will not be able to recover the VAT they are charged when they rent or buy property. Most public sector organisations and third sector organisations such as charities are in the same situation – they too cannot recover VAT they are charged when they rent or buy property.
Rather less obvious candidates who may well feel inclined to ask a landlord to revoke his option to tax will include some of the UK’s bestknown retail and high street retailers, who may have
diversified over the years to include VATexempt services in the range of goods and services they provide to their customers.
Exempt and partlyexempt businesses, and public sector bodies occupying a large number of small retail premises and/or individual large offices therefore often suffer significant amounts of irrecoverable VAT on their rental payments. They are likely to see that they now have an opportunity to remove the VAT being charged by requesting that the landlord revoke his option to tax where it is possible for him to do so under the new revocation rules. Such a revocation is almost certain to involve the landlord suffering additional irrecoverable VAT, and landlords contemplating revocation will have to consider whether an adjustment to net rent (and if so, how much) is required.
Thus it is now possible for tenants who cannot recover VAT they incur when they rent or buy property to make that VAT cost disappear by persuading their landlord to revoke his option it is also possible for landlords who would suffer irrecoverable VAT on their costs if they revoke to be able to offset their increased VAT costs through an appropriate increase in the rent.
Landlords therefore need to be ready to deal with requests from tenants to
revoke the option to tax, and tenants need to be ready to negotiate with landlords to persuade them to do so. With goodwill and sensible negotiations on both sides, it will be possible to achieve a winwin scenario.
This is not ‘VAT planning’ or ‘abusive’ – HMRC is, and always has been, aware of the fiscal consequences for the Exchequer of allowing revocation – rather it is sensible VAT management using a specific relief which has been introduced.
So what’s the catch?
The catch is that there are conditions to be met before a property owner can revoke an option to tax.
Subject to a number of other conditions, where the landlord has owned the property and opted to tax it at the introduction of the option to tax on 1 August 1989, this should be possible immediately. Given the volatility of the property market over the last 20 years, there may not be too many property owners today who have held properties for 20 years or more, and who made an option to tax on a property, 20 years or more ago.
But even where revocation is not possible immediately, it may well be possible to plan for the possibility of
revocation over a period of months as the 20year anniversary of original options to tax approaches. A rolling programme of planned revocations across a tenanted portfolio of properties may be the most viable project for many landlords, as it will give them time to enter into commercial negotiations with tenants.
It also provides a landlord with time to consider the detailed technical rules covering revocation.
The revocation rules!
The option to tax is not revocable for 20 years. The ability to revoke an option to tax therefore became effective on 1 August 2009, if the option to tax was exercised at the outset. If the option was made, for example, on 1 November 1989, then it is eligible to be revoked with effect from 1 November 2009.
There is a system of both automatic revocations (ie where no permission is required from HMRC) and revocation by consent of HMRC.
Broadly, in order to revoke an option to tax automatically where an interest in the property is still held, the following conditions must be met:
Continued 24

UK real estate insights Quit Print Home
VAT opportunity for landlords and tenants: Revoking the option to tax
1. The property must have been opted by the holder of the relevant interest for 20 years or more.
2. The property must not still be subject to current capital goods scheme (CGS) adjustment periods for the opter.
3. No supply of the property should have been made at less than market value in the last 10 years.
4. There should be no prepayment in respect of any supply related to the building which will take place after the option to tax is revoked.
If all the above conditions are met then the landlord is able to revoke its option to tax without HMRC’s permission, although a written notification of revocation still needs to be made to HMRC.
Whilst many properties are likely to have undergone refurbishment work during the last 10 years, they will only be capital goods scheme items for the landlord if the landlord has carried out the works and the normal rules apply (i.e. £250k expenditure etc). Many works, in particular the fit out of retail premises, are likely to have been carried out by the tenant and the capital item will be the tenant’s. If the tenant has outstanding CGS periods, this does not impact on the landlord’s ability to revoke.
If condition 1 is met but not all of the remaining conditions are met, a landlord can apply for permission to HMRC to revoke its option to tax. In determining whether or not to grant permission, HMRC will consider whether the landlord or a third party has received a VAT benefit. In other words, HMRC will want to see that the impact of revocation in advance of the end of the landlord’s CGS adjustment periods will not give rise to a net VAT loss. So this remains a viable option for tenants who will wish to persuade their landlord to explore the possibility of revocation.
Where condition 2 is not met, it may be possible for a landlord to dispose of their capital goods scheme item, to allow for automatic revocation. So again, this is not an absolute bar to a successful revocation.
What next?
Broadly speaking, whether you are a property owner who could be asked by a tenant to consider revocation, or a tenant who is asking your landlord not to charge VAT on your rent, the steps you will need to take are as follows:
1. Identify and prioritise relevant properties;
2. Landlord agreement in principle;
3. Model the cost benefit for both the tenant and the landlord;
4. Specific landlord & tenant agreement;
5. Implementation.
The benefits could be significant – an absolute VAT saving for exempt and partly exempt tenants, and increased rental income for landlords.
Hugh Love is a director and leads our Real Estate VAT team.
25

UK real estate insights Quit Print Home
Largest city economies in the world in 2008 and 2025
As indicated elsewhere in this issue of UK real estate insights, the current edition of UK economic outlook also includes a special article on global city GDP rankings in 2008 and projections to 2025. The latter reveal the growing significance of cities such as Shanghai, Beijing, Mumbai, Sao Paulo and Moscow as the centre of economic gravity shifts from the G7 to the emerging markets. It also shows the importance of the big cities: the top 30 in our list accounted for an estimated 18% of total world GDP in 2008.
Cities tend to be ranked in size national statistical agencies) to produce Our analysis reemphasises the according to their populations, but to a ranking by GDP at Purchasing Power economic significance of the world’s assess the relative size of their Parity (PPP) exchange rates of the largest cities. The top 30 such cities economies we also need to take account largest 100 urban economies in the ranked by GDP accounted, according to of their average income per capita levels. world in 2008 (updating our earlier our estimates, for around 18% of world Doing this in a consistent and estimates from 2005). The precise GDP in 2008, and this share rises to comprehensive way at a global level is rankings are dependent on the around 30% for the top 100 cities. challenging, but in our report, we have definitions and data sources adopted, pieced together data from a number of but looking at GDP gives a much better reputable sources (e.g. the OECD, the indication of relative economic size than UN and the World Bank, as well as just looking at population.
Continued 26

Largest city economies in the world in 2008 and 2025
Table 1.2: Top 30 urban agglomeration GDP rankings in 2008 and illustrative projections to 2025 (using UN definitions and population estimates)
Rank Cities ranked by estimated 2008 GDP at PPPs
Est. GDP in 2008 ($bn at PPPs)
Cities ranked by projected 2025 GDP at PPs
Est. GDP in 2025 ($bn at 2008 PPPs)
Est. GDP in 2025 ($bn at 2008 PPPs)
1 Tokyo 1479 Tokyo 1981 1.7%
2 New York 1406 New York 1915 1.8%
3 Los Angeles 792 Los Angeles 1036 1.6%
4 Chicago 574 London 821 2.2%
5 London 565 Chicago 817 2.1%
6 Paris 564 Sao Paulo 782 4.2%
7 Osaka/Kobe 417 Mexico City 745 3.9%
8 Mexico City 390 Paris 741 1.6%
9 Philadelphia 388 Shanghai 692 6.6%
10 Sao Paulo** 388 Buenos Aires 651 3.5%
11 Washington DC 375 Mumbai (Bombay) 594 6.3%
12 Boston 363 Moscow 546 3.2%
13 Buenos Aires 362 Philadelphia 518 1.7%
14 Dallas/Fort Worth 338 Hong Kong 506 2.7%
15 Moscow*** 321 Washington DC 504 1.8%
16 Hong Kong 320 Osaka/Kobe 500 1.1%
17 Atlanta 304 Beijing 499 6.7%
18 San Francisco/Oakland 301 Boston 488 1.8%
19 Houston 297 Delhi 482 6.4%
20 Miami 292 Dallas/Fort Worth 454 1.8%
21 Seoul 291 Guangzhou 438 6.8%
22 Toronto 253 Seoul 431 2.3%
23 Detroit 253 Atlanta 412 1.8%
24 Seattle 235 Rio de Janeiro 407 4.2%
25 Shanghai 233 San Francisco/Oakland 406 1.8%
26 Madrid 230 Houston 400 1.8%
27 Singapore 215 Miami 390 1.7%
28 Sydney 213 Istanbul 367 4.2%
29 Mumbai (Bombay)**** 209 Toronto 352 2.0%
30 Rio de Janeiro** 201 Cairo 330 5.0%
Rising by more than 3 places
Source: PwC estimates and projections using UN population data and definitions (see Section III below for further details of data sources and methodology used). Growth rates in final column relate to the cities ranked by projected GDP in 2025 in the fourth column of the table.
UK real estate insights Quit Print Home
At present, as Table 1.2 shows, the megacities of the major developed economies continue to lead the global GDP rankings, with the top six in 2008 being Tokyo, New York, Los Angeles, Chicago, London and Paris (using UN definitions). Only seven emerging economy cities are currently in the top 30 (Mexico City, Sao Paulo, Buenos Aires, Moscow, Shanghai, Mumbai and Rio de Janeiro), but our illustrative projections suggest that they will all move up the GDP rankings by 2025 and be joined in the top 30 by fastgrowing cities such as Istanbul, Beijing, Guangzhou and Cairo. Tellingly, we expect the largest emerging market cities to grow at a faster rate (between 6%–7% pa) than the cities in advanced economies (ca 2%), leading to cumulative growth of up to nearly 200% for the period under investigation (2008–25). This is in contrast to advanced economy cities whose cumulative growth will be only around 35%.
According to our illustrative projections, London is projected to grow somewhat faster than leading rivals such as Tokyo, New York and Chicago, moving up from 5th place in 2008 to 4th place by 2025. However, other ‘old Europe’ cities like Milan, Madrid and Rome seem likely to slide down the rankings as the emerging megacity economies of Asia and Latin America rise. Smaller UK cities such as
Birmingham, Manchester and Leeds, while continuing to grow at reasonable rates in absolute terms, will also tend to fall down the relative GDP rankings.
Our projections for individual cities are subject to many uncertainties, but our conclusion that the emerging economy cities as a group should increase their relative weight in the global economy seems likely to be robust. But the cities of the established developed economies should see this as more of an opportunity than a threat as it gives opportunities for them to specialise further in those areas (e.g. business and financial services, entertainment and media, fashion, cultural tourism) where they have potential comparative advantages in fastgrowing global markets. Competition between cities, as between nations, should not be seen as a zero sum game.
Click here to access the full report
For further information regarding macroeconomic advice for the real estate industry, please contact Yael Selfin, who is Head of Macro Consulting, Economics in our Market & Value Advisory practice.
27

UK real estate insights Quit Print Home
Events
European Real Estate Conference 2009 Berlin, Germany Friday 23 October 2009
PricewaterhouseCoopers once again hosted a successful European Real Estate Client Conference in Berlin on 23 October 2009. Through these events, our goal is to provide delegates with fresh insights on the current challenges we all face, especially in the light of the recent market events.
The conference opened with a plenary presentation on ‘Real estate – the developing crisis’ followed by a panel discussion by experts from the industry; George Ochs (JP Morgan), Dr. Gerhard Niesslein (IVG Immobilien AG), Stephen Shaw (RREEF), Dr. Peter Otto (Eurohypo AG) and Jon Zehner (AREA Property Partners).
The plenary session was followed by four streams of topical breakouts:
• Investment opportunities in the UK, Germany and Central and Eastern Europe;
• Raising capital – what investors want in the new environment/raising capital from Middle Eastern and German investors;
• The new environment – sustainability and the impact of climate change/real estate as a regulated asset class/ operating with harsher tax;
• New opportunities, new challenges – what tenants want and what they are prepared to give/buying, selling and restructuring debt/managing risk, managing cost, learning the lessons from business failures.
If you would like to discuss these or any other topical issues, or would like to receive a copy of the slides for any of these sessions, please don't hesitate to contact the PricewaterhouseCoopers real estate insights team or your local PricewaterhouseCoopers contact directly.
28

UK real estate insights Quit Print Home
PricewaterhouseCoopers provides industryfocused assurance, tax, and advisory services to build public trust and enhance value for its clients and their stakeholders. More than 155,000 people in 153 countries across our network share their thinking, experience and solutions to develop fresh perspectives and practical advice.
This report is produced by experts in their particular field at PricewaterhouseCoopers, to review important issues affecting the financial services industry. It has been prepared for general guidance on matters of interest only, and is not intended to provide specific advice on any matter, nor is it intended to be comprehensive. No representation or warranty (express or implied) is given as to the accuracy or completeness of the information contained in this publication, and, to the extent permitted by law, PricewaterhouseCoopers firms do not accept or assume any liability, responsibility or duty of care for any consequences of you or anyone else acting, or refraining to act, in reliance on the information contained in this publication or for any decision based on it. If specific advice is required, or if you wish to receive further information on any matters referred to in this paper, please speak with your usual contact at PricewaterhouseCoopers or those listed in this publication.
© 2009 PricewaterhouseCoopers LLP. All rights reserved. “PricewaterhouseCoopers” refers to PricewaterhouseCoopers LLP (a limited liability partnership in the United Kingdom) or, as the context requires, the PricewaterhouseCoopers global network or other member firms of the network, each of which is a separate and independent legal entity.