Embed Size (px)
Citation preview

Ukraine World Bank Rural Finance Project (P076553)
Initial Feasibility Study of Developing Weather Index Insurance
Crop Disaster Assistance in Ukraine: Issues, Alternatives, and Consequences
Report prepared by
Jerry R. Skees, Ulrich Hess, and Hector Ibarra1
December, 2002
1. Skees is president of GlobalAgRisk; Hess is with the International Finance Corporation of the World Bank Group; Ibarra is director of reinsurance with Argoasemex in Mexico. This report was conducted as an initial feasibility study for using index-based agricultural insurance in Ukraine as part of a World Bank Rural Finance Project (P076553). The objectives of this study were: 1) to perform an initial assessment of developing and introducing weather index and other index-based insurance in Ukraine; and 2) to educate and familiarize key stakeholders in the Ukraine with the concepts of index-based insurance and to inform the rural finance and agricultural insurance policy making process of the potential consequences on their current legislation. A number of professionals contributed to the overall effort. The authors wish to thank the Deputy Prime Minister Kazachenko and the head of the Agrarian Policy secretariat, Dr. Shevzov, for hosting and helping with meetings and guidance for the mission. World Bank professionals in Kiev were also instrumental in helping organize meetings inside Ukraine. A complete list of those we met while in Ukraine appears in Appendix A. Our sincere gratitude is extended to all who spent time helping us understand more about Ukraine and this issue in particular. As with any undertaking of this nature, our translations and assessments of information we gathered is subject to error. We apologize for any misinterpretations of the information and welcome comments and feedback to correct any errors. The corresponding author can be reached at [email protected]. Anne Goes contributed to Section 4 of this report. Finally, a personal thank you is extended to Celeste Sullivan for her diligence in editing and formatting this report.

Crop Disaster Assistance in Ukraine: Issues, Alternatives, and Consequences Table of Contents
ii
Skees, Hess, Ibarra
Table of Contents
Table of Contents.....................................................................................................................ii
Illustrations...............................................................................................................................v
Figures ..................................................................................................................................................v Tables ...................................................................................................................................................v
Executive Summary ................................................................................................................vi
Why Weather Index Insurance?.......................................................................................................... vii Main Findings of the Initial Assessment............................................................................................. viii
Agriculture in Ukraine ......................................................................................................................................viii Risk Profile for Ukrainian Farmers ................................................................................................................... ix Link: Rural Finance Crop Insurance ............................................................................................................ ix Risk Profile of Ukraine Agriculture.................................................................................................................... ix The Likely Cost of Farm-Level Crop Insurance in Ukraine ............................................................................... x Insurance Sector in General.............................................................................................................................. x Crop Insurance in Ukraine................................................................................................................................ xi Reinsurance ....................................................................................................................................................xiii Proposed Compulsory Crop Insurance ...........................................................................................................xiii Prototype Weather Index Insurance Contract .................................................................................................xiv Regulatory Framework .................................................................................................................................... xv Infrastructure: Weather Data and Weather Stations ....................................................................................... xv Weather Index Development...........................................................................................................................xvi Backstop Facility for Weather Risk Insurance Retention in the Ukraine.........................................................xvi Education and Familiarization Work During the Mission................................................................................xvii
Comments on the Feasibility of Weather Index Insurance in the Ukraine ........................................ xvii Future Assessments for Evaluating the Potential of Index-Based Insurance ...................................xviii
A. Conduct a full feasibility study................................................................................................................... xviii B. Pilot project .................................................................................................................................................xix C. Phase I: Investment phase .........................................................................................................................xix D. Phase II: Sustainable private sector-led weather index insurance.............................................................xix E. Expenditure items .......................................................................................................................................xix F. Technical assistance (regulatory, feasibility, dissemination, education).....................................................xix G. Goods .........................................................................................................................................................xix H. Backstop facility ..........................................................................................................................................xix
Section 1: Experience with Multiple-Peril Crop Insurance ...................................................1
Requirements for Multiple-Peril Crop Insurance ...................................................................................2 The U.S. Federal Crop Insurance Program ..........................................................................................2 Actuarial Performance of the Crop Insurance Programs ......................................................................3 Compulsory Crop Insurance in Ukraine ................................................................................................6

Crop Disaster Assistance in Ukraine: Issues, Alternatives, and Consequences Table of Contents
iii
Skees, Hess, Ibarra
Section 2: Reinsurance............................................................................................................7
Problems with Traditional Markets ......................................................................................................10 New Market Instruments for Sharing Catastrophe Risk ......................................................................10
Exchange-Traded Indexes .............................................................................................................................. 11 Risk-Linked Securities..................................................................................................................................... 12
Markets for Weather-Based Securities ...............................................................................................12 Reinsurance and Weather Markets.....................................................................................................13 Conclusion ..........................................................................................................................................13
Section 3: Finding a Better Approach to Crop Insurance: Index Insurance Alternatives 15
Prototype Weather Index Insurance Contract for Ukraine ..................................................................16 Experience with Index Insurance ........................................................................................................17 Basis Risk ...........................................................................................................................................18 Summary of the Relative Advantages and Disadvantages of Index Insurance ..................................20
Section 4: Assessing the Market for Agricultural Insurance in Ukraine ...........................23
The Status and Structure of the Agricultural Sector in Ukraine...........................................................24 Farm Size and Ownership Patterns ....................................................................................................24 Access to credit and financial services ...............................................................................................25 Risk Profile for Ukrainian Farmers ......................................................................................................25 Demand for Agricultural Insurance: Links to Rural Finance................................................................26
Section 5: Modeling Risk for Major Crops in Ukraine .........................................................29
Methodology for Developing Loss Cost Estimates..............................................................................30 Aggregation of Indemnities and Liabilities...........................................................................................32 Mapping Crop Risk in Ukraine ............................................................................................................33
Section 6: The Ukrainian Risk Profile...................................................................................35
Likely Cost of Farm-Level Insurance...................................................................................................37
Section 7:Development of the Insurance Market of Ukraine During the 1990s ................38
Insurance Market for the Period 1995-2001: Major Performance Indicators ......................................39 Analysis of the Actual Insurance Market .............................................................................................40
Market Structure .............................................................................................................................................. 42 Market Distribution by Line of Business .......................................................................................................... 42 Underwriting Results ....................................................................................................................................... 43
Supply of Agricultural Insurance .........................................................................................................44

Crop Disaster Assistance in Ukraine: Issues, Alternatives, and Consequences Table of Contents
iv
Skees, Hess, Ibarra
Profitability Analysis of the Industry ....................................................................................................46 Investment Risk ..................................................................................................................................47 Reinsurance........................................................................................................................................48 Other Possibilities for Supplying Index Insurance Contracts ..............................................................50
Section 8: Considering the Regulatory Framework for Index-Based Insurance Products .............................................................................................52
Regulatory History...............................................................................................................................52 Weather Index Insurance in the Ukrainian Regulatory Framework.....................................................53 Weather Derivative Versus Weather Index Insurance ........................................................................53 The Relevance of Compulsory Crop Insurance in Ukraine .................................................................55 Regulatory Capacity............................................................................................................................55 The Current Regulatory Set-up in Ukraine..........................................................................................56 Weather-Risk Reinsurance and Moral Hazard....................................................................................56 Other Issues for the Ukraine Regulatory Regime ...............................................................................56
Section 9: Designing a Risk Management Component of the Rural Finance Project ......58
Description of Sub-Component: Weather Index Insurance Products..................................................58 Weather-Risk Transfer Mechanism: International Reinsurance and the Ukraine Government (GoU) Backstop Facility .................................................................................................................................59 Summary of Benchmarks....................................................................................................................60
A. Full feasibility study..................................................................................................................................... 60 B. Pilot project ................................................................................................................................................. 60 C. Phase I: Investment phase ......................................................................................................................... 61 D. Phase II: Sustainable private sector-led weather index insurance............................................................. 61 E. Expenditure items ....................................................................................................................................... 61 F. Technical assistance (regulatory, feasibility, dissemination, education)..................................................... 61 G. Goods ......................................................................................................................................................... 61 H. Backstop facility .......................................................................................................................................... 61
Backstop Facility for Weather-Risk Insurance Retention in Ukraine...................................................61
Appendix A: List of Meetings................................................................................................65
Appendix B: Soils in Ukraine ................................................................................................67
Major Topographical Features ............................................................................................................67 Major Soil Types .................................................................................................................................67
Appendix C: FAS Assessment of Ukraine, June 2002 ........................................................68
References..............................................................................................................................71

Crop Disaster Assistance in Ukraine: Issues, Alternatives, and Consequences Lists of Illustrations
v
Skees, Hess, Ibarra
Illustrations
Figures 1.1: The Relationship Between Administrative Expenses and Actuarial Performance ........................................ 4 2.1: Independent Versus Correlated Risk.................................................................................................................... 7 2.2: Hypothetical Loss Function for Private Hail Versus MPCI ............................................................................. 8 3.1:The Relationships Between Estimating Farm Yields, the Number of Observations, and the Standard
Deviation of Farm Yields ..................................................................................................................................... 19 5.1: Actual and Detrended Yields for Wheat in Zaporizhia ................................................................................... 30 5.2: Map of Value of Five Crops by Oblast .............................................................................................................. 32 5.3: Map of Relative Risk in Ukraine Using a 95 Percent Area-Yield Insurance Program ................................ 33 6.1: Regional Map for Relatively Homogenous Regions in Ukraine..................................................................... 35 6.2: Comparison of Country-Loss Function to Regional-Loss Function............................................................. 36 7.1: Total Insurance Premiums and Indemnities ..................................................................................................... 39 7.2: Historical Loss Ratio............................................................................................................................................. 39 7.3: Evolution of Total Number of Insurance Companies .................................................................................... 40 7.4: Total Insurance Market by Line of Business..................................................................................................... 42 7.5: Profits as Percentage of Total Capital ................................................................................................................ 46 7.6: Reinsurance to Residents and Non-Residents .................................................................................................. 48 7.7: Relative Importance of the Reinsurance Market .............................................................................................. 48 7.8: Total Reinsurance by Type of Business ............................................................................................................. 49 9.1: Sample Structure for Risk Layering .................................................................................................................... 59 9.2: Possible Structure for Risk Sharing .................................................................................................................... 62
Tables 1.1: Financial Performance of Crop Insurance in Seven Counties.......................................................................... 4 4.1: Ukraine Land Use Estimates 2000...................................................................................................................... 23 4.2: Grain Area, Yield, and Production: All Farms, 1987-1998, (10-year Average) ............................................ 23 4.3: Agricultural Production in Ukraine in 2000 ...................................................................................................... 24 4.4: The Number and Size of Private Farms in Ukraine on January 1, 2001....................................................... 25 4.5: Number of Agricultural Entities in Ukraine as of April 2001 ........................................................................ 28 5.1: Estimates of Value at Risk in 2001 (in UAH 1,000,000) ................................................................................. 31 5.2: Relative Pure Premium Risk for Different Crops by Oblast Using a 95 Percent Area-Yield Insurance
Program. .................................................................................................................................................................. 34 6.1: Correlation of Crop Insurance Loss Ratios Among the Five Regions.......................................................... 36 7.1: Comparison of Market Density of Insurance Among Select Developing Countries.................................. 40 7.2: Top 30 Non-Life Companies .............................................................................................................................. 41 7.3: Profile of Various Insurance Offerings in Ukraine .......................................................................................... 43 7.4: Data for 12 Categories of Voluntary Property Insurance ............................................................................... 44 7.5: Composite Share of Ukraine Companies........................................................................................................... 47 7.6: Foreign Reinsurers in 2000/2001 By Country of Origin ................................................................................ 49 7.7: Volume of Operations of Derivatives Traded in 2001 .................................................................................... 51

Crop Disaster Assistance in Ukraine: Issues, Alternatives, and Consequences Executive Summary
vi
Skees, Hess, Ibarra
Executive SummaryThe transition to markets has been difficult for Ukraine. A country with significant agricultural potential, Ukraine has nearly one-third of the world’s “black soils.” Yet many tillable hectares remain idle and yields are well below their potential. Agricultural development progress has slipped since the beginning of the new Ukrainian Republic. While many components are needed to strengthen the agricultural sector, efforts to build the financial sector are among the most important. Risk sharing markets such as agricultural insurance and exchange markets can contribute to the financial sector development. To that end, this report is focused on the public policy issues involved in considering the role of government and markets in developing sustainable agricultural insurance markets. Making choices among competing public policy alternatives is never easy, especially when considering the allocation of limited government funds. The primary data collection for this report occurred in the summer of 2002, in the midst of a major policy initiative on agricultural insurance. Regulations on compulsory crop insurance were released in July 2002. Crop insurance is included as a compulsory insurance for all activities of state-owned agricultural businesses, as well as for sugar beet and grain crops for all private businesses. Further, the designs of the proposed crop insurance program include many features that are similar to the United States (U.S.) crop insurance program, including premium subsidies. Given the move toward such crop insurance programs, it was determined that some assessment of the world experience with multiple-peril crop insurance was needed within this report. Section 1 provides this assessment. Given the classic problems with providing multiple-peril crop insurance, there are essentially no real private market efforts. In nearly every case, heavy government financing through subsidies has been a necessary component.
Therefore, most multiple-peril crop insurance programs that are available today are limited to countries with developed economies. The U.S. program has been particularly expensive, with farmers paying only 25 percent of the total cost for the insurance. Further, there are few multiple-peril programs that have not had tremendous actuarial problems in the beginning years. The conclusion presented in this study is that the current course for crop insurance in Ukraine could also be quite expensive to the government. Thus, the challenge is to leverage the limited fiscal resources of Ukraine to the largest extent possible to make agricultural insurance as widely available as possible across Ukraine. This is no small task, especially given the nature of crop risk. Crop yield disasters are generally correlated across large geographic areas when one person has a wreck, many others have a wreck at the same time. This creates a tremendous financial challenge. Financing frequent and severe crop losses requires special considerations. Thus, section 2 of this report focuses on reinsurance for these types of risk. Given the desire to create sustainable crop insurance in Ukraine, the major focus of this report is on the opportunity to introduce index-based insurance, in particular, weather-based indexes. Section 3 examines why this alternative is promising given the limitations of traditional approaches to crop insurance. Section 4 provides a cursory review of agriculture in Ukraine as a means of raising the right questions about the potential market for agricultural insurance. Given the risk and the wide range of crops across Ukraine, one would think that agricultural insurance has a significant potential in Ukraine. Nonetheless, farmers in Ukraine are not familiar with such insurance and the educational challenge will be significant. Further, since many farmers are not familiar with making purchase decisions regarding other inputs, this adds to the challenge.

Crop Disaster Assistance in Ukraine: Issues, Alternatives, and Consequences Executive Summary
vii
Skees, Hess, Ibarra
The report also examines the risk profile for major crops in Ukraine in Sections 5 and 6. This analysis is encouraging as it demonstrates that there are some potential offsets if a countrywide portfolio of crop insurance were provided. Some regions of Ukraine have low correlations in crop yields, suggesting that a carefully crafted risk-pooling arrangement within the country could provide savings before going to international reinsurance markets. Section 7 examines the insurance and financial markets in Ukraine in some detail. There is very limited experience with agricultural insurance in Ukraine. Further, the insurance companies have limited experience in providing insurance for risks that are correlated. Use of international reinsurance has been limited. These factors combine to raise even more questions regarding the requirement for compulsory crop insurance. One must ask what insurance companies in Ukraine are prepared to deliver the type of crop insurance program that is being proposed. It is not likely that any insurance provider in Ukraine is in the position to do this. A number of regulatory issues are reviewed in Section 8 of the report. Clearly, offering index-based insurance would require regulators in Ukraine to think differently about insurance. This section develops some of the challenges to the regulatory environment. Finally, the report concludes by developing the detailed requirements for pursuing the alternative approaches that are presented for agricultural insurance in Ukraine.
Why Weather Index Insurance? One of the factors contributing to the scarcity of credit in rural areas is the inability to secure loans with collateral. While land tenure constraints have been a major constraint in this regard, the lack of insurance opportunities available to potential borrowers has also limited access to credit by agricultural borrowers. If crops fail, the repayment capacity of borrowers may be uncertain. This makes lenders reluctant to extend
credit to farmers. When insurance markets are working, borrowers can use private insurance as a risk mitigation alternative. For agricultural borrowers this insurance normally takes the form of “business interruption insurance” and primarily involves crop or weather insurance. While agricultural insurance may be an important innovation in Ukraine, there are many reasons to proceed with caution. Traditional multiple-peril crop insurance that indemnifies the individual farm loss is likely not a workable solution in the short term. As is more fully developed in Section 1, such insurance is subject to high administrative cost if it is to be free of adverse selection and moral hazard. And if investments are not made in monitoring and information on farm yields, the insurance will likely experience higher losses than the initial rating. This will result in serious actuarial problems. Further, since there are large correlated risk involved in multiple-peril crop insurance (i.e., drought, excess rain, and freeze), there is an extra cost of providing reinsurance. In short, there are two major added costs to traditional crop insurance: 1) administrative costs and 2) reinsurance costs. These extra costs can be quite high in an emerging economy with little or no experience in providing multiple-peril crop insurance. One form of agricultural insurance that mitigates these costs is weather insurance. The monitoring costs of weather insurance should be less as there is no need to perform farm-level loss adjustments and the balance of information about the weather is equally shared by the insured and the insurer (unlike with traditional farm-level insurance where the farmer will always know more about the yield than the insurer). Further, the reinsurer is more likely to provide better terms when the insurance is based upon weather events and not farm-level losses. Thus, weather insurance could be a preferred alternative to crop insurance, as it avoids moral hazard problems. Payout is determined by an objective parameter the combination of a series of weather-related metrics (e.g., mm of rain, soil moisture, etc).

Crop Disaster Assistance in Ukraine: Issues, Alternatives, and Consequences Executive Summary
viii
Skees, Hess, Ibarra
Weather index insurance may be well suited to the agricultural production in regions in Ukraine where there are wide spread crop losses. Among the causes of loss, drought was mentioned as the most important in many of the discussions. To the extent that drought covers a vast region, weather index insurance could serve as a foundation for agricultural insurance in Ukraine. Such insurance would cover the major correlated risk while avoiding many of the problems associated with farm-level crop insurance (Skees, Hazel, and Miranda, 1999). While weather index insurance is simpler than offering multiple-peril insurance, there are a number of preconditions for offering such insurance: 1) the historic weather data must be easily obtainable and reliable; 2) a sound infrastructure for providing secure and reliable weather data in a timely fashion must be in place; 3) local providers of such insurance must have ready access to international capital markets; and 4) there should be a strong relationship between economic loss and well-defined weather events (limited basis risk2).
Main Findings of the Initial Assessment
Agriculture in Ukraine Privatization of farms has been very slow to emerge as most policies and agricultural supports have excluded privately owned farms. The majority of state-run farms had been restructured into joint stock companies known as Collective Agricultural Enterprises (CAE) during the 1990s. These enterprises were reformed in 2000 to establish more secure property rights, though most remain in pseudo-collective ownership in
2. Basis risk occurs when the farmer has a loss and does not receive a payment from the weather insurance or when the farmer does not have a loss and receives a payment. While the problem of not receiving a payment is the most serious, insurance companies should be able to address this problem over time with add-on products. The issue of overpayment should not be viewed as a problem as long as the farmer has insurable interest. Such a possibility gives the farmer the proper incentives to continue to try to make a crop even though the neighbors are having losses.
the form of agricultural enterprises or joint stock and limited liability companies. Small household plots still remain the most productive sector, however, producing the majority of the country’s food supply. Movement towards market liberalization has removed some of the price distortions created under central planning. This has resulted in declines in commodity prices, while prices for agricultural inputs have increased. There is adequate supply of domestic and foreign input suppliers of chemical inputs. Demand for chemical inputs is limited, however, because producers do not have easy access to finance and credit (cyclical problem). Access to credit is extremely limited, especially for small private farms that were excluded from earlier government supported credit programs, such as credit barters and interest subsidies. Seasonal credit for the purchase of essential inputs, such as fuel and lubricants can be obtained through commercial lenders, input suppliers, or the state. However, foreign suppliers are growing more reluctant to extend credit because of problems with repayment. In a survey of chief executives of agricultural enterprises in the Ukraine, 28 percent reported failure or delay in credit repayment (Taylor Nelson Sofres (TNS) Ukraine, 2002). Borrowers need to be creditworthy (profitable) to obtain loans, but lack of access to credit poses a constraint on production improvements. Obstacles to credit reported in the survey include high interest rates (30 percent) and no mortgage (lack of collateral). Profitable farmers have access to credit because they can repay their debts. Less profitable farmers have difficulty obtaining credit and, therefore, inputs. For this category of farmers, their low productivity is exacerbated by an inability to increase productivity without access to capital. The result on output is low yields, depleted soils, and other problems. All of these issues make any movement toward using historic farm yields as the benchmark for establishing crop insurance coverage problematic.

Crop Disaster Assistance in Ukraine: Issues, Alternatives, and Consequences Executive Summary
ix
Skees, Hess, Ibarra
Risk Profile for Ukrainian Farmers The major risk facing farmers in Ukraine appears to be market risk. A lack of market infrastructure to support the sale and movement of agricultural products has hindered the development of a market economy. Producers cannot guarantee an outlet or price for their product because of the instability of the transition economy. Declining commodity prices and high input prices compound these problems. The TNS development survey of agricultural enterprises in the Ukraine revealed that farmers’ failure to repay credit was most often attributable to problems related to the sale of produce (71 percent of respondents) primarily resulting from low product prices, limited demand, lack of market information, and high interest rates (53 percent of respondents). Only 12 percent cited bad harvests as the reason for their inability to repay their debts. (TNS Ukraine, 2002). This suggests that in recent years, market and price declines pose more of a risk to farmers’ profitability than yield risks. However, one must be careful with such an interpretation since price declines are a general market condition rather than price risk. The survey also revealed that the most commonly cited production-related problems concerned inefficiencies in crop management such as use of chemical inputs and machinery, as well as problems with new seed varieties. While regional differences were very evident, few farmers reported production related problems resulting from lack of financing or natural disasters. Link: Rural Finance Crop Insurance Generally, rural credit requires fixed assets as well as equipment and personal guarantees as collateral. Equipment in Ukraine is old and of limited value. Increasingly, rural finance institutions are considering using future harvest gains as collateral. To hedge against crop losses, these lenders are also interested in insuring the harvest. Currently, the major banks active in agricultural lending, such as Aval with a total of 4600 loans and 30 percent market share, simply do not lend on the basis of uninsured collateral. The farmer has to produce a proper insurance policy written by a pre-approved insurer to obtain
credit. At the current time, interest rates do not vary according to insurance coverage. Most banks set up their own insurance companies to provide for their own lending insurance needs. Nonetheless, frequently the insurance polices cover only very limited risks as a means of keeping premiums low. These policies are often somehow artificial and destined only to comply with government regulations imposing the insurance of collateral. Several banks demonstrated lack of awareness of real crop risks. Therefore, the real coverage of their collateral is restricted to some risks, with no inclusion of major severe risks, in particular, drought risk. Still, the banks demonstrated a keen interest in more appropriate crop insurance covers that would allow them to extend loans to the riskier groups such as smaller farmers with limited traditional collateral. Risk Profile of Ukraine Agriculture Crop-yield data were obtained from the Government Agrarian Policy Coordination Council. These data were for all 25 oblasts from 1970-2001. The crops include: maize, sunflowers, sugar beets, wheat, and barley. These data allow for a rudimentary assessment of risk for Ukraine. After making the appropriate adjustment for yield trends and the current value at risk, the procedures presented in Section 5 and 6 of this report allow for a risk assessment of the major crops in Ukraine. The map on the following page provides a geographic view of the estimates of value at risk for the five crops in Ukraine by oblast. While the major values are concentrated in the center of Ukraine, there is a good geographic spread of the value represented by these five crops across Ukraine. Ultimately the work performed in Section 6 provides an indication that the risk spread is also good for Ukraine. For example, the correlation of crop yields between the eastern section of Ukraine and the southern region around Odessa is nearly zero. This type of risk offset presents unique opportunities for structuring risk-swapping arrangements within Ukraine for crop insurance providers who may

Crop Disaster Assistance in Ukraine: Issues, Alternatives, and Consequences Executive Summary
x
Skees, Hess, Ibarra
find that they are geographically concentrated in sales of crop insurance in the future. The Likely Cost of Farm-Level Crop Insurance in Ukraine The risk assessment performed in Section 6 also provides an opportunity to make an initial cost estimate of the Ukrainian government’s proposed mandatory crop insurance program. This program would pay for yields that are below 70 percent of the simple five-year average of farm-level yields. This is similar to the U.S. Actual Production History (APH) program for multiple-peril crop insurance. Based on that experience and some assumptions about the needed loads for premium rates in this setting, the likely premiums needed to support such a program will exceed 10 percent. Further, the program will have excess losses because of poor insurance infrastructure and lack of experience at making loss adjustments. To make a crude estimate of cost, we assume that the premium base would be driven by insuring $1 billion of crop value (well less than 30 percent of the total crop value in Ukraine). At this level of participation and with a 10 percent premium rate, the premium base would be roughly $100 million.
The analyses above suggest that loss ratios in the 300 percent range are possible with such a program. Thus, with even modest crop insurance program participation, the cost could exceed $300 million in the worst crop years. There is no consideration about how to finance this large exposure. International reinsurers will be very hesitant to enter given the current design. If the government were to supply a 25 percent subsidy, the government annual average cost would easily exceed $25 million for only the premium subsidy. Again, this value is based on only 30 percent participation; the subsidy alone for a fully subscribed program would likely exceed $100 million. More cost would be added to the program given the need for the government to support the reinsurance at some level. Insurance Sector in General The insurance sector is divided into three types of activities. The first involves the protection of property and obligations of major international corporations. Often local companies “front” this business for international insurers. The second activity is carried out by domestic companies for domestic clients. For this segment the regulator receives high number of complaints (more than
Map of Value of Five Crops by Oblast

Crop Disaster Assistance in Ukraine: Issues, Alternatives, and Consequences Executive Summary
xi
Skees, Hess, Ibarra
320 last year). Only a fraction of this business is reinsured. The third type of activity is carried out by captive insurers. These are companies established as subsidiaries or affiliates of other corporations or associated groups. Insurance policies are produced for the parent organization. The supervisory authority estimates that 20 percent of the top 50 companies are captive companies. Among these captives are companies that do not insure any risk, but act as tax optimization schemes. Overall insurance penetration is low with 1.5 percent of GDP (2001) or US$12 per capita, total gross non-life premium income was around US$500 million in 2001, total reserves amounted to US$180 million. These figures comprise a substantial amount of tax avoidance schemes, possibly up to 25 percent of total premiums.3 Due to unclear nature and business purpose of the market participants, traditional underwriting performance measurement such as expense ratios and claims ratios are less meaningful. Collateral and agricultural banking are linked in very significant ways. Banks in Ukraine report a relatively high share of their credit going into agricultural activities (e.g., Aval reports about 30 percent). Since land tenure is not well established, banks are generally unable to use land as a collateral item. Acceptable agricultural collateral includes the following: • Fixed assets (like agricultural equipment).
These kinds of assets have to be notarized and insured.
• Future harvest. • Personal guarantees of managers of
agricultural enterprises. In general, banks require that all types of collateral have insurance. As a result, banks have become a major driver of the agricultural insurance market. Some banks, like Aval, report having insurance
3. Source:Ukraine FSAP Insurance report, page 8. World Bank.
representatives from their own insurance companies, as well as others at their branch offices. They also reported providing their credit executives with guidelines to choose the proper type of insurance to cover the future harvest pledged as collateral. Nevertheless, several reports, like the FSAP, have outlined the inability of the credit officers in the banks to select the appropriate coverage. Crop Insurance in Ukraine Crop insurance is underdeveloped; only three or four companies offer limited coverage. The former state monopolist, Oranta, now owned up to 49 percent by privates, notably Ukrsotzbank, has a large network of agents in the country and a crop insurance portfolio of UAH 9 million. Donetsk-based Aska has a portfolio of around US $10 million, of which up to 10 percent is crop insurance. ERC Frankona reinsures part of the Aska portfolio. This is significant as it indicates some willingness by a major agricultural insurer to participate in the Ukrainian agricultural insurance market. Ostra-Kiev, also has a relationship with an international reinsurer for one contract with a major food processor (premium is UAH 2 million). The market currently offers harvest insurance and input cost insurance policies. Input cost insurance is mostly linked to agricultural credit collateral requirements and is generally limited to very low insured sums. Harvest insurance covers hail, hurricanes, excessive precipitation, freeze, and fire risk. Drought is not covered; however, there are plans to include this risk as well. The government compulsory insurance is a multiple-peril crop insurance that would pay using a five-year average of farm yields with current prices minus a deductible of 20-40 percent. The equation for liability is Liability = Yield x (1-deductible) x Price x
Hectares
where yield is the five-year simple average of farm yields

Crop Disaster Assistance in Ukraine: Issues, Alternatives, and Consequences Executive Summary
xii
Skees, Hess, Ibarra
Premium rates are to range from 2-7 percent . The scientific basis for establishing premium rates could not be determined. Data on expense ratios are not available, but are expected to be very high due to the lack of professional loss adjustment systems and scarcity of qualified loss-adjustors. The low loss ratios of the insurers in the crop insurance market suggest potential problems as it appears that insurance covers minimum risk exposures and rarely incurs claims. Lack of farmer trust of these systems was a common theme among those who were interviewed. Data are available at an aggregate level, the largest non-life loss ratios are on the order of 30-45 percent, whilst expense ratios are in the same range. In developed economies, loss ratios for private hail insurance are on the order of 60-70 percent, with expense and profits accounting for the residual 30-40 percent. The preliminary assessment of the mission is that the market is exposed to high reputation risk as a large portion of companies do not pay claims because of their nature, some companies seem to be paying claims only to a limited extent and many companies seem to be rather inefficient, as evidenced by the high expense ratios.4 Insurance for total loss of harvest was reported as the main source of business for new entrants to this market, like Garant Auto and Skide-West. They recognized that the demand for insurance appearing two to three years ago attached to agricultural credit from banks. As a result of formal requests from banks to do so, the companies reported having designed their insurance products to serve the needs of the banks. Since the cost of total loss insurance was reported below 1 percent, banks frequently issue these policies. Nonetheless even in the total loss products, drought coverage is usually excluded. Insurance companies are also concerned about the lack of appropriate statistics to value risk in agriculture.
4. The FSAP insurance report arrives at similar findings.
Partial loss coverage is mainly offered by Oranta. They reported total insurance premiums of UAH 9 million in agricultural insurance. This company evolved into a joint stock company after being a state-owned company in Soviet times when they held a complete monopoly of the market. They inherited a big infrastructure and today they still have the biggest network of branches with 550. Oranta reported that they insure all types of risk except drought, which seems to be the most catastrophic risk in Ukraine. They offer some version of the multiple-peril crop insurance program envisioned by the government. Main crops to be insured were winter wheat, sugar beet, potatoes and specialty crops, but grains seems to have a far greater relative importance than the other mentioned crops. Drought is also excluded from this type of coverage. Oranta reported a loss ratio in agricultural insurance (indemnities/premiums) of 70-80 percent. They also reported an extensive workforce to administer this type of insurance in their branches (loss adjusters, administrative personnel, etc.). Even though the information available is limited, the results suggest that partial loss agricultural insurance schemes in Ukraine generate a negative result (indemnities plus administrative expenses seem to be greater than the premiums received), which is in line with the international experience. It is important to highlight the fact that the net result seems to be negative even excluding drought, which appears to be the most correlated risk in Ukraine that affects agriculture. In Ukraine, insurance providers have to be licensed insurance institutions, constituted as joint stock companies, and approved by the Ministry of Finance. Insurers licensed for life insurance activity shall not have the right to conduct other types of insurance activity. Therefore, any other market participants, like input suppliers, can’t underwrite insurance policies. Nevertheless, market players, like input suppliers, have a very important direct relationship and contact with the farmers, giving them more information about the technology and production practices used.

Crop Disaster Assistance in Ukraine: Issues, Alternatives, and Consequences Executive Summary
xiii
Skees, Hess, Ibarra
Therefore, they could become important sources for better insurance design or marketing channels. Reinsurance The total capital of the insurance industry in Ukraine is only US$358 million for all lines of business, therefore retention capacity is very limited inside Ukraine. Non-life companies reinsure around 50 percent of gross premiums. Any type of crop insurance, traditional or index-based, requires reinsurance capacity. In particular, the systemic or correlated risk portion of crop insurance, the weather risk part, needs to be reinsured to limit the exposure of the single insurer. Total risk exposure for grains and sugar beets in the Ukraine is around US $3.1 billion, if only 30 percent of this sum were to be insured against crop losses, the sum insured would be US $1 billion. At a 10 percent premium rate, premiums collected may be US $100 million. There would be a tremendous need for reinsurance given this level of activity. Insurance companies expressed a limited appetite for crop insurance risk retention beyond 10 percent, which is typical for this line of business. Thus, a comprehensive insurance/reinsurance system for crop yields in Ukraine is in the very early stages of development. Reinsurance activity in the Ukraine is limited, particularly for correlated risk. Due to the lack of ownership of property and other long-term assets in Ukraine and the restrictive investment regulation of foreign assets, companies use foreign reinsurance to minimize the foreign exchange and maturity mismatch between assets and liabilities. Oranta is only ceding 4 percent of the premiums to the reinsurance industry, either national or internationally. This is a very important fact because it means the agricultural risk is almost certainly being retained inside Ukraine. As the names of the reinsurance companies were not available, it was not possible to value the solvency of the foreign reinsurers providing limited capacity to the Ukrainian market.
Skide-West and Garant Auto report developing contacts with specialized reinsurance professionals in Europe, mainly through Partner Re (Erich Kasten). They mentioned, with some degree of confidence, the ability to seed their total loss insurance policies abroad. Further, they indicated their ideal retention in this type of risk has been established by their executive board at approximately 5 percent, meaning they are not willing to retain an important share of these kinds of risk. Thus, a significant reinsurance capacity for agricultural risks would be extremely important. Given past experience, it is questionable if international reinsurers are actually willing to provide such capacity. Two considerations were noted: 1. Reinsurance capacity for drought in the short
term is considered almost impossible to find. 2. The international reinsurance community is
very reluctant to offer capacity for the agricultural sector in Ukraine due to the perceived underdevelopment of the sector. Nevertheless, Marsh (the reinsurance broker) has placed the first multi-peril agricultural risk for irrigated potatoes (500 hectares). The risks covered were drought, frost, hail, and secondary diseases (usually associated with excess humidity). As it is an irrigated land, drought is defined as coverage for lack of irrigation. This is quite different from the drought risk discussed throughout this report. This drought risk is defined as a lack of rain for rain-fed production areas
Proposed Compulsory Crop Insurance The new law on insurance promulgated in November 2001 made 34 types of insurance compulsory for certain categories; one of them is crop insurance. Crop insurance thereby was supposed to be compulsory for all activities of state-owned agricultural businesses, as well as for sugar beet and grain crop insurance for all private businesses. A regulation passed by the cabinet of ministers in July 2002 specifies the coverage and premiums as well as policy wordings of this insurance. Premiums are supposed to range between 8.5 and 9.5 percent. Premium subsidies

Crop Disaster Assistance in Ukraine: Issues, Alternatives, and Consequences Executive Summary
xiv
Skees, Hess, Ibarra
are foreseen in another law, the law on “Stimulation of Agriculture Development, 2001-2004”5. A number of concerns regarding the introduction of compulsory crop insurance in the Ukraine are presented: • Forcing farmers to purchase insurance will
ultimately lead to a failed system. The economic literature suggests that moral hazard problems will be compounded as even the better farm managers are more prone to change their behavior in ways that increase risk when they are forced to purchase insurance.
• Since it will be impossible to classify risk and distinguish between the better farm managers versus the poorer farm managers, compulsory insurance will tax the better farm managers and transfer the tax to the poorer farm managers. Such a tax would lead to more inefficiency in the farming economy in Ukraine.
• Ultimately the system would result in an overall tax on farming, as insurance companies do not have the proper financial or technical resources to properly deliver on the collected premiums.
• Finally, there is no real experience with compulsory crop insurance in the world the U.S. tried a form of compulsory crop insurance in 1995 and abandoned it after one season.
Many of the concerns regarding compulsory crop insurance also extend to weather index insurance. Such insurance will work best only if it is voluntary. In particular, since weather insurance has a basis risk, the consequences of compulsory weather index insurance contracts that do not 5. Law of Ukraine, Stimulation of Agricultural Development for the Period 2001-2004, June 2001. Article 15: Obligatory insurance of agricultural crops harvest and perennial plants is partially compensated from the state budget of Ukraine in the amount of not less than 50 percent of losses incurred by agricultural enterprises.
compensate the expected yield shortfalls would be devastating for the crop insurance sector in the Ukraine and the concept of weather index insurance as a whole. Prototype Weather Index Insurance Contract To provide an illustration of the concept of weather index insurance, a prototype insurance contract was developed using a yield and weather dataset for the one county (Artemisvsk) in the Donetsk oblast. The prototype contract would pay based on shortfalls in precipitation during the critical growing period and freezing temperatures shortly after planting. Again, the purpose of this prototype is to illustrate the concept of weather index insurance to the Ukrainian industry participants. • •Crop: Winter wheat • •Weather station: Artemivsk (Donetsk oblast) • •Weather index: A) cumulative rainfall April
10 – June 20 (10day capped at 45mm); B) minimum temperature
• •Insured sum per hectare (max. payout): US$100
• •RAIN: Payout Trigger: 94mm (80 percent of average); Payout per mm of rain deficit: US$0.9
• •FREEZE: Payout for first day with temperature below –1Co: US$12, Second day US$5, Third day US$2
• •Premium rates with loads in the 6-7 percent range.
This contract provided promising results in terms of the relationship between revenue losses and weather events simulated in the past. Between 1984 and 2001 the contract would have paid for losses in major disaster years (other than 1987). The construction of accurate indexes is complicated by the trend breaks in the yield data after 1990 and the insufficient available price data. Nevertheless this prototype weather index contract suggests that the correlation between precipitation during the latter months of winter wheat cycle, as well as freeze events is promising for developing weather insurance in this particular locale.

Crop Disaster Assistance in Ukraine: Issues, Alternatives, and Consequences Executive Summary
xv
Skees, Hess, Ibarra
Regulatory Framework The insurance laws and regulations slightly disadvantage international reinsurance compared to national reinsurance and application of the rules results in administrative burdens for insurance companies. 1. Insurance and reinsurance are not
differentiated in the Law of Insurance, so institutions that obtain the approval for conducting insurance activity in Ukraine can provide both services to the domestic market. The law specifies that insurance shall be carried out in Ukraine only by Ukrainian resident insurers.
2. Reinsurance involving a non resident is not restricted in terms of the amount (percentage) of premium ceded outside of Ukraine, but should comply with the procedures specified in the special norms for that purpose, particularly when fees or premiums ceded to non residents exceed 50 percent of their total amount received from the start of the calendar year.
3. Even though the total amount to be ceded to non-residents is not capped, the amounts of required insurance reserves of the unearned premiums do not decrease for premiums ceded to foreign reinsurance institutions. Ninety percent of these reserves have to be invested inside Ukraine, therefore, institutions that cede more than 10 percent of their premium incur the additional financial cost of keeping additional reserves.
4. Reinsurance regulations do not distinguish yet between low and high rated reinsurers for the purpose of determination of reserve requirements, as well as the administrative approval of reinsurance treaties.
5. Administrative and tax procedures seem to be inadequate and cumbersome and therefore penalize international reinsurance transactions. All interviewed companies with
significant reinsurance activity reported problems with the relevant authorities.
6. Supervisory capacity seems to be very limited
as to reinsurance activity in the country. Reporting standards, on-site supervision, and sanction powers are still inadequate.
Infrastructure: Weather Data and Weather Stations The Hydro meteorological service in the country runs a total of 187 active meteorological stations with traditional equipment. Placement of these stations is roughly 50 kilometers apart. Observations are made for temperature and precipitation. Of these, 147 stations perform special observations as well, such as the measurement of deposits of humidity in the soil and soil temperature. These observations are relevant for the monitoring of crop conditions and phases of plant development. Since the stations are not automatic, the information is manually aggregated at oblast level and then transmitted electronically to the central weather service. On the basis of these observations and very advanced crop growth simulation models, the weather service performs crop yield forecasting for the major crops. Proper seeding and planting depend on these forecasts. These models appear relatively useful as they also provide an index of the crop yield relative to the average (i.e., percent above or below the average). According to the deputy head of the weather service, historical data begin in 1891 for most of the stations and are reliable and reasonably complete (i.e., few missing observations). However, the historical data sets are stored on an old computer system, making it inaccessible in electronic format at this time. This should be an easy problem to address and may be an appropriate use of support loans.

Crop Disaster Assistance in Ukraine: Issues, Alternatives, and Consequences Executive Summary
xvi
Skees, Hess, Ibarra
Weather Index Development Agronomist and Agro-meteorological professionals in the Ukraine such as Anatoliy Polevoy from Odessa Ecological University (former HydroMet Institute) or Vitaliy Dmitrenko from the Agrometeorology institute in Kiev have a long history of modeling crop yields using structured plant growth simulation models (some of this work dates to 1961). These models allow for plant growth using given soils, input packages, management, and weather events. It is appropriate to keep the soils, input packages, and management fixed. Thus, once every other input variable is locked down to a representative case in a region, weather becomes the most important random variable that determines crop yields. Thus, these models can be used to determine the expected (or average) yield per hectare given an average weather. The models are used now by professionals in the meteorological agency during the season to track the crop yield. These models basically report the percent above or below the average yield for different regions and different
crops. Even satellite data generating vegetative indexes are used for this work. This work provides obviously an excellent basis for the development of weather indexes. The main shortcoming of the weather-monitoring infrastructure is the lack of automated stations and the existent but unavailable historical data. In addition, the operating budget for these stations has been low since 1990, raising the concern about the existing infrastructure. Backstop Facility for Weather Risk Insurance Retention in the Ukraine One of the reasons for the lack of demand for agricultural insurance is supply driven. Insurance companies do not underwrite systemic risks such as drought, floods, and frost, which are some of the major risks faced by farmers involved in crop production. Ukrainian insurance companies would need international reinsurance should they decide to write these types of agricultural insurance. A goal for the Ukrainian agricultural insurance program should be to create an
Farmers/agribusinesses
Insurance Company- A
Insurance Company- B
Insurance Company- C
Risk pool for drought, floods and frost risk (swaps for weather indexes from one region to another)
Basic Risk Layer
Intermediate Risk Layer
Catastrophic Risk Layer
Competitive risk transfer
Government Risk Fund
GoU/World Bank Facility/ Intl RI
International Reinsurance(RI)
Possible Structure for Risk Sharing

Crop Disaster Assistance in Ukraine: Issues, Alternatives, and Consequences Executive Summary
xvii
Skees, Hess, Ibarra
institutional structure that allows the underwriting of agricultural insurance in the Ukraine to retain as much risk inside the country as possible, before going to international reinsurance markets. One option for effective risk transfer is the aggregation of risk according to pre-established underwriting guidelines and templates using a Ukrainian risk pool. The risk would then be reinsured through a government-backed fund and national and international reinsurance based on transparent and competitive premium ratemaking principles. Through the aggregation and layering of the risk, reinsurers would first of all be interested in reinsuring Ukrainian risk and then would be forced to price the risk competitively. For a country like Ukraine there is a strong risk of a reinsurance market failure. Individual insurance companies face sometimes insurmountable difficulties to even access international reinsurance markets, let alone obtain competitive prices. International reinsurers simply do not have the capacity to work with fragmented and non-transparent risk portfolios in the Ukraine. Opportunity costs for reinsurers are too high compared to the benefits and expected profits. Therefore the combination of introducing a transparent index insurance product and an efficient and well-regulated risk pool can overcome this market failure. Education and Familiarization Work During the Mission
The team used presentations6 and individual discussions to educate and familiarize the main players in the crop insurance world of Ukraine. The mission carried out two major presentations of the weather index insurance concept and related policy issues for insurance professionals, as well as a policy discussion with industry participants and government officials. The first presentation at the beginning of the mission addressed a group of around 20 industry professionals and generated much interest. A final
6. The two PowerPoint presentations that were made in the closing workshop are reproduced at the very end of this document.
presentation to an even larger number of professionals, including the deputy prime minister, also addressed agricultural insurance policy issues, such as compulsory insurance. Between the two presentations the agrarian policy secretariat organized a policy debate that mainly discussed the issue of compulsory insurance. The individual familiarization work with industry participants can be considered successful insofar as at least two companies expressed strong interest of developing weather index insurance in the near future. Notably, the company ASKA has put together the first weather index insurance policy for a client following the mission seminar and visit to ASKA headquarters in Donetsk.
Comments on the Feasibility of Weather Index Insurance in the Ukraine The mission had access to very limited yield and weather data. Evidence from the analyzed data, as well as qualitative assessments in the field and interviews with market participants, lead to the following preliminary conclusions on desirability and feasibility of weather index insurance in the Ukraine: Demand. Very preliminary indications from the market suggest that rural credit will drive the demand for crop insurance. The goal of rural lending that will eventually reach smaller farmers who do not have sufficient traditional collateral can be facilitated with proper crop insurance. Farmers tend to understand weather risk very well and at least the slightly larger and more sophisticated farmers should understand the particular nature of weather index insurance. The Ukraine has a large number of previously state-owned large agricultural industry complexes that have studied weather and yield relationships for a long time and therefore can provide demonstrative effects for surrounding farmers. Supply the insurance market. The market is very thin and fragmented. Very few banks are ready to lend to agriculture and very few insurance companies are in a position to insure crops.

Crop Disaster Assistance in Ukraine: Issues, Alternatives, and Consequences Executive Summary
xviii
Skees, Hess, Ibarra
Nevertheless, a few insurers made the first steps with training people, as well as selling crop insurance and are willing to venture into new insurance formulas as they realize the high expense ratios of traditional crop insurance. Weather risk and weather risk transfer. The volatility of yields and crop revenues is very high in Ukraine. Particularly the major grain producing oblasts in the south are exposed to systematic drought risk. Any type of crop insurance requires the efficient weather risk transfer at the insurance or reinsurance level. Only weather index insurance can provide an efficient risk transfer mechanism that renders these risks insurable in the Ukraine. Countrywide loss ratio simulations for a pure premium based agricultural insurance suggest that losses in excess of 200 percent would occur one out of five years. Thus, even if the premium rate were doubled to account for the catastrophic risk in crop yields, the insurance industry would lose money 1 out of 5 years. This is very high frequency, making the prospective for private reinsurance more problematic. Weather risk (and price risk) hampers development of rural credit. The uncertainties related to lending to farmers are compounded by the absence of weather and price hedging mechanisms in the Ukraine. Weather service infrastructure can be developed. The issue of weather station placement and automation must be addressed. Historical data of sufficient quality seem to exist, although the mission could not analyze more than one dataset so far. Moral hazard (tampering with weather data) could be addressed by the automation of weather stations, set up of fallback stations by reinsurers, and satellite data use for verification purposes. Weather index development resources. Ukraine has important resources that allow for the quick development of efficient weather indexes for many regions in the country. Policy framework. Currently, reinsurance is allowed for and used, but international reinsurance is
penalized in terms of insurance reserve costs. Crop insurance has been made compulsory for two major crops, which does not allow for the introduction of weather index insurance as a new compulsory crop insurance policy, but rather as voluntary insurance. Preliminary conclusion: Weather index insurance seems to be desirable and feasible at this stage and warrants further work to test these hypotheses.
Future Assessments for Evaluating the Potential of Index-Based Insurance Ukraine has good resources in the area of plant growth simulation models and crop forecasting in general. The purpose of any future assessment would be to better understand these resources and gain first insights in the potential use of the models and crop forecasting history for the development of weather indexes. What follows are recommended next steps: A. Conduct a full feasibility study The objectives of the feasibility study are to • Deepen the issues developed in this report. • Test the hypotheses formulated by the initial
assessments. • Develop viable methodologies and indexes
that insurance companies can use as prototypes and for test cases.
• Model weather indexes and develop and test statistical and agronomical models to calculate the relationship between yield and weather variables jointly with the Ukrainian researchers.
• Design complementary risk management models for insurance companies.
• Analyze countrywide risk pooling to determine the correlated exposure and the potential to hedge risks inside Ukraine.
• Perform local spatial correlation analysis to determine the appropriate number of weather stations.

Crop Disaster Assistance in Ukraine: Issues, Alternatives, and Consequences Executive Summary
xix
Skees, Hess, Ibarra
B. Pilot project The objectives of pilot projects are to test the feasibility and market viability of the concept. Main activities of the project are to • Select proper pilot counties where strong
relationships between crop yields and weather are present and those counties that have already automated weather stations or that can easily establish automated stations.
• Perform focus groups within the selected counties to determine the weather events that are of most concern to farmers in the selected regions.
• Establish properly formatted historical databases for crop yields per county, weather variables per county, including agro-meteorological variables like soil moisture and temperature, as well as farm-level data.
• Set up weather databases, mainly temperature and precipitation data that have to be made available in a proper format.
• Automate weather stations in the pilot areas. • Formulate technical underwriting guidelines. • Establish ground rules for backstop facility. • Transfer the technological platform to
insurance companies (pricing models, operational skills, portfolio management).
• Educate farmers, brokers, agents, banks, and agro-processing and other stakeholders.
• Organize study tour to weather index insurance schemes (Alberta and Ontario, Canada).
• Assist insurance companies in the development of insurance policies and pilot cases in selected counties.
• Design an effective and efficient subsidization mechanism that is largely incentive-neutral in a study.
• Study of the pilot project results: incentives, demand, communication between farmers, appropriate client level (banks, input suppliers or farmers).
C. Phase I: Investment phase Following the full analysis and assessment of the feasibility study and pilot projects, GoU and World Bank would explore the following investment options: Acquisition and installation of automated stations
a. Test analysis of the density of the network according to the weather exposure of Ukraine. b. Design adequate maintenance program to ensure the quality of observations across time.
Backstop facility for weather risk (the actual level of the stop loss will be determined analytically given the budget constraints). D. Phase II: Sustainable private sector-led weather index insurance Following the successful implementation of a pilot and a full program for two to three years, the private sector shall be in a position to operate without government provided backstop facilities. E. Expenditure items
F. Technical assistance (regulatory, feasibility, dissemination, education) Consultants G. Goods Weather stations Pilot phase: Twelve automated weather stations in three pilot oblasts H. Backstop facility Disbursement mechanisms Project management

Crop Disaster Assistance in Ukraine: Issues, Alternatives, and Consequences Section 1: Experience with Multiple-Peril Crop Insurance
1
Skees, Hess, Ibarra
Section 1: Experience with Multiple-Peril Crop Insurance Multiple-peril insurance would seem to address the issue of handling major crop failures, especially since most farmers would prefer to have farm-level insurance, assuming it can be priced appropriately. However, significant problems have plagued multiple-peril crop insurance programs. It is important to understand these problems as this establishes the base for helping the Ukrainian government in their search for solutions. Two types of crop insurance programs dominate world experience: named peril insurance (such as hail), and multiple-peril insurance, which covers losses from many perils (e.g., drought, flooding, wind, insects, and freeze). Hail coverage can also include losses from fire and wind damage. Hail insurance is generally successful around the world for a variety of reasons: the losses are more nearly independent; there is less adverse selection and moral hazard, and good data and methods exist to both underwrite and assess losses. Crop-hail insurance is not discussed since it does not handle major crop failures such as droughts. Further, with assistance from the international reinsurance industry, private companies in Ukraine should be able to offer private hail insurance. While many look to the U.S. experience as a model for what might be considered, there are some important limitations for countries trying to replicate the U.S. program. Today, North American farmers pay only a fraction of the total cost of the crop insurance offered by the government (about 25 percent). There are few countries around the world that can afford such heavy subsidies. Further, looking back and understanding the growing pains of the U.S. crop insurance program gives any country reason to pause. For over 15 years the U.S. program suffered from serious actuarial problems. Crop insurance losses exceeded unsubsidized premiums in every year but one, from 1981 to 1993. By the early 1990s, the U.S. aggregate loss ratio was about 1.5, meaning that the program was paying
out $1.50 for every dollar of accounting-based total premium.7 While the national number today is closer to $1.08 in many regions, serious actuarial problems still plague the program. In the early years, private companies were reimbursed over 38 percent for every dollar of unsubsidized premium. While that number is below 25 percent today, the companies also expect to make about 15 percentage points for each dollar of total premium that they retain for risk sharing. Higher reimbursement expenses in the early years helped build the elaborate infrastructure that is in place today allowing companies to deliver the crop insurance program for less than in the past. The major lessons to be gleaned from the United States and other developed countries’ experience are • delivering farm-level, multiple-peril crop
insurance is complex and expensive; • actuarial problems are to be expected when
developing farm-level, multiple-peril crop insurance; and
• allowing private companies to sell government crop insurance products creates a new political force that creates still more demand for subsidies.
Experience to date indicates that it is extremely difficult, without massive government subsidies, to insure farm-level crop yields from losses caused by any number of natural perils. Those who seek effective, agricultural risk management tools, offered with little or no government subsidy, need to understand the underlying problems with farm-level, multiple-peril crop insurance. These problems are discussed below. This discussion sets the stage for considering an alternative form of insurance that makes 7. Loss ratios for the U.S. program are not calculated using the farmer paid premiums. Rather they are calculated using the premium as if it were not subsidized. This is referred to as the total premium. If farmer paid premiums are used, the loss ratios are much higher.

Crop Disaster Assistance in Ukraine: Issues, Alternatives, and Consequences Section 1: Experience with Multiple-Peril Crop Insurance
2
Skees, Hess, Ibarra
payments based not on measures of farm yields, but rather on either area yields or some weather event like temperature or rainfall. This alternative form of insurance is often referred to as index insurance, since payments are triggered by realizations of a pre-specified index measure rather than by realized farm yields. Index insurance holds significant promise for a number of reasons. In some situations, index insurance offers superior risk protection when compared to traditional multiple-peril crop insurance that pays indemnities based on individual farm yields. Furthermore, index insurance provides an effective policy alternative for Ukraine as it seeks to protect the agricultural production sector from widespread positively correlated crop-yield losses (e.g., drought). Finally, when index insurance is used to shift the risk of widespread crop losses to financial and reinsurance markets, the residual idiosyncratic risk often has characteristics that should open the door for local insurance markets to design more effective farm-level insurance products as markets conditions permit.
Requirements for Multiple-Peril Crop Insurance Successful insurance programs require that the insurer have adequate information about the nature of the risks being insured. This has proven to be extremely difficult for farm-level yield insurance. Farmers will always know more about their potential crop yields than any insurer. This asymmetric information is the major problem with insuring farm yields. If an insurer cannot properly classify risk, then it is impossible to provide sustainable insurance. Those who know that they have been favorably classified will buy the insurance; those who have not been favorably classified will not buy. This phenomenon, known as adverse selection, initiates a cycle of losses (Goodwin and Smith, 1986; Skees and Reed, 1986; Quiggin, Karagiannis, and Stanton, 1994). The insurer will typically respond with “across the board” premium rate increases. But this only exacerbates the problem, as only the most risky individuals will continue to purchase the
insurance. The problem can only be corrected if the insurer can acquire better information to properly classify and assign premium rates to the potential insured. Insurers must also be able to monitor policyholder behavior. Moral hazard occurs when insured individuals change their behavior in a way that increases the potential likelihood or magnitude of a loss. In crop-yield insurance, moral hazard occurs when, as a result of having purchased insurance, farmers reduce fertilizer or pesticide use or simply become more lax in their management. At the extreme, moral hazard becomes fraud where policyholders actually attempt to create a loss. Again, the problem is asymmetric information. Unless the insurer can adequately monitor these changes in behavior and penalize policyholders accordingly, the resulting increase in losses will cause premium rates to increase to the point where it becomes too expensive for all but those engaged in these practices. Insurers must also be able to identify the cause of loss and assess the magnitude of loss without relying on information provided by the insured. For automobile or fire insurance, the insurer can generally identify whether or not a covered loss event has occurred and the magnitude of any resulting loss. For multiple-peril crop-yield insurance this is not always the case. It is not always easy to tell whether a loss occurred due to some covered natural loss event or due to poor management. Nor is it easy to measure the magnitude of loss without relying on yield information provided by the farmer.
The U.S. Federal Crop Insurance Program There are a number of countries around the world that offer multiple-peril crop-yield insurance on individual farm yields. Very few of these offerings are made with no government involvement. In the United States, multiple-peril crop insurance is designed to protect against losses from a wide array of natural occurrences including hail,

Crop Disaster Assistance in Ukraine: Issues, Alternatives, and Consequences Section 1: Experience with Multiple-Peril Crop Insurance
3
Skees, Hess, Ibarra
drought, excess moisture, plant disease, insects, and wind. The intent is to insure only acts of nature and not bad management. Policyholders must follow “generally accepted farming practices.” While this provision is in place to reduce the impact of moral hazard, it is difficult to enforce. Indemnifiable losses include quality adjusted-yield shortfalls, prevented planting, and in some cases, replanting costs. Contracts for annual crops must be purchased no later than approximately six weeks prior to planting. Contracts for perennial crops must be purchased in the fall of the year before the crop is harvested. These dates are set to reduce the possibility that farmers will purchase insurance only when the likelihood of, and/or magnitude of a potential loss is greater than normal — a phenomenon known as intertemporal adverse selection. A payable loss occurs if the Realized Yield is less than the Trigger Yield (the trigger yield is sometimes called the yield guarantee). Payable Losses (in bushels, hundred weight, tons, etc.) for an insurance unit are calculated as: Payable Losses = max (0, Trigger Yield –
Realized Yield) x Insured Acreage Trigger yield is based upon the coverage chosen and the insurance yield. Specifically, Trigger Yield = Insurance Yield x Coverage The Insurance Yield is an estimate of the long-run average yield for the insurance unit. A farm may have several insurance units. Coverage, as the term is used in the U.S. federal crop insurance program, is 100 percent minus the percent deductible. Available coverage levels typically range from 50-85 percent in 5 percent increments. Deductibles are one way to reduce the problems that emerge from adverse selection and moral hazard. The policyholder selects an Indemnity Price that is less than or equal to a federal estimate (made
prior to planting and sales closing) of the market price at harvest. The payable loss is converted into dollars as follows: Indemnity = Payable Loss x Indemnity Price Liability is the amount that the insurance contract would pay, if the realized yield were equal to zero (i.e., a 100 percent loss): Liability = Trigger Yield x Indemnity Price x
Insured Acreage The Gross Premium is calculated as: Gross Premium = Gross Premium Rate x Liability Gross premium increases as coverage levels increase. The Farmer Premium is calculated as: Farmer Premium = Gross Premium –
Government Subsidy
Actuarial Performance of the Crop Insurance Programs Performance of publicly supported multiple-peril crop insurance has been poor when all costs are considered. If companies were private, the premiums collected would have to exceed the administrative cost and the indemnities paid out. Hazell quantifies the condition for sustainable insurance as follows: (A + I) / P < 1
where A = average administrative costs I = average indemnities paid P = average premiums paid
Given this ratio, Hazell (1992) finds that in every case the value exceeds 2 (see Table 1.1). This means that the support from government is at least 50 percent. However, there are cases where farmers are clearly paying only pennies on the dollar of the real cost of the crop insurance program. A ratio of 4, means that the farmer pays 25 cents per 1 dollar of total costs. Skees (2001) reports a ratio of 4 for the current U.S. crop
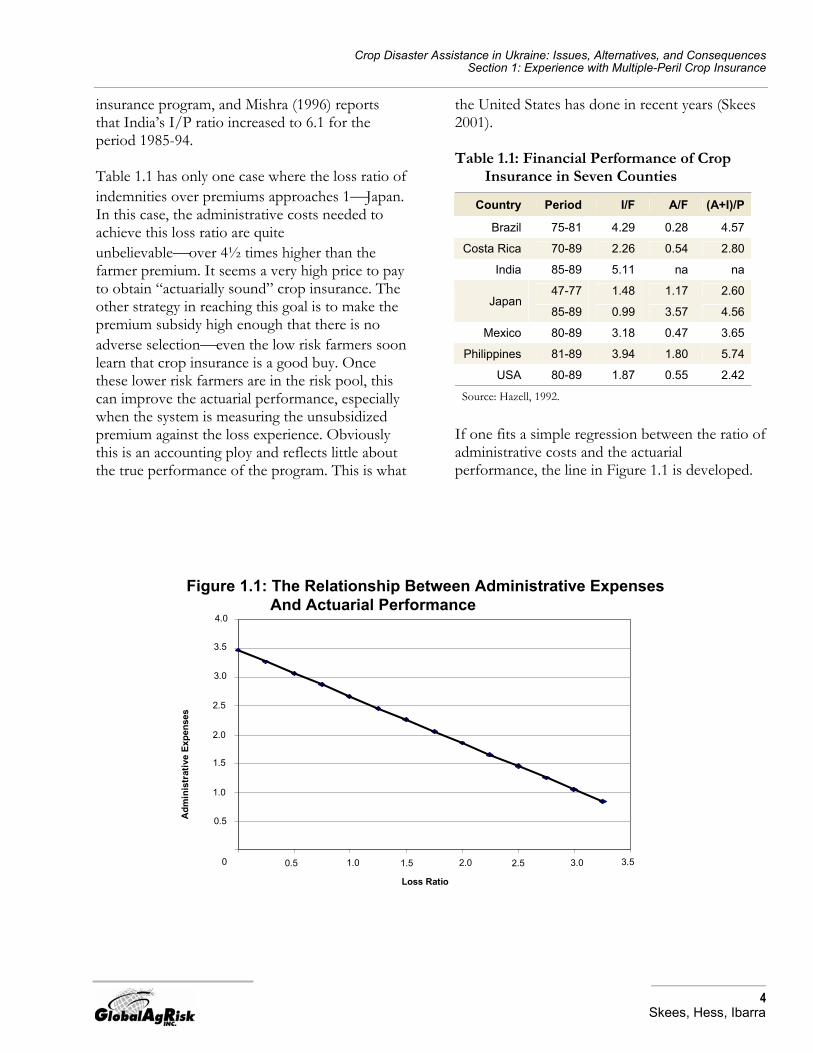
Crop Disaster Assistance in Ukraine: Issues, Alternatives, and Consequences Section 1: Experience with Multiple-Peril Crop Insurance
4
Skees, Hess, Ibarra
insurance program, and Mishra (1996) reports that India’s I/P ratio increased to 6.1 for the period 1985-94. Table 1.1 has only one case where the loss ratio of indemnities over premiums approaches 1Japan. In this case, the administrative costs needed to achieve this loss ratio are quite unbelievableover 4½ times higher than the farmer premium. It seems a very high price to pay to obtain “actuarially sound” crop insurance. The other strategy in reaching this goal is to make the premium subsidy high enough that there is no adverse selectioneven the low risk farmers soon learn that crop insurance is a good buy. Once these lower risk farmers are in the risk pool, this can improve the actuarial performance, especially when the system is measuring the unsubsidized premium against the loss experience. Obviously this is an accounting ploy and reflects little about the true performance of the program. This is what
the United States has done in recent years (Skees 2001). Table 1.1: Financial Performance of Crop
Insurance in Seven Counties
If one fits a simple regression between the ratio of administrative costs and the actuarial performance, the line in Figure 1.1 is developed.
Figure 1.1: The Relationship Between Administrative Expenses and Actuarial
Performance
Country Period I/F A/F (A+I)/P
Brazil 75-81 4.29 0.28 4.57
Costa Rica 70-89 2.26 0.54 2.80
India 85-89 5.11 na na
47-77 1.48 1.17 2.60 Japan
85-89 0.99 3.57 4.56
Mexico 80-89 3.18 0.47 3.65
Philippines 81-89 3.94 1.80 5.74
USA 80-89 1.87 0.55 2.42
Source: Hazell, 1992.
0
0.5
1.0
1.5
2.0
2.5
3.0
3.5
4.0
0.5 1.0 1.5 2.0 2.5 3.0 3.5 Loss Ratio
Adm
inis
trat
ive
Expe
nses
Figure 1.1: The Relationship Between Administrative Expenses And Actuarial Performance

Crop Disaster Assistance in Ukraine: Issues, Alternatives, and Consequences Section 1: Experience with Multiple-Peril Crop Insurance
5
Skees, Hess, Ibarra
It is of considerable concern that such a line suggests that administrative expenses for monitoring must at least be equal to premiums before sound actuarial experience emerges. With such poor performance one must ask if it is even possible to run an individual multiple-peril crop insurance program that is self-sustaining. Further, one should ask why we have such poor performance. Consider the information required to deliver and monitor this program. The insurer must know the following for every individual insured unit:
Insurance yield. Estimating the expected yield for an insurance unit is a daunting task. For the U.S. federal crop insurance program, insurance yields are based on a simple average of the most recent 4-10 years of realized yields on the insurance unit. Farmers can establish an initial insurance yield with as little as four years of yield records (there are significant penalties if farmers cannot provide at least four years of yield records). As the farmer builds toward 10 years of yield records, realized yield in a given year is incorporated into the calculation of the insurance yield in subsequent years. When the farmer has built 10 years of yield records, the insurance yield is calculated as a rolling average of the most recent 10 years of realized yields. This is a rather crude method for estimating the central tendency in yields. Due to a sampling error, insurance yields can either underestimate or overestimate the true central tendency depending on the random weather events over the most recent 4-10 years. The effect of sampling error is further compounded by the fact that for most multiple-peril crop insurance programs, insurance yields are also the primary (if not the only) mechanism for relative yield-risk classification. Thus, the mechanism for establishing insurance yields can lead to adverse selection where only those farmers who believe they are getting a fair or better offer will chose to participate. Farmers who think the insurance yield is too low will not participate. Also, since farmers provide
the yield records on which insurance yields are based, there are opportunities for fraud. Loss adjustment. It is complicated and expensive to measure realized yields so payable losses can be determined. Most farmers do not like the idea of having someone come to their farm to estimate the realized yield. Nor is loss estimation a precise science. As is implied by the word “estimate,” measurement errors are common. Additional investment in personnel and training is required to minimize measurement errors. When losses are widespread, a very large workforce of trained individuals is needed. In the United States, farmers are often allowed to self-report realized yields. Spot checks are conducted with penalties for filing false reports, yet there are opportunities for farmers to receive payments that are not warranted. Gross premium rate. For most insurance products, premium rate calculation is based on historical loss experience. However, calculating crop-yield insurance premium rates is more complex. One would ideally like to know the yield distribution for each individual farm. That is, one would like to know all of the possible yield outcomes and the probability of occurrence for each of those outcomes. But as indicated above, most crop-yield insurance programs have difficulty estimating even the central tendency in yields. Estimating factors that influence the higher moments of the yield distribution is much more problematic. Further, simply knowing the yield distribution for a well-classified group of farmers may not be enough. Extra losses (beyond those represented by yield distributions) can occur due to moral hazard.
The U.S. government has made significant investments in attempting to address these and other informational challenges inherent in farm-level crop-yield insurance. While improvements have been made, the federal crop insurance program still suffers from problems related to

Crop Disaster Assistance in Ukraine: Issues, Alternatives, and Consequences Section 1: Experience with Multiple-Peril Crop Insurance
6
Skees, Hess, Ibarra
inadequate or asymmetrically distributed information. Many of the more obvious and inexpensive improvements in information gathering and monitoring systems have already been made. Needed additional improvements will likely come at much higher marginal cost. That cost will be borne by taxpayers and/or policyholders. If the cost is passed on to policyholders, many will decide that the insurance is too expensive and there would be very limited participation in the crop insurance program.
Compulsory Crop Insurance in Ukraine Once it is recognized that crop insurance has serious actuarial problems if large investments are not monitored, many policy makers conclude that they can make a crop insurance program actuarially sound by forcing all farmers to purchase the insurance. Given 100 percent participation, there can be no adverse selection. However, forcing farmers to purchase crop insurance invites even more moral hazard than does a voluntary program. In Ukraine the new law on insurance promulgated in November 2001 made 34 types of insurance compulsory for certain categories; one of them is crop insurance. Crop insurance is to be compulsory for all activities of state-owned agricultural businesses as well as for sugar beet and grain crop insurance for all private businesses. A regulation passed by the Cabinet of Ministers in July 2002 specifies the coverage and premiums as well as policy wordings of this insurance. Premiums are supposed to range between 8.5 and 9.5 percent. Premium subsidies are foreseen in another law, Stimulation of Agricultural Development, 2001-2004.8
8. Ukrainian law, On Stimulation of Agricultural Development for the Period 2001-2004, June 2001. Article 15: Obligatory insurance of agricultural crops harvest and perennial plants is partially compensated from the state budget of Ukraine in the amount of not less than 50 percent of losses incurred by agricultural enterprises.
The mission expressed the following concerns regarding the introduction of compulsory crop insurance in the Ukraine.9 • Forcing farmers to purchase insurance will
ultimately lead to a failed system. The economics literature demonstrates that moral hazard problems will be compounded, as even the better farm managers are more prone to change their behavior in ways that increase risk when they are forced to purchase insurance. In the farmer’s mind, “If they are going to force me to purchase this, I will have a loss!”
• Since it will be impossible to classify risk and distinguish between the better farm managers versus the poorer farm managers, compulsory insurance will tax the better farm managers and transfer the tax to the poorer farm managers. Such a tax would lead to more inefficiency in the farming economy in Ukraine.
• Ultimately, the system would result in an overall tax on farming, as insurance companies do not have the proper financial or technical resources to properly deliver on the collected premiums.
• Finally, there is no real experience with compulsory crop insurance in the worldthe United States tried a form of compulsory crop insurance in 1995 and abandoned it after one season.
9. Many of the concerns regarding compulsory crop insurance also extend to any index-based insurance programs. Such insurance will work best only if it is voluntary.

Crop Disaster Assistance in Ukraine: Issues, Alternatives, and Consequences Section 2:Reinsurance
7
Skees, Hess, Ibarra
Section 2: ReinsuranceAnother requirement for traditional insurance products is that the loss events be independent, or at least not highly positively correlated. This characteristic allows the “law of large numbers” to generate a narrow confidence interval around the expected loss for the insurer’s portfolio of insurance products. If risks are highly positively correlated (what some refer to as systemic risk), the law of large numbers is not relevant and the solvency of the insurer can be threatened by extremely large losses due to a single event. For multiple-peril crop insurance, losses due to perils such as drought, freeze, or excess moisture are typically highly positively correlated across exposure units. In Ukraine this is particularly true. The analysis presented below demonstrates that large losses would be present in about one-half of the crop yields in recent years.10 Since crop-yield risks are not independent, insurance markets are incomplete in most countries. The widespread nature of natural disaster losses undermines the ability of insurance companies to pool risks and offer affordable insurance coverage. Although crop losses are often widespread, they may not be completely
10. While 2002 data are not available, the evidence to date strongly suggests that this crop year will be among the most serious for crop losses in anyone’s memory.
correlated. General price movements for agricultural commodities are generally strongly correlated. Such correlated risks can be managed with futures exchanges. In many ways, crop and natural disaster risks are “in-between” risks. They are neither completely correlated nor independent (see Figure 2.1). New ways of thinking are required to introduce markets for such “in-between risks.” When insurance is offered for natural disaster risks, the rates must be loaded for catastrophes because of the nature of the risk. In effect, the potential seller must overestimate the pure risks. Insurance is available for natural disaster risk in developed economies. Homeowners can insure against damage from hurricanes and earthquakes. These risks are clearly different than most insurable risk. Unlike automobile insurance where the risks are largely independent, natural disaster risk are correlated with some low probability of very high losses as a widespread area is damaged by a single event. This requires special arrangements to share these risks in the capital markets. Primary insurers pass on certain levels of risk to an international reinsurance market.
Figure 2.1: Independent Versus Correlated Risk
I N - B E T W E E N R I S K
NEARLY ZERO CORRELATION LARGELY CORRELATED 100% CORRELATED
Auto Accidents Natural Disasters Commodity Prices Heart Attacks Rainfall/Crop Yields Internet Rates
Insurance Markets Government/Capital Markets Futures Markets
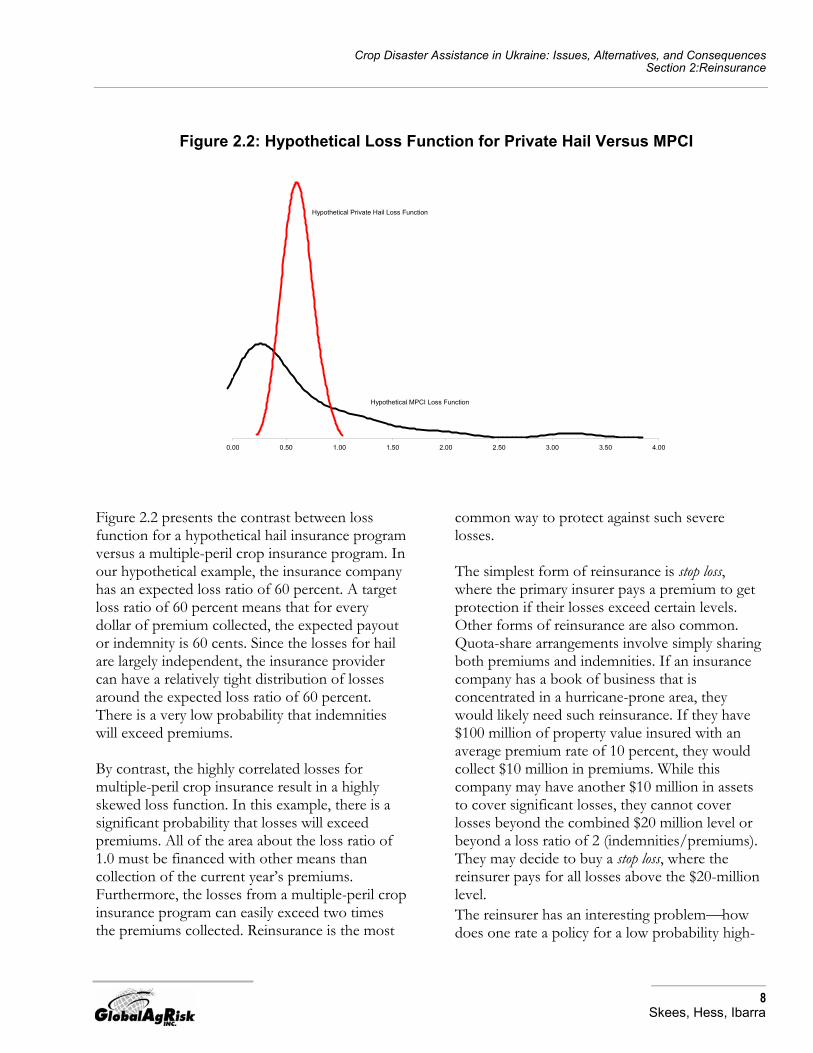
Crop Disaster Assistance in Ukraine: Issues, Alternatives, and Consequences Section 2:Reinsurance
8
Skees, Hess, Ibarra
Figure 2.2 presents the contrast between loss function for a hypothetical hail insurance program versus a multiple-peril crop insurance program. In our hypothetical example, the insurance company has an expected loss ratio of 60 percent. A target loss ratio of 60 percent means that for every dollar of premium collected, the expected payout or indemnity is 60 cents. Since the losses for hail are largely independent, the insurance provider can have a relatively tight distribution of losses around the expected loss ratio of 60 percent. There is a very low probability that indemnities will exceed premiums. By contrast, the highly correlated losses for multiple-peril crop insurance result in a highly skewed loss function. In this example, there is a significant probability that losses will exceed premiums. All of the area about the loss ratio of 1.0 must be financed with other means than collection of the current year’s premiums. Furthermore, the losses from a multiple-peril crop insurance program can easily exceed two times the premiums collected. Reinsurance is the most
common way to protect against such severe losses. The simplest form of reinsurance is stop loss, where the primary insurer pays a premium to get protection if their losses exceed certain levels. Other forms of reinsurance are also common. Quota-share arrangements involve simply sharing both premiums and indemnities. If an insurance company has a book of business that is concentrated in a hurricane-prone area, they would likely need such reinsurance. If they have $100 million of property value insured with an average premium rate of 10 percent, they would collect $10 million in premiums. While this company may have another $10 million in assets to cover significant losses, they cannot cover losses beyond the combined $20 million level or beyond a loss ratio of 2 (indemnities/premiums). They may decide to buy a stop loss, where the reinsurer pays for all losses above the $20-million level. The reinsurer has an interesting problemhow does one rate a policy for a low probability high-
Figure 2.2: Hypothetical Loss Function for Private Hail Versus MPCI
0.00 0.50 1.00 1.50 2.00 2.50 3.00 3.50 4.00
Hypothetical MPCI Loss Function
Hypothetical Private Hail Loss Function

Crop Disaster Assistance in Ukraine: Issues, Alternatives, and Consequences Section 2:Reinsurance
9
Skees, Hess, Ibarra
loss event? While there are very sophisticated models used to address this problem, most wise reinsurers will load the risk beyond levels experienced in the past. Things can always get worse. Or as anyone in the risk management business will emphasize, “Just because it has never happened, doesn’t mean it won’t.” The other problem is intertemporal. Suppose the big hit comes in the first year. This will require capital reserves to pay large losses. Rate makers load to build these reserves quickly for early losses. Finally, keep in mind that all of the issues of asymmetric information apply for the principal-agent relationship between the primary insurer and the reinsurer. Reinsurers must invest in monitoring and information systems to balance the information. This increases transaction costs. In the end, all of these costs must be summed together with the pure risk of the contract to develop a premium rate. Premium Rate = Pure Premium Rate + Catastrophic Load + Reserve Load+ Charge to cover transaction costs + Return on equity It is little wonder that premium rates can exceed the expectations of decision-makers who tend to forget bad events from natural disasters. These arguments are used to justify government involvement. Efficiencies are needed. Large international reinsurers can spread risks around the worldapplying all of the principles of portfolio theory. If the portfolio of reinsurance is large enough, what may be low-probability, high-catastrophic events for small companies becomes a largely independent and diversifiable risk for the large reinsurer. There has been significant growth in the international reinsurance markets. Yet, reinsurance markets are thin, with few large international firms and limited capacity. Reinsurers have short memories. After major catastrophes, reinsurance prices increase greatly or the reinsurer simply pulls out of the market. This happened in Florida after Hurricane Andrew and in California after the Northridge earthquake.
State reinsurance pools were created in both Florida and California to offset these problems. Improved efficiencies are needed in reinsurance markets. Similar tightening of the market occurred after the terrorist attacks of September 11, 2001. The transaction costs of putting together large sums of capital can be high. There are new developments that hold promise for reducing the transaction costs. There is some promise that exchange markets can be used as risk-sharing institutions for disasters. The Chicago Board of Trade (CBOT) trades a Catastrophic Insurance Options Contract (CAT). Property Claim Services (PCS) catastrophe loss indices are traded for nine geographic regions in the United States. As such, the contract allows those at risk from large property and casualty losses due to hurricanes or earthquakes to share some of that risk with a larger community of traders in an exchange market. Another important development is the emergence of catastrophe (CAT) bonds. This is truly using capital markets to share catastrophic risk. These take on a variety of structures. In essence they represent contingent capital, should the disaster occur. Some have called the CAT bonds the ultimate junk bondinvestors have a very high probability of getting a high rate of return on their money or they have a very low probability of losing everything. Since catastrophes are not correlated with other market equities, they should be a good diversification strategy for portfolio managers. The use of the capital markets for sharing “in-between” risk remains in the infant stages, leaving the issue of capacity and efficiency in doubt. This raises questions about the role of government in sharing such risk. For the United States, Lewis and Murdock (1996) recommend government catastrophic options that are auctioned to reinsurers. Part of the thinking is that the government has adequate capital to back stop such options and may be less likely to load these options as much as the reinsurance market. Skees and Barnett (1999) have also written about a role for government in offering insurance options for

Crop Disaster Assistance in Ukraine: Issues, Alternatives, and Consequences Section 2:Reinsurance
10
Skees, Hess, Ibarra
catastrophes as a means of getting affordable capital into the market.
Problems with Traditional Markets Since catastrophe risks are not independent, and in the classic sense are uninsurable, how can markets share these risks most efficiently? The traditional mechanism is to share catastrophe risk with another insurance entity by what is called reinsurance. Reinsurance can take many forms. The two most common reinsurance arrangements are quota share and stop loss. A quota share is an arrangement where the primary insurance company shares premium and risk in some proportion with a reinsurance company. A stop loss can be thought of as another insurance contract – the primary insurer pays a premium to the reinsurer who agrees to pay for all losses beyond a certain threshold. While reinsurance markets are extremely effective and have grown in recent years, there are significant limitations. First, price discovery is difficult. There is no price transparency. The international reinsurance market is a classic thin market with few buyers and sellers. Second, transaction costs are high. Reinsurance contracts can be unique, requiring costly legal fees to tailor the contract to the special circumstances. Monitoring must also occur to reduce the likelihood of moral hazard. Third, the prices that must be charged for reinsurance may simply not match the willingness to pay. In addition to covering the transaction costs, prices are to build reserves and account for the ambiguity of catastrophe risk (Jaffee and Russell, 1997; Skees and Barnett, 1999). A lack of understanding about the risks and events being insured may cause insurers and reinsurers to set premiums too high (Camerer and Kunreuther, 2002) Froot (1999) develops four explanations for the high price and low use of catastrophe reinsurance: 1) reinsurers have market power; 2) the corporate form for reinsurance is inefficient; 3) frictional costs of reinsurance are high; and 4) moral hazard and adverse selection at the insurer level are high.
Most of the analytical review provided by Froot boils down to items that increase the transaction costs of getting reinsurance for catastrophes. Froot goes on to point to how insurance regulations increase the transaction costs even further and how free government disaster assistance crowds out development of reinsurance markets. Finally, he discusses how decision makers may underestimate or simply not consider the very low likelihood of payment from reinsurance. Kunreuther (1976) also reviews these cognitive failure problems in insurance and reinsurance markets.
New Market Instruments for Sharing Catastrophe Risk New innovations are emerging to address the limits of reinsurance (Cole and Chiarenza, 1999; Doherty, 2001; Lamm, 1997). Many of these innovations are being called insurance securitization. Insurance securitization involves the creation of a marketable security that is financed by premiums flowing from a contingent claims transaction – generally the traditional insurance and reinsurance transactions. The concept is simple: if the risk can be standardized in some fashion and packaged into a market security, then many investors can participate in the risk sharing. Since capital markets trade many times the value of the entire reinsurance capacity, this access to additional capital with lower transaction costs should compensate for many of the limitations in the reinsurance markets. Despite significant growth in the volume of insurance securities, they remain a small percentage of the overall reinsurance market (roughly 5 percent). Still these markets hold promise, and there is considerable excitement in the industry about their potential (Elliott, 1998). Two classes of equity instruments are being used to securitize insurance risk: exchange-traded indexes (e.g., the CAT contract on the CBOT) and risk-linked securities (e.g., Catastrophe or CAT bonds). Both provide a mechanism of risk transfer from a primary insurer to a large group of investors/speculators. As such, they serve as

Crop Disaster Assistance in Ukraine: Issues, Alternatives, and Consequences Section 2:Reinsurance
11
Skees, Hess, Ibarra
another type of reinsurance. The actual arrangement for these equity instruments can take many forms. In some cases, they will look very similar to reinsurance and protect against excess losses of the primary insurer. In other cases, they may simply be structured as an index product with an event-triggered risk (explained below). Beyond the security instruments that have emerged, event-triggered risks are being traded in other ways. The most significant event-triggered risk trades are in the new weather market where both temperature and rainfall are being traded. Exchange-Traded Indexes Exchange-traded indexes offer the opportunity to receive payments based on the occurrence of some event. Sandor, Berg, and Cole (1994) write about the attributes needed for successful futures and options contracts on indexes. “First, the underlying index must be standardized and uniform. Second, the index formula must be well understood and verifiable. Third, the prices underlying the index and the index itself must be disseminated frequently and widely. Fourth, the index inputs should be competitively determined and not subject to manipulation. Finally, the market must perceive that the index accurately reflects value (p. 6).” When an index contract is properly constructed, it is largely free of moral hazard since an individual who uses the index contract should be unable to influence the outcome that determines payments from the contract. Monitoring needs are reduced and transaction costs will be lower. The payment is solely based on the index, not on what happens to the insured’s individual losses. And while this may lower the price as it controls moral hazard and lowers transaction costs, it does mean that the insured faces a basis riskthey can have a loss even when the index does not trigger a payment. The trade-off between increased basis risk and lower moral hazard is key. Since incentives are more properly ordered with an index contract, one can expect that there are opportunities for more price transparency and increased liquidity. Ultimately, secondary markets may also emerge where individuals who purchase
index contracts to protect against their risk exposure can sell the contracts as conditions change and they become more valuable to someone else who is at risk. The Property Claim Services (PCS) CAT options that trade on the CBOT are the first exchange-traded indices. PCS is an industry authority that has provided estimates of catastrophic property damage since 1949. PCS provides the data needed to trade and settle PCS CAT options. There are nine indices (one national, five regional, and three states) that track the PCS estimates for insurance losses resulting from catastrophes in each defined region for a specified loss period. The loss period is the time during which the catastrophe must occurthe most common loss period is set for quarterly losses. Thus, purchasing a call option at some specified loss level will give a form of reinsurance when losses during a three-month period exceed the “strike” loss level. The options are European, meaning they can only be exercised at the end of the contract. Cummins and Geman (1995) develop the economics of how to use and price the CAT contracts. When the CAT contracts were first introduced (1992), there were fewer regions and they were larger in size. Restructuring the contracts and breaking the regions into smaller sizes helped the trading considerably. For all of the CAT contracts on the CBOT, the open interest exceeded 20,000 contracts in April and May of 1998 (Bouriaux and Himick, 1998). Since that time, open interest has declined as the entire reinsurance market has become softer. In the spring of 1995, the CBOT introduced Crop Yield Insurance and Futures Options for corn. Sandor, Berg, and Cole were leaders in writing about what was needed and how such a contract might be designed. In the first year, there was considerable interest. Open interest exceeded 2,000. Iowa corn was the most active contract. U.S. Department of Agriculture (USDA) estimates of harvested corn yield per acre are the basis for the index. One advantage of these

Crop Disaster Assistance in Ukraine: Issues, Alternatives, and Consequences Section 2:Reinsurance
12
Skees, Hess, Ibarra
contracts is that they could be traded throughout the season. This offered opportunities to offset risk positions at any time. There are a number of reasons why the crop yield contracts have not been successful. Government subsidized reinsurance offered to crop insurance companies and constraints in the regulatory environment are likely major reasons. The concept of area yield contracts in the United States was introduced when USDA began a pilot program on area yields indexed at the county level in 1993. Numerous articles have been written about area yield insurance (Skees, Black and Barnett, 1997; Mahul, 1999; Miranda, 1991). Risk-Linked Securities Cat bonds are the most common risk-linked security. CAT bonds, just like corporate bonds, are debt instruments providing capital contingent upon the triggering of a certain event. CAT bonds are used to provide reinsurance protection. Over 30 such bonds providing over $10 billion of “synthetic reinsurance” have been sold since 1994. In exchange for taking the risk, those purchasing CAT bonds receive a relatively high rate of return if there are no catastrophes. However, they may lose some or all of their investment or earnings on their investment if a catastrophe does occur. Since catastrophes should be independent of the general economic trends, fund managers may use CAT bonds to diversify their portfolios with an equity that has zero correlation to traditional equity markets. CAT bonds can be written to replace insurance losses from a single event such as an earthquake or a hurricane or they can be written to cover risk of aggregate losses for a portfolio of risk. In both cases, the likely trigger would be some high level of loss thus making them work just like a stop loss in reinsurance or as a call option on losses beyond some level. Primary insurers and reinsurers have used CAT bonds. Capital is captured with CAT bonds. For this reason, regulators like this tool because it eliminates the likelihood that a reinsurer will default. With a traditional reinsurer, defaults are more likely
because reinsurers do not have to guarantee their ability to pay future losses. Numerous risk-modeling firms have emerged to both model catastrophes and educate potential purchases of catastrophes. The more complex the risks, the higher the transaction costs associated with defining terms, modeling, and developing the unique characteristics needed to develop the contract. While most of the CAT bonds issued to date have transferred catastrophe reinsurance risk, there are many other potential uses. Any risks where a well-defined trigger can be identified could be packaged into a CAT bond. An easily defined trigger will reduce transaction costs since no one has to worry about moral hazard or how well the business at risk is underwriting their risks. In these cases, the parametric features (the full probability distribution function) can be estimated. Such contracts are known as parametric reinsurance. For example, at least two Richter scale CAT bonds have been developed in recent years. Payments are triggered by a certain value on the Richter scale at a certain location. These CAT bonds have been as large as $100 million. Agriculture has many risks that can be parameterized: weather risk, area crop yields, some environmental risk, and others. Any of these risks could be packaged into a CAT bond, possibly with very low transaction costs.
Markets for Weather-Based Securities Weather indexes began trading in 1996 as the U.S. power industry was deregulated. Some people lose and others win when certain weather events occur. When the same event has different impacts on different parties, a trade is possible. When the power industry was deregulated, revenues became more volatile. Extremely low and high temperatures create peak load problems for the electricity industry. When the local company cannot generate enough electricity, they must buy power on the open market to meet the additional demand. By using index contracts that pay when the temperature is either too cold or too hot, the company can hedge against this added cost. In some cases, power companies may also want to

Crop Disaster Assistance in Ukraine: Issues, Alternatives, and Consequences Section 2:Reinsurance
13
Skees, Hess, Ibarra
protect against normal temperatures since benign weather creates low demand. As information systems improve and we learn more about the relationships between weather and crop yields and crop quality, it may soon be more useful to have a portfolio of weather contracts that meet particular needs. Farmers or agribusinesses may find that such contracts are more dynamic than traditional crop insurance. For example, different weather events will have varying influence depending on the cumulative weather events that create a unique growing season. If the crop starts slow due to a cold wet spring, the timing of the weather may influence yields differently than a season with a quick start. Further, new varieties may be expected to respond differently to weather events than old varieties. This knowledge may be used to tailor the rainfall contracts to the new varieties rather than using historic yield records. Improvements in information systems will continue. Credible and inexpensive ways of measuring weather events will make these markets even more attractive when they are coupled with computer models that link weather events to yields or other variables that drive incomes.
Reinsurance and Weather Markets Much can be said about the international reinsurance community and their resistance to entering new and un-tested markets. The use of the capital markets for sharing “in-between” risk remains in the infant stages, leaving the issue of capacity and efficiency in doubt. This raises questions about the role of government in sharing such risk. For the United States, Lewis and Murdock recommend government catastrophic options that are auctioned to reinsurers. Part of the thinking is that the government has adequate capital to back stop such options and may be less likely to load these options as much as the reinsurance market. Skees and Barnett (1999) have also written about a role for government in offering insurance options for catastrophes as a means of getting affordable capital into the market.
Finally, development of weather markets has also prompted new thinking about sharing catastrophic risk in agriculture. In 2001, the Mexican agricultural insurance program used the weather markets to reinsurance part of their multiple crop insurance program. By using weather indexes that were based on temperature and rainfall in the major production regions, a weather index was created that was highly correlated with the Mexican crop insurance loss experience. This method of reinsurance proved to be more efficient than traditional reinsurance. The Mexican contract is an important development for Ukraine and some of the ideas presented in this report. Reinsurers have now acquired many of the professionals who were trading weather. SwissRe acquired professionals from Enron and PartnerRe acquired professionals from Aquila. Reinsurers are now in a position to offer reinsurance using weather-based indexes. This type of reinsurance should be more affordable since it is not subject to the same adverse selection and moral hazard problems as traditional insurance.
Conclusion The important lessons from both market developments for sharing catastrophic risk and academic writing about how to do so with markets and government are • developing something clear and transparent is
critical, • having more data is always better for whatever
is developed, and • indexing natural disasters or area yields, so
that markets and or government can write insurance contracts on these risks, is gaining in importance.
Again, this amounts to relatively simple systems that can segment the risk into that which is highly correlated, leaving other market mechanisms to attempt to handle the independent risk.

Crop Disaster Assistance in Ukraine: Issues, Alternatives, and Consequences Section 2:Reinsurance
14
Skees, Hess, Ibarra
When considering the requirements for insurance, it is instructive to compare multiple-peril crop insurance with hail insurance. For well over 100 years, the private sector has sold crop hail insurance with no government involvement. Why has hail insurance succeeded without government involvement when multiple-peril crop insurance has not? There are at least four reasons:
(1) farmers have no better information than the insurer regarding the likelihood of a hailstorm;
(2) farmers cannot, by changing their behavior, increase the likelihood of a hailstorm or the magnitude of damage from a hailstorm;
(3) insurers can generally tell whether or not a loss was caused by hail and accurately estimate the damage without relying on information provided by the farmer; and
(4) hail risk is largely independent across exposure units.

Crop Disaster Assistance in Ukraine: Issues, Alternatives, and Consequences Section 3: Finding a Better Approach to Crop Insurance: Index Insurance Alternatives
15
Skees, Hess, Ibarra
Section 3: Finding a Better Approach to Crop Insurance: Index Insurance Alternatives
Index insurance makes payments based not on shortfalls in farm yields, but rather on measures of an index that is assumed to proxy farm yields. We will consider two types of index insurance products: those that are based on area yields where the area is some unit of geographical aggregation larger than the farm, and those that are based on weather events. Various area-yield insurance products have been offered in Quebec, Sweden, India, and since 1993, the United States (Miranda, 1991; Mishra, 1996; Skees, Black, and Barnett, 1997). Two Canadian provinces currently offer an index insurance instrument, based on rainfall: Ontario and Alberta. The Canadians are also experimenting with other index insurance plans. Alberta corn growers can use a temperature-based index to insure against yield losses in corn. Alberta is also using an index based on satellite imagery to insure against pasture losses. Mexico is the first non-developed country to enter into a reinsurance arrangement based on weather derivatives. Much of the discussion of index insurance in this report focuses on the U.S. Group Risk Plan (GRP) area-yield insurance product. The information needed to run an index insurance program is much less than what is needed for a farm-yield insurance program. One needs sufficient data to establish the expected value of the index and a reliable and trusted system to establish the estimates of realized yield values. There is no need for any farm-level information. For example, area-yield insurance indemnities are based on estimates of official measurements of realized area yields relative to expected area yields. Areas are typically defined along political boundaries (e.g., counties in the United States) for which historical yield databases already exist.
The logic for using index insurance is relatively simplethere is no asymmetric information (Skees and Barnett). Farmers likely have no better information than the insurer regarding the likelihood of area-yield shortfalls or unusual weather events, thus there is no adverse selection. Farmers cannot, by changing their behavior, increase the likelihood of an area-yield shortfall (if areas are defined at large enough levels of aggregation) or an unusual weather event, thus there is no moral hazard. All of the information needed for loss adjustment is available from public sources. Therefore, it is easy to tell whether or not a loss has occurred and accurately measure the indemnity, without having to rely on any information provided by the policyholder. All of these factors make it much less expensive for the insurer to provide index insurance than multiple-peril crop insurance. Thus, the cost of index insurance can be significantly lower than the cost of multiple-peril crop insurance. Also, since adverse selection and moral hazard are not problems, there is no need for deductibles. There are numerous ways to calculate payments on index contracts (Skees, 2000). For GRP, indemnity is calculated as
Indem = max (0, Index Trigger – Realized Index) x Liab Index Trigger
where the index is the yield for the county where the farm is located (Skees, Black and Barnett). The Index Trigger is the product of a coverage level selected by the policyholder and the official estimate of the expected county yield per acre. Coverage levels range from 70-90 percent in 5 percent increments. Expected county yields are estimated using up to 45 years of historical county-yield data.

Crop Disaster Assistance in Ukraine: Issues, Alternatives, and Consequences Section 3: Finding a Better Approach to Crop Insurance: Index Insurance Alternatives
16
Skees, Hess, Ibarra
For GRP, liability is calculated as Liability = Expected County Yield x Coverage x
Indemnity Price x Scale x Farmer’s Planted Area
where Expected County Revenue per Acre is equal to the product of the official estimate of price and expected county yield per acre and Scale is chosen by the policyholder but is limited to between 90 and 150 percent.11 Of course, one could easily adapt this contract design to any number of other indexes such as aggregate rainfall measured over a stated period at a specific weather station or the number of days with temperatures above or below a specified level. The contract design used in GRP is sometimes called a proportional contract because the loss is measured as a percentage of the trigger. Proportional contracts contain an interesting feature called a disappearing deductible. As the realized index approaches zero, the indemnity approaches 100 percent of liability, regardless of the coverage chosen. An alternative design has been proposed for rainfall index insurance (Martin, Barnett, and Coble).12
Indem = max (0, Index Trigger – Realized Index) x Liab Index Trigger – Limit
if Realized Index > Limit, else Indemnity = Liability
11. The limitations on both Coverage and Scale were politically dictated. In principle, there is no reason that these parameters would need to be limited with index contracts. Still, it is common to set some limits on how much index insurance a farmer can purchase. Some estimates of value at risk may be used for this purpose. For the GRP program, the farmer must certify the planted acreage used to calculate liability. 12 .The presentation here is for index insurance that would protect against losses due to insufficient rainfall. Martin, Barnett, and Coble present an analogous index insurance that would protect against losses due to excessive rainfall.
Here Limit is a parameter selected by the policyholder and bounded by 0 or Limit < Index Trigger. The choice of Limit determines how fast the maximum indemnity is paid. By their selection of Limit, policyholders can attempt to better match indemnities with expected losses over the domain of potential realized values for the index. For example, suppose that losses would occur when realized aggregate rainfall is less than 100 mm, measured over a given time period at a given weather station. Further suppose that realized rainfall less than or equal to 50 mm would cause a complete loss. The policyholder would select an Index Trigger of 100 mm and a Limit of 50 mm. If realized rainfall is less than or equal to 50 mm, the Indemnity would be equal to the full Liability. One can easily see that the GRP contract is simply a specific case of this more general contract design with Limit set equal to zero. At the other extreme, the closer Limit is set to Index Trigger, the more the contract resembles a “zero-one” contract where Indemnity equals zero or the full Liability solely based on the condition if the Realized Index < Index Trigger.
Prototype Weather Index Insurance Contract for Ukraine To provide an illustration of the concept of weather index insurance, a prototype insurance contract was developed using a yield and weather dataset for the one Ukrainian county (Artemisvsk) in the Donetsk oblast. The prototype contract would pay based on shortfalls in precipitation during the critical growing period and freezing temperatures shortly after planting. Again, the purpose of this prototype is to illustrate the concept of weather index insurance to the Ukrainian industry participants.
• Crop: Winter wheat, using weather station: Artemisvsk (Donetsk oblast)
• Weather index: (a) Cumulative rainfall April 10–June 20 (10-day capped at 45mm); (b) Minimum temperature

Crop Disaster Assistance in Ukraine: Issues, Alternatives, and Consequences Section 3: Finding a Better Approach to Crop Insurance: Index Insurance Alternatives
17
Skees, Hess, Ibarra
• Insured sum per hectare (max. payout): US$100
• RAIN: Payout Trigger: 94mm (80 percent of average); Payout per mm of rain deficit: US$0.9
• FREEZE: Payout for first day with temperature below –1Co: US$12; Second day US$5; Third day US$2
• Premium rates with loads in the 6-7 percent range.
This contract yielded respectable results in terms of the relationship between revenue losses and weather events simulated in the past (burn analysis). Between 1984 and 2001, the contract would have paid out in all years (other than 1987) with major revenue losses expressed as major deviations from mean trend adjusted revenue. The construction of accurate indexes is complicated by the trend breaks in the yield data after 1990 and the insufficient available price data. Nevertheless, this first weather index suggests that the correlation between precipitation during the latter months of the winter wheat cycle, as well as freeze events, is promising for developing weather insurance in this particular locale.
Experience with Index Insurance In the United States, participation in GRP has been relatively low for a variety of reasons. Obviously, is it quite different from traditional insurance, and this raises legitimate concerns from the insurance industry. Traditional insurers find it difficult to understand and accept an insurance product where indemnities are not based on farm-level yield losses. Farmer interest has also been mixed. Not surprisingly, most GRP policies seem to be sold in areas where crop insurance sales agents are most familiar with GRP. In 2000 about 5.6 million acres were insured under GRP. In some states with strong agents selling GRP, the participation rates were relatively high. The Ontario, Canada, rainfall insurance product was fully subscribed in the first year that it was introduced (2000). However, this is a limited pilot test with a restricted market. By 2001 the market
was expanded and 235 farmers purchased about $5.5 million in liability with payments of $1.9 million.13 A similar policy in Alberta, Canada, has now had two years of experience. Over 4,000 farmers purchased the rainfall index insurance in 2002. For many emerging economies, rainfall index insurance merits consideration (Hazel, 1992; Skees, Hazell, and Miranda, 1999). While basis risk may generally be lower with area-yield index insurance, there are several reasons why rainfall index insurance may be preferable in an emerging economy like Ukraine. First, there may be limited data available at the county level. Second, current systems for developing county-yield data are not well understood and may still be limited. On the other hand, the meteorological data in Ukraine have a long history of being developed in a similar fashion over time. Third, it may be less costly to set up a system to measure weather events for specific locations than to develop a reliable yield estimation procedure for small geographical areas. Finally, either insufficient or excess rainfall is a major source of risk for crop losses in many regions. Drought causes low yields and excess rainfall can cause either low yields or serious losses of yield and quality during harvest (Martin, Barnett, and Coble). For irrigated farms, a drought can also cause increased irrigation costs. The World Bank Group is now studying the feasibility of rainfall index insurance in a number of countries. The International Finance Corporation (IFC) of the World Bank Group is planning to take a financial interest in making rainfall insurance offers in developing countries; Morocco has launched a new rainfall insurance contract for the fall of 2002. The IFC is interested in supporting these innovations as a means of supporting risk-sharing arrangements. A specially funded project was also awarded to a working group within the World Bank. This project has investigated the feasibility of developing weather-based index insurance for four countries: 13. Personal email communication with Mr. Paul Cudmore of Agricorp, Canada, October 23, 2001.

Crop Disaster Assistance in Ukraine: Issues, Alternatives, and Consequences Section 3: Finding a Better Approach to Crop Insurance: Index Insurance Alternatives
18
Skees, Hess, Ibarra
Nicaragua, Morocco, Ethiopia, and Tunisia. Since that project began, several of the professionals involved have begun similar investigations in Mexico, Argentina, and Ukraine at the request of those governments. The governments of Turkey, Brazil, India, and Mongolia have made similar requests. There is clearly a growing international interest in weather-based insurance.
Basis Risk The phrase basis risk is most commonly heard in reference to commodity futures markets. In that context, “basis” is the difference between the futures market price for the commodity and the cash market price in a given location. Basis risk is variation over time in the relationship between the local cash price and the futures price. Consider a U.S. example where farmers in a specific locale chose to forward price their corn using the Chicago Board of Trade (CBOT) December futures contract. By selling December futures contracts, the farmers “lock in” a price at harvest that is conditional on an anticipated relationship between the futures market price and the local cash price. For instance, they may anticipate that when they harvest and sell their crop in November, the local cash price will be 20 cents per bushel lower than the November price on the December CBOT contract. If, however, local cash prices are much lower than expected relative to the CBOT, say, 35 cents per bushel below CBOT, the farmers do not get the price risk protection that they had hoped for. Their actual realized price from the combined cash market and futures market activities is 15 cents per bushel less than had been expected. Conversely, the local cash price may be much higher than expected relative to the CBOT price. For instance, the local cash price may be only 5 cents per bushel lower than the CBOT price. In this case, the farmer’s actual realized price from the combined cash market and futures market activities is 15 cents per bushel more than had been expected. Basis risk is a common phenomenon in futures markets. While futures contracts can still be
effective price risk management tools for farmers, the existence of basis risk implies that farmers will not always receive the anticipated price. Sometimes it will be higher. Sometimes it will be lower. Because of basis risk, forward pricing in the futures market does not eliminate all exposure to price risk. Basis risk also occurs in traditional insurance. It occurs when an insured has a loss and does not receive an insurance payment sufficient to cover the loss (minus any deductible). It also occurs when an insured has a loss and receives a payment that exceeds the amount of loss. Since indemnities are triggered by area-yield shortfalls or weather events, an index insurance policyholder can experience a yield loss and not receive an indemnity. The policyholder may also not experience a farm-yield loss and yet receive an indemnity. The effectiveness of index insurance as a risk management tool depends on how positively correlated farm-yield losses are with the underlying area yield or weather index. In general, the more homogeneous the area, the lower the basis risk and the more effective area-yield insurance will be as a farm-yield risk management tool. Similarly, the more a given weather index actually represents weather events on the farm, the more effective the index will be as a farm-yield risk management tool.
Recently, the academic literature on crop insurance has focused on basis risk that will naturally be part of any index insurance program. But there has been little discussion of the basis risk inherent in farm-level insurance. To illustrate how basis risk is possible for farm-level multiple-peril insurance programs, one need only consider the major underwriting mechanism used in the United States to establish the insurable yields. Recall that in the United States, the insurance yield (a measure of central tendency) is based on a simple 4-10 year average of historical yield data for the insurance unit. The “square root of n rule” states that for normal distributions, an average
estimates the true central tendency of the distribution with standard error calculated as

Crop Disaster Assistance in Ukraine: Issues, Alternatives, and Consequences Section 3: Finding a Better Approach to Crop Insurance: Index Insurance Alternatives
19
Skees, Hess, Ibarra
where σ is the standard deviation of the true distribution and n is the size of the sample from which the average was calculated. While crop yields are probably not normally distributed, the implications of this statistical formula would still hold for most reasonable assumptions of crop-yield distributions. Namely, the higher (lower) the standard deviation of the true distribution, the higher (lower) will be the error in using an average as an estimate of central tendency. The higher (lower) the sample size, the
lower (higher) will be the error in using an average as an estimate of central tendency. Consider the error in using an average to estimate the central tendency of crop yields with a sample size of only 4-10 years of farm-yield data. For simplicity, we assume a corn farm where yield is normally distributed with a mean of 100 bushels per acre. We consider values for σ of 25, 35, and 45 bushels per acre. Figure 3.1 presents the standard error of the estimate for different values of σ and n. Clearly, the higher the variability in yield, measured by σ, the higher the error in using a simple average as an estimate of central tendency. However, it is also striking how much higher the error is when using four years rather than ten years of data.
Figure 3.1:The Relationships Between Estimating Farm Yields, the Number of
Observations, and the Standard Deviation of Farm Yields
0.0
5.0
10.0
15.0
20.0
25.0
4 5 6 7 8 9 10
Years of Farm Data
SD o
f Far
m Y
ield
25 35 45 If the standard deviation is 35 bushels per acre (which is a reasonable value for the United States), using only four years of data to estimate the insurance yield will result in a standard error of 17 bushels per acre. Thus, while two thirds of
the APH yields would be between 83 and 117 bushels per acre, there is a 33 percent chance that the calculated insurance yield will be less than 83, or more than 117 bushels per acre. Now consider a situation where, because of the error in using a
nEstimatetheofErrorStandard σ
=

Crop Disaster Assistance in Ukraine: Issues, Alternatives, and Consequences Section 3: Finding a Better Approach to Crop Insurance: Index Insurance Alternatives
20
Skees, Hess, Ibarra
simple average as an estimate of central tendency, the insurance yield is calculated as 120 bushels per acre when the true central tendency is only 100 bushels per acre. If the farmer selects an 85 percent coverage level (15 percent deductible) the trigger yield will be 102 bushels per acre, which is higher than the actual central tendency! While the farmer has been charged a premium rate based on a coverage level of 85 percent, in effect, the farmer has been given a coverage level over 100 percent. Due to the estimation error, this farmer could receive an insurance payment when the realized yield is at, or even slightly above the central tendency. Alternatively, if the insurance yield is estimated at 80 bushels per acre, 85 percent coverage will generate a trigger yield of 68 bushels per acre. While the farmer has been charged a premium rate based on a coverage level of 85 percent, in effect, the farmer has been given a coverage level of only 68 percent. If central tendency were estimated accurately, a yield loss in excess of 15 bushels per acre would trigger an insurance payment. Because of the estimation error, this farmer must have a yield loss in excess of 32 bushels per acre to receive an insurance payment. Because of the error in estimating central tendency, it is possible for farmers to receive insurance payments when yield losses have not occurred. It is also possible for farmers not to receive payments when payable losses have occurred. Thus, basis risk occurs not only in index insurance but also in farm-level yield insurance. Another type of basis risk results from the estimate of realized yield. Even with careful farm-level loss adjustment procedures, it is impossible to avoid errors in estimating the true realized yield. These errors can also result in under- and over-payments. Between the two sources of error, measuring expected yields and realized yields, farm-level crop insurance programs also have significant basis risk. Longer series of data are generally available for area yields or weather events than for farm yields.
The standard deviation of area yields is also lower than that of farm yields. Since n is higher and σ is lower, the square root of n rule suggests that there will be less measurement error for area-yield insurance than for farm-yield insurance in estimating both the central tendency and the realization. Long series of weather data are also available, but it is not necessarily true that the standard deviation of weather measures will be less than that of farm yields.
Summary of the Relative Advantages and Disadvantages of Index Insurance Index contracts offer numerous advantages over more traditional forms of farm-level multiple-peril crop insurance. These advantages include
No moral hazard. Moral hazard arises with traditional insurance when insured parties can alter their behavior so as to increase the potential likelihood or magnitude of a loss. This is not possible with index insurance because the indemnity does not depend on the individual producer’s realized yield. No adverse selection. Adverse selection is a misclassification problem caused by asymmetric information. If the potential insured has better information than the insurer about the potential likelihood or magnitude of a loss, the potential insured can use that information to self-select whether or not to purchase insurance. Those who are misclassified to their advantage will choose to purchase the insurance. Those who are misclassified to their disadvantage will not. With index insurance products, insurers do not classify the individual policyholder’s exposures to risk. Further, the index is based on widely available information. So there are no informational asymmetries to be exploited. It is true that some will find index insurance products more attractive than others. However, unlike individualized insurance products, such self-selection will not affect the actuarial soundness of index insurance products.

Crop Disaster Assistance in Ukraine: Issues, Alternatives, and Consequences Section 3: Finding a Better Approach to Crop Insurance: Index Insurance Alternatives
21
Skees, Hess, Ibarra
Low administrative costs. Unlike farm-level multiple-peril crop insurance policies, index insurance products do not require costly on-farm inspections or claims adjustments. Nor is there a need to track individual farm yields or financial losses. Indemnities are paid solely on the realized value of the underlying index as measured by government agencies or other third parties. Standardized and transparent structure. Index insurance policies can be sold in various denominations as simple certificates with a structure that is uniform across underlying indexes. The terms of the contracts would therefore be relatively easy for purchasers to understand. Availability and negotiability. Since they are standardized and transparent, index insurance policies can easily be traded in secondary markets. Such markets would create liquidity and allow the policies to flow to where they are most highly valued. Individuals could buy or sell policies as the realization of the underlying index begins to unfold. Moreover, the contracts could be made available to a wide variety of parties, including farmers, agricultural lenders, traders, processors, input suppliers, shopkeepers, consumers, and agricultural workers. Reinsurance function. Index insurance can be used to transfer the risk of widespread, correlated, agricultural production losses. Thus, it can be used as a mechanism to reinsure insurance company portfolios of farm-level insurance policies. Index insurance instruments allow farm-level insurers to transfer their exposure to undiversifiable correlated loss risk while retaining the residual risk that is idiosyncratic and diversifiable (Black, Barnett, Hu,).
There are also challenges that must be addressed if index insurance markets are to be successful:
Basis Risk. It is possible for index insurance policyholders to experience a loss and yet not receive an indemnity. Likewise, they may receive an indemnity when they have not experienced a loss. The frequency of these occurrences depends on the extent to which the insured’s losses are positively correlated with the index. Without sufficient correlation, “basis risk” becomes too severe, and index insurance is not an effective risk management tool. Careful design of index insurance policy parameters (coverage period, trigger, measurement site, etc.) can help reduce basis risk. Security and dissemination of measurements. The viability of index insurance depends critically on the underlying index being objectively and accurately measured. The index measurements must then be made widely available in a timely manner. Whether provided by governments or other third party sources, index measurements must be widely disseminated and secure from tampering. Precise actuarial modeling. Insurers will not sell index insurance products unless they can understand the statistical properties of the underlying index. This requires both sufficient historical data on the index and actuarial models that use these data to predict the likelihood of various index measures. Education. Index insurance policies are typically much simpler than traditional farm-level insurance policies. However, since the policies are significantly different than traditional insurance policies, some education is generally required to help potential users assess whether or not index insurance instruments can provide them with effective risk management. Insurers and/or government agencies can help by providing training strategies and materials not only for farmers, but also for other potential users such as bankers and agribusinesses.

Crop Disaster Assistance in Ukraine: Issues, Alternatives, and Consequences Section 3: Finding a Better Approach to Crop Insurance: Index Insurance Alternatives
22
Skees, Hess, Ibarra
Marketing. A marketing plan must be developed that addresses how, when, and where index insurance policies are to be sold. Also, the government and other involved institutions, must consider whether to allow secondary markets in index insurance instruments and, if so, how to facilitate and regulate those markets. Reinsurance. In most transition economies, insurance companies do not have the financial resources to offer index insurance without adequate and affordable reinsurance. Effective arrangements must therefore be forged between local insurers, international reinsurers, local governments, and possibly international development organizations.
Index insurance is a different approach to insuring crop yields. A precondition for such insurance to work is that many farmers in the same location must be subjected to the same risk. In short, rather than the usual precondition of independent risk, it is strongly correlated risk that makes index insurance work the best. When
correlated risks are present, index insurance has the potential to offer affordable and effective insurance for a large number of farmers. Such insurance requires a different way of thinking. It is possible to offer such contracts to anyone at risk when there is an area wide crop failure. Furthermore, unlike traditional insurance that pays the individual based on his or her losses, there is no reason to place the same limits on the amount of liability an individual purchases. As more sophisticated systems to measure events that cause widespread problems are developed (such as satellite imagery), it is possible that indexing major events will be more straightforward and accepted by international capital markets. Under these conditions, it may become quite possible to offer insurance in countries where traditional reinsurers and primary providers would previously never have considered. Insurance is about trust. If the system to index a major event is reliable and trustworthy, there are truly new opportunities in the world to offer a wide array of index insurance products.

Crop Disaster Assistance in Ukraine: Issues, Alternatives, and Consequences Section 4: Assessing the Market for Agricultural Insurance in Ukraine
23
Skees, Hess, Ibarra
Section 4: Assessing the Market for Agricultural Insurance in UkraineUkraine has nearly one third of the world’s “black soils” (See Appendix A for a description of the soil in Ukraine). The total surface of Ukraine comprises some 60 million hectares. Of that, 42 million are considered suitable for agriculture of some type and 33 million are considered arable. Nonetheless, land use data suggest that several million hectares considered suitable for agriculture are fallow. The table below presents a summary of land use for the major crops in 2000. Table 4.1: Ukraine Land Use Estimates 2000
Crop % Share of Hectares
Thousands of Hectares
Mixed Grasses 25 7000 Wheat 18 5162 Barley 13 3689
Maize-Silage 11 3224 Sunflowers 10 2842
Potatoes 6 1630 Maize 5 1279
Sugar beets 3 746 Root Vegetabl 2 605
Fruit 2 568 Buckwheat 2 527
Rye 2 481 Oats 2 480
Source: United Nations Food and Agriculture Organization, (FAO), www.fao.org
These numbers total about 28 million hectares. The five crops that are used for our risk profile analysis comprise about one half of that total. Interestingly, hectares devoted to animal feed (silage or forage) are nearly three times greater than maize hectares grown for grain. This is important to note since it would be nearly impossible to insure these plantings with traditional insurance as it is very difficult to measure yields for corn silage and forage that are fed to animals. On the other hand, weather insurance can be quite useful for these plantings as it is not necessary to measure the yields with weather index insurance. It is also important to note that over 98 percent of the surface planted to wheat is for fall planted wheat, whereas over 88 percent of the surface planted to barely is for
spring planted barley. This is favorable to an insurance portfolio, as the different weather events will impact these two crops in different ways; making the likelihood that the correlation in wheat and barley yields will be relatively low. Some 5 million persons are reported as being employed in an agricultural activity, over 20 percent of the labor force, with up to 0.25 million agricultural entities. In 2000 gross value of agricultural production was roughly (Ukrainian Hryvna) UAH 16.7 billion in 1996 prices. Estimates are that 65 percent of that value came from crops and 35 percent from livestock enterprises (FAO). Agricultural production accounts for roughly 11-12 percent of Ukraine’s GDP. (Van Atta, 2001). Table 4.2: Grain Area, Yield, and Production:
All Farms, 1987-1998, (10-year Average)
Crop Thousands of Hectares
Tons / Hectares
Winter Wheat 6,081 3.18 Spring Wheat 86 2.17
Total Wheat 6,167 3.17 Winter Barley 436 2.85 Spring Barley 3,265 2.50
Total Barley 3,702 2.55 Rye 565 2.08
Oats 529 2.16 Millet 198 1.37 Corn 1,207 3.00 Rice 24 2.86
Coarse Grains 6,201 2.54 Total Grains 12,392 2.85
Buckwheat 428 0.88 Pulses 1,120 1.95
Miscellaneous 36 1.34 Winter Grains 7,083 3.08 Spring Grains 6,894 2.32
Total w/ Pulses 13,976 2.71 Sources: USDA/ERS, USDA/FAS, Ukraine Committee on Statistics.

Crop Disaster Assistance in Ukraine: Issues, Alternatives, and Consequences Section 4: Assessing the Market for Agricultural Insurance in Ukraine
24
Skees, Hess, Ibarra
As of 1997 a very small percentage of grain and sunflower production came from individual farms. Household plots account for large portions of potatoes and vegetables production. Household plots also accounted for around 60 percent of the meat, milk, and eggs in Ukraine.
The Status and Structure of the Agricultural Sector in Ukraine The path of agricultural and economic policy reforms has greatly influenced the performance of transition economies in Eastern Europe. Different approaches to reform account for a divergence in the economic performance among these countries (Swinnen, 2001). All countries belonging to the former Soviet Republic experienced significant declines in output and GDP in the early years following their independence, as was to be expected. Countries that were quick to respond to the changing economic and political environment were able to accelerate or lessen the economic decline during the mid-1990s. For Ukraine, which has been slow to enact policy reforms, steep declines in GDP, output, and productivity were felt for nearly a decade. The year 2000 showed the first signs of growth in these indicators, possibly the result of increased privatization of land and other market-oriented policies. More reforms are needed, however, to improve the productivity and efficiency of the agricultural sector. Privatization of farms has been very slow to emerge as most policies and agricultural supports have excluded privately owned farms. The majority of state-run farms had been restructured into joint stock companies known as Collective Agricultural Enterprises (CAE) during the 1990s. These enterprises were reformed in 2000 to establish more secure property rights, though most remain in pseudo-collective ownership in the form of agricultural enterprises or joint stock and limited liability companies. Small household plots still remain the most productive sector, however, producing the majority of the country’s food supply.
Household plots, with an average size of 0.5 hectare, contribute 63.6 percent of total agricultural production in Ukraine, while utilizing only about 10 percent of agricultural land. In the western region of the country, household plots dominate agricultural production at 70 percent (State Statistics Committee of Ukraine, 2001). In 2000 household plots produced 75 percent of all livestock and poultry, 72 percent of eggs, and 66 percent of milk. Household production has primarily been used for subsistence purposes, with surplus sold in local markets. With the April 2000 reformation of CAE, the establishment of property values and titles has encouraged more efficient management of agricultural land. Crop yields still remain low, but could be increased with improved crop management and technical assistance. High planting densities and minimal use of chemical inputs are cited as contributing factors to low yields. Table 4.3: Agricultural Production in Ukraine
in 2000
Source: Artiushin et al., 2001
Farm Size and Ownership Patterns Policies aimed at certifying property rights have led to increased privatization of farmland. Tables 4.4 and 4.5 show the number and structure of farms in the Ukraine. The average size of private farms has increased throughout Ukraine’s transition as policy reforms have made it easier to own and lease farmland. In January 2000 state-
Crop2000
production (million tons)
Land area used
(million ha)
YieldTon/ha
Cereals 31.9 -- --Corn 3.4 1.1 2.81
Sugar beets 15.5 0.842 18.4Sunflower seeds 2.4 2.4 1.01
Potatoes 17 2.4 10.6Milk 11.8 -- --
Livestock/poultry 1.7 -- --Eggs 8500 -- --

Crop Disaster Assistance in Ukraine: Issues, Alternatives, and Consequences Section 4: Assessing the Market for Agricultural Insurance in Ukraine
25
Skees, Hess, Ibarra
owned agricultural land accounted for only 2.0 million hectares (less than 5 percent). Non-state (held by agricultural enterprises and companies) accounted for 30.9 million hectares, while the amount of private agricultural land (including household plots) had risen to 7.4 million hectares. The average size of privately owned farms varies across the country: For example, average farm size is only 8-12 hectares in the Transcarpathia oblast, while average farm size is 109-111 hectares in the Rivne and Luhansk oblasts. (Puhachov & Puhachova, 2001) Table 4.4: The Number and Size of Private
Farms14 in Ukraine on January 1, 2001. Indicators 1991 1996 2000 2001Number of Farms 82 34,778 35,884 38,400Agricultural land (1000 hectares) 1.99 786.3 1162.3 2200Average farm size (hectares) 24.3 22.6 32.4 56Source: Puhachov & Puhachova, 2001 The leasing market is also beginning to emerge as a result of increased privatization of the reformed CAE. Leasing of land shares is now very common practice among members of joint stock agricultural enterprises. Nearly half of the land used by farmers is leased. As of October 2001, 20.7 million hectares of land were being leased by 5.3 million citizens (Artiushin et al., 2001).
Access to credit and financial services Movement towards market liberalization has removed some of the price distortions created under central planning. This has resulted in declines in commodity prices, while prices for agricultural inputs have increased. There is adequate supply of domestic and foreign input suppliers of chemical inputs. Demand for chemical inputs is limited, however, because producers do not have easy access to finance and credit (cyclical problem). Access to credit is extremely limited, especially for small private farms that were excluded from earlier government
14. Including household plots.
supported credit programs, such as credit barters and interest subsidies. Seasonal credit for the purchase of essential inputs, such as fuel and lubricants can be obtained through commercial lenders, input suppliers, or the state. However, foreign suppliers are growing more reluctant to extend credit because of problems with repayment. In a survey of chief executives of agricultural enterprises in the Ukraine, 28 percent reported failure or delay in credit repayment. (Taylor Nelson Sofres (TNS) Ukraine, 2002). Borrowers need to be creditworthy (profitable) to obtain loans, but lack of access to credit poses a constraint on production improvements. Obstacles to credit reported in the survey include high interest rates (30 percent) and no mortgage (lack of collateral). Profitable farmers have access to credit because they can repay their debts. Less profitable farmers have difficulty obtaining credit and, therefore, inputs. For this category of farmers their low productivity is exacerbated by an inability to increase productivity without access to capital. The result on output is low yields, depleted soils, and other problems.
Risk Profile for Ukrainian Farmers The major risk facing farmers in Ukraine appears to be market risk. A lack of market infrastructure to support the sale and movement of agricultural products has hindered the development of a market economy. Producers cannot guarantee an outlet or price for their product because of the instability of the transition economy. Declining commodity prices and high input prices compound these problems. The TNS development survey of agricultural enterprises in the Ukraine revealed that farmers’ failure to repay credit was most often attributable to problems related to the sale of produce (71 percent of respondents) primarily resulting from low product prices, limited demand, lack of market information; and high interest rates (53 percent of respondents). Only 12 percent cited bad harvests as the reason for their inability to repay their debts. (TNS Ukraine, 2002). This suggests that in

Crop Disaster Assistance in Ukraine: Issues, Alternatives, and Consequences Section 4: Assessing the Market for Agricultural Insurance in Ukraine
26
Skees, Hess, Ibarra
recent years market and price declines pose more of a risk to farmers’ profitability than yield risks. The survey also revealed that the most commonly cited production-related problems concerned inefficiencies in crop management such as use of chemical inputs and machinery, as well as problems with new seed varieties. While regional differences were very evident, few farmers reported production related problems resulting from lack of financing or natural disasters.
Demand for Agricultural Insurance: Links to Rural Finance While there are many banks in Ukraine, few provide any long-term loans. Limited loans are available to agriculture and short-term loans dominate. According to van Meijel:
“Farmers often take out these loans in March or April and must pay them back in December. The compensation loans given by the government do support agriculture, but are often hard to acquire. The reason that banks do not draw long-term loans is that farmers do not have long-term business plans. For farmers, it is hard to make long-term assumptions, as they do not know when or how the policy will change.”
Furthermore, high interest rates can be prohibitive. Generally, rural credit requires fixed assets, as well as equipment and personal guarantees as collateral. Equipment in Ukraine is old and of limited value. Increasingly rural finance institutions are considering using future harvest gains as collateral. To hedge against crop losses, these lenders are also interested in insuring the harvest. Currently, the major banks active in agricultural lending, such as Aval with a total of 4600 loans and 30 percent market share, simply do not lend on the basis of uninsured collateral. The farmer has to produce a proper insurance policy written by a pre-approved insurer to obtain credit. At the current time, interest rates do not vary according to insurance coverage. Regardless, less than 10 percent of agricultural enterprises were insured in 2001 (Artiushin et al., 2001).
Most banks set up their own insurance companies to provide for their own lending insurance needs. Nonetheless, frequently the insurance polices cover only very limited risks as a means of keeping premiums low. These policies are often somehow artificial and destined only to comply with government regulations requiring insurance as collateral. Several banks demonstrated lack of awareness of the real crop risks. Therefore the real coverage of their collateral is restricted to some risks, with no inclusion of major severe risks, in particular drought risk. Still, the banks demonstrated a keen interest in more appropriate crop insurance coverages that would allow them to extend loans to the riskier groups such as smaller farmers with limited traditional collateral. Private market-oriented farmers would likely have the most interest to purchase insurance as opposed to farms under collective ownership where incentives for risk mitigation are less. Privately owned farms make up only a small percentage of agricultural enterprises, although their numbers are on the rise. Banks and input suppliers that offer credit to producers may also have an interest in purchasing insurance, since loan repayments are dependent on producer output and future output is often used as collateral. However, insurance would not hedge against poor production resulting from poor management. Poor yields due to managerial or technical deficiencies are more likely a concern than weather related losses. Therefore, these institutions may benefit more from assessing the credit risk of potential clients. The current methods of charging high interest rates and demanding large amounts of collateral inhibit less productive producers from obtaining credit. During the World Bank mission in July 2002, the insurance team used presentations and individual discussions to educate and familiarize the main players in the crop insurance milieu of Ukraine. The mission introduced two major presentations: on the weather index insurance concept and related policy issues for insurance professionals, as well as a policy discussion with industry

Crop Disaster Assistance in Ukraine: Issues, Alternatives, and Consequences Section 4: Assessing the Market for Agricultural Insurance in Ukraine
27
Skees, Hess, Ibarra
participants and government officials. The first presentation at the beginning of the mission addressed a group of around 20 industry professionals. This presentation generated significant interest. A final presentation to a larger number of professionals, including the deputy prime minister, also addressed agricultural insurance policy issues, such as compulsory insurance. Between the two presentations the agrarian policy secretariat organized a policy debate that primarily discussed the issue of compulsory insurance.
The individual familiarization work with industry participants can be considered successful insofar as at least two companies expressed strong interest in developing weather index insurance in the near future. Notably, the company ASKA has put together the first weather index insurance policy for a client, following the mission seminar and visit at ASKA headquarters in Donetsk.

Crop Disaster Assistance in Ukraine: Issues, Alternatives, and Consequences Section 4: Assessing the Market for Agricultural Insurance in Ukraine
28
Skees, Hess, Ibarra
Table 4.5: Number of Agricultural Entities in Ukraine as of April 2001
Information in this text box is directly taken from a M.S. thesis that was developed at the Agricultural Economics and Rural Policy Group, Wageningen University by Sandra van Meijel. The thesis is titled The Future of Agriculture in Ukraine, April 2002. It can be found at the following web site: http://myland.org.ua/en/ Table 1: Number of agricultural entities in Ukraine, as of April 1, 2001 Non-reorganized agricultural entities 26 New agricultural entities, dividend into: 16205 Private companies 3277 Limited liability companies 6641 Joint stock companies 770 Agricultural co-operatives 2845 Private (family) farms 1767 Other entities 905 Private farms NOT registered as legal entities 228001 Total 244232 Source: State Statistical Committee As Table 1 shows, the number of agricultural entities in Ukraine was 244.232, as of April 1, 2001. In an interview held on October 24, 2001 with the director of the Association of Farmers and Landowners of Ukraine (AFLU), he indicated that there were 41.500 farms in Ukraine at that time. In general, the term farms refer to agricultural entities with less than 100 hectares of land. He also stated that the average farm has 50.4 hectares of land. The farms mentioned by the director of the AFLU are part of the agricultural enterprises given in Table 1. The private farms, which are not registered as a legal entity through Ukraine, are estimated to possess about 7 to 8 million hectares of arable land. Important to note, is that the small market-oriented enterprises, possessing a mere 15 percent of arable land, account for close to two third of gross agricultural production (UCEPS, 2001). According to the FAO (2001b), the agricultural sector employs approximately 20 percent of the national workforce. Research shows that no significant changes in the management methods of the newly created farm businesses have taken place (Pugachov, 2000). The directors have not laid off surplus workers. The owners of the agricultural enterprises must consider the interests and opinions of the rural inhabitants and are therefore forced to hire more people to avoid social conflicts.

Crop Disaster Assistance in Ukraine: Issues, Alternatives, and Consequences Section 5: Modeling Risk for Major Crops in Ukraine
29
Skees, Hess, Ibarra
Section 5: Modeling Risk for Major Crops in UkraineCrop-yield data were obtained from the Government Agrarian Policy Coordination Council. These data were for all 25 oblasts from 1970-2001. The crops include: maize, sunflowers, sugar beets, wheat, and barley. These data allow for a rudimentary assessment of risk for Ukraine. The first challenge was to adjust these time series for the central tendency through the 32 years. As expected, from 1970 to the mid-1980s there are generally positive trends in yields due to advances in technology and the application of more inputs. Ukraine had tremendous difficulties from the mid-1980s and into the early 1990s as they became independent and began the painful process of adjusting to a market-based economy, the application rates of inputs dropped off precipitously. In some areas this meant less fertilizer and chemicals, in others the change in irrigation likely accounts for major declines in yields. Relatively robust econometric procedures are needed to capture the central tendency in yields when these types of major changes are occurring. The LOESS procedures in the SAS software were used.15 Once a central tendency (trend) was developed, the next issue was to “detrend” the data into today’s technology. The central tendency was extended to the 2002 crop year. Past data were detrended with the following equation: Detrended Yieldtjc = (Actual Yieldtjc / Trend Yieldtjc) x
Trend Yield2002 jc
15. SAS reports the following about LOESS, “The LOESS procedure implements a nonparametric method for estimating regression surfaces. The LOESS procedure allows great flexibility because no assumptions about the parametric form of the regression surface are needed…[y]ou can use the LOESS procedure for situations in which you do not know a suitable parametric form of the regression surface. Furthermore, the LOESS procedure is suitable when there are outliers in the data and a robust fitting method is necessary.”
where t = year, 1970-2001 : j = oblast; 1-25: and c = crop; 1-5
Figure 5.1 provides an example of the actual yield per hectare, the trend yield, and the detrended-yield series for wheat in the Zaporizhia oblast. As described above, the actual yields increased steadily in the 1980s and then reverse trends after 1990. The smooth line is the LOESS fit for the central tendency or trend. The lower line is the detrended data and represents the best estimate of the yield, given today’s (the year, 2001) input and technology mix. Detrended yield data are used throughout to make estimates of the yield risk by oblast and crop. However, the next task is to develop the profile of risk given the historic estimates of yields and the best estimates of value at risk for the current spread of crops across Ukraine. Three years (1999-2001) are used to develop the estimate of the current plantings. A weighted average is used to make the estimate: Current Plantingjc = .5 x HA2001jc + .33 x
HA2000 jc + .17 x HA1999 jc
where j = oblast; 1-25: and c = crop; 1-5 Value at risk represents the best estimate of expected revenue for each crop at planting time in the crop year 2002. Value at risk is calculated using estimates of the 2001 expected yields, the current plantings, and the expected prices for the commodities in 2002. Value at Riskjc = Current Plantingsjc x Trend Yield 2002jc x Pricec
where j = oblast; 1-25: and c = crop; 1-5

Crop Disaster Assistance in Ukraine: Issues, Alternatives, and Consequences Section 5: Modeling Risk for Major Crops in Ukraine
30
Skees, Hess, Ibarra
Figure 5.1: Actual and Detrended Yields for Wheat in
Zaporizhia The estimated planting time prices used are in Ukrainian Hryvna (UAH) per ton:16
Sugar beets UAH 160 Wheat UAH 410 Maize UAH 465
Sunflowers UAH 1300 Barley UAH 390
Table 5.1 has oblast values at risk or the total expected revenue for these five crops. The total values are UAH 16.6 billion (about US$3.1 billion). The value-at-risk numbers are used for a number of items. First, value at risk for the crop and oblast will drive the liability for any insurance designs. The liability is the maximum amount that will be paid by an insurance policy. While the expected 2002 revenue is based upon the expected yields for 2001, it is also useful to back cast the revenue estimates given the adjusted 16. The information on prices came from the following web site: http://www.minagro.kiev.ua/pricemonitoring/index.php3
or detrended yields from 1970-2001. Again, this exercise is done with the best estimates of the current plantings and the current prices. In short, the exercise assumes that the weather events of the past would be a random draw with the current conditions. Since there are 32 past observations on yields, each yield draw is also assumed to be equally likely and independent from the previous year’s yield. A potential limitation of this analysis is that price and yield are also implicitly assumed to be independent, since the 2002 expected price is used throughout. Revenuetjc = Adjusted Yieldtjc x Hectares tjc x
Pricec
where t = year, 1970-2001 : j = oblast; 1-25: and
c = crop; 1-5
Methodology for Developing Loss Cost Estimates Given the corrections made to the oblast data described in the section above, it is now possible
Zaporizhia Wheat
0
0.5
1
1.5
2
2.5
3
3.5
4
4.5
1970 1975 1980 1985 1990 1995 2000 Year
Tons
/ H
ecta
res
Figure 5.1: Actual and Detrended Yields for Wheat in Zaporizhia

Crop Disaster Assistance in Ukraine: Issues, Alternatives, and Consequences Section 5: Modeling Risk for Major Crops in Ukraine
31
Skees, Hess, Ibarra
Table 5.1: Estimates of Value at Risk in 2001 (in UAH 1,000,000)
Oblast Barley Maize Sugar beets Sunflower Wheat Totals
Cherkasy 137 149 206 74 371 937Chernihiv 65 44 60 3 130 301Chernivtsi 24 76 59 5 57 221
Crimea 62 2 NA 41 282 388Dnipropetrovsk 226 163 51 445 383 1268
Donetsk 182 67 NA 366 205 821Ivano-Frankivsk 32 24 41 1 56 153
Kharkiv 155 54 157 313 397 1077Kherson 145 43 NA 168 455 811
Khmelnytskyi 154 53 208 3 284 703Kirovohrad 165 105 125 248 418 1062
Kiev 138 49 287 19 385 879Liev 47 16 70 NA 152 285
Luhansk 56 36 NA 205 111 408Mykolaiv 130 62 35 236 379 842Odessa 120 174 54 313 649 1309Poltava 153 123 195 176 322 969
Rivne 66 7 83 NA 109 265Sumy 115 21 136 28 222 522
Ternopil 106 36 218 1 170 530Transcarpathia 4 52 NA 2 24 82
Vinnytsia 193 157 356 46 432 1184Volyn 55 1 90 NA 127 274
Zaporizhia 181 40 NA 425 397 1043Zhytomyr 97 13 82 NA 162 354
Totals 2810 1566 2515 3118 6680 16689 to take further steps that allow for a more complete assessment of the potential cost of various agricultural insurance proposals. Generally, the largest single cost from an insurance program is the indemnities paid. The calculation of empirical indemnities forms the basis for insurance premiums. In insurance ratemaking, actuaries use the past experience on losses relative to the value insured as the basis for calculating what is termed the historic loss cost. Loss cost = Indemnities / Liabilities
When an actuary has a large number of observations on loss cost, they use the simple mean of these data as the beginning point for ratemaking. The mean of the series can also be thought of as the pure premium. Intuitively, it is a relatively simple notion that the average indemnities paid over time should be equal to the average premiums collected over time. The challenge is to develop reasonable procedures to estimate loss cost when there is no history of providing crop insurance. Loss cost estimates must come both from the empirical basis and from judgment about the level of adverse selection and moral hazard that may be present in

Crop Disaster Assistance in Ukraine: Issues, Alternatives, and Consequences Section 5: Modeling Risk for Major Crops in Ukraine
32
Skees, Hess, Ibarra
different insurance products. The components of premiums are as follows: • Loss cost or pure premium estimates from
historic data and/or simulation of data (this can include negative trends in losses).
• Loss cost loading for adverse selection and moral hazard (in principle, farm-level insurance products will be loaded much more than index-based products).
• Catastrophic loading or estimates of reinsurance costs and reserve loading (when the loss function has some high probability of large losses, reinsurance costs will be relatively high).
• Administrative cost should include the cost of underwriting, sales, upkeep, actuarial services, loss adjustment, etc.
• Profits will be added to all of these costs in many cases.
Aggregation of Indemnities and Liabilities Insurance is a portfolio problem. The value at risk is a spatial aspect of the portfolio and, of course, time is the temporal aspect. While the major weather events in the same year have similar impacts across much of Ukraine, one can expect at least some degree of diversification if crops in the different regions are insured. The fact that the various crops also have different crop growth calendars adds further diversification as the same weather events that damage the fall planted wheat may not damage maize, sunflowers, sugar beets, and barley. Figure 5.2: Map of Value of Five Crops by Oblast
Figure 5.2: Map of Value of Five Crops by Oblast
It is very important that the spatial correlation of the risk among crops across space and time has been maintained. The Ukrainian sample of 32 years can now be used to examine the profile of risk in today’s terms by assuming that every oblast has the same level of participation in the crop insurance program. Keep in mind that the values-at-risk numbers are the best estimates of the expected revenue for each oblast and crop for the 2002 crop year.
Thus, the amount insured for each is simply: Liabilityjc = Revenuejc x Participation Rate where j = oblast; 1-25: and c = crop; 1-5 Given a liability, the loss cost numbers can easily be converted to indemnities for each oblast, crop, and year.

Crop Disaster Assistance in Ukraine: Issues, Alternatives, and Consequences Section 5: Modeling Risk for Major Crops in Ukraine
33
Skees, Hess, Ibarra
Indemnitytjc = Liabilityjc x Loss Costtjc where t = year, 1970-2001 : j = oblast; 1-25: and c = crop; 1-5 Premium rates are the simple average of the loss cost (these are pure premiums before any loads are added and premiums are the product of premium rate and liability. Premiumjc = Liabilityjc x Premium Ratejc
where j = oblast; 1-25: and c = crop; 1-5 To develop the risk profile of the portfolio of insured crops, one sums up all liabilities, indemnities, and premiums for each year (keep in mind that sum of liabilities and premiums will be the same for all years since the model is in today’s terms). Once these values are aggregated to the national level, it is easy to calculate the loss ratio for the 32 years. The 32 years of the national loss ratios (indemnities/premiums) will be used to make statements about the loss function for alternative crop insurance programs in Ukraine.
Mapping Crop Risk in Ukraine
The pure risk or loss-cost measures allow one to examine the relative riskiness of the five crops across Ukraine. A simple oblast yield policy is examined to provide insights into the overall relative risk of the five crops.
Indemnity = max (0, Index Trigger – Realized Yield) x Liability Index Trigger
Liability = Price2002 x Hectaresavg-99-02 x Oblast Expected Yield2001
The index trigger is set in two different fashions: • At 95 percent of the oblast expected yield to
provide for relative risk comparisons. • At the oblast yield that represents a one-in-five
year event to better represent the preferred risk management program to address disasters.
The index trigger is set as 95 percent of the expected oblast yield, meaning that any time the actual yield drops below this trigger yield, the payment will be calculated using the percentage equation below times the liability selected.
Figure 5.3: Map of Relative Risk in Ukraine Using a 95 Percent Area-Yield Insurance Program

Crop Disaster Assistance in Ukraine: Issues, Alternatives, and Consequences Section 5: Modeling Risk for Major Crops in Ukraine
34
Skees, Hess, Ibarra
Table 5.2: Relative Pure Premium Risk for Different Crops by Oblast Using a 95 Percent Area-Yield Insurance Program.
Oblast
Maize%
Sugar beets %
Wheat%
Sunflower %
Barley %
Cherkasy 4.5 3.0 4.1 6.4 4.3 Chernihiv 2.5 2.1 3.7 4.4 5.6 Chernivtsi 2.9 3.1 4.1 8.2 5.7
Crimea 4.7 NA 4.7 6.1 5.2 Dnipropetrovsk 6.8 6.4 6.6 2.6 6.4
Donetsk 7.5 NA 4.9 3.5 5.5 Ivano-Frankivsk 3.3 3.7 3.7 7.2 5.3
Kharkiv 7.4 5.6 6.9 2.9 7.4 Kherson 4.9 NA 5.2 7.2 5.9
Khmelnytskyi 4.0 2.3 3.0 6.9 4.1 Kirovohrad 5.8 6.6 5.3 4.6 6.8
Kiev 3.6 1.8 2.9 5.1 4.4 Liev 3.2 3.4 3.1 NA 4.3
Luhansk 6.9 NA 7.9 3.9 9.6 Mykolaiv 3.8 7.1 5.9 4.4 6.9 Odessa 7.0 6.9 5.8 4.5 5.6 Poltava 4.6 4.2 6.3 3.9 5.7
Rivne 4.9 2.5 3.0 NA 4.5 Sumy 3.5 2.9 4.3 5.7 5.3
Ternopil 4.9 2.9 3.1 6.1 4.8 Transcarpathia 2.2 NA 4.6 7.5 4.6
Vinnytsia 4.2 3.1 3.0 7.3 4.9 Volyn 5.7 3.9 3.7 NA 5.7
Zaporizhia 6.3 NA 6.0 4.0 6.4 Zhytomyr 4.0 2.6 3.1 7.7 4.9

Crop Disaster Assistance in Ukraine: Issues, Alternatives, and Consequences Section 6: The Ukrainian Risk Profile
35
Skees, Hess, Ibarra
Section 6: The Ukrainian Risk ProfileAt this stage, the risk profile of Ukraine can be evaluated to demonstrate how an insurance program may have performed over the past 32 years. In particular, the concern is about the potential to spread crop risk across Ukraine among crops and oblasts. To perform this analysis, an area-yield program is developed to cover events in the tail of the distribution for each oblast. Frequency is used to define the trigger. This is a more logical way to set disaster and crop insurance programs than using percent of average or expected yield. Frequency is an important dimension of risk. Setting an index trigger at 95 percent of the expected yield may result in high frequency payments in the most risky oblasts and an infrequency of payments in the less risky oblasts. This study uses one-in-four years as the index trigger. While this may seem fairly
frequent, it is important to recognize that the level of aggregate for these data is relatively high (the oblast). Less aggregate county data would be preferred and these data would be more risky. Aggregating statistics reduces the variance. First, the country is divided into five regions that should be relatively homogenous. The map for these five regions is presented in Figure 6.1. The loss ratio for our area-yield insurance program that triggers on oblast yields below one-in-four is calculated for each year from 1970-2001. These numbers provide the information needed to examine a loss function for crop insurance in Ukraine. The loss function can be represented as a cumulative probability function as in Table 6.1, on the following page.
Figure 6.1: Regional Map for Relatively Homogenous Regions in Ukraine

Crop Disaster Assistance in Ukraine: Issues, Alternatives, and Consequences Section 6: The Ukrainian Risk Profile
36
Skees, Hess, Ibarra
Table 6.1: Correlation of Crop Insurance Loss Ratios Among the Five Regions
LR_1 100% LR_2 3% 100% LR_3 40% 69% 100% LR_4 63% 27% 60% 100% LR_5 13% 42% 63% 33% 100%
LR_1 LR_2 LR_3 LR_4 LR_5
The loss ratio correlation among the regions is encouraging. There are some relatively low correlations (e.g., the correlation between region one and two is very low). This reinforces the supposition that Ukraine is a large country and
may allow for an excellent spread of risk. Nonetheless, Figure 6.2 shows that when only pure premium is charged, even if the risk is spread across the regions, there are still large losses (up to three times the pure premium). This requires some special arrangements to finance these risks. Figure 6.2 also demonstrates how important spreading of risk is. For example, if region two is considered in isolation, there is a very long tail in the risk and the possibility of having much larger loss ratios than the combined loss ratio distribution for the entire country. Nonetheless, the country loss ratio is still likely to have large losses and require special financing
Figure 6.2: Comparison of Country-Loss Function to Regional-Loss Function
0%
10%
20%
30%
40%
50%
60%
70%
80%
90%
100%
0 1 2 3 4 5 6 7
Prob
abili
ty
Region 2
Country Loss Ratio
Loss Ratio

Crop Disaster Assistance in Ukraine: Issues, Alternatives, and Consequences Section 6: The Ukrainian Risk Profile
37
Skees, Hess, Ibarra
Likely Cost of Farm-Level Insurance
The Ukrainian government has proposed mandatory crop insurance that would pay for yields that are below 70 percent of the simple five-year average of farm-level yields. This is similar to the U.S. Actual Production History (APH) program for multiple-peril crop insurance. Based on that experience and some assumptions about the needed loads for premium rates in this setting, the likely premiums needed to support such a program will exceed 10 percent. Further, the program will have excess losses because of poor insurance infrastructure and lack of experience at making loss adjustments. Consider
the premium base should the program insure $1 billion of crop value (well less than 30 percent of the total crop value in Ukraine). At this level of participation and with a 10 percent premium rate, the premium base would be roughly $100 million. The analyses above suggest that loss ratios in the 300 percent range are possible with such a program. Thus, with even modest crop insurance program participation, the cost could exceed $300 million in the worst crop years. There is no consideration about how to finance this large exposure. International reinsurers will not be interested given the current design.

Crop Disaster Assistance in Ukraine: Issues, Alternatives, and Consequences Section 7:Development of the Insurance Market of Ukraine During the 1990s
38
Skees, Hess, Ibarra
Section 7:Development of the Insurance Market of Ukraine During the 1990s
In 1988 two state insurance institutions, Derzhstrakh and Inderzhstrakh, were the monopolists in both Ukraine and other republics of the USSR. These institutions were controlled by the state. The demonopolization of the insurance sector in the former USSR started in 1988 with legislative efforts. It wasn’t until 1990, when the Council of Ministries of the USSR approved the resolution regarding demonopolization of the economy, that the monopoly was dissolved. These efforts allowed state institutions, joint stock companies, and co-operative and mutual associations to do insurance business on a competitive basis. The movement of demonopolization made systemic changes in Derzhstrakh. As a result, republican insurance institutions were granted the right to introduce their own property and personal insurance plans. In 1991 Ukraine adopted an independent regulation of the insurance sector in its territory, as did other republics of the former USSR. For the 1991-1996 period, Ukrainian lawmakers introduced the first legislation to regulate the domestic insurance sector. This legislation ignored characteristics of the sector. Additionally, there was no entity authorized to supervise business activities of insurance companies. After years of abuses by the insurance companies, the Cabinet of Ministers focused its efforts toward regulating insurance activities and protecting policyholders. These efforts resulted in a system for the state regulation of the insurance sector, including registration of insurance companies and licensing of their business activities. The previous acts also called a halt to the State Commercial Insurance Organization, which later became the Oranta National Joint Stock Insurance Company. The origin of this organization is crucial, as it is currently the major player in the agricultural insurance market.
The insurance market grew to 700 institutions. Rather questionable organizations comprised a major part of the newly established insurers, which laundered underground money or devised financial pyramids. Many insurance companies found themselves on the verge of bankruptcy due to insufficient start-up capital, improper policy reserve funds, and low-quality management practices. The year 1999 marked the beginning of the next phase of the evolution of the Ukrainian insurance market. In that year, the Supreme Council of Ukraine passed a new insurance law. The Resolution of the Council of Ministries of the Ukrainian SSR, effective from 1981, was replaced when this legislation took effect. This resolution determined compulsory privately owned assets insurance. Consequently, this new law overturned the compulsory and prescribed voluntary privately owned assets insurance. Even though the government determined that privately owned assets insurance was voluntary, it maintained control of the boundary values of insurance rates against destruction and damages to residential constructions and facilities by natural hazards and loss of livestock by disease, accidents, or natural hazards. Additionally, the government partnered with the private sector in the creation of new companies, such as Ukrinmedstrakh, Ukreximstrakh, and Interpolis, monopolizing different types of insurance. Even though there are no longer companies that are 100-percent owned by the government, the government’s partnership probably leads to a favored business position of such companies. The first of the above mentioned companies, Ukrinmedstrakh, was founded by the Ministry of Public Health of Ukraine and, literally, managed a monopoly of the provision of compulsory medical insurance policies to foreign citizens upon entering Ukrainian territory.

Crop Disaster Assistance in Ukraine: Issues, Alternatives, and Consequences Section 7:Development of the Insurance Market of Ukraine During the 1990s
39
Skees, Hess, Ibarra
In general, the government has had an active role in the insurance market from several perspectives: • direct participation in the insurance market as
a service provider, either as a monopoly or in partnership with private capital
• regulation of the insurance sector • determination of different lines of insurance
business to be compulsory • regulation of market rates in different market
niches, both for compulsory and voluntary insurance
Another important fact to keep in mind is that during the development stage of the insurance market in the 1990s, bureaus, such as the Aviation and Marine Insurance Bureau, were created. These bureaus were authorized to coordinate the efforts of air and sea insurers with the intention of obtaining better reinsurance terms and extending tutorial assistance to insurers themselves. These institutions were expected to facilitate the development of a domestic market of these insurance services, redistribute risks abroad more reasonably, strengthen financial soundness, and together with local ministries and authorities, work out a system of measures for the cutback of accidents by air and sea. The creation of such institutions is worth mentioning since the Ukrainian insurance market has historically lacked enough capital to retain major risks, such as airliner catastrophes, whose individual costs are valued in the millions of dollars. For this report, we do not have evidence of the effectiveness of such bureaus, but their efforts demonstrate a history of cooperation in the insurance industry to develop the market for insuring major risks, which otherwise might not be insured.
Insurance Market for the Period 1995-2001: Major Performance Indicators The market value is approximately UAH 3,030 million in total insurance premiums and has been growing at an average real growth rate of 27.13 percent annually, while total indemnities
measured in real terms have not grown for the last six years (see Figure 7.1).
Figure 7.1: Total Insurance Premiums and Indemnities
One of the main reasons for the decline in relative terms of the loss ratio (indemnities/premiums) has been the incorporation of an important number of captive insurersinsurance companies established as subsidiaries of affiliates of other corporations or associated groups (see Figure 7.2). Figure 7.2: Historical Loss Ratio
The insurance policies sold under this scheme are produced exclusively for the parent company. The supervisory authority estimates that of the top 50 percent of the companies as measured by premiums, 20 percent are captive companies. Among these captive companies are a number of companies that do not necessarily insure any risk, but act primarily as tax optimization schemes.
(2001 Prices in UAH Millions)
0
500
1,000
1,500
2,000
2,500
3,000
3,500
1995 1996 1997 1998 1999 2000 2001
(Indemnities/Premiums)
0%
10%
20%
30%
40%
50%
60%
70%
1995 1996 1997 1998 1999 2000 2001

Crop Disaster Assistance in Ukraine: Issues, Alternatives, and Consequences Section 7:Development of the Insurance Market of Ukraine During the 1990s
40
Skees, Hess, Ibarra
According to information provided by the supervisory authority to this mission, insurance companies’ profits are not taxed; the tax is applied on a 3 percent basis over the total insurance premiums. Therefore the companies can deduct the insurance premiums from their profit balance and pay only a 3 percent tax through the insurance company. The supervisory authority estimates that 10 percent of all companies in the industry are tax optimization schemes. However, local market players estimate that the number of companies established to conduct non-insurance business is much larger, and the volume of premiums associated with this type of activity may be between 25 percent and 50 percent of the total market.17 Even through the rapid growth of recent years, the size of the market remains relatively small. As of 2001, gross premium income accounted for 1.5 percent of GDP. Market density is also small, with only US$12 premium income per capita. Indicators of market penetration and density are comparable with countries with similar per capita GDP, as shown in Table 7.1: Table 7.1: Comparison of Market Density of
Insurance Among Select Developing Countries
In terms of total number of companies, the market suffered an important decline between 1994 and 1997 because of the bankruptcy of many Ukrainian insurance companies over this period, especially those with important participation in the combined life insurance
17. The Ukraine Financial Sector Assessment Program (FSAP), a World Bank report.
business (see Figure 7.3).18 There were also two additional factors: the absence of safety guarantees for the funds invested by the insurance companies, and an initial increase in the minimum capital requirements in 1996. Figure 7.3: Evolution of Total Number
of Insurance Companies
Analysis of the Actual Insurance Market In Ukraine, insurance providers have to be licensed insurance institutions, constituted as joint stock companies, and approved by the Ministry of Finance. Insurers licensed for life insurance activity do not have the right to conduct other types of insurance activity. Since August 3, 2001, insurers adhere to the minimum statutory fund requirement in the amount equivalent to €100,000. For insurers with participation of foreign legal entities or individuals, a minimum statutory fund is established in the amount equivalent to €500,000. The total amount of an insurer’s contribution to the statutory fund of other insurers of Ukraine shall not exceed 20 percent of its own statutory fund, and the contribution to one sole institution shall not exceed 5 percent of its own statutory fund. There is a transitional period of two years within which all companies have to comply with the new minimum capital requirements. Until November 2001 the foreign participation in the capital of national insurance institutions was
18. Reform of The Ukraine’s Insurance System: Conceptual Background, an internal World Bank document.
Country
Real per capita GDP (US$)
Premium over GDP (%)
1.501.501.920.92 4.802.59
Premium percapita (US$)
3,981 3,9713,9663,8213,6393,546
Notes: Data on per capita GDP are for 2000; data on Ukraine is for 2001.Sources: WB Calculations
Ukraine Philippines Jordan Guatemala Jamaica Morocco
12.3713.0029.5416.20
127.7033.63
0
100
200
300
400
500
600
700
800
1994 1995 1996 1997 1998 1999 2000 2001

Crop Disaster Assistance in Ukraine: Issues, Alternatives, and Consequences Section 7:Development of the Insurance Market of Ukraine During the 1990s
41
Skees, Hess, Ibarra
limited to 49 percent, but the limitation has since been lifted. Any licensed institution is authorized to issue policies for both voluntary and compulsory insurance without any further approval or special authorization by line of business. As of 2001, there were 328 insurance companies: 309 in non-life activities and 19 life insurance companies. Of these 328 companies, 20 have
foreign participation with participation in paid-up capital of around UAH 585 million,19 which represents 56.47 percent of total paid-up capital in the market (UAH 1,036 million). This fact highlights the concentration of capital on few companies, an issue we would like to discuss in more detail. Table 7.2 demonstrates that the 30 biggest non-life companies in terms of paid-up capital concentrate 50.3 percent of the total paid-up capital in the system. Table 7.2: Top 30 Non-Life Companies
19. Ukraine FSAP (World Bank report)
№ Company name City
Authorized capital Ownership capital as per01.04.2002, UAH Ths
1 LEMMA Kharkiv 100,000.00 2 INSURANCE GROUP GARANT Kiev 76,550.40 3 ARMA Kiev 50,000.00 4 UKREKSIMSTRAKH Kiev 30,050.00 5 ORANTA Kiev 22,323.60 6 ORIANA Kiev 22,135.00 7 AVANTE Kharkiv 21,000.00 8 UKRAINIAN NAFTOGAZ INSURANCE COMPANY Kremenets 18,620.80 9 ASKA Donetsk 18,190.60
10 CREDO-CLASSIC Kiev 18,000.00 11 ALCONA Kiev 12,384.00 12 ZAKHID-RESERVE Kolomiya 12,250.00 13 UKRAINIAN FIRE&INSURANCE COMPANY Kiev 10,000.00 14 UKRAINIAN INDUSTRIAL INSURANCE COMPANY Kiev 10,000.00 15 UKRAINIAN TRANSPORT INSURANCE COMPANY Kiev 10,000.00 16 DISCO Dnipropetrovsk 9,020.60 17 OSTRA-KYIV Kiev 8,804.90 18 SKIDE-WEST Kiev 8,355.00 19 DASK Dnipropetrovsk 6,653.30 20 PODILLYA (INSURANCE GROUP"UNIVERSAL") Vinnytsia 6,000.00 21 INSPOL Mikolaiv 5,504.00 22 IG "TAS" Kiev 5,500.00 23 EDEM Kiev 5,500.00 24 UKRNAFTATRANS Kiev 5,400.00 25 UKRGAZPROMPOLICY Kiev 5,000.00 26 TEREN (INSURANCE GROUP"UNIVERSAL") Ternopil 5,000.00 27 KNIAZHA Rivne 5,000.00 28 ENERGOPOLICY Kiev 4,860.00 29 NADRA Kiev 4,752.00 30 VEKSEL Kiev 4,680.00
TOTAL 521,534.20
TABLE 7.2: Top 30 Non-Life Companies

Crop Disaster Assistance in Ukraine: Issues, Alternatives, and Consequences Section 7:Development of the Insurance Market of Ukraine During the 1990s
42
Skees, Hess, Ibarra
Even within the top 30 group, there is an important concentration of capital, with the first seven companies holding 61.75 percent of the total capital from this group and 31.06 percent of the total capital in the industry. It is important to mention that 289 companies have a lower paid-up capital than UAH 5 million. Market Structure The insurance market in Ukraine is divided into three segments. The first type of activity involves the protection of property and obligations of major international corporations. Such corporations, having their origins in other more developed markets, will regard insurance as an essential part of their risk management practices. For this reason, they will acquire extensive coverage for property and liability risks through local companies and require them to reinsure most, if not all the risk, with reputable reinsurers abroad. Experience has shown that professional brokers or local companies through fronting usually manage businesses of this nature very effectively. Even though there is not specific data to measure the importance of each sector, the influence of this first one can be understood by
observing the relative importance of voluntary property insurance and voluntary liability insurance in the whole market, and the share of premiums ceded abroad for reinsurers in these two lines of business. The second category of insurance activity is between local companies and their domestic clients. This sector is characterized by a limited number of skilled people running the business and there is usually little reinsurance. This situation occurs because such new programs usually do not have the standards or have not developed the confidence in their internal control and underwriting schemes to be internationally reinsured. The third type of activity is carried out by captive insurers. Market Distribution by Line of Business In Ukraine there are five major types of insurance (their market shares in 2001 are represented in Figure 7.4): voluntary personal insurance, voluntary property insurance, voluntary civil liability insurance, non-state compulsory insurance, and state compulsory insurance.
Figure 7.4: Total Insurance Market by Line of Business
VOLUNTARY PERONAL INSURANCE7.09%
VOLUNTARY PROPERTY INSURANCE 73.3%
VOLUNTARY CIVIL LIABILITY INSURANCE
8.02%
NON STATE COMPULSOY INSURANCE9.13%
STATE COMPULSORY NSURANCE2.43%
Voluntary Personal Insurance 7.09%
Voluntary Property Insurance
73.3%
Voluntary Civil Liability Insurance
8.02%
Non-State Compulsory Insurance 9.13%
State Compulsory Insurance 2.43%

Crop Disaster Assistance in Ukraine: Issues, Alternatives, and Consequences Section 7:Development of the Insurance Market of Ukraine During the 1990s
43
Skees, Hess, Ibarra
As we can observe, the major line of business is voluntary property insurance. Even though the 1999 insurance law established 34 types of compulsory insurance, their share of the market is still lower by 10 percent. The importance of the voluntary property schemes has been boosted by the development of sectors of the market related to captive insurers and the protection of the assets of major international corporations. Underwriting Results The overall loss ratio of the industry, as we mentioned earlier, is 14 percent (total indemnities/total premiums). These technical results are driven by the behavior of the voluntary property insurance, which accounts for 73.3 percent of the market and whose underwriting performance has come up to 6.64 percent in 2001. Such a loss ratio is non-characteristic of a developed insurance industry where we find loss ratios on the property side from 60 percent to 90 percent depending on the level of retention of
insurance companies and the operational margin required by type of business. There are other important facts to be analyzed that we think are relevant. A new insurance law was passed in the last quarter of 2001, in which 34 types of insurance were declared as compulsory. After some delay, most of the regulatory framework for each type of compulsory insurance was drafted. These regulations include, Procedures and Rules of Obligatory Insurance of Harvests of Agricultural Crops and Perennial Plantings by State-Owned Agricultural Enterprises and Harvests of Cereal Crops and Sugar Beet by Agricultural Enterprises of All Forms of Ownership, which was passed in July 2002. Therefore, the compulsory types of insurance, which were previously voluntary, were not included in the 2001 results under the compulsory category, so we should look at their technical results in the voluntary property insurance results.
Table 7.3: Profile of Various Insurance Offerings in Ukraine
Insurance Premiums UAH Millions
Insurance Payments UAH Millions
Indemnities/ Premiums %
Insurance Categories 2000
2000 (2001
Prices)2001
Growth %
Nominal
Growth %
Real2000
2000 (2001
Prices)2001
Growth %
Nominal
Growth %
Real(7)/(2) (9)/(4)
1 2 3 4 5 6 7 8 9 10 11 12 13
Voluntary Personal 165.1 175.1 214.8 30.18 22.70 120.0 127.3 120.0 0.00 -5.75 72.73 55.87
Incl. Life Insurance 10.1 10.7 15.7 55.45 46.51 9.2 9.8 4.8 -47.83 -50.83 91.09 30.57
Voluntary Property 1,479.1 1,569.2 2,222.3 50.26 41.62 185.0 196.3 147.5 -20.27 -24.85 12.51 6.64
Voluntary Civil Liability 203.0 215.4 243.0 19.70 12.82 29.0 30.8 45.6 57.24 48.20 14.29 18.77
Non-State Compulsory 238.0 252.5 276.8 16.30 9.62 25.0 26.5 42.3 69.20 59.47 10.50 15.28
State Compulsory 51.0 54.1 73.6 44.31 36.02 48.0 50.9 68.7 43.13 34.90 94.12 93.34
Totals 2,136.0 2,266.3 3,030.5 41.88 33.72 407.0 431.8 424.1 4.20 -1.79 19.05 13.99
Voluntary Personal
Excl. Life Insurance 154.9 164.3 199.1 28.53 21.14 110.8 117.6 115.2 3.97 -2.01 71.53 57.86

Crop Disaster Assistance in Ukraine: Issues, Alternatives, and Consequences Section 7:Development of the Insurance Market of Ukraine During the 1990s
44
Skees, Hess, Ibarra
Nevertheless, it is important to mention that the technical result of the non-state compulsory insurance is also very low (15.28 percent). We have discussed in detail several factors, such as the increased importance of captive insurers, which may explain the technical results of the voluntary property insurance. On the compulsory side, we are concerned that the technical results might reflect that the industry might offer limited or inappropriate coverage to the compulsory lines of business to comply with the law. This concern is something we would like to comment on in
detail when we discuss the current supply of agricultural insurance. Underwriting Results of Voluntary Property Insurance As we can observe in Table 7.4, there is statistical information available for 12 different categories of voluntary property insurance, but agricultural insurance is not listed separately.
According to the information provided by Oranta, the organization underwrites UAH 9 million worth of premiums on agricultural insurance and is, by far, the leader in the industry. If we assume UAH 9 million is close to 100 percent of the market, this means agricultural insurance is only 2.9 percent of the other categories, therefore, the 3.28 percent loss ratio is
not indicative of the technical result of this type of insurance.
Supply of Agricultural Insurance Banks reported a high share of their credit for agricultural activities, i.e. Aval, 30 percent. Banks reported as acceptable collateral the following assets:
Table 7.4: Data for 12 Categories of Voluntary Property Insurance
Insurance Categories
Total Premiums UAH 1000
2001
Total Indemnities UAH 1000
2001
Percent
1 2 (2)/(1)
Railway Transport 2,889.02 44.25 1.53 Overland Transport Excluding Railway 119,338.91 54,872.82 45.98
Air Transport 4,666.88 44.25 0.95
Water Transport 12,667.26 2,950.15 23.29
Freight and Luggage 268,012.53 3,717.19 1.39
Fire/Natural Calamities 440,242.80 34,118.50 7.75
Lending Risk 138,450.92 9,248.73 6.68
Investment 88.89 0.00 0.00
Financing Risk 919,820.77 32,259.91 3.51
Judicial Cost 1,555.63 44.25 2.84 Guaranties/Securities
Provided and Accepted 7,555.91 162.26 2.15
Totals 307,125.47 10,060.02 6.64
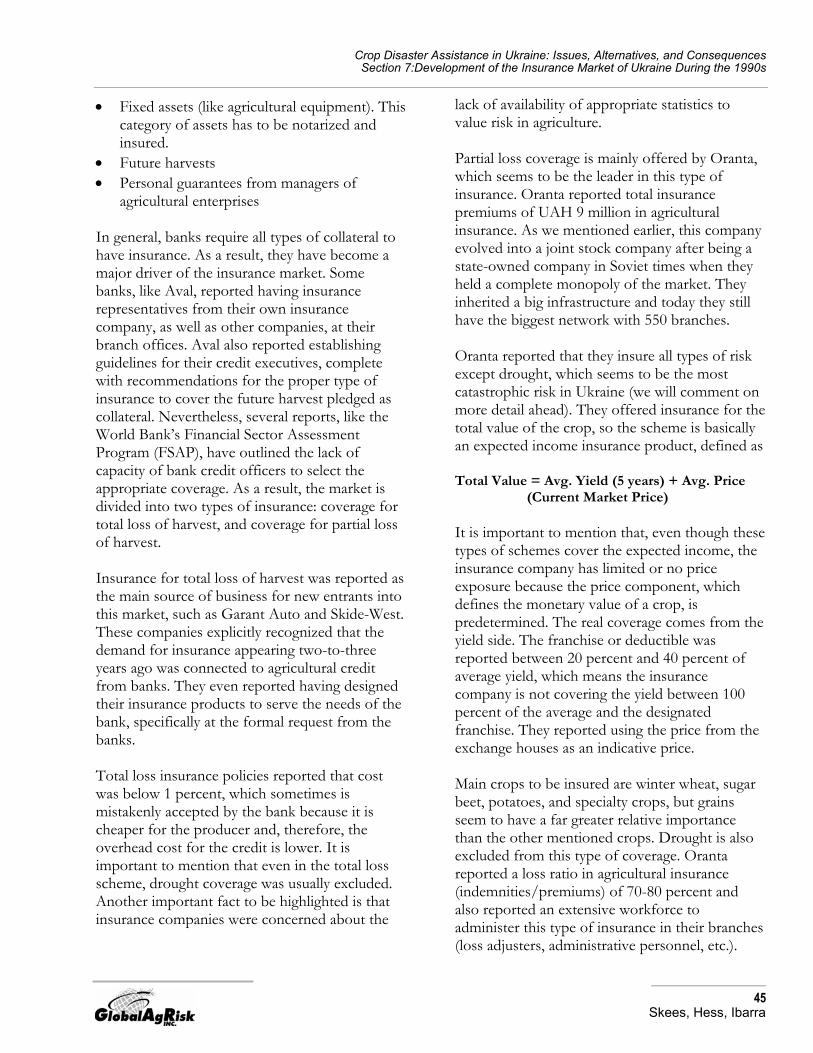
Crop Disaster Assistance in Ukraine: Issues, Alternatives, and Consequences Section 7:Development of the Insurance Market of Ukraine During the 1990s
45
Skees, Hess, Ibarra
• Fixed assets (like agricultural equipment). This category of assets has to be notarized and insured.
• Future harvests • Personal guarantees from managers of
agricultural enterprises In general, banks require all types of collateral to have insurance. As a result, they have become a major driver of the insurance market. Some banks, like Aval, reported having insurance representatives from their own insurance company, as well as other companies, at their branch offices. Aval also reported establishing guidelines for their credit executives, complete with recommendations for the proper type of insurance to cover the future harvest pledged as collateral. Nevertheless, several reports, like the World Bank’s Financial Sector Assessment Program (FSAP), have outlined the lack of capacity of bank credit officers to select the appropriate coverage. As a result, the market is divided into two types of insurance: coverage for total loss of harvest, and coverage for partial loss of harvest. Insurance for total loss of harvest was reported as the main source of business for new entrants into this market, such as Garant Auto and Skide-West. These companies explicitly recognized that the demand for insurance appearing two-to-three years ago was connected to agricultural credit from banks. They even reported having designed their insurance products to serve the needs of the bank, specifically at the formal request from the banks. Total loss insurance policies reported that cost was below 1 percent, which sometimes is mistakenly accepted by the bank because it is cheaper for the producer and, therefore, the overhead cost for the credit is lower. It is important to mention that even in the total loss scheme, drought coverage was usually excluded. Another important fact to be highlighted is that insurance companies were concerned about the
lack of availability of appropriate statistics to value risk in agriculture. Partial loss coverage is mainly offered by Oranta, which seems to be the leader in this type of insurance. Oranta reported total insurance premiums of UAH 9 million in agricultural insurance. As we mentioned earlier, this company evolved into a joint stock company after being a state-owned company in Soviet times when they held a complete monopoly of the market. They inherited a big infrastructure and today they still have the biggest network with 550 branches. Oranta reported that they insure all types of risk except drought, which seems to be the most catastrophic risk in Ukraine (we will comment on more detail ahead). They offered insurance for the total value of the crop, so the scheme is basically an expected income insurance product, defined as Total Value = Avg. Yield (5 years) + Avg. Price
(Current Market Price) It is important to mention that, even though these types of schemes cover the expected income, the insurance company has limited or no price exposure because the price component, which defines the monetary value of a crop, is predetermined. The real coverage comes from the yield side. The franchise or deductible was reported between 20 percent and 40 percent of average yield, which means the insurance company is not covering the yield between 100 percent of the average and the designated franchise. They reported using the price from the exchange houses as an indicative price. Main crops to be insured are winter wheat, sugar beet, potatoes, and specialty crops, but grains seem to have a far greater relative importance than the other mentioned crops. Drought is also excluded from this type of coverage. Oranta reported a loss ratio in agricultural insurance (indemnities/premiums) of 70-80 percent and also reported an extensive workforce to administer this type of insurance in their branches (loss adjusters, administrative personnel, etc.).

Crop Disaster Assistance in Ukraine: Issues, Alternatives, and Consequences Section 7:Development of the Insurance Market of Ukraine During the 1990s
46
Skees, Hess, Ibarra
Even though the information available is limited, the results suggest that partial loss agricultural insurance schemes in Ukraine generate a negative result (indemnities plus administrative expenses seems to be greater than the premiums received), which is in line with the international experience. It is important to highlight the fact that the net result seems to be negative even excluding drought, which appears to be the most correlated risk in Ukraine affecting agriculture.
Profitability Analysis of the Industry If we focus on the group of top 30 companies according to paid-up capital, then the total capital of this group would be UAH 896.4 million, which is 72 percent more than the paid-up capital (UAH 521.5 million). In terms of administrative costs, there are two segments in the industry:
• Low costs related to captive companies that
often turn to brokerage as additional distribution or sole distribution channels to lower expenditures. Costs are kept below 5 percent in most cases. This segment reports great profit as a result of a low loss ratio and negligible administrative costs.
• Costs related to the conventional insurance operation scheme. Administrative cost data for the industry were not available, but previous reports suggest a range of 15-77 percent.20 Even though these administrative costs are way above international standards (10-25 percent at the most), the combination of a very profitable technical result (loss ratio) with these figures is reporting important profits to this segment of the industry also.
Figure 7.5: Profits as Percentage of Total Capital
20. Ukraine FSAP (World Bank report).
0% 20% 40% 60% 80% 100%
IG "TAS"UKRGAZPROMPOLIC
FIRE&INSURANCE CO.PODILLYA
INDUSTRIAL ASKA
TRANSPORTALCONA
LEMMAINSPOL
AVANTECREDO-CLASSIC
VEKSELNADRA
ENERGOPOLICYTEREN
GARANTOSTRA-KYIV
UKRNAFTATRANSUKREKSIMSTRAKH
SKIDE-WESTKNIAZHA
DISCOARMA
NAFTOGAZORIANA
EDEM Oranta –12.8% Dask –28.8%
Figure 7.5: Profits as Percentage of Total Capital

Crop Disaster Assistance in Ukraine: Issues, Alternatives, and Consequences Section 7:Development of the Insurance Market of Ukraine During the 1990s
47
Skees, Hess, Ibarra
If we look more closely to the top 30 group, most of these companies have reported important profits between the first quarter of 2001 and the first quarter of 2002 (on an annual basis). On average, each of these companies had profits reported on its balance sheets accounting for 21 percent of their total capital. The positive results mean capital is being created in the industry as a result of the profits. Even though we do not have the exact figures on the total capital in the first quarter of 2001 for these companies, we could say the profit reported on the balance sheets from this group was over UAH 220 million. Therefore, the annual return on capital, measured over the total paid-up capital, was over 40 percent from 2001 to 2002. Nevertheless, if we analyze the profitability of the top 30 companies on an individual basis, we would notice important differences. For the purposes of this report, it is important to analyze the result of the most dominant insurance company in the agricultural sector, Oranta, against the other companies in the sample. While the profitability of the companies in the sample is 21 percent (measured against actual total capital), Figure 7.5 shows that Oranta has a negative result of 12.8 percent. This indicates Oranta lost 1/10 of its capital between 2001 and 2002, making it the second worst showing in the sample. This information indicates that the traditional partial loss insurance available in Ukraine is generating a loss to the risk carriers. As a result, the government has partially subsidized this deficit through their proportional share of the loss of capital incurred by Oranta.21
Investment Risk The time lag between premium collection and benefit payout varies according to the type of insurance. During that time lag, the insurance
21. According to the information provided by Oranta, the government has kept 50 percent plus one share of the ownership of the company and the rest has been privatized. Additional packages for privatization were announced for the near future.
companies keep technical provisions on the balance sheets to honor their debts. But investments of insurance undertakings are exposed to a variety of risks. Depreciation risks stem from investment that can suddenly diminish in value following a stock or real estate downturn (market risk), exchange rate fluctuations (in the case of assets denominated in foreign currency), interest rate fluctuations, credit risk from issuers of financial debt and liquidity risk that stems from the fact that an insurance undertaking risk can have difficulties converting its investments to cash on satisfactory terms when it is time to meet contractual obligations. The lack of investment instruments is demonstrated by the large cash holdings of most of the companies. This diminishes the liquidity risk of the industry but increases the risk of depreciation due to inflation (see Table 7.5). There is also an asset liability mismatch risk that stems from any type of maturity mismatch. The risk of mismatch becomes greater for long-term contracts, such as life insurance, marine insurance, etc. Agricultural insurance is a short-term contract. Growing seasons only last few months and, as a result, the risk of mismatch is not as important for agricultural insurance. Table 7.5: Composite Share of Ukraine
Companies
Type of Investment UAH 1000 %
Cash and Deposits 710,768 60.02Government Bonds 40,299 3.40Corporate Bonds 96,877 8.18Loans 0 0.00 w/o policyholders 0 0.00 w/o government 0 0.00
Shares na w/o listed na w/o commercial na w/o banks na
Real Estate 60,969 5.15Other 275,306 23.25Total Reserves 1,184,219Source: World Bank

Crop Disaster Assistance in Ukraine: Issues, Alternatives, and Consequences Section 7:Development of the Insurance Market of Ukraine During the 1990s
48
Skees, Hess, Ibarra
Reinsurance Due to the lack of long-term assets in Ukraine and the restrictive investment regulation in foreign assets, companies use foreign reinsurance to minimize the foreign exchange and maturity mismatch between assets and liabilities. Companies also use foreign reinsurance in the traditional manner to optimize the technical risk of an insurance portfolio by diversifying the risks among several other insurers and reinsurers. It is worth mentioning that reinsurance serves also to expand the financial capacity of insurance companies to underwrite risks, specifically in the case of major risks which require an important amount of financial capacity. Reinsurance activity in Ukraine is not licensed separately to enable insurers to act as reinsurers, even in the same line of business. When premiums are ceded nationally, the pool of capital available remains the same, so this strategy doesn’t solve the lack of capital in the industry to retain major risks. Foreign reinsurers are not controlled, and no official registry of approved reinsurers exists. The only prerequisites for a foreign reinsurance company to be admitted are the company must have been active for at least three preceding years and have no financial problems according to home supervisory authority during that three-year period. Local insurers have to report any large individual risks. Beside this, the supervisory authority has no specialized reinsurance department. Companies are required to use local reinsurers for at least 90 percent of their reinsurance activity because investment regulation is applicable to ceded premiums as well. Ceded premiums are treated as an admitted asset that can be used in the representation of insurance liabilities. No more than 10 percent of ceded premiums can be ceded abroad. The only way to avoid this clause is to have excess capital to cover liabilities. According to international standards, ceded premiums are treated instead as an expenditure incurred by the direct insurer to transfer part of
the liabilities to the reinsurer. In terms of tax, a 15-percent rate applies to all premiums ceded internationally, except for those countries with which Ukraine has a treaty to avoid double taxation. The retention limit for individual risks is set at 10 percent of the total individual company’s capital. As we see in Figure 7.6, the aggregate results of the market demonstrate that reinsurance has followed the pattern of growth in the insurance industry. Figure 7.6: Reinsurance to Residents
and Non-Residents In Figure 7.7 we can also observe that the relative importance of reinsurance premiums to total insurance premiums collected by the industry has been growing constantly. This has occurred primarily because the growth of the market has come from voluntary property insurance. Figure 7.7: Relative Importance of the
Reinsurance Market
(Figures in UAH Millions)
0200400600800
1000120014001600
1996 1997 1998 1999 2000 2001
Total ReinsurancePremiums
Reinsurance toResidentCompaniesReinsurance toNon Residents
0%10%
20%
30%
40%
50%
60%
70%
80%
1996 1997 1998 1999 2000 2001
% of Non Resident to Total Reinsurance
% of ResidentReinsurance to TotalReinsurance% of TotalReinsurance to TotalInsurance

Crop Disaster Assistance in Ukraine: Issues, Alternatives, and Consequences Section 7:Development of the Insurance Market of Ukraine During the 1990s
49
Skees, Hess, Ibarra
In terms of the origin of the reinsurance carrier, we could observe a small relative decrease in the last couple of years of international ceded premiums, maybe attributable to the increased capacity of the national carriers, since capital in the industry has been growing according to the numbers we have already discussed. As we have already mentioned, the major reinsurance operations are related to voluntary property insurance. Even if we look at the relative weight, voluntary property insurance has a bigger share of total reinsurance premiums than its share in the total revenue of the industry (85.5 percent versus 73.3 percent, see Figure 7.8). According to the information provided by the supervisory authority, 90 foreign reinsurers participated in the market during 2001. Their countries of origin are listed below.
Table 7.6: Foreign Reinsurers in 2000/2001 By Country of Origin
Figure 7.8: Total Reinsurance by Type of
Business
2000 2001Russia 13 23Latvia 9 14
Germany 6 9UK 7 6
France 1 6Switzerland 3 6
Austria 1 5Poland 2 4
Hungary 2 3Moldova 0 2Sweden 0 2Estonia 1 2Belarus 0 1
Canada 0 1Kazakhastan 0 1
Lithuania 1 1Romania 0 1Slovakia 0 1
USA 2 1Finland 1 1Cyprus 1 0
Toral Reinsurance by Type of Business
Voluntary Property Insurance85.5%
Voluntary Personal Insurance
1.8%
Voluntary Civil Liability Insurance8.3%
Non State Compulsory Insurance
4.3%
Voluntary Property Insurance85.5%
Voluntary Personal Insurance
1.8%
Voluntary Civil Liability Insurance8.3%
Non-State Compulsory Insurance
4.3%
Figure 7.8: Total Reinsurance by Type of Business

Crop Disaster Assistance in Ukraine: Issues, Alternatives, and Consequences Section 7:Development of the Insurance Market of Ukraine During the 1990s
50
Skees, Hess, Ibarra
Information about their share of the market was not available; nevertheless, we should highlight two facts: • The major reinsurance markets (Germany,
France, UK, Switzerland, USA) already seem to have a presence in Ukraine.
• Russian-related markets (including ex-Soviet areas) have an important participation in the market.
It is important to highlight that Oranta is only ceding 4 percent of the premiums to the reinsurance industry, either national or international. This is a very important fact because it means the agricultural risk is almost certainly being retained inside Ukraine at the present time. As the names of the reinsurance companies were not available, we were not able to value the solvency of the foreign reinsurers already providing capacity to the Ukrainian market. Skide-West and Garant Auto are reported to have been developing contacts with specialized reinsurance professionals in Europe, mainly through Partner Re (Erich Kasten). These companies, with some degree of confidence, are able to seed their total loss insurance policies abroad. They mentioned that their executive board has established their ideal retention in this type of risk at approximately 5 percent. This means they are not willing to retain an important share of these kinds of risks, and, therefore, require reinsurance capacity for agricultural risks. There were two additional important facts that arose from the talks with these two companies that should be considered in approaching the international reinsurance market in the future. First, they consider it almost impossible to find reinsurance capacity for drought in the short term, and second, the international reinsurance community is very reluctant to offer capacity for agricultural sector in Ukraine due to the perceived underdevelopment of the sector. Nevertheless, it is important to mention that Marsh (the
reinsurance broker) reported to have covered the first multiple-peril agricultural risk for irrigated potatoes (500 hectares). The risks covered were drought, frost, hail and secondary diseases (usually associated with excess humidity). As the potatoes were being produced on irrigated land, drought coverage, in this context, is coverage for lack of irrigation. This is very different than the major correlated risk facing Ukrainian agriculture, which is lack of rain in rain-fed production areas.
Other Possibilities for Supplying Index Insurance Contracts According to the Ukrainian law on the taxation of the income of enterprises, the following instruments are derivatives: • Forward contracts • Futures contracts • Options According to the rules of issue and circulation of stock derivatives approved in 1997, only legal entities can be issuers of options. These include securities traders that are participants in the stock exchange or the trading informational system, which should meet the requirements on capital adequacy and other indicators and demands that limit risks in securities transactions. The issuer of the option for purchase of securities must be the owner of basic assets no less than 80 percent of the general amount, stipulated by the terms of the option issue, or must have (a) contract(s) of commission with the owner(s) of no less than 80 percent of the general amount of basic assets, stipulated by the terms of issue. The terms of the contract(s) of commission should not be shorter than the term of option. In the case of issue of options for purchase, the basic assets, stipulated by the terms of issue, but no less than 80 percent of the issue amount, should be placed with the securities custodian for the whole term of validity of the options. If the securities custodian is the issuer of the option,
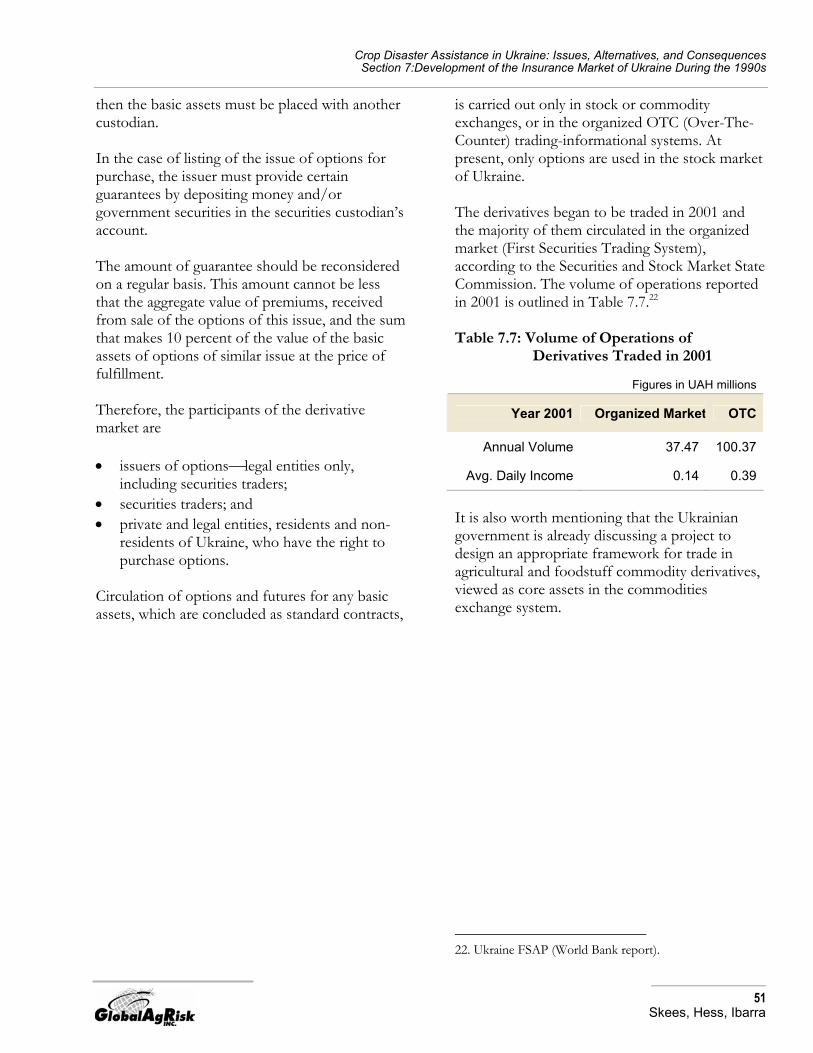
Crop Disaster Assistance in Ukraine: Issues, Alternatives, and Consequences Section 7:Development of the Insurance Market of Ukraine During the 1990s
51
Skees, Hess, Ibarra
then the basic assets must be placed with another custodian. In the case of listing of the issue of options for purchase, the issuer must provide certain guarantees by depositing money and/or government securities in the securities custodian’s account. The amount of guarantee should be reconsidered on a regular basis. This amount cannot be less that the aggregate value of premiums, received from sale of the options of this issue, and the sum that makes 10 percent of the value of the basic assets of options of similar issue at the price of fulfillment. Therefore, the participants of the derivative market are • issuers of optionslegal entities only,
including securities traders; • securities traders; and • private and legal entities, residents and non-
residents of Ukraine, who have the right to purchase options.
Circulation of options and futures for any basic assets, which are concluded as standard contracts,
is carried out only in stock or commodity exchanges, or in the organized OTC (Over-The-Counter) trading-informational systems. At present, only options are used in the stock market of Ukraine. The derivatives began to be traded in 2001 and the majority of them circulated in the organized market (First Securities Trading System), according to the Securities and Stock Market State Commission. The volume of operations reported in 2001 is outlined in Table 7.7.22 Table 7.7: Volume of Operations of
Derivatives Traded in 2001
It is also worth mentioning that the Ukrainian government is already discussing a project to design an appropriate framework for trade in agricultural and foodstuff commodity derivatives, viewed as core assets in the commodities exchange system.
22. Ukraine FSAP (World Bank report).
Figures in UAH millions
Year 2001 Organized Market OTC
Annual Volume 37.47 100.37
Avg. Daily Income 0.14 0.39

Crop Disaster Assistance in Ukraine: Issues, Alternatives, and Consequences Section 8: Considering the Regulatory Framework for Index-based Insurance Products
52
Skees, Hess, Ibarra
Section 8: Considering the Regulatory Framework for Index-Based Insurance Products
This section provides background on regulatory history and lays out the regulatory requirements for the introduction of weather-based index insurance in Ukraine. It addresses the regulatory issues both from a regulation, as well as regulatory capacity point of view. Finally, this section addresses a few general shortcomings of the insurance regulatory regime in Ukraine that potentially hamper the development of real insurance companies and new insurance products, including innovative products like weather-based index insurance.
Regulatory History By 1988 two state insurance institutions, Derzhstrakh and Inderzhstrakh, were the monopolists in both Ukraine and other republics of the USSR. The demonopolisation of the insurance sector in the former USSR started in 1988 with some legislative efforts, but not until 1990 did the Council of Ministries of the USSR approve the resolution ordering the demonopolisation of the economy. These efforts allowed state institutions, joint stock companies, and cooperative and mutual associations to do insurance business on a competitive basis. Demonopolisation did introduce systemic changes in Derzhstrakh, and as a result, republican insurance institutions got the right to introduce their own property and personal insurance plans. In 1991 Ukraine introduced independent regulation of the insurance sector. In the period from 1991 to 1996, Ukrainian lawmakers introduced the first legislative instruments to regulate the domestic insurance sector. This legislation ignored peculiarities of the sector and there was no authorization to supervise business activities of insurance companies. After several years of constant abuses by the insurance companies, the Cabinet of Ministers oriented its efforts to regulate insurance activities and protect
policyholders. These acts were elaborated to provide a system of state regulation of the insurance sector, including the registration of insurance companies and licensing of their business activities. The previous acts led to the transformation of the State Commercial Insurance Organization into The Oranta National Joint Stock Insurance Company, currently the only major player in the agricultural insurance market. The insurance market increased to 700 institutions by the mid-1990s. However, the majority of the newly set-up insurers were questionable organizations, which laundered or devised financial pyramids. Many insurance companies found themselves on the verge of bankruptcy due to inadequate start up capital, improper policy reserve funds, and insufficient quality management and particularly loss adjustment practices. The next phase of the evolution of the Ukrainian insurance market begin in 1999, when the Supreme Council of Ukraine passed the law on insurance. This law superseded the previous resolution of the Council of Ministries of the Ukrainian SSR in 1981. That resolution stipulated compulsory insurance of privately owned assets. Consequently, the insurance law of 1999 overturned compulsory insurance and prescribed voluntary insurance of privately owned assets. Even though the government moved to voluntary insurance of privately owned assets, the government continued to regulate the boundary values of insurance rates against destruction and damages of residential constructions and facilities by natural hazards, loss of livestock by disease, accidents or natural hazards. In short, the Ukrainian government has had an active role in the insurance market from several perspectives:

Crop Disaster Assistance in Ukraine: Issues, Alternatives, and Consequences Section 8: Considering the Regulatory Framework for Index-based Insurance Products
53
Skees, Hess, Ibarra
• Direct participation in the insurance market as a service provider, either as a monopoly or in society with private capital.
• Regulation of the insurance sector. • Special powers to determine different lines of
insurance business as compulsory. • Regulation of market rates in different market
niches, both for compulsory and voluntary insurance.
Weather Index Insurance in the Ukrainian Regulatory Framework This report assesses the feasibility of weather index insurance, rather than weather derivatives, because derivatives are not the appropriate instrument at the farm level. The insurance instrument imposes certain restrictions on the product and its marketing. The major distinction is that when the weather index is sold as an insurance product, the case must be made that those purchasing the contracts have an insurable interest. Any number of parties can have an insurable interest when it comes to agriculturally oriented weather insurance products, e.g., the farmer, farm banks, agricultural input suppliers, grain elevators, etc.
Weather Derivative Versus Weather Index Insurance In general, weather derivatives are not construed as insurance, unless specific circumstances provide for an insurable interest of the insured party. In the United States, the New York Insurance Department issued an informal opinion in 2000 that effectively challenged weather derivatives because the derivative had no relationship with the economic losses of many of the purchasers and there was continuous opportunity to change positions on the contract. By contrast, weather index insurance is characterized by an upfront premium payment and index-determined payouts at the end of a specified contract period. Furthermore, the insurance trigger is met in insurable interest of the insured party following simple eligibility criteria that
the insured party should have an insurable risk related to the probable index payments. In two respects, the weather index insurance concept is not aligned with traditional insurance and traditional insurance legislation: the loss risk exposure definition and the loss compensation definition. Weather index insurance coverage is different from traditional insurance coverage. Traditionally, non-life insurance insures a specific loss related to a physical asset or an activity and the potential damage to the asset or interruption of the activity. However, weather-based index insurance does not necessarily insure a specific asset or activity but rather the income risk exposure of the insured party. In practice, a farmer could choose to insure considerably more value than the yield of a specific crop or even all his crops, he or she could also wish to insure the income derived from off-farm sources that may also be negatively impacted by bad weather events that trigger payments from the weather index insurance. For example, the off-farm job may be with a processing firm that depends heavily on the amount of the crop produced in the area. Weather index insurance could cover the crop yield and the off-farm job exposures, as well as other unspecified income risks, if those are exposed to drought risk. This is different from traditional insurance, which usually does not cover unspecified income risks.23 Weather index insurance is therefore conceptually comparable to weather derivatives, as its payouts are derived from an index and not specified economic losses. Insurance legislation in Ukraine clearly defines the types of coverage insurers can underwrite and therefore does not contemplate general weather
23. There are exceptions, such as the innovative Adjusted Gross Revenue Pilot Program in the United States, which provides an insured producer protection against low revenue due to unavoidable causes. Yet the program specifies types of incomes: “Covered farm revenue includes income from crops and agricultural commodities, including incidental livestock.” Source: Risk Management Agency, USDA.

Crop Disaster Assistance in Ukraine: Issues, Alternatives, and Consequences Section 8: Considering the Regulatory Framework for Index-based Insurance Products
54
Skees, Hess, Ibarra
related “income” insurance. 24 Nonetheless, legislation in Ukraine does not prohibit this type of insurance if there is an insurable or “material” interest from the insured party. The broader principle underlying insurance regulations is the anti-gambling concern. A farmer who buys weather-risk coverage in excess of the expected value of the crop could be seen as a gambler, contrary to the law. A dentist buying weather insurance could be perceived as a gambler not covered by law. Both of these phenomenon are common in derivative markets, where traded notional volumes exceed several times the physical amounts of the underlying commodity. However, for weather insurance to work best, the farmer who has the multiple exposures, as described above, should be allowed to purchase more value than the crop value. To satisfy traditional insurance regulation requirements, the regulator and insurers need to define eligibility criteria for insured parties, making sure the insured party has an insurable interest, based on hectares or other verifiable insured party specific parameters. Thereby the insurance coverage per hectare could be limited to a reasonably expected economic value or input costs.25 For example, in the United States, the Group Risk Plan (GRP) is an index insurance product as described in Appendix A. The GRP pays based on what happens to county yields. Farmers are allowed to purchase coverage at values that are up to 1.5 times the county-expected value. Weather index insurance payouts can deviate from actual damage suffered. This is referred to as basis risk. Basis risk is the potential mismatch between the insurance payout and the actual loss
24. Main texts are the Insurance Law of Ukraine, October 4, 2001, No.2745-ІІІ: On Stimulating Development of Agriculture in the Period 2001-2004; providing for premium subsidies. 25. Eventually the regulator might decide to allow for the creation of a real primary and secondary derivative market for weather risk, where weather-risk insurance derivatives can be traded freely, regardless of the holder’s nature and risk exposure.
suffered by the insured party. Nearly all insurance has some level of basis risk. Traditional crop insurance relies on the loss adjustment of the insured party’s declared lossesdisputes between the loss adjustment numbers and the farmer’s view of the loss are common. More fundamentally, the methods for developing yield coverage levels are subject to significant measurement error. This creates an even greater basis risk for traditional insurance. Weather index insurance relies on the index to reflect the risk exposure of the insured party. To the extent that the weather index is highly correlated with the economic losses, the cost savings associated with much lower monitoring and loss-adjustment costs can easily compensate for the potentially greater basis risk. Since moral hazard and adverse selection are not problems, weather index insurance does not require the large deductibles that accompany traditional crop insurance. This also reduces the likelihood that a farmer will have a loss and not be paid with weather-based index insurance. Ukrainian legislation prohibits insurance payments that exceed the actual losses of the insured party.26 For two reasons this rule should not pose a concern for this type of insurance. First, in the case of weather index insurance, the actual real losses incurred will always exceed the payouts if the regulator accepts the broad definition of economic losses introduced above. Therefore, the rule would not be violated or could insured parties formally declare that economic losses exceeded insurance payout. Second, the rationale for this regulation, precluding payouts in excess of true losses, is to combat fraud and abuse of the insurance instrument for either money laundering or tax avoidance purposes, rather than the maintenance of sound insurance principles. Therefore, the regulation could either be waived or amended for this type of index insurance, as
26. Article 9 of the Insurance Law of Ukraine: “The amount payable as insurance money shall not exceed the amount of direct damage sustained by the insured. Indirect losses shall be considered insured if so provided by the insurance contract.”
Crop Disaster Assistance in Ukraine: Issues, Alternatives, and Consequences Section 8: Considering the Regulatory Framework for Index-based Insurance Products
55
Skees, Hess, Ibarra
the motivation for the rule does not apply to this type of insurance.
The Relevance of Compulsory Crop Insurance in Ukraine Crop insurance became compulsory for sugar beets and grains with the new insurance law and the related regulation issued in July 2002. The regulator thereby defines premium levels, sums insured, modalities for risk exposure definition, and policy formulation. The objective of insurance for all farmers, including the smaller ones, at uniform prices, seems to extend a basic safety net to every grain and sugar beet farmer in the country and also develop the insurance market. Another common objective of compulsory insurance is to avoid adverse selection. Nonetheless, actual effects of compulsory insurance will be counterproductive. As explained in the policy section, the response of insured when they are forced to purchase this insurance will be to increase the incidents of moral hazard and fraud. Compulsory insurance is incompatible with the principles underlying weather index insurance. Weather index insurance is based on the insured party’s full understanding of the type of coverage purchased, in other words, the insured needs to understand the nature of the basis risk and the amount of coverage to buy for what type of exposure. Furthermore, the adverse selection and moral hazard problems are very low. Compulsory insurance does not allow the farmer to make his own choices regarding these parameters, and introduces one-size-fits-all insurance with rigid coverage amounts and premiums. Finally, weather index insurance has not been tested in Ukraine. The concept needs to be pilot tested with effective educational efforts before introduction of a fully commercial available insurance can be implemented. Therefore the introduction of weather index insurance is incompatible with the current regulation of compulsory insurance on grains and sugar beets.
Regulatory Capacity There are some specific demands on regulatory capacity posed by weather-based index insurance. To begin with, the regulator needs to license products and monitor portfolios and the insurer’s ability to pay for claims. Weather index insurance differs from traditional insurance products only insofar as the coverage is limited to one or a clearly defined basket of risk parameters. An actuarial analysis of the historical series for these parameters, as well as a loss or burn analysis to determine loss histories, usually reveals a rather accurate picture of the exposure. Weather index insurance introduces at least three new challenges for regulators:
The nature of risk parameters. Weather risk is subject to structural changes that the regulator should understand at least in principle: global warming and climate patterns (El Niňo in certain parts of the world), as well as the nature of microclimates are prime examples. The nature of reinsurance markets. As opposed to traditional crop insurance the ultimate risk takers in the weather-risk market are not necessarily the big name reinsurers, but could be banks or even power traders. While the contractual format will be a reinsurance treaty with an acceptable reinsurer, there are potentially more efficient risk transfers should the regulator choose to accept other risk transfer formats. The nature of risk portfolio management. The insurer may have unique opportunities for risk diversification and hedging. A weather-risk portfolio can be managed in a fashion that allows for limited risk capital to support a large amount of underwritten notional risk if at least some of the exposures offset one another due to low correlations. For example, if an insurer writes both flood and drought risk in one place for the same period, only one of the two contracts can pay out and the same traditional insurance reserves can support

Crop Disaster Assistance in Ukraine: Issues, Alternatives, and Consequences Section 8: Considering the Regulatory Framework for Index-based Insurance Products
56
Skees, Hess, Ibarra
twice as much premium underwriting. Therefore the regulator should recognize the hedging and portfolio diversification effects on capital needs and allow for a competitive use of risk capital by insurers and reinsurers.
Analysis and oversight of new types of products and insurers in the market require specific skills and profiles currently not available in the Ukraine regulatory environment.
The Current Regulatory Set-up in Ukraine The Ukraine Ministry of Finance has around 80 staff to supervise and manage non-bank financial institutions in Ukraine. One of three departments deals with supervision, one with non-bank financial institutions, and one with insurance. The supervision department is divided into units of licensing, organizational oversight, oversight of Kiev-based companies, and oversight of non-Kiev-based companies. The new regulation on compulsory insurance for publicly owned farms, sugar beet and cereal farmers, as well as plans for premium subsidies, would place a burden on the handling capacity of the current regulatory system. Minimum capital for the set-up of an insurance company has been raised to €1million, of which 60 percent has to be paid in advance.
Weather-Risk Reinsurance and Moral Hazard Insurers and reinsurers primarily rely on weather data measured by synoptic weather stations in Ukraine. Although verification mechanisms such as fallback stations and even satellite data might be used, the primary data has to be highly reliable and accurate. Certainly the weather data must be tamperproof. Introducing insurance that pays, based on weather measurements, could cause certain individuals to attempt to tamper with the measurement instruments to “create a payment.” The best guarantee against tampering is a fully independent third party, unrelated to any party in the insurance contract. As soon as government takes a substantial interest in the reinsurance or insurance of weather insurance contracts, this
independence is compromised. Four aspects of the contract can reduce the incentives for tampering and increase the confidence of all parties in the integrity of the system:
1. the arms length nature of the transaction: third party determination of the weather events;
2. a neutral stance from the government in taking risk on the contract;
3. careful contract designs that do not involve a zero-one payment schedule whereby a very fine measurement difference will result in full payment; and
4. secondary systems to collaborate measurements from the official weather stations (this could be satellite imagery or simply redundant and lower cost instruments that are nearby).
Currently the weather service organization in Ukraine is nominally independent of ministries, but depends on state funding. Governance mechanisms and weather service culture suggest that the weather service produces reliable data similar to most Western weather services. Ukraine belongs to the World Metrological Organization (WMO), and standard training, acceptable measurement instruments, and reporting are common among members of the WMO.
Other Issues for the Ukraine Regulatory Regime The insurance laws and regulations seem more disadvantageous for international reinsurance as compared to national reinsurance. Furthermore, the application of the rules results in administrative burdens for insurance companies, a common problem for all insurers in Ukraine. However, these obstacles also impact weather index insurance development in Ukraine. Insurance and reinsurance are not differentiated in insurance law. Therefore, businesses that obtain the approval for conducting insurance activity in Ukraine can provide both services to the domestic market. The law specifies that only Ukrainian resident insurers provide insurance in

Crop Disaster Assistance in Ukraine: Issues, Alternatives, and Consequences Section 8: Considering the Regulatory Framework for Index-based Insurance Products
57
Skees, Hess, Ibarra
Ukraine. Reinsurance involving a nonresident provider is not restricted in terms of the amount (percentage) of premium ceded outside of Ukraine, but must comply with the procedures specified in the special norms for that purpose, particularly when fees or premiums ceded to nonresident providers exceed 50 percent of the total amount received from the start of the calendar year. Even though the total amount to be ceded to nonresidents is not capped, the amounts of required insurance reserves of the unearned premiums do not decline for premiums ceded to foreign reinsurance institutions. The requirement is that 90 percent of these reserves be invested inside Ukraine. Insurers ceding more than 10 percent of their premium incur the added financial cost of keeping additional reserves.
Reinsurance regulations do not distinguish between low- and high-rated reinsurers for the purpose of determination of reserve requirements, as well as the administrative approval of reinsurance treaties. Administrative and tax procedures seem to be inadequate and cumbersome and therefore penalize international reinsurance transactions. All interviewed companies with significant reinsurance activity reported problems with the relevant authorities. Finally, supervisory capacity is limited with regard to reinsurance activity in the country. Reporting standards, on-site supervision, and sanction powers are still inadequate in the Ukraine insurance sector.
Crop Disaster Assistance in Ukraine: Issues, Alternatives, and Consequences Section 9: Designing a Risk Management Component of the Rural Finance Project
58
Skees, Hess, Ibarra
Section 9: Designing a Risk Management Component of the Rural Finance Project
There is market failure in Ukraine as private markets are not in position to offer weather-risk management alternatives to the agricultural sector that is vulnerable to weather risk. This has resulted in a highly inefficient government response introducing compulsory traditional crop insurance in a setting where the infrastructure is clearly not adequate. The World Bank can provide the needed technical assistance to help the government understand these issues more clearly and to design weather-based index insurance markets. The Bank may also provide some level of contingent capital that addresses the need for risk transfer of highly correlated risk that will be present when weather-risk insurance products are first introduced. A government facilitated risk transfer system may be needed in the beginning.
Description of Sub-Component: Weather Index Insurance Products During the pilot phase and first phase of the project, international and local consulting services would be financed to assist in the development of weather insurance products. Eligible private insurance companies would offer these insurance products to those with an insurable risk that is related to adverse weather events. The index insurance, based on objective third-party verifiable indicators, such as weather data or soil moisture data, would differentiate relative risk at an appropriate level, based on historical data. Indemnities would be triggered once the measurements drop (or index drops) below or went above the pre specified triggering event. The amount of insurance sold to insurable entities would be based on insurable interest verified by eligibility criteria. Since the insurance would provide compensation during highly correlated risk events, such as widespread drought, flooding, and major freezes, special financing of these risks may be necessary in the beginning. For example, participating
insurance companies should be allowed to participate in a special stop-loss agreement between the government and the participating insurance companies. It is quite possible for the insurance providers to have very high losses. First, a pooling system needs to be developed to allow geographically limited insurance providers to swap risk from one geographic region to another. It is unlikely that a single insurance provider will have the desired geographic spread of risk. Since these are index-based products that will involve similar design, rating, and data, it should be possible to price the risk and facilitate swapping of the risk from one region to another. The analysis in the risk profile section of this report clearly demonstrates that the risk across regions in Ukraine is not strongly correlated. For example, if one insurance company is located in the western region and another is selling weather index in the southern region, they should be able to pool their risk by swapping equal values of the portfolio. Given relatively standard products, this pooling of premiums and risks should involve low transaction costs. Once the risks are pooled, the government may be needed to stop the losses of the insurance companies beyond some level to be determined (in the example presented here the government would pay for all losses above 300 percent). The government could finance at least part of these excess losses via a contingent loan arrangement using IDA (International Development Association). Such a stop-loss provision would complement international reinsurance. At this stage, the international reinsurance community is unlikely to cover the participating insurance companies individually, or accept the arrangement of the program until it is proven. Once commercial viability of these products, as well as the reliability of weather data are demonstrated, international reinsurers are expected to provide the necessary financing to cover the catastrophic risks. Given the excellent

Crop Disaster Assistance in Ukraine: Issues, Alternatives, and Consequences Section 9: Designing a Risk Management Component of the Rural Finance Project
59
Skees, Hess, Ibarra
opportunities to spread the risk geographically and among industries, this is especially true as the insurance pool becomes national. With a national pooling system, the excess loss level should be well below 300 percent as depicted in this example. The conditions of disbursement of IDA funds to provide contingency financing for the government reinsurance function would be the provisional. Several criteria will be used: • the integrity of the weather-based index
insurance offerings must match the recommendations of designed provided by the technical assistance;
• stop-loss agreements between the government and the participating insurance companies must be transparent;
• parallel stop-loss and quota share agreements with international reinsurers must be established;
• clear evidence that insurance policies have been issued and paid must be provided; and
• weather records must be provided to demonstrate the events that create the excess losses.
Under Phase II of the program, the index-based insurance program would be expected to operate in a financially and institutionally sustainable manner, without the need for government to offer a stop-loss provision. Insurance companies offering weather index insurance would then be expected to seek international reinsurance.
Weather-Risk Transfer Mechanism: International Reinsurance and the Ukraine Government (GoU) Backstop Facility The risk transfer structure is based on the assumption that international reinsurance treaties will not be readily available at competitive prices due to information asymmetries and knowledge gaps. The overriding principle of the risk transfer structure is the opportunity for private companies to swap risk within Ukraine and then develop risk sharing with the government of Ukraine (GoU) that allows for optimal risk retention within Ukraine. A possible structure for layering the risk is presented in Figure 9.1.
Figure 9.1: Sample Structure for Risk Layering
Stop Loss Coverage–Private Reinsurance (layer structure tbd)
Stop Loss GoU
Stop Loss Coverage–Government of Ukraine (GoU)
Pool Quota Share Agreement–Private Reinsurance Primary Risk Retention (Private
Ukrainian)
80%
300%
600%
I. Primary Insurance Layer
II. Stop Loss Layer
III. Excess of Loss Layer

Crop Disaster Assistance in Ukraine: Issues, Alternatives, and Consequences Section 9: Designing a Risk Management Component of the Rural Finance Project
60
Skees, Hess, Ibarra
Summary of Benchmarks Ukraine has good resources in the area of plant growth simulation models and crop forecasting in general. The purpose of further assessment therefore is to better understand these resources and gain insights into the potential use of the models and crop forecasting history for the development of weather indexes. The following steps are recommended: A. Full feasibility study The objectives of the feasibility study are to • Deepen the issues outlined for the initial assessments in the annex. • Test the hypotheses formulated by the initial assessments. • Develop viable methodologies and indexes that insurance companies can use as prototypes and
for test cases. • Model weather indexes and develop and test statistical and agronomical models to calculate the
relationship between yield and weather variables jointly with the Ukrainian researchers. • Design complementary risk management models for insurance companies. • Countrywide risk pooling analysis to determine the correlated exposure and the potential to
hedge risks inside Ukraine. • Perform local spatial correlation analysis to determine the appropriate number of weather
stations. B. Pilot project The objectives of pilot projects are to test the feasibility and market viability of the concept. Main activities of the project are to • Select proper pilot counties where strong relationships between crop yields and weather are
present and those counties that have already automated weather stations or that can easily establish automated stations.
• Perform focus groups within the selected counties to determine the weather events that are of most concern to farmers in the selected regions.
• Establish properly formatted historical databases for crop yields per county, weather variables per county (including agro-meteorological variables like soil moisture & temperature) as well as farm-level data.
• Set up weather databases, mainly temperature and precipitation data that have to be made available in a proper format.
• Automate weather stations in the pilot areas. • Formulate technical underwriting guidelines. • Establish ground rules for backstop facility • Transfer the technological platform to insurance companies (pricing models, operational skills,
portfolio management). • Educate farmers, brokers, agents, banks, agro-processing, and other stakeholders. • Organize study tour to weather index insurance schemes (Alberta and Ontario, Canada). • Assist insurance companies in the development of insurance policies and pilot cases in selected
counties.

Crop Disaster Assistance in Ukraine: Issues, Alternatives, and Consequences Section 9: Designing a Risk Management Component of the Rural Finance Project
61
Skees, Hess, Ibarra
• Design an effective and efficient subsidization mechanism that is largely incentive-neutral in a study.
• Study of the pilot project results: incentives, demand, communication between farmers, appropriate client level (banks, input suppliers or farmers).
C. Phase I: Investment phase Following the full analysis and assessment of the feasibility study and pilot projects, GoU and World Bank would explore the following investment options: • Acquisition and installation of automated stations
a. Test analysis of the density of the network according to the weather exposure of Ukraine. b. Design adequate maintenance program to ensure the quality of observations across time.
• Backstop facility for weather risk (The actual level of the stop loss will be determined analytically given the budget constraints.)
D. Phase II: Sustainable private sector-led weather index insurance Following the successful implementation of a pilot and a full program for two to three years, the private sector shall be in a position to operate without government provided backstop facilities. E. Expenditure items
F. Technical assistance (regulatory, feasibility, dissemination, education) Consultants G. Goods Weather stations Pilot Phase: 12 Automated weather stations in three pilot oblasts H. Backstop facility Disbursement Mechanisms Project Management
Backstop Facility for Weather-Risk Insurance Retention in Ukraine One reason for the lack of demand of agricultural insurance is supply driven. Insurance companies do not underwrite systemic risks such as drought, floods, and frost, which are some of the major risks faced by farmers involved in crop production. Ukrainian insurance companies would need international reinsurance should they decide to write these types of agricultural insurance. A goal for the Ukrainian agricultural insurance program should be to create an institutional structure that allows the underwriting of agricultural insurance in Ukraine to retain as much risk inside the country as possible, before going to international reinsurance markets. One option for effective risk transfer is the aggregation of risk according to pre-established underwriting guidelines and templates using a Ukrainian risk pool. The risk would then be reinsured through a government-backed fund, and national and international reinsurance based on transparent and competitive tarification principles. Through the aggregation and layering of the risk, reinsurance would, first of all, be interested in reinsuring Ukrainian risk and then would be forced to price the risk competitively (see Figure 9.2 on following page) For a country like Ukraine there is a strong risk of a reinsurance market failure. Individual insurance companies face sometimes insurmountable difficulties to even access international reinsurance

Crop Disaster Assistance in Ukraine: Issues, Alternatives, and Consequences Section 9: Designing a Risk Management Component of the Rural Finance Project
62
Skees, Hess, Ibarra
markets, let alone obtain competitive prices. International reinsurers simply do not have the capacity to work with fragmented and non-transparent risk portfolios in Ukraine. Opportunity costs for reinsurers are too high compared to the benefits and expected profits. Therefore the combination of introducing a transparent index insurance product and an efficient and well-regulated risk pool can overcome this market failure. Figure 9.2: Possible Structure for Risk Sharing
Farmers/agribusinesses
Insurance Company-
A
Insurance Company-
B
Insurance Company-
C
Risk pool for drought, floods and frost risk (swaps for weather
indexes from one region to the another)
Basic Risk Layer
Intermediate Risk Layer
Catastrophic Risk Layer
Competitive risk transfer
Government Risk Fund
GoU/World Bank Facility/ Intl RIInternational Reinsurance(RI)
Figure 9.2: Possible Structure for Risk Sharing
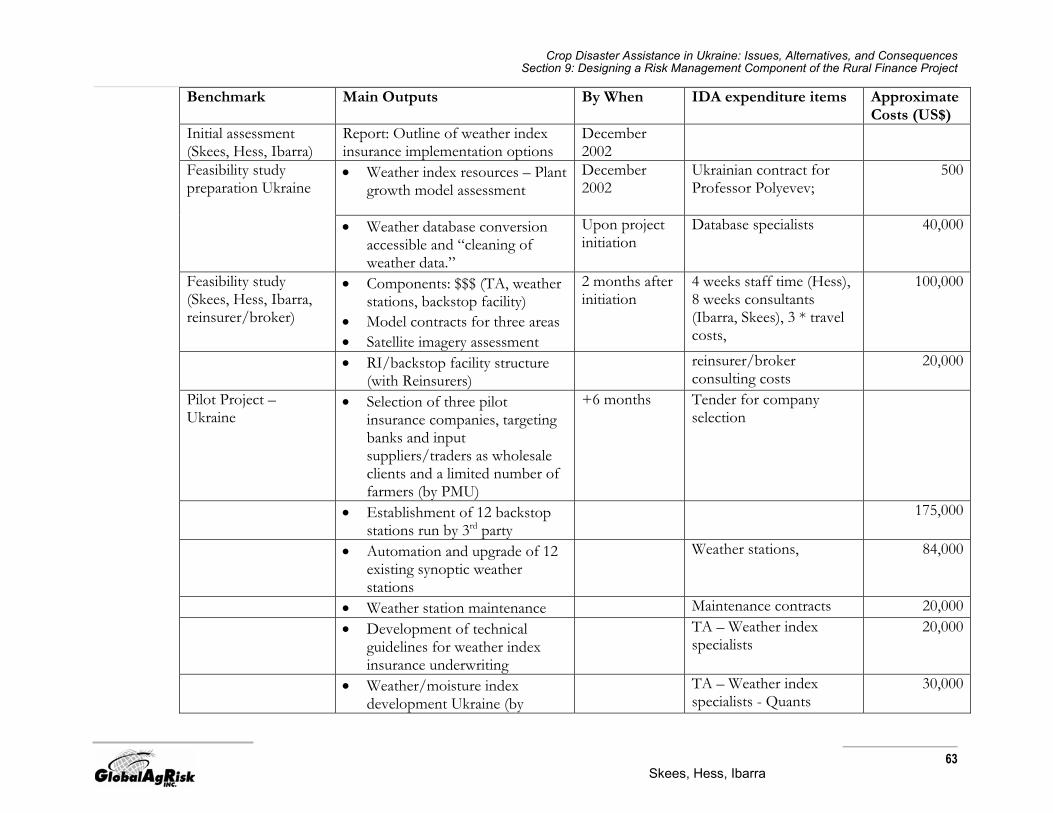
Crop Disaster Assistance in Ukraine: Issues, Alternatives, and Consequences Section 9: Designing a Risk Management Component of the Rural Finance Project
63
Skees, Hess, Ibarra
Benchmark Main Outputs By When IDA expenditure items Approximate Costs (US$)
Initial assessment (Skees, Hess, Ibarra)
Report: Outline of weather index insurance implementation options
December 2002
• Weather index resources – Plant growth model assessment
December 2002
Ukrainian contract for Professor Polyevev;
500 Feasibility study preparation Ukraine
• Weather database conversion accessible and “cleaning of weather data.”
Upon project initiation
Database specialists 40,000
Feasibility study (Skees, Hess, Ibarra, reinsurer/broker)
• Components: $$$ (TA, weather stations, backstop facility)
• Model contracts for three areas • Satellite imagery assessment
2 months after initiation
4 weeks staff time (Hess), 8 weeks consultants (Ibarra, Skees), 3 * travel costs,
100,000
• RI/backstop facility structure (with Reinsurers)
reinsurer/broker consulting costs
20,000
Pilot Project – Ukraine
• Selection of three pilot insurance companies, targeting banks and input suppliers/traders as wholesale clients and a limited number of farmers (by PMU)
+6 months Tender for company selection
• Establishment of 12 backstop stations run by 3rd party
175,000
• Automation and upgrade of 12 existing synoptic weather stations
Weather stations, 84,000
• Weather station maintenance Maintenance contracts 20,000 • Development of technical
guidelines for weather index insurance underwriting
TA – Weather index specialists
20,000
• Weather/moisture index development Ukraine (by
TA – Weather index specialists - Quants
30,000

Crop Disaster Assistance in Ukraine: Issues, Alternatives, and Consequences Section 9: Designing a Risk Management Component of the Rural Finance Project
64
Skees, Hess, Ibarra
private insurers) facilitated with focus groups and education, TA, workshops
• Launch of contracts in three pilot areas
+9 months Private insurers
• Backstop facility for three pilots 1,000,000 • Study and dissemination of
results TA (Skees, Ibarra, Hess)
Printing, Workshop 70,000
Phase I: Full Program • If pilots successful: extension to whole country
+1 year Technical Assistance 40,000
• Determine the needed number of weather stations to support a country-wide system
Automatization and modernization of weather stations/ system
1,000,000
• Backstop facility 10,000,000Phase II: No gov’t backstopping
• Private companies manage own RI contracts
+2 years
TOTAL $12,599,500

Crop Disaster Assistance in Ukraine: Issues, Alternatives, and Consequences Appendix A: List of Meetings
65
Skees, Hess, Ibarra
Appendix A: List of Meetings
1) Government a) Government Agrarian Policy Coordination Council Secretariat
i) Oleksandr L. Shevtsov, Head of Secretariat ii) Volodymyr I. Artyushyn, Coordinator of Agricultural Policy Analysis Unit iii) Olga P. Kovalenko, Strategic Area Manager iv) Olesya O. Pynzenyk, Assistant to Strategic Area Manager v) Inna P. Chapko, Agricultural Analyst (UNDP Agricultural Policy for Human Dev. Project)
b) Ukrainian Hydrometeorogical Center
i) Anatoliy Prokopenko, Deputy Head
2) Insurance Industry i) Dmitry Starodub, International Insurance Programs, Loss settlement, Agricultural
Insurance, OSRA-KYIV Joint-Stock Insurance Company ii) Edward Rosenblat, Chairman of the Board, Etanoh Insurance Company iii) Alexsander F. Filonuyk, President, League of Insurance Organization of Ukraine iv) Aleksander I. Nebylytsya, Vice President, Oranta, National Joint-Stock Insurance Company v) Oleg Asmotkin, Grant Auto, Ukrainian Insurance Company
3) World Bank/IFC i) Elena Voloshina, Deputy Head of IFC Mission in Ukraine ii) Nadiya Ryazanova, Consultation on Financial Issues, World Bank Ukraine iii) Victoria Yakubovich, Agriculture Finance Specialist, IFC Ukraine
4) CONSULTANTS Extra Consulting
i) Irene Romanenko, Director, Management Consulting ii) Vlad Kartavtsev, Chief Executive Officer
5) Banks a) Joint Stock Commercial Bank for Social Development
i) Timonkin V. Borys, Chairman of the Board ii) Dr. Nikolai Lagun, Director of Treasury
b) Joint Stock Post Pension Bank
i) Vitaly Kislenko, Deputy Head of Corporate Banking Department ii) Victor Gorbachov, Head of Credit Department
c) Micro Finance Bank
i) Volker Renner, General Manager

Crop Disaster Assistance in Ukraine: Issues, Alternatives, and Consequences Appendix A: List of Meetings
66
Skees, Hess, Ibarra
d) Donetsk Joint Stock City Bank
i) Vladimir Popovich, Chairman of the Board
6) Commodity Trading a) Cargill Grain and Oilseed Supply Chain
i) Ivan V. Moroshnichenko, Origination and Trading Manager ii) Yevgeniy Kuzmenko, Trading Manager
b) KYIV Agrostock
i) Boris L. Berenshtein, Vice President of Agrostock Committee
7) Associations i) Nikolay P. Barabash, Executive Director, Association of Farmers and Landowners of
Ukraine ii) Robert A. Cohen, Regional Manager, ACDI VOCA
8) Brokers a) Marsh
i) Anton Novikov, Director, FINPRO and Employee Benefits ii) Vladimir Bobko, Senior Vice President, Country Manager iii) Yuriy Alatortsev, Manager/Development, Agriculture, Food and Related Industries
Crop Disaster Assistance in Ukraine: Issues, Alternatives, and Consequences Appendix B: Soils in Ukraine
67
Skees, Hess, Ibarra
Appendix B: Soils in Ukraine27
Major Topographical Features Plains occupy over 90 percent of Ukraine. However it has the Crimean Mountains in the south and the Carpathians in the west. The highest elevations of its plains are 300 - 473 m above the sea, while those in the highlands reach heights of 1,542 m (Mt. Roman-Kosh in the Crimean Mountains) and 2,061 m (Mt. Goverla in the Carpathians). The high part of the flatland is in the central and southern areas of the country; it spreads from the west to southwest and occupies Podolskaia, Prydneprovskaia, Pryazovskaia and the Donetskaia high grounds. The lowest elevations can be found in the south, in Prychernomorie lowlands (38-67 m), in the center-Prydneprovskaia lowland (65 m) and on the northern territories of Ukraine referred to as the Poltava plain and Polissia lowland. Soil cover of the latter region is the least well drained and may be characterized by a high percentage of swampy land. 32, 000 km2 (66 percent) of swamps have been drained and brought into agricultural production. It is planned to increase the drained swamp area up to 38, 000 km2 in the future (Kovalenko, 1998]. Large stocks of peat are available. The river network comprises over 22,000 rivers with a total length of up to 170,000 km. The Dnieper, the largest - its basin covers 40 percent of the Ukraine, crosses the country from north to south and flows to the Black Sea, being the largest navigable artery of the country. There are many lakes, reservoirs and ponds.
Major Soil Types The soil cover of Ukraine is diversified and tends to occur in latitudinal zones across the country. The northwest has a wide belt of soddy (dern or dernovo)- podzolic soils with mainly light texture on sand-clay strata. These soils form some 70 percent of the total cover, are characterized by low humus content, increased acidity and therefore need application of mineral fertilizers and organic manures, as well as lime to yield a rich harvest. Thirty percent of the territory is occupied with sod (dern), meadow, meadow-bog and peat-bog soils with slight soddy (dernor dernovo) sands on elevated pine-clad terraces. Over 600,000 hectares (60 percent) of Ukrainian peat lands are concentrated here. A wide belt of grey forest soils, as well as podzol and typical chernozems with a 1.2-1.5 m thick humus bed, running from southwest to northeast, is located somewhat to the south. These soils are formed on loess strata. In addition to these, small areas are occupied with bog, meadow and meadow-chernozem soils, often of solonetz type. Further to the south, encompassing a considerable part of the territory of Odessa, Kirovograd, Dnipropetrovsk, Zaporizhia, Donetsk and Lugansk regions, typical chernozems stretch, with the thickness of their humus bed up to 80-90 cm, formed on moist-loamy strata. The southern part of Prychernomorie lowlands contains dry southern chernozems, which are replaced along the coastlines of the Black Sea and the Sea of Azov with a rather narrow strip of dark-chestnut and then chestnut soils combined with solonetz and soloth. Carbonatic chernozems and brown forest (often with gravel) soils prevail in the Crimean Mountains, while the Carpathians are characterized with short-profile mountain-forest and sod-brown soils with low content of humus, leached and heavy acid soils (pH=3.6 - 5).
27. This section is taken from Bogovin, A.V. “Country Pasture/Forage Resource Profiles in Ukraine.” FAO May 2001 website http://www.fao.org/ag/agp/agpc/doc/counprof/ukraine.htm

Crop Disaster Assistance in Ukraine: Issues, Alternatives, and Consequences Appendix C: FAS Assessment of Ukraine, June 2002
68
Skees, Hess, Ibarra
Appendix C: FAS Assessment of Ukraine, June 2002
June 19, 2002
UKRAINE TRIP REPORT: MARKET REFORMS CONTINUES
Analysts from the USDA Foreign Agricultural Service traveled in Ukraine during late May and early June to meet with agricultural officials, farm managers, and independent commodity analysts to assess 2002/03 grain production prospects and monitor the state of Ukraine’s former State and collective farms. Although 2002/03 grain yields are likely to drop significantly from last year, due chiefly to less favorable weather, the agricultural sector shows signs of increasing efficiency. The next few years will be a period of adjustment, as questions regarding farm credit are resolved and smaller private farms are folded into larger, more efficient enterprises. Dryness Reduces Yield Potential
Overall crop conditions in Ukraine are not as good as last season, when unusually favorable weather resulted in the highest total grain yield in nearly ten years. The USDA estimates 2002/03 grain production at 34.8 million tons (against 39.6 million in 2001/02), including 18.0 (21.3) million wheat, 9.0 (10.2) million barley, and 3.7 (3.6) million corn. Winter grains were sown on a reported 8.6 million hectares (roughly equal to last season), including 7.2 million hectares of winter wheat, 0.8 million rye, and 0.6 million barley. Persistent dryness prevailed in southern Ukraine throughout the fall and winter, with an estimated 0.5 million hectares of winter wheat lost due to drought. According to the State Statistical Committee, spring grains were sown on 5.6 million hectares (compared to 5.7 million last year), including 3.7 (3.4) million barley and 1.4 (1.5) million corn for grain. Spring precipitation was below normal in western and central Ukraine, and weather was excessively dry in parts of eastern and southern Ukraine. Late-May and early-June precipitation was beneficial for both winter and spring grains, but the effect of nearly two months of below-normal precipitation is indicated in recent Landsat satellite imagery from Dnipropetrovsk oblast (1, 2, 3) and Odesa oblast (4, 5, 6) and in imagery-derived vegetation indices. Well-Managed Farms Surviving the Transition
This will be the second full cropping season since the restructuring of Ukraine’s agricultural sector in April, 2000. State and collective farms were dismantled and farm property was divided among the farm workers in the form of land shares. Most new shareholders leased their land back to newly-formed private agricultural associations, under the leadership of a director who was frequently, but not always, the manager of the former State farm. Consolidation of small farms into larger and more viable enterprises has been the prevailing trend, similar to what took place in Russia several years earlier. (For a brief discussion of Ukraine’s agricultural restructuring, see June 2001 trip report.) The conversion to a more
Production Estimates and Crop Assessment Division Foreign Agricultural Service

Crop Disaster Assistance in Ukraine: Issues, Alternatives, and Consequences Appendix C: FAS Assessment of Ukraine, June 2002
69
Skees, Hess, Ibarra
market-oriented environment is progressing relatively well according to most observers. Many farms are succeeding, under shrewd leadership, in spite of low grain prices and constraints on the availability of credit. The transition of Ukraine's agricultural sector from a command economy to a more market-oriented system has introduced the element of fiscal responsibility, and decisions on crop selection, fertilizer application, harvest method, grain storage, and all other aspects of farm management are made with an eye toward boosting farm profit. Some farm managers are striving to make their enterprises as efficient as possible. Ukraine agriculture is going through a winnowing process whereby unprofitable, usually smaller farms will either collapse or join more successful farms. Credit Constraints Hinder Capital Improvement
Most farms are able to receive credit from banks, but two main problems were cited by farm directors: high interest rates and banks’ unwillingness to make long-term loans. Because of this, most loans to farms are seasonal loans (six to ten months) used almost exclusively for the purchase of fertilizer and plant protection chemicals. Commercial interest rates currently run around 30 percent. The State provides assistance to farms by paying 50 percent of the interest on agricultural loans. Payment delays of the subsidy to banks are common, however, and farms are sometimes forced to pay all of the interest to avoid defaulting on the loan, then wait to be reimbursed by the State.
Since many farms are already heavily in debt to banks or suppliers of fertilizer and plant-protection chemicals, and since agricultural loans are not guaranteed by the government, banks are cautious in their assessment of farms’ ability to repay loans. Banks typically require 200 to 300 percent collateral, depending on the farm’s credit history and the risk level. Exceptionally stable farms may need to offer only 150 percent, and high-risk farms may not be able to receive credit at all. Future crop usually serves as collateral, but collateral can also be offered in the form of livestock, farm machinery, or the personal property of the farm director. Under current legislation, land cannot be used as collateral. Most observers feel that this will change eventually. Farms' difficulty in obtaining anything other than short-term, high-interest loans places severe constraints on their ability to invest in long-term capital improvements, such as agricultural machinery or storage facilities, and using land as collateral would enable farms to receive longer-term loans. Nevertheless, some farm managers remain leery of the Ukrainian banking system – which is not yet as stable as in Russia – and are reluctant to risk losing their land in default. Furthermore, many agricultural enterprises are comprised of hundreds of shareholders, whose permission would need to be obtained before the farm director could use the land as collateral.
A chronic lack of modern harvesting equipment remains one of Ukraine’s main obstacles to increasing grain output and quality. Farm managers estimate harvest losses due to inefficient machinery at 10 to 20 percent of the standing crop, and the inevitable harvest delays, when combined with unfavorable weather, can contribute to a reduction in grain quality. Custom combining services are available but expensive, with operators charging 20 percent of the crop for the harvest of food-quality wheat, and 25 percent for feed wheat. The director of a grain and livestock operation in Kharkiv oblast explained that, after weighing the benefits and disadvantages of custom combining, he decided to fix his outdated combines as best he could and harvest the crop himself. Harvest losses would amount to less than the service charge, he reasoned, and the harvest campaign would provide work for the farm employees. Market Forces Influence Input Use
There is no shortage of mineral fertilizers or plant-protection chemicals in Ukraine. Any inputs that a farmer needs can be obtained if the farm has money or can get credit. The application of mineral fertilizer reportedly has increased slightly again this year, although the average application rate is still significantly below recommended amounts. The high price of imported herbicides and fungicides has caused some farmers to cut back on their use, or to use less expensive and less effective domestic

Crop Disaster Assistance in Ukraine: Issues, Alternatives, and Consequences Appendix C: FAS Assessment of Ukraine, June 2002
70
Skees, Hess, Ibarra
products. For farmers that can afford them, non-selective glyphosate-based herbicides (like Roundup) are popular. Farmers still rely to a large degree on mechanical weed control.
In an effort to lower operating costs and increase efficiency, some farms are experimenting with crop-management methods which are unconventional compared to traditional local practices. Two large enterprises in eastern Ukraine -- one in Dnipropetrovsk oblast, the other in Kharkiv--apply nitrogen to winter grains at planting rather than following the standard technique of spring application. This reduces fuel use and spring tillering (which can result in uneven ripening). The Dnipropetrovsk farm has also adopted fuel-saving minimum-tillage practices, which eliminate deep plowing. According to the farm director, the combination of minimum tillage and fall fertilization has reduced fuel consumption on this farm from 180 to 40 liters per hectare. What About the Bad Farms?
The consensus of most observers is that the already-successful farms will continue to expand as shareholders pull out of failing farms and lease their plots to stronger ones. One problem inherent in crop-assessment travel is that farm visits are typically arranged through local agricultural officials and there is an understandable tendency to view only the more efficient and successful enterprises. Directors and chief agronomists of these farms routinely cite wheat yields of 4 tons per hectare or more, which is easy to believe given the good management, but it raises questions regarding the operation of other, poorly-run farms. If the "good" farms are harvesting 4.0 to 4.5 tons per hectares, how low are the yields on the remainder of farms in order to pull the national yield down to 2.5 to 3.0 tons per hectare? Clearly, many farms will not survive the transition to a market economy, and high-risk farms with few liquid assets, heavy debt, bad credit history, and poor management will collapse.

Crop Disaster Assistance in Ukraine: Issues, Alternatives, and Consequences References
71
Skees, Hess, Ibarra
References Artiushin, V., I. Chapko, I. Kobuta, R. Korinets, O. Kovalenko, O. Protchenko, M. Pugachov, O.
Sadauskienie, N. Seperovich, O. Shevstov, M. Tereschenko, A. Vorobyov, and O. Yarovslavsky. February 2002. Agricultural Policy in Ukraine in 2001: Review and Outlook. Agricultural Policy for Human Development Project (APHD). Kiev.
Black, J. R., B. J. Barnett, and Y. Hu. “Cooperatives and Capital Markets: The Case of Minnesota-
Dakota Sugar Cooperatives.” Amer. J. Agr. Econ. 81: 1240-1246. Bouriaux, S. and M. Himick. 1998. Exchange-Traded Insurance Derivatives: Catastrophe Options and
Swaps. In Securitized Insurance Risk, M. Himick (Ed.). The Glenlake Publishing Company. Ltd. Camerer, C. F. and H. Kunreuther. 1989. “Decision Processes for Low Probability Events: Policy
Implications.” J. of Policy Analysis and Mgt. 8: 565-592. Cole, J. B. and A. Chiarenza. 1999. “Convergence in the Markets for Insurance Risk and Capital.” Risk
Magazine. Cummins, J. D. and H. Geman. March 1995. “Pricing Catastrophe Insurance Futures and Call Spreads:
An Arbitrage Approach.” The J. of Fixed Income: 46-57. Doherty, N. A. 2001. “Financial Innovation in The Management of Catastrophic Risk.” Paper presented
at ASTIN/AFIR Conference, Brisbane, Australia. August 1997. Aachen: Shaker Verlag. Elliott, M. W. November 17, 1998. “Insurance Securitization An Educator’s Perspective.” Paper
presented at the Employers Reinsurance Corporation Seminar Six Series ’98, Toronto, Ontario. Froot K. A. (Ed.). 1999. The Financing of Catastrophic Risk. Chicago and London: The University of
Chicago Press. Goodwin, B. K. and V. H. Smith. 1995. The Economics of Crop Insurance and Disaster Aid. Washington,
D.C.: The AEI Press. Hazell, P.B.R. 1992. “The Appropriate Role of Agricultural Insurance in Developing Countries”. Journal
of International Development 4(6): 567-81. Jaffee, D. M. and T. Russell. 1997. “Catastrophe Insurance, Capital Markets, and Uninsurable Risks.” J.
of Risk and Insur. 64: 205-230. Kunreuther, H. 1976. “Limited Knowledge and Insurance Protection.” Public Policy 24: 227-261. Lamm, R. M., Jr. February 3, 1997. “The Catastrophe Reinsurance Market: Gyrations and Innovations
Amid Major Structural Transformation.” Bankers Trust Research, pp 1-13. Bankers Trust Company, New York, NY.

Crop Disaster Assistance in Ukraine: Issues, Alternatives, and Consequences References
72
Skees, Hess, Ibarra
Lapan, H. and G. Moschini. 1994. “Futures Hedging Under Price, Basis, and Production Risk.” American J. Agr. Econ. 76(3): 465-77.
Lewis, C. M. and K. C. Murdock. 1996. “The Role of Government Contracts in Discretionary
Reinsurance Markets for Natural Disasters.” J. of Risk and Insurance 63: 567-597. Mahul, O. 1999. “Optimum Area-Yield Crop Insurance.” Amer. J. Agr. Econ. 81: 75-82. Martin, S.W., B.J. Barnett, and K.H. Coble. 2001. “Developing and Pricing Precipitation Insurance.”
J. Agr. Res. Econ. 26: 261-74. Miranda, M. J. 1991. “Area-Yield Crop Insurance Reconsidered.” Amer. J. Agr. Econ. 73: 233-42. Mishra, P. K. 1996. Agricultural Risk, Insurance and Income: A Study of the Impact and Design of India’s
Comprehensive Crop Insurance Scheme. Brookfield: Avebury Press. Quiggin, J., G. Karagiannis and J. Stanton. 1994. Crop Insurance and Crop Production: An Empirical
Study of Moral Hazard and Adverse Selection. In Economics of Agricultural Crop Insurance, D.L. Hueth and W.H. Furtan, (eds.). Norwell, MA: Kluwer Academic Publishers.
Puhachov, M. and K. Puhachova. 2001. Evolution of Farm Structures in Ukraine. In Policies and
Agricultural Development in Ukraine. S. von Cramon-Taubadel, S. Zorya, and L. Strieve, (eds). Aachen: Shaker Verlag.
Sandor, R. L., A. Berg, and J. B. Cole. August 1994. “Crop Yield Futures and Options Contracts: A
Proposal for Market Architecture.” Paper presented at the American Agricultural Economics Association Preconference, San Diego, CA.
Skees, J.R. 2000. “A Role for Capital Markets in Natural Disasters: A Piece of the Food Security
Puzzle.” Food Policy 25: 365-378. . 2001. “The Bad Harvest Regulation.” The CATO Review of Business and Government. 24: 16-21. Skees, J.R. and B.J. Barnett. 1999. “Conceptual and Practical Considerations for Sharing
Catastrophic/Systemic Risks”. Review of Agricultural Economics 21(2): 424-41. Skees, J.R., J.R. Black, and B.J. Barnett. 1997. “Designing and Rating an Area-Yield Crop Insurance
Contract.” Amer. J. Agr. Econ. 79(2): 430-38. Skees, J.R. and M.R. Reed. 1986. “Rate-Making and Farm-Level Crop Insurance: Implications for
Adverse Selection.” Amer. J. of Agr. Econ. 68(3): 653-59. Skees, J., P. Hazell, and M. Miranda. 1999. New Approaches to Public/Private Crop-Yield Insurance.
Unpublished working paper. Washington, DC: The World Bank. State Statistics Committee of Ukraine. 2001. Agricultural Activity of Households in Ukraine: Statistical
Yearbook 2000. O. M. Prokopenko, (ed.). Kiev.

Crop Disaster Assistance in Ukraine: Issues, Alternatives, and Consequences References
73
Skees, Hess, Ibarra
Swinnen, J. 2001. Ten Years of Agricultural Transition in Central and Eastern Europe: Some Lessons
for Ukraine. In Policies and Agricultural Development in Ukraine, S. von Cramon-Taubadel, S. Zorya, and L. Strieve, (eds.). Aachen: Shaker Verlag.
Taylor Nelson Sofres (TNS) Ukraine. 2001. Agrobusiness Development in Ukraine: Survey of Ukraine.
In Policies and Agricultural Development in Ukraine. S. von Cramon-Taubadel, S. Zorya, and L. Strieve, (eds). Aachen: Shaker Verlag.
. February 2002. Executives of Agricultural Enterprises. Analytical Report. Project of Agrobusiness
Development in Ukraine of the International Financial Corporation. United Nations Food and Agriculture Organization (FAO). “Estimates of Land Use in Ukraine in
2000.” Electronic publication. http://www.fao.org (December 2002). U.S. Department of Agriculture/Economic Research Service (USDA/ERS) and Foreign Agricultural
Service (USDA/FAS). “Grain Area, Yield, and Production: All Farms, 1987-1998 (Ukraine).” Electronic publication. http://www.fas.usda.gov (December 2002).
Van Atta, D. 2001. Towards a More Market-Driven Strategy for Agricultural Reform in Yarovslavsky. Agricultural
Policy in Ukraine in 2001: Review and Outlook.
![armenian - World Banksiteresources.worldbank.org/.../cks_armenian.pdffirrwurarfrnqbßpba ffmurnrlmlJQmt1 prnqrnrrlrnrurnnl_nrnaurblrna Jprlmrlrnbqrntl mournrfrnnmburblurcû' ril]burblrnc](https://img.pdfslide.net/doc/110x75/5adb9cbd7f8b9aee348e42d0/armenian-world-ffmurnrlmljqmt1-prnqrnrrlrnrurnnlnrnaurblrna-jprlmrlrnbqrntl-mournrfrnnmburblurc.jpg)