Embed Size (px)
Citation preview
Securities offered through LPL Financial, Member FINRA/SIPC. LPL Compliance Tracking #1-264181
April 14, 2014 – HFT, Topping & Tapering is Tightening,
As always we hope that this letter finds you well. Since our last letter we have finally transitioned away from a brutally cold winter into the long awaited warmth and renewal of spring. Equity markets, however, have not made as cheery a transition. As of the date of this letter, the Dow Jones Industrial Average, NASDAQ Composite and S&P 500* are all in negative territory for 2014. While it would be premature to look at one quarter of performance results and declare a long-term trend reversal, it is very telling that the point at which these three major stock market indices lost their 2013 momentum was the point at which the Federal Reserve began reducing the rate of its monthly bond purchases.
Dr. Ben Hunt of Salient Partners had this to say in a recent note (if you are interested in game theory and how it applies to financial markets I highly recommend that you subscribe to receive Dr. Hunt’s regular notes via email at www.EpsilonTheory.com):
What’s the source of this beta earthquake? What tectonic plate is shifting beneath our feet? Only the bedrock bull Narrative of the past five years – “the Fed has got your back.” As I wrote last week, the Common Knowledge on Fed policy is starting to shift.
The market is in a tough spot right now, as good news will not make the market go higher (Fed stays on tightening path) and bad news can make the market go lower if it’s really bad news (or if the Fed gives more signals that they’re tightening regardless of how bad the news gets).
This tough spot is made even tougher by both a market fatigue with Fed jawboning (excuse me… communication policy) and a growing sense, fair or not, that the Yellen Fed is kind of flailing around right now. The dominant Narrative by a mile is still Central Bank Omnipotence, where the Fed is responsible for all market outcomes, but there are definitely signs of a growing counter-Narrative, one that I call “The Incompetent Magician”, that bears close watching. The Incompetent Magician Narrative is a story that’s very dangerous for markets, because it’s a story of a loss of control.
Securities offered through LPL Financial, Member FINRA/SIPC. LPL Compliance Tracking #1-264181
Is the Fed’s apparent commitment to tapering their asset purchases and the accompanying shift in market behavior leading to the long awaited top, the end of this five-year-old cyclical bull market? Maybe so, maybe not. Might markets regain the head of steam they exhibited following the 5.76% pullback on the S&P 500 from mid-January to the recent low on February 3rd? Possibly. The fact of the matter is that market tops are only visible in retrospect, so even though similar market patterns were witnessed at the bull market tops in 2000 and 2007 it is impossible to definitively say now that the last several months of sideways chop is in fact “the top”.
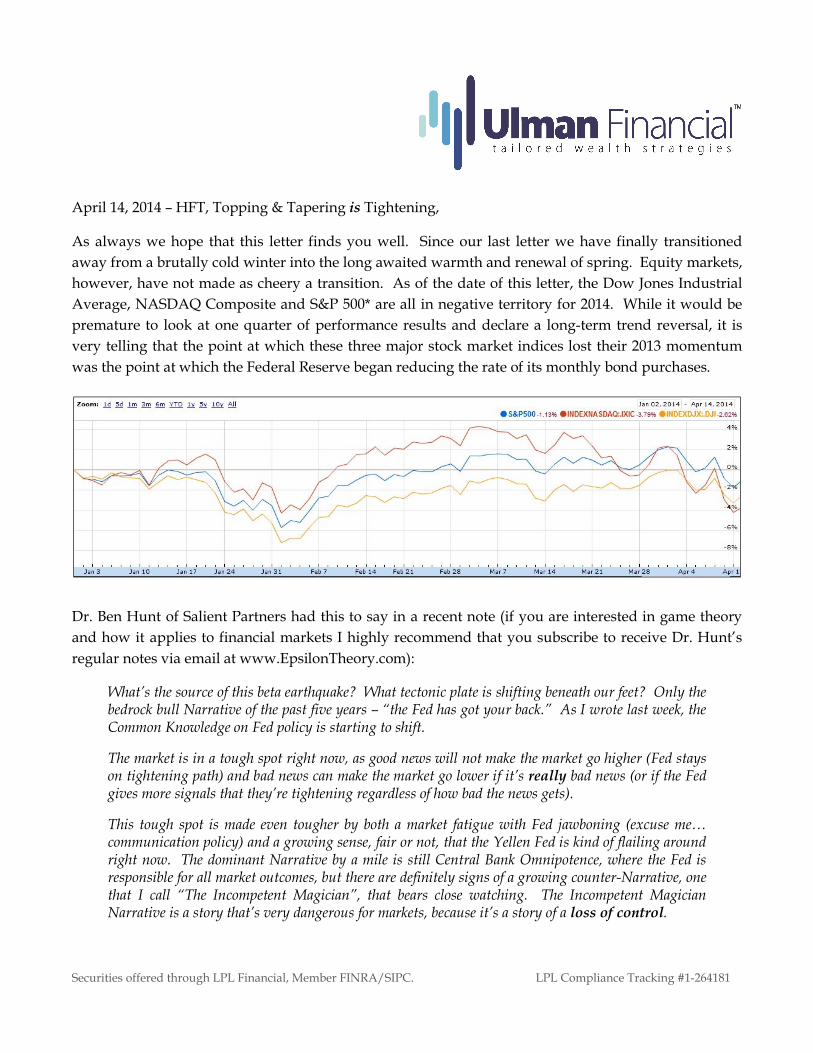
Here is what we do know: There has been a virtually direct relationship in the growth of the Fed’s balance sheet and the growth of the S&P 500 since QE1 was initiated five years ago. Each time the FOMC has wound down one of its QE programs the S&P 500 has sold off by greater than 15%, only to be saved by the promise of more QE. The Fed is still pumping an enormous amount of liquidity in to the financial system (currently $55 billion per month, down from $85 billion per month during all of 2013) but the systematic reduction of the amount of stimulus is a tightening of policy.
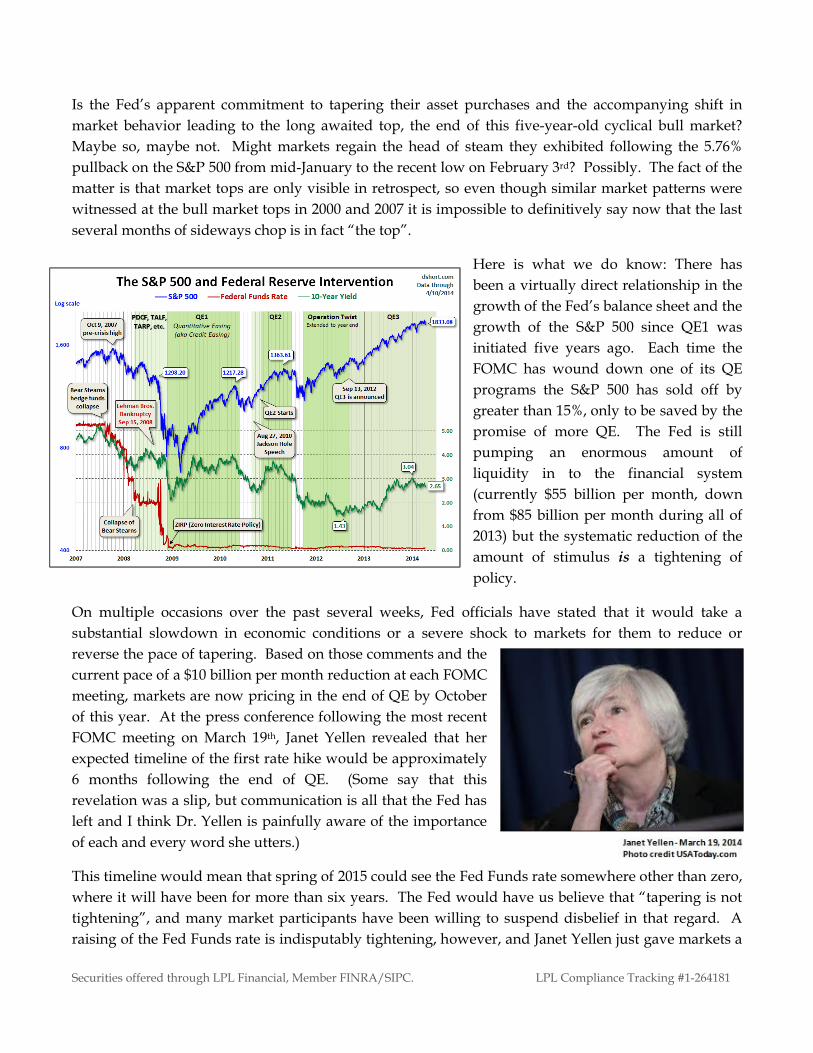
On multiple occasions over the past several weeks, Fed officials have stated that it would take a substantial slowdown in economic conditions or a severe shock to markets for them to reduce or reverse the pace of tapering. Based on those comments and the current pace of a $10 billion per month reduction at each FOMC meeting, markets are now pricing in the end of QE by Octoberof this year. At the press conference following the most recent FOMC meeting on March 19th, Janet Yellen revealed that her expected timeline of the first rate hike would be approximately 6 months following the end of QE. (Some say that this revelation was a slip, but communication is all that the Fed has left and I think Dr. Yellen is painfully aware of the importance of each and every word she utters.)
This timeline would mean that spring of 2015 could see the Fed Funds rate somewhere other than zero, where it will have been for more than six years. The Fed would have us believe that “tapering is not tightening”, and many market participants have been willing to suspend disbelief in that regard. A raising of the Fed Funds rate is indisputably tightening, however, and Janet Yellen just gave markets a
Securities offered through LPL Financial, Member FINRA/SIPC. LPL Compliance Tracking #1-264181
signal as to when the formal tightening is to begin. The last two cyclical bull market tops were preceded by a period of monetary policy tightening intended to temper speculation in equities and real estate, and I don’t need to remind anyone that those bull markets were followed by bear market losses in excess of 50% on the Dow Jones Industrial Average, NASDAQ Composite and S&P 500.
More on tapering and topping in just a minute, first I want to spend a minute on our third title topic, HFT. Fed policy has been the dominant topic of conversation in the financial world for years, and rightfully so, but in the last few weeks, in addition to the talk of a potential top, one other issue has garnered much attention, high frequency trading (HFT). High frequency trading firms are electronic traders that use lightening fast computer algorithms and close proximity to stock exchange data centers (often in the same building or even the same room) to benefit from microsecond delays in data sent between the dozens of public stock exchanges and bank run 'dark pools'. The main topic of the media’s coverage has been the seemingly unfair advantage they have over traditional retail and institutional investors in domestic and global equity markets.
High frequency traders have been around for years and were the topic of a similar flurry of market and regulatory concern in the immediate aftermath of the May 6, 2010, Flash Crash, during which the Dow Jones Industrial Average lost 9% in just over 10 minutes, only to recover most of those losses just as quickly. The recent resurgence of concern over the safety and fairness of HFTs has been the result of Michael Lewis' newest book Flash Boys and a 60 Minutes interview in which Lewis (author of The Blind Side and Moneyball) stated, categorically, "The stock market is rigged!" Understandably, such an accusation in front of a nationwide audience was highly controversial. Lewis and his book’s real life protagonist, Brad Katsuyama, have been making the rounds on the talk show circuit to discuss the book and their claims of market manipulation not just by HFTs but by the exchanges themselves, aided by regulatory bodies that are ineffective at best and complicit at worst. The SEC and FBI have both recently launched investigations largely in response to the claims made in the book. Like all of Lewis’ past efforts Flash Boys is a fantastic read even for those previously unfamiliar with electronic trading. I highly recommend it, if only to gain a better understanding of the plumbing that makes up the modern stock market and so you can draw your own conclusions about Lewis' controversial proclamation.
My concern with HFTs is not so much that they have manipulated the system to skim pennies per trade off of the orders of slower market participants, which is undeniable. Markets have always relied on intermediaries, so called "market makers", to fill the gap between buyers and sellers and to provide liquidity when large buy or sell orders come to market and those intermediaries have always exacted a tax for their service. My concern with the exponential increase of algorithmic trading (approximately 70% of daily trading volume is computers trading with computers, often holding positions for mere fractions of a second, with zero human involvement) is that we have introduced yet another layer of complexity, to what is already a highly complex and adaptive system. Complex systems, by their very nature, are subject to non-linear responses to stimuli, which means that a small change or action by one member of the system has the ability to affect an outsized response that can ripple through and dramatically alter the entire system. Think of how the shifting of a few snowflakes on the side of a mountain in what complexity theorists call a “critical state” can trigger a chain reaction that results in a
Securities offered through LPL Financial, Member FINRA/SIPC.
massive avalanche. The Flash Crash of 2010 and the inability of even the most knowledgeable and seasoned traders on Wall Street to pinpoint a specific cause are a perfect example of the potential highly complex and largely automated system to provide unexpected results.
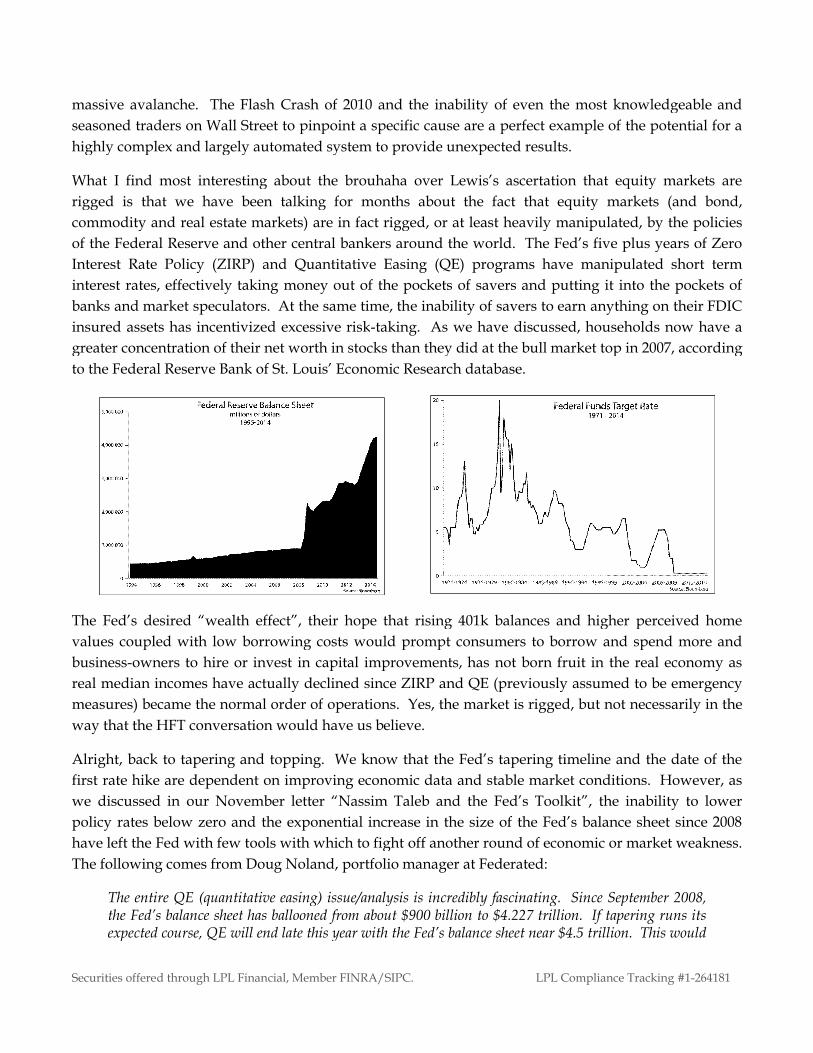
What I find most interesting about the brouhaha over Lewis’s ascertation that equity markets are rigged is that we have been talking for months about the fact that equity markcommodity and real estate markets) are in fact rigged, or at least heavily manipulated, by the policies of the Federal Reserve and other central bankers around the world. The Fed’s five plus years of Zero Interest Rate Policy (ZIRP) and Quainterest rates, effectively taking money out of the pockets of savers and putting it into the pockets of banks and market speculators. At the same time, the inability of savers to earn anything oninsured assets has incentivized excessive riskgreater concentration of their net worth in stocks than they did at the bull market top in 2007, according to the Federal Reserve Bank of St. Lo
The Fed’s desired “wealth effect”, their hope that rising 401k balances and higher perceived home values coupled with low borrowing costs would prompt consumers to borrow and spend more and business-owners to hire or invest in capital improvements, has not born fruit in the real economy as real median incomes have actually declined since ZIRP and QE (previously assumed to be emergency measures) became the normal order of operations. Yes, the market is riggeway that the HFT conversation would have us believe.
Alright, back to tapering and topping. We know that tfirst rate hike are dependent on improving we discussed in our November letter “Nassim Taleb and the Fed’s Toolkit”, the inability to lower policy rates below zero and the exponential increase in the size of the Fed’s balance sheet since 2008 have left the Fed with few tools with which to fight off another round of economic or market weakness. The following comes from Doug Noland,
The entire QE (quantitative easing) issue/analysis is incredibly fascinating. Since September 2008, the Fed’s balance sheet has ballooned from about $900 billion to $4.227 trillion. If tapering runs its expected course, QE will end late this year with the Fed’s balance sheet near $4.5 trillion. This would
al, Member FINRA/SIPC. LPL Compliance Tracking #1
The Flash Crash of 2010 and the inability of even the most knowledgeable and traders on Wall Street to pinpoint a specific cause are a perfect example of the potential
highly complex and largely automated system to provide unexpected results.
What I find most interesting about the brouhaha over Lewis’s ascertation that equity markets are rigged is that we have been talking for months about the fact that equity markcommodity and real estate markets) are in fact rigged, or at least heavily manipulated, by the policies of the Federal Reserve and other central bankers around the world. The Fed’s five plus years of Zero Interest Rate Policy (ZIRP) and Quantitative Easing (QE) programs have manipulated short term interest rates, effectively taking money out of the pockets of savers and putting it into the pockets of banks and market speculators. At the same time, the inability of savers to earn anything oninsured assets has incentivized excessive risk-taking. As we have discussed, households now have a greater concentration of their net worth in stocks than they did at the bull market top in 2007, according to the Federal Reserve Bank of St. Louis’ Economic Research database.
The Fed’s desired “wealth effect”, their hope that rising 401k balances and higher perceived home values coupled with low borrowing costs would prompt consumers to borrow and spend more and
to hire or invest in capital improvements, has not born fruit in the real economy as real median incomes have actually declined since ZIRP and QE (previously assumed to be emergency measures) became the normal order of operations. Yes, the market is rigged, but not necessarily in the way that the HFT conversation would have us believe.
Alright, back to tapering and topping. We know that the Fed’s tapering timeline and improving economic data and stable market conditions. However, as
we discussed in our November letter “Nassim Taleb and the Fed’s Toolkit”, the inability to lower policy rates below zero and the exponential increase in the size of the Fed’s balance sheet since 2008
ools with which to fight off another round of economic or market weakness. The following comes from Doug Noland, portfolio manager at Federated:
The entire QE (quantitative easing) issue/analysis is incredibly fascinating. Since September 2008, balance sheet has ballooned from about $900 billion to $4.227 trillion. If tapering runs its
expected course, QE will end late this year with the Fed’s balance sheet near $4.5 trillion. This would
LPL Compliance Tracking #1-264181
The Flash Crash of 2010 and the inability of even the most knowledgeable and traders on Wall Street to pinpoint a specific cause are a perfect example of the potential for a
What I find most interesting about the brouhaha over Lewis’s ascertation that equity markets are rigged is that we have been talking for months about the fact that equity markets (and bond, commodity and real estate markets) are in fact rigged, or at least heavily manipulated, by the policies of the Federal Reserve and other central bankers around the world. The Fed’s five plus years of Zero
ntitative Easing (QE) programs have manipulated short term interest rates, effectively taking money out of the pockets of savers and putting it into the pockets of banks and market speculators. At the same time, the inability of savers to earn anything on their FDIC
taking. As we have discussed, households now have a greater concentration of their net worth in stocks than they did at the bull market top in 2007, according
The Fed’s desired “wealth effect”, their hope that rising 401k balances and higher perceived home values coupled with low borrowing costs would prompt consumers to borrow and spend more and
to hire or invest in capital improvements, has not born fruit in the real economy as real median incomes have actually declined since ZIRP and QE (previously assumed to be emergency
d, but not necessarily in the
tapering timeline and the date of the et conditions. However, as
we discussed in our November letter “Nassim Taleb and the Fed’s Toolkit”, the inability to lower policy rates below zero and the exponential increase in the size of the Fed’s balance sheet since 2008
ools with which to fight off another round of economic or market weakness.
The entire QE (quantitative easing) issue/analysis is incredibly fascinating. Since September 2008, balance sheet has ballooned from about $900 billion to $4.227 trillion. If tapering runs its
expected course, QE will end late this year with the Fed’s balance sheet near $4.5 trillion. This would
Securities offered through LPL Financial, Member FINRA/SIPC. LPL Compliance Tracking #1-264181
leave the latest round of QE totalling almost $1.7 trillion, with the Fed’s balance sheet having expanded a parabolic 60% in two years. This would also place total Fed asset growth at $3.6 trillion, or 400%, in six years.
Dr. Bernanke’s theories held that Fed “money” printing could ensure a rising rate of inflation (i.e. central banks could inflate away problematic debt loads). Now as the biggest QE yet begins to wind down, most notions of how Fed “money” printing operations actually function are overdue for a thorough reexamination. After all, in the face of what will be $1.6 trillion on new liquidity, bond yields rose and CPI (inflation) declined. Stocks, on the other hand, went on a historic moonshot. In corporate Credit, it became 2007 reincarnate.
When the Fed was discussing its so-called “exit strategy” back in 2011, I was writing that there would be “No Exit”. Well the Fed has since doubled the size of its balance sheet and I just don’t see how the Fed can inflate liquidity from $900 billion to $4.5 trillion and then just shut down the “printing presses” – that is, without some major consequences for the general liquidity backdrop. The history of monetary inflations provides unequivocal support for this view.
In our opinion, the Fed is now trapped in a very difficult situation. They are very well aware that their extended zero interest rate policy and massive balance sheet expansion have left them with few suitable policy tools with which to fight the next battle. For this reason they very much want to normalize policy, and have stated explicitly that they are eager to be out of the QE business. However, as shown in the chart on page 2, in the past five years each time monetary policy has become less accommodative the markets have reacted negatively and threatened what little progress has been made in the real economy. We may be witnessing the beginning of another such episode.
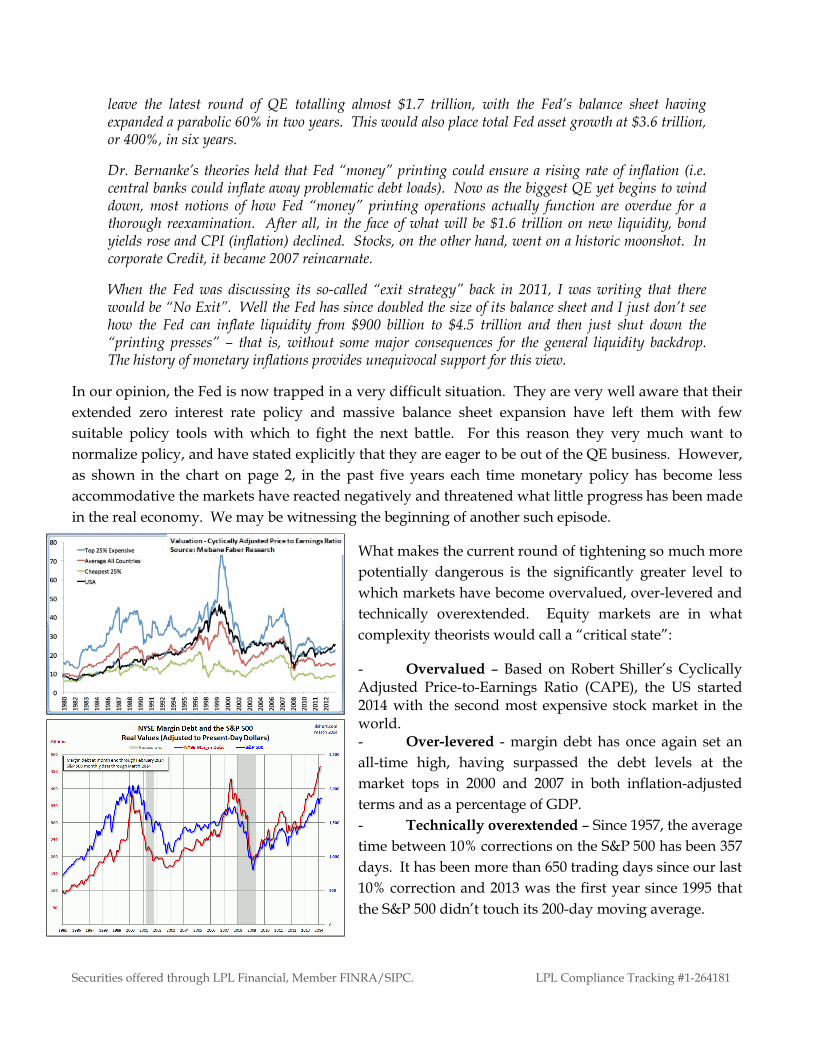
What makes the current round of tightening so much more potentially dangerous is the significantly greater level to which markets have become overvalued, over-levered and technically overextended. Equity markets are in what complexity theorists would call a “critical state”:
- Overvalued – Based on Robert Shiller’s Cyclically Adjusted Price-to-Earnings Ratio (CAPE), the US started 2014 with the second most expensive stock market in the world.- Over-levered - margin debt has once again set an all-time high, having surpassed the debt levels at the market tops in 2000 and 2007 in both inflation-adjustedterms and as a percentage of GDP. - Technically overextended – Since 1957, the average time between 10% corrections on the S&P 500 has been 357 days. It has been more than 650 trading days since our last 10% correction and 2013 was the first year since 1995 that the S&P 500 didn’t touch its 200-day moving average.
Securities offered through LPL Financial, Member FINRA/SIPC. LPL Compliance Tracking #1-264181
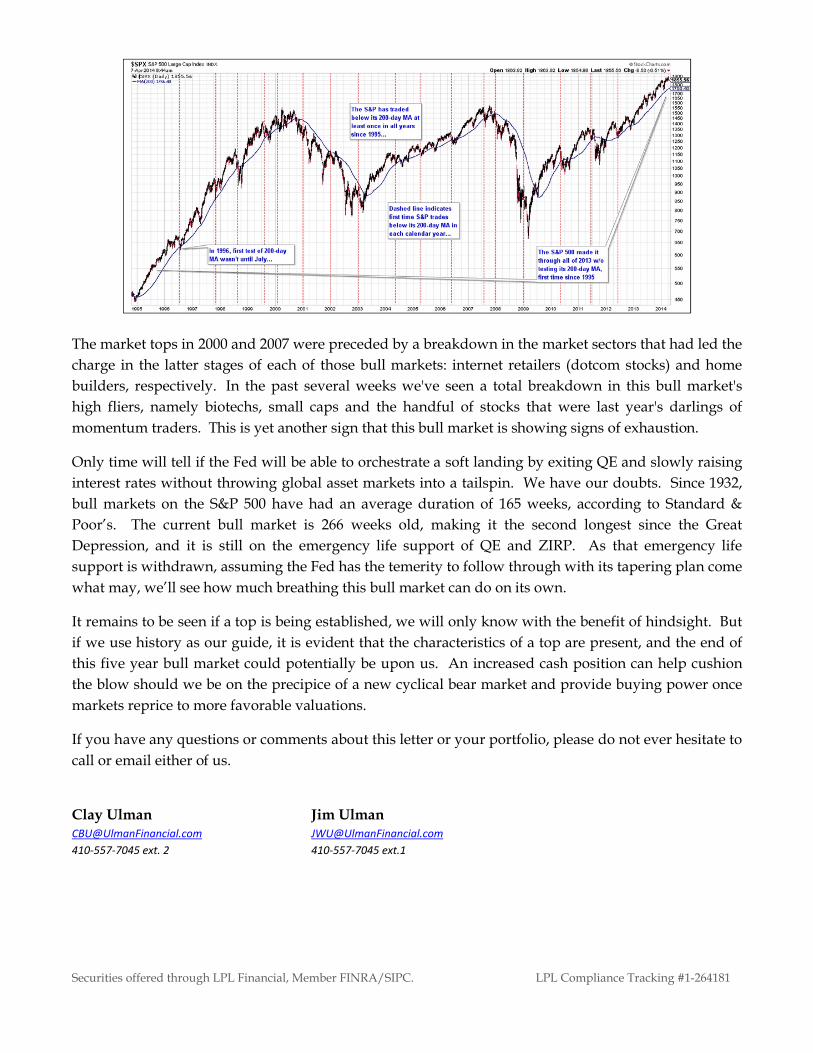
The market tops in 2000 and 2007 were preceded by a breakdown in the market sectors that had led the charge in the latter stages of each of those bull markets: internet retailers (dotcom stocks) and home builders, respectively. In the past several weeks we've seen a total breakdown in this bull market's high fliers, namely biotechs, small caps and the handful of stocks that were last year's darlings of momentum traders. This is yet another sign that this bull market is showing signs of exhaustion.
Only time will tell if the Fed will be able to orchestrate a soft landing by exiting QE and slowly raising interest rates without throwing global asset markets into a tailspin. We have our doubts. Since 1932, bull markets on the S&P 500 have had an average duration of 165 weeks, according to Standard & Poor’s. The current bull market is 266 weeks old, making it the second longest since the Great Depression, and it is still on the emergency life support of QE and ZIRP. As that emergency life support is withdrawn, assuming the Fed has the temerity to follow through with its tapering plan come what may, we’ll see how much breathing this bull market can do on its own.
It remains to be seen if a top is being established, we will only know with the benefit of hindsight. But if we use history as our guide, it is evident that the characteristics of a top are present, and the end of this five year bull market could potentially be upon us. An increased cash position can help cushion the blow should we be on the precipice of a new cyclical bear market and provide buying power once markets reprice to more favorable valuations.
If you have any questions or comments about this letter or your portfolio, please do not ever hesitate to call or email either of us.
Clay Ulman Jim [email protected] [email protected] ext. 2 410-557-7045 ext.1
Securities offered through LPL Financial, Member FINRA/SIPC. LPL Compliance Tracking #1-264181
*Indexes, such as the Dow Jones Industrial Index and S&P 500 Index, are unmanaged and investors are not able to invest directly into any index. Past performance is no guarantee of future results.
The opinions voiced in this material are for general information only and are not intended to provide specific advice or recommendations for any individual. To determine which investment(s) may be appropriate for you, consult your financial advisor prior to investing.
The economic forecasts set forth in the presentation may not develop as predicted and there can be no guarantee that strategies promoted will be successful.