Embed Size (px)
Citation preview
Ultra-High Resolution Information Visualization
CS 5764Sarah Peck, Chris North Credits: Beth Yost, Bob Ball, Christopher Andrews, Mike DellaNoce, Candice Luebbering, Sarah Peck, Lauren Shupp, John Booker

Research Questions
• Fundamental issues:• What is the benefit for visualization?
in terms of Perception, Navigation, Awareness• Limits of visual scalability?
• Display design issues:• How big? How shaped?
• Visualization design issues:• How to embed more information?
• Interaction design issues:• How to point? pan? zoom?
Performance - Navigation
0
5
10
15
20
1 2 3 4 5 6 7 8
Per
form
ance
Tim
e
(seco
nd
s)
What is the impact of large high-resolution displays on visualization?
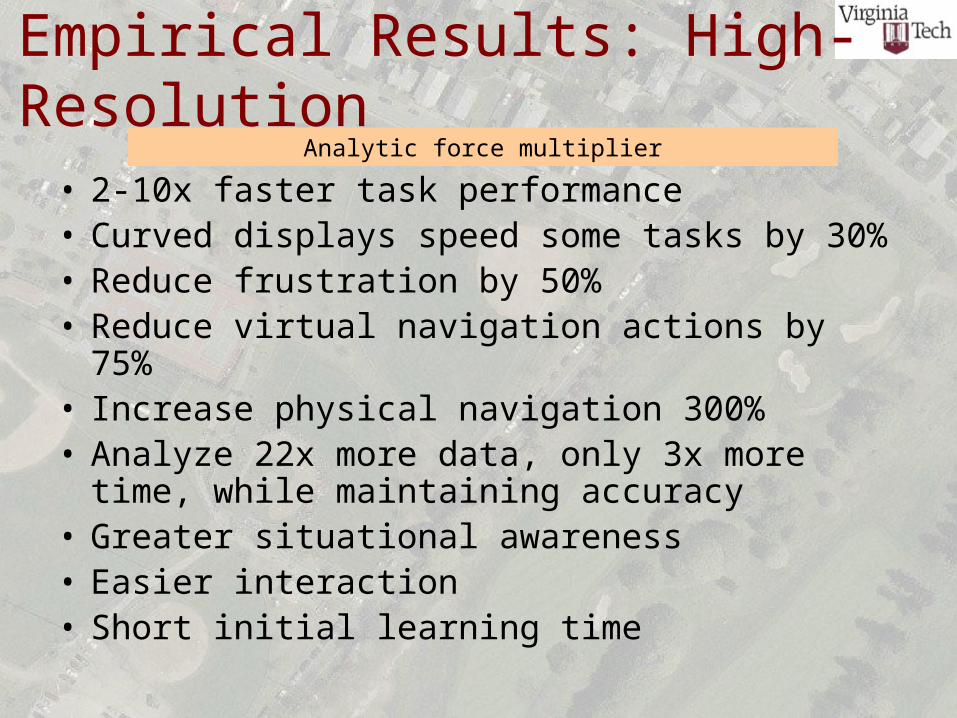
Empirical Results: High-Resolution
• 2-10x faster task performance• Curved displays speed some tasks by 30%• Reduce frustration by 50%• Reduce virtual navigation actions by 75%• Increase physical navigation 300%• Analyze 22x more data, only 3x more time, while
maintaining accuracy• Greater situational awareness• Easier interaction• Short initial learning time
Analytic force multiplier
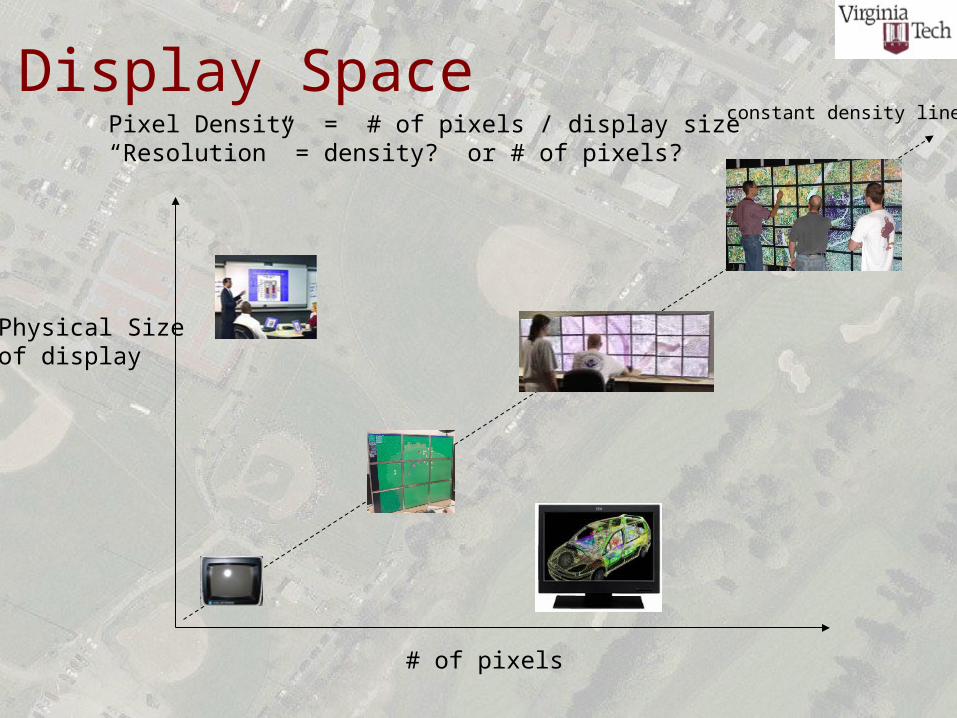
Display Space
# of pixels
Physical Size of display
Pixel Density = # of pixels / display size“Resolution” = density? or # of pixels?
constant density line
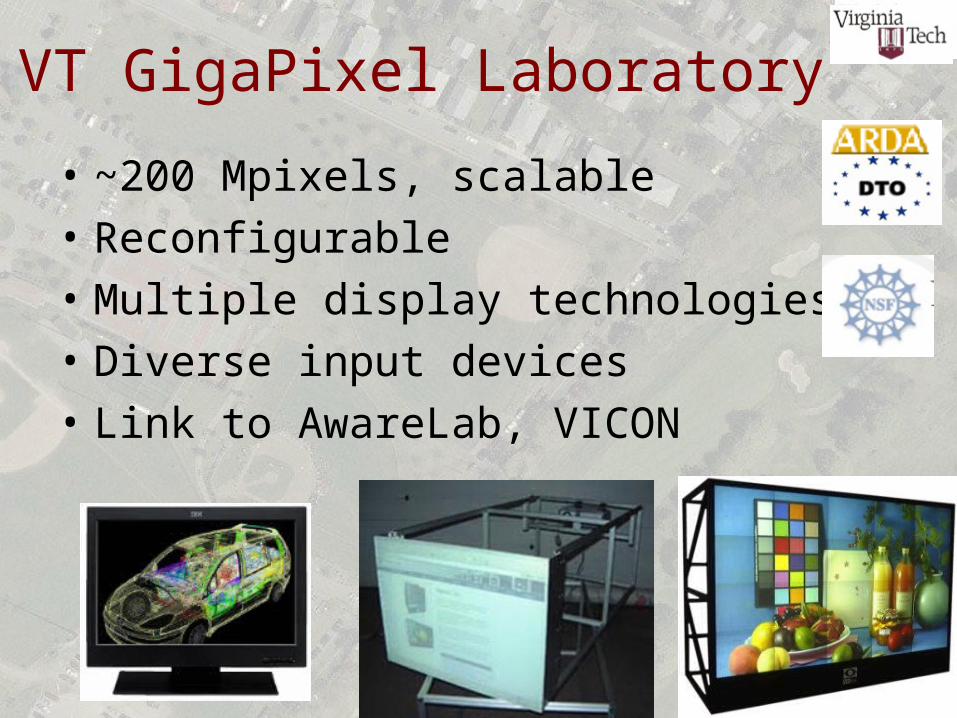
VT GigaPixel Laboratory
• ~200 Mpixels, scalable
• Reconfigurable
• Multiple display technologies
• Diverse input devices
• Link to AwareLab, VICON
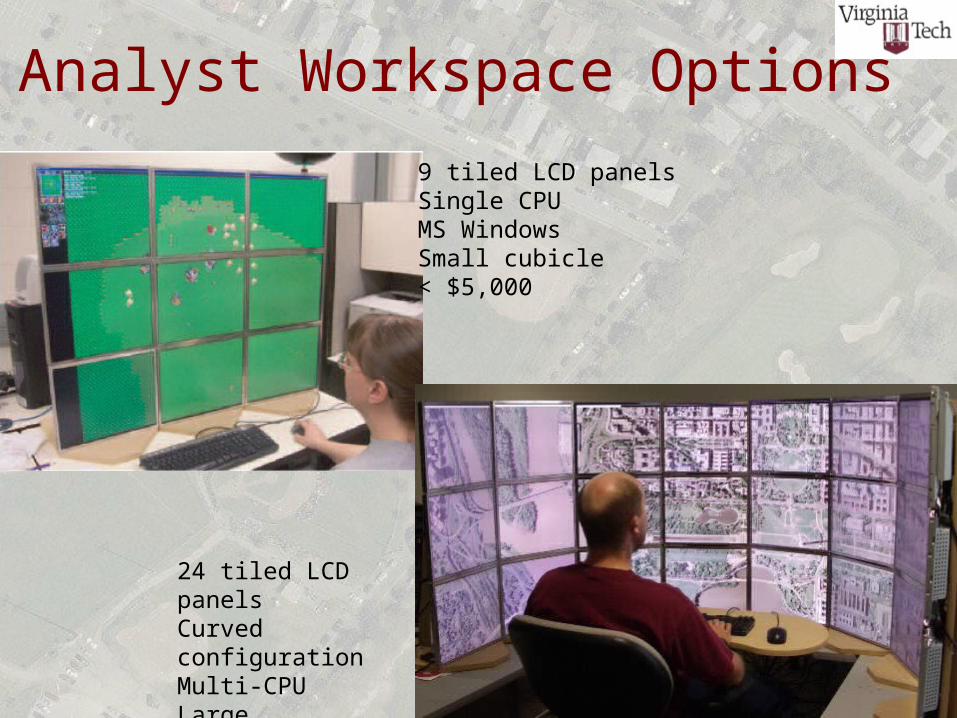
Analyst Workspace Options
9 tiled LCD panelsSingle CPUMS WindowsSmall cubicle< $5,000
24 tiled LCD panelsCurved configurationMulti-CPULarge cubicle/office~ $20,000
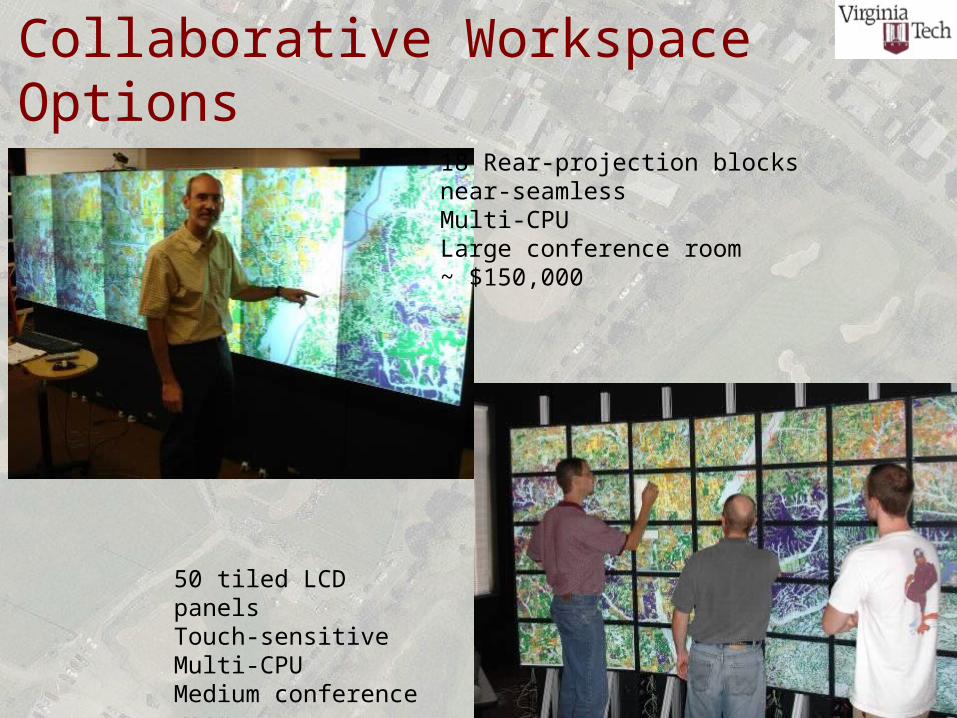
Collaborative Workspace Options
18 Rear-projection blocksnear-seamlessMulti-CPULarge conference room~ $150,000
50 tiled LCD panelsTouch-sensitiveMulti-CPUMedium conference room~ $120,000
LCD vs. Rear-projection
Variables
• # pixels, display size, density• Shape, curvature, horizontal / vertical• Brightness, contrast, color, clarity• Uniformity• Alignment • Bezels, seams• Technology type• Footprint• Maintenance • Input technique
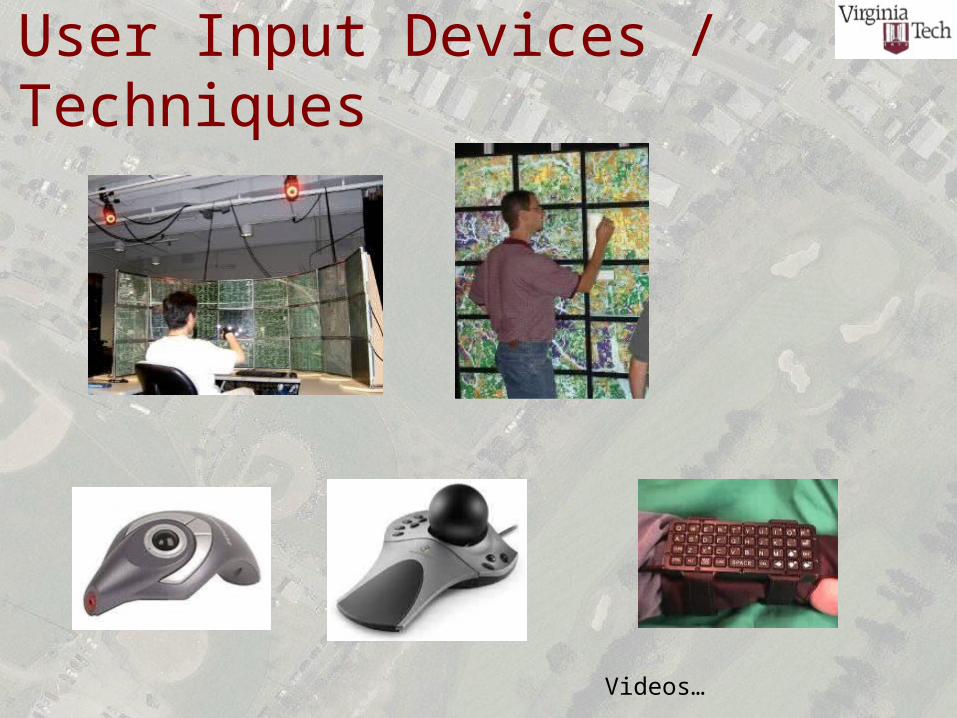
User Input Devices / Techniques
Videos…
High-Res Visualization Design
Displaying more data
• More entities
• More attributes
• Embed details
• Larger spatial area
• Multiple levels of scale
• Heterogeneous data
• Task context info
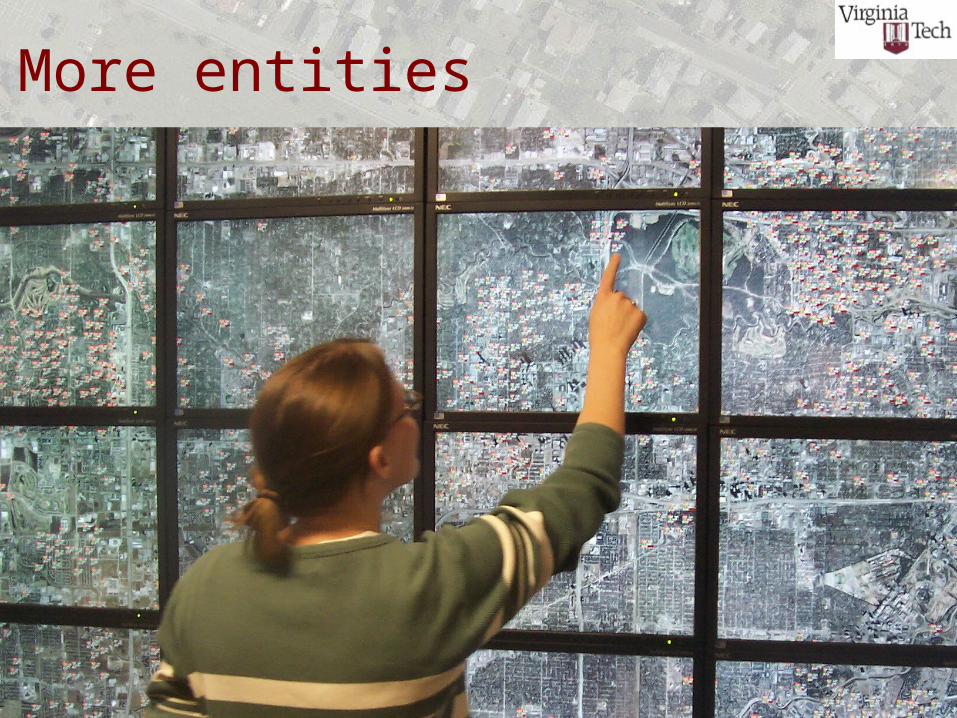
More entities
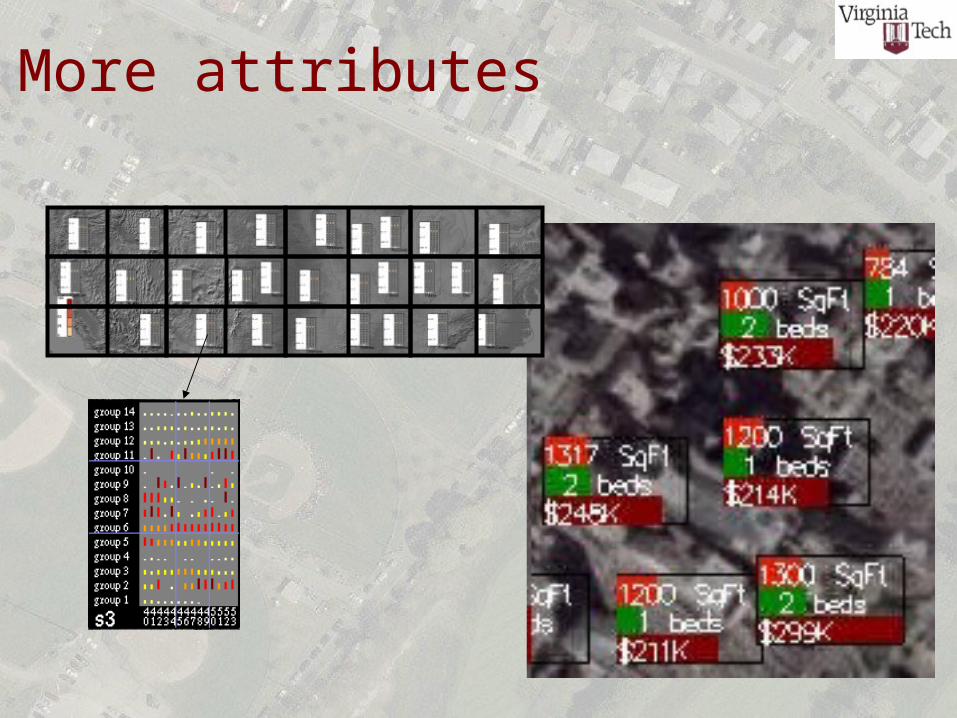
More attributes
Embed details
• Storyboard notecards
Design Suggestions
• Take advantage of fast physical navigation to replace slow virtual navigation
• Design to take advantage of visual aggregation• Consider what is perceptible from various
physical distances• Consider multiple strategic labels and both local
and global legends• Choose scalable encodings• Consider effect of display characteristics
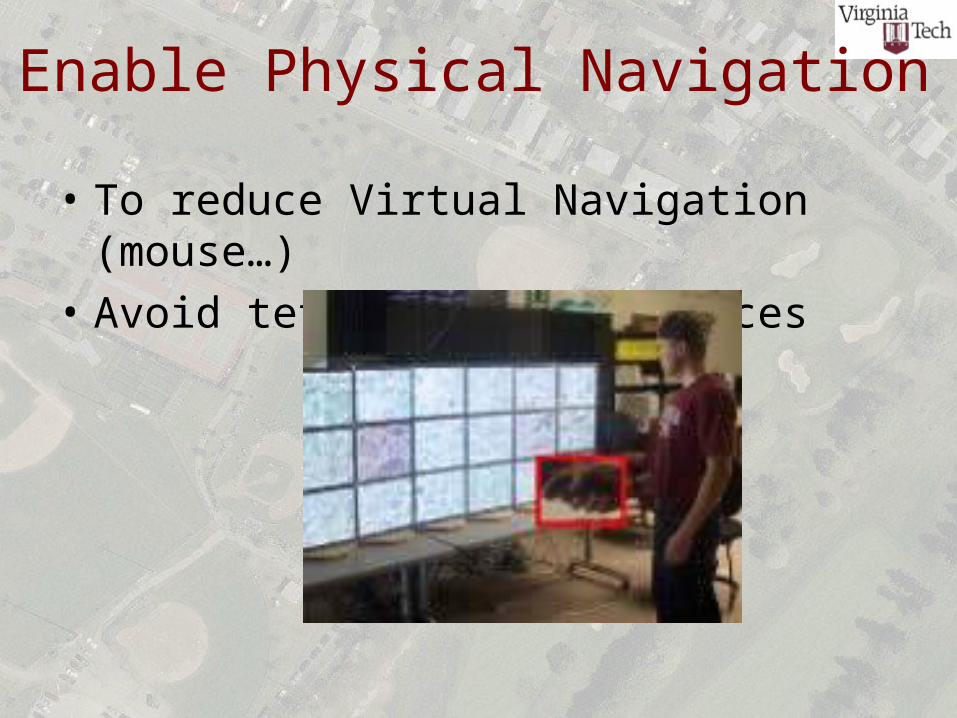
Enable Physical Navigation
• To reduce Virtual Navigation (mouse…)
• Avoid tethered input devices
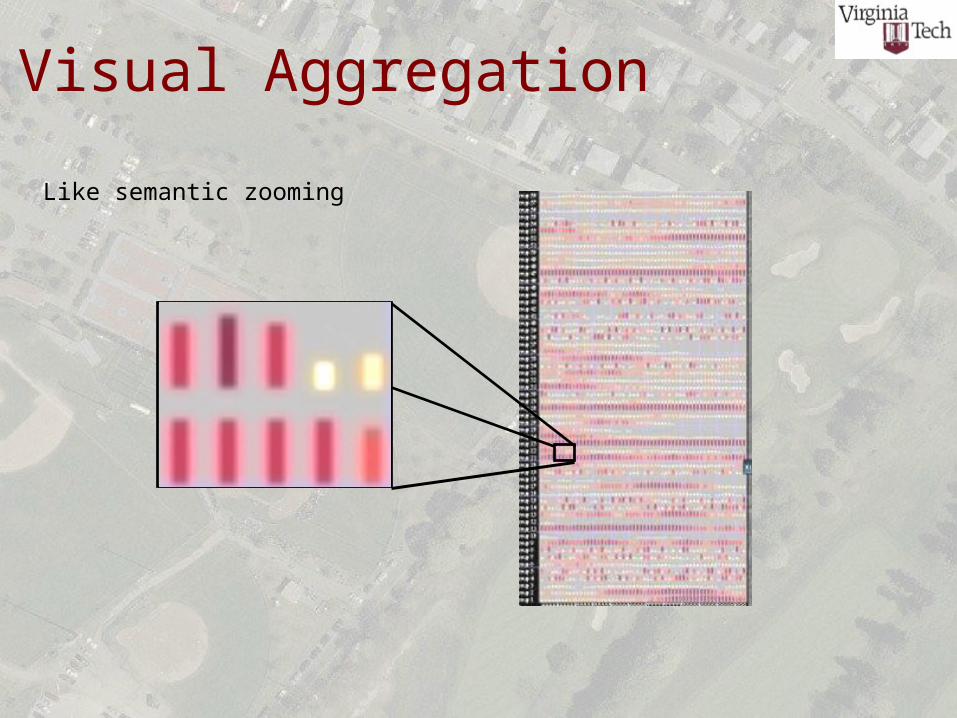
Visual Aggregation
Like semantic zooming
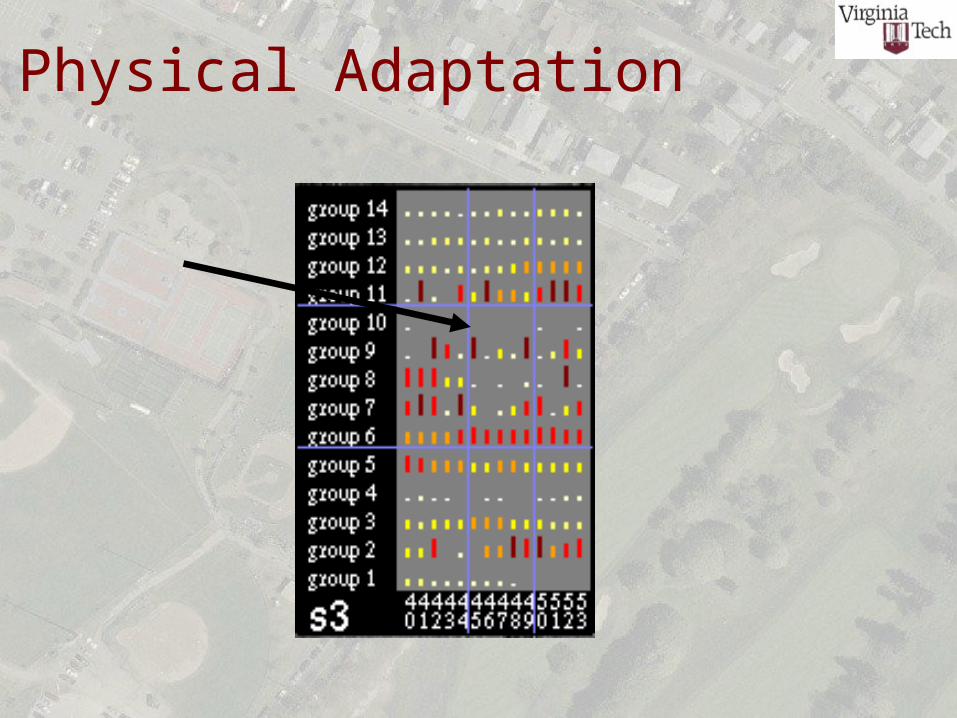
Physical Adaptation
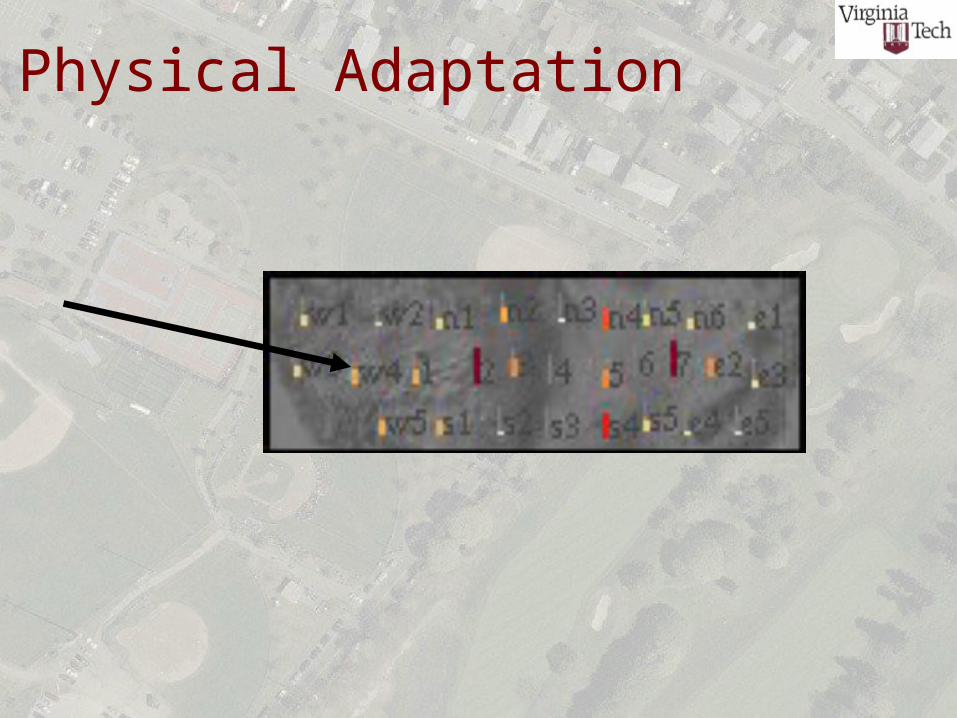
Physical Adaptation
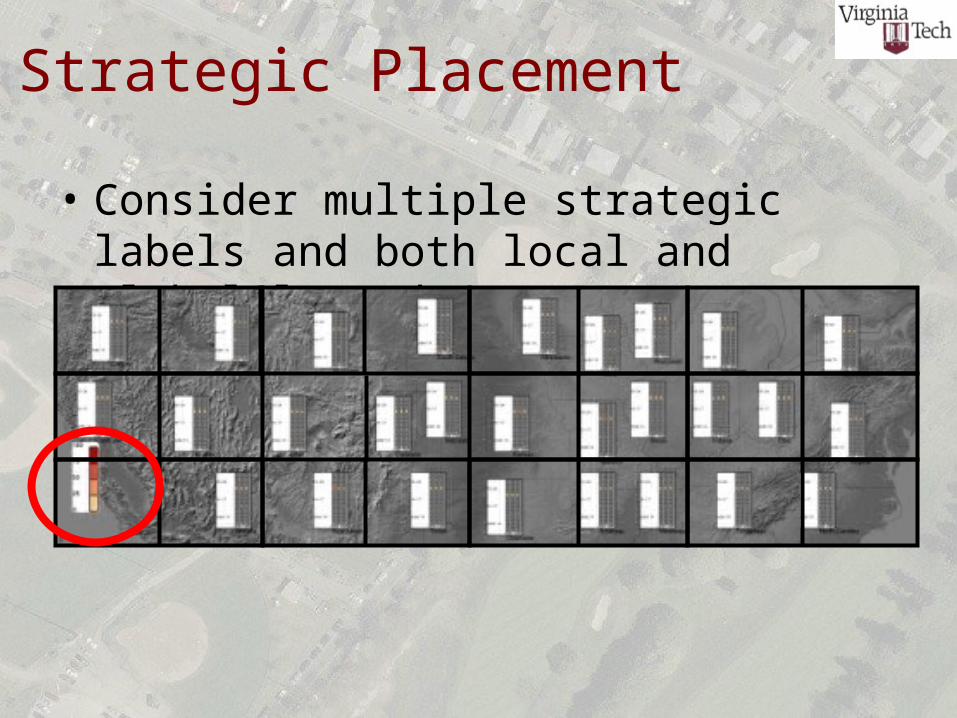
Strategic Placement
• Consider multiple strategic labels and both local and global legends
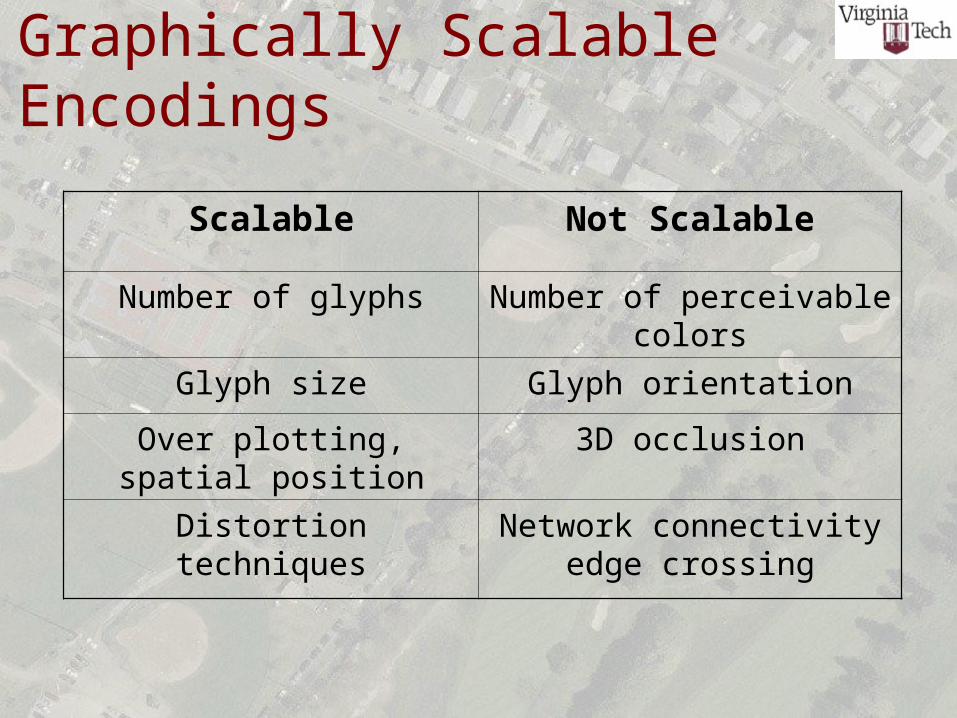
Graphically Scalable Encodings
Scalable Not Scalable
Number of glyphs Number of perceivable colors
Glyph size Glyph orientation
Over plotting, spatial position
3D occlusion
Distortion techniques Network connectivity edge crossing
Today’s paper
• Shupp et al “Size and curvature of Hi-Res displays”
• Presenter: Sunghee Park
Empirical Results
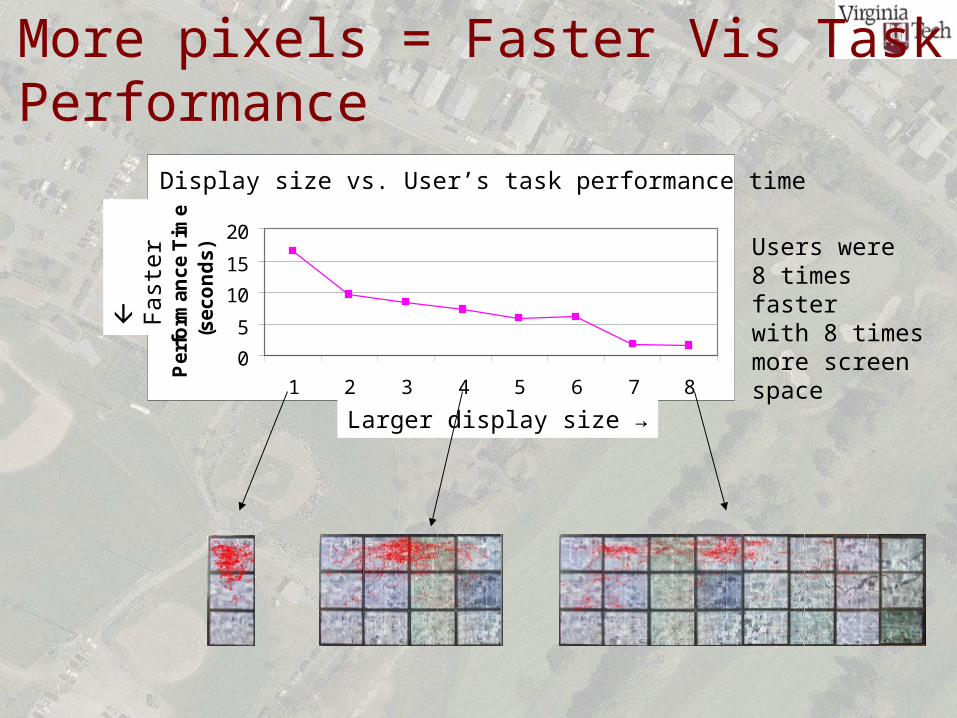
More pixels = Faster Vis Task Performance
Performance - Navigation
0
5
10
15
20
1 2 3 4 5 6 7 8
Pe
rfo
rma
nc
e T
ime
(s
ec
on
ds
)Display size vs. User’s task performance time
F
aste
r
Larger display size →
Users were 8 times faster with 8 times more screen space
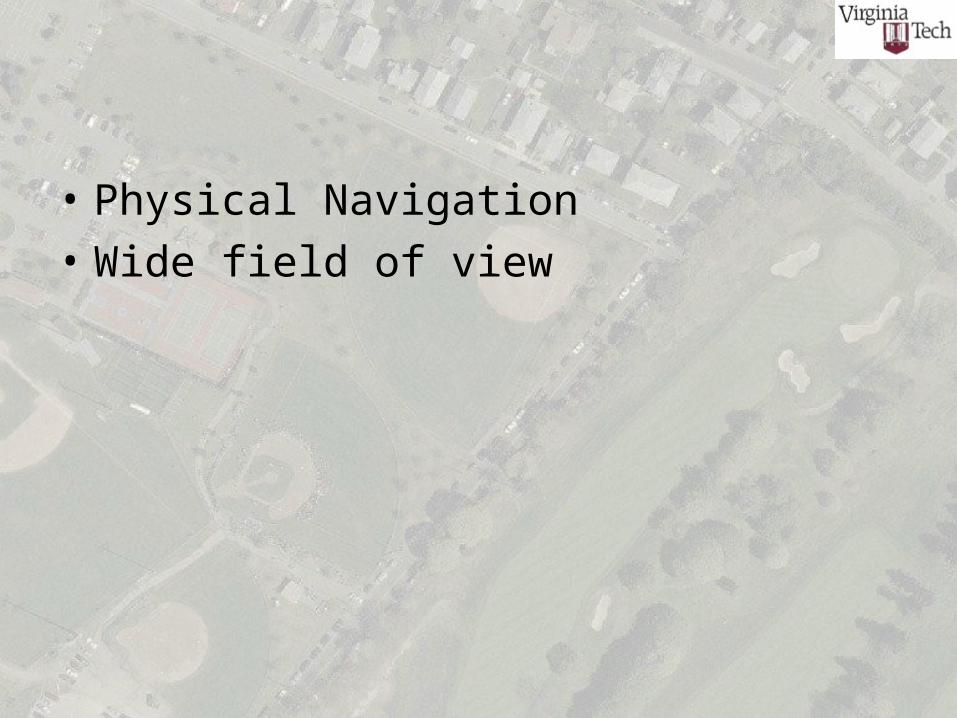
• Physical Navigation
• Wide field of view
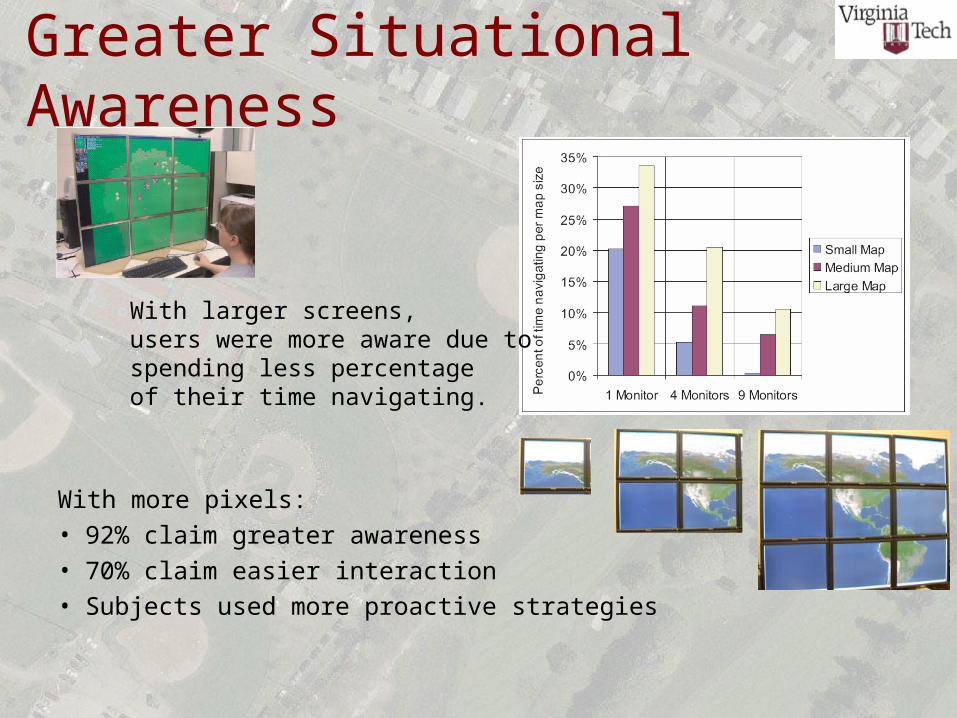
Greater Situational Awareness
With more pixels:• 92% claim greater awareness• 70% claim easier interaction• Subjects used more proactive strategies
With larger screens,users were more aware due tospending less percentage of their time navigating.
1 Monitor1 Monitor
45%45%
1%1%
2%2%
35%35%
8%8%
1%1%
4%4%2%2%
2%2%
4 Monitors4 Monitors
<1%<1%
<1%<1%4%4%
6%6%
9%9%
16%16%
64%64%
<1%<1%
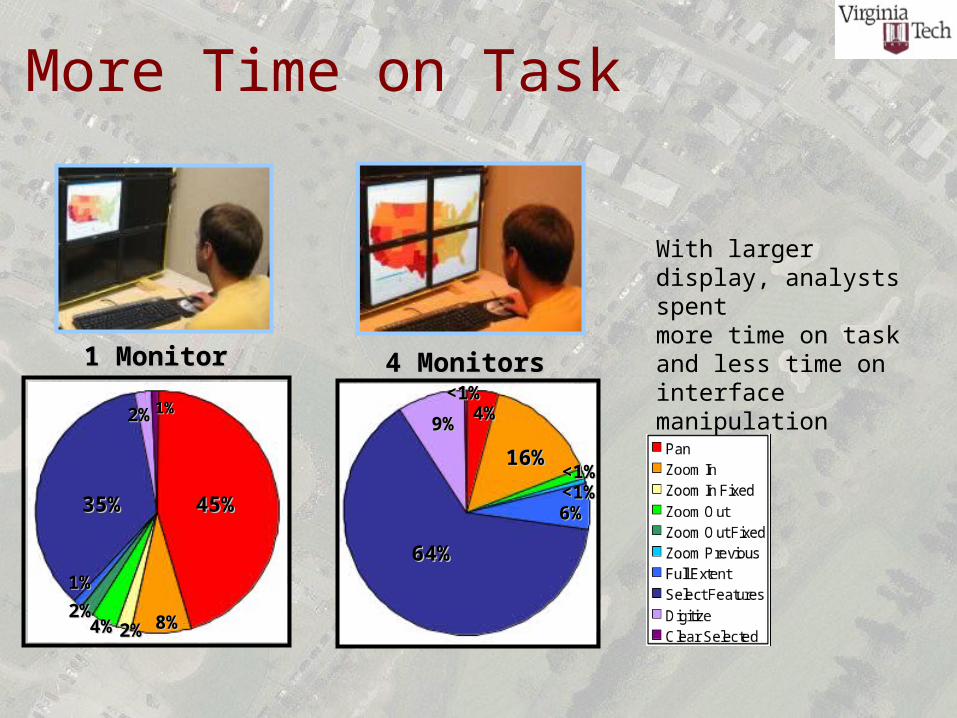
With larger display, analysts spent more time on task and less time on interface manipulation
More Time on Task
# of Monitor(s)# of Monitor(s)
Mo
us
e C
licks
Mo
us
e C
licks
Average # of Mouse Clicks by Display SizeAverage # of Mouse Clicks by Display Size
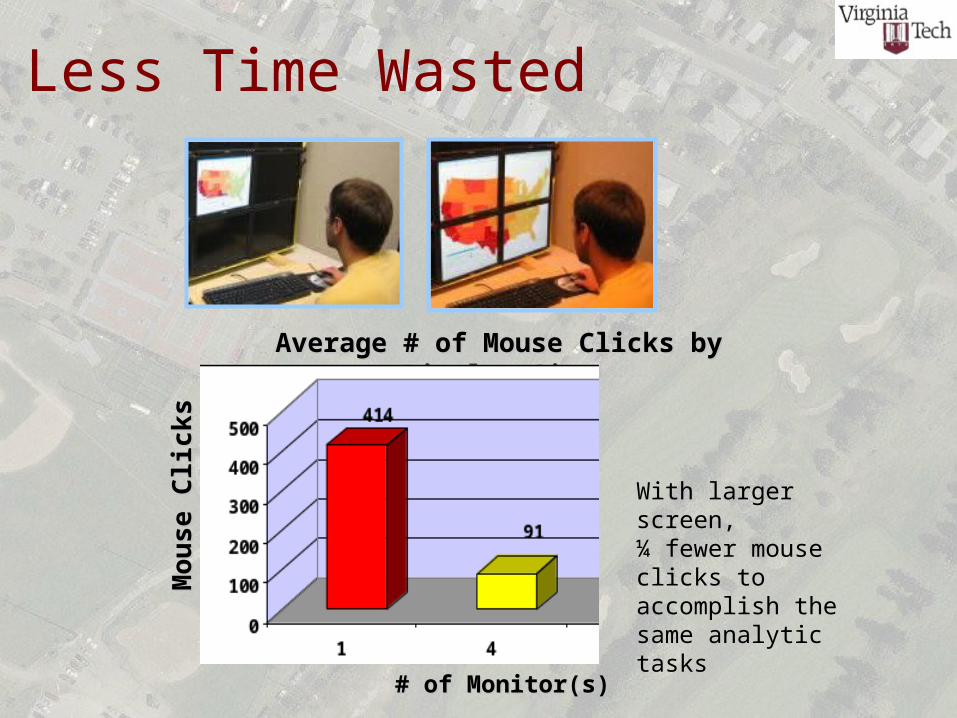
Less Time Wasted
With larger screen,¼ fewer mouse clicks to accomplish the same analytic tasks
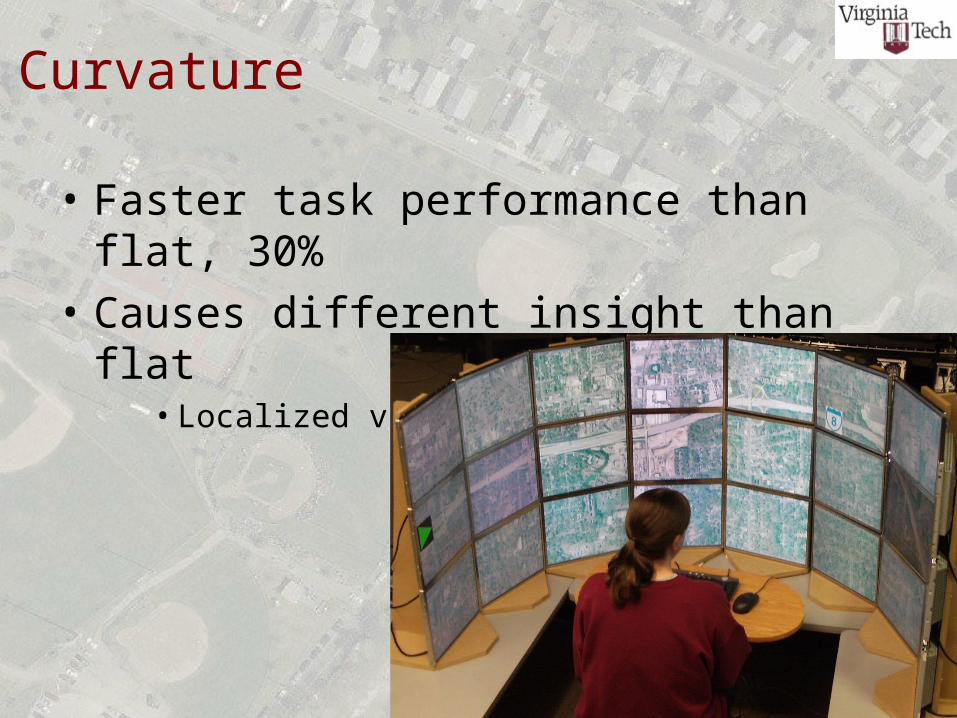
Curvature
• Faster task performance than flat, 30%
• Causes different insight than flat• Localized vs global insights
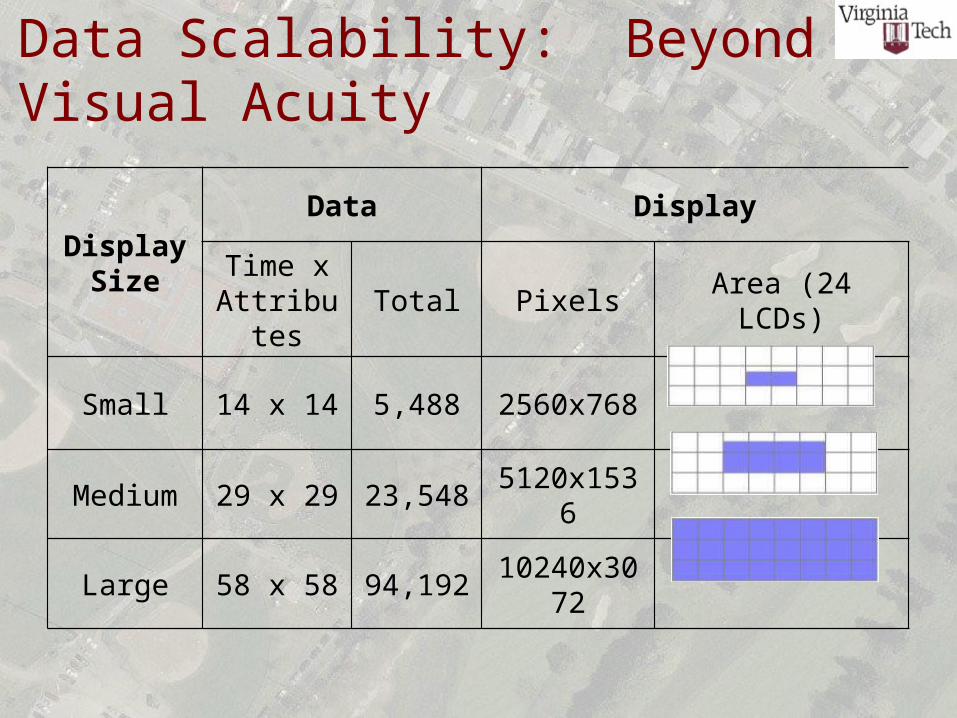
Data Scalability: Beyond Visual Acuity
Display Size
Data Display
Time x Attributes
Total Pixels Area (24 LCDs)
Small 14 x 14 5,488 2560x768
Medium 29 x 29 23,548 5120x1536
Large 58 x 58 94,192 10240x3072
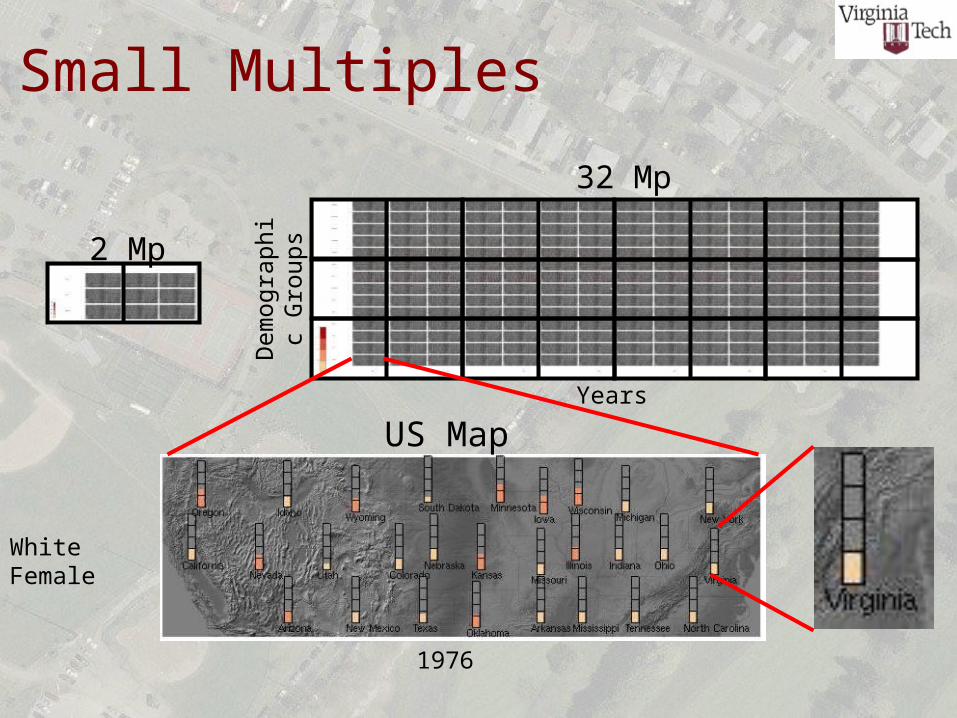
Small Multiples
1976
White Female
2 Mp
32 Mp
Years
Dem
ogra
phic
G
roup
s
US Map
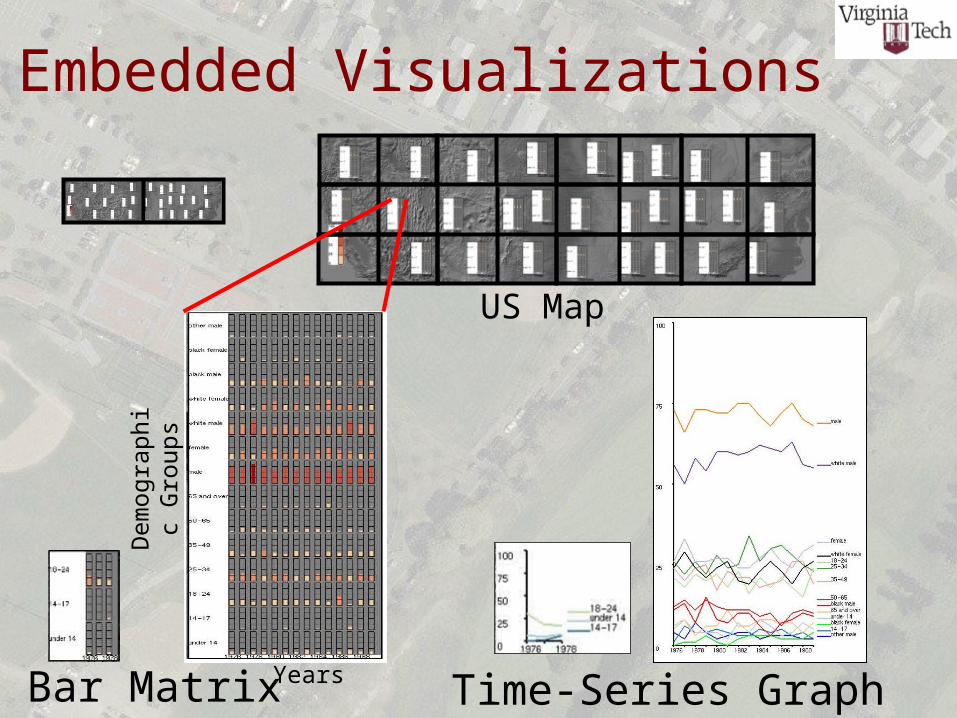
Embedded Visualizations
Bar Matrix Time-Series Graph
Dem
ogra
phic
G
roup
s
Years
US Map

Data Scalability: Beyond Visual Acuity
• Efficient: 17x more data, 2x more time
• Accuracy maintained
• Embedded vis design scales better• Spatial grouping is important on Large Displays
• Used physical navigation & visual aggregation
Publications• CHI 2005: “Effects of Tiled, High-Resolution …”• Interact 2005: “Analysis of User Behavior…”• HCI 2005: “Evaluating the Benefits…for Navigating Maps”• AAG 2006: “Map Reading Efficiency on High-Resolution…”• Graphics Interface 2006: “Viewport Size & Curvature…”• ISI 2006: “Intelligence Analysis using High-Resolution…”• InfoVis 2006: “Scalability of Visualization…” and Demo• Interacting with Computers: “High-Resolution Gaming…”• British HCI: “Applying Embodied Interaction…”• Computers & Graphics: “Realizing Embodied Interaction…”
• IVS: “Designing Info Visualizations for Hi-Res…”• CHI 2007: “Perceptual Scalability with Hi-Res…”• CHI 2007: “Physical vs Virtual Navigation…”


![Dnevni avaz [broj 5764, 15.9.2011]](https://img.pdfslide.net/doc/110x75/577d26241a28ab4e1ea0608f/dnevni-avaz-broj-5764-1592011.jpg)