Embed Size (px)
Citation preview
BNL-112404-2016-JA
Ultra-High Temperature
Continuous Reactors based on Electro-thermal
Fluidized Bed Concept
Sergiy S. Fedorov, Mykhailo V. Gubynskyi, Mykola V. Livitan
National Metallurgical Academy of Ukraine, Dniepropetrovsk, Ukraine
Igor V. Barsukov, Michelle G. Barsukov, Brian S. Wells,
American Energy Technologies Co., Arlington Heights, IL, USA
Upendra Singh Rohatgi
Brookhaven National Laboratory, Upton, NY, USA
Oleksiy G. Gogotsi
Materials Research Centre, Ltd., Kiev, Ukraine
Submitted to the Journal of Fluids Engineering-Transactions of the ASME
March 2016
Department of Nuclear Nonproliferation and National Security
Brookhaven National Laboratory
U.S. Department of Energy DOE Nuclear Nonproliferation Security Administration
Notice: This manuscript has been authored by employees of Brookhaven Science Associates, LLC under
Contract No. DE- SC0012704 with the U.S. Department of Energy. The publisher by accepting the
manuscript for publication acknowledges that the United States Government retains a non-exclusive, paid-up,
irrevocable, world-wide license to publish or reproduce the published form of this manuscript, or allow others
to do so, for United States Government purposes.
DISCLAIMER
This report was prepared as an account of work sponsored by an agency of the
United States Government. Neither the United States Government nor any
agency thereof, nor any of their employees, nor any of their contractors,
subcontractors, or their employees, makes any warranty, express or implied, or
assumes any legal liability or responsibility for the accuracy, completeness, or any
third party’s use or the results of such use of any information, apparatus, product,
or process disclosed, or represents that its use would not infringe privately owned
rights. Reference herein to any specific commercial product, process, or service
by trade name, trademark, manufacturer, or otherwise, does not necessarily
constitute or imply its endorsement, recommendation, or favoring by the United
States Government or any agency thereof or its contractors or subcontractors.
The views and opinions of authors expressed herein do not necessarily state or
reflect those of the United States Government or any agency thereof.
1
Ultra-High Temperature Continuous
Reactors based on Electro-thermal Fluidized
Bed Concept
Sergiy S. Fedorov
e-mail: [email protected]
National Metallurgical Academy of Ukraine, Dniepropetrovsk, Ukraine
Igor V. Barsukov
e-mail: [email protected]
American Energy Technologies Co., Arlington Heights, IL, USA
Mykhailo V. Gubynskyi
e-mail: [email protected]
National Metallurgical Academy of Ukraine, Dniepropetrovsk, Ukraine
Upendra Singh Rohatgi
ASME membership
e-mail: [email protected]
Brookhaven National Laboratory, Upton, NY, USA
Michelle G. Barsukov
e-mail: [email protected]
American Energy Technologies Co., Arlington Heights, IL, USA
Brian S. Wells
e-mail: [email protected]
American Energy Technologies Co., Arlington Heights, IL, USA
Mykola V. Livitan
e-mail: [email protected]
National Metallurgical Academy of Ukraine, Dniepropetrovsk, Ukraine
Oleksiy G. Gogotsi
e-mail: [email protected]
Materials Research Centre, Ltd., Kiev, Ukraine
2
ABSTRACT
This paper presents the results of research and development in high-temperature (i.e. 2,000-
3,000ºС) continuous furnaces operating on the principle of electro-thermal fluidized bed for the
purification of recycled, finely sized carbon materials. The basis of this fluidized bed furnace is
specific electrical resistance and a new correlation has been developed to predict specific
electrical resistance for the natural graphite-based precursors entering the fluidized bed reactor
This correlation has been validated with the data from a fully functional pilot furnace whose
throughput capacity is 10 kg per hour built as part of this work. Data collected in the course of
graphite refining experiments demonstrated that difference between the calculated and measured
values of specific electrical resistance of fluidized bed does not exceed 25%. It was concluded
that due to chaotic nature of electro-thermal fluidized bed reactors this discrepancy is
acceptable. The fluid mechanics of the three types of operating regimes, have been described.
The numerical relationships obtained as part of this work allowed proposing an algorithm for
selection of technological operational modes with large- scale high-temperature furnaces rated
for throughputs of several tons of product per hour. Optimizations proposed now allow
producing natural graphite-based end product with the purity level of 99.98+ wt%C which is the
key passing criteria for applications in the advanced battery markets.
1. INTRODUCTION
In recent years the graphite and carbon industry has been rapidly evolving towards
placing an ever growing emphasis on the production of ultra-high purity materials. The trend has
been largely driven by downstream original equipment manufacturers (OEM), i.e. graphite
customers whose applications increasingly call for the use of refined carbon materials in high-
end products, which these companies sell on the consumer market.
3
One of such applications is the advanced battery market. The majority of batteries
manufactured during the 1970-80s employed carbonaceous grades in their list of materials which
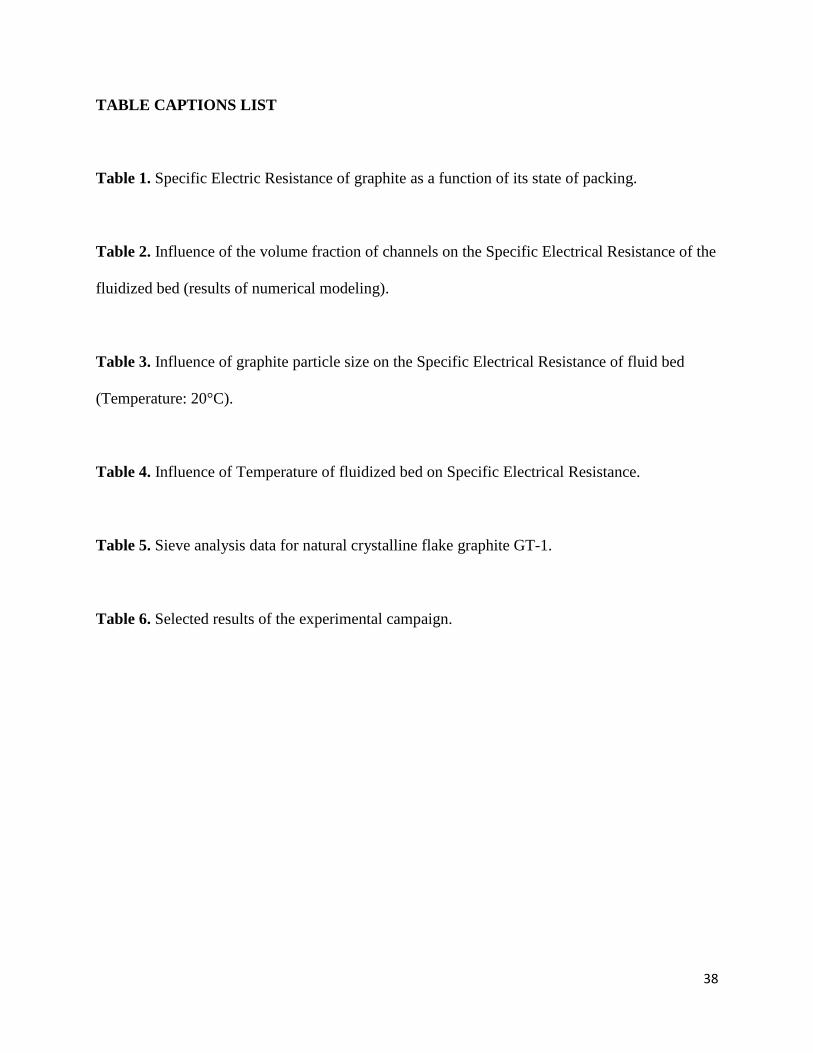
have the purity level on the order of 89 – 99 wt%C [1, 2, 3, 4]. The surface detail of such
materials can be traced to a Scanning Electron Microscopy image presented in Figure 1 (a). The
edge plane of graphite is peppered with trace mineral impurities. When inside a battery, these
impurities may leach out from the surface of graphite, diffuse to the electrode and create an
undesirable evolution of gas. As our modeling shows, internal pressure buildup (Figure 1 (b))
can lead to an eventual catastrophic rupture of a cell (Figure 1 (c)).
Two decades ago the vast majority of aqueous battery systems relied heavily on the use
of mercury and cadmium in their anodes. These heavy metals readily form protective amalgam
on the surface of anode active materials, thus suppressing in-cell gassing. Due to environmental
legislature prohibitions on land disposal of items containing cadmium and mercury, most
consumer battery manufacturers have phased out these additives [5]. Alternative dopants to
anodes were found and typically include Indium, Lead [5], and Bismuth [6].
Primarily as a consequence of the industry transitioning to mercury-free batteries, some
of the most stringent requirements to the purity levels of all battery materials, including carbons,
were imposed. The battery industry has adopted the use of synthetic graphite [7, 8], acid leached
graphite [9, 10] and thermally purified carbons [11, 12]. The required minimum level of purity
for the advanced battery grade carbons is 99.95%C per Loss on Ignition method (see Appendix).
Due to recognized environmental concerns associated with acid purification technologies
[10], as well as the limited availability of feedstock and thermal balance inefficiencies in the
production of synthetic graphite in Acheson furnaces [13], a growing emphasis has been placed
in recent years on the optimization of industrial thermal purification technologies for graphite
4
and carbon [3, 14]. This latter group of technologies are environmentally and economically
beneficial; in addition, their application could promote recycling of fine carbon particles from
spent batteries and prevent them from going to land fill [15, 16].
One of the most efficient technologies for refining graphite and carbon is a continuous
processing of graphitic raw material in electro-thermal fluidized bed furnaces [17-25]. A typical
reactor is shown in Figure 2. The presented furnace design allows for a continuous processing of
granular carbon matter within the temperature range of 2,000 – 3,000°C. In doing so the
following advantages of refining process are achieved:
i. Uniformity of properties of the end product [22, 23, 25];
ii. Ultra-high purity of the resultant refined graphite [11];
iii. Precise control of degree of its graphitization [14, 26];
iv. Ability to operate on recycled sources of energy [25];
v. Continuous materials processing capability [24];
vi. Economic effectiveness [20];
vii. Flexibility of raw material selection, to include raw materials of natural, amorphous and
synthetic origin, as well as recyclable carbon-containing wastes, to include finely sized powdered
matter [23].
Several studies were performed into the hydraulic and thermal regimes of continuous
electro-thermal fluidized bed reactors by these and other authors [18, 21, 22, 23, 24, 25, 27, 28,
38]. Based on the vast experimental data collected in the course of testing of various fluidized
bed furnaces, a number of useful numerical models have been proposed. The models proposed in
the referenced studies describe the processes which take place in the electro-thermal fluidized
bed, specific to processing of industrial carbon and graphite. Some of these models proved to be
5
useful for the industry in that they were used for engineering and scaled up manufacturing of
large scale high temperature reactors and for selection of their operating regimes, irrespective of
the furnace size and raw carbon material employed as the furnace feed.
However, none of the models which exist to date are able to furnish an explicit definition
of the electrical resistivity of the fluidized bed as a function of different operating regimes which
the reactors may be operated at. On the other hand, knowing the value of resistivity of the bed
becomes paramount when the fluid bed equipment is operated and scaled up.
Also, in operating fluidized bed reactors, a gradient of electrical resistivity has been noted
as a function of the fluidization regime and of the location of particles within the bed for a given
regime [23]. The existing state-of-the-art models do not explain why, at times, when more
current is supplied into the fluidized bed of moving graphite particles, the overall power
consumption of the furnace is dropping and subsequently, the purity of the end-product is not
achieved. The work presented in this paper identifies the dynamics of resistivity of the bed as a
function of complex gas and particle flows through the reactor, among the key features
responsible for the observed counterintuitive phenomena.
The work presented seeks to refine the existing electrical and fluid flow models and
considers them synergistically as a complex function not previously considered.
2. Operating Principle of The Continuous Electro-Thermal Fluidized Bed Furnace and
Fluid Mechanics Regimes
The key functional segments of a continuous fluidized bed reactor which was developed
and produced in this study are shown in Figure 2. The interior “hot zone” of the furnace is made
6
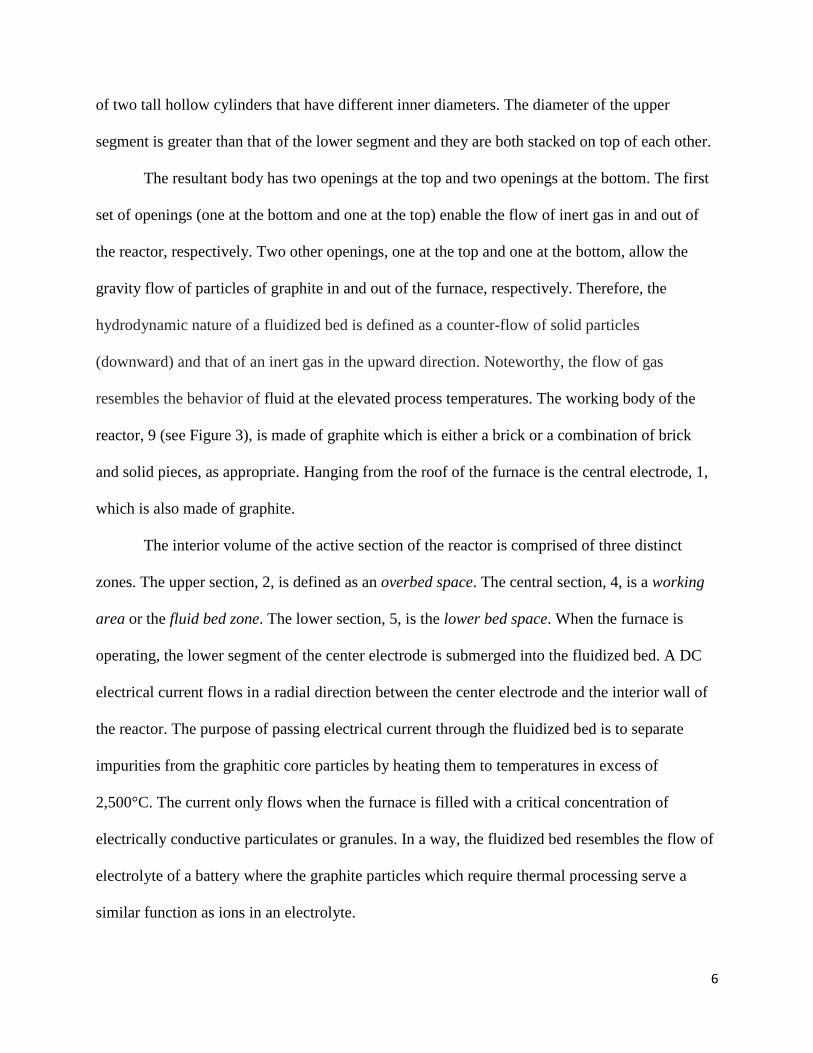
of two tall hollow cylinders that have different inner diameters. The diameter of the upper
segment is greater than that of the lower segment and they are both stacked on top of each other.
The resultant body has two openings at the top and two openings at the bottom. The first
set of openings (one at the bottom and one at the top) enable the flow of inert gas in and out of
the reactor, respectively. Two other openings, one at the top and one at the bottom, allow the
gravity flow of particles of graphite in and out of the furnace, respectively. Therefore, the
hydrodynamic nature of a fluidized bed is defined as a counter-flow of solid particles
(downward) and that of an inert gas in the upward direction. Noteworthy, the flow of gas
resembles the behavior of fluid at the elevated process temperatures. The working body of the
reactor, 9 (see Figure 3), is made of graphite which is either a brick or a combination of brick
and solid pieces, as appropriate. Hanging from the roof of the furnace is the central electrode, 1,
which is also made of graphite.
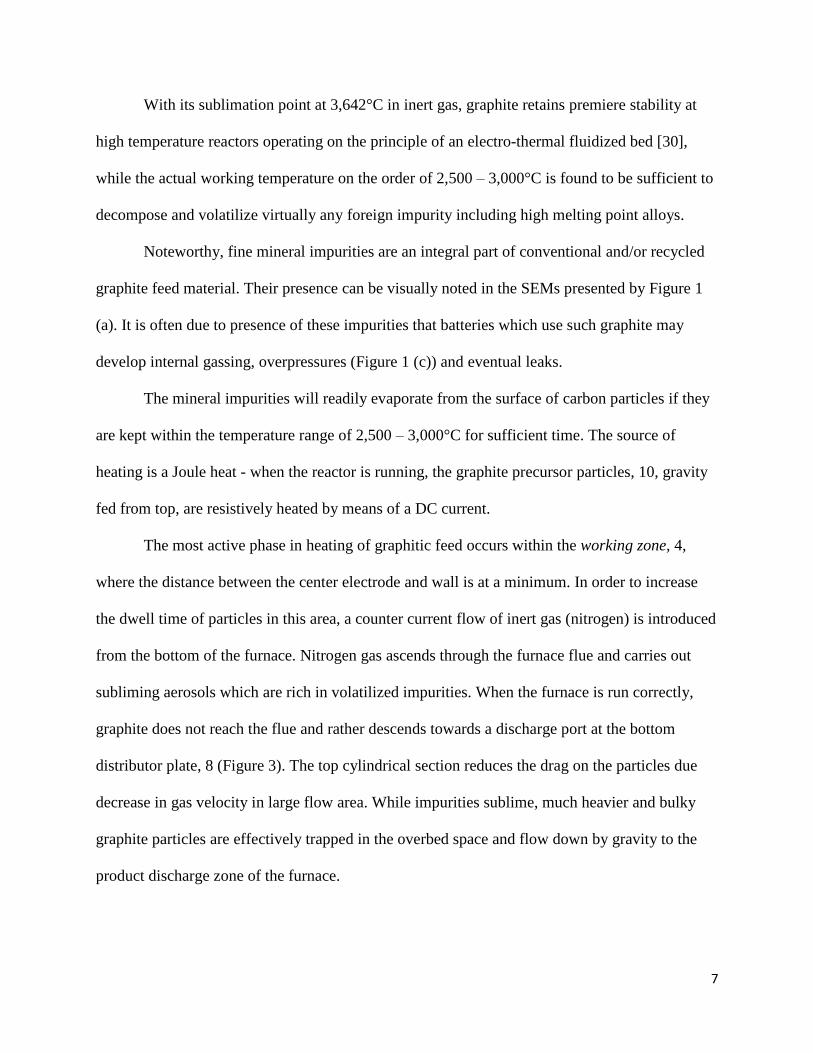
The interior volume of the active section of the reactor is comprised of three distinct
zones. The upper section, 2, is defined as an overbed space. The central section, 4, is a working
area or the fluid bed zone. The lower section, 5, is the lower bed space. When the furnace is
operating, the lower segment of the center electrode is submerged into the fluidized bed. A DC
electrical current flows in a radial direction between the center electrode and the interior wall of
the reactor. The purpose of passing electrical current through the fluidized bed is to separate
impurities from the graphitic core particles by heating them to temperatures in excess of
2,500°C. The current only flows when the furnace is filled with a critical concentration of
electrically conductive particulates or granules. In a way, the fluidized bed resembles the flow of
electrolyte of a battery where the graphite particles which require thermal processing serve a
similar function as ions in an electrolyte.
7
With its sublimation point at 3,642°C in inert gas, graphite retains premiere stability at
high temperature reactors operating on the principle of an electro-thermal fluidized bed [30],
while the actual working temperature on the order of 2,500 – 3,000°C is found to be sufficient to
decompose and volatilize virtually any foreign impurity including high melting point alloys.
Noteworthy, fine mineral impurities are an integral part of conventional and/or recycled
graphite feed material. Their presence can be visually noted in the SEMs presented by Figure 1
(a). It is often due to presence of these impurities that batteries which use such graphite may
develop internal gassing, overpressures (Figure 1 (c)) and eventual leaks.
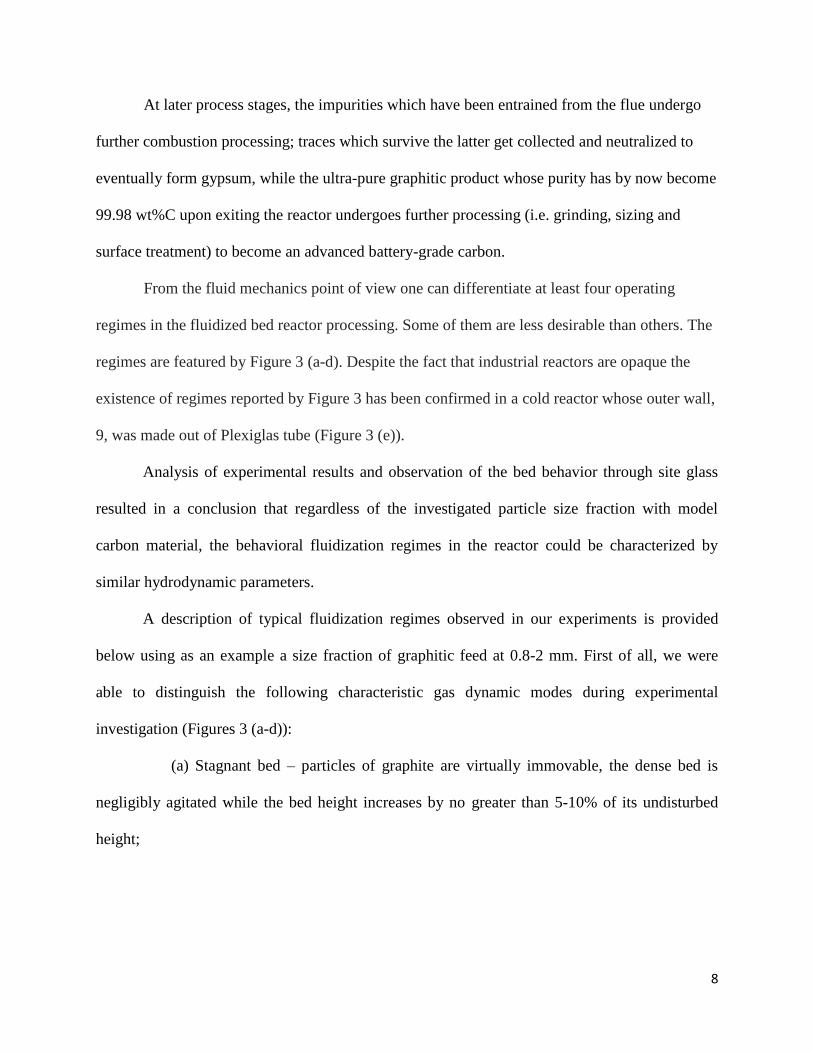
The mineral impurities will readily evaporate from the surface of carbon particles if they
are kept within the temperature range of 2,500 – 3,000°C for sufficient time. The source of
heating is a Joule heat - when the reactor is running, the graphite precursor particles, 10, gravity
fed from top, are resistively heated by means of a DC current.
The most active phase in heating of graphitic feed occurs within the working zone, 4,
where the distance between the center electrode and wall is at a minimum. In order to increase
the dwell time of particles in this area, a counter current flow of inert gas (nitrogen) is introduced
from the bottom of the furnace. Nitrogen gas ascends through the furnace flue and carries out
subliming aerosols which are rich in volatilized impurities. When the furnace is run correctly,
graphite does not reach the flue and rather descends towards a discharge port at the bottom
distributor plate, 8 (Figure 3). The top cylindrical section reduces the drag on the particles due
decrease in gas velocity in large flow area. While impurities sublime, much heavier and bulky
graphite particles are effectively trapped in the overbed space and flow down by gravity to the
product discharge zone of the furnace.
8
At later process stages, the impurities which have been entrained from the flue undergo
further combustion processing; traces which survive the latter get collected and neutralized to
eventually form gypsum, while the ultra-pure graphitic product whose purity has by now become
99.98 wt%C upon exiting the reactor undergoes further processing (i.e. grinding, sizing and
surface treatment) to become an advanced battery-grade carbon.
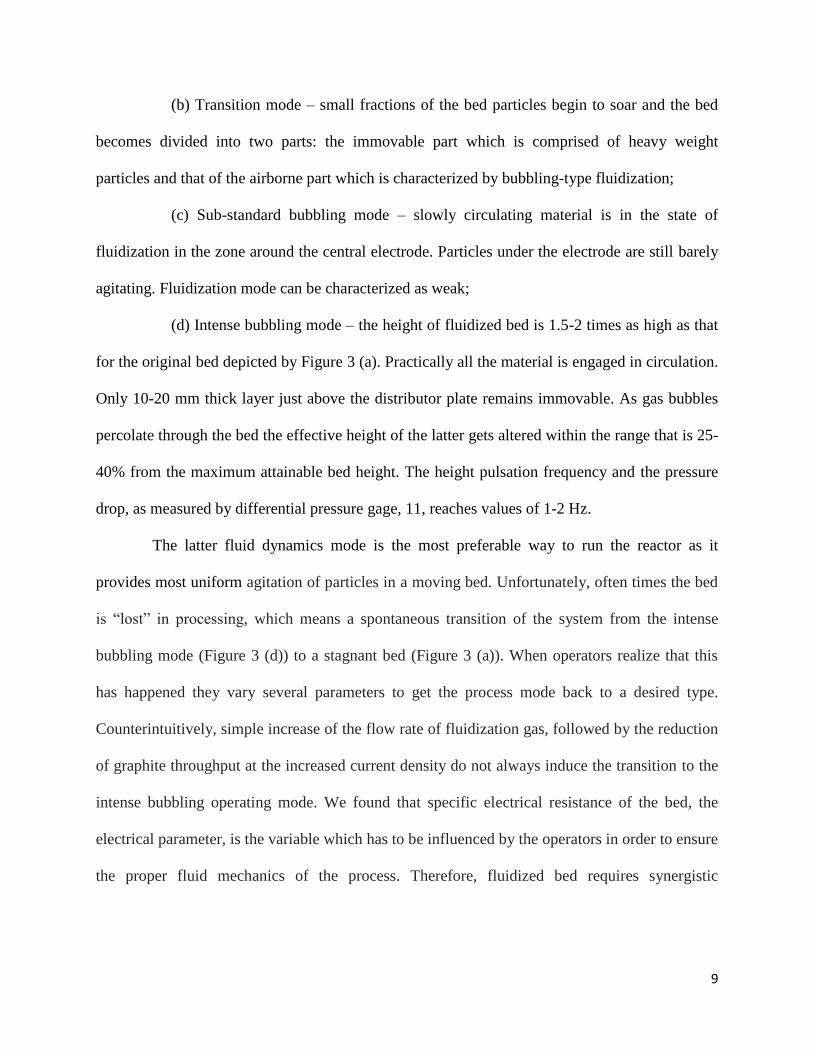
From the fluid mechanics point of view one can differentiate at least four operating
regimes in the fluidized bed reactor processing. Some of them are less desirable than others. The
regimes are featured by Figure 3 (a-d). Despite the fact that industrial reactors are opaque the
existence of regimes reported by Figure 3 has been confirmed in a cold reactor whose outer wall,
9, was made out of Plexiglas tube (Figure 3 (e)).
Analysis of experimental results and observation of the bed behavior through site glass
resulted in a conclusion that regardless of the investigated particle size fraction with model
carbon material, the behavioral fluidization regimes in the reactor could be characterized by
similar hydrodynamic parameters.
A description of typical fluidization regimes observed in our experiments is provided
below using as an example a size fraction of graphitic feed at 0.8-2 mm. First of all, we were
able to distinguish the following characteristic gas dynamic modes during experimental
investigation (Figures 3 (a-d)):
(a) Stagnant bed – particles of graphite are virtually immovable, the dense bed is
negligibly agitated while the bed height increases by no greater than 5-10% of its undisturbed
height;
9
(b) Transition mode – small fractions of the bed particles begin to soar and the bed
becomes divided into two parts: the immovable part which is comprised of heavy weight
particles and that of the airborne part which is characterized by bubbling-type fluidization;
(c) Sub-standard bubbling mode – slowly circulating material is in the state of
fluidization in the zone around the central electrode. Particles under the electrode are still barely
agitating. Fluidization mode can be characterized as weak;
(d) Intense bubbling mode – the height of fluidized bed is 1.5-2 times as high as that
for the original bed depicted by Figure 3 (a). Practically all the material is engaged in circulation.
Only 10-20 mm thick layer just above the distributor plate remains immovable. As gas bubbles
percolate through the bed the effective height of the latter gets altered within the range that is 25-
40% from the maximum attainable bed height. The height pulsation frequency and the pressure
drop, as measured by differential pressure gage, 11, reaches values of 1-2 Hz.
The latter fluid dynamics mode is the most preferable way to run the reactor as it
provides most uniform agitation of particles in a moving bed. Unfortunately, often times the bed
is “lost” in processing, which means a spontaneous transition of the system from the intense
bubbling mode (Figure 3 (d)) to a stagnant bed (Figure 3 (a)). When operators realize that this
has happened they vary several parameters to get the process mode back to a desired type.
Counterintuitively, simple increase of the flow rate of fluidization gas, followed by the reduction
of graphite throughput at the increased current density do not always induce the transition to the
intense bubbling operating mode. We found that specific electrical resistance of the bed, the
electrical parameter, is the variable which has to be influenced by the operators in order to ensure
the proper fluid mechanics of the process. Therefore, fluidized bed requires synergistic
10
optimization of fluid mechanics and that of electro-thermal heat treatment in order to achieve
optimum processing conditions. The specific electrical resistance of the bed is introduced next.
3. The Electric Resistance of The Fluidized Bed as Key Building Block of Numerical Models
for Refining of Electrically Conductive Matter.
The Specific Electric Resistance (SER) is a key building block of numerical models
describing electro-thermal fluidized bed reactors for refining of electrically conductive materials.
A task of designing high temperature reactors for refining graphitic carbon involves the
determination of geometrical parameters of the working zone; to include the heights and
diameters of reactor’s main technological sections, as well as the diameter of the center
electrode. In creating the model, a synergy of hydrodynamic, electro-thermal, chemical and
thermal variables need to be considered.
The correct determination of SER is paramount for determining reactor geometry, the
targeted process temperature and throughput rates. SER represents a complex function of the
material type, particle size, current density, flue gas composition and a number of other process
variables. Generally, SER reduces with the increase of current density, particle diameter,
temperature, homogeneity and the height of the bed. The SER was seen to undergo an increase
by a factor of 2 to 5 as a function of transition from dense to aggregating, or intense bubbling
fluidization defined by Figure 3 (d). The SER of a dense bed is 2 to 3 orders of magnitude
greater than the SER of a stagnant material, Figure 3 (a), and as shown in Table 1.
3.1. The Mechanisms of Electrical Energy Transfer in a Dynamic Fluidized Bed.
11
The processes of resistive heating in a fluidized bed are very complex in nature. Analysis
of literature references [17, 18, 22, 25], as well as our own experimental results suggest that the
Joule heat is generated inside a reactor by at least two mechanisms. The first is due to multiple
particle-to-particle collisions which induce electrical contact and in turn lead to resistive heating
of graphite. The second is as a result of the appearance of short-lived lightning bolts which
percolate the bulk of the bed when chains of particles contacting one another form spontaneous
clusters which then contact neighboring clusters. In other words, constantly agitating particles
collide to form electrically conducting chains; when their contact interrupts, electric micro-arcs
may appear. There could be thousands of them at any given moment of time inside an operating
reactor. One can observe these lightning bolts from the roof of reactor through the site glass.
Another notable factor of fluid bed processing is the presence of gas channels and
bubbles inside the bed. The electrical conductivity of bubbles is very low and must be considered
as an important contributor to the overall electrical conductivity of the bed. Hollow channels are
formed by nitrogen which ascends the working chamber in a counter flow to descending
graphitic particulates. Gas channels are responsible for breaking up electrically conductive
networks formed by graphite. The size and amount of gas bubbles in graphite matter
significantly during processing.
These variables were taken into account in a dual phase model of fluidized bed [35, 36].
This model assumes that the fluidized bed consists of two distinctly different phases: a quasi-
dense graphite phase which resembles liquid emulsion, and the fluidized gas-filled channels
which are free of graphite but surrounded by the latter (Figure 4). Moreover, three areas of the
reactor - the working (active) zone (b); the lower bed (a); and the overbed space (c) can be
clearly distinguished. These have different ratios of gas channels to graphite phase. Pore size
12
distribution and size of channels are also different in each of these zones. For reference, presence
of these areas was clearly observed in the cold reactor with Plexiglas wall (Figure 3).
It is noteworthy that channels allow filtering massive amounts of gas through the bed. In
the densest portion of the bed (section “b” in Figure 4), the throughput rate of fluidizing nitrogen
is close to a critical threshold which defines the stability of a bed. A peculiar fact is that the
dense phase of graphite moves predominantly down the walls formed by graphite lining and the
central electrode; bubbles tend to concentrate predominantly in the center of the bed at some
distance away from the limiting surfaces.
Analysis of Equations (1) and (2) which define porosity of the bed in conditions of such a
non-uniform fluidization indicates that the volume ratio of channels in graphite (density, =
2,050 kg/m3; effective particle diameter, dparticle = 0.1-1.0 mm) is small and possesses a value on
the order of 5 vol % [35,36].
(1)
(2)
Where is the porosity of a non-uniform fluidized bed; = 0.4-0.45 is the critical porosity of
the fluid bed on the border line of maximum achievable stability of the bed; Re and Remf are the
Reynolds numbers for the fluidized bed and dense bed when it is at the threshold of losing its
stability; - is the volume ratio of gas channels.
As the results of our modeling indicate (Table 2), in the above conditions, gas channels
reduce the effective surface area of the fluid bed but their influence is not significant.
13
3.2. Structure of the Fluidized Bed and its Influence on the Value of Specific Electrical
Resistance.
As one can see from the schematic presented in Figure 4, the fluid bed consists of three
main zones. The first segment (a) is located just above the distributor plate. It is known as the
lower bed space. This zone is only few centimeters tall, and this is the area of initial formation of
gas blisters. The working zone of the fluid bed (b) represents main segment of a process reactor.
This is where blisters of gas grow in size, rise and combine to form straight through channels (an
undesirable phenomenon which must be avoided) [36]. There is also an over-bed zone (c) where
bubbles which come to the surface burst, and where the bed gains both returning and fresh
carbon particles.
In the lower bed zone, the fluidized bed is characterized by high porosity. It is typical to
see high homogeneity of graphite particle distribution in this part of reactor. Consequently, local
electrical resistance in this zone is significantly higher than the average resistance for the entire
height of the bed. Borodulya, et al. have experimentally confirmed this to be true [37].
In the over-bed space, clusters of particulates which have burst from the main zone are
fluffed, mostly disaggregated and free-flowing; consequentially this section’s porosity increases
to near 100% and as a result, the electrical current is almost nonexistent.
The only area of the bed which significantly impacts the value of electrical resistance is
the active working zone (b). This is where the most active phase of channel development takes
place. For the given graphite precursor, the regime of forming gas channels corresponds to the
fluidization criteria , which falls in the range of 1< <2. Note:
, where V - Gas velocity,
m/s; - Minimum fluidization velocity, m/s.
14
It should be noted that at an increased gas velocity the system goes into a pulsing
fluidization regime which results in a height reduction of the blister zone; the taller this area, the
more dramatic the increase of SER. The pulsing channels form at a height which corresponds to
a ratio of H/D>1 (H is the height from the distributor plate to the imaginary line where the gas
channels begin to form and D is the effective diameter of a distributor plate at the bottom of
reactor).
3.3. The Effect of Electric Contact Between Colliding Particles.
As it has been mentioned earlier, the working zone of a fluidized bed reactor is filled with
non-homogeneous electrically conductive networks of graphitic particles. These form
spontaneously as individual particles of graphite collide as part of their mechanical movement in
a counter flow of fluidizing gas.
The network resistivity is defined by the contact surface area of two individual granules.
It makes sense to define the above area as a “footprint” of contact between two particles; the
radius of such footprint is assumed to be known and equal to a. This parameter is a function of a
value of compressive pressure between two particles, P; and the number of planes in a particle
which are available for contact, N. It should be understood that in fluid bed reactors particle-to-
particle contact is highly unreliable and short lived. Application of pressure between particles is
ensured by pulsation of the bed. Considering instability of the above parameters, the electrical
resistance of the active layer is a dynamically alternating variable. The frequency of SER
changes is a reflection of the pulsation frequency of the entire system. Our experimental results
suggest that this frequency ranges from 2 to 7 Hz – a range which we have observed on the cold
model described earlier [24] (Figure 3 (e)).
15
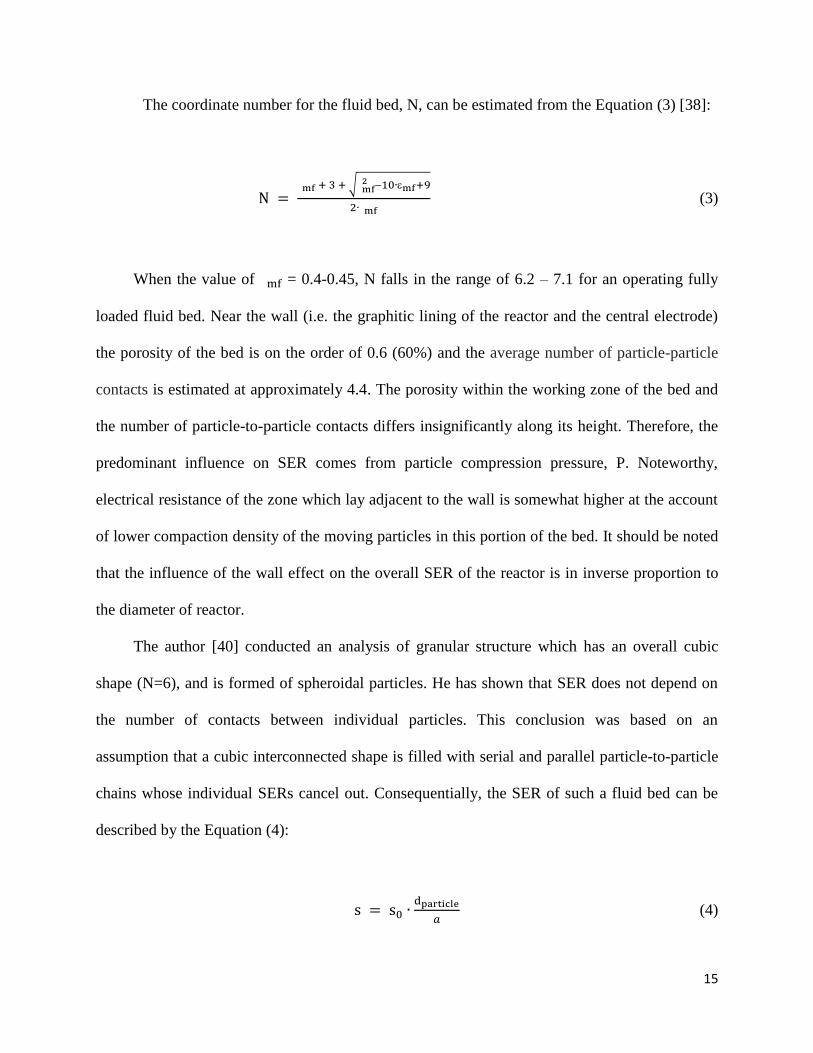
The coordinate number for the fluid bed, N, can be estimated from the Equation (3) [38]:
(3)
When the value of = 0.4-0.45, N falls in the range of 6.2 – 7.1 for an operating fully
loaded fluid bed. Near the wall (i.e. the graphitic lining of the reactor and the central electrode)
the porosity of the bed is on the order of 0.6 (60%) and the average number of particle-particle
contacts is estimated at approximately 4.4. The porosity within the working zone of the bed and
the number of particle-to-particle contacts differs insignificantly along its height. Therefore, the
predominant influence on SER comes from particle compression pressure, P. Noteworthy,
electrical resistance of the zone which lay adjacent to the wall is somewhat higher at the account
of lower compaction density of the moving particles in this portion of the bed. It should be noted
that the influence of the wall effect on the overall SER of the reactor is in inverse proportion to
the diameter of reactor.
The author [40] conducted an analysis of granular structure which has an overall cubic
shape (N=6), and is formed of spheroidal particles. He has shown that SER does not depend on
the number of contacts between individual particles. This conclusion was based on an
assumption that a cubic interconnected shape is filled with serial and parallel particle-to-particle
chains whose individual SERs cancel out. Consequentially, the SER of such a fluid bed can be
described by the Equation (4):
(4)
16
In the above equations, s is the SER of a fluidized bed layer, ·cm; s0 is the SER of a
material being processed; dparticle is the effective average diameter of particles, mm; a is the
radius of a particle-to-particle contact imprint. The author of this work proposes to work with a =
0.008 mm [39]. However, the question remains open as to the applicability of the above value for
packing arrangements which are not cubical. Moreover, the model proposed by Equation (4)
does not factor in the influence of pressure, surface properties of granules, and their resiliency
(e.g. spring back of material in response to the applied pressure).
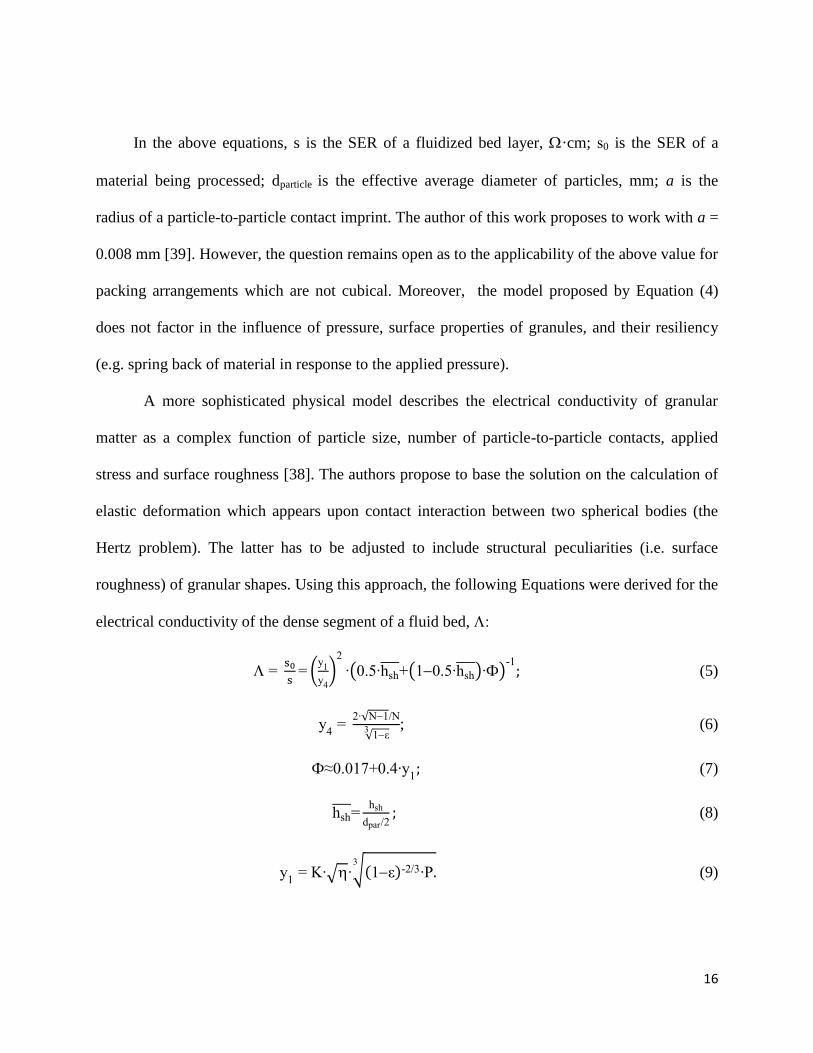
A more sophisticated physical model describes the electrical conductivity of granular
matter as a complex function of particle size, number of particle-to-particle contacts, applied
stress and surface roughness [38]. The authors propose to base the solution on the calculation of
elastic deformation which appears upon contact interaction between two spherical bodies (the
Hertz problem). The latter has to be adjusted to include structural peculiarities (i.e. surface
roughness) of granular shapes. Using this approach, the following Equations were derived for the
electrical conductivity of the dense segment of a fluid bed,
y
y
hsh hsh - (5)
y
; (6)
y (7)
hsh hsh
dpar (8)
y -
(9)
17
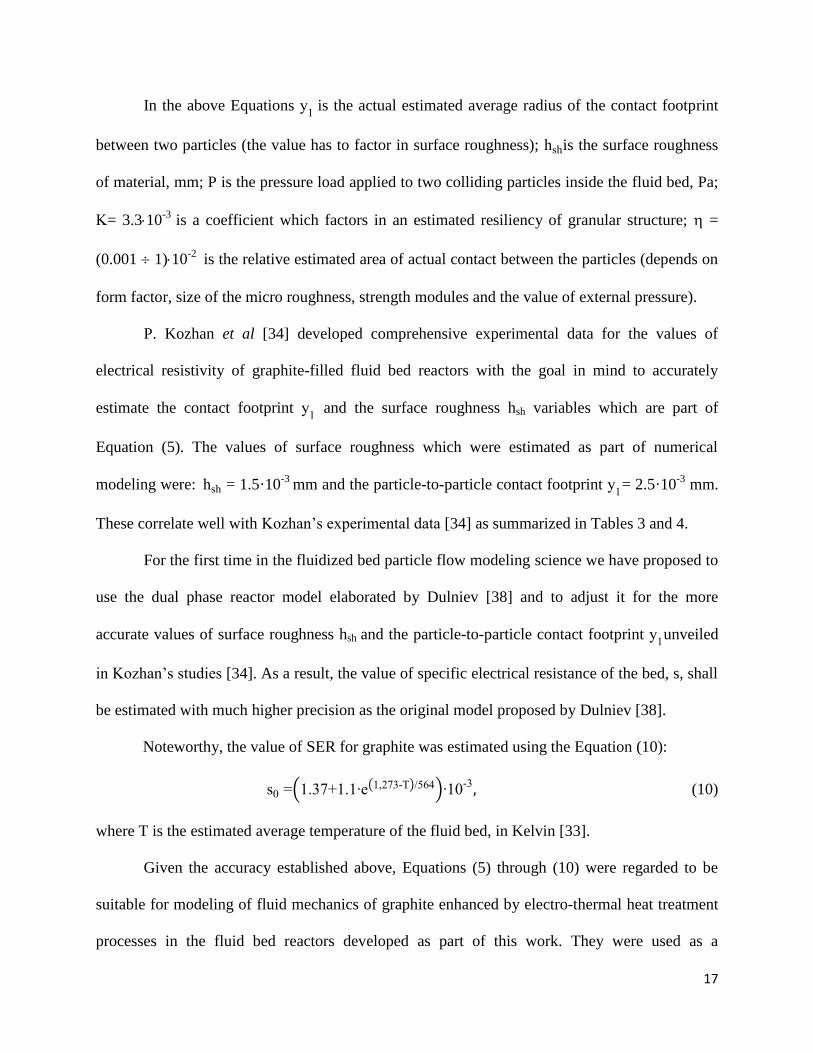
In the above Equations y is the actual estimated average radius of the contact footprint
between two particles (the value has to factor in surface roughness); hshis the surface roughness
of material, mm; P is the pressure load applied to two colliding particles inside the fluid bed, Pa;
= 3.310-3
is a coefficient which factors in an estimated resiliency of granular structure; =
(0.001 1)10-2
is the relative estimated area of actual contact between the particles (depends on
form factor, size of the micro roughness, strength modules and the value of external pressure).
P. Kozhan et al [34] developed comprehensive experimental data for the values of
electrical resistivity of graphite-filled fluid bed reactors with the goal in mind to accurately
estimate the contact footprint y and the surface roughness hsh variables which are part of
Equation (5). The values of surface roughness which were estimated as part of numerical
modeling were: hsh = 1.5·10-3
mm and the particle-to-particle contact footprint y = 2.5·10
-3 mm.
These correlate well with ozhan’s experimental data [34] as summarized in Tables 3 and 4.
For the first time in the fluidized bed particle flow modeling science we have proposed to
use the dual phase reactor model elaborated by Dulniev [38] and to adjust it for the more
accurate values of surface roughness hsh and the particle-to-particle contact footprint y unveiled
in ozhan’s studies [34]. As a result, the value of specific electrical resistance of the bed, s, shall
be estimated with much higher precision as the original model proposed by Dulniev [38].
Noteworthy, the value of SER for graphite was estimated using the Equation (10):
s e - - (10)
where T is the estimated average temperature of the fluid bed, in Kelvin [33].
Given the accuracy established above, Equations (5) through (10) were regarded to be
suitable for modeling of fluid mechanics of graphite enhanced by electro-thermal heat treatment
processes in the fluid bed reactors developed as part of this work. They were used as a
18
foundation for modeling and engineering work. These functions have proven useful for
designing of a pilot furnace with a throughput of 10 kg/hour (Figure 6, section #4.4).
4. RESULTS OF MODELING AND EXPERIMENTS
4.1. Design of a pilot fluidized bed reactor with throughput of 10 kg/hour and description
of experiments.
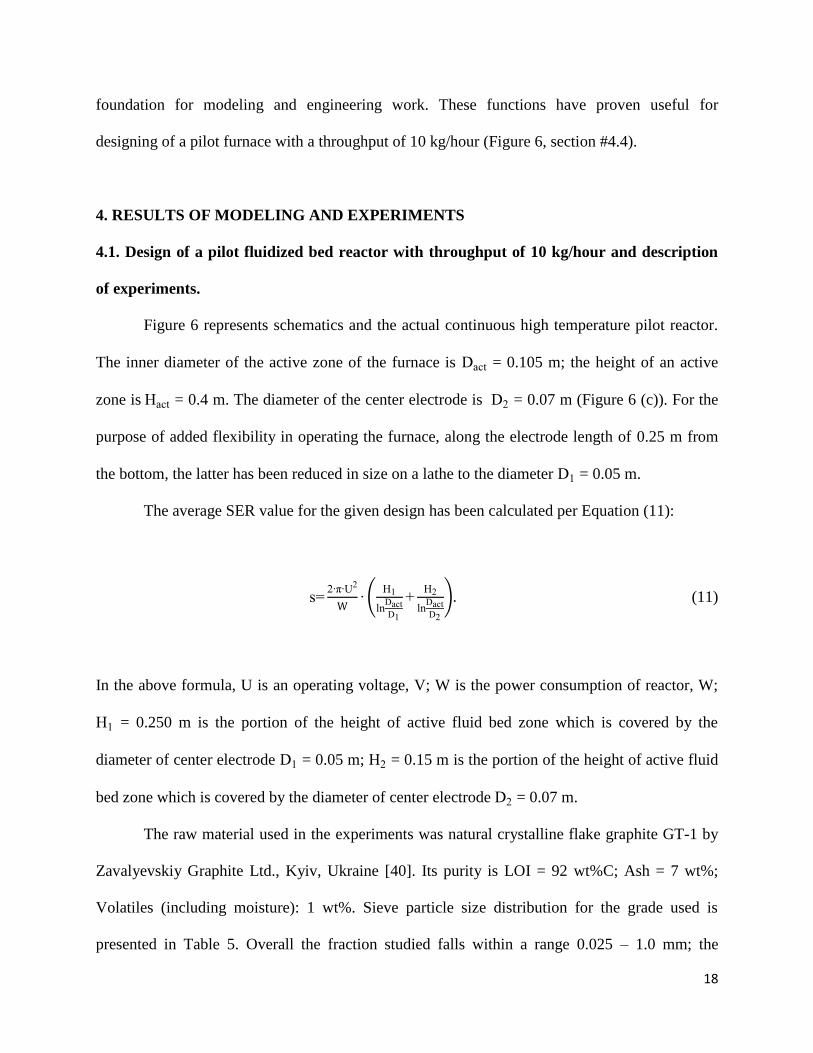
Figure 6 represents schematics and the actual continuous high temperature pilot reactor.
The inner diameter of the active zone of the furnace is ct = 0.105 m; the height of an active
zone is act = 0.4 m. The diameter of the center electrode is = 0.07 m (Figure 6 (c)). For the
purpose of added flexibility in operating the furnace, along the electrode length of 0.25 m from
the bottom, the latter has been reduced in size on a lathe to the diameter = 0.05 m.
The average SER value for the given design has been calculated per Equation (11):
s
ln act
ln act
(11)
In the above formula, U is an operating voltage, V; W is the power consumption of reactor, W;
= 0.250 m is the portion of the height of active fluid bed zone which is covered by the
diameter of center electrode = 0.05 m; = 0.15 m is the portion of the height of active fluid
bed zone which is covered by the diameter of center electrode = 0.07 m.
The raw material used in the experiments was natural crystalline flake graphite GT-1 by
Zavalyevskiy Graphite Ltd., Kyiv, Ukraine [40]. Its purity is LOI = 92 wt%C; Ash = 7 wt%;
Volatiles (including moisture): 1 wt%. Sieve particle size distribution for the grade used is
presented in Table 5. Overall the fraction studied falls within a range 0.025 – 1.0 mm; the
19
average particle diameter is 0.25 mm.
The SER of graphite GT-1 was determined experimentally per [41]. In accordance with
the method, a specific size fraction and volume of sample is confined under load in a non-
conductive cylindrical mold by two metal electrodes. Unidirectional resistance is measured
between these electrodes using a Kelvin bridge. Resistivity is calculated and reported in ·cm. It
measured 7.1-9.810-3 ·cm – a value which agrees well with an estimate calculated by Eq. (10).
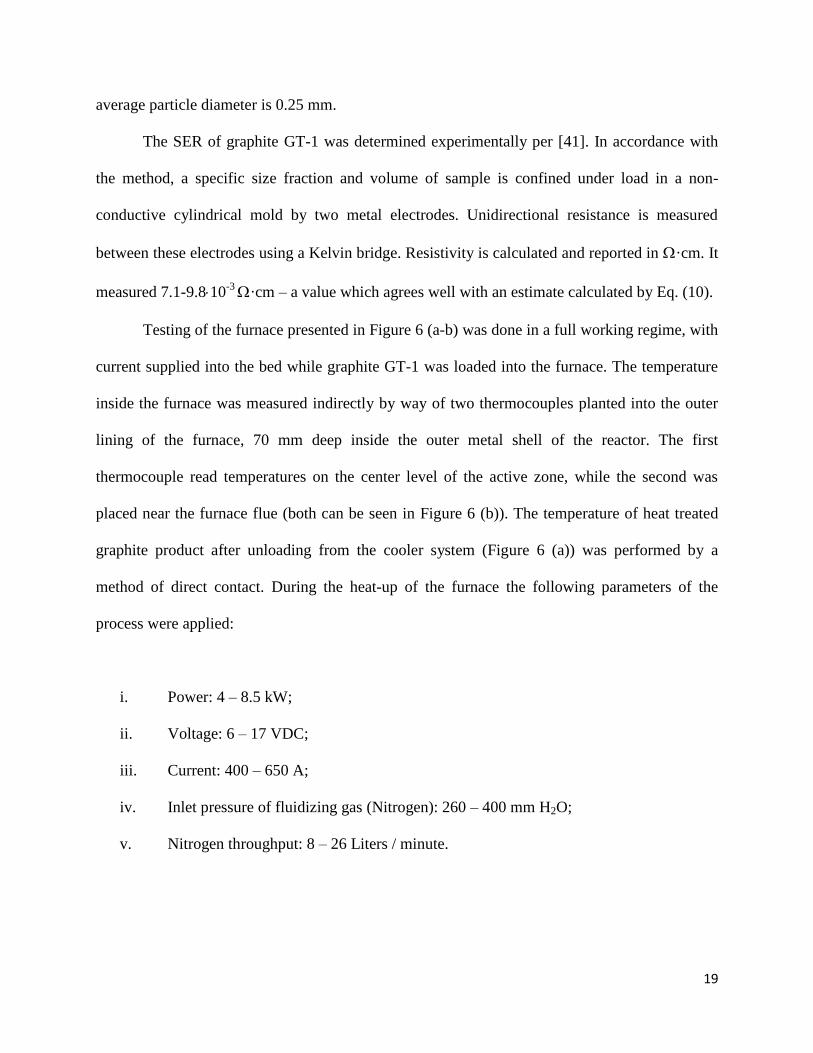
Testing of the furnace presented in Figure 6 (a-b) was done in a full working regime, with
current supplied into the bed while graphite GT-1 was loaded into the furnace. The temperature
inside the furnace was measured indirectly by way of two thermocouples planted into the outer
lining of the furnace, 70 mm deep inside the outer metal shell of the reactor. The first
thermocouple read temperatures on the center level of the active zone, while the second was
placed near the furnace flue (both can be seen in Figure 6 (b)). The temperature of heat treated
graphite product after unloading from the cooler system (Figure 6 (a)) was performed by a
method of direct contact. During the heat-up of the furnace the following parameters of the
process were applied:
i. Power: 4 – 8.5 kW;
ii. Voltage: 6 – 17 VDC;
iii. Current: 400 – 650 A;
iv. Inlet pressure of fluidizing gas (Nitrogen): 260 – 400 mm H2O;
v. Nitrogen throughput: 8 – 26 Liters / minute.
20
Using the above process parameters we were able to achieve the temperature of graphite on the
order of 800°C. The results of this start-up run calculated vs. actual are summarized in Table 6.
4.2. Discussion into the significance of estimated SER value.
Some of the published data of experimental studies in the electro-thermal fluidized bed
reactors [17, 18] points out that the reduction of SER takes place with an increase of current
density supplied into the bed. The physics of such phenomena are not completely understood.
The author of [18] links these phenomena to the change of a mechanism of electrical
conductivity within the fluidized bed from pure particle-to-particle contact to contact-ionizing
mechanism. Assuming there is room for ionization of gas inside the fluidized bed reactors at the
ultra-high temperatures, as well as recognizing the fact that Equation (5) may need to be adjusted
for processes which are accomplished in the temperature range of 2,000-2,800°C (i.e. thermal
purification of graphite for advanced batteries), we applied a regression relationship for SER to
the experimental data [18] as related to process temperature and current density , Eq. (12):
s = 0.01(84.711 –2.59310-2T – 46.854i + 1.20510
-2ti) (12)
This relationship is believed to be accurate for graphitic carbons (dparticle = 0.130 mm) in
the temperature range T = 0 – 2,800°C and current density i = 0.004 – 1 A/cm2. The Equation is
valid under the assumption that an unrestricted fluidization in its classic form, such as the one
described by Figure 3 (d), is taking place in a reactor.
4.3. Description of the Numerical Methodology of Developing Large Scale Electro-thermal
21
Fluidized Bed Reactors.
In developing high temperature reactors of the fluid bed type, one has to consider a
complex task where geometrical parameters of the reactor are tied in with the properties of
available power supply, and simultaneously tailored for the properties of material being
processed and fluid mechanics associated with its flow through the furnace. Overall, the
sequence of designing industrial fluidized bed reactors consists of the following steps:
1. Select working geometry of the furnace, taking into account the desired furnace
throughput, specific types and properties of available raw materials, hydrodynamics of the
fluidized bed as a function of required dwell time and process temperature;
2. Engineering of the external geometry of the furnace to include the thickness of thermal
insulation, its type, the way of placing thermocouples and the ways of feeding precurosrs,
fluidized gas, elutriating the off- gas and collecting / cooling the product;
3. Determine energy efficiency properties of the reactor (perform material and heat
balance calculations for the given throughput and reactor dimensions);
4. Calculate main aspects of technology to include: current, voltage, throughput of
material and that of the fluidizing gas. At this stage the power supply for the furnace is selected.
Refining answers to the above questions over several iterations ultimately leads to
optimization of the reactor design as well as regimes of its operation. Few specific examples
follow.
When it comes to selection of processes of heating regimes for the reactor, we have
developed an iterative algorithm which is based on the analysis of Voltammograms of the
electro-thermal fluidized bed, the furnace, and the power supply. All three have to be considered
simultaneously in conjunction with each other as introduced by Figure 7.
22
The Voltammograms of the electro-thermal fluidized bed at the given temperature
(T=constant) is represented by solid black lines in Figure 7. These lines are plotted from the data
feeds generated from Equations (13) and (14):
I
(13)
s ln
(14)
Where is the diameter of the active zone of the furnace; electrode
is the diameter of the center
electrode in meters; is the height of the working zone of the reactor, m; s is the SER of a
fluidized bed which has been derived from (12).
The Voltammograms of the furnace at the constant throughput rate (G=constant) are
outlined by red curves. Values of working current and voltage are selected from the energy input
required. The latter are calculated from the heat balance of the reactor for varying temperatures
of heat treatment, and factoring in the values of electrical resistivity of fluid bed, as calculated
from Eq. (12):
(15)
(16)
In the above expressions,
, (17)
where is the actual heat carried out by the finished product (i.e. refined graphite); is the
physical heat taken from the reactor by Nitrogen gas; is the heat emitted by fine dust exiting
the furnace; is the actual heat value generated by volatile matter (organics and moisture);
23
is the heat generated by vapor (considering the loss resulting through the aerosol phase)
and is the heat loss due to external cooling.
Due to the fact that SER calculated per formula Eq. (12) is a function of current density,
one needs to solve Equation (15) using an iterative numerical approach.
Green curves in Figure 7 refer to voltammograms of power input of the furnace, W. A
condition W = constant is typically assumed in operating reactors. Using graphs in Figure 7 and
also Equation (17) one can determine parameter W and derive the required Voltage, U and
current, I from the latter:
(17)
The voltammograms of power supply are shown in Figure 7 by blue lines. In this
particular example we show a non-flexible power supply whose Us(I) = constant. It should be
understood that there is a great variety of power supplies on the market and in some the voltage
may not be a fixed line. Overall, the area of the graph presented by Figure 7, where red and black
curves intersect (points a and b), should be regarded as characteristic points which define the
relationship between the voltage and current required in order to achieve the desired process
temperature for a given throughput rate, and chosen reactor geometry (i.e. diameter of center
electrode, the height and diameter of working zone and given thickness of thermal insulation).
Correspondingly, the voltamogram of power supply has to correspond to the working regimes
defined by points a and b on the graph.
Proposed methodology has been used in the development and construction of a fully
functional continuous electro-thermal fluid bed reactor with the throughput of 10 kg/hour (Figure
6 (b)). Numerical calculation of furnace parameters specific to thermal purification of flake
graphite GT-1 at the temperature of 2,000°С required the following engineering inputs: I = 600
24
A, U = 27 VDC; = 0.35 m; = 0.105 m, = 0.06 m.
5. CONCLUSIONS.
This paper shows development of model for specific electrical resistance for fluidized
bed accounting for basic mechanism of particle to particle interaction and its application to
industrial design.
High temperature refining of graphite in continuous electro-thermal fluidized bed
reactors described in this paper reliably produce graphite whose high purity of 99.99% by weight
of carbon (see Appendix) . This technology is environmentally benign, economically viable and,
scalable to the industrial volumes.
Besides the complex fluid mechanics of the counter flow system of the reactor which is
comprised of ascending flow of fluidizing Nitrogen gas and a descending flow of graphite
particles, one of the key critical parameters of an operating electro-thermal fluid bed is the value
of specific electrical resistance (SER) of the bed. An enhancement into the dual phase numerical
model and a methodology for estimating the value of SER specific to fluidized bed reactors for
purification of natural flake graphite has been presented. The legacy model by Dulniev [38] was
not sufficiently accurate because it did not factor in the values of surface roughness, hsh =
1.5·10-3
mm and the particle-to-particle contact footprint y = 2.5·10
-3 mm as proposed in studies
by Kozhan [34]. The upgraded model (Eq. 12) increased the accuracy of description of SER in
dynamic fluidized bed processes within +/- 25% of the experimentally determined value which is
the highest accuracy to date and deemed acceptable to chaotic nature of particle agitation in the
intense fluidized bed. The model which led to the above result is a dual phase fluidized gas /
particle counter-flow where an emulsified dense graphite bed moves along the surfaces formed
25
by the center electrode and reactor lining, and a gas-channels-filled with particles in the middle
of the bed.
Application of the above model was verified in the experiments. The model was
determined to be accurate with a maximum 25% deviation from actual test data, which is a great
result considering that processes of fluidized beds are highly complex systems.
Using this model authors have derived a regression expression which allows estimating
values of SER for particles of flake graphite in a temperature range from 0 to 2,800°C, and for
the current density i = 0.004-1.0 А/сm2
A methodology for designing fluidized bed reactors for purification of carbon has been
proposed. This methodology will allow for estimation of the geometry, key dimensional aspects,
current, voltage, power, as well as specific properties of the power supply for the reactor for
desired furnace throughput rate, operating temperature and material dwell time in the hot zone.
The basis for the reactor design is the creation of voltammograms for the fluidized bed, furnace,
and power supply, and plotting them on the same graph so as to identify overlapping areas and
operating in the zones where these voltammograms intersect.
Based on the above models, a fully functional prototype reactor whose throughput rate is
rated at 10 kg/hour has been built, and tested. Thermally purified material was analyzed using
the loss on ignition test tailored for graphite, and by the Scanning and Optical microscopy
methods. Please see Addendum for description of the above methodology.
ACKNOWLEDGMENT
This paper is being submitted to special issue of Journal of Fluids Engineering in honor of Prof.
Clayton Crowe. The support for Dr. Rohatgi and team from Ukraine came from the US
26
Department of Energy, NNSA under the Global Initiatives for Proliferation Prevention (projects
BNL-T2-372-UA and STCU-P482). The support on various stages of this project from Dr.
Joseph E. Doninger of Dontech Global, Inc. in Lake Forest, IL, USA is greatly appreciated.
Additionally, we would like to acknowledge scientific contributions by the engineering group
represented by Leonid M. Usatiuk, Vitaliy I. Lutsenko, Yaroslav O. Tyrygin, Konstantyn A.
Nikitenko and Vadim Yu. Pisarenko of M.K. Yangel Special Design Bureau “Yuzhnoe” in
Dniepropetrovsk, Ukraine who took part in this project. Author I.B. submits this work in an
eternal memoriam of Mr. Wesley Krueger, whose dogged persistence, technical acumen and
deep understanding of electro-thermal fluidized bed reactors for carbon refining made this
technology viable in the battery marketplace. This paper also recognizes contributions of many
colleagues in Ukraine who went to defend their country in the wake of events of 2014-15. We
hope that time will bring true peace and prosperity to this wonderful central European country
and to its scientific community.
NOMENCLATURE
a – Nominal radius of an imprint formed when one particle contacts a neighbor particle, mm;
D - the effective diameter of a distributor plate at the bottom of reactor;
ct - Inner diameter of the active zone of the furnace, m;
- Diameter of the upper segment of central electrode, m;
– Diameter of the lower segment of central electrode, mm;
– Nominal diameter of central electrode, mm;
dparticle - Nominal average diameter of particles, mm;
- Volume ratio of gas channels;
27
- Porosity of a non-uniform fluidized bed;
- Critical porosity of the fluid bed on the border line of maximum achievable stability of the
bed;
G - Furnace throughput, kg/h;
H - The height from the distributor plate to the imaginary line where the gas channels begin to
form;
act - Height of active fluidization zone inside the furnace, m;
– Length of an active zone along central electrode with a diameter D1, m;
– Length of an active zone along central electrode with diameter D2, m;
hsh - Surface roughness of material being refined, mm;
I – Amperage, A;
i - Current density, A/cm2;
K - Coefficient which factors in an estimated resiliency of granular structure;
- Relative electric conductivity of the dense fluidized bed;
N - Coordinate number (number of contact points between moving particles);
- Relative estimated area of actual contact between the particles;
P - Pressure load between two colliding particles, Pa;
- Actual heat released by the finished product, kW;
- Physical heat released by Nitrogen, kW;
-Heat released by dust exiting the furnace, kW;
-Actual heat released by subliming volatile matter (organics and moisture), kW;
- Heat released by vapor (considering the loss resulting through the aerosol phase), kW;
- Heat loss due to external cooling, kW;
28
Rfb – Electrical resistance of the fluidized bed, ;
Rpb –Electrical resistance of the stagnant bed of graphite, ;
- Reynolds numbers;
- Reynolds numbers at a gas velocity ;
- Density, kg/m3.
s - Specific electrical resistance (SER) of a fluidized bed layer, ·cm;
s0 - SER of a material being processed (graphite), ·cm.
T – Temperature, °C;
U – Operating voltage of fluidized bed reactor, V;
V - Gas velocity, m/s;
- Minimum fluidization velocity, m/s;
- Fluidization criteria;
- Kinematic gas viscosity, m2/s;
W - Power consumption of reactor, kW;
Wt%C- Percentage of carbon by weight
y - Actual estimated average radius of the contact footprint between two particles;
REFERENCES
[1] Grades of graphite and specifications: Product GE-3, 2012, Product Brochure. Zavalyevskiy
Graphite Ltd., Kyiv, Ukraine.
[ ] “Signature Graphite and Carbon roducts 98 9 ” 998 roduct Brochure Superior
Graphite Co., Chicago, IL, USA.
29
[3] Barsukov, I., Gallego, M., and Doninger, J., “ ovel materials for electrochemical
power sources” Introduction of UREBLACK® Carbons, J. Power Sources,153,pp. 288-299.
[4] “Analytical procedures for IM EX® Graphite and Coke” 8 In “A Synopsis of
Analytical Procedures”, Timcal, Ltd. Group, Bodio, Switzerland, 4.
[5] Linden eddy B “ andbook of Batteries” rd ed McGraw ill ew York
NY, P.35.1.
[6] Sarkas, H.W., and Barsukov, I.V., 2014, “Zinc Anode Alkaline Electrochemical Cells
Containing Bismuth” Patent Appl. US 20140227592A1, Publ. 8/14/2014.
[7] Spahr, M.E., Yoshio, M., Brodd, R.J., and Kozawa, A., eds. 9 “Carbon Conductive
Additives for Lithium-Ion Batteries”. In Lithium-Ion Batteries, Springer Science Business
Media, LLC, New York, NY, P. 117.
[8] Juri, G., Wilhelm A and L’ eureux, J., “ igh-Purity Graphite Powders for High
erformance”, Timcal, Ltd. Group, Bodio, Switzerland.
[9] Lia, Y.F., Zhu, S.F., Wang, L., ” urification of natural graphite by microwave assisted
acid leaching” Carbon. Vol. 55 (4), pp. 377–378.
[10] Lazenby, H., “ orthern Graphite develops proprietary purification technology”
Mining Weekly International, The Creamer Media Publ. 30/9/2013, Bedford view, Johannesburg,
South Africa.
[11] Barsukov, I.V., Doninger, J.E., Zaleski, P., and erwin “ ecent developments on
the use of graphite in alkaline battery systems“ I E Letters on Batteries ew echnologies and
Medicine, 2, 1, pp. 106-110.
[12] Henry, F.X, Barsukov, I.V., et al “ ew evelopments in the Advanced Graphite for
Lithium-ion Batteries” New Carbon Based Materials for Electrochemical Energy Storage
30
Systems: Batteries, Supercapacitors and Fuel Cells, I.V. Barsukov et al. (eds.), Springer, pp. 213-
229.
[13] Tamashausky, A.V., “An Introduction to Synthetic Graphite” Asbury Graphite Mills
Inc., Asbury, NJ, USA ,p. 12.
[14] Booth, P., Doninger, J.E., Barsukov, I.V., Zak, M.S., Taylor, R.L., Ayala, J.A., Tandon, D.,
2003, “ hermally modified carbon blacks for various type applications and a process for
producing same” US Patent Appl.20050063892-A1.
[15] "Creating Safer Ways to Recycle Batteries." Bloomberg, 3 June 2014. Web. 10 Dec. 2014.
[16] National Battery Collaborative (NBC) Roadmap, 2008, Publ. US Department of Energy.
[17] Gupta, C.K., Sathiyamoorthy, D., 999 ” Fluid bed technology in materials processing”
CRC Press, Boca Raton, FL, USA, p. 528.
[18] Borodulia, V.A., 9 “ igh-temperature processes in electro-thermal fluidized bed”
Nauka I Technika Publ. House, Minsk, USSR, p. 173.
[19] Gubynskyi, M.V., Fedorov,S.S., Livitan,M.V., Gogotsi,O.G., Barsukov, I.V., and Rohatgi
U., 2013, “Analysis of energy efficiency of furnaces for high-temperature heat treatment of
carbonaceous materials” J Metallurgical and Mining Industry 2, pp 88-91.
[20] Zak, M.S., Harrison, W.M., Doninger, J.E., “Method and Apparatus for eat
Treatment of Particulates in an Electro-thermal Fluidized Bed Furnace and esultant roducts”
US Patent Appl. 2005/0062205A1.
[21] Goldberger, W.M., Carney, P.R., Reed, A.K., 98 “ hermal purification of natural
mineral carbons” European atent Appl 8
[22] Goldberger, W.M., 1968, Method of Generating a Plasma Arc with a Fluidized Bed as One
Electrode. US Patent 3,404,078.
31
[23] Gubynskyi, M.V., Barsukov, I.V., Fedorov, S.S., Livitan, M.V., Gogotsi, O.G., Rohatgi
U.S., 2013, “Study of Aerodynamic roperties of Continuous igh emperature eactors” roc
of ASME 2013 Fluids Engineering Div., Incline Village, NV, USA, Publ. BNL-99755-2013-CP
- Nonproliferation and National Security Department, Brookhaven National Laboratory, U.S.
Department of Energy, Office of Science, NA242.
[24] Gubynskyi, M.V., Fedorov, S.S., Livitan, M.V., Kheifetz, R.G., and Gogotsi, O.G., 2012,
“Selection of aerodynamic modes for high-temperature electro-thermal fluidized bed furnaces”
Metallurhycheskaya teplotehnyka, Publ. of the National Metallurgical Academy of Ukraine,
Dniepropetrovsk, Ukraine, 4 (19),pp. 55-61.
[25] Kozlov, A., Chudnovsky, Y., Khinkis, M.,Yuan, H., Zak, M “Advanced Green
Petroleum Coke Calcination in Electro-thermal Fluidized Bed” Book of Abstracts of 143th
Annual Meeting & Exhibition, MS Foundation, San Diego, CA, USA.
[26] Reynier, Y., Yazami, R., Fultz, B and Barsukov I “Evolution of lithiation
thermodynamics with the graphitization of carbons” J ower Sources 165, pp. 552-558.
[27] Fedorov, S.S., ” he analysis of the efficiency of high temperature segmental
secondary heat utilizers of fluidized bed type”, Part I, J. Metallurgical and Mining Industry, 3,
pp. 125-128.
[28] Fedorov, S.S., “ he analysis of the efficiency of high temperature segmental
secondary heat utilizers of fluidized bed type” art II J Metallurgical and Mining Industry
4,pp. 107-109.
[29] Ostrovskiy, V.S., Virgiliev, Yu.S., Kostikov, B.I., et al 98 “Synthetic graphite”
Metallurgija Publ. House, Moscow, USSR, p. 272.
32
[30] Chernish, I.G., Karpov, I.I., Prikhodko, G.P., Shai, V M 99 “ hysicochemical
Properties of Graphite and Its Compounds” aukova Dumka, Kiev, Ukraine, p.198.
[31] Fialkov, A.S., 99 “Carbon he Interlayer Compounds and Composite Materials
hereof” Aspect Press, Moscow, Russia, p.718.
[32] Fedorov, S.S., Gubynskyi, M.V., Barsukov, I.V., Livitan, M.V., Wells, B.S., Barsukov, M.,
Zimina, D., Gogotsi, O.G., Zozulya, Yu., and Rohatgi, U.S., 2014 “Modeling the Operation
Regimes in Ultra-High Temperature Continuous Reactors” U.S. Department of Energy
Nonproliferation and Nuclear Security Publ. BNL-103872-2014-CP. Brookhaven National
Laboratory, Upton, New York, USA, 1/17/2014.
[33] Kulik, A.N., Bugai, A.N., Rogulskiy, Y.V., Lysenko, O B “ etermination of the
Specific Electric Resistance of Graphite at the high temperature using complex atomic
absorption measurements” Journal of nano- and electronic physics.
/ssuir.sumdu.edu.ua/handle/123456789/1233.
[34] Kozhan, P., Makhorin, K.E., Gorislavets, S. P., 9 8 “Electrical resistance of a fluidized
bed of graphite particles” Journal of Engineering hysics and hermophysics 15 (4), pp. 959-
961.
[35] Kunii, D., and Levenspiel, O., 1968, Ind. Eng. Chem. Process Design Developments, 7, 481.
[36] Todesand, O.M., Tsitovich, O.B., 98 “Fluidized bed reactors” Khimiya Publ. House,
Leningrad, USSR, p. 296.
[37] Malinovskiy, A. I., Rabinovich, O.S., Borodulya, V.A. , Grebenkov, A.Zh., and Sidorovich,
A.M., 2012, “Local conductivity of fluidized bed filled with electrically conductive particles”
Journal of Engineering Physics. 85 (2), pp. 239 – 245.
33
[38] Dulniev, G.N. and Novikov, V.V., 99 “ he processes of transfer in non-uniform
environments” Energoatomizdat Publ. House, Leningrad, Russia, p.248.
[39] Lakomskiy, V.I., 8 “Electrical and electro-contact properties of electrode
thermoanthracite coal” Akademperiodika Publ. House, Kiev, Ukraine, p.106.
[40] “Grades of graphite and specifications roduct G - ” 2012, Product Brochure,
Zavalyevskiy Graphite Ltd., Kyiv, Ukraine.
[41] State Standard Analytical Technique GOST 46684-75, 9 “Carbonaceous Materials”
Harmonized Method for Measuring the Specific Electric esistance of a owder” Gos Standart
SSSR Publ. House, Moscow, USSR, p.13.
[42] “Standard est Method for Ash in a Graphite Sample AS M C - 9 ( ) e ” 2010,
ASTM International, Book of Standards, Vol. 05.05, Subcom. D02.F0, p. 2.
APPENDIX: ASSESSING THE EFFECTIVENESS OF THE FURNACE BASED ON
ANALYSES OF PURITY OF GRAPHITE BEFORE AND AFTER PROCESSING IN A
FLUIDIZED BED REACTOR.
There are multiple analytical methods which the industrial carbon industry uses to qualify
how well the refining furnaces purify graphite precursor. In this paper we describe an ASTM-
referenced variation of the Loss on Ignition test (LOI) test [42] which authors believe to be fully
adequate for accurate express control of the effectiveness of thermal purification in the fluidized
bed reactors.
In accordance with this method, a desiccated low-profile ceramic crucible which has been
precooked at 950°C and cooled down to room temperature prior to the test is loaded with 1.0000
+/- 0.0001 grams of graphite (Figure7 (a)) and placed into a muffle furnace. The graphite powder
34
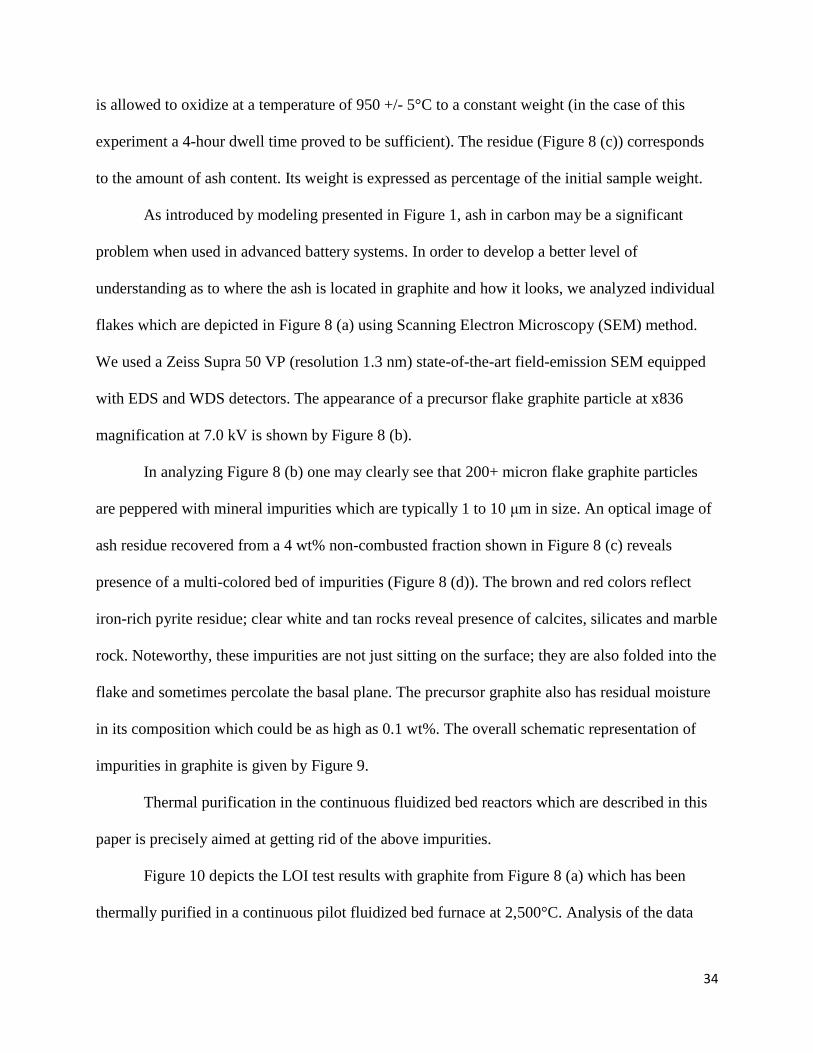
is allowed to oxidize at a temperature of 950 +/- 5°C to a constant weight (in the case of this
experiment a 4-hour dwell time proved to be sufficient). The residue (Figure 8 (c)) corresponds
to the amount of ash content. Its weight is expressed as percentage of the initial sample weight.
As introduced by modeling presented in Figure 1, ash in carbon may be a significant
problem when used in advanced battery systems. In order to develop a better level of
understanding as to where the ash is located in graphite and how it looks, we analyzed individual
flakes which are depicted in Figure 8 (a) using Scanning Electron Microscopy (SEM) method.
We used a Zeiss Supra 50 VP (resolution 1.3 nm) state-of-the-art field-emission SEM equipped
with EDS and WDS detectors. The appearance of a precursor flake graphite particle at x836
magnification at 7.0 kV is shown by Figure 8 (b).
In analyzing Figure 8 (b) one may clearly see that 200+ micron flake graphite particles
are peppered with mineral impurities which are typically 1 to 10 μm in size. An optical image of
ash residue recovered from a 4 wt% non-combusted fraction shown in Figure 8 (c) reveals
presence of a multi-colored bed of impurities (Figure 8 (d)). The brown and red colors reflect
iron-rich pyrite residue; clear white and tan rocks reveal presence of calcites, silicates and marble
rock. Noteworthy, these impurities are not just sitting on the surface; they are also folded into the
flake and sometimes percolate the basal plane. The precursor graphite also has residual moisture
in its composition which could be as high as 0.1 wt%. The overall schematic representation of
impurities in graphite is given by Figure 9.
Thermal purification in the continuous fluidized bed reactors which are described in this
paper is precisely aimed at getting rid of the above impurities.
Figure 10 depicts the LOI test results with graphite from Figure 8 (a) which has been
thermally purified in a continuous pilot fluidized bed furnace at 2,500°C. Analysis of the data
35
presented in Figure 10 (b) reveals that there is hardly any ash left in the graphite structure after it
has undergone a refining process in a fluidized bed reactor at the above temperature.
Specifically, ash amounted to 0.01 wt% of the starting sample which corresponds to graphite
purity of 99.99%C – a suitable level of purity for advanced battery applications.
Independent verification of the effective purification can be seen in Figure 10 (a). The
SEM of the edge plane of the resultant graphite particle recorded at magnification x502 at 7 kV
reveals a clean surface of graphite which is essentially free of foreign impurities.
FIGURE CAPTIONS LIST
Figure 1. Sources and effects of gassing in batteries: SEM of mineral impurities in graphite (a);
modeling the effect of gas evolution inside an AA size cylindrical battery (static stress mapping):
(b); a cutaway view of a stress model (deformation scale 1:1); (c) stress diagram of a cylindrical
AA cell (deformation scale 104:1).
Figure 2. Cutaway view of a continuous electro-thermal fluidized bed reactor:
1 – Center electrode; 2 – lining of the over-bed space; 3 - loading zone of graphite feed; 4 –
active working zone of reactor; 5 – lower bed zone; 6 – cooling system (product exit); 7 – Feed
bin.
Figure 3. Key fluid mechanics modes of the fluidized bed reactor, as observed in the cold reactor
experiments ( ) Stagnant bed (b) ransitional operating mode; (с) Low-bubbling mode, (d)
Intense bubbling mode; (e) Photo of the cold model reactor outfitted with Plexiglas wall; 1 –
Center electrode, 2 –over-bed space, 4 – active working zone of reactor; 8 – Bottom distributor
36
plate where the product exits the reactor; 9 – Outer shell of reactor; 10 – bed of graphite particles
which undergo fluidization; 11 – Differential pressure gauge.
Figure 4. Segmental cross-section of a fluidized bed reactor used for thermal purification of
graphite.
Figure 5. Oscillogram of relative resistance of fluidized bed of graphite GT-1, Zavalye Graphite,
Ltd. (= 2,050 kg/m3, effective particle diameter, dparticle= 0.25 mm; fluidizing agent – air, T=
50°C, W = 2; Rfb– electrical resistance of the fluid bed, s; Rpb– electrical resistance of the
stagnant bed of graphite, ).
Figure 6. Pilot Continuous Electro-thermal Fluidized bed reactor: (a) Engineering model; (b)
Actual reactor; (c) Schematic of active fluidization zone.
Figure 7. Numerically modelled properties of Electro-thermal Fluid Bed Reactors: (a) and (b) –
working areas for selected operation regimes; T – Voltamogram of the fluidized bed for a given
temperature (Тb<Тa); G – Voltamogram of the furnace at a given throughput (Gb>Ga); W –
parallel lines of constant power (Wb>Wa); Us(I) – Voltammograms of the power supply.
Figure 8. Ash analysis in the precursor graphite (prior to thermal purification): (a) Coors
ceramic crucibles which hold 1.0000 +/- 0.0001 g of precursor graphite each; (b) Scanning
Electron Micrograph of the edge plane of precursor graphite prior to ash test; (c) ash residue of
37
samples depicted in (a) after the Loss on Ignition (LOI) test; (d) Optical microscopy image of the
ash residue from the samples depicted in (c), magnification: x500.
Figure 9. Schematic representation of impurities in graphite: 1 – graphite basal plane; 2 –
mineral ash; 3 – moisture and volatile matter.
Figure 10. Results of thermal purification of graphite in a continuous electro-thermal fluidized
bed reactor at 2,500°C: (a) Scanning Electron Micrograph of refined flake; (b) ash residue from
the above after the LOI test.
38
TABLE CAPTIONS LIST
Table 1. Specific Electric Resistance of graphite as a function of its state of packing.
Table 2. Influence of the volume fraction of channels on the Specific Electrical Resistance of the
fluidized bed (results of numerical modeling).
Table 3. Influence of graphite particle size on the Specific Electrical Resistance of fluid bed
(Temperature: 20°C).
Table 4. Influence of Temperature of fluidized bed on Specific Electrical Resistance.
Table 5. Sieve analysis data for natural crystalline flake graphite GT-1.
Table 6. Selected results of the experimental campaign.
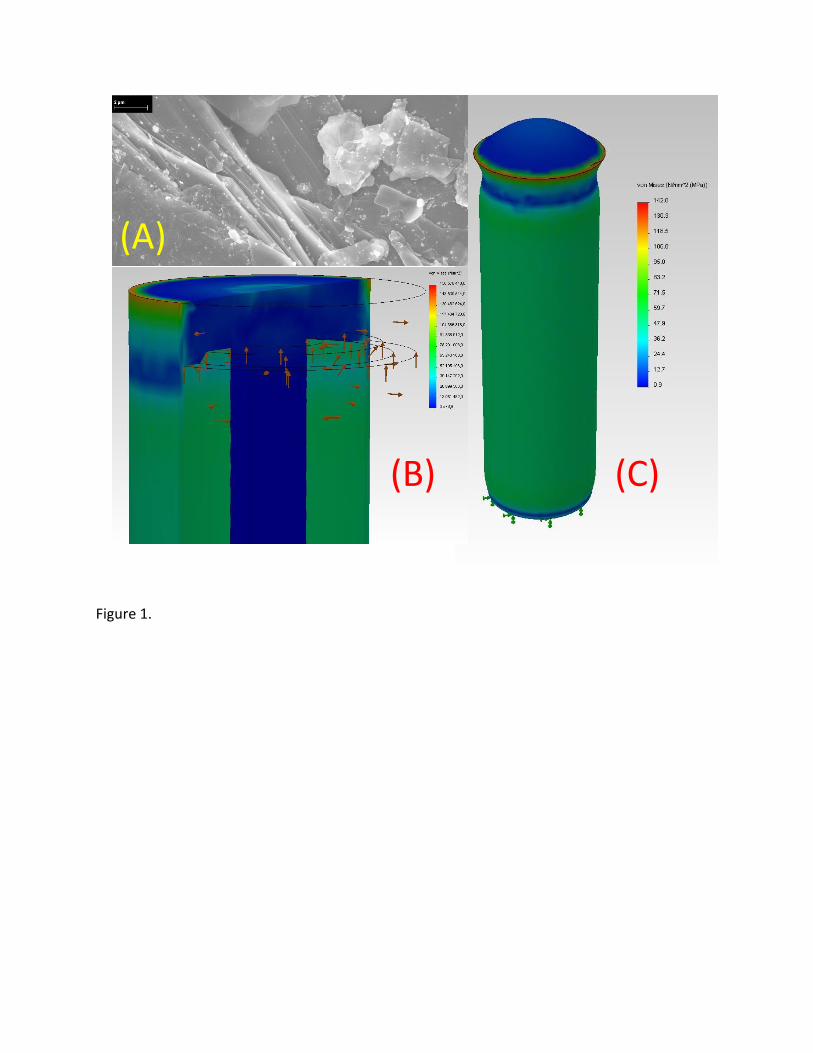
Figure 1.
(A)
(B) (C)
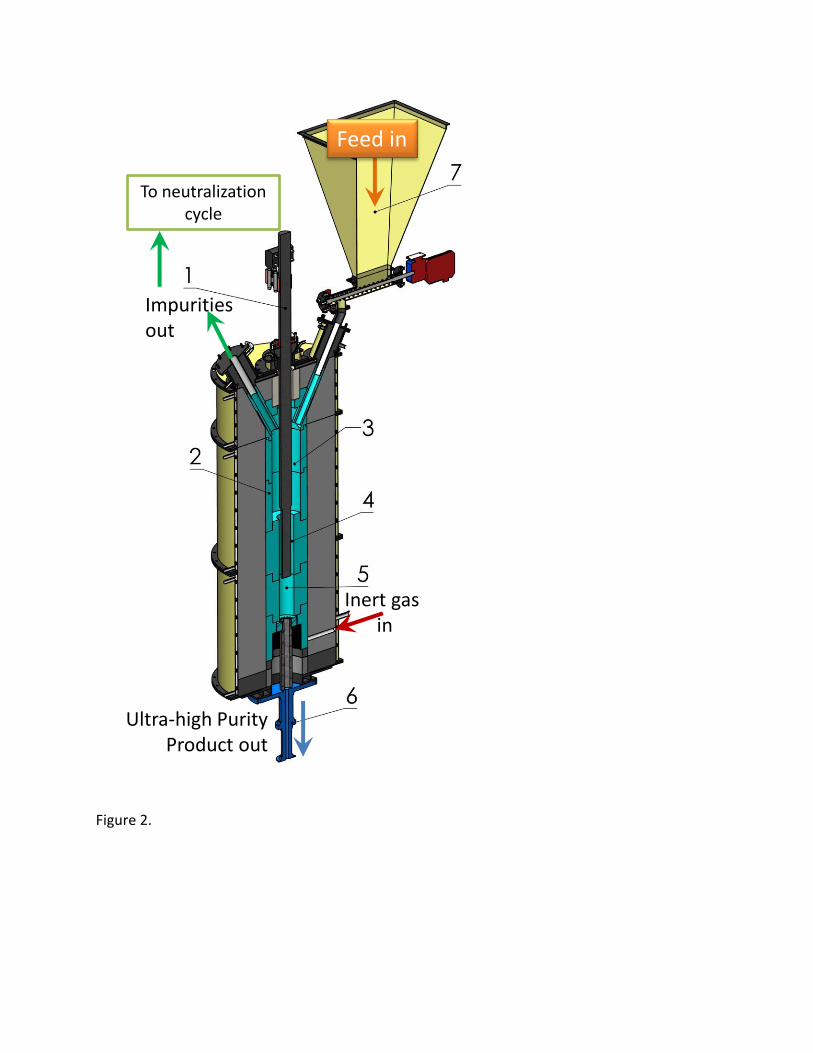
Figure 2.
Feed in
Ultra-high PurityProduct out
Inert gasin
Impurities out
To neutralizationcycle
Figure 3.
(a) (b) (c) (d) (e)
1
9
4
8
2
10
11
1
9
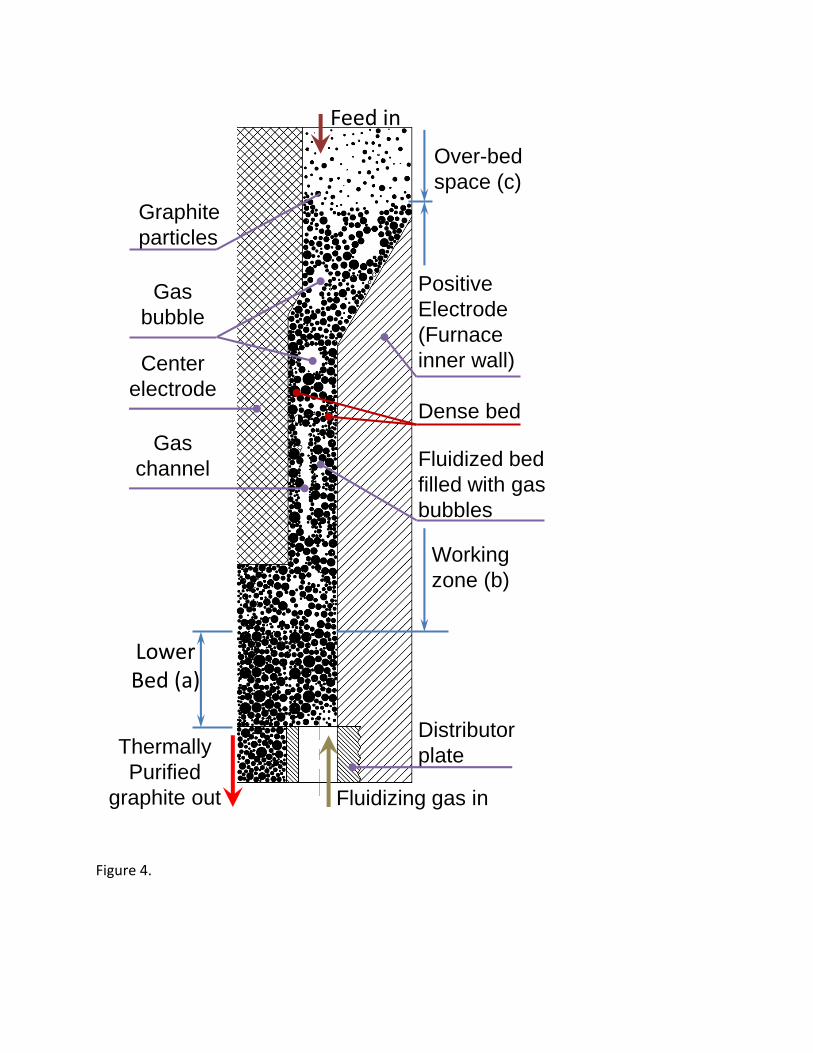
Figure 4.
Thermally
Purified
graphite out Fluidizing gas in
Center
electrode
Gas
channel
Gas
bubble
Distributor
plate
Positive
Electrode
(Furnace
inner wall)
Dense bed
Fluidized bed
filled with gas
bubbles
Graphite
particles
LowerBed (a)
Over-bed
space (c)
Working
zone (b)
Feed in
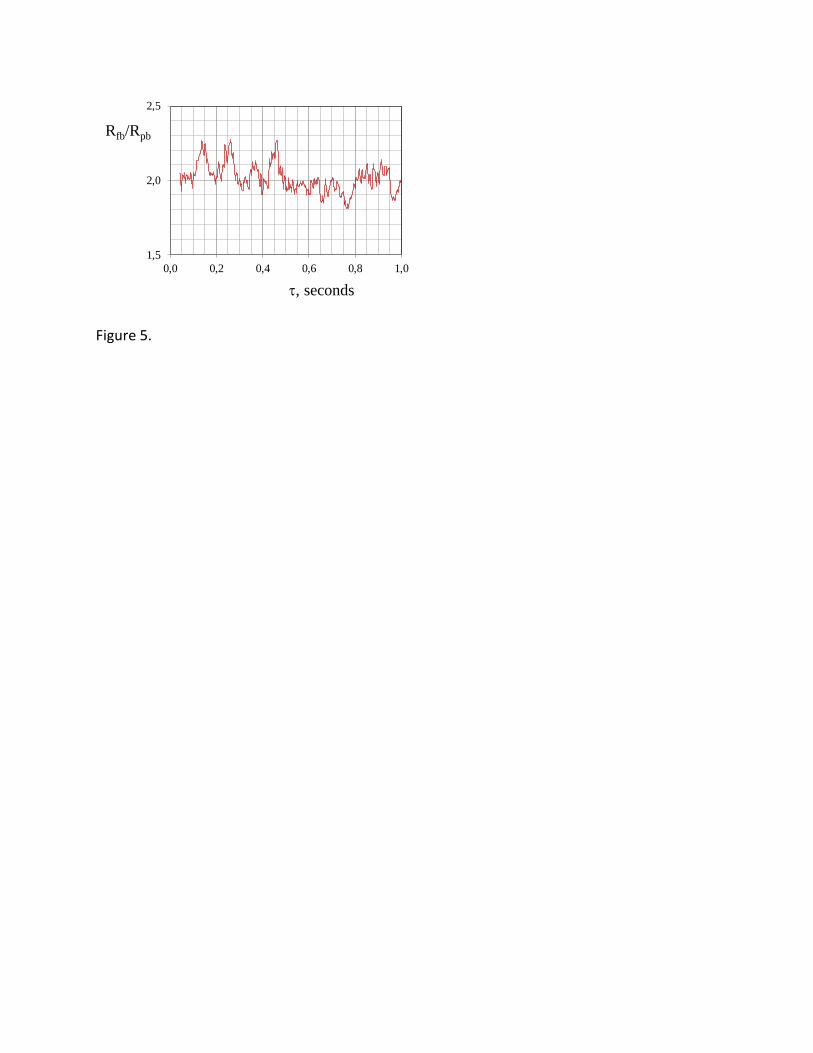
Figure 5.
1,5
2,0
2,5
0,0 0,2 0,4 0,6 0,8 1,0
Rfb/Rpb
, seconds
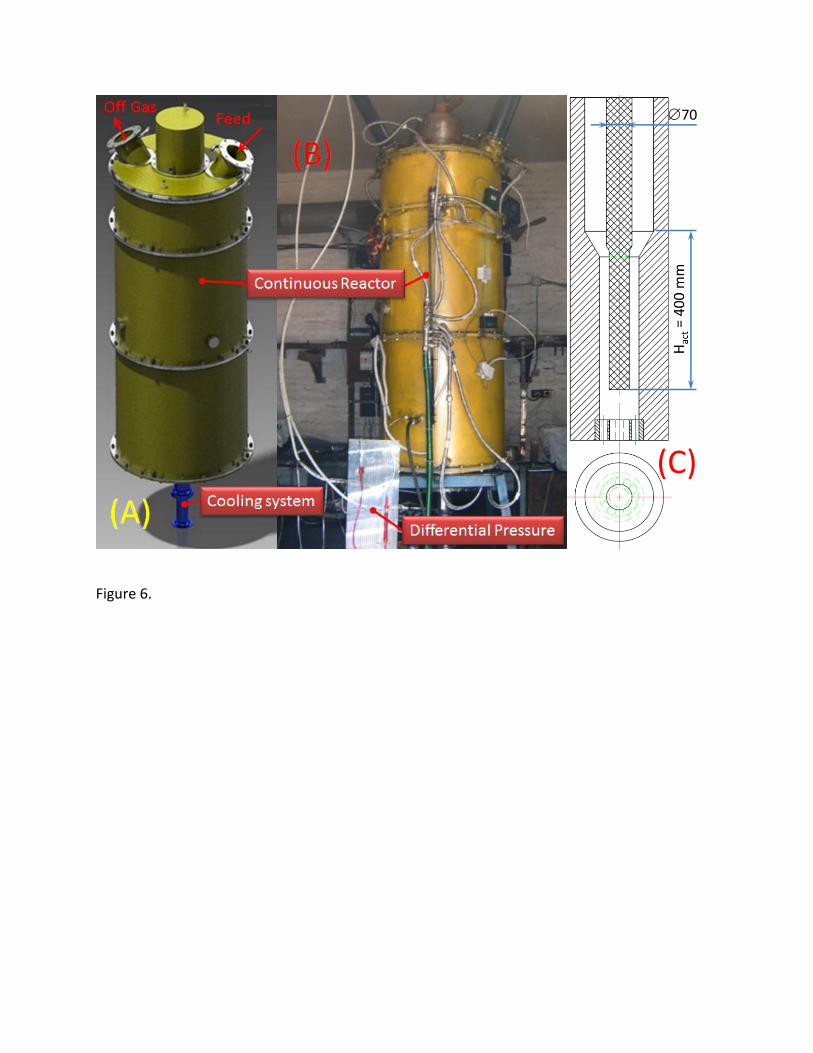
Figure 6.
70
(C)
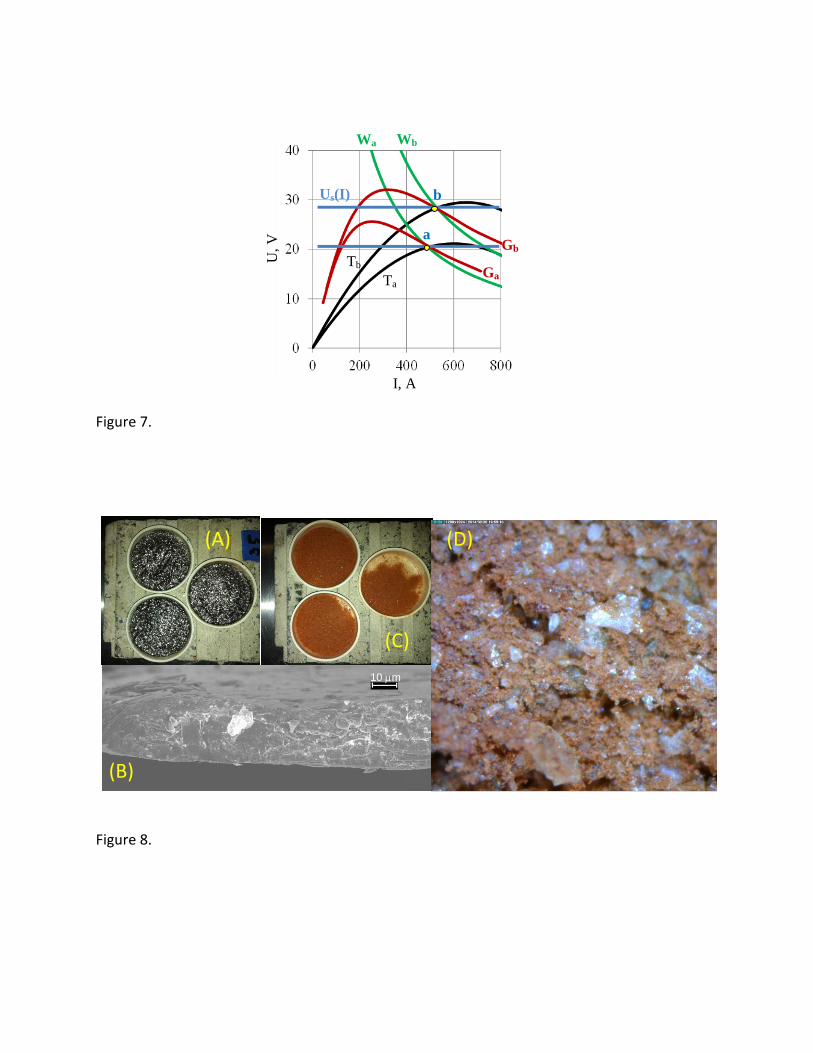
Figure 7.
Figure 8.
U,
V
I, A
a
b
Tb
Ta
Wa
Gb
Ga
Wb
Us(I)
10 mm
(A)
(B)
(C)
(D)
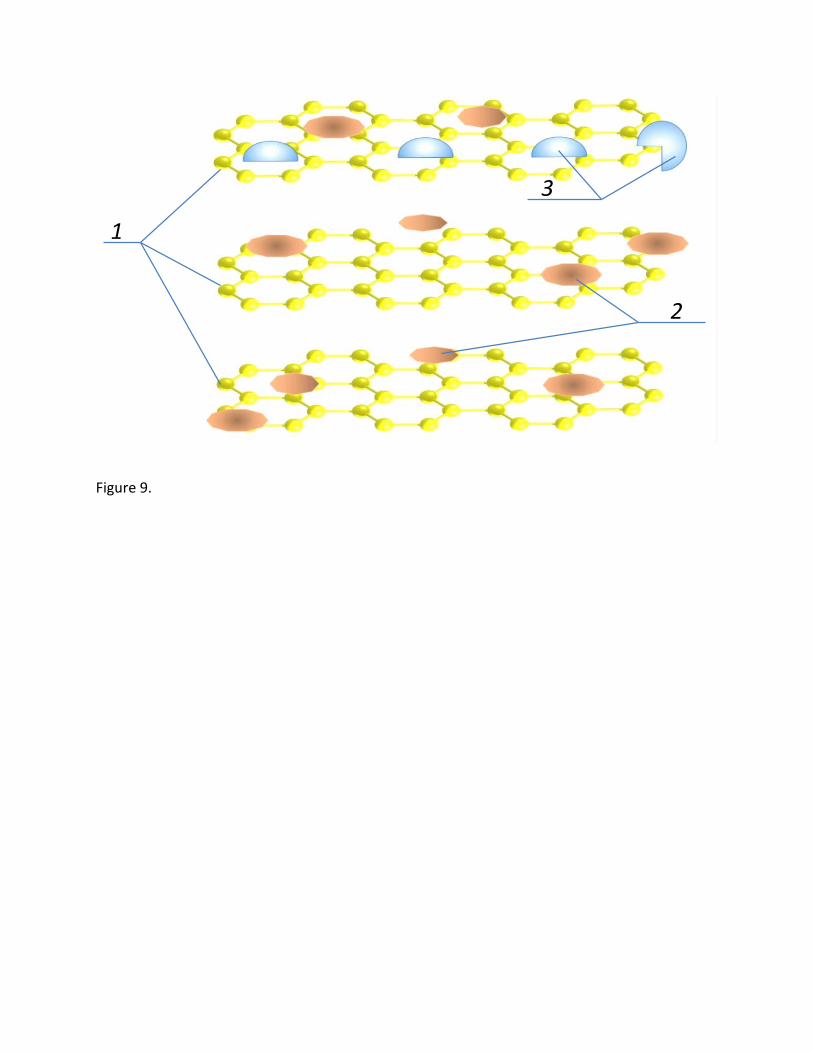
Figure 9.
1
2
3
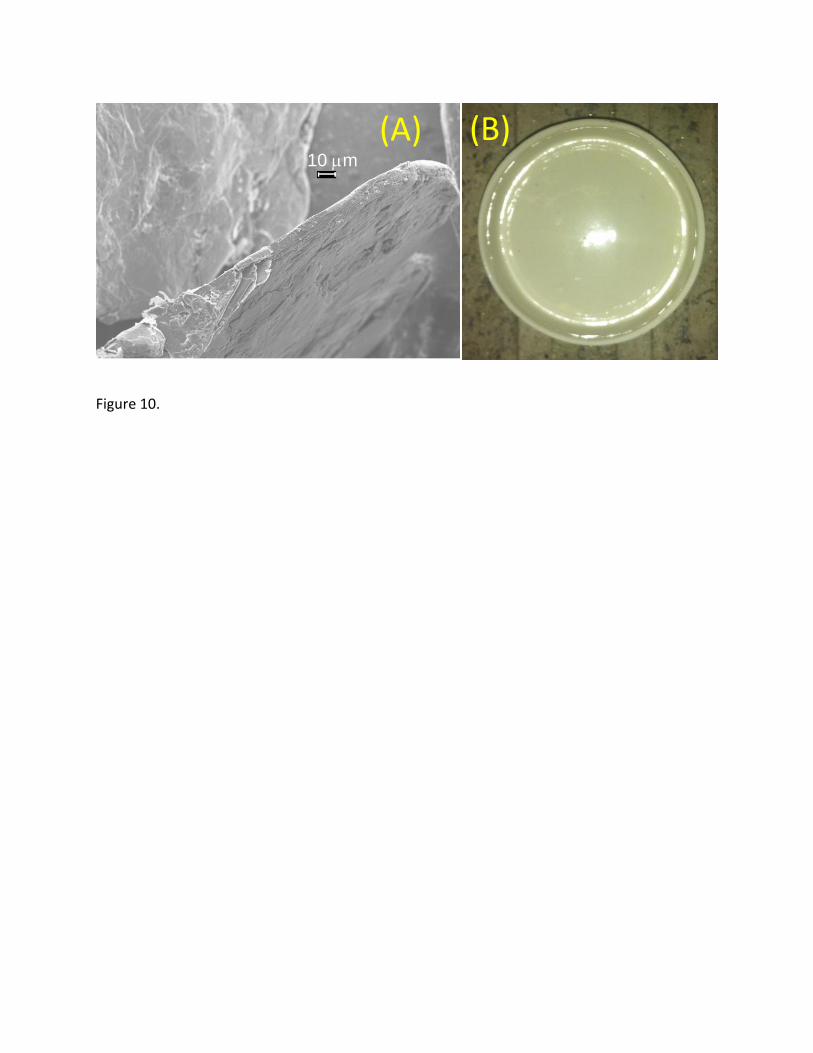
Figure 10.
10 mm
(A) (B)