Embed Size (px)
Citation preview
INFORMATION TO USERS
This manuscript has been reproduced trom the microfilm master. {Th.{(
films the text directly from the original or copy submitted. Thus, sorne
thesis and dissertation copies are in typewriter face, while others may he
from any type ofcomputer printer.
The quality of this reproduction is dependent upon the quality of the
copy submitted. Broken or indistinct print, colored or poor quality
illustrations and photographs, print bleedthrough, substandard margins,
and improper alignment can adversely affect reproduction.
In the unlikely event that the author did not send UMI a complete
manuscript and there are missing pages, these will be noted. A1so, if
unauthorized copyright material had to be' removed, a note will indicate
the deletion.
Oversize materials (e.g., maps, drawings, charts) are reproduced by
sectioning the original, beginning at the upper Ieft-hand corner and
continuing from left to right in equal sections with sma1l overlaps, Each
original is aIso photographed in one exposure and is included in reduced
fonn at the back of the book,
Photographs included in the original manuscript have been reproduced
xerographically in this copy. Higher quality 6" x 9" black and white
photographie prints are available for any photographs or illustrations
appearing in this copy for an additional charge. Contact UMI direetly to
order.
UMIA Bell & Howell Information Company
300 North Zeeb Roa~ ADn Arbor Ml 48106-1346 USA313n61-4700 800/521-<>600

NOTE TO USERS
The original manuscript received by UMI contains pages withprint exceeding margin guidelines. Pages were microfilmed
as received.
This reproduction is the best copy available
DMI

(
-(
PROTEOLYTIC DEGRADATION PRODUCTS AS INDIC..-\.TORSOF QUALIn" IN MEAT AND FISH.
By
HUSAM F. AL - OMIR.-\H
Department of Food Scienceand Agricultural Chemistry
Macdonald CampusMcGill UniversityMontreal, Quebéc
A Thesis submitted to the Faculty of Graduate Studies and Research in partialfulfilment for the requirements for the degree of Master of Science
September.. 1996
C Husam F. AI- Omirah
1+1 National Libraryof Canada
Acquisitions andBibliographie Services
395 Wellington StreetOttawa ON K1A ON4Canada
Bibliothèque nationaledu Canada
Acquisitions etservices bibliographiques
395. rue WellingtonOttawa ON K1A ON4canada
aur lie Notffl reférenœ
The author has granted a nonexclusive licence allowing theNational Library of Canada tareproduce, loan, distribute or sellcopies of this thesis in microfonn.,paper or electronic formats.
The author retains ownership of thecopyright in this thesis. Neither thethesis nor substantial extracts from itmay be printed or otherwisereproduced without the author' spenmSSlon.
L"auteur a accordé une licence nonexclusive permettant à laBibliothèque nationale du Canada dereproduire, prêter, distribuer ouvendre des copies de cette thèse sousla forme de microfiche/film, dereproduction sur papier ou sur formatélectronique.
L'auteur conserve la propriété dudroit d'auteur qui protège cette thèse.Ni la thèse ni des extraits substantielsde celle-ci ne doivent être imprimésou autrement reproduits sans sonautorisation.
0-612-29642-3
CanadrL
(
Suggested short title:
PROTEOLYTIC PRODUCTS IN MEAT AND FISH
Il
{
(
ABSTRACTAssessment of freshness and quality of meat and fish is a major activity of both food
reguIatory agencies and the food industry. Various methods are used for measuring fish and
meat quality, each with its panicuIar advantages and limitations. However, methods based on
monitoring the products of proteoIysis have received relatively Iittle attention. The objective
of the present study was to identify specific protein and peptide produets of proteolysis as
indicators of freshness and quality during chilled storage of fresh fish and meat.
Samples ofmeat and fish were subjected to chilled storage~ at intervaIs ofO. 2. 4. 8.
12 and 16 days. samples were subjeeted to protein and peptide extraction. and separation of
individual sarcoplasmic and myofibrillar proteins by SDS and native electrophoresis. These
extracted proteins along with acid soluble nitrogen (ASN) were separated by RP-HPLC.
fractions were collected and identified by eleetrospray ionization mass speetrometry (ESI-
MS).
RP-HPLC separated at least thirty fractions from the ASN extract of fresh fish. ESI-
MS revea1ed the presence ofat least twenty-five polypeptides with molecular weights (MW)
ranging from 2 to 32 kDa. The relative area % of the polypeptides with MW 32.8 kDa and
42.8 kDa decreased during the storage while polypeptides of MW of ]0.9 kDa and ]6 7 kOa
increased during storage. Changes in polypeptides of MW 12. 34.2 and 42.8 kDa was also
observed. The sarcoplasmic protein extraeted from ground and whole meat contained at least
12 polypeptides with MW ranging trom Il to 42 kDa. The relative area % of polypeptide of
MW of35.7 kDa decreased during storage. The results suggest that changes in proteins and
polypeptides of MW ]0.9, 12. 16.7.32.8.34.2 and 42.88 kDa in fish and 35.7 kDa in meat
couId serve as indicators of spoilage.
III
(
(
RESUME
Déterminer la qualité et la fraîcheur de la viande et du pOIsson est un gros
problème à la fois pour l'industrie alimentaire et les agences gouvernementales. Plusieurs
méthodes sont utilisées pour arriver à cette fin~ chaqu' une avec ses avantages et ses
inconvenients. Toutefois~ les méthodes basées sur le suivit des produits de protéolyse
n'ont reçu que peu d'attention. L'objectif de cette étude était dl identifier des protéines
et des peptides spécifiquement produits par la protéolyse et pouvant servir dl indice de
fraîcheur et de qualité pendant Il entreposage au froid de la viande et du poisson.
Les échantillons de viande et de poissons furent entreposés au froid durant
différentes périodes (0, 2, 4, 8, 12 et 16 jours). LI extraction des peptides et des protéines
fut ensuite réalisée sur ces échantillons. La séparation des protéines sarcoplasmiques et
myofibrillaires par SDS et native électrophorése fut réalisée. Les protéines extraites et la
fraction azotée soluble dans l'acide furent séparées par chromatographie liquide à haute
pression (HPLC) en phase inverse, les fractions furent collectées et identifiées par
spectrophotométrie de masse en ionistion d' electrospray (ESl/MS).
La HPLC en phase inverse permit la séparation d'au moins 25 fractions à partir de
la fraction azotée soluble dans l'acide obtenues des extraits de poissons. La E5I/MS
revela la présence dl au moins 25 polypeptides avec des poids moléculaires variant de 2 à
32 kDa. Le pourcentage de surface relative des polypeptides de 32.8 et 42.8 kDa de poids
moléculaire decrut durant II entreposage. Des variations au niveau des peptides de 12.
34.2 et 42.8 kDa de poids moléculaire furent également observées. Les protéines
sarcoplasmiques extraites de la vainde hachée et entiére contenaient au moins 12
polypeptides dont le poids moléculaire variait de Il à 42 kDa. Le pourcentage de surface
relative du polypeptide de 35.7 kDa de poids moléculaire décrut durant l'entreposage.
Ces resu[tats sugérèrent que les variations en protéines et en polypeptdes de poids
moléculaire égal à 10.9. 12, 16.7,32.8 et 42.8 kDa pour le poisson et 35.7 kDa pour la
viande pouvaient servir d'indicateurs pour la dégradation de ces produits.
IV
( ACKNOWLEDGEMENTS
1 would like to express my sincere gratitude and appreciation to my supervisor. Dr.
l Alli for his guidance and patience throughout the completion ofthis study. Thanks are also
extended to everyone in Dr. Alli's family for their kindness and continuous support during my
stay in Canada.
1would like ta thank Dr. S. Kermasha, Dr. l.P. Smith~ Dr. B.K.Simpsom and Mr. B.
Gibbs for their fiiendship. encouragement. and for allowing me to use their facilities and Dr.
W. Sawaya ofIGSR for his support.
1 would like ta thank Dr. Y. Konishi of Biotechnology Research institute (BRI) for
his invaluable advise and assistance in the use of LC-E5I-MS.
1 would like ta express special thank ta Br. Ismail Pennino and rus wife Sister
Nooralein Chapman for their invaluable comments on the manuscript.
1 would like to express my sincere thanks to the graduate student and staff of the
Department of Food Science for their friendship and support.
[ would like ta express my appreciation to my family and to my dear wife Asma for
their love and care without which the completion of this program would not have been
possible.
Financial support in the form of a scholarship from Kuwait [nstitute for Scientific
Research ( KlSR) is gratefully acknowledged.
v
(
(
TABLE OF CONTENTS
SHORT TITLE _ ii
ABSTAACT _ _ iii
RÉsUMÉ.-- iv
ACKNOWLEDGElVŒNTS _ _ v
TABLE OF CONTENTS vi
LIST OF FIGURES _ _ xi
LIST OF TABLES _ xv
1. INTRODUCTION 1
2. LITERATURE REVIEW _ 3
2. I. Definition ofSpoilage 3
2.2. Factors Meeting Spoilage 4
2.2.1. Initial Contamination .4
2.2.2. Nutrients 5
2.2.3. pH and Acids __ 5
2.2.4. Water Activity (aw) _ 6
2.2.5. Temperature _ 7
2.2.6. Atmospheric Conditions _ 8
., "\ Pd' M- . 9_.-'. re omInant lcroorgarusms .
2.4. Proteolytic Enzymes 10
2.4.1. Carboxyl Proteinases _ _ 13
2.4.2. Serine Proteinases 14
2.4.3. Metallo Proteinases _ 15
2.4.4. Cysteine Proteinases 16
2.5. Quality and Freshness 17
2.5.1. Sensory (Organoleptic Methods) 17
VI
(
(
2.5.2. PhysicaI Methods _ 18
2.5.3. Physico-ChemicaI Methods , .. 18
2.5.3.1. pH _ _ _._ _ 18
2.5.3.2. Titrable AIkalinity / Acidity (TA) _ 19
2.5.3.3. Extract Release Volume {ERV) 19
2.5.3.4. Lactic Acid Determination _ 19
2.5.4. Fat and Lipid Oxidation _ _ 20
2.5.4.1. Thiobarbitllric Acid (TBA) '_ , 20
2.5.4.2. Peroxide Value 22
2.5.5. MicrobiaI Methods _ _ 13
2.5.6. Nucleotide Degradation Products _ 23
2.5.6.1. Hypoxanthin (Hx) Tests 23
2.5.6.2. K-VaIlle _ 24
2.5.7. Polyamines (Biogenic amines) _ _ _26
2.5.8. Trimethylamine (TMA) _ 28
2.5.9. Protein Degradation Products 30
2.5.9.1. Total Volatile Bases (TVB) 30
2.5.9.2. Non-Protein Nitrogen (NPN) 30
2.5.9.3. Water Soluble Nitrogen (WSN) and Total Nitrogen
(TN) 31
2.5.9.4. Free Amino Acid 32
2.6. Electrophoresis _ _33
2.7. High Performance Liquid Chromatography._ 34
2.8. Mass Spectrometry 36
2.9. Le-MS of Peptides and Proteins _ _.. _ 38
3. MATERIAL ANn METROnS .40
3. 1. Materials 40
3.1. Microbiological Analysis _ .40
vu
(
(
3.3. pH Measurement 41
3.4. Extraction of Acid Soluble Nitrogen (ASN) __ ._ _ _ __ ._ .. _ 41
3.5. Determination of Protein Concentration __ " _., _.. _42
3.6. Preparation ofFish Myofibrillar and Sarcoplasmic Protein Fractions _.. .42
3.7. Preparation of Meat Myofibrillar and Sarcoplasmic Protein Fractions.. _.. _._._.44
3.8. High Performance Liquid Chromatography (HPLC) " ., _ 46
3.9. Mass Spectrometry (MS) _ _.. _.. _.46
3.10. Electrophoresis , __ _ __ ." _.. _.47
3.10.1. Sodium Dodecyl Sulphate Polyacrylarnide Gel Electrophoresis
(SOS-PAGE) - .. _ 47
3.10.1.1. Sample Preparation _.. _ _ 49
3.10.1.2. Gel Concentration and Preparation _._ .49
3.10.1.3. Electrophoresis Condition _ _ 51
3.10.1.4. Protein Fixing, Staining and Destaining _ _.. 51
3.10.2. Native Electrophoresis 51
3.10.2.1. Sample Preparation _ _ __ ._ _ _. __ .51
3.10.2.2. Gel Concentration and Preparation _ _.. 52
3.10.2.3. Electrophoresis Condition _ __ 52
"" 10'" 4 P . F" S" d D " -~.J. .__. rotem Ixmg, tammg an estammg . )_
3.11. Statistical Analysis.. __ _ _.. _ _ _ _ _ __ .52
4. RESULT AND DISCUSSION _._ _.. _. _54
A. Proteolysis ofCarp Fish , , _ _' __ 54
4.A. 1. Bacterial Plate Count -- _._ _ _ 54
4.A.2. pH _._ _._ _ _.57
4.A.3. Changes in Protein Content Extracted from Carp Fish.. _ __ . 59
4_A.4. Electrophoresis __ , _.. __ 61
4.A.4. 1. Myofibrillar Proteins _ __ ._ 61
4.A.4.1.1. SOS-PAGE _ 61
VIII
{
(
4.A.4. 1.2. Native Electrophoresis 65
4.A.4.2. Sarcoplasmic Proteins '" 65
4.A.4.2.1. SOS-PAGE..................................... ..65
4.A.4.2.2. Native Electrophoresis 68
4.A.5. Liquid Chromatography Mass spectrometry 73
4.A.5.1. Acid Soluble Nitrogen Fraction which Show Changes During
Storage 73
4.A.5. 1.1. Fraction A , 73
4.A.5.1.2. Fraction B 80
4.A.5. 1.3. Fraction H 80
4.A.5.1.4. Fraction G 85
4.A.5.2. Fractions which Show no or little Changes During Storage 85
4.A.5 .2.1. Fraction C and D 85
4.A.5.2.2. Fraction E 89
4.A.5.2.3. Fraction F. ' 89
4.A.5.2.4. Fraction L 89
4.A.5.2.5. Fraction J 94
8. Proteolysis of Meat ,.'" ." , 96
4.B.1. BacteriaI Plate Count 96
4.8.1.1. Whole Meat................................................................ .. ..96
4.B. 1.2. Ground Meat 99
4.8.2. pH 99
4.8.3. Electrophoresis 102
4.8.3.1. Myofibrillar Proteins 102
4.8.3.1.1. Native Electrophoresis 102
4.8.3.1.2. SOS-PAGE I06
4.8.3.1.2.1. Whole Meat 106
4.8.3.1.2.2. Ground MeaL 110
4.8.3.2. Sarcoplasmic Proteins 113
IX
{
(
4.B.3 .2. 1. Native Eleetrophoresis 113
4.B.3.2.2. SDS-PAGE 113
4.B.4. Changes in Protein Content Extracted from Whole and Ground Meat 121
4.B. 5. Liquid Chromatography Mass Spectrometry................... .... ... ... . 123
5. GENERAL CONCLUSION 132
6. REFERENCES....................................................................................... .134
x
Figure 1.
Figure 2.
Figure 3.
Figure 4.
Figure 5.
Figure 6.
Figure 7.
Figure 8.
Figure 9.
Figure la.
Figure Il.
Figure 12.
Figure 13.
Figure 14.
Figure 15.
Figure 16.
Figure 17.
LIST OF FIGURES
Proposed TBA reaction 21
Sorne pathways ofdecomposition of fat hydroperoxide 22
Known degradation pathway of ATP and cartibutes flavour. 25
Enzymatic reaction which involves in nucleotide determination by
polarographic probe 26
Reduction oftrimethylamine oxide and formation oftrimethylamine 29
Reaction ofTNBS with amino acid 33
Procedure utilized for extracting sarcoplasmic and myofibrillar proteins
from fish 43
Procedure utilized for extracting sarcoplasmic and myofibrillar proteins
from meat 45
Representative of typicaI interpreted ES1-mass spectra of standard
lysozyme. Component mass is 14.305 0 .48
Plot of Log MW vs relative mobility of standard proteins 50
Mesophilic~ psychrotrophic and anaerobic bacteriaI count of stored carp
fish 55
Changes in pH during storage ofcarp fish 58
Changes in the protein content of extract sarcoplasmic. myofibrillar and
acid soluble nitrogen from carp fish '" 60
SDS-PAGE of myofibrillar proteins extracted from carp fish after O. 2. 4.
8. 12 and 16 days of storage 62
Native -PAGE of myofibrillar proteins extracted from carp fish after O. 2.
4. 8~ 12 and 16 days of storage 66
SOS-PAGE of sarcoplasmic proteins extracted from carp fish after 0, 2. 4.
8, 12 and 16 days of storage 69
Native -PAGE of sarcoplasmic proteins extracted from carp fish after O. 2.
4.8. 12 and 16 days ofstorage 71
XI
87
.76
.81
Figure 18.
Figure 19.
Figure 20.
Figure 21.
Representative ofRP-HPLC separation of A5N extracted from carp fish.74
Section of the A5N chromatograms corresponding to retention time range
of33 min. to 38 min..................................... 75
Fraction which showed changes in relative area (0/0 ) of acid soluble
nitragen storage of carp fish .
Fraction which showed changes in relative area (%) of acid soluble
nitragen storage of carp fish __ . 86
Figure 22-A. Representative oftypical interpreted ESI-mass speetra of fraction A.
Component mass is 32.81 1 D........................................... . 79
Figure 22-81. Representative oftypical interpreted ESI-mass speetra of fraction 81.
Component mass is 10.995 D .
Figure 22-82. Representative oftypicaJ interpreted ESI-mass spectra of fraction 82.
Component mass is 10,898 D , . . 82
Figure 22-H. Representative oftypical interpreted ESI-mass spectra of fraction H.
Component mass is 16,751 D................................................. .. 83
Figure 22-G. Representative oftypical interpreted ESI-mass spectra affraction G.
Component mass is 42842 D __ .. __ ' 84
Figure 22-C. Representative oftypical interpreted E5I-mass speetra of fraction C.
Component mass is 11.482 D .
Figure 22-D. Representative oftypical interpreted E5I-mass spectra of fraction D
Component mass is 11.51 1 D 88
Figure 22-E. Representative oftypical interpreted ESI-mass spectra of fraction E.
Component mass is 42.857 O...... . 90
Figure 22-FI. Representative oftypical interpreted ESI-mass spectra offraetion FI.
Component mass is 11.958 O........................................................... 91
Figure 22-F2. Representative oftypical interpreted ESI-mass spectra of fraction F2.
Component mass is 12.01 5 D...................................................... ...... .. .. 92
Figure 22-1. Representative oftypical interpreted ESI-mass spectra of fraction I.
Component mass is 34.251 D 93(
(
xu
(
(
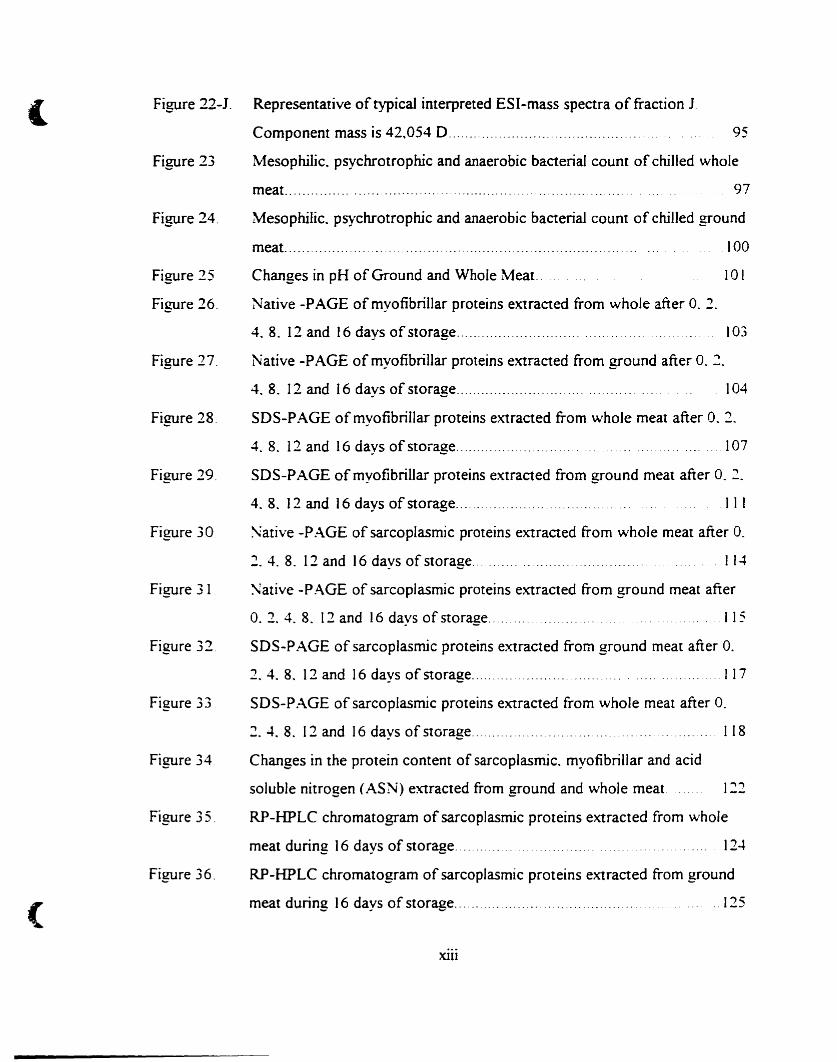
Figure 22-1.
Figure 23
Figure 24.
Figure 25
Figure 26.
Figure 27.
Figure 28.
Figure 29.
Figure 30
Figure 31
Figure 32
Figure 33
Figure 34
Figure 35.
Figure 36.
Representative oftypicaJ interpreted ESI-mass speetra of fraction J
Component mass is 42.0540........................................ ..... 9~
Mesophilic. psychrotrophic and anaerobic baeterial count of chilled whole
meat.............................................................................. 97
Mesophilic. psychrotrophic and anaerobic baeteriaJ count of chilled ground
meat................... 100
Changes in pH of Ground and Whole Meat... . 101
Native -PAGE of myofibrillar proteins extraeted from whole after O. 2.
4. 8. 12 and 16 days of storage ', . 103
Native -PAGE of myofibrillar proteins extraeted from ground after O. 2.
4. 8. 12 and 16 days of storage ' .. , ]04
SOS-PAGE ofmyofibriIJar proteins extraeted from whole meal after 0.2.
4. 8. 12 and 16 days of storage............................ . 107
SOS-PAGE of myofibriIJar proteins extraeted from ground meat after O. 2.
4. 8. 12 and 16 days of storage ' Il ]
Native -PAGE of sarcoplasmic proteins extraeted from whole meat after O.
2. 4. 8. 12 and 16 days of storage ,' .. ' 114
~ative -PAGE of sarcoplasmic proteins extracted from ground meal after
O. 2. 4. 8. 12 and 16 days of storage............ " 115
SOS-PAGE of sarcoplasmic proteins extraeted from ground meal after O.
2. 4. 8. 12 and 16 days of storage..................... ...... ] 17
SOS-PAGE ofsarcoplasmic proteins extracted from whole meal after O.
2. 4. 8. 12 and 16 days of storage. . 118
Changes in the protein content of sarcoplasmic. myofibrillar and acid
soluble nitrogen (ASN) extracted from ground and whole meal 122
RP-HPLC chromatogram of sarcoplasmic proteins extracted from whole
meat during 16 days of storage. .... ..... . ... .. ... .. ... . ]24
RP-HPLC chromatogram of sarcoplasmic proteins extraeted from ground
meat during 16 days of storage.. .......... ... ..... ... ..... ..... ...... . ]25
XIU
(
(
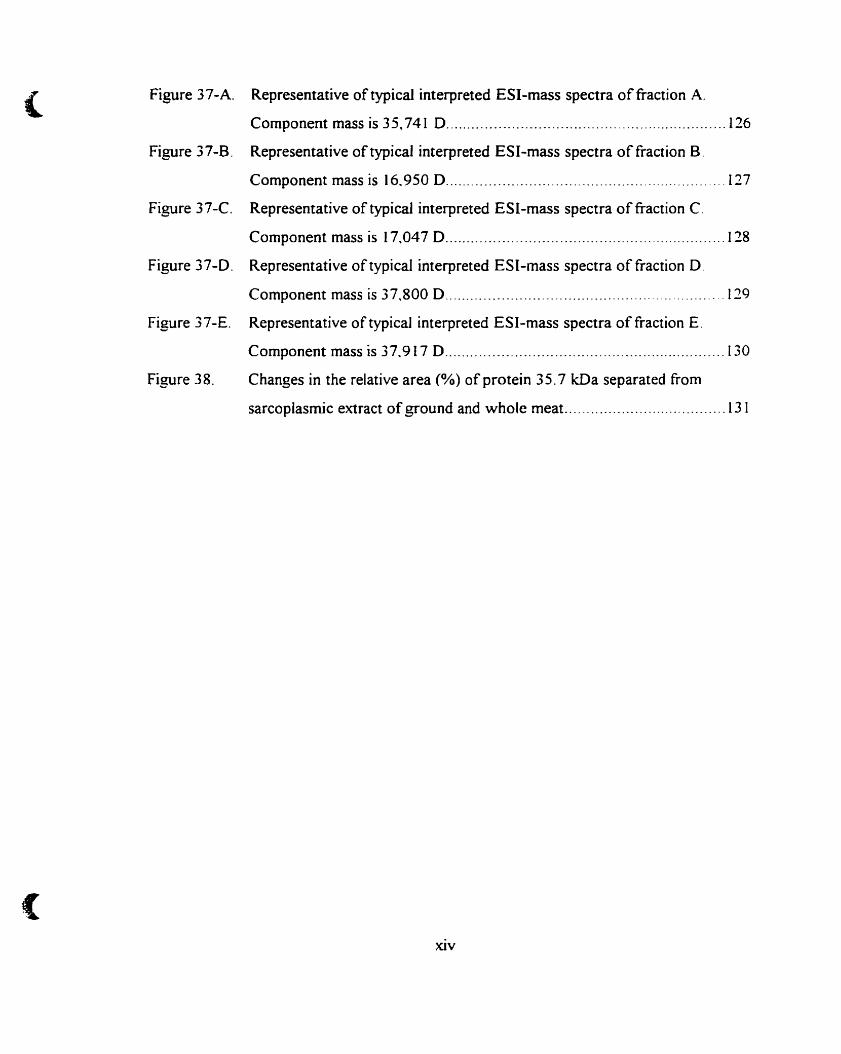
Figure 37-A. Representative oftypical interpreted ESI-mass spectra offraction A.
Component mass is 35. 741 O 126
Figure 37-B. Representative oftypicaI interpreted ESI-mass spectra offraction B.
Component mass is 16,950 O 127
Figure 37-C. Representative of typical interpreted ES1-mass spectra of fraction C.
Component mass is 17,047 O 128
Figure 37-0. Representative oftypicaI interpreted ESI-mass spectra of fraction D.
Component mass is 37,800 O 129
Figure 37-E. Representative oftypicaI interpreted ESI-mass spectra of fraction E.
Component mass is 37,917 0 130
Figure 38. Changes in the relative area (%) ofprotein 35.7 kOa separated from
sarcoplasmic extract ofground and whole meat 13 1
XIV
(
(
Table 1.
Table 2.
Table 3.
Table 4.
Table S.
Table 6.
Table 7.
Table 8.
Table 9.
Table la.
Table Il.
Table 12.
Table 13.
Table 14.
Table IS.
Table 16.
Table 17.
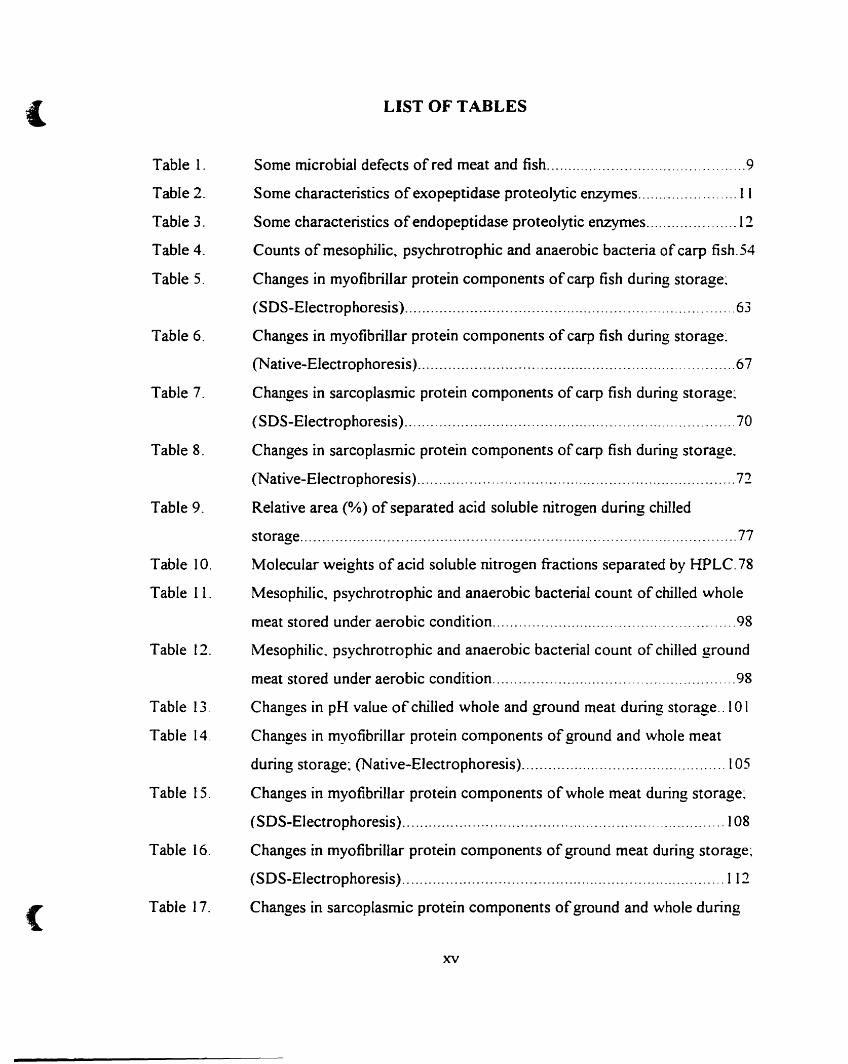
LIST OF TABLES
Sorne microbial defects of red meat and fish 9
Sorne characteristics of exopeptidase proteolytic enzymes '" II
Sorne characteristics ofendopeptidase proteolytic enzymes 12
Counts of mesophilic~ psychrotrophic and anaerobic bacteria of carp fish. S4
Changes in myofibrillar protein components of carp fish during storage:
(SDS-Electrophoresis) 63
Changes in myofibrillar protein components of carp fish during storage:
(Native-Electrophoresis) , ,.. 67
Changes in sarcoplasmic protein components of carp fish during storage:
(SDS-Electrophoresis) 70
Changes in sarcoplasmic protein components of carp fish during storage~
(Native-Electrophoresis) 72
Relative area (%) of separated acid soluble nitrogen during chilled
storage " , 77
Molecular weights of acid soluble nitrogen fractions separated by HPLC. 78
Mesophilic~ psychrotrophic and anaerobic bacterial count ofchilled whole
meat stored under aerobic condition 98
Mesophilic. psychrotrophic and anaerobic bacterial count of chilled ground
meat stored under aerobic condition 98
Changes in pH value of chilled whole and ground meat during storage.. l0 1
Changes in myofibrillar protein components ofground and whole meat
during storage: (Native-Electrophoresis) 105
Changes in myofibrillar protein components ofwhole meat during storage:
(SDS-Electrophoresis) 108
Changes in myofibrillar protein components ofground meat during storage;
(SDS-Electrophoresis) 112
Changes in sarcoplasmic protein components ofground and whole during
xv
1
(
Table 18.
Table 19.
storage; (Native-Electrophoresis) 116
Changes in sarcoplasmic protein components of ground during storage:
(SDS-Electrophoresis) 119
Changes in sarcoplasmic protein components of whole during storage:
(SDS-Eleetrophoresis) 120
XVI
(
(
1. INTRODUCTION
Meat and fish are major protein food commodities in many parts of the world. The
chronic shortage of proteins of high biologicaJ value in developing countries. afong with the
relatively high cast ofmeat and fish provides the justification for research on the quality and
freshness and therefore the preservation and spoifage of these commodities.
Loss of freshness of food in general. is the result of undesirable changes in odour.
colour. flavour. texture or appearance offood when loss offreshness reaches a certain degree.
spoilage results. Spoilage ofmeat and fish can be caused by severaI factors including: rodent.
insect. tissue enzymes. non enzymatic chemical changes. physicaI effect and the action of
microorganisms. Tissue enzymes affect microbiaI deterioration of meat and fish by a1tering
their components sa they are more readily available for microbiaJ use. ln addition. meat and
6sh are good substrates for microorganisms because they have (a) high moisture content. (b)
high levels of nitrogenous components and minerais. and (c) favorable pH and accessory
growth factors.
Protein hydrolysis by microorganisms and by autolysis in meal and fish can produce
a variety of odour and flavour defects: sorne psychotropic spoilage bacteria are strongly
proteolytic and cause undesirable changes. Lipid oxidation is associated with the deterioration
of the quality of meat and fish products particufarly in the presence of unsaturated lipids
(Schaich 1980). The spoifage ofwholecuts ofmeat or fish under refrigeration is primarify a
surface phenomenon resufting in sliminess. lipids. off-odour and taste. discolouration and
souring. During storage, souring can result from action of endogenous enzymes. fatty acid or
laetic acid fonnation by baeteria and proteolysis without putrefaction. CrystaIlization of water
(
and cryo-concentration of solutes ultimately causes disintegration of muscle membrane
systems in meat and fish allowing mixing of tissue enzymes and substrates followed by
reactions resulting in pigment and lipid oxidation.
Assessment ofoverall quality of meat and fish is a major concem for regulatory food
laboratories. In order to determine freshness of meat and fish many physicaL chemical.
biochemical, sensory and microbiologicaI methods have been proposed. The traditional
sensory methods are subjective and costly because they require specially trained personnel.
Microbiological assessment and chemicaI methods do not measure early postmortem
deterioration: they measure bacteriaI spoilage instead of loss of freshness caused by autolysis
shortly after death (Luong et al., 1991). It is important therefore. for methods to be
developed to provide indicators of freshness and deterioration in addition to spoilage.
The fact that proteins (a) represent a substantiaI non-water component ofmeat and
fish and (b) are substrates for degradative processes during storage, provides the basis for
investigating products of proteolysis as indicators of spoilage. Non-protein nitrogen (NPN)
is commonJy used as an indicator for spoilage. Peptides cao be significant compounds ofNPN.
depending on the nature of the initial degraded protein. There is liule information in the
published literature on the quantities and types of peptides which results during degradation
ofmeat and fish protems. The objective ofthe present work was to determine whether specifie
proteins or peptides or groups of products of proteolysis can be identified as indicators of
freshness in fish and meat.
2
(
(
2. LITERATURE REVIEW
2.1. Definition of Spoilage
Meat spoilage has been defined as ..any single symptoms or group of symptoms of
overt microbiaI activity. manifest by changes in meat odour. flavour. or appearance" (Gill.
1986). ln generaL food spoilage is the result ofundesirable change in odour. coIour. flavour.
texture or appearance. Deterioration of food during storage has been attributed to both
autolytic as weIl as bacteriaJ changes (Dainty et al.. 1983). ln muscle tissue autolytic changes
include sorne proteolytic action on muscle and connective tissue and hydrolysis of fat (Anders.
1989). Preliminary hydrolysis ofproteins by meat and fish enzymes facilitates the ability of the
microorganisms to penetrate and grow in the tissue (Anders. 1989). The actual spoilage of
fleshy food has been attributed mainly to the action of contaminating bacteria~ gram negative
organisms have been recognized as the predominant spoilers (Hobbs. 1983).
In generaL food products can be categorized into the following three basic groups: (i)
perishable foods (eg. meat and fish). (ii) partially processed foods that are processed ta
increase the shelf life and are generally refiigerated. and (iii) fully processed food. that have
a long shelf life and are usually held at room temperature.
Like meat, fish may be spoiled by autolysis, oxidation, bacterial activity or by
combination of these. Fish is considered more perishable than meat because of more rapid
autolysis by fish enzymes and because of the less acid conditions which favour microbial
growth. To understand meat and fish spoilage fully it is necessary to know (i) the types of
baeteria and their proportions within the microflora. (ii) the relative contributions ofvarious
3
•
(
factors affecting the growth of spoilage bacteria and (iii) the chemical changes produced
during growth and the end products responsible for off-odour and off-flavour.
2.2. Factors AfTecting Spoilage
Most biological systems experience direct deterioration as a result of the following
types ofaetivities~ physical (by foreign bodies), chemical (water activity, gaseous conditions.
pH). biological (microorganism. bacteria. spores. protozoa. insect). or biochemical
(enzymatic. which are natural catalysts present in food). In addition. food deterioration is
indireetly influenced byenvironmental factors, i.e., temperature, light and time. These factors
cao operate either alone or in combination: however, one ofthem can terminate useful shelf
life before the others become serious (Lambert et al., 1991). Furthermore, the availability of
essential nutrients, such as amino acids and sugars and certain lipids can also effect spoilage
(Gill and Newton. 1980).
2.2.1. Initial Contamination
The inner tissues ofheaIthy animaIs slaughtered under good hygienic conditions are
relatively free from contamination (GilL 1979). Baeteria found on meat originate from the skin
of the animal. from faecal material, soil. water or air. The spoilage in meat and fish is
associated with a particular level of bacteria (Hobbs, (987). The lower the initial
contamination the longer it takes for baeteria to achieve spoilage level. Greer (1989) reported
that the shelflife ofbeef steak with an initial load of 1 x 10² was longer than 3 d at 7°(, while
beef steak with an initialload of6 x 104 cm-! exhibited slime in 2 d at 0 oC: with an initial load
of 1 x 10⁷• the refrigerated shelf life was less than 1 d.
4
(
(
2.2.2. Nutrients
The interaction between microorganism and nunient influence both microbial spoilage
population and spoilage pattern (Lambert et al.. 1991). The level of protein or fat is
unchanged during the onset of rigor and is not a substrate for microorganism attack prior to
the onset of spoilage (Gill and Newton, 1980). Several studies have shawn that in meat the
initial microbial growth occurs at the expense of low molecular weight soluble compounds
formed during postmortem glycolysis (GiIl, 1986). These compounds include glucose.
glucose-6-phosphate and lactic acid (Eskin, 1990).
Pseudomonas species preferentially use glucose as substrate at the surface of rneat
(Gill and Newton, 1978). and then later use amino acids as substrate with the consequent
production of sulfides. esters and acid (Gill. 1986 and McMeeking. 1982). However. when
oxygen is limiting, glucose concentration is considered to have a limiting effect on the
microbial 5poilage pattern. Depletion of glycogen supplies occurs in muscle of live animaIs
as a result of stress. starvation~ or fright prior to slaughter. This can lead to a higher pH and
low concentration oflow molecular weight substances, this favouring spoilage.
2.2.3. pH and Acids
Microorganisms are significantly affected by the pH of growth medium because of the
absence ofa mechanism for adjusting their internai pH (Corlett and Brown. 1980). Not only
are the rates ofgrowth of microorganisms affeeted by pH. but also the rates of survival during
processing (1ay, 1992). Foods with low pH values (below 4.5) usually are not readily spoiled
by bacteria and are more susceptible to spoilage by yeast and molds and therefore. are
microbiologically more stable than neutral foods (Gill. 1986). Growth of most bacteria is
5
( favoured by neutraI pH although sorne. such as those that fonn acid. are favoured by
moderate acidity while others. such as proteolytic active bacteria in the white of stored eggs.
can grow in alkaline media. Inhibition of microorganisms by acids depends on strains.
incubation., temperature. types ofacid. and concentration. At the same pH vaIue. for example.
inhibition ofL. monocytogenes by various acids follows the arder: acetic > lactic > citric >
malic > hydrochJoric. However. storage temperature has an affect: in the presence ofequal
concentration at 1DoC. the order is: maIic > citric > acetic > lactic > hydrochIoric while at 25
and 35°C. the order was citnc > malic > lactic > acetic > hydrochIoric (Jay. 1992). The initial
pH may be suitable or restrictive for the growth of bacteria., however gro\\'th of competitive
bacteria or the growth of the organism itself could aIter the pH so that it beeomes more
favourable or unfavourable for growth (Glass and Doyle. 1991).
2.2.4. Water Activity (aw)
Microorganisms have an absolute demand for water, for without water no growth ean
oecur. Water activity is eonsidered as a limiting factor ofmicrobial groWlh as it determines
the osmotie stress (Franks. 1991). Each microorganism has a critical ~. below which groWlh
cannot oceur. For example pathogenic bacteria cannot grow at élv,. < 0.086. yeast and molds
are more tolerant. but show no growth at ~. < 0.62 (Hayes. 1992). On the other hand most
bacteria can grow at élw of 0.85 to 0.98. Factors affecting the a~ requirement of
(
microorganisms includes type and strain of microorganism. substrate. pH. availability of
oxygen. temperature. types of solute. and presence of inhibitory substances (Tapia de Daza
et al.. 1991). Chirife (1994) reviewed the ~. requirements for growth of several pathogenic
bacteria and suggested that minimal élw aIlowing growth was independent of the type of
6
(
(
dissoIved solute. typicaIly sodium chloride. sucrose. glucose. or potassium chloride Frank
( 199 1J stated that a... did not prediet the relative usefulness of additives for antirnicrobial
stabilizarion. The concept ofVialer dynamics has been proposed to replace the use of~ values
to prediet microbial stability of concentrated and intermediate moisture food systems
However. Chirife and Buera ( 1994) showed that water dynamics does not permit prediction
of microbial stabiIity of food v.ith confidence
2.2.5. Temperature
Temperarure is considered the most imponant en\.ironmentaI factor influencing both
the rates of chemica1 reactions linked to the processes of microbial grov.lh and the spoiIage
bacteria population (Lamben et al .. 1991 J. Four physiological groups of baeteria may be
distinguished on the basis of their temperature relationships A great deal of confusion
surrounds the use of terms psychrophiIe and psychrotroph in the literature \1orita ( 1975)
pointed out that the term psychrophiIe has been used incorrectly and suggest that trus
terminology be restricted to organisms Vlith optimum temperarure of 15 QC or Jess. a
maximum of20 CC and a minimum of0 "c The term psychrotroph refers to organisms v.-hJch
can grow al refiigeration temperature. but have temperature optima greater than 20 "c The
temperature v.111 determine which spoilage microorganism is predominant For example
PseudomollG..S maintain a grov.lh rate advantage over competing psychrotrophs and
mesophiles at ternperarure approaching 20 OC \Vhen the temperature is doser to optimum for
mesophyllic ternperarure gro",lh (30 /jC). Pseudomonas are replaced by mesophyllic stains of
AClIlelo!xu:ter and Enrerobactenaceae as the dominant aerobic spoiIage population (Gill and
'e\\lon. 1980) Cnlike psychrophile. psychrotroph grov.-th would decrease as a result of a
7
(
(
small decrease in temperature (below 5 OC) (Hanus and Morita. 1968). Therefore. this can
affect the development of psychrotrophs which are the organisms of concem in the spoilage
of remgerated meat and fish.
The effect oftemperature on microbial growth cannat be considered in isolation~ other
factors (e.g.. élw ) in combination with temperature ultimately determine the spoilage of a food
stored under particuIar set of conditions (Mossei. 1971). A decrease in temperature below 0
OC lowers the water activity of stored meat and fish~ hence. spoilage above 0 oC is the result
of bacteria. while in the frozen state. yeasts and mouIds are the predominant spoilage
organisms (Jay, 1992).
2.2.6. Atmospheric Conditions
The shelflife ofmeat and fish cao be extended at refrigeration temperature « 4°C):
SpoiIage will occur due mainIy to aerobic. psychrotrophic bacteria, unless additional control
measures are taken to modify the environmentaI storage condition (Lambert et al.. 1991).
Two major innovations in packaging systems are modified and controlled atmospheric
packaging, (MAP and CAP systems. respectively). MAP systems alter the atmosphere
surrounding the produet with one packaging process. while CAP systems continuously control
the composition ofthe atmosphere surrounding the product (Gill. 1986). For meat packaging.
the lower the oxygen transmission rates the better the end product quaIity. This is not the case
with fish and fish product (Jay, 1992)~ oxygen is a critical component when applying MAP
to fresh fish since certain 6sh are naturally contaminated with C. hOlulinum, type E.
(anaerobic bacteria). The spoilage which develops on chilI stored meats is detennined to a
large extent by the storage atmosphere (Jay, 1992). Pseudomonas spp. are typical spoilage
8
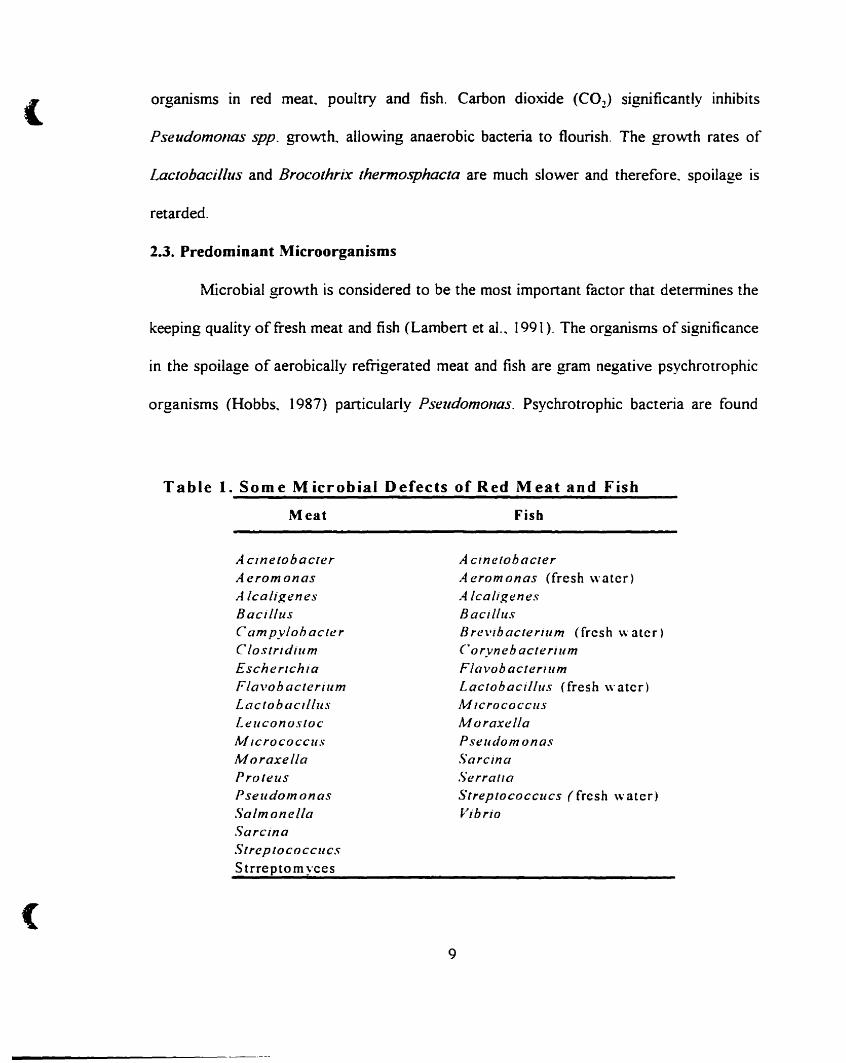
(organisms 10 red meat poultry and fish. Carbon dioxide (CO:!) significantly inhibits
Pseudomonas spp. growth. allowing anaerobic bacteria to flourish. The growth rates of
Lactobacil/us and Brocothrix rhermosphacta are much slower and therefore. spoilage is
retarded.
2.3. Predominant Microorganisms
Microbial growth is considered to be the mast important factor that determines the
keeping quality of fresh meat and fish (Lambert et al.. 1991). The organisms of significance
in the spoilage of aerobically refiigerated meat and 6sh are gram negative psychrotrophic
organisms (Hobbs. 1987) particularly Pseudomonas. Psychrotrophic bacteria are found
Table 1. Sorne Microbial Defects of Red Meat and Fish
(
Meat
A cinetobacterAeromonasA lcaligenesBacil/usC ampylohaclerC lostridiumEscherlchlaFlavobacterlumLaclobaClllllsLellconostocN/lcrococcusMoraxellaProleusPselldomonas,Ç,'almonelfaSarcina.s'lreplococCllCSS trreptom yces
9
Fish
A cmelohaclerA erom onas (fresh w atcr)A lcaliKenesBacil/usBrevibaclerlllm (frcsh w atcr)Coryneb aclerlumFlavobacreriumLaclobacillus (fresh watcr)M IcrococcusMoraxellaPselldomonasSarcma,S'errallaStreplococCUcs (fresh water)Vibrio
(
primarily in the genera Pselldomollas~ Flavobacterium, Achromobacter and Alca/igelles.
although Micrococcus, Lactobacil/us, Ellterobacter, Arthrobacter aise contain
psychrotrophic species (Palumbo, 1985 and Hayes, 1992). The relative spoilage potential of
bacteria depends on which groups or species predominate and on their ability to form
malodorous compounds, such as H!S. volatile amines, esters and acetone (McMeeking. 1982).
The types of microorganisms which contaminate meat and fish vary considerably
because of the differences in meats and fish. Common spoilage and pathogenic
microorganisms associated with meat and fish are shown in Table 1. The flora of living fish
depends on the microbiai content of the waters in which they live. The bacteria on fish from
northem waters are primarily psychrophiles, while fish from tropical water carry more
mesophiles. Fresh water fish carry fresh water bacteria, which include the common genera
found in salt water plus species ofAeromonas. Lactohacil/us, Brevihacterium. Alcaligenes
and Streptococclls.
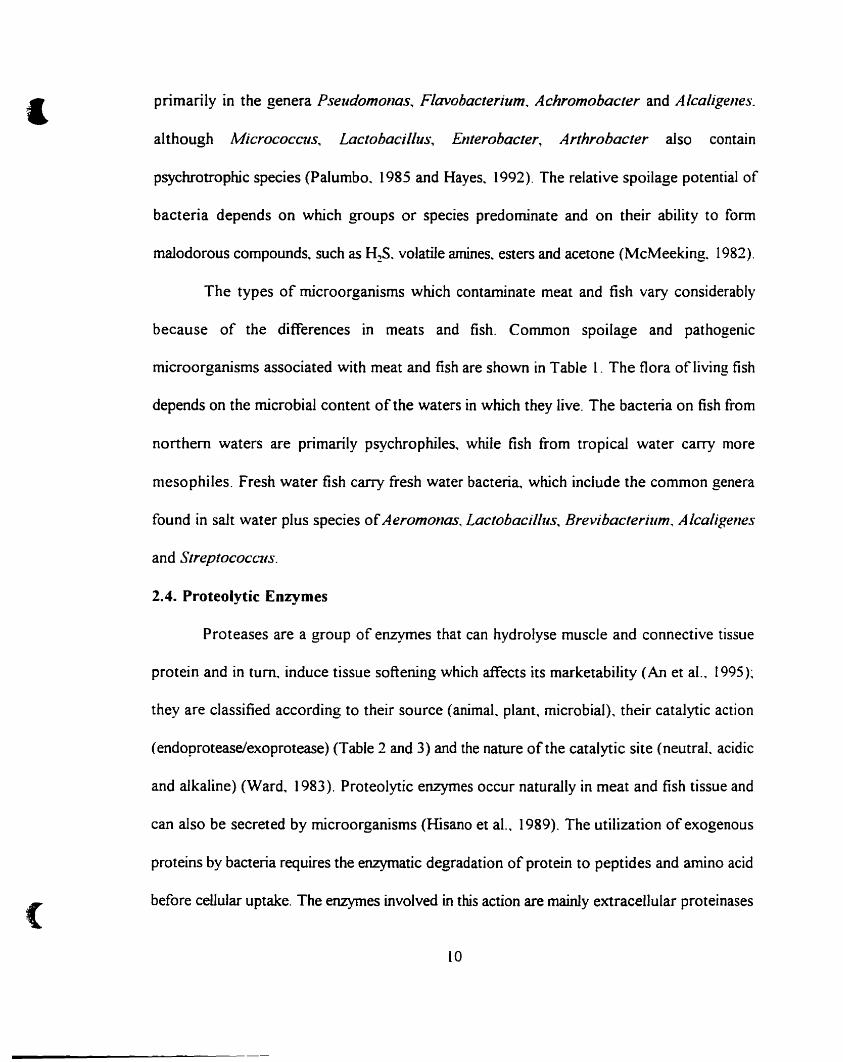
2.4. Proteolytic Enzymes
Proteases are a group of enzymes that can hydrolyse muscle and connective tissue
protein and in turn. induce tissue softening which affects its marketability (An et al.. 1995):
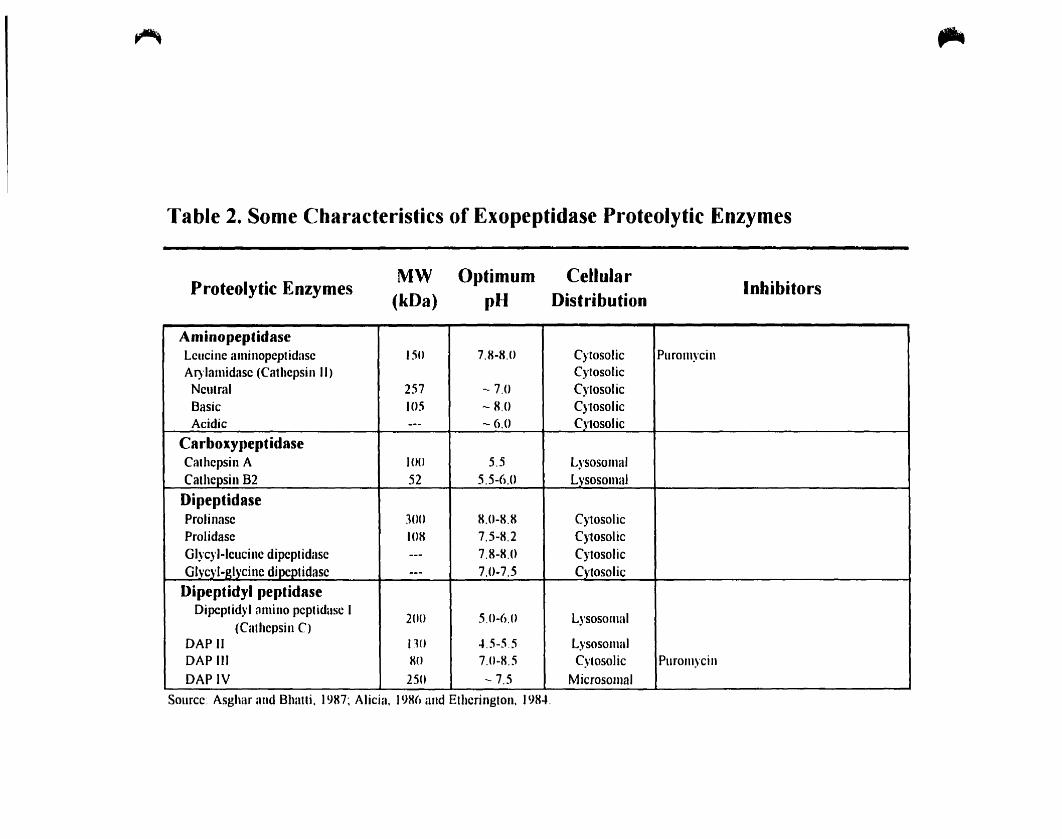
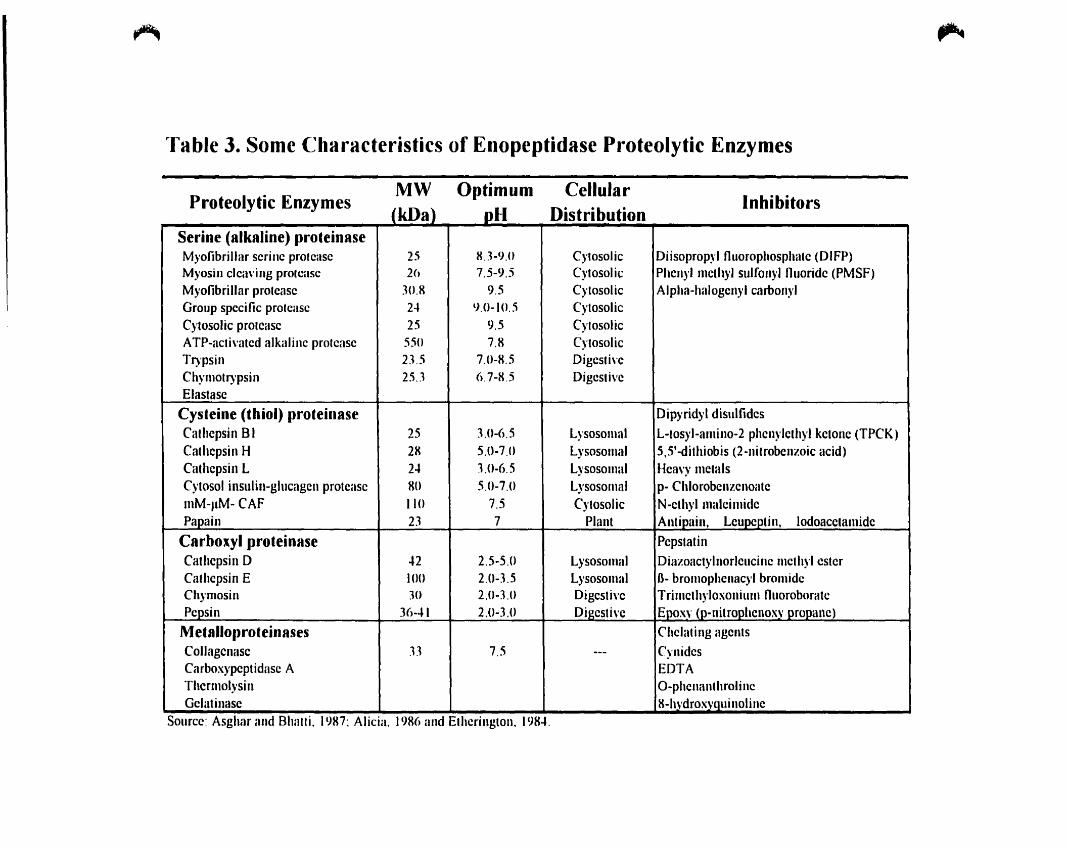
they are classified according to their source (animal. plant. microbial), their catalytic action
(endoproteaselexoprotease) (Table 2 and 3) and the nature of the catalytic site (neutral, acidic
and alkaline) (Ward. 1983). Proteolytic enzymes occur naturally in meat and fish tissue and
can also be secreted by microorganisms (Hisano et al.. 1989). The utilization of exogenous
proteins by baeteria requires the enzymatic degradation of protein to peptides and amino acid
before cellular uptake. The enzymes involved in this action are mainly extracellular proteinases
10
,.,
Table 2. Sorne Characteristics of Exopeptidase Proteolytic Enzymes
,..
Proteolytic EnzymesMW
(kDa)Optimum
pHCellular
DistributionInhibitors
AminopeptidaseLcucine aminopcptidasc ISO 7.H-H,O Cylosolic PuromycinAI)'lamidasc (Cathcpsill Il) CytosolicNeutral 257 - 7.0 CylosolicBasic 105 - H,O CytosolicAcidic --- - 6.0 Cytosolic
CarboxypeptidaseCalhcpsin A IO() 5.5 LysosomalCathcpsin 82 52 5.5-6.U Lysosomal
DipeptidaseProlinasc ]()O H.0-8.8 CytosolicProlidase 108 7.5-8.2 CytosolicGI)'c)'I-leucinc dipeptidasc --- 7.8-K.U CytosolicGlvcyl-Jdycinc dipcptidasc --- 7.0-7.5 Cytosolic
Dipeptidyl peptidaseDipcplidyl flmino peptidase 1
200 5,0-6.0 Lysosomal(Calhcpsin C)
DA? Il no ".5-55 LysosomalDAP III xo 7.0-X.5 Cytosolic PuromycinDAPIV 250 - 7.5 Microsomal
Source: Asghar and Bhatli. )987: Alicia, J9X() and Etherington, J98...
~
"fable 3. Sorne Characteristics of Enopeptidase Proteolytic Enzymes
,...
Proteolytic EnzymesMW °l)timum Cellular
Inhibitors
Serine (alkaline) pro.einaseMyofibrillar serine prolease 25 8.1-9.0 Cytosolic Diisopropyl fluorophosphate (DIFP)Myosin c1ea\'ing proleasc 26 7.5-9.5 Cytosolic Phenyl mcth}'1 sulfonyl fluoride (PMSF)Myofibrillar protease 10.R 9.5 Cytosolic Alpha-halogcnyl carbon)'1Group specific prolease 24 lJ.O-IO.5 CytosolicCytosolic protcasc 25 9.5 CytosolicATP-acti\'atcd alkalinc prolcasc 550 7.R CytosolicTl)'psin 2J.5 7.0-R.5 Digcsti\'cChymotl)'psin 25..1 6.7-R.5 Digesti\'cElastasc
Cys.eine (thiol) proteinase Dipyridyl disulfidcsCathcpsin BI 25 lO-6.S Lysosomal L-tosyl-alllino-2 phcnylcthyl kctonc (TPCK)Cathcpsin H 2R 5.0-7.0 Lysosomal 5,51-dithiobis (2-nitrobcnzoic acid)Cathcpsin L 2~ lO-6.5 Lysosomal Hca\'}' mctalsCytosol inslilin-glllcagcn protcasc HO 5.0-7.0 Lysosomal p- ChlorobcnzcnoatemM-J1M- CAF 110 7.5 Cytosolic N-cthyl malcimidcPapain 2.1 7 Plant Antipain, Lcupcptin, lodoacctamidc
Carboxyl proteinase PcpstatinCathcpsin D ..2 2.5-5.0 Lysosolllai Diazoactylnorlcllcinc mcthyl esterCathcpsin E 100 2.0-3.5 Lysosomal B- bromophcnacyl brolllidcCh)'mosin JO 2.0-3.U Digcsti\'e Trilllcthyloxonilllll flllOfohoratcPepsin 36-"1 2.0-3.0 Digcsti\'c Epoxy (p-nitrophenoxv propane)
Metalloproteinases Chclating agentsCollagcnasc .B 7.5 --- CynidcsCarboxypeptidasc A EDTAThcrmol)'sin O-phcnanthroli neGclatinasc R-h\'drox\,Quillolinc
Source: Asghar and Bhatli. 19H7; Alicia. 19R() and Ethcrington, 19R4.
(
(
(Lee and Chang, 1990). AlI bacteria have intracellular proteinases, but only a limited number
have extracellular proteinases (Ward, 1983). Many bacterial species are known to produce
extracellular proteinases: for example. many of the species of Baci/lus (Ward. 1983).
Pseudonomas (Hisan0 et al.. 1989). Clostridium (Kalchayanand et aL 1989). and Proteus
(Baeza et al.. 1990) considered as proteolytic baeteria.
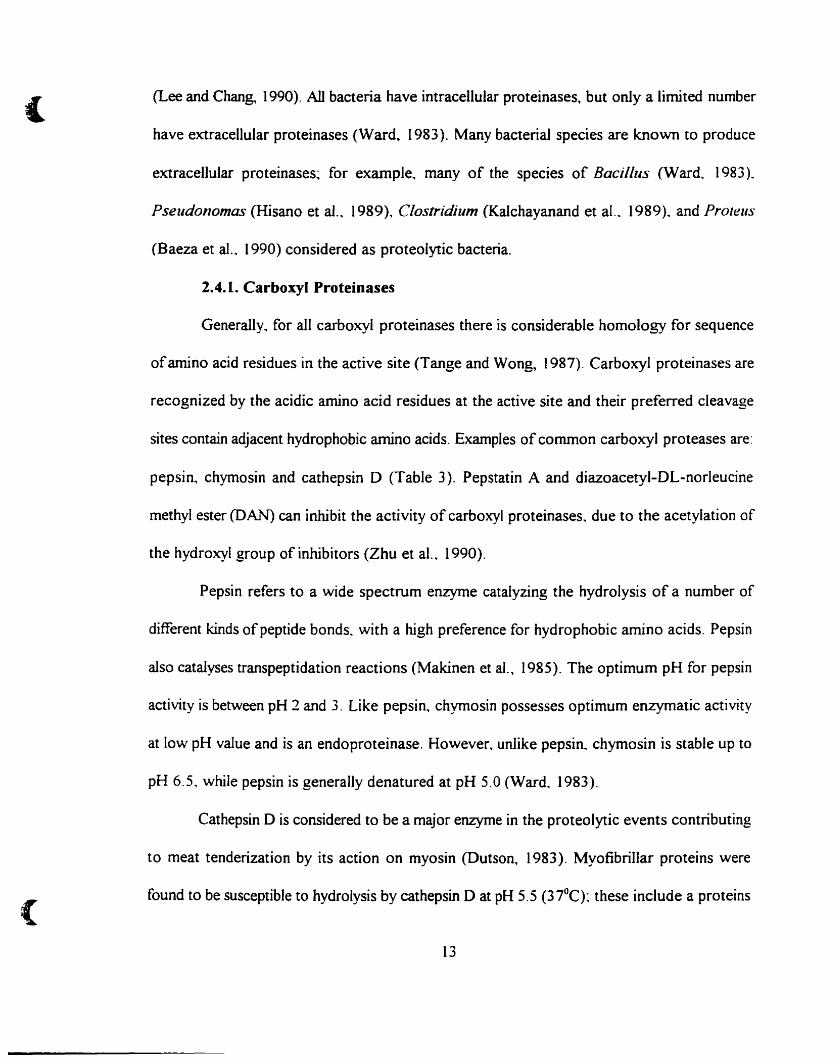
2.4.1. Carboxyl Proteinases
Generally, for ail carboxyl proteinases there is considerable homolagy for sequence
ofamino acid residues in the active site (Tange and Wong, 1987). Carboxyl proteinases are
recognized by the acidic amino acid residues at the active site and their preferred cIeavage
sites eontain adjacent hydrophobie amino acids. Examples of common earbaxyl proteases are:
pepsin, ehymosin and eathepsin D (Table 3). Pepstatin A and diazoaeetyl-DL-norleucine
methyl ester (DAN) can inhibit the aetivity of earboxyl proteinases. due to the aeetylation of
the hydroxyl group of inhibitors (Zhu et al.. 1990).
Pepsin refers to a wide speetrum enzyme catalyzing the hydrolysis of a number of
different kinds ofpeptide bonds. with a high preference for hydrophobie amino aeids. Pepsin
a1so catalyses transpeptidation reaetions (Makinen et al., 1985). The optimum pH for pepsin
aetivity is between pH 2 and 3. Like pepsin. ehymosin possesses optimum enzymatie activity
at low pH value and is an endoproteinase. However. unlike pepsin. ehymosin is stable up ta
pH 6.5. while pepsin is generally denatured at pH 5.0 (Ward, 1983).
Cathepsin D is eonsidered to he a major enzyme in the proteolytie events eontributing
to meat tenderization by its action on myosin (Dutson, 1983). Myofibrillar proteins were
found ta be susceptible to hydrolysis hy cathepsin D at pH 5.5 (37°C): these incIude a proteins
13
{
(
named titin (Wang et aL 1979) and connectin (Maruayama et al.. 1980). Lasalle et al. (1983)
eonsidered titin and eonneetin to be the same protein. Myosin (both heavy and light chains)
was rapidly degraded by Cathepsin 0 (Zeeee and Katoh. 1989) while Kirschke and Barret
(1987) reported that the enzyme did not degrade mature collagen or gelatin. Cathepsin 0
activity under normal temperature aging ofmeat (O-4°C) has not been observed (Bandsman
and Zandis, 1988); there is very little or no aetivity at 1SoC and maximum activity occurs at
4SoC and pH S.S (Zeeee and Katoh, 1989). Activity of Cathepsin D can be inhibited by
microbiaI peptides. pepstaine and diazo compounds. Cathepsin 0 is active over the pH range
3 to 5.
The mierobial carboxyl proteases are widely distributed in molds and yeasts. but
seldom found in baeteria: their optimum pH is at 2.S-S and they are sensitive to acid
proteinase inhibitors (Zhu et al., 1990). Like pepsin, mierobial earboxyl proteinases exhibit
specifieity toward Ct-amino groups ofhydrophobic amino acids (Ward, 1983). Matsubara and
Feder (1971) have proposed that microbial carboxyl proteinases ean be ciassified either as
pepsin-like enzymes or rennin-like enzymes.
2.4.2. Serine Proteinases
Trypsin and chymotrypsin are common examples of serine proteases (Table 3).
AIthough the meehanism of catalysis for ail serine proteases is similar. there are different
specifieities toward the peptide bond depending on the presence of basic. aromatic. or
hydrophobie amino acids (Trevor, 1991). For example. during digestion trypsin acts as a very
specifie endo-proteinase, ooly the peptide bonds whose carbonyl groups are donated by basic
side chains of lysine and arginine are hydrolyzed (Trevor, 1991 ). On the other hand,
14
chymotI)'psin catalyses the hydrolysis of the peptides whose carbonyl groups are donated by
aromatic amino acids.
Morihara and Tsuzuki (1971) classified the serine microbial proteinases into 4 main
groups: trypsin-like proteinases. alkaline proteinases. Myxobacter a-Iytic proteinases and
staphylococca1 proteinases. Microbial trypsin-like proteinases exhibit specificity for carboxyl
groups which are donated by amino acids with basic side chains. The second group shows
a specificity toward aromatic or hydrophobic residues. The third group exhibits specificity for
small aliphatic residues: the acidic residues at the carboxyl side act as a specific splitting point
for the fourth group (Ward. (983).
2.4.3. Metallo Proteinases
Carboxypeptidases, aminopeptidases, gelatinases, prolidases. and collagenases belong
to a group of enzymes which contain divalent metal ions in their active site (Table 3). The
enzymes can be inactivated by metal chelating agents. such as EDTA. 1.1 O-phenathnoline.
glycyltrosine. and sulthydryl-blocking agents (Table 3).
Carboxypeptidases contain one atom ofzinc per mole. and are exopeptidases. since
they catalyse the hydrolysis of peptide bonds in sequence (particularly peptides with aromatic
and branched side chain amino acid) at the C-terminal end ofprotein and polypeptides. The
carboxypeptides enzyme catalyses the further hydrolysis of chymotrypsin and trypsin
produced polypeptides to release some important essential amino acids for assimilation.
Therefore. the composition and range of peptides produced is controlled sequentially by the
ordered action of pepsin. the serine proteinases and carboxyl peptidases.
Collagenase hydrolyses collagen and is considered important in the characterization
15
(
(
of deteriorated meat (Hisan0 et ai.. 1989). Collagenase has been found in many vertebrates
and microorganisms. Hisano et al. (1989) isolated two kinds of eollagenolytic enzymes trom
Pseudomonas spp and concluded that the purified enzyme shows both collagenolytic and
caseinolytic activity. Collagenases have also been found in Clostridium hislolilieum. libno
argino(vticus. Vibrio 8-30 and Streptomyces spp. (Endo et al .. 1987)
The rnicrobial metallo proteinases can be divided into four groups: neutral and alkaline
proteinases. and Myxobaeter proteinases l and II. (Hisano et al.. 1989). The neutral
proteinases show speeificity toward hydrophobie amino aeid residues. while alkaline
proteinases exhibit very broad speeificity: Myxobacter proteinases [ are specifie for small
amino acid molecules at either side of the splitting point (Ward. 1983).
2.4.4. Cysteine Proteinases
According to Goll et al. (1983 b). the major cysteine proteinases are Cathepsin B. L
and H (Table 3). These enzymes show optimum pH in the range of 5.5 to 6.0 (Kirschke and
Barret. 1987) (Table 3). The mode of action ofthese enzymes is considered to be similar to
that ofserine proteinases (Trevor. 1991): however. \VÏth cysteine proteinases. the nucleophilic
attack on the carbonyl carbon atom of the peptide is by polarized -SH group. As a group.
cysteine proteinases are inhibited by chemieal reagents which react with -SH group such as
Hg-:. 4-Chloromeruriben Zoate. N-ethyl maleimide and iodoacetic aeid (Robinson. 1987)
Bojork and Karin. (1990) reported that the cysteine proteinase inhibitor cystatin (from chicken
egg white) bond to cysteine proteinases aetinidin. chymopapain A. ficin and papain: the
inhibition was reversible. Bandsman and Zandis (1988). suggested that eysteine proteases and
carboxyl type proteinases are responsible for myosin degradation in muscle.
16
&
(
Pap~ a mixture of proteinases obtained by tapping the unripe fruit of papaya while
still on the plant, is a cysteine proteinase used industrially to convert protein molecules into
simpler peptides (Baeza et al.. 1990).
The microbial cysteine proteinases have neutral pH optima and are sensitive to
cysteine inhibitors. They are classified into two groups based on specificity: Clostnripain
which exhibits stringent specificity against basic amino acids at the carboxyl side and
streptococcaI proteinases show broader specificity (Ward. 1983).
2.S. Quality and Freshness
Freshness is a property of fish and meat that have a considerable influence on their
quality~ it is the most important criterion for judging the quality of most fish and meat
produets (Howgate, 1982). Loss offreshness, foUowed by spoilage, is a complex cornbination
of microbiologjcaL chemicaL and physica1 processes (Pedrosa and Regenstein, 1990). Usually
sorne specific property of the spoilage process is measured and used as an index of the stage
of spoilage (Connell et al.. 1976). However. quality is determined by severaI factors. sorne
being more important than others (Pedrosa and Regenstein. 1990).
2.5.1. Sensory (Organoleptic Methods)
As meat and fish spoiL there is a sequence of changes that are readily detectable by
the human senses (sight touch. smell and taste). Sensory methods are considered the most
satisfactory way of assessing the freshness of meat and fish products (Connell et aL 1976)
These methods are quick and often nondestructive unless the samples are being cooked and
mest importantly. can be closely related to the criteria the consumer uses in evaluating food
acceptability (Pedrosa and Regenstein. 1990). Therefore, sensory methods offer the most
17
(
(
appropriate rneans of detennining the expeetation of the consumer (Connell et aL 1976)
However. sensory methods have sorne degree of subjectivity The same quality measured in
different places. at different times. or by different inspeetors. could be estimated to have a
different quality (Morin. 1989).
2.5.2. Physical ~Iethods
Many tests have been deveIoped to monitor the physical changes that take place in
meat and fish. Refraetive index.. texturaI changes. eleetrical conducti\-ity. optical tests. surface
tension. viscosity. drip. and internaI friction are sorne physical tests re\-iewed by Gould (1971 )
The Torryrneter is widely used to rneasure spoilage in fish. it measures changes in the
dielectric properties offish as spoilage proceeds (Connen et al.. 1976) This method is based
on the difference between the ratio of two electrical resistances of the cell tissue as measured
by eleetricaI currents of different frequencies (Pedrosa and Regenstein. 1990) The
disadvantages ofan earlier instrument Vlere resolved by measuring the power factor of intact
fish. The power factor decreases uniformly as the fish and rneat spoils (Cheyne. 1975). Since
the power factor is dependent on temperature. an automated correction thermistor in the
apparatus gives readings corrected to temperature. ln generaI. most physical tests have not
shoVYTI satisfactory correlation \\;th freshness of rneat and fish (Pedrosa and Regenstein.
1990)
2.5.3. Physico-Chemical Methods
Physico-chemical tests used to determine the freshness of meat and fish include pH
rneasurement. the titratable alkalinity (TA). and extraet release volume (ERV)
2.5.3.1. pH
18
(
(
Yamanaka (1990) studied the use ofpH as a potential index for freshness offish~ and
found an initial decrease followed by increase at the onset of decomposition. Consequently.
pH might be useful as an index for the stage of initial decomposition ooIy. Relatively smaii
increase in pH.. along with the fact that the change is not usuaIly uniformly distributed. makes
direct pH measurement unsuitable for detecting incipient spoilage (Shelef and Jay. 1970).
2.5.3.2. Titrah/e A/kali/ury Aeidity (TA)
The TA method is based on the faet that as meat undergoes refiigerator spoilage. there
is a graduaI increase in the production of alkaline substances by the spoilage flora. The level
ofthese substances was measured by titrating filtered aqueous extract of meat and fish to pH
5.00 (Shelef and Jay. 1970). The TA value is affected by both acids produced by
microorganisms and amino acid metabolism leading to production ofammonia (Sutherland
et al .. 1976).
2.5.3.3. Extraet Release rolume (ER!)
The measurement of ERV is a simple objective method for assessing freshness of
refrigerator-stored meat and fish. It was intraduced in 1964 (Jay. 1964) and has since been
applied to pork (Bonon et aI.. 1968). seafood products (Shelef and Jay. 1971). and vacuum
packaged meat (Patterson and Gibbs. 1977).
2.5.3. -1. Laelie Acid Determination
Changes in other constituents like glucose. glycogefL and lactic acid are aIso examined
as freshness indicators of meat and fish (Sutherland et al.. 1976). Lactic acid determination
is based on the addition of CuSO~ and solid calcium hydroxide ta aqueou5 meat and fish
extraet to remove substances which might interfere with laetic acid determination. Lactic acid
19
(
can be estimated by the method of Barker and Summerson (1941) which is based on
converting laetic acid into acetaldehyde by treatment with concentrated sulphuric acid and the
consequent determination ofacetaldehyde by its color reaction with p-hydroxydiphenyl in the
presence of cupric ions. read at 560nm. Sutherland et al. (1976) reported that there is no
correlation of lactic acid concentration with the proportion of lactic acid bacteria in the
microf1ora. maybe due to the further metabolism of lactic acid by the remainder of the
rnicroflora. Lactic acid and carbohydrate determination is therefore not a useful method for
evaluating the overall bacteriological condition of packaged meat and fish.
2.5.4. Fat and Lipid Oxidation
Fat oxidation is an important deterioration reaction causing flavour. colour. and
texturai changes associated with rancidity (Pedrosa and Regenstein. 1988). Lipid hydrolysis
is a common postmortem feature in meat and fish. The major products are free fatty acid
(FFA) and glycerol. Hydrolysis is caused either by lipolytic activity of fish and meat or by
bacterial lipases during meat and fish storage (pedrosa and Regenstein, 1988). A variety of
procedures have been proposed for estimating lipid oxidation in meat and fish. Among the
most widely used methods are determination of thiobarbituric acid. free fatty acid and
peroxide value.
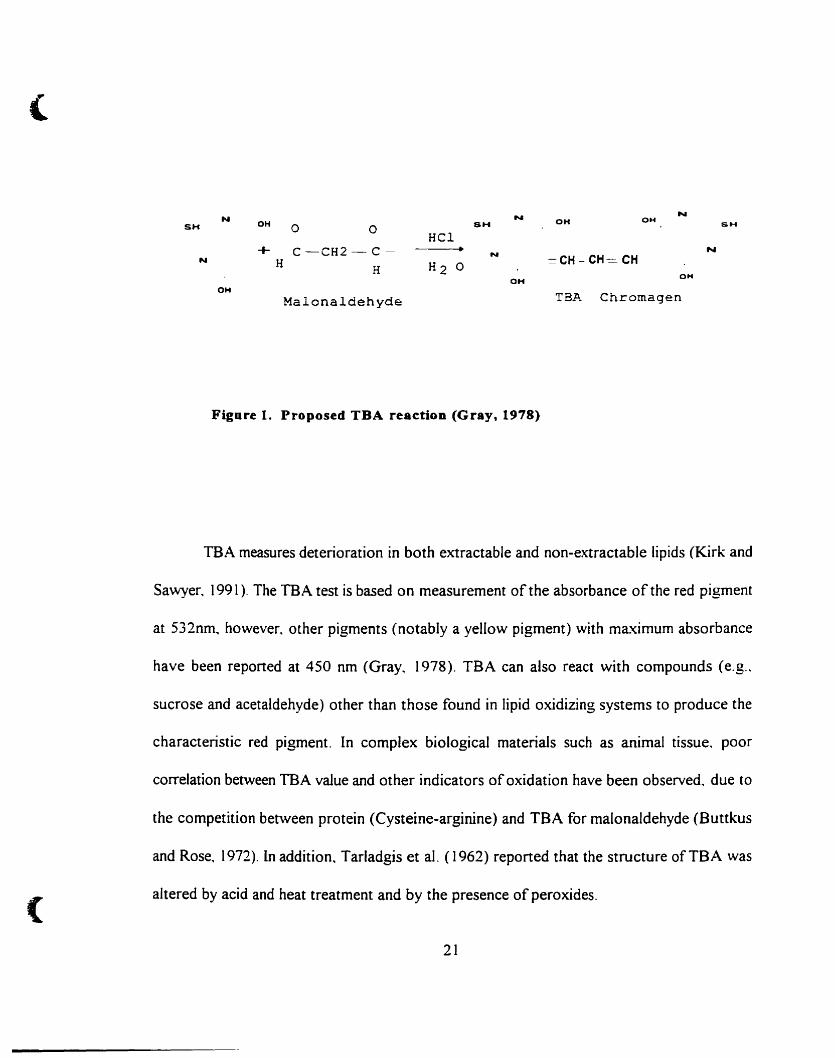
2.5. -/.1. Thiobarhilliric Acid (TBA)
The thiobarbituric acid (TBA) test is one of the more commonly used methods for the
detection oflipids oxidation (Gray, 1978). A red pigment is formed as result of a condensation
reaetion oftwo molecuJes ofacidified TBA with one molecule of malonaldehyde, a secondary
product in the oxidation of polyunsaturated fatty acids (Figure 1).
20
(
(
N N NOH OH
SH OH 0 05H SH
HCl+ C-CH2-C- N
NN H H2 0 =CH - CH-=. CH
HOH
OH
OHTSP.. ChromagenMalonaldehyde
Figure I. Proposed TBA reaction (Gray, 1978)
TBA measures deterioration in both extractable and non-extractable lipids (Kirk and
Sawyer. 1991). The TBA test is based on measurement of the absorbance of the red pigment
at 532nm. however. other pigments (notably a yellow pigment) with maximum absorbance
have been reported at 450 nm (Gray. 1978). TBA can also react with compounds (e.g..
sucrose and acetaldehyde) other than those found in lipid oxidizing systems to produce the
characteristic red pigment. In complex biological matenals such as animal tissue. poor
correlation between TBA value and other indicators of oxidation have been observed. due to
the competition between protein (Cysteine-arginine) and TBA for malonaldehyde (Buttkus
and Rose. 1972). ln addition. Tarladgis et al. (1962) reported that the structure ofTBA was
altered by acid and heat treatment and by the presence of peroxides.
21
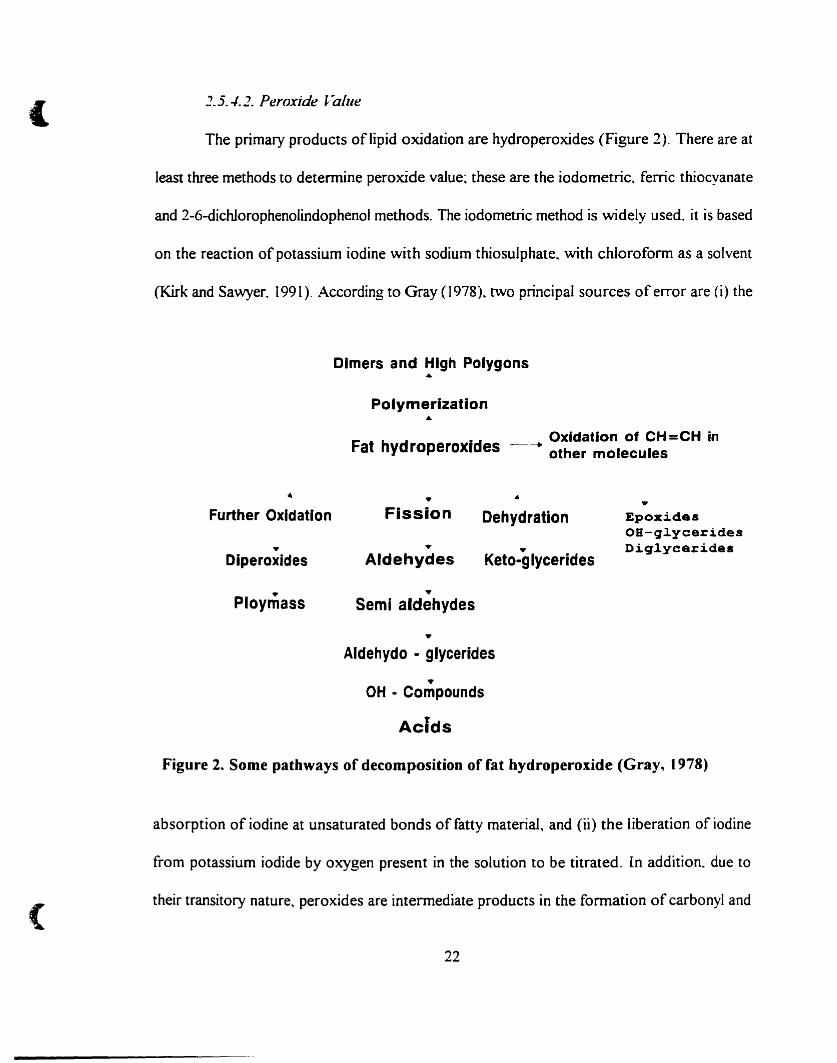
( 2.5.-/.2. Peroxide Value
The primary products of lipid oxidation are hydroperoxides (Figure 2). There are at
least three methods to detennine peroxide value: these are the iodometric. ferric thiocyanate
and 2-6-diclùorophenolindophenol methods. The iodometric method is widely used~ it is based
on the reaction of potassium iodine with sodium thiosulphate. with chloroform as a solvent
(Kirk and Sawyer. 1991). According to Gray (1978). two principal sources of error are (i) the
Dlmers and High Polygons•
Polymerization•
Fat hyd roperoxldesOxldation of CH =CH in
-------+other molecules
• •....
Further Oxldation
•Diperoxides
•Ploymass
Fission
•Aldehydes
•Semi aldehydes
•
Dehydration
•Keto-g Iycerides
Epox~dea
oa-q.1yceridesDi.q~ycerides
{
Aldehydo - glycerides
•OH • Compounds
Acfds
Figure 2. Sorne pathways of decomposition of fat hydroperoxide (Gray, 1978)
absorption of iodine at unsaturated bonds of fatty material, and (ii) the liberation of iodine
from potassium iodide by oxygen present in the solution to be titrated. ln addition. due to
their transitory nature, peroxides are intermediate products in the formation of carbonyl and
22
1
(
hydroxy compounds (Figure. 2). Consequently. determination ofperoxides concentration as
a measure oflipid oxidation. has certain limitations (Gray, 1978).
2.5.5. Microbial Methods
The number of microorganisms found in meat and fish can be a reliable indicator of
the state offreshness ofmeat and fish (Pedrosa and Regenstein~ 1990). The two most widely
used types ofmicrobiological methods are the standard plate count (SPC) and the selective
plate count. A SPC test gives a comparative measure of the overall degree of contamination
for which the temperature of incubation should aIways be quoted since the type (psychrophilic
or mesophilic) and rates ofbacteriaI growth critically depend on temperature (Connell et al..
1976). The selective methods utilize a special media that selectively favors the growth of a
particular group of organisms such as pathogenic bacteria (Pedrosa and Regenstein~ 1990).
Microbiai methods for assessment offreshness have certain disadvantages. Firstly. not
ail species of bacteria present on meat and fish causes spoilage. As spoilage proceeds. the
number of spoilage organisms as a proportion of the total bacteria population changes
Secondly, most bacteriological tests require two to three days to complete. Thirdly. as various
new methods of preserving meat and fish are tested. the level of bacteria that would indicate
problems might change. In the extreme case. the spoilage. of even fresh meat and fish. would
no longer be basically microbiological (Pedrosa and Regenstein. 1990).
2.5.6. Nucleotide Degradation Products
2.5.6.1. Hypoxanthi/1 (Hx) Tests
Hypoxanthin (Hx) is a nonnal constituent of fish. although it is present in very low
concentration in the living animal. It is the end product of the series of enzymatic breakdown
23
(
(
reaction ofATP (pedrosa and Regenstein. 1990). After death. hypoxanthine inereases in most
species and can thus be used to diseriminate between different degrees of good quality of meat
and fish (Howgate. 1982). An enzymatie test method. uses the enzyme xanthine oxidase to
eonvert hypoxanthine to xanthine and then to urie aeid (Figure 3) whieh is measured
spectrophotometricallyat 290 nm(Jahus et al.. 1976).
2.j.6.2.K-~a/ue
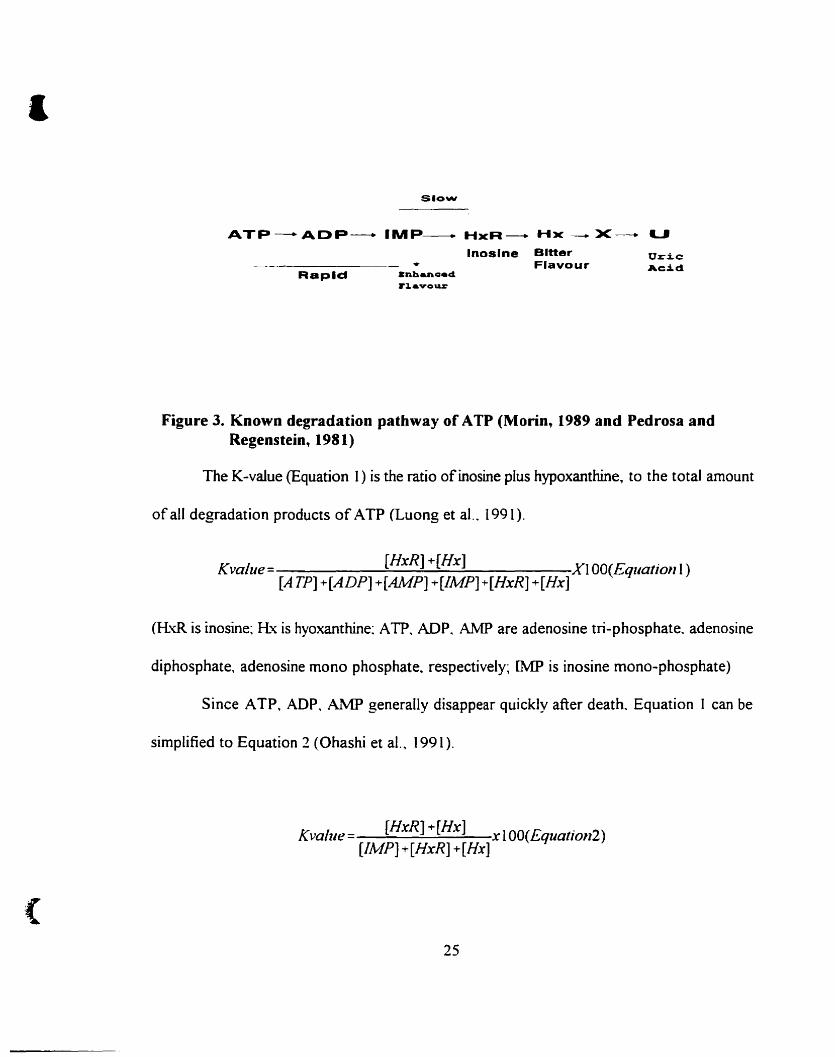
As fish and meat age. adenosine triphosphate (ATP) breaks down (Figure 3) mainly
to ADP to IMP to 1to Hx (hypoxanthine) to xanthine to urie acid (Pedrosa and Regenstein.
1988). Certain degradation products of ATP are indicators of fish freshness. For example.
inosine monophosphate (IMP). has flavour enhancing properties, while hypoxanthine. has a
bitter flavour, which is associated with the taste of spoiled fish (Morin. (989). Generally. the
reaetion involved in converting ATP to IMP in the early stage after death is rapid. while the
rMP to inosine step is rate limiting (Pedrosa and Regenstein, 1988).
The measurement ofintennediates for the degradation ofATP at any given time. gives
an estimation offreshness of the fish (Morin. 1989). In particular. determination of the total
concentration of hypoxanthine and IMP is considered a reliable indicator of fish freshness.
hypoxanthine or inosine a]one cannot be used as universal indicator of fish (Pedrosa and
Regenstein. 1988).
24
1
ATP---ADP--- IMP- HxR- Hx -- X- '-J
Rapld J:nhanc:.cl.
FI.&VOuz
Inoslne BitterFlavour
UrieAeid
Figure 3. Known degradation pathway of ATP (Morin, 1989 and Pedrosa andRegenstein, 1981)
The K-value (Equation 1) is the ratio ofinosme plus hypoxanthine. to the total amount
of ail degradation products of ATP (Luang et aL 1991).
[HrR] + [Hx] .Kvaille- XI OO(Equallonl)
[A TP] + [ADP] +[AMP] + [IMP] + [HxR] + [Hx]
(HxR is inosine: Hx is hyoxanthine: ATP. ADP. AMP are adenosine tri-phosphate. adenosine
diphosphate. adenosine mono phosphate. respectively~ lMP is inosine mono-phosphate)
Since ATP. ADP. AMP generally disappear quickJy after death. Equation 1 can be
simplified to Equation 2 (Ohashi et al., 1991).
Kvalue _--:f;.,..H_x_R-=-l+.......:[;.,..H_x-=-]-,r100(Eqllation2 )[IMP] + [HrR] + [Hx]
25
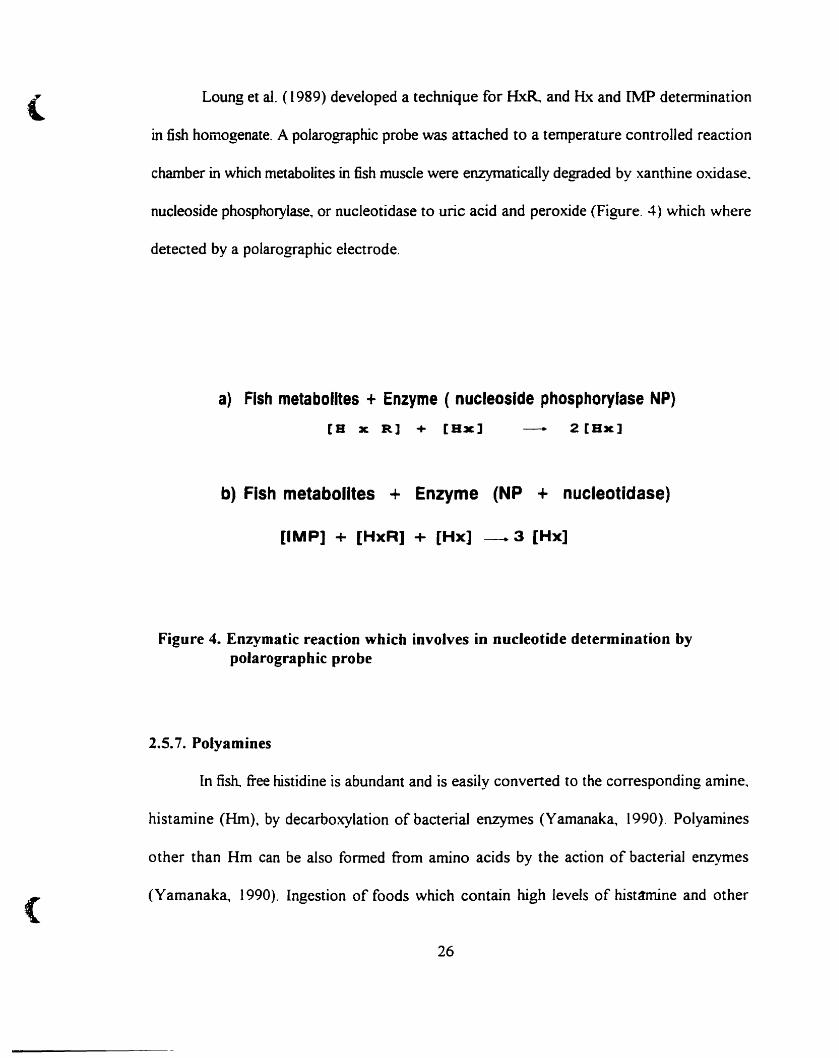
( Loung et al. (1989) developed a technique for~ and Hx and UvfP detennination
in fish homogenate. A polarographic probe was attached to a temperature controlled reaction
chamber in which metabolites in fish muscle were enzymatically degraded by xanthine oxidase.
nucleoside phosphorylase. or nucleotidase to urie acid and peroxide (Figure. 4) which where
detected by a polarographic electrode.
a) Fish metabolltes + Enzyme ( nucleoslde phosphorylase NP)
[B x Rl + [Bx] 2[Bx]
(
b) Fish metabolltes + Enzyme (NP + nucleotidase)
[IMP] + [HxR] + [Hx] __ 3 [Hx]
Figure 4. Enzymatic reaction which involves in nucleotide determination bypolarographic probe
2.5.7. Polyamines
In fish. free histidine is abundant and is easily converted ta the corresponding amine.
histamine (Hm), by decarboxylation ofbacterial enzymes (Yamanaka. 1990). Polyamines
other than Hm can be also formed from amine acids by the action of bacterial enzymes
(Yamanaka. 1990). Ingestion of foods which contain high IeveIs of histamine and other
26
{
{
biogenic amines eause clinical symptoms. such as histamine poisoning (Taylor. 1983).
Yamanaka (990) found that the histamine content in sardines after 1 day of storage at 20uC
was 104 mg! 100 g which exceeded the level (100 mg! 1OOg) required to cause allergy-like
food poisoning. aJthough the fish was acceptable organoleptieally.
There are several reports on the increase of histamine (Hm). eadaverine (Cad).
putrescine (Put). tyramine (Tym). tryptamine (Tpm) and agmatine (Agm) concentration in
stored fish (Yamanaka, 1990) and beef(Edward et aI.. 1985 and Sayem-EI Daher and Simard.
1985). These polyamines can serve as a quality index for fish and meal.
Naguib et al. (1995) summarized different methods used for detennination biogenic
amines: (a) a bioassay method based on the observation ofguinea pig ileum ccntraction which
has not yet been applied to foods. (b) a colorimetrie assay using a ninhydrin. or Pauly's diazo
reagent. in whieh colour was measured spectrophotometrically. but was not considered to be
satisfaetory (Taylor. 1983). (c) a fluorometric assay based on conversion of amines to stable
and strongly fluorescent products by reaction with reagents such as dansyl chloride. (d) the
current official method (AOAC. 1975) which uses phthaladehyde for derivatization of
histamine resulting in fluorescence which is measured spectrophotofluorometry or
densitometry. Lerke and Bell (1976) reported that the official method is slow and time
consuming and Jack sensitivity at very low levels~ it is used only for histamine determination.
(e) an enzymatic isotope assay based on the incubation of tissue sarnpJe with trace amount of
eH) histamine and ~ C)-S-adenosylmethionine in the presence of the enzyme histamine
methyl transferase (Arnold and Brown. 1978). (t) agas chromatography (GC) method based
on derivatization of polyamines to form perfluoropropionyl products (Staruszkiewics and
27
(
(
Bond. 1981). (g) HPLC after derivatization with phthalaldehyde and mercaptoethanol which
convert polyamines into fluorescent derivatives (Yamanaka. 1990).
HPLC. Ge. and enzymatic isotope assays are among the more recent techniques which
offer sorne advantages in aceuracy and flexibility, but are costly. Naguib et al. (1995) reported
that separation ofbiogenic amines could be obtained by using two dimensionaJ TLC with two
solvent systems providing simple and inexpensive rneans to separate and detect biogenic
anunes.
Pedrosa and Regenstein (1990) suggested that since hypoxanthine peaked at ten days
and declined after 15 days of storage and polyamines did not begin to develop after 8 days
after storage. the cornbined anaJysis of hypoxanthine and polyamines couJd reflect the
freshness and incipient spoilage phases of fish and more adequately evaJuate overall quaJity
than either procedure alone.
2.5.8. Trimethylamine (TMA)
TMA is produced during fish spoilage. aJthough a srnall arnount may be derived from
the intrinsic enzymes in fish. It is mainly derived trom bacterial action (Figure 5) of
trimethylamine oxide (TMAO). a natural compound of marine fish. by bacterial enzyme
triaminooxidase (TAO) (Pedrosa and Regenstein. 1990). TMA is one of the major
components associated with smeII of spoiled marine fish. A ratio ofTMAO/TMA has been
proposed as an objective index ofraw fish quaJity (Pan. 1989).
Severa! procedures have been proposed for estimating the quantity ofT!\.1A. present
in fish. Among the most widely used methods are: steam distillation (Hjorth-Hansen and
Bakken. 1947). the Beatly and Gibbons (1936) modification of Conway microdiflùsion
28
Lactlc Acid
1
(
method. the Dyer method (Ritchner et al.. 1941) and chromatographic methods (Ge and
HPLC) (Wang et aI .. 1967). Other methods include the use of specifie T~1A eleetrodes and
the automatie methods (Chang et al.. 1976). The Dyer determination ofTMA is often used~
it is a colorimetrie method that is based on treating of fish muscle extract with formic aeid to
fix any ammonia (NH3) present fol1owed by liberation ofammonia by adding alkali. The TMA
is then extraeted with toluene. reacted with picric acid and estimated colorimetricaIly at 410
nm (Shewan et al.. 1971): however. Dyer method is tedious and expensive (Chang et al..
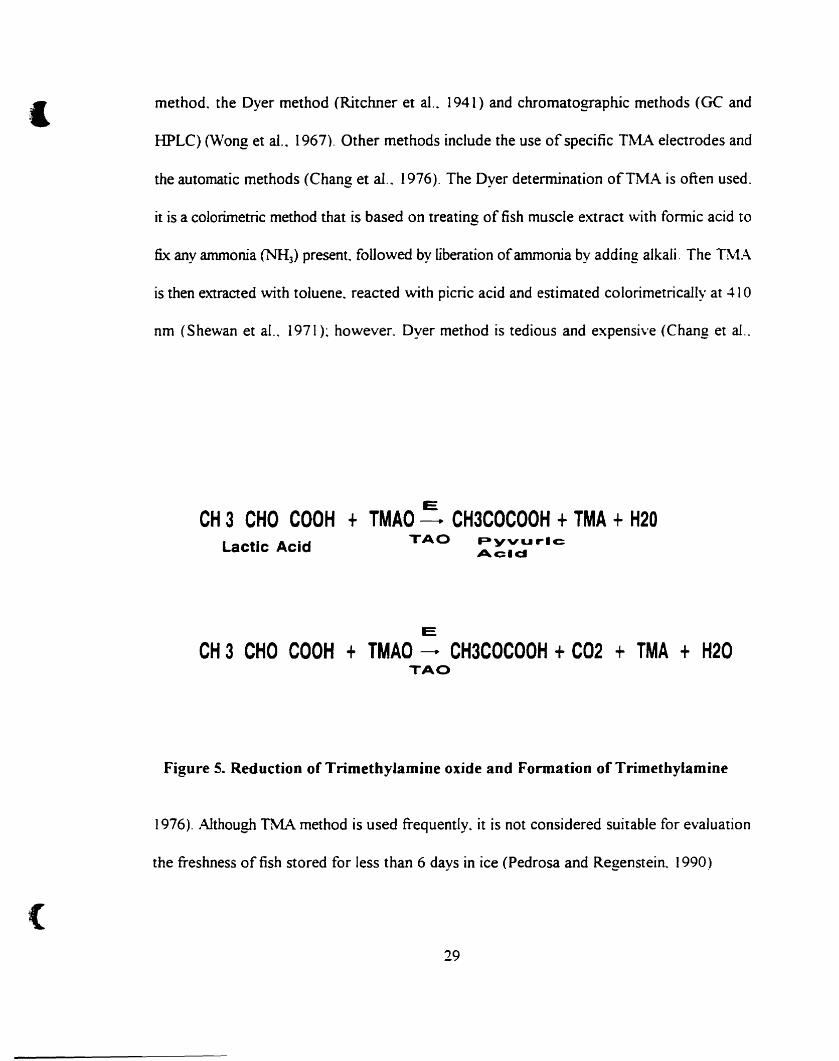
ECH 3 CHO COOH + TMAO - CH3COCOOH +TMA +H20
TAO PyvurlcAclcl
E
CH 3 CHa caOH + TMAO -+ CH3COCOOH + C02 + TMA + H20TAO
Figure 5. Reduction of Trimethylamine oxide and Formation of Trimethylamine
1976). Although Th1A method is used frequently. it is not considered suitable for evaluation
the freshness of fish stored for less than 6 days in ice (Pedrosa and Regenstein. 1990)
29
(
(
2.5.9. Protein Degradation Products
2.5.9.1. Total Volatile Bases m13) (Nitrogenj m13-N)
In meat and fis~ as spoilage approaches~ there is foonation of volatile bases which are
comprised main1y ofammonia trimethylamine (TMA) and dimethylamine (DMA) in amounts
that depend on the species and the degree of spoilage (Pedrosa and Regenstein. 1990). As a
result. TVB is used as an alternative to measure TMA content. However. the TVB content
is not a sensitive index of freshness because of its high variability: the test is usuaIly reserved
for meat and fish near the limits of acceptance (Howgate, 1982).
The Conway and Byme. (1933) method for the microdetermination of TVB is widely
used. The methods for TVB are based on (a) TCA extraction/microdiffusion. (b) MgO with
direct distillation, (c) ethanol extraction/direct distillation (d) MgO with steam distillation. (e)
TCA extraction / steam distillation and (f) MgSO.. extraction / steam distillation. Botta et al.
( 1984) evaluated the accuracy. precisio~ suitability as an index of spoilage. speed and cost
of determination of six different methods of determining TVB and concluded that the
methods were similar in their suitability as an index of spoilage.
2.5.9.2. NOll-Prote;n Nitrogell (NPNj
NPN is defined as "peptides that are too small to be precipitated and filtered. free
amino acid (AA). amides and other nonpolymeric nitrogen (N) constituents of the plant or
animal product" (lmafidon and SosulskL 1990). Determination ofNPN is often performed by
two methods. Firstly, extracting biological materials with Tek the proteins are precipitated
by TCA leaving only low molecular weight compounds (amino acids. amides, peptides and
polypeptides) in solution (Wolf et al .. 1994). Optimum concentration ofTCA is established
30
(
(
by examining the solubility of nitrogen compounds as a funetion of TCA concentration and
determining the concentration that gives minimal values for the nitrogen extracted (Wolf et
al.• 1994). Secondly. NPN can be determined by measuring the total nitrogen content of the
ultrafiltration from ethanol extracts (25%. VN) of finely ground food products. Bell ( 1963 )
carried out a comparative study for detennining NPN by twenty methods and conc1uded that
none of the methods studied completely avoids the main sources of error (hydrolysis of
protein and adsorption ofNPN onto protein) in detennining NPN yet dialysis and gel filtration
techniques appeared ta achieve separation most closely relative to NPN_
Imafidon and Sosulski (1990) extracted N"PN fram 20 primary food products and
concluded that despite the comparatively high N contents of the animal products. including
beef and fish. the NPN values were legs than 2.5 mg/g of sample or 3.5 % of the total N.
Glutamic acid and glutamine were the principle free amino acids in most food products. Of
the NPN constituents, the concentration of free low molecuIar weight peptides decreased
whereas the concentration of free amino acid increased during the early spoilage period
(DeMasi et al.. 1990). Espe et al. (1992) indicated that NPN and TVN values increased in
stored fish due ta the autolytic activity of endogenous enzymes present in fish. Amino acid
composition. however is not effected during storage.
2.5.9.3. Water Soluhle Nitrogen rwSN) and Total Nilrogen (IN)
The ratio ofwater soluble nitrogen to total nitrogen (WSN:TN) content ofmeat and
fish is commonly used as an index ofspoilage. Nitrogen is usually determined by the Kjeldahl
procedure which both laborious and time consuming. AJtematively WSN can be measured
according to Lowry et al. (1951). This method measures onJy tyrosine components of the
31
1
(
protein but. by using bovine serum aIbumin as a standard~ the result can be expressed in terms
of TCA-soluble protein (Aksnes. 1988). WSN can be measured by the reaction of a
homogenate with 12%(WN) TCA ta precipitate pratein and the assay of the supematant with
TNBS (Gallagher et al.. 1994).
2.5.9.-/. Free Amino Acid
As protein breakdown praceeds in fish and meat spoilage. increasing quantities of
soluble amina acids are produced. Reagents that react specifically with a-amino groups have
been employed to measure free amino acid in meat and fish. including nihydrin (Reimerdes and
Klostermeyer. 1976). 2.4.6-trinitrobenzenesulphonic acid (TNBS) (McKeIlar. 1984). 0
phthalaldehyde (Church et al.. 1983). and fluorescamine (Kwan et al.. (983). Most ofthese
methods require protein to be removed by precipitation with trichloroacetic acid (TCA).
Free amina acids are highly correlated with t1avor development in meat and fish. These
amino acids have been reported as precursors of sour, sweet and bitter taste (Kato et al..
(989). On the other hand. amino acid degradation to amines would affect the health of the
consumers if the biogenic amines are formed (C6rdoba et al.. (994). In muscle. major NPN
initially present originates from peptide nitragen~ while amino acid nitrogen is the dominant
source during storage (Ventanas et al.. 1992). Levels oftryptophan and glutamic acid increase
during meat storage: changes were increased as the bacterialload and storage temperature
increased
32
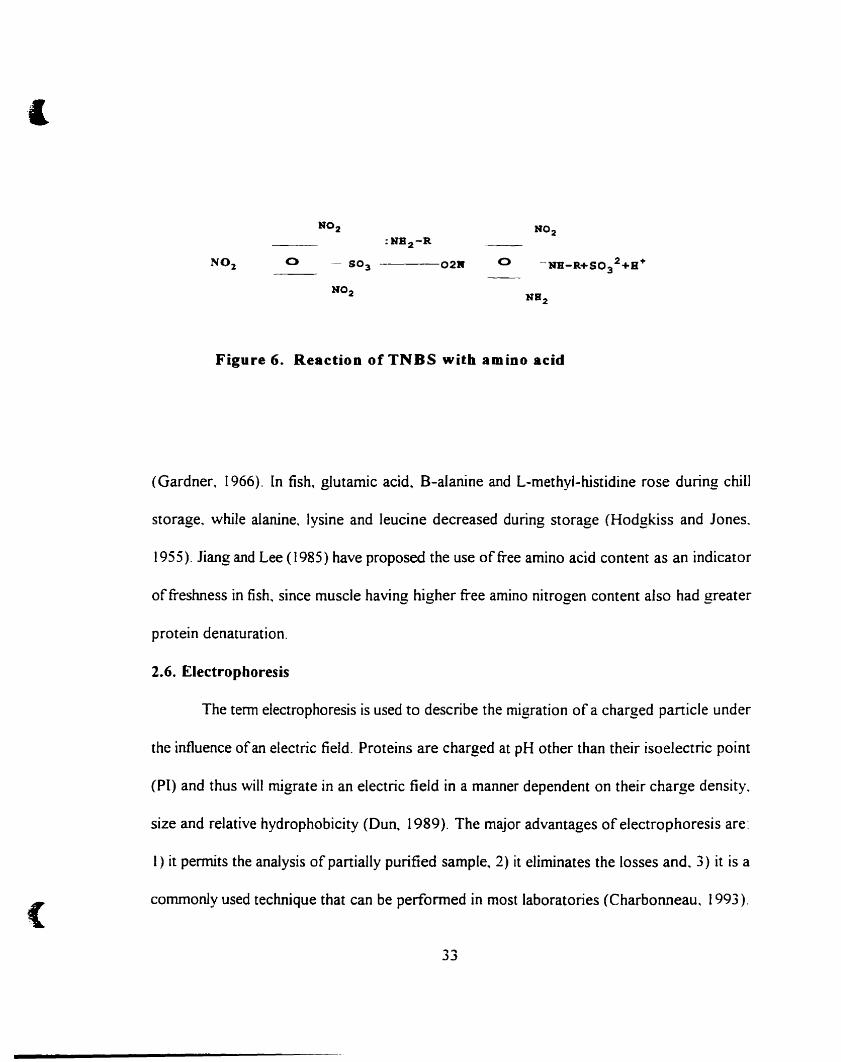
.(
a ---0211
N02
a -NB-R+S032 +S+
NB2
(
Figure 6. Reaction of TNBS with amino acid
(Gardner, 1966). In fish, glutamic acid, B-alanine and L-methyl-histidine rose during chilI
storage, while alanine, lysine and leucine decreased during storage (Hodgkiss and Jones.
1955). Jiang and Lee (1985) have proposed the use of free amine acid content as an indicator
offreshness in fish, since muscle having higher free amino nitrogen content aiso had greater
protein denaturation.
2.6. Electrophoresis
The tenn electrophoresis is used ta describe the migration of a charged particle under
the influence ofan electric field. Proteins are charged at pH other than their isoelectric point
(PI) and thus will migrate in an electric field in a manner dependent on their charge density.
size and relative hydrophobicity (Dun, 1989). The major advantages of electrophoresis are:
1) it pennits the analysis of partially purified sample, 2) it eliminates the lasses and. 3) it is a
commonly used technique that can be performed in most laboratories (Charbonneau. 1993).
33
1
(
Animal muscle protein can be separated using sodium dodecyl sulphate polyacrylamide gel
electrophoresis (SOS-PAGE) such that samples containing different proteins or different
amounts of the same protein can be distinguished by examination and comparison of the
resulting protein profiles (Savage et al.. 1995). Studies have indicated that SDS-PAGE is a
time consuming, but sensitive method of detecting molecular changes in stored fish and meat
muscle tissue (LeBlance and LeBlance. 1989). SOS-PAGE has gained wide application in
monitoring the proteolytic degradation of meat myoribrillar proteins (Oison et al.. 1977~
Penny. 1980~ Bechtel and Perrish. 1983: Kooharaie et al.. 1984 a.b: Zeece et al.. 1986~ Xiong
and Anglemier. 1989: Crouse et al.. 1991 and Negishi et al.. 1996) as weil as sarcoplasmic
proteins (Hay et al.. 1973: Dainty et al.. 1975~ Harrington and Henahan. 1982: Yates et al..
1983~ Bechtel and Parrish. 1983: Xiong and Anglemier. 1989~ McCormik et al.. 1988: Wang
et al.. 1996 and Park et al.. 1996).
SOS-pAGE often has been used as an aid in the species identification of fish and fish
products (Mackie. 1969. 1972. 1980: Laird et al.. 1982: Nakagawa et al.. 1988b~ An et al..
1988 and Huang et al.. 1995). to monitor fish myofibrillar (Gill et al.. 1979~ Yowell and
Flurkey. 1986) and sarcoplasmic protein degradation (Yowell and Flurkey. 1986~ Nakagawa
et aL 1988a and Park et aL. 1996). Moreover. SOS-PAGE were used to examine changes in
protein solubility (Xiong and Brekke. 1989). meat composition and palatability (Xiong et al..
1996) and digestibility (Kim and Barbeau. 1991).
2.7. High Performance Liquid Chromatography
Reverse-phase high perfonnance liquid chromatography (RP-HPLC) is a rapid method
for separating amino acids. peptides and proteins based primarily on hydrophobicity (Regnier
34
(
(
and Goodin~ 1980 and Lemieux and Amict. 1989). Howard and Martin (1950) were the first
to describe the reversed partition process as a reversed-phase chromatography; the term
reversed-phase implies that the stationary phase is a non-polar liquid and the mobile phase is
a more polar solvent. RP-HPLC has received considerable attention for proteins and peptides
due to ilS versatility. short analysis time. effective separation. high resolution. column stability.
economy and low toxicity of its common solvents. and the ease ofgradient elution (Little et
al., 1991 and Polo et al.. 1992). The main disadvantages of RP-HPLC in particular and HPLC
in general are their availability. cost and the experience needed ta use them (Naguib et al..
1995).
RP-HPLC has been used for a variety ofdifferent applications including the separation
of peptide hormones (O'Hare and Nice. 1979). the characterization of proteolysis (Fullmer
and Wasserman. 1979 and Cliffe et aL 1991). the optimization ofprotein synthesis (Lobley
and Lovie, 1979). the measurement ofprotein concentration (Shimizu et al.. 1989). evaluating
protein cross-linking and biodegradability (Kim and Haering. 1994) and the separation of
globin chains (petrides et al .• 1980). RP-HPLC is considered the standard procedure currently
employed in the routine monitoring for domic acid in mussel extract (Smith et al.. 1995).
Moreover quantitative and qualitative determination of biogenic amines (Yen and Hsieh.
1991) and nucleotide degradation products (Loung et al.. 1991) is performed by RP-HPLC.
Chromatographie separation ofbovine. rabbit. chicken. porcine and fish sarcoplasmic
and myofibrillar proteins have been reported using ion-exchange (Fujimaki and Deathereroge.
1964 and Rampton et al.. 1965). affinity elution (Scopes. 1977) and size exclusion
chromatography (Klotz et al., 1978; Mozersky et aI.. 1981; Sehreurs et al.. 1983~ Davis and
35
.(
(
Anderson. 1984~ LeBlance and LeBlance. 1989 and Murch et al .. 1992). RP-HPLC was used
to separate and identifY fish (Ashoor and Knox., 1985: Osman et al., 1987~ Ashoor et al.. 1988
and Armstrong et al.. 1992) and meat sarcoplasmic and myofibrillar proteins( Grandier
Vazeille and Tetaert. 1984: Libera et al., 1984 and McConnick et al., 1988). These studies
were performed either to monitor proteolysis or to ditTerentiate species.
A1though monitoring meat and fish proteolysis by RP-HPLC is not weIl established.
monitoring proteolysis of cheese by RP-HPLC has been used during the last decade (Cliffe
et al.. 1991). For example. Lee and Warthesen (1996) used RP-HPLC to separate and
detennine peptide and amino acids that cause bittemess in cheese while many researchers have
monitored proteolysis during the ripening of cheese (Minagwa et al.. 1989: Altemueller and
Rosenberg, 1996: and Jin and Park, 1996).
2.8. Mass Spectrometry
Mass spectrometry (MS) is a microanalyticaI technique that provide characteristic
information regarding the structure and molecular weight of the analyte. It is based on
transferring energy into neutral molecule to induce ionization. The ionized molecules then
explodes into a variety of fragment ions. In principle, the fragment ions are unique for each
compound and can be used as a chemical fingerprint to characterize the sample (Watson.
1985).
There are four common types ofmass spectrometer detectors: magnetic. quadruple.
time of flight and founer transform. In the magnetic sector mass spectrometer ions. are
transfered from their source into discrete ions beamed by a process of momentum dispersion
and direction focusing . Magnetic scanning is advantageous because the entire mass range may
36
(
(
he scanned while the instrument maintains optimum accelerating potentiaI. However. if scan
speeds exceeds a certain rate (0.1 sec/decade) the magnetic field can change significantly
during the ion transit period. causing ions to follow a distorted path to the detector (Holland
et al.. 1983). Consequently. this type of spectrometer is not recommended when fast scan
rates are needed.
Quadruple mass spectrometer (QMS) employs a combination of direct CUITent (OC)
and radio frequency (RF) potentials as a mass tilter. The OC/RF ratio is adjusted so that only
ions ofspeci.fic rvtJZ (mass to charge ratio) avoid collision with rads and successfully traverse
the quadruple filter to reach the detector. Furthennore. the ratios that controls the mass scale
can be changed rapidly. with good response. and are weIl stabilized throughout the mass range
(Caprioli and Bruner, 1993). Therefore QMS is more capable of maintaining quality output
al higher pressure than other conventional MS~ this may be an advantage in chemical
ionization (CI), Ge-MS or Le-MS application.
The operating principle of the time of flight (TOF) mass spectrometer involves
measuring of the time needed for an ion to arrive at a detector located 1 to 2 m from the
sources (Harrington, 1960). Ali the ions will receive the same kinetic during acceleration. but
the velocity ofmovement will differ due to differences in masses. thus separation will occur
The faet that TOF instrument has an eleetron multiplier and that can be scanned rapidly. make
it suitable for GC-MS application.
Fourier transform mass spectrometry (FT-MS) is based on the original technique
called ion cyclotron resonance (lCR). 1CR is based on the principle that ions in a magnetic
field move in circular orbits with a characteristic cyclotron frequency, Wc, that depends ooly
37
(
(
on the MJZ value of the ion.
Wc = ZeB/2II m
Ifenergy is provided to these ions al a frequency equal to their process frequency. the
ions will absorb the energy and move to orbits of larger radius and become chorent. The ions
will transmit a complex RF signaJ to the excited chip. These signais contain the frequency
components characteristic of aIl of the ions present
2.9. Le-MS of Peptides and Proteins
The MS is probably the idea1 detector for liquid chromatography (LC). as it is capable
ofproviding bath structural information and quantitative analysis of the various components
of mixture separated by HPLC. with minimum handling losses and analysis time The main
constraint imposed v..~th direct coupling of LC and MS is the radical difference between the
LC environment (solute at room temperature) and the MS electron impact source requirement
(gas phase at relatively high temperature and in a very high vacuum) (Caprioli and Bruner.
1993). Different inteIface techniques have been explored to overcome direct Le-MS coupling
problems. Sorne ofthese technique are moving wirelbelt system. a 1°1o split of the LC effluent
into MS (Covery et aL 1991). a vacuum nebulizing coupled with Micro-LC. a particle beam
coupling de\ice (Caprioli and Bruner. 1993 J. and electrospray (Loo et aL 1989)
To generate ions from so-called non-volatile or thermally labile molecules. such as
peptides and proteÏns. soft ionization is required. Field desorption (FD). desorption chemical
ionization (Cotter. 1980). ~~~Cf plasma desorption( 2~2 Cf-PD). laser desorption (Karas and
Hillenkamp. 1988). fast atom bombardment (FAB) (Rinehart. 1982) and secondary ion MS
(LSIMS) are considered soft ionization techniques, producing stable even electron molecular
38
(
ions (MIr). The main advantage of these techniques is direct MS analysis 'Nithout the
necessity of chemicaJ derivatization to irnprove volatiIity and stabiIity of the moIecule of
interest (peptides).
39
1
(
3. MATERIAL AND METHODS
3.1. Materials
Eighteen Carp fish (Cyprinus carpio) were purchased fresh from a local shop
(Waldmanplus: Montreal, Canada). The fish were immediately placed on ice in an insulated
box and transported ta the laboratory. they were then immersed and covered with wet ice in
an insulated container and kept in a refrigerated room (5 ± 1°C). Three fish were selected at
random after O. 2. 4. 8, 12 and 16 days of storage in the laboratory for microbial and protein
analysis. The average weight offish was 1380 g (min. 1000 g, max. 1800 g).
3.2. Microbiological Analysis
Fish removed from storage was washed with running tap water and flesh was removed
using a flamed, sterile knife and forceps. The underlying muscle was aseptically removed. 10
g ofmusele was placed in sterile stomacher bags (Seward 4000. England) containing sterile
pre-measured 90 ml of0.1 % peptone diluent (Difco. MI. USA): this mixture was pummelled
for 1 min in a stamacher 400 (Seward Medical. England) and 1 ml of the homogenate was
transferred into a sterile screw-cap dilution bottles containing 9 ml of O. 1 % peptone diluent.
Decimal dilution series were prepared for each sample.
Total aerobic bacteria counts were detennined by placing 1 ml of the original
homogenate and 1 ml from each dilution in sterile petri dishes(AOAC 1990). Plate count agar
(PCA.. Duca) heated to 50 oC was poured into the inoculated plates and swirled ta distribute
the sample evenJy. The plates were left to dry. then incubated at 37 ± 1°C: colonies were
counted after incubation for 48 h.
Psychratrophic and anaerobic bacteria were enumerated by spreading 0.1 ml of
40
(
original sample homogenate and 0.1 ml from each dilution on prepoured(AOAC 1990), dried
PCA (Duco, USA) with a sterile bent glass rod. Psychrotrophic plates were incubated at 5 :::
1 oC for 7 days. Anaerobie plates were placed in an anaerobic jar equipped with a palladium
catalyst (Fisher Scientific, MontreaL Canada) and hydrogen and carbon dioxide generating
kits (BBL. USA) were aetivated to flush the jar. To insure complete anaerobic condition~
anaerobic indicator strips (Difco. USA) were used. Incubation of anaerobic plates was done
at 37 :::: 1 oC for 48 h. Colonies were caunted after incubation periode
3.3. pH Measurement
On each sampling day. pH of the three sampled fish was measured according to
Dhananjaya and Stroud (1994). For each fisQ triplicate sampies of flesh (lOg) were
macerated in a beaker using glass rod. Whatman filter paper (No.4) was inserted into the
macerate and the beaker was stored at 5 oC for 30 min. The pH was measured with a Fisher
digital pH/ion meter (Madel 750 Accument~ Pittsburgh~ PA. USA) equipped with a flat
combination electrode.
3.4. Extraction of Acid Soluble Nitrogen (ASN)
Acid Soluble Nitrogen (ASN) in fish was extracted according ta the method of
(DeMasi et al.. 1990) with sorne modifications. Macerated flesh (5 g) was rnixed with 100 ml
0.1 N HCL~ the mixture was blended for 1 min in a aster blender at high speed. The extract
was held at 4 oC for 24 h and then centrifuged at 6500 RPM (Avanti Centrifuge. Model J
25tBeckman. CA USA) for 10 min. at 4 oC. The supematant was filtered (Whatman No. 4
filter paper). and refiigerated.
41
(3.5. Determination of Protein Concentration
The method of Lowry et al. (1951) as modified by Hanree (1972) was used ta
determine protein content in ASN. sarcoplasmic and myafibriIs extracted from fish and meal.
Bovine serum albumin (BSA egg white extraet, Sigma, St. Louis. MO) was used as standard.
3.6. Preparation of Fish Myofibrillar and Sarcoplasmic Protein Fractions
The method used was that of Dyer et al. (I950) as modified by Machado and
Sgarbiere (1991) and is shown in Figure 7. Myofibrils were soIubilized with 1. 1 M KI in O. 1
M potassium phosphate. (pH 7.4). AlI extraction procedures were carried out at
approximately 4 oC. A homogenized fish sample (lOg) was bIended at high speed (Oster
BIender) in 166.5 ml buffer solution (5% NaCI in 0.02 M NaHC03. pH 7.4) for 2 min. Care
was taken to prevent the final temperature after blending from exceeding 5 oC. The mixture
was centrifuged at 4000 RPM for 30 min. at 4 oC to separate insoluble material and extracted
protein. The supernatant (salt extraet) which consists of sarcoplasmic and myofibrillar protein
was retained. The pellet. which cansists mainly of stroma, collagen and denatured prateins.
was discarded. The myofibrillar was precipitated by 10 fald dilution of salt extract with
distilled water (4 OC) and the mixture was heId at 4 oC for 24 h.
The diIuted salt extraet was centrifuged at 10000 X g (7500 RPM) for 15 min at 4 oC.
The supernatant (sarcoplasrnic protein) was filtered through 2 layers of cheese c10th and kept
for further analysis. The precipitate (myofibrillar protein) was resuspended in ]5 volumes of
1.1 M KI in 0.1 M potassium phosphate buffer. (pH 7.4). The mixture was blended for 30 s.
at high speed followed by centrifugation at 1000 X g for 15 min and the supernatant was
retained as myofibrillar protein fraction.
42
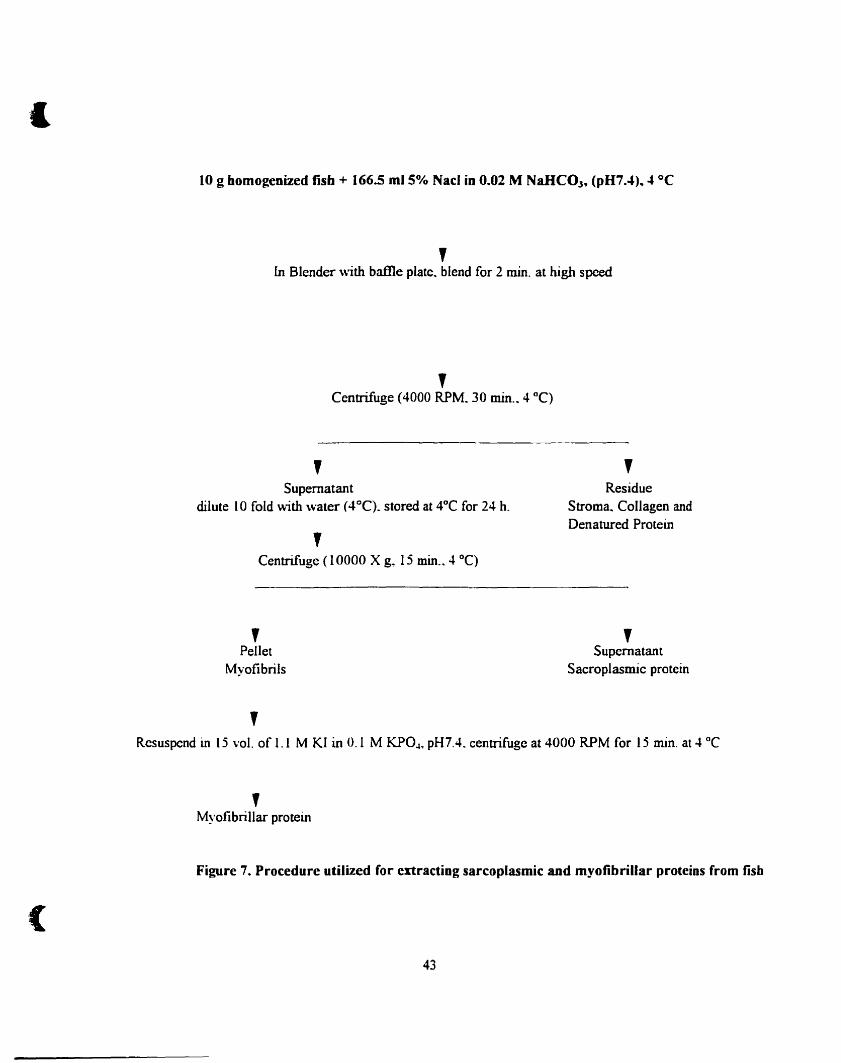
-1
10 g homogenized fisb + 166.5 ml 5% Nad in 0.02 M NaHCOJ9 (pH7.4).. " oC
,ln Blender with baffle plate. blend for 2 min. at high speed
,Centrifuge (4000 RPM. 30 min.. 4 OC)
,Supematant
dilute 10 fold with water (4°C). stored al 4°C for 24 h.,Centrifuge ( 10000 X g, 15 min.• 4 OC)
,Pellet
Myofibrils
,
,Residue
Stroma. CoUagen andDenatured Protein
,Supematant
Sacroplasmic protein
(
Rcsuspend in 15 vol. of 1.1 M KI in 0.1 M KP04 • pH7.4. centrifuge at 4000 RPM for 15 min. at 4 oC
,Myofibrillar protein
Figure 7. Procedure utilized for enracting sarcoplasmic and myofibrillar proteios from fisb
43
1
(
3.7. Preparation of Meat Myotibrillar and Sarcoplasmic Protein Fractions
The method used was that of Molina and Toldiâ (1992) and is outlined in Figure 8. AIl
extraction procedures were carried out at approximately 4 oC. A homogenized meat sample
(3 g) was homogenized for 90 sec. using Polytron (polytron~, PT-MR 3000. Kinematic. AG.
Littau, Switzerland) in 30 ml phosphate buffer solution (0.03 M. pH 7.4). Care was taken to
prevent the final temperature after blending trom exceeding 5 oC. The mixture was centrifuged
at 4000 RPM for 15 min. at 4 oC to separate sarcoplasmic proteins. The supematant
(sarcoplasmic protein) was filtered through 2 layers of cheese cloth and kept for further
analysis. The precipitate (myofibrillar, stroma. collagen and denatured proteins) was
resuspended in 10 volumes of 1.1 M KI in 0.1 M potassium phosphate buffer. (pH 7.4). The
mixture was blended for 30 s. at high speed followed by centrifugation at 4000 RPM for 15
min and the supematant was retained as the myofibrillar protein fraction.
44
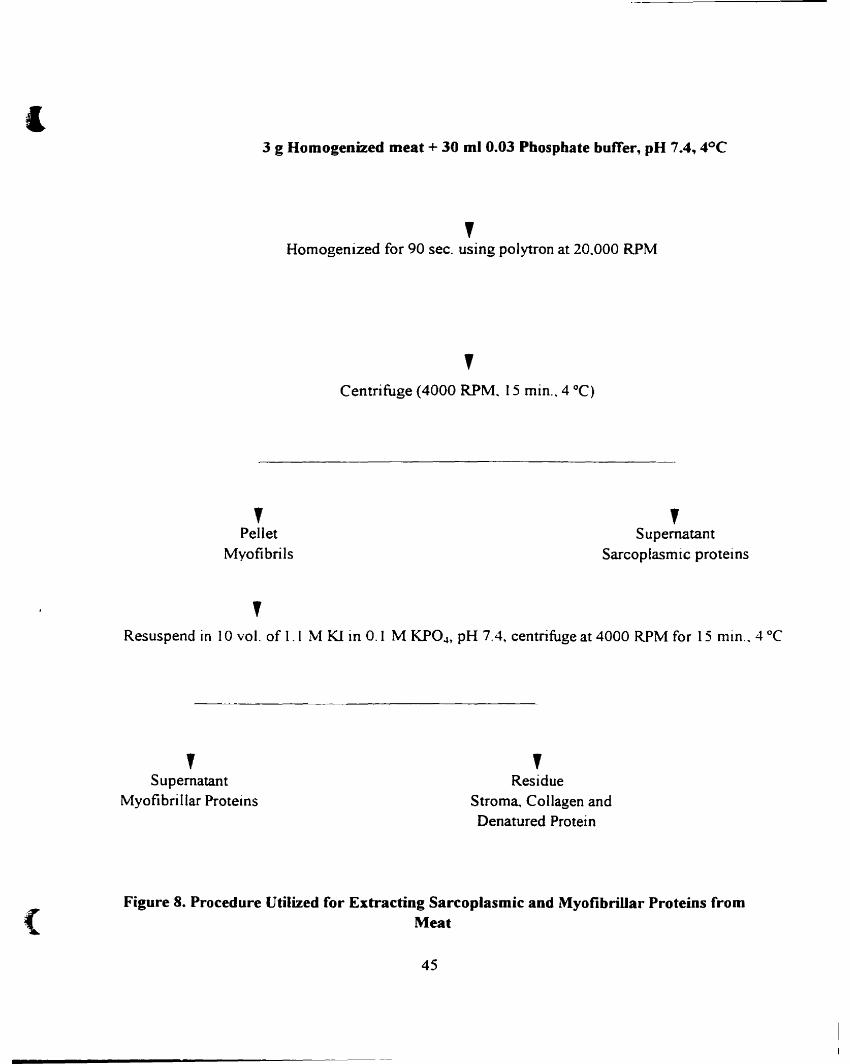
.(3 g Homogenized meat + 30 ml 0.03 Pbosphate buITer, pH 7.4, 4°C
,Hornogenized for 90 sec. using polytron at 20.000 RPM
,Centrifuge (4000 RPM~ 15 min.. 4 OC)
,Pellet
Myofibrils
,
,Supematant
Sarcoplasmic proteins
Resuspend in 10 vol. of 1.1 M KI in 0.1 M KP04 , pH 7.4, centrifuge at 4000 RPM for 15 min.. 4 oC
,Supernatant
Myofibrillar Proteins
,Residue
Strom~ Collagen andDenatured Protein
{Figure 8. Procedure Utilized for Extracting Sarcoplasmic and Myofibrillar Proteins from
Meat
45
&
(
3.8. High Performance Liquid Chromatography (HPLC)
HPLC analysis was carried out with a Hewlett-Packard (HP) liquid chromatograph
model 1090 equipped with a binary high-pressure solvent delivery system~ an auto-injector
and diode array deteetor (Madel 1040 A). Spectral and chromatographie data were stored on
dise using HP model 85 B computer and a model 9012 twin dise driver. 1 ml of acid soluble
nitrogen (ASN) was centrifuged (14000 RPM~ 4 min. EppendorfCentrifuge. Madel 415 C).
the supematant was filtered (0.45 Jl. Millipore. USA). and injeeted into a C IK reversed phase
column (5 mm, 25 X 0.46 cm, Vydac Co., USA) operated at room temperature. The
following conditions were used to elute the sample at flow-rate of 1 ml min- I from the column:
- Solvent A, 0.1 % tritluoroacetic acid (TFA) in water (VN, pH 2)~ and solvent B. 0.1 °/0
TFA in aeetonitrile (VN)~ solvent B was increased linearly from 10 - 70% over 60 min. The
fractions which were separated by RP-HPLC were colleeted manually. evaporated (Speed-vac
concentrator, Savant, Hicksville. NY. USA) and stored at -18 oC unttl they were analyzed by
mass spectrometry.
3.9. Mass Spectrometry (MS)
A SCIEX API 111- triple-quadrupole mass spectrometer equipped with a standard
atmospheric pressure ionization (API) source (Sciex. lnc.. ThornhilL Ontario. Canada) was
used to sample ions produced from an ion spray interface(Alli et aL. 1993 and 1994). Liquid
samples were introduced to the electro-spray source (ES) by continuous infusion from a
syringe pump (Model 22. Harvard Apparatus, South Natick. MA USA), through a fussed
silica capillary (l00 Jlm i.d.) at flow rate of 1-2 JlL min- I. The ions were detected by scanning
the first quadrupole of the mass spectrometer and the scans were monitored between m, :
46
1
(
700-1 700 in 5 s. Between 15 and 20 scans were averaged to obtain representative spectra.
The abundances of the ions are reponed as percentages relative to the peak that was most
intense. The deteetor was a Chevron type multichannel plate multiplier (3025. Galileo Electro
optics~ Strurbidge. MA) used in the pulse-counting mode. Signais were recorded with a 100
l\1H! pulse counter (SR430. Stanford Research system. Sunny-vale. CA) which incorporated
internai amplitude discrimination. Ali data were transferred to Macintosh computer over
Apple File Exchange software (Apple computer. [nc.. Cupenino. CA). Postacquisition
analyses were condueted on the Macintosh using the Passages Software package (Version F.
Passage Software. Inc., Ft. Collins. CO).
The instrument m. =scale was calibrated with singly-charged ammonium adduct ions
of polypropylene glycol (1 xl O-IM in 50/50 methanol / H20 2mM ammonium formate,
NH4oAC) under unit m= resolution. Before molecular weight determination of the HPLC
fractions, the mass spectrometer accuracy was tirst checked with 1 mg/ml lysozyme in 100/0
acetic acid (Sigma. L-6876 grade 1. St. Louis. MO). Figure 9 shows the interpreted mass
spectra of the lysozyme solution: the expected MW of 14.305 kDa was confirmed. The
potential on the sarnpling orifice ofthe instrument was set at +30 V during calibration and was
raised to + 100 V to enhance ion signal for protein.
3.10. Electrophoresis
3.10.1. Sodium Dodecyl Sulphate Polyacrylamide Gel Electrophoresis (SOS
PAGE)
Electrophoresis of myofibrillar protein was performed according to the method of
Fritz et al. (1989). AU the chemicals used for electrophoresis were purchased from Bio-Rad
47
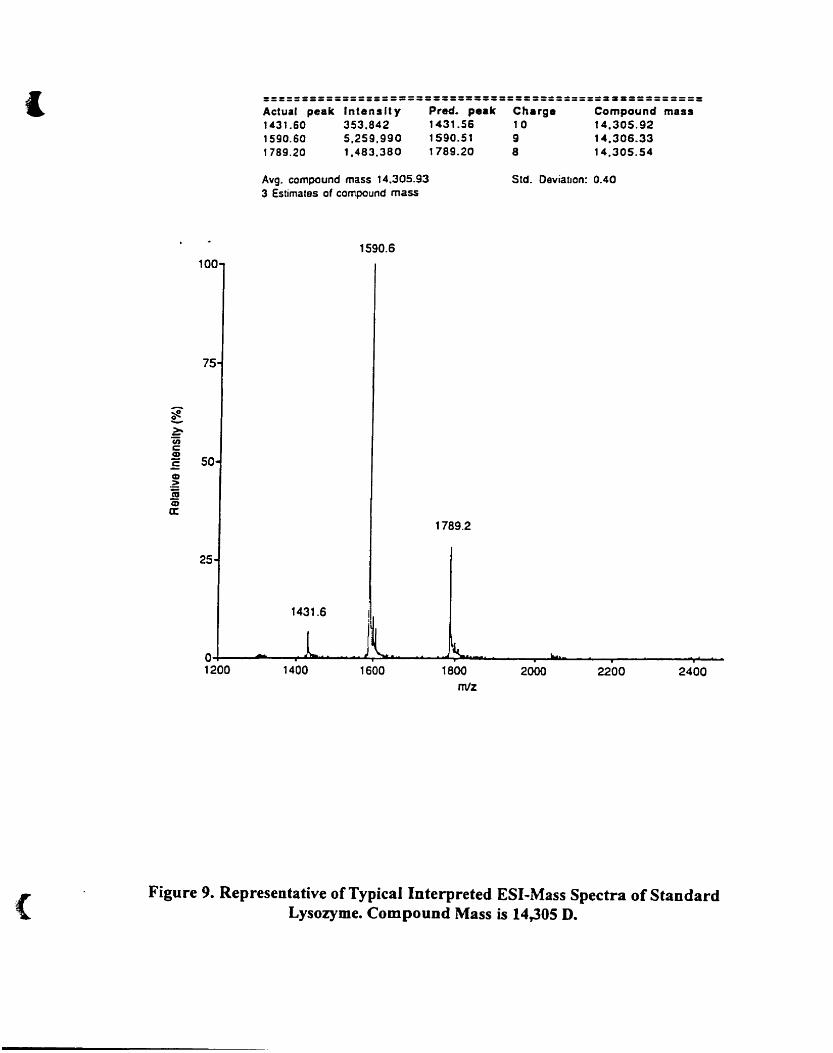
===========================================sa=========1 Actual peak Intenslty1431.60 353,8421590.60 5,259.9901789.20 1,483,380
Pred. peak1431.561590.511789.20
Chargela98
Compound mass14,305.9214.306.3314,305.54
Avg. compound mass 14.305.933 Estimalss of compound mass
Std. Deviation: 0.40
1590.6100
75
;;e!-~ëiic=Q)
50.ËQ)
.2:aiëDCI:
1789.2
25
1431.6
2400220020001800mtz
16001400O+----...--...,................-...~~-.-_-- .......L..y.JI...._--....,...-..l&-. ----......'--'_1200
( Figure 9. Representative of Typical Interpreted ESI-Mass Spectra of StandardLysozyme. Compound Mass is 14,305 D.
(
(Mississauga, Ontario. Canada.. electrophoresis grade) except for urea and thiourea urea
which were brought from Sigma. AIl other chemical unless specifically noted. are reagent
grade.
3.10.1.1. Sample Preparation
Freeze dried myofibrillar protein extract was diluted to a final protein concentration
of 1.4 mg/ml with water. The diluted protein solutions were mixed 2: 1 with sample buffer
containg 3% (WN) SOS. 0.7 M 2-MercaptoethanoL 25 mM Tris-Hel (pH 6.8). 8 M Urea.
2 M Thiourea and 0.35 mg/ml BromophenoI-blue. The protein mixture were heated in boiling
water bath for 5 min. and allowed to cool ta room temperature before application to the gel.
3.10.1.2. Gel Concentration and Preparation
The final composition of the separation gel was 10% (WN) acrylamide and 0.050/0
(W/V) bis. The ratio of acrylarnide to bis was (200: 1), so the gel contained 10.05 % total
(TO~) acrylamide + bis with a cross-linking (C%) of0.5%. lt also contained 0.1 % (WN) SOS.
10% (V/V) glycerol and 0.75 M Tris-HCI (pH 8.6). Polymerization was catalysed by the
addition of 0.067% (WN) ammonium persulfate (APS) and 0.067% N.N.N'.N I
tetramethylethylene-diamine (TErvtEO). The stacking gel contained 3.9% (WN) acrylamide.
0.1% (WN) bis. 0.125 M Tris-HCI (pH 6.8) and 0.1% SDS. Polymerization was catalysed
by the addition of 0.05% (WN) APS and 0.1% (VIV) TEtvŒD. Slab gels were prepared
between 7 x 8 cm glass plates. After polymerization(45-60 min.) the area above the
separating gel was dried with tilter paper, a comb was mounted on top of the gel and the
stacking gel was poured. The comb formed 10 sample wells. Soluble protein (25 ilL) and
molecular weight markers (5 J.1L) were loaded into the sample wells using a Hamilton syringe.
49
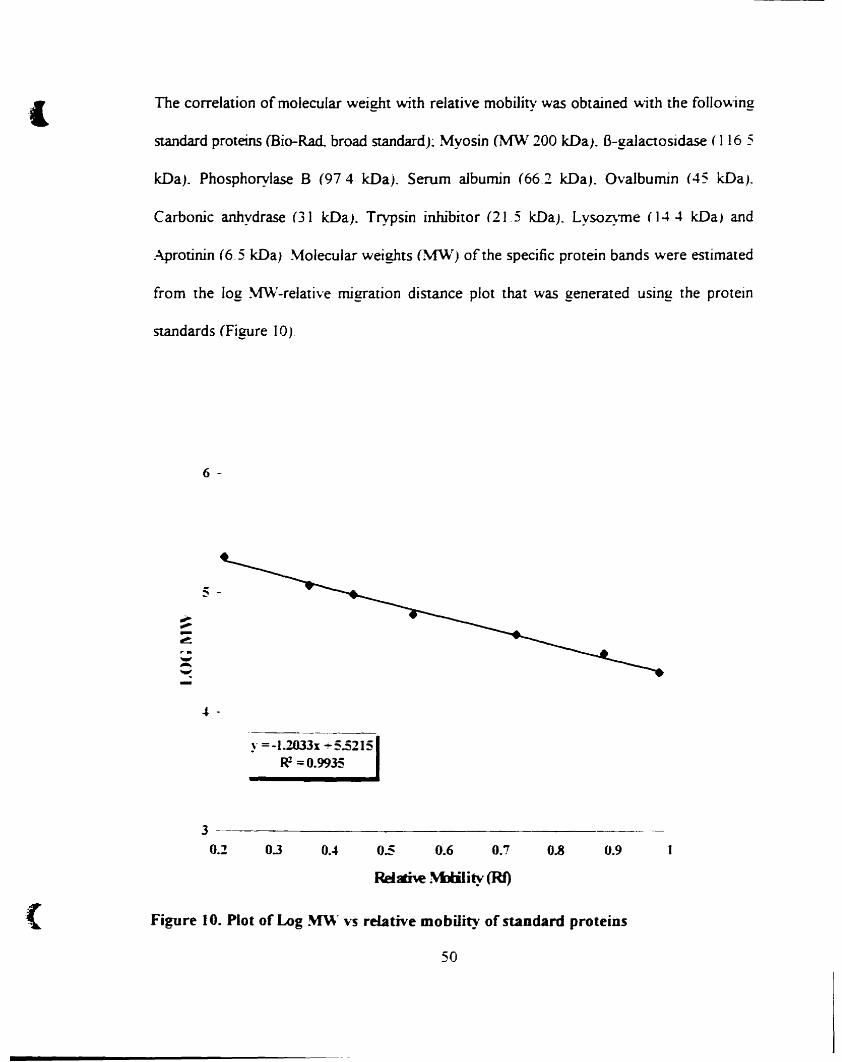
l The correlation of molecular weight with relative mobility was obtained v--ith the folIov--ing
standard proteins (Bio-Rad. broad standard): Myosin (MW 200 kDa). fi-gaJaetosïdase ( 116 5
kDa). Phosphorylase B (974 kDa). Serum albumin (662 kDa). Ovalbumin (45 kDa).
Carbonie anhydrase (31 kDa). Trypsin inhibitor (21 5 kDa). LysoZ}me (14 4 kDa) and
Aprotinin (6.5 kDa) \1olecular weights (MW) of the specifie protein bands were estimated
from the log~-relative migration distance plot that was generated using the protein
standards (Figure 10)
6 -
.. -
y = ·1.2033:1 + 5.5215RI =0.9935
3 ----------------------
0.2 0.3 004 0.5 0.6 0.7 0.8 0.9
(
Relathe MlIiIity (Rf)
Figure 10. Plot of Log M\\" vs relative mobilit), of standard proteins
50
(
(
3.10./.3. Eiectrophoresis Condition
The running buffer cantained 50 m.M Tris-HCl (pH 8.3). 0.384 M glycine and 0.1 %
(w/v) sns. ln arder ta imprave the mobility and the resolution of the high molecular weight
proteins. 10 mM 2-Mercaptoethanol was acided to the upper buffer charnber Eleetrophoresis
was perfonned at a constant CUITent of 15 milliamps (mA). The voltage. CUITent and power
limits for the electrophoresis run were 400 V. 30 m..A. and 15 W respectively The temperature
ofthe elecrrophoresis unit was maintained at 20 oC. by immersion the bottom pan of the unit
in water bath at 12 oC. Electrophoresis was terminated when the tracking dye front
(Bromophenol blue) reached the bonom of the geL trus took 2. 1 h.
3.10./. -1. Protein Fixing. Stal1lIng and Deslailling
.A.fter electrophoresis. the gels \vere removed from glass plates and placed in a fixing
solution that contained 20%) (VlV) methanol. 1O~/O (Vl\r) acetic acid for 2 h. and were then
transferred te a washing solution (l O~/O acetic acid. and 20% (VAl) ethanol for 1 h. (Claeys
et aL 1995) Protein bands \Vere stained bv immersion ofthe gel for 18 h in 10% (\'i'/) acetic- ~
acid. 20°:0 (V!V) methanol and 0.1~· 0 (\V/V) Coomassie BriIliant Blue R :~ Destaining \\'as
carried out by storing of the gel in the fixing solution until the background colour was
completely removed. The destained gels were stored in a 7~/0 acetic acid until they were
photographed.
3.10.2. S ative Electrophoresis
3.10.2./. Sample Preparation
Freeze dried sarcoplasmic extraet (O.03g) was diluted v..ith 06 mJ sample buffer te
give a final protein concentration of 1.4 mg/mI (30;'0). The sample buffer contained 0.3 !\1 Tris-
51
•
(
HeL (pH 8.8). 100/0 glycerol and 25 mg/ml bromophenol blue.
3.10.2.2, Gel Concentrallon and Preparation
Native electrophoresis was performed using the method of Davis (1964) with sorne
modifications. The separation gels consisted of7. ']0/0 T (total) polyacrylamide 0.65c!/0 C (cross
linkage) and 0.375 M Tris-HCL (pH 8.9). The ratio of acrylamide to bis was 375' 1
Polymerization was catalysed by the addition of 0.030/0 (VN) TEMED and 007~0 (\\/1\',
APS. The stacking gels contained 3%) (WN) acrylamide. 0 750/0 (W/v~) bis (monomer:Bis.
4: 1) and 0.0617 M Tris-HCI (pH 6 7). Polymerization Vias initiated by the addition of
rihoflavin 0.0005% (Wf\/) and 0.0575 % (VIV) TEMED. Sucrose (200/0 W/V) was added to
increase the gel density. Gel preparation and sample application is similar to that described in
section 3.10.1.2.
3,10.2.3. Electrophoresis Conditions
~ative eleetrophoresis was performed by using a running buffer that contained 4 95
rt1l\1 Tris and 0.0376 M glycine (pH 8.3). A constant current of 10 mA per gel was used. The
time ofelectrophoresis was 1.1 h. The electrophoresis power limits and temperature is similar
to that described in section 3. 10. 1.3 .
3.10.2. -1. Prote111 jiX111g. Staining and DestaIlling
The method was similar to that described in section 3 10.1.4. "vith exception that
washing step with ethanol was eliminated (SDS was not pan of the gel composition)
3.11. Statistical AoaJysis
The Statistica1 AnaJysis System (SAS Institute Inc .. Cary. NC) was used for anaJysis
of Least significant difference (LSD) of means using completely randomized block design
52
( Whenever the LSD test was found to be significant. NSK and Tukey's tests were performed
between the means to confirm the differences. In ail cases. results were considered
significantly different when P <0.05.
53
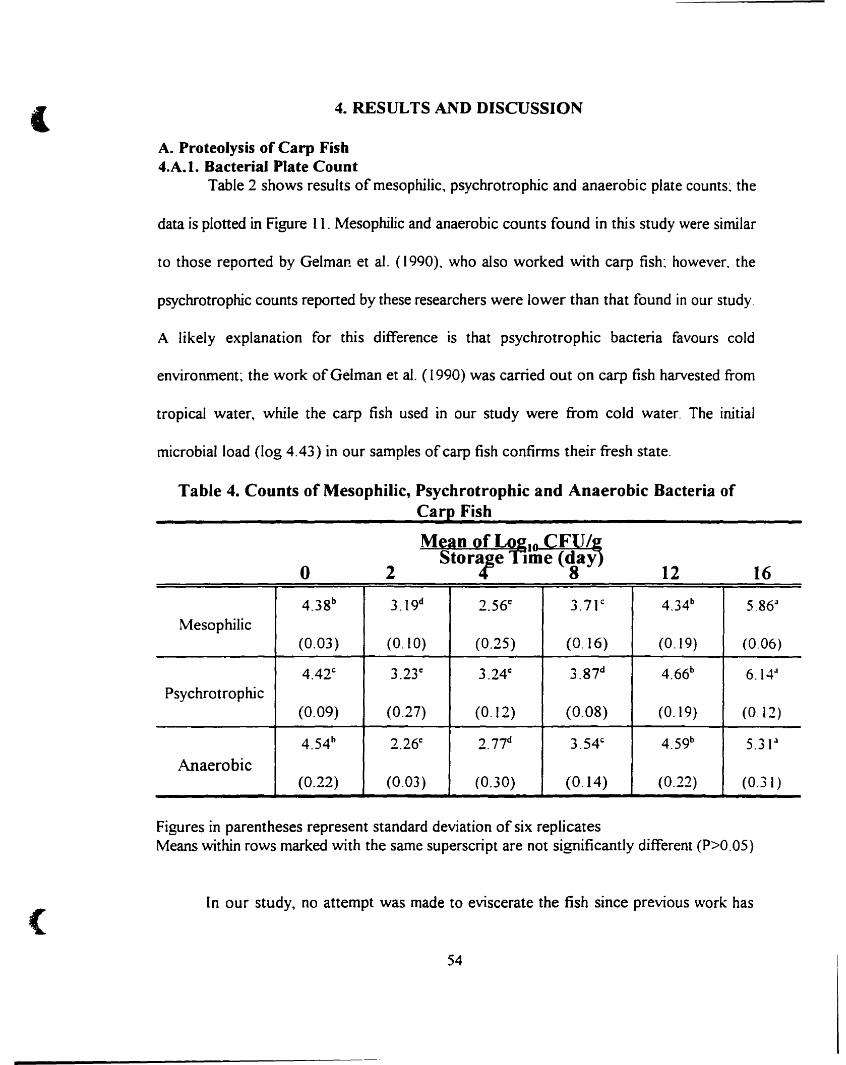
( 4. RESULTS AND DISCUSSION
A. Proteolysis of Carp Fish4.A.1. Bacterial Plate Count
Table 2 shows results of mesophilic, psychrotrophic and anaerobic plate counts~ the
data is plotted in Figure Il. Mesophilic and anaerobic counts found in this study were similar
to those reported by Gelman et al. (1990). who aIse worked with carp fish: however. the
psychrotrophic counts reported by these researchers were lower than that found in our study.
A likely explanation for this difference is that psychrotrophic bacteria favours cold
environment: the work ofGelman et al. (1990) was carried out on carp 6sh harvested from
tropical water, while the carp fish used in our study were from cold water. The initial
microbialload (log 4.43) in our samples of carp fish confirms their fresh state.
Table 4. Cooots of Mesophilic, Psychrotrophic and Anaerobie Hacteria ofCarp Fish
o 2
Mean Of L~lo CFUI~Stora;e Ime (~ay
12 16
(
4.3gb 3.19d 2.56c 3.7I c 4.34b 5.86;1Mesophilic
(0.03) (0.10) (0.25) (0.16) (0.19) (0.06)
4.42c 3.23 c 3.24c 3.87d 4.66b 6.14;1Psychrotrophic
(0.09) (0.27) (0.12) (0.08) (0.19) (0.12)
4.54b 2.26c 2.77d 3.54c 4.59b 5.31;1
Anaerobie(0.22) (0.03) (0.30) (0.14) (0.22) (0.31 )
Figures in parentheses represent standard deviation of six replicatesMeans within rows marked with the same superscript are not significantly different (P>0.05)
ln our study, no attempt was made to eviscerate the fish since previous work has
54
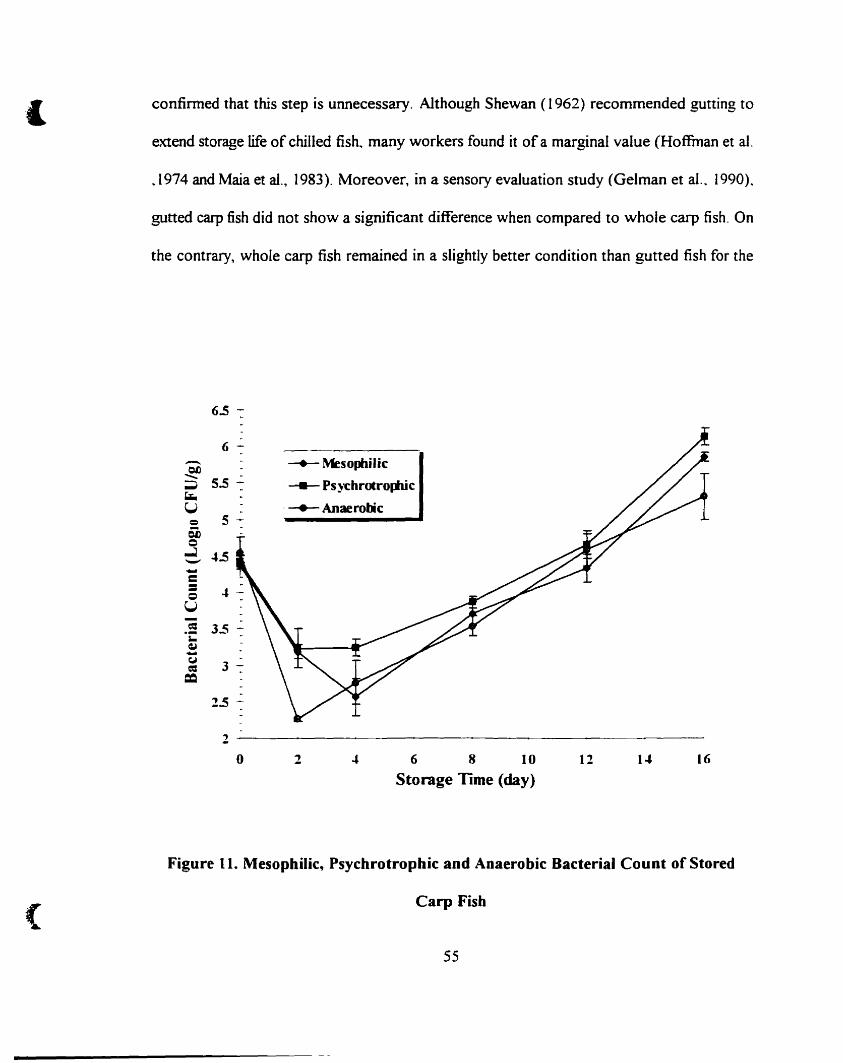
·( confirmed that this step is unnecessary. AIthough Shewan (1962) recommended gutting to
extend storage life of chilled fish. many workers found it of a marginal value (Hoffrnan et al.
.1974 and Maia et al., 1983). Moreover, in a sensory evaluation study (Gelman et al .. 1990).
gutted carp fish did not show a significant difference when compared to whole carp fish. On
the contrary, whole carp fish remained in a slightly better condition than gutted fish for the
6.5 -:
6 -
~;;1 5.5-:'-U= 5 ~Oïlo
....J 4.5--c=oU-== 3.5-:";:~-e",I
== 3-:=2.5 -:-
-+- Mesophilie
---- Psychrotro.me
.-+- Anaerobie
2----------------~---------
o 2 6 8 10
Storage lime (day)12 14 16
(
Figure Il. Mesophilie, Psyehrotrophie and Anaerobie Haeterial CouRt of Stored
Carp Fish
55
(
same storage period.
StatisticaI analysis demonstrated that there was no significant difference (P> 005)
between tish samples. for mesophilic (p= 0.47). psychrotrophic (p= 0.34) and anaerobic
bacteria (p=0.30) for the same storage period. Differences in microbial count between tish
samples stored for the same period were explained by Lasta et al. (1995) in terms of the
heterogeneity ofdifferent samples and random distribution ofbaeteria contamination: however
this type of difference was not observed in our study.
The three groups of bacteria (mesophilic. anaerobic and psychrotrophic) showed a
decrease in counts during the tirst 2 days of storage: however. the rate of decrease was
different among the three groups (Figure Il). The psychrotrophic count decreased from log
4.42 to log 3.23 during the first 2 days, then increased ta log 3.24 (day 4) to and tinally ta log
6.14 (day 16). The mesophilic baeteria count also decreased from log 4.38 to log 2.56 during
the tirst 4 days. Anaerobic bacteria showed the greatest decrease from log 4.54 to log 2.26
after 2 days then increased to log 2.77 (day 4) and finally to log 5.31 (day 16). AIthough
mesophilic bacteria showed the same decrease pattern as psychrotrophic bacteria after 2 days
in storage (Figure 11), mesophilic bacteria did not cease the decrease in day 2 but decreased
from log 3.19 (day 2) ta log 2.56 (day 4). On day 8. mesophilic bacteria count recovered from
log 2.56 (day 4) ta log 3.71 (day 8) and tinally increased ta log 5.86 (day 16).
The decrease in baeterial number during the tirst 2-4 days of storage in our study was
also observed by Gelman et al. (1990). This rapid decrease is the result of the 'cold shock'
phenomenon. Rose (I968) suggested that 'cold shock' resulted from release of cell
constituents from bacteria following the freezing of certain membrane lipids after sudden
56
1
{
chilling with consequent development of 'holes' in the membrane. Based on this hypothesis
the three bacterial groups showed considerably different responses to .coId shock'. The
difference in bacterial response to .coId shock' is due to 'Iipid solidification', a concept
proposed by Gaughram (1947). Allen (1953) and Byme and Chapman (1964) who suggested
that bacteria increase their rate of synthesis of unsaturated fatty acid at the expense of
saturated fatty acid in response to low temperature. which apparently decreases the melting
point of membrane lipids. In psychrotrophic bacteria. 59 to 72% of the lipid is in the
unsaturated fonn (Jay. 1992): trus could expIain the lowest observed 'cold shock' effect this
group (Figure 11). Another reason for the differences in baeterial response to low temperature
storage has been suggested by Farell and Rose (1968) who related the minimum growth
temperature of an organism to the inhibition of substrate uptake by inactivating permease
protein to changes in the molecular architecture of the cytoplasmic membrane. and a shonage
of energy required for the active transport of solutes.
The results from trus study show that carp fish stored aerobically at temperature 0-2
oC up to 2 weeks have the capacity to support baeterial growth to a level which did not result
in noticeable deterioration. This is in agreement with previous reports which indicate that
sensory spoilage was deteetable only when baeterial counts of 106 to 108/ g are reached (Gray
and Sorhang. 1983: GilL 1986 and Gelman et al.. 1990).
4.A.2. pH
The pH changes are shown in Figure 12. The initial pH (day 0) was 6.41. During
storage the pH decreased to 6.31 at day 2 then increased to 6.97 and 7.11 after day 8 and 10.
respectively. An initial reduction in pH was also observed with haddock and herring
57
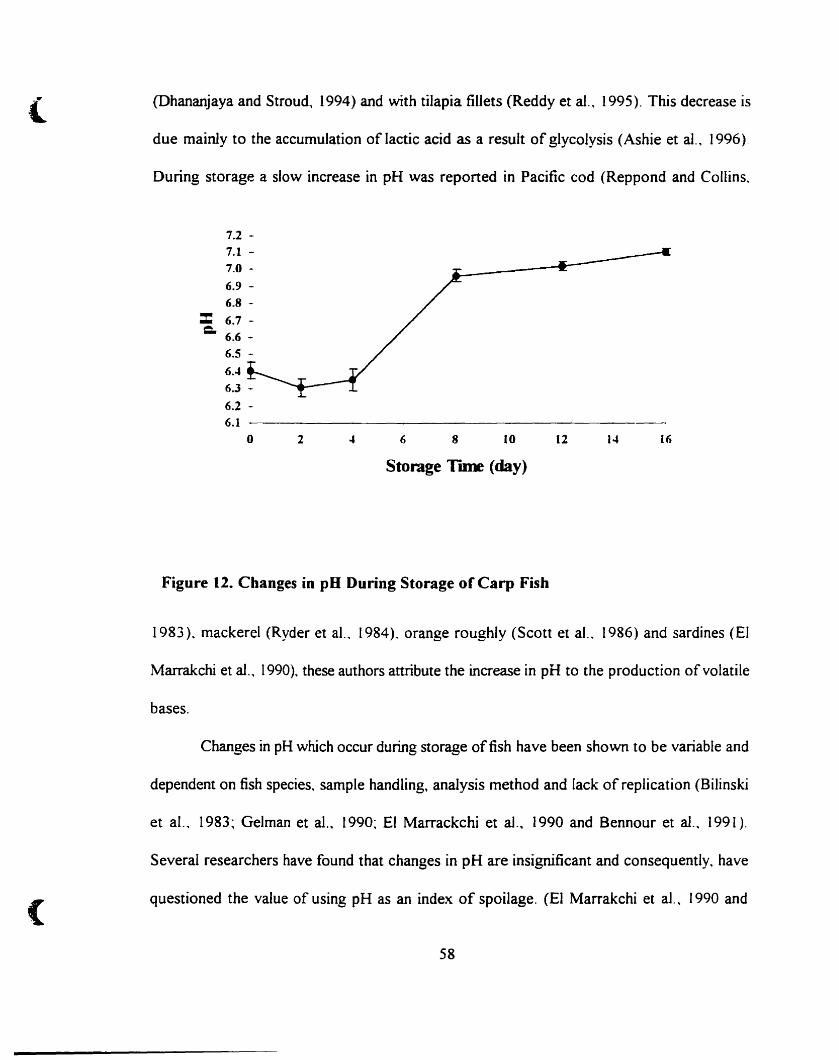
( (Dhananjaya and Stroud, 1994) and with tilapia fiUets (Reddy et al., 1995). This decrease is
due mainly to the accumulation of lactic acid as a result of glycolysis (Ashie et al., 1996)
During storage a slow increase in pH was reported in Pacific cod (Reppond and Collins,
16141210862
7.2 -7.1 7.0
6.9
6.8 -
::c 6.7-C. 6.6 _
6.5 6.-4
6.3
6.2 ~
6.1 ~--------------------o
Storage Toœ (day)
Figure 12. Changes in pH During Storage of Carp Fish
1983), mackerel (Ryder et al., 1984), orange roughly (Scott et al., 1986) and sardines (El
Marrakchi et al., 1990), these authors attribute the increase in pH to the production ofvolatile
bases.
Changes in pH which occur during st0 rage offish have been shown to be variable and
dependent on fish species, sample handling, analysis method and lack of replication (Bilinski
et al., 1983~ Gelman et al., 1990: El Marrackchi et al., 1990 and Bennour et al., 1991).
Several researchers have found that changes in pH are insignificant and consequently, have
(questioned the value of using pH as an index of spoilage. (El Marrakchi et al., 1990 and
58
(
(
Bennour et al.. 1991).
lt can be proposed that changes in pH during storage was significant under controlled
experimentaI condition, this supports the notion that post-harvest handling affects the pH
changes which occur during storage (Ashie et al., 1996).
4.A.3. Changes in Protein Content Extracted from Carp Fish
Changes in protein content of soluble proteins is shown in Figure 13. The average
initial content of sarcoplasmic, myofibrillar and ASN in carp fish was 0.1. 1.2 and 3.8 g/L.
respeetively. Similar results were reported by Machado and Sgarbieri (1991). Protein content
of ASN increased significantiy at day 2 (5.1 g1L) and kept constant throughout the storage
period. No significant changes was observed in the solubility of sarcoplasmic and myofibrillar
during storage.
Severa! reports have indicated that increased storage time (Owusu-Ansah and Hultin.
1986). freezing (Matthews et al., 1979) and draying (Raghunath et al.. 1995) reduce the
extractability of fish proteins as a result of protein denaturation. On the other hand. several
other reports indicated that changes in protein content during storage are insignificant (Xiong
and Brekke. 1989 and Lin and Park 1996). Salm et al. (1983) suggested that myofibrillar
protein solubility in KI buffer increased with ageing of beef These reports and our results
demonstrate the difficulty associated with the use of protein solubility as an indicator of
quality.
59
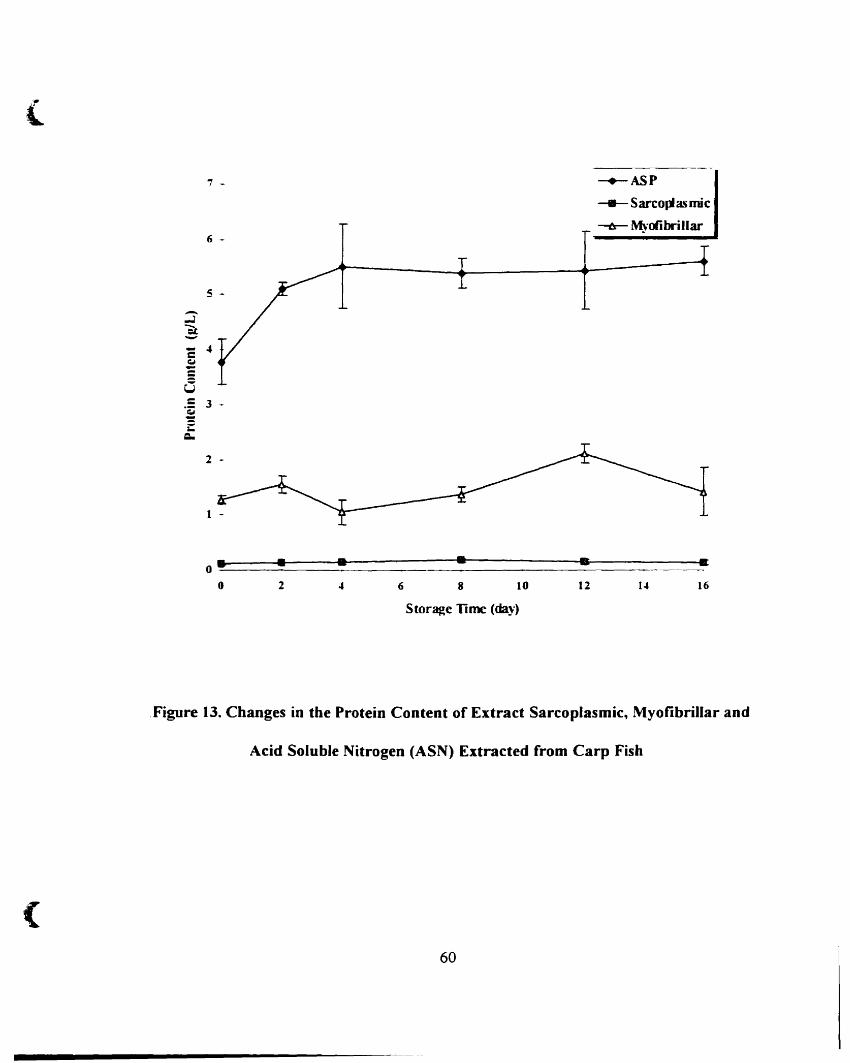
7 -
2 6 8 10 12
-+-ASP
---Sarcop1asmic
~Myofibrillar
16
(
Stor~e lime (da~:)
.Figure 13. Changes in the Protein Content of Extract Sarcoplasmic, Myofibrillar and
Acid Soluble Nitrogen (ASN) Extracted from Carp Fish
60
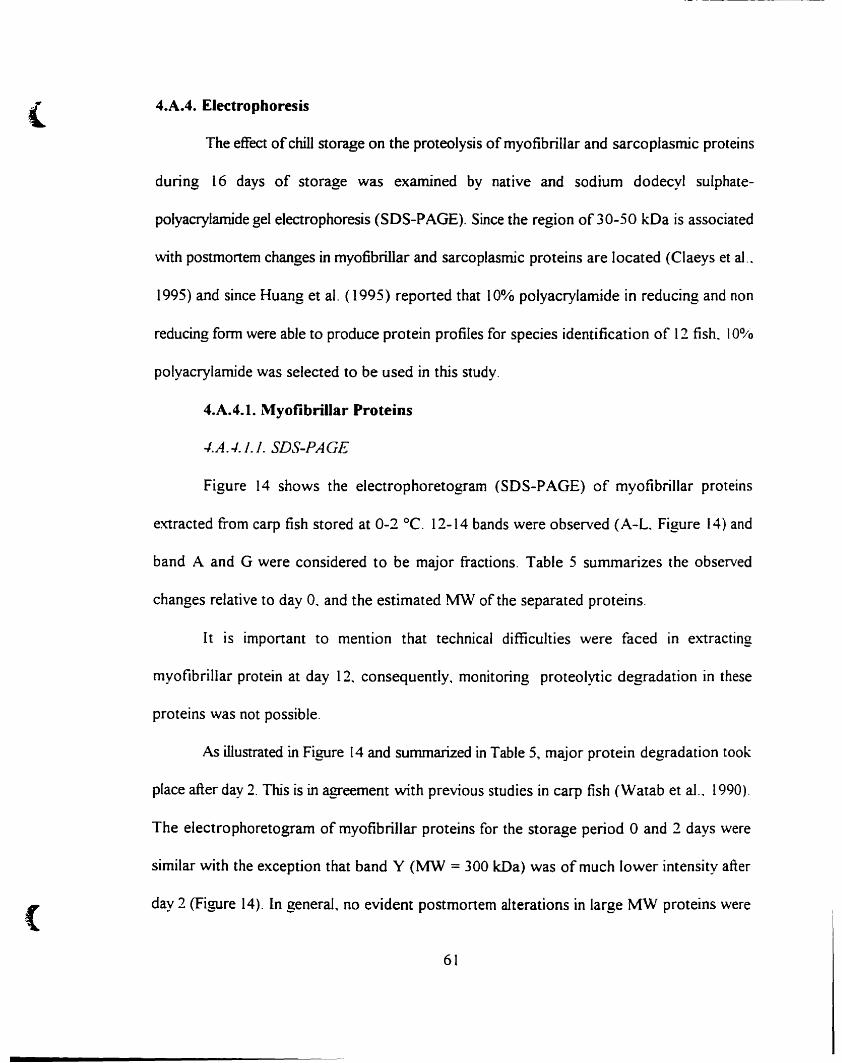
(
.(
4.A.4. Electrophoresis
The effect ofchilI storage on the proteolysis of myofibrillar and sarcoplasmic proteins
during 16 days of storage was examined by native and sodium dodecyl sulphate
polyacrylamide gel electrophoresis (SOS-PAGE). Sïnce the region of 30-50 kOa is assaciated
with postrnortem changes in myofibrillar and sarcoplasmic proteins are located (Claeys et aL.
1995) and since Huang et al. (1995) reported that 10% polyacrylamide in reducing and non
reducing farro were able to produce protein profiles for species identification of 12 fish. 10%
polyacrylamide was selected to be used in this study.
4.A.4.1. Myofibrillar Proteins
-/.A.-/./.l. SnS-PAGE
Figure 14 shows the electrophoretogram (SOS-PAGE) of myofibrillar proteins
extracted from carp fish stored at 0-2 oC. 12-14 bands were observed (A-L. Figure 14) and
band A and G were considered to he major fractions. Table 5 summarizes the observed
changes relative to day O. and the estimated MW of the separated proteins.
It is important to mention that technical difficulties were faced In extracting
myofibrillar protein at day 12. consequently, monitoring proteolytic degradation in these
proteins was not possible.
As ilIustrated in Figure 14 and summarized in Table 5, major protein degradation took
place after day 2. This is in agreement with previous studies in carp fish (Watab et al.. 1990)
The electrophoretogram of myofibrillar proteins for the storage period 0 and 2 days were
similar with the exception that band Y (MW = 300 kDa) was of much lower intensity after
day 2 (Figure 14). In generaL no evident postmortem alterations in large MW proteins were
61
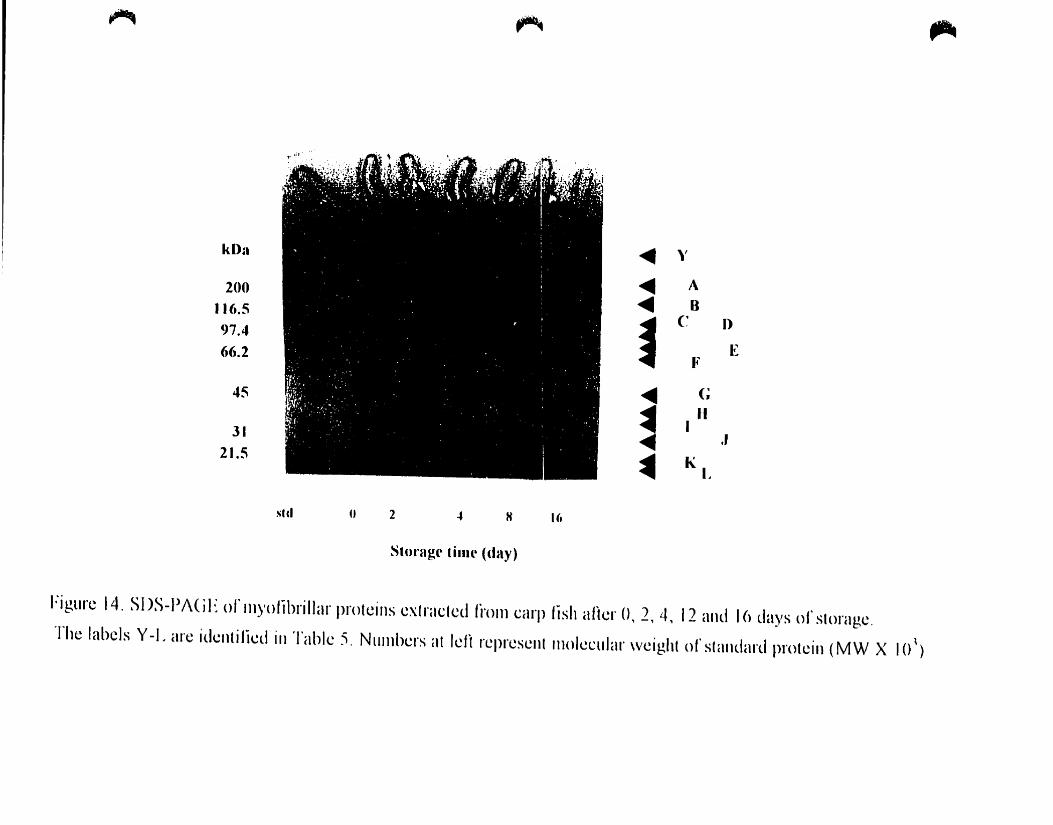
~ ~ ,...
.. 'f .. ,:,~ 'l"~ /)'1'<~;;;~":,, i-o,( ·f:.. ,~~~~}~A. .'i.,/,. ·i{'!·,~·f . fr"' .
• '. . .,.".;: ""."" ", ',. l ".~ ...';, \., ,~.. ';'" '" ." ~ l " • "1 ,,:.";:j{' .',::::'..:."':F', ".' l',.,:. ,.+,\' ..:", ,,' ,",' . i,.. .... ',".
;
kOn~ y
~ A200~ BIl ().5
1C ()97.4
E66.2li'
45 ~ (;
~Il
131 .121.5 • K
L
s.cI U 2 .. H Il,
Storag(' tim(' (day)
Figure 14, SDS-I'1\(;E or llJ)'olibrillar proteins exlraeled Ihm) carp lish alier (J, 2, 4, 12 and 16 days or storage.
The labels Y-1. arc identiflcd in Tablc 5, NL1llJbcrs al Idl represenl llJolecLllar wcight or slnudard prolcin (MW X 1(J 1)
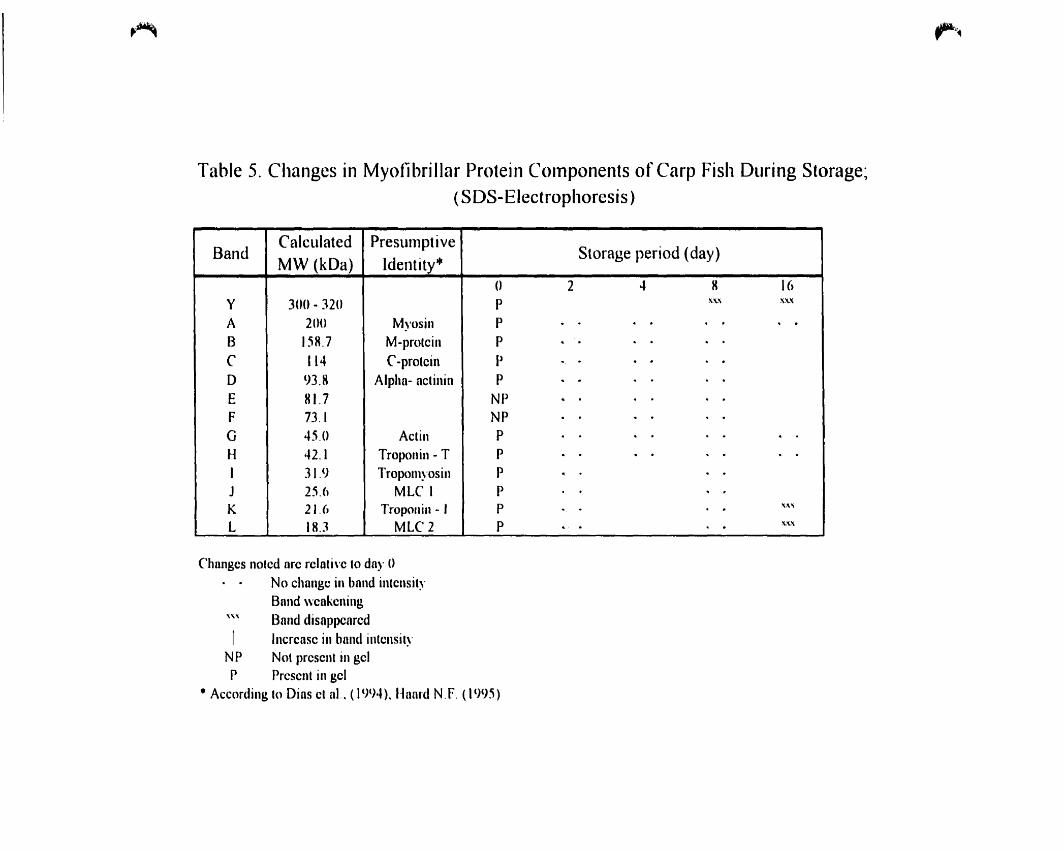
"'~
Table 5. Changes in Myofibrillar Protein COlnponents of Carp Fish During Storage~
(SDS-Electrophoresis)
BandCalculated Presumptive
Slorage period (day)MW (kDa) ldentity*
() 2 4 H 16Y 300 - 320 P X.\.\ XX!(
A 200 Myosin PB )58.7 M-prolcin P · .C 114 C-protcin P · . . .D 93,8 Alpha- aclinin P · .E 81.7 NP ·F 73.1 NPG 4S.U Aclin PH 42,1 Troponin - T P · . . .1 31.9 Tropomyosill P ·J 25.6 MLf 1 P . .K 21.6 Troponin - 1 P . \.'n
L 18,3 MLC2 P ,\.'(,\
Chnnges noled ore relalivc to da)' ()No changc in band inlcnsilyBand wcakening
'" Band disappcarcdr Incrcasc in band inlcnsily
NP Not prescnl in gelP Presenl in gel
• According 10 Dias cl nI.. () 9(4). Haurd N. F, ()995)
~~
.&
(
observed~ thus~ myosin heavy chain (band A. MW=200 kDa). M-protein (band B. 158.7 kDa)
and C-protein (band C, 114 kOa), alpha aetinin (band D. 94 kDa) actin (band G. 45 k.Da) and
troponin-T (band H~ 42.1 kDa) did not show any detectable changes during storage
Ragnarsson and Regenstein (1989) relate the stability of these proteins to their abundance in
a muscle. The electrophoresis gel is usually overloaded with these proteins 50 that it would
be much harder to detect decrease in their intensity. On the contrary, reduction in band
intensity oflow MW proteins occurred. After day 2, there was a reduction in the intensity of
band 1 (3 l.9 kDa ), band J (25.6 kDa), band K (21.6 kDa) and band L (18.3 kOa). The
presummed identity of these separated proteins are tropomyosin, myosin light chain 1.
troponin-I and myosin light chain 2. Similar changes were also reported by many researchers
(Zeece et al., 1986~ Busconi et al., 1989 and Crouse et al., 1991).
Proteolytic changes observed in our study can be related mainJy to autolytic activity
rather than baeterial action, since baeterial count was relatively low (Table 4). During the tirst
week, carp fish had pH in the range of6.4 - 7 which was neither optimal for mammalian CAF
(pH 7.5) (Zeece et al.. 1986) nor for cathepsin 0 (pH 4) (Schwartz and Brid. 1977). but
optimal for neutral proteolytic enzymes (Yu and Lee, 1986). This was supported by
Makinodan et al. (1979) who suggested that neutral proteases (tentatively called a sub
endopeptidase) were responsible for fish deterioration. Moreover. Maeda et al. (1992) found
that CAf enzymes from carp 6sh (also called calpain) have optimal activity at pH 6.8 and
Penny et al. (1980), reported that CAf enzymes can retain as much as 25-280/0 of their
maximum aetivity at low temperature as 5 °C~ therefore, the involvement of CAf enzymes in
the pervious observed proteolysis cannot be excluded. In addition, Busconi et al. (1989)
64
.(
(
suggested that endogenous serine proteinase (trypsin-like serine proteinase) is responsible for
fish muscle degradation during ice storage.
-/.A.-/./.2. Native Electrophoresis
Figure 15 shows the electropherogram (native) ofmyofibrillar protein samples at O.
and after 2, 4, 8, 12 and 16 days of storage. Table 6 summarize the changes and relative
mobility of the separated proteins. The most apparent changes were: (a) the rapid decrease
in intensity ofband Y (Rm = 0) which rapidly decreased by day 2 and completely disappeared
by day 4 and (b) a graduai decrease in intensity of bands F (Rm= 0.82), G (Rm=O.91 ), and H
(Rm= 0.96) during the storage period. The presumptive identity ofthese proteins is unknown.
4.A.4.2. Sarcoplasmic Proteins
-I.A.-/.2. J. SDS-PAGE
Eleetrophoretograms of the sarcoplasmic proteins conditions are shown in Figure 16:
the estimated mean molecular weights and changes in the separated protein are shown in
Table 7. The major sarcoplasmic proteins (II proteins) separated in this study, with molecular
weights ranging from 100 to 23 kOa, were comparable to proteins found in sarcoplasm of
carp fish by Nakagawa et al. (1988 a and b) and of red snappers by Huang et al. (1995). The
most apparent changes were as follows: (a) graduai increase in intensity of bands F (Creatine
kinase) and G (AIdolase), (b) graduai decrease in bands A (- 140 kDa), C (alpha-actinin), 0
(BSA), E (- 53 kDa) and H ( glyceraldehyde-3-phosphate dehydrogenase, GAPDH).
The appearance of myofibrillar protein. a-actinin (arrow C), in sarcoplasmic
electrophoregram was not expected. The release of a-actinin fram myofibrillar extract to
sarcoplasmic extraet was also proposed by Yamamoto et al. (1979) and Xiong et al. (1996).
65
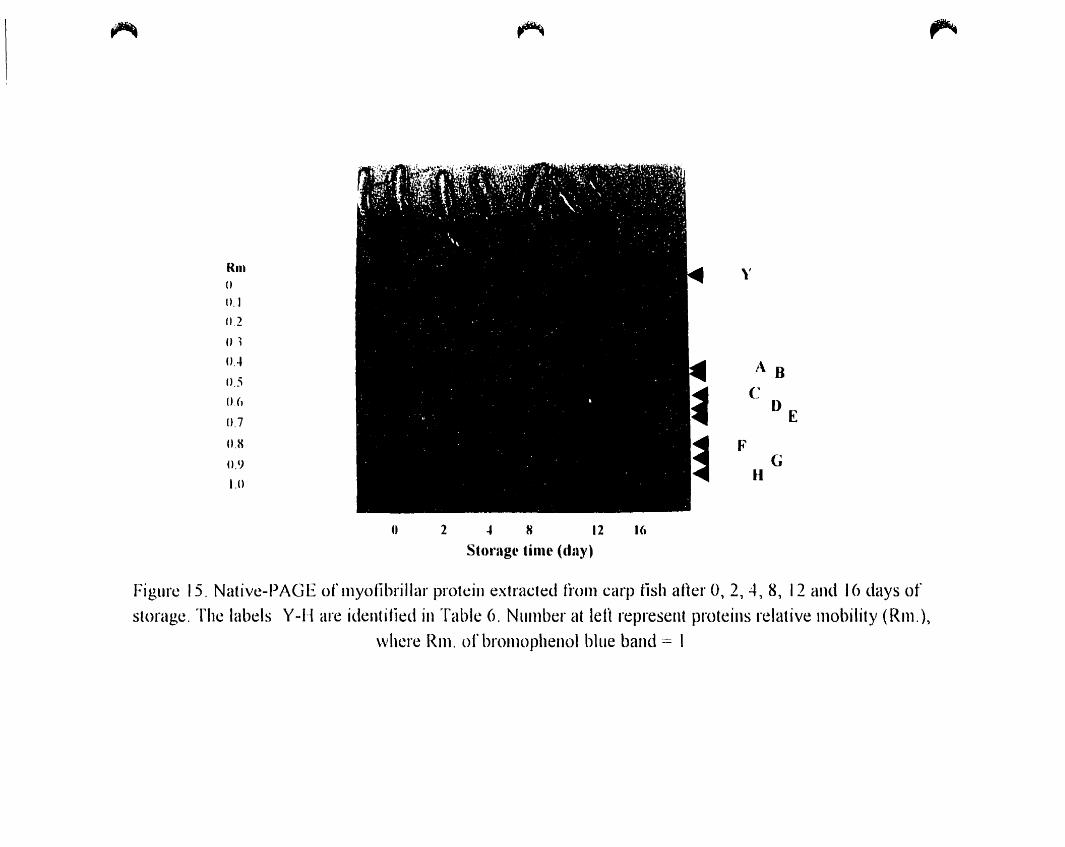
~
RmIl
Il. 1
Il.2
01
0..1
Il.S
ll.()
0.7
Il.X
0.9
l.O
~
y
A B
C 0E
FG
If
~
u 2 .. H 12
Slo..nge lime (dny)
1(,
Figure 15. Native-PAGE oflnyofibrillar protcin extracted n·oln carp fish aner 0,2,4,8,12 and 16 days of
storage. The labels Y-H are identificd in Table 6. NlIInber at leH represent proteins relative tl10bility (Rlll.),\vhere Rlll. of broll1ophenol bille band = 1
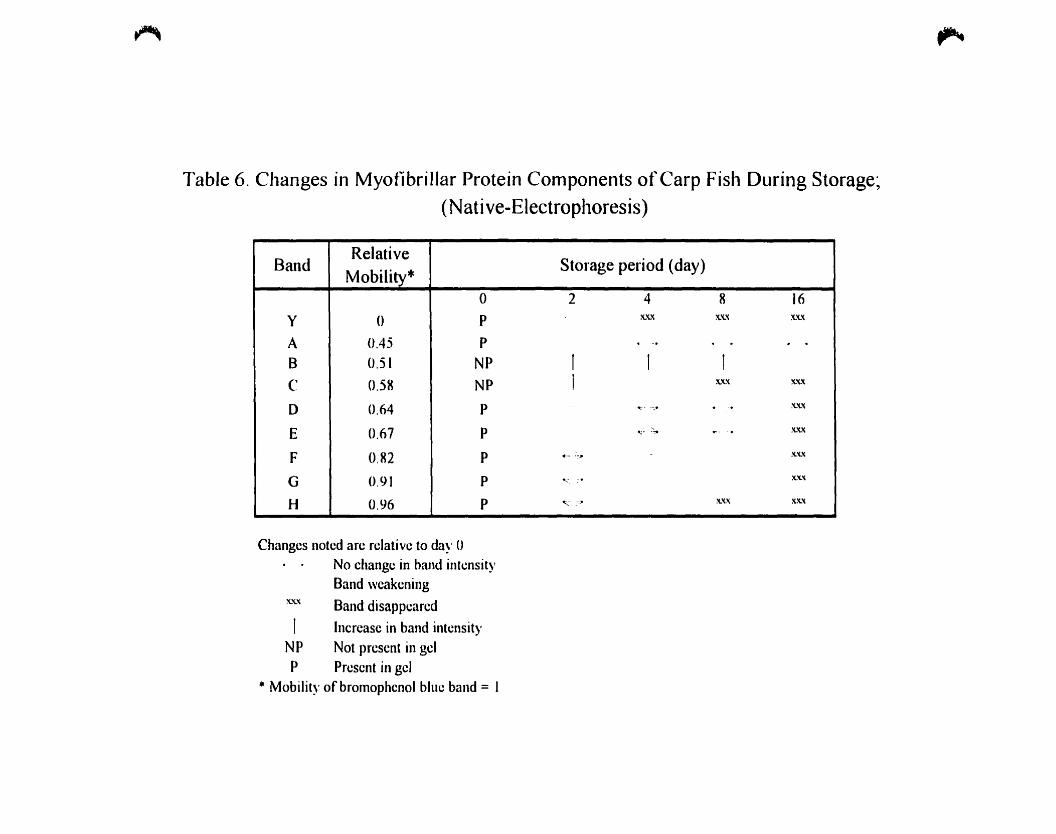
~
Table 6. Changes in Myofibrillar Protein Components ofCarp Fish During Storage~
(Native-Electrophoresis)
BandRelative
Storage period (day)Mobility*
() 2 4 8 16
Y 0 P )(.x,'( x.x,'( :<.x,'(
A 0.45 P 4-. . .B 0.51 NP 1 1 1
C 0.58 NP 1 x.x:< llx',(
D 0.64 P lI;::"- --," . . :'<.'l'l(
E 0.67 P lt,;- .~ ..... :'<.x,'l(
F (}.82 P 4-- ._;JJ )(''l'<
G 0.91 P ,~ :-- :'<.'l'<
H 0.96 P ,,- ;-~ :'<.'<)0; x:'<.'<
Changes noted are relative to day 0
No change in band intensityBand weakening
:'<.'l'< Band disappeared
1 Increase in band intensityNP Not present in gelP Present in gel
• Mobility of brornophcnol blue band = 1
~
.(
{
Kimberly and Flurkey (1986) suggested that myofibrillar protein couId be resoIubilized by
electrophoresis denaturing buffer. Moreover. Goll et al. (1977) indicated that myofibrillar
proteins are soluble in water once they have been extracted and sorne are extraetable with
water.
The disappearance ofbands D (67 kDa) and A (140 kDa) and the graduai increase in
band intensity of creatin kinase (band F) and aldolase (band G) can be used as potential
indicators for the state of freshness of chilled carp fish.
-I.A. ",.2. 2. Native E/ectrophoresis
Figure 17 shows the electropherogram (native) of the sarcoplasmic extract at 0 and
after 2, 4. 8. 12 and 16 days of storage. Changes in fractions and relative mobilities of
separated sarcoplasmic proteins are summarized in Table 8. In general. the intensity of
separated bands remained stable throughout the storage period~ ooly minor changes were
observed in bands B (creatine kinase), E (parvalbumin 1). and F (parvalbumin 3) which
completely disappeared in day 16. Bands D. E. and Fare most likely parvalbumins. the
presence of which in carp fish was initially reponed by Konosu et al. (1965) and later
identified by Nakagawa et al. (1988 a)~ these proteins in fish may constitute upto 20-30% of
the sarcoplasmic fraction (Sch\vimner. 1995). Although cathepisns can degrade sarcoplasmic
proteins (Drabikowski et al.. 1977), no signs of degradation were observed in native
electrophoretogram of sarcoplasmic extract ( Figure 17). Moreover. Goll et al. (1983 b)
stated that CAf. originally found in the sarcoplasmia, has very litde effect on the sarcoplasmic
proteins. From results obtained we can conclude that native electrophoresis is not applicable
to monitor protein degradation in carp fish.
68
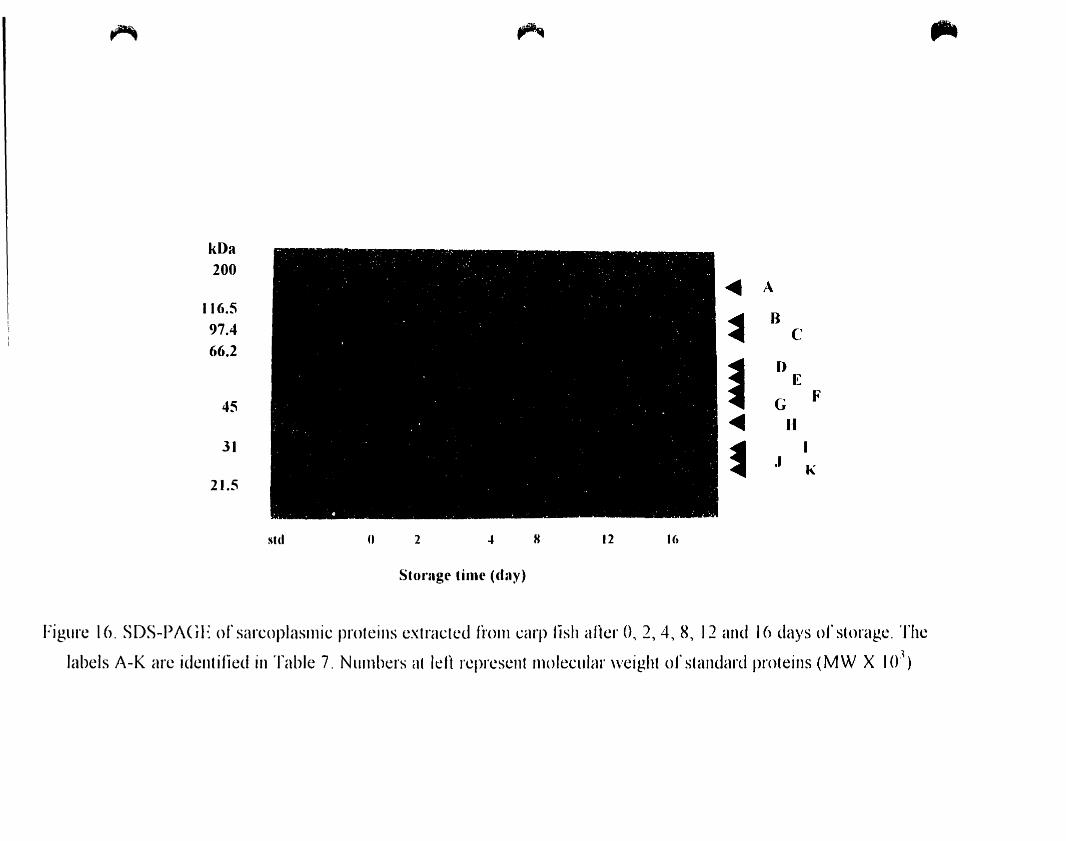
~ ~
1
Il ,
,..
std fi 2 .. H 12 Ut
Stornge time (day)
Figure 16. SDS-PACIE of sarcoplasn1Ïc proteins cxtracled fi'onl carp fish aBcr 0, 2, 4, 8, 12 and 16 days of storage. The
labels A-K arc idcntified in Table 7. NllIllbers at left rcprcscnt rnolecular \\'eight of standard proteins (MW X 1()')
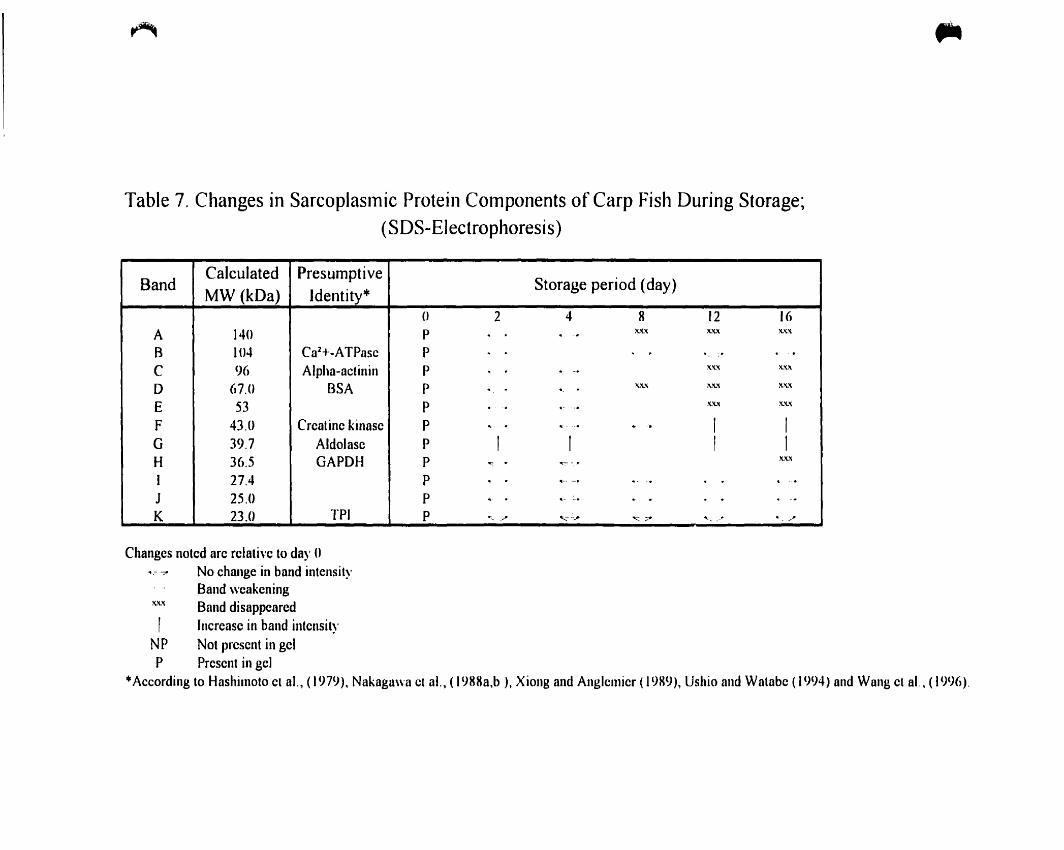
~
Table 7. Changes in Sarcoplaslnic Protein COlnponents of Carp Fish During Storage~
(SDS-EJectrophoresis)
BandCalculated Presumptive
Storage period (day)MW (kDa) Identity*
0 2 4 R 12 16A 140 P . -. xx.'! xx.'! ~'(,(
B 104 Ca2+-ATPase P ..
C 96 Alpha-actinin P . -. ~'l'! ~'(.,
D 67.0 BSA P "- . 'l'lI( :\''(.'1 X:\.'l
E 53 P ll- --.~'l'l ~'l'l
F 43.0 Creatine kinase P "'- . ....-- --. ~ -. 1 1
G 39.7 Aldolasc P 1 1,
1H 36.5 GAPDH P ':- .. .,- - . ~'l'l
1 27.4 P . . ..... - . .. .. il. - •
J 25.0 P .- . ll- :.. .. ~ . . • -0
K 23.0 TPI P ~- ," "'7 "":7 '-:' ~. Co -~ -.,.
fi'
Changes noted are relativc to day 0',- -;* No change in band intensity
Band wcakening~'l'l Band disappcared1 Increase in band intensily
NP Not present in gelP Present in gel
•According 10 Hashimoto ct al., (1979), Nakagawa cl al., (19KHa,b ), Xiong and Anglcmicr (1989), Ushio and Watabc (1994) and Wang el al., (1996).
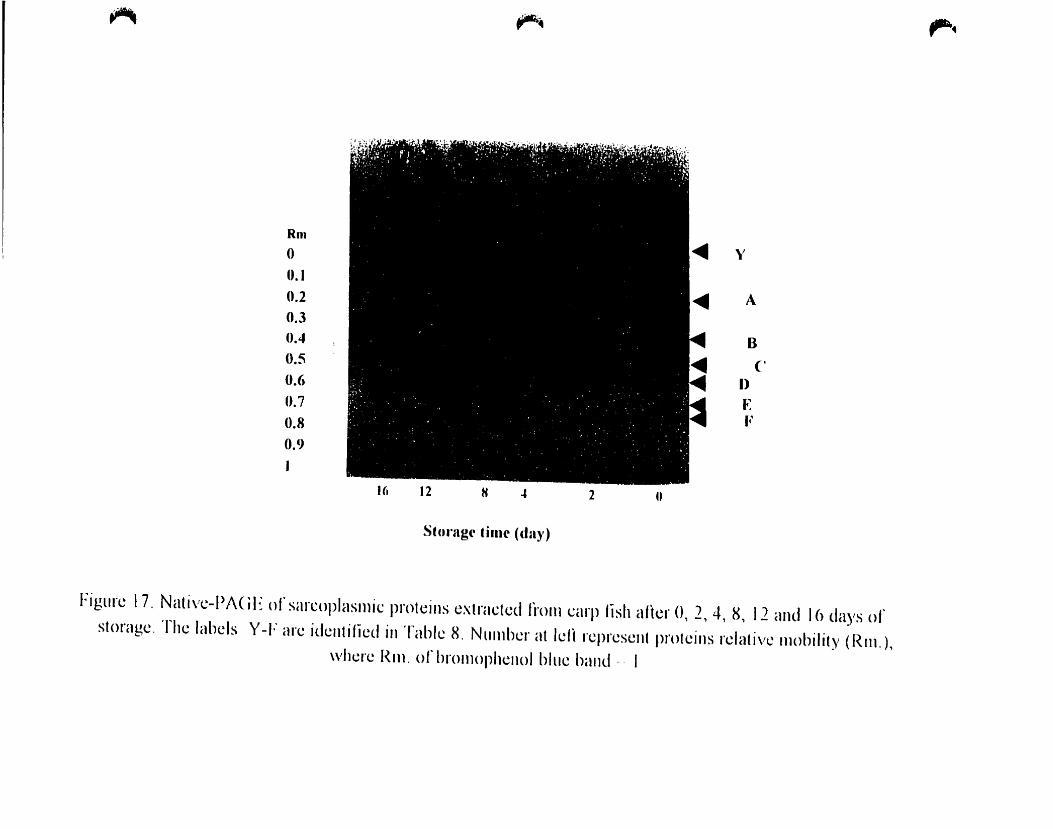
~
Hmo0.10.20.30.40.5
0.6
0.7
0.8
0.9
1
HI 12 H
~;.- -~
.. 2 u
y
A
B
C1)
EF
,..~
Storngr 'illl(, (dn)')
Figure 17. Nalive-PMiE of sarcoplasmic proteins extracted fi'oll1 carp lish afier 0, 2, 4, S, 12 and 16 days or
storage. The labels Y-F are idcntified ill Tablc 8. Nlllllbcr al Icli rcprcscllt proteins relative IlH)bilily (Rlll.),
\vhere Rlll. or brOIlH)phcnol bille band·· 1
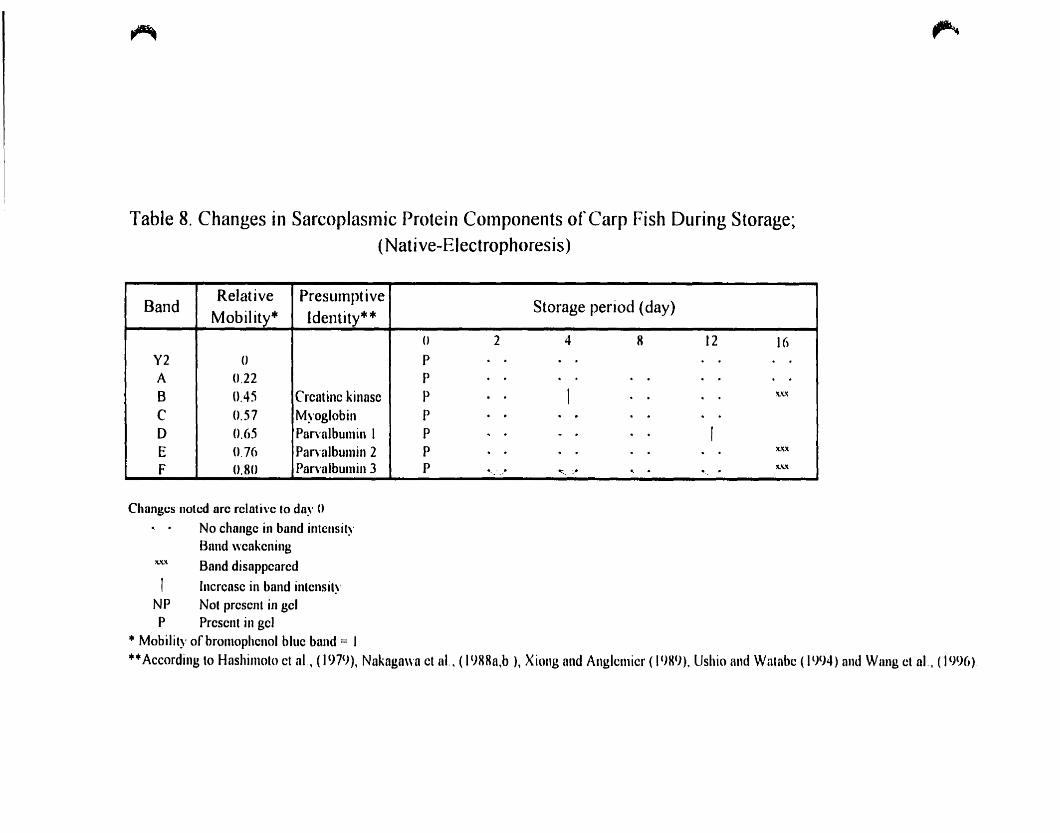
~
Table 8. Changes in Sarcoplasillic Protein COlnponents of Carp Fish During Storage;(Native-Electrophoresis)
BandRelative Presumptive
Storage period (day)Mobility* Identity**
0 2 4 H 12 16Y2 0 PA 0,22 P ·B UA5 Crcatinc kinasc P 1 . ,\.'(.)(
C 0.57 Myoglobin P · · .D 0,65 Parvalbumin 1 P · · 1E 0,76 Pan'albumin 2 P . x.'I(.'(
F 0,80 Pan'albumin 3 P . · "" c·.. . . )(.'1(.'(
" -~
~
Changcs notcd arc relati"c to da)' 0
No changc in band intcnsityBand wcakcning
,u" Band disappearcd
1 Incrcase in band intel1sityNP Not present in gelP Present in gel
• Mobility ofbromophcnol blue band = 1++According to Hnshimoto cl al., (197()), Nakagawa cl al .. (1 ()RRa,b ), Xiong and Anglcmicr (19K()). Ushio and Walabc (1 ()94) and Wang ct al.. (199(,)
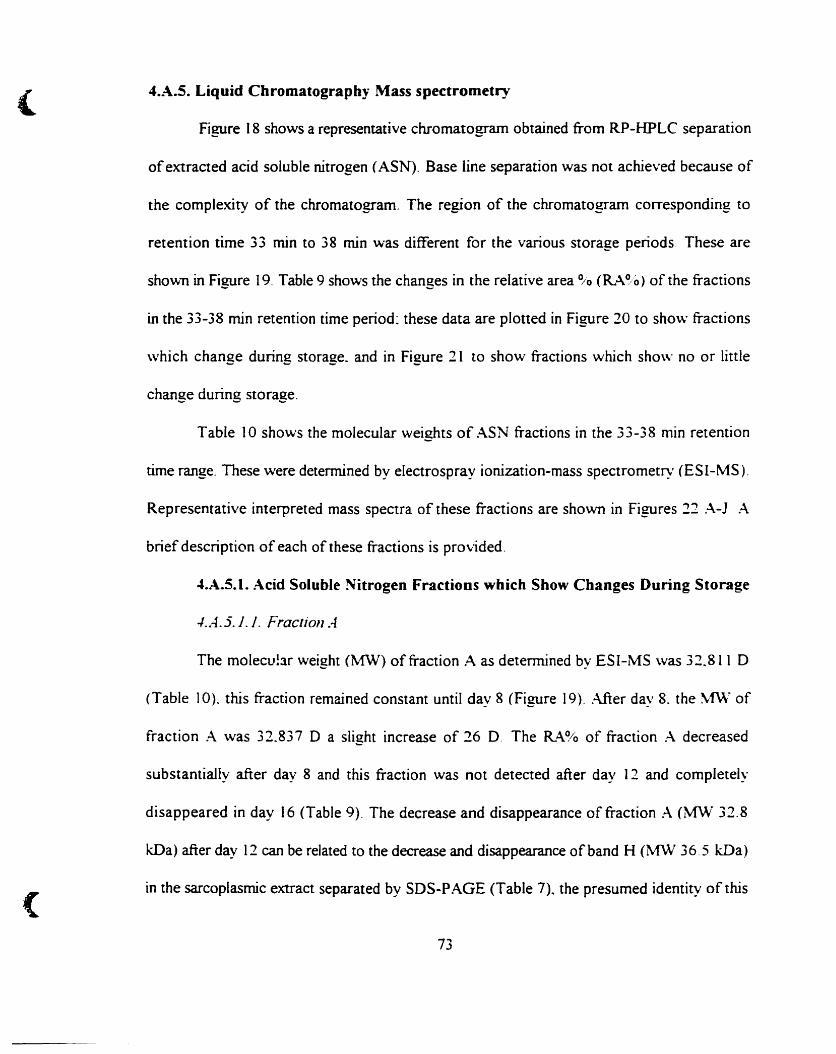
{
(
4.:\.5. Liquid Chromatography Mass spectrometry
Figure 18 shows a representative chromatogram obtained from RP-HPLC separation
ofextracted acid soluble nitrogen (ASN). Base line separation was not achieved because of
the complexity of the chromatogram. The region of the chromatogram corresponding to
retention time 33 min ta 38 min \\t"as different for the various storage periods. These are
shovm in Figure 19. Table 9 shows the changes in the relative area % (RA~/o) of the fractions
in the 33-38 min retention time period: these data are plotted in Figure 10 to shov; fractions
\vhich change during storage. and in Figure 11 to show fractions which sho\\" no or linie
change during storage.
Table 10 shows the molecular weights of ASN fractions in the 33-38 min retention
rime range. These were determined by electrospray ionization-mass spectrometry (ESI-MS).
Representative interpreted mass spectra of these fractions are shown in Figures 22 A-1 A
brief description of each of these fractions is pro\iided.
4.A.5.1. Acid Soluble Nitrogen Fractions which Show Changes During Storage
-1...1.5.1.1. Fraction A
The molecu!:lr weight (rvfW) of fraction A as detennined by ESI-MS was 32.811 0
(Table 10). this fraction remained constant until day 8 (Figure 19). :liter day 8. the \-1\V of
fraction A \vas 32.837 0 a slight increase of 26 D. The R.-\~/o of fraction A decreased
substantially after day 8 and this fraction was not detected after day 12 and completely
disappeared in day 16 (Table 9). The decrease and disappearance of fraction A (MW 32.8
kDa) after day Il can be related to the decrease and disappearance ofband H (rvtW 36.5 kDa)
in the sarcoplasmic extract separated by SOS-PAGE (Table 7)~ the presumed identity of this
73
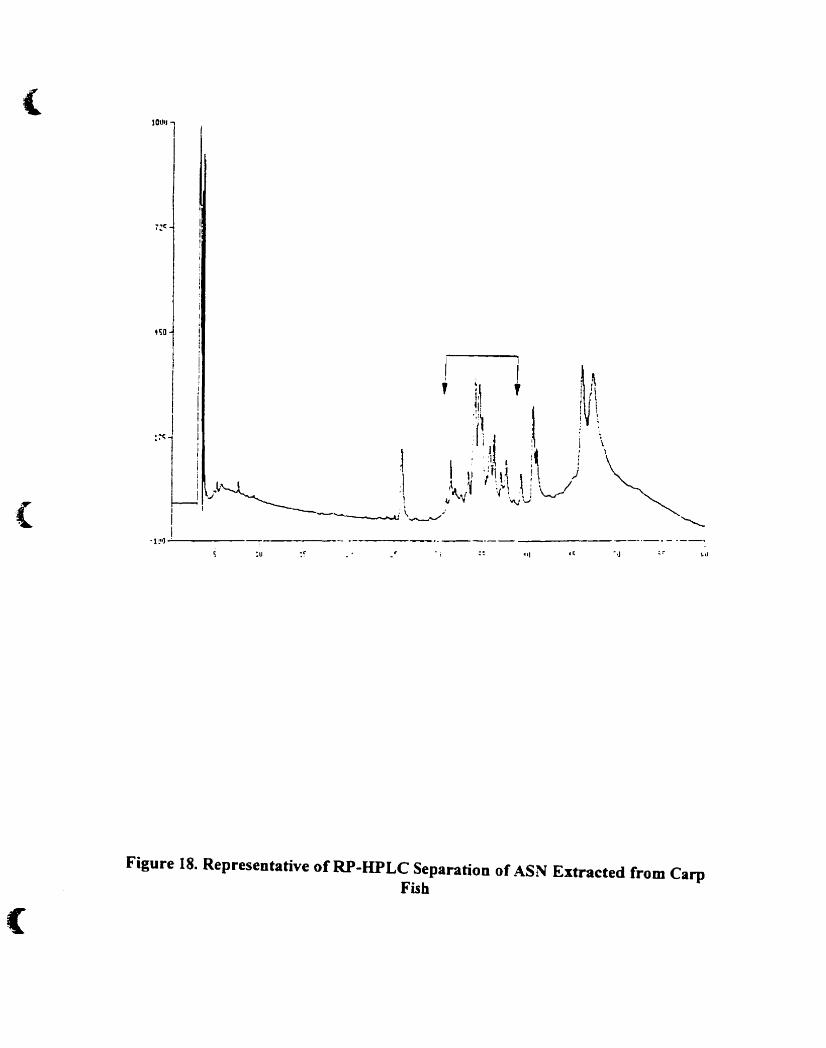
(
(
10111'
:u._--------- --.. -._~
~"
(
Figure 18. Representative of RP-HPLC Separation of ASN Extracted from CarpFish
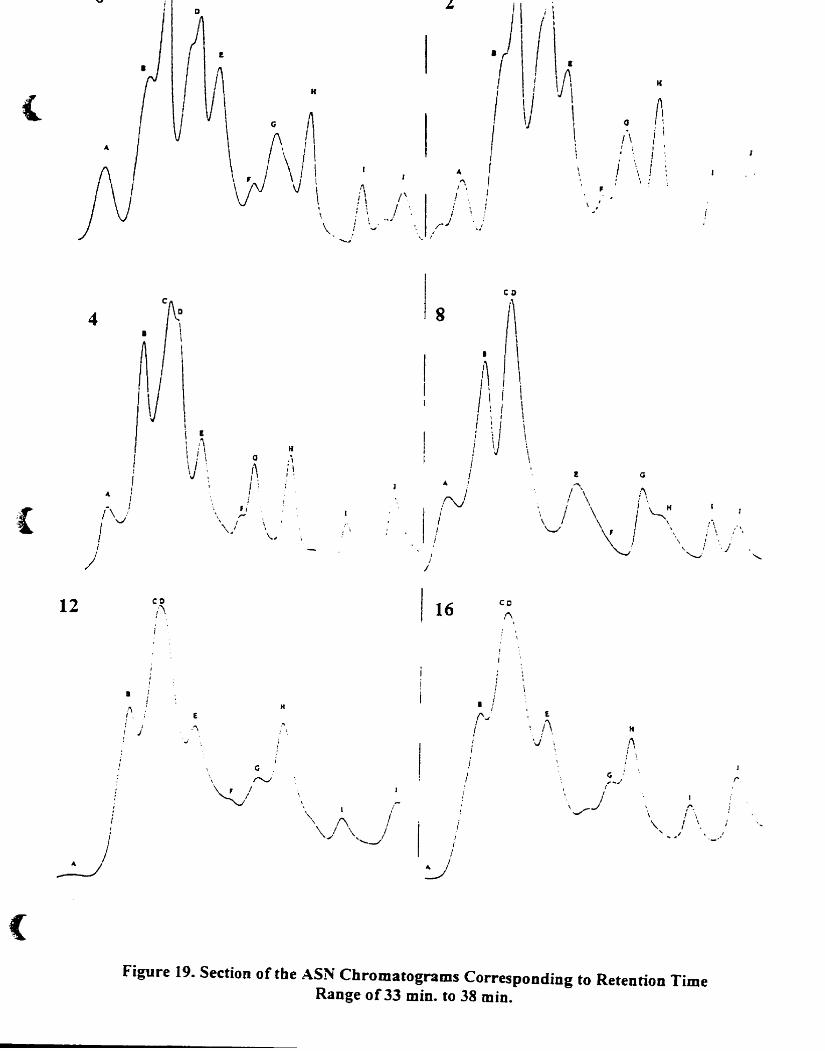
(
v
H
G ~
jV\\
\
,~ l'! \i \ _./. \ .i ""
4,...l,
1ii
,J, ,'- 1
If
Q A{\ 1;:~. ;1 \!
'.
\ "
{
12
4
11
1A. ;
- !1\ .-/ v
1
Jco/\
,1 !
t '\\ i,
\) \
,/\ ,.., ,\.,
Q
1\1:J •
\\
\. ..
If.;i'" ~
CD
'\8 ~ 1\
1\! \'j \i \ \
1 \
1 \
!,;V1ji
/;
co(\.
! <i
;'"'\ t\
\,.// ~.JI \.......~'\ i\\ :., i .j'-.". .......
{
•1'1, ,
! 1, J!
E
.",
H
.-; \
,,1 (\ f\ 1\ / \ /
.; ''---/
rJ
!1
1
i1
1 1o
E
/\'J
G,-..'r
\-/"J
ft
(\j \
1,." ! -,\, 1 \
.... ,1 ... .~I
r
Figure 19. Section of the ASN Chromatograms Corresponding to Retention TimeRange of 33 min. to 38 min.
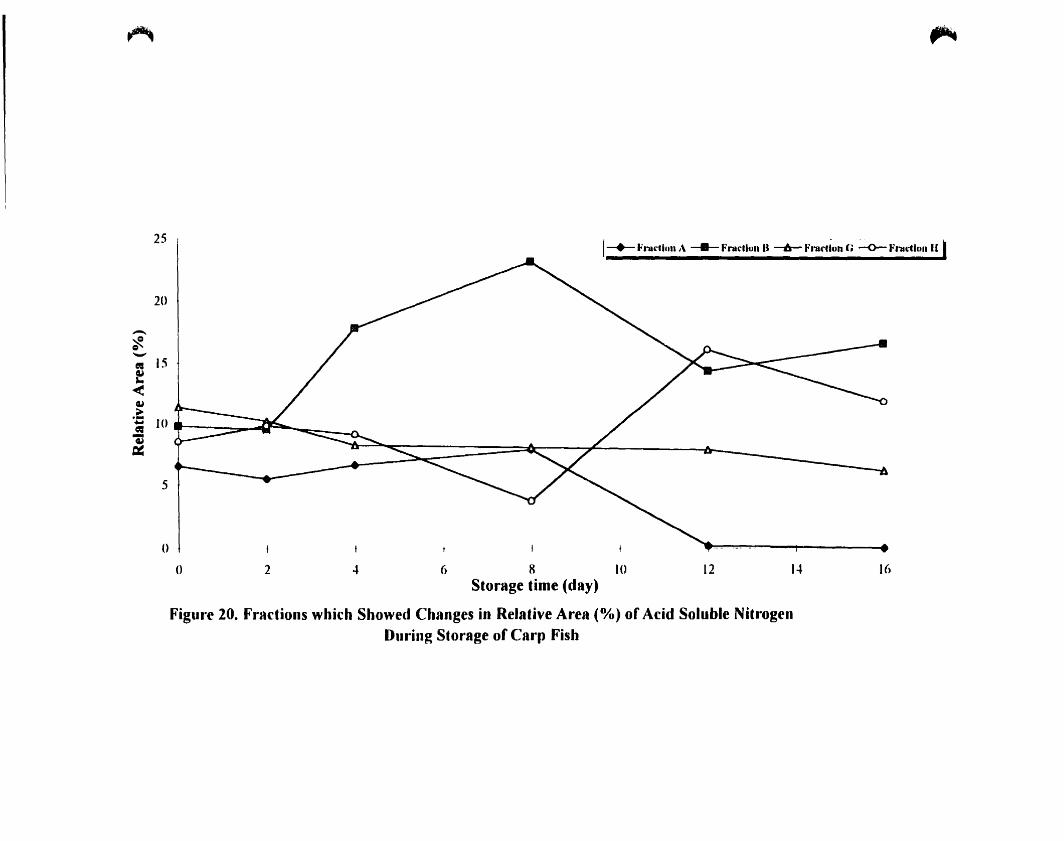
~,..
251~ l'radlon A~ l'nlcllon n -Ii- Fraction {; -0-- "'ruetlon Il
16l-l12-l2 6810
Storage time (day)
Figure 20. Fractions which Showed Changes in Relative Area (%) of Acid Soluble NitrogenDuring Storage of Carp Fish
o()
20
-"1--~ 15~a..<~
>.-.... 10œ-~c=
5
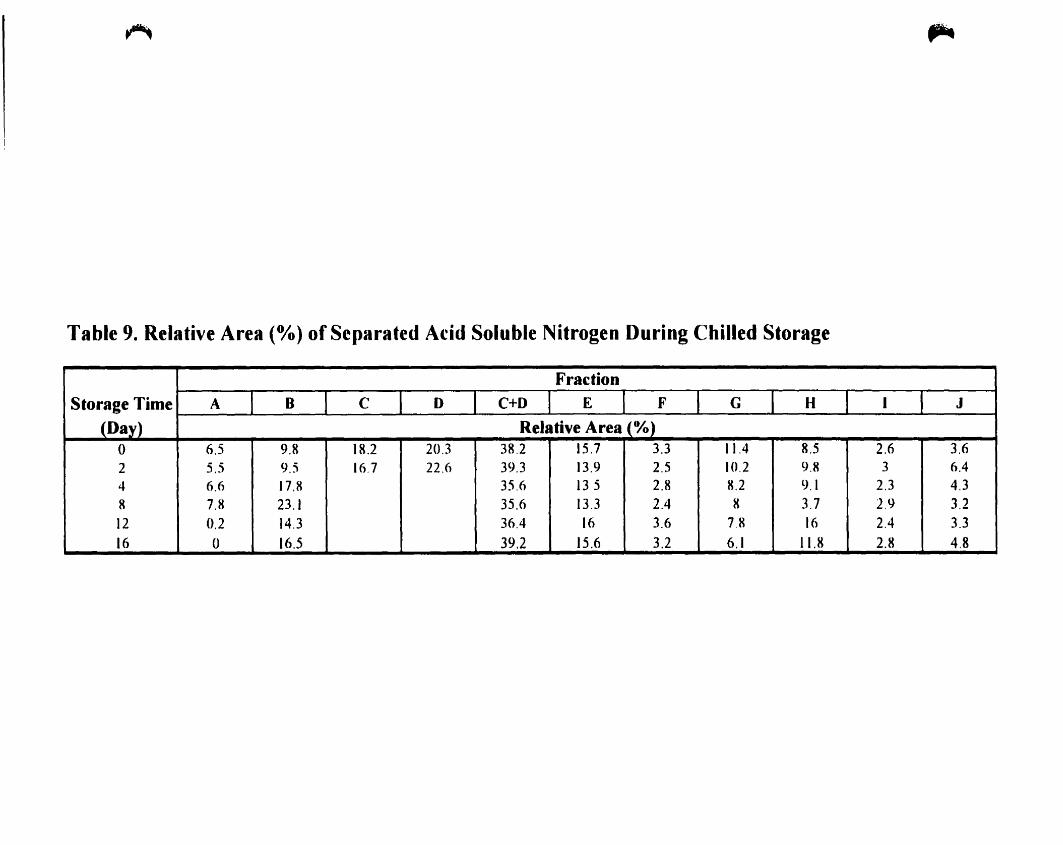
~
Table 9. Relative Area (%) of Separated Acid Soluble Nitrogen During Chilled Storage
,..
FractionStorage Time A B C D C+D E F G H 1 J
(Day) Relative Area (%)0 6.5 9.8 18.2 20.3 38.2 15.7 3.3 11.4 8.5 2.6 3.62 5.5 9.5 16.7 22.6 39.3 13.9 2.5 10.2 9.8 3 6.44 6.6 17.8 35.6 13 5 2.8 8.2 9.1 2.3 4.38 7.8 23.1 35.6 13.3 2.4 8 3.7 2.9 3.212 0.2 14.3 36.4 16 3.6 7.8 16 2.4 3.316 0 16.5 39.2 15.6 3.2 6.1 11.8 2.8 4.8
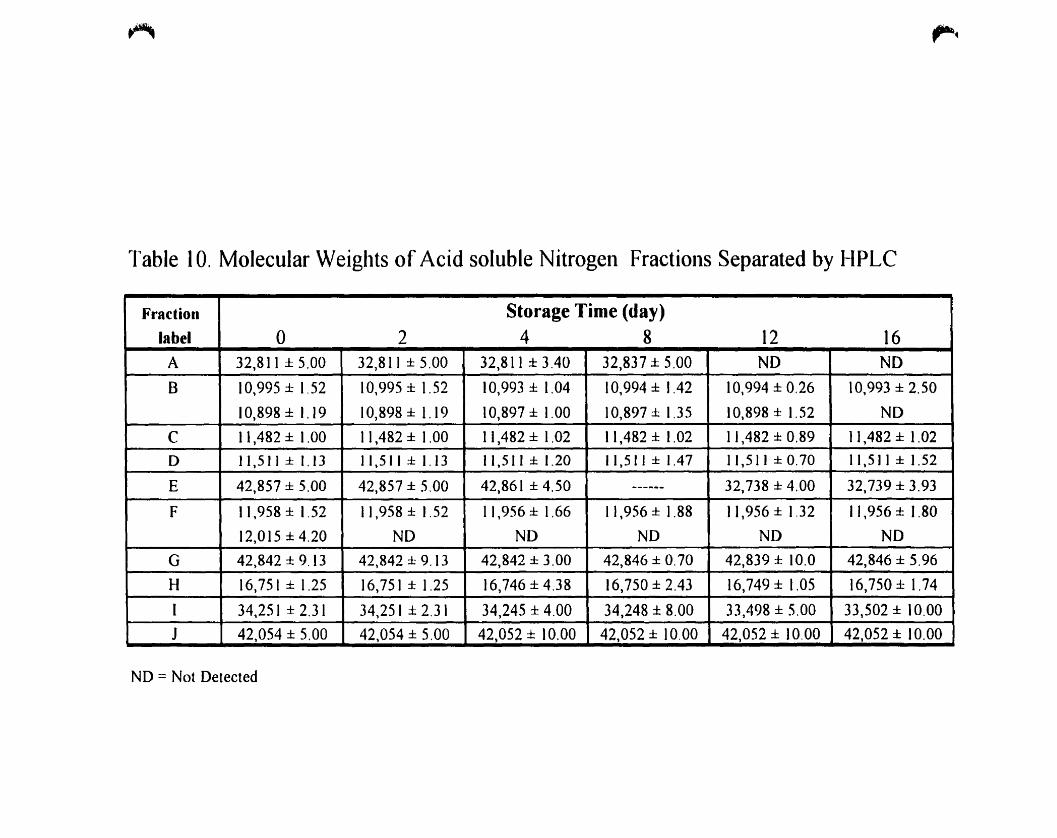
~
Table 10. Molecular Weights of Acid soluble Nitrogen Fractions Separated by HPLC
,-~
Fraction Storage Time (day)label 0 2 4 8 12 16
A 32,811 ± 5.00 32,811 ± 5.00 32,811 ± 3.40 32,837 ± 5.00 ND ND
B 10,995 ± 1.52 10,995 ± 1.52 10,993 ± 1.04 10,994 ± 1.42 10,994 ± 0.26 10,993 ± 2.50
10,898± 1.19 10,898± 1.19 10,897 ± 1.00 10,897 ± 1,35 10,898 ± 1. 52 ND
C 11,482 ± 1.00 11,482 ± 1.00 11,482 ± 1.02 11,482 ± 1.02 11,482 ± 0.89 1],482 ± 1.02
D Il,511±1.13 Il,511±1.13 Il,511 ± 1.20 Il,511 ± 1.47 Il,511 ± 0.70 11,511 ± 1.52
E 42,857 ± 5.00 42,857 ± 5.00 42,861 ± 4.50 ---.._- 32,738 ± 4.00 32,739 ± 3.93
F 11,958 ± 1.52 1],958 ± 1.52 11,956 ± 1.66 1],956 ± 1.88 ] 1,956 ± 1,32 Il,956 ± 1.80
]2,0]5 ± 4.20 ND ND ND ND ND
G 42,842 ± 9.13 42,842 ± 9.13 42,842 ± 3.00 42,846 ± 0.70 42,839 ± 10.0 42,846 ± 5.96
H 16,751 ± 1.25 ]6,75] ± 1.25 16,746 ± 4.38 16,750 ± 2.43 16,749 ± 1.05 16,750± 1.74
1 34,251 ± 2.31 34,251 ± 2.3 1 34,245 ± 4.00 34,248 ± 8.00 33,498 ± 5.00 33,502 ± 10.00
J 42,054 ± 5.00 42,054 ± 5.00 42,052 ± 10.00 42,052 ± 10.00 42,052 ± 10.00 42,052 ± 10.00
ND = Not Detected
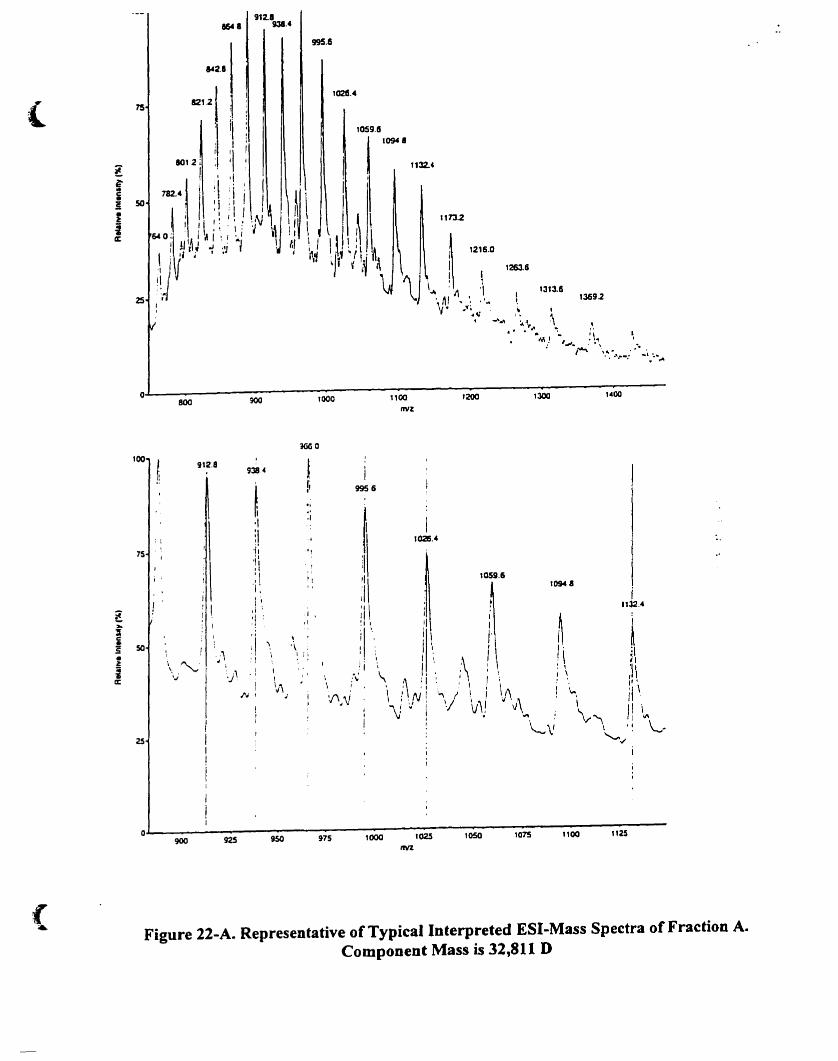
912.1~I 9311.4
995.6
( 75
~fc:• 50!~
i~
1025.4
, ..00130012001100
nvz1000800
o.L------------------------------------
i(j6 °100
912.89384
9956
1132.4
~ !/. "1. \ JI; " ;1\r • l"
1 1.., '1 \1 l '
Il \\,,'" 1 \1\
\ -1 \....•
...........;'
109411059.6
1026.•1il
!ll;1 il 1
ill .... il /.i', 1 \ l'
1 1 1 \) j \ 1.': 1
\, ;"": " ~., ' 1'\ 1,'I.N'lr . '\ \I,f\.~i '" / ' 1 !\
• '" .1 ' \. 'Vi, 'J J\""\! v \\i ~ ~
.\.....\'
"
".1
. t.,'I
:1.,1
"
1 -
11
'l\J
1
1 1! '
: 1
j'
25
75
11251100101510501000 1025lftIZ
9759509000"---------------------------------------
(Figure 22-A. Representative of Typical Interpreted E8I-Mass Spectra oC Fraction A.
Compooent Mass is 32,811 D
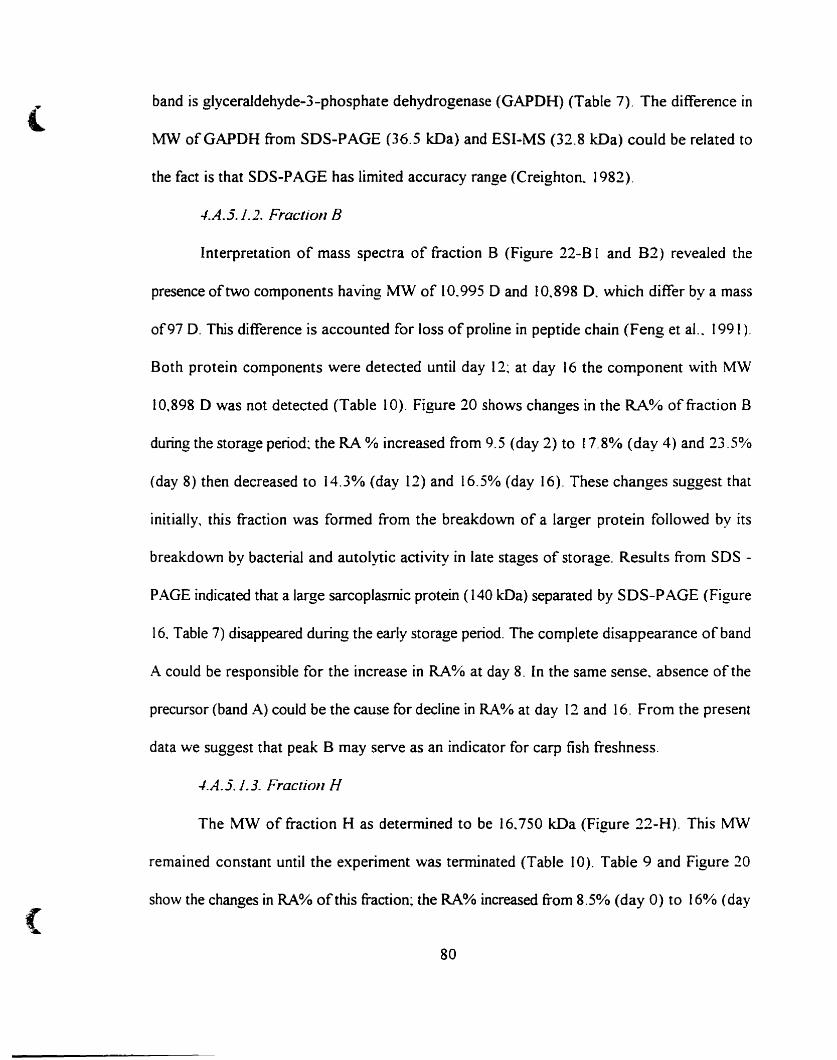
(
{.&
band is glyceraldehyde-3-phosphate dehydrogenase (GAPDH) (Table 7). The difference in
MW ofGAPDH from SOS-PAGE (36.5 kDa) and ESI-MS (32.8 kDa) could be related to
the fact is that SOS-PAGE has limited accuracy range (Creighton. 1982).
-I.A.5. 1.2. Fraction B
Interpretation of mass spectra of fraction B (Figure 22-B 1 and 82) revealed the
presence oftwo components having MW of 10.995 0 and 10.898 D. which differ by a mass
of97 D. This difference is accounted for loss of praline in peptide chain (Feng et al.. 1991).
80th protein components were cletected until clay 12: at day 16 the component with MW
10.898 0 was not detected (Table 10). Figure 20 shows changes in the RA% offraction B
during the storage period: the RA % increased from 9.5 (day 2) to 17.8% (day 4) and 23.50/0
(clay 8) then decreased to 14.30/0 (day 12) and 16.5% (day 16). These changes suggest that
initially, this fraction was formed from the breakdown of a larger protein followed by its
breakdown by bacterial and autolytic activity in late stages of storage. Results From SOS -
PAGE indicated that a large sarcoplasmic protein (140 kDa) separated by SDS-PAGE (Figure
16. Table 7) disappeared during the early storage period. The complete disappearance ofband
A could be responsible for the increase in RA% at day 8. ln the same sense. absence of the
precursor (band A) could be the cause for decline in RAO/O at day 12 and 16. From the present
data we suggest that peak B may serve as an indicator for carp fish freshness.
-I.A.5.1.3. Fraction H
The MW of fraction H as determined to be 16.750 kDa (Figure 22-H). This MW
remained constant until the experiment was terminated (Table 10). Table 9 and Figure 20
show the changes in RA% ofthis fraction: the RA% increased trom 8.5% (day O) ta 160/0 (day
80
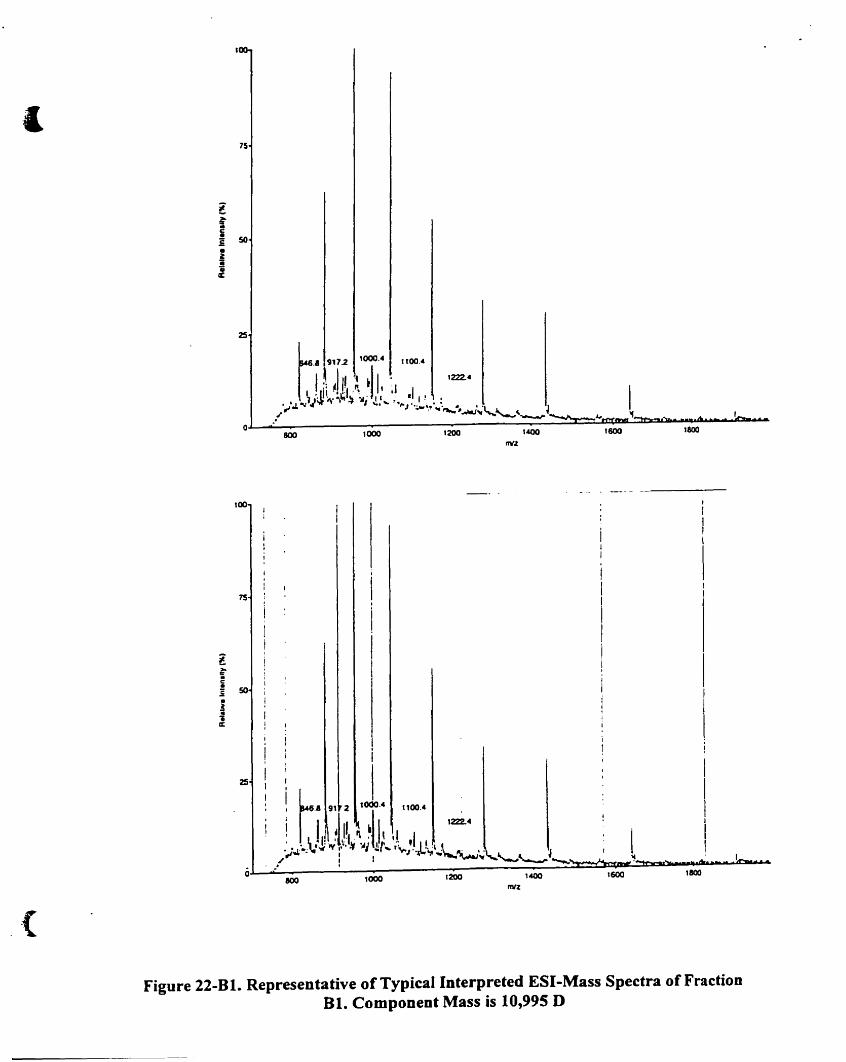
100
175
2S
1800160012001000800
t", ,;9:17.2,,:'~ll·4. 1100.4 1222.41 ; Ilj' ~. ·1 " . 1.1 1 1
•• ,.},J'-.Jf "'....~ ~ "Ai J.!---;. ., I! "~"..J. ~J •.:,..., .. " - • 'L J./ . ~-J'NJ"'4",'-..,,__ Jo,"
aL....::... ----........----------=:..=:::::...:::::~:::::::(==ma..:~~ .....~~.......~w.&o&
100
1000
{
Figure 22-Bl. Representative of Typical Interpreted ESI-Mass Spectra of FractionBI. Component Mass is 10,995 D
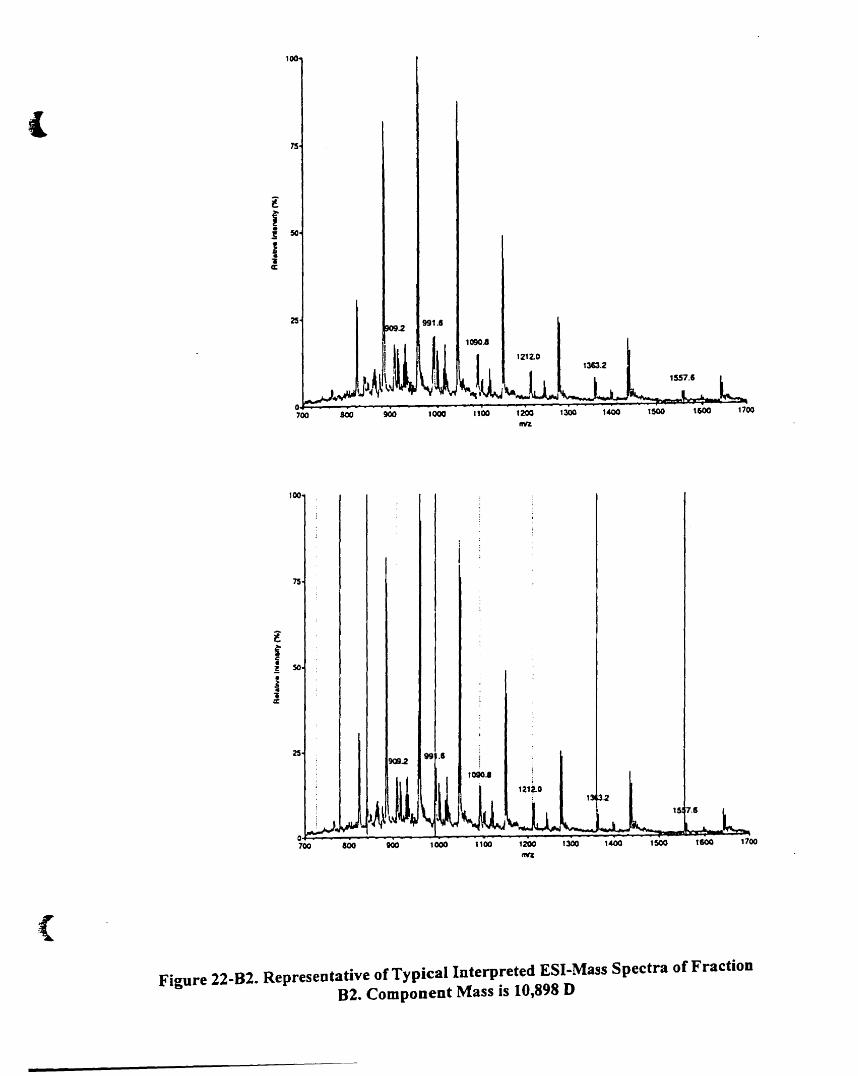
100
(
lfi 50
i~a::
.2991.11
1700
100
1 7.11
i
1212.0
1090..
99 .11909.2
~:;;OO;---=~-:=--~:::---:I:"':I00-:----I':200;:=::=:"::I300~~~1~<&OO-::::!..~::15OG~..IlC:lt~&OO:--~=-1700Rn
(
Figure 22-82. Representative of Typical Interpreted ESI-Mass Spectra of FractionB2. Component Mass is 10,898 D
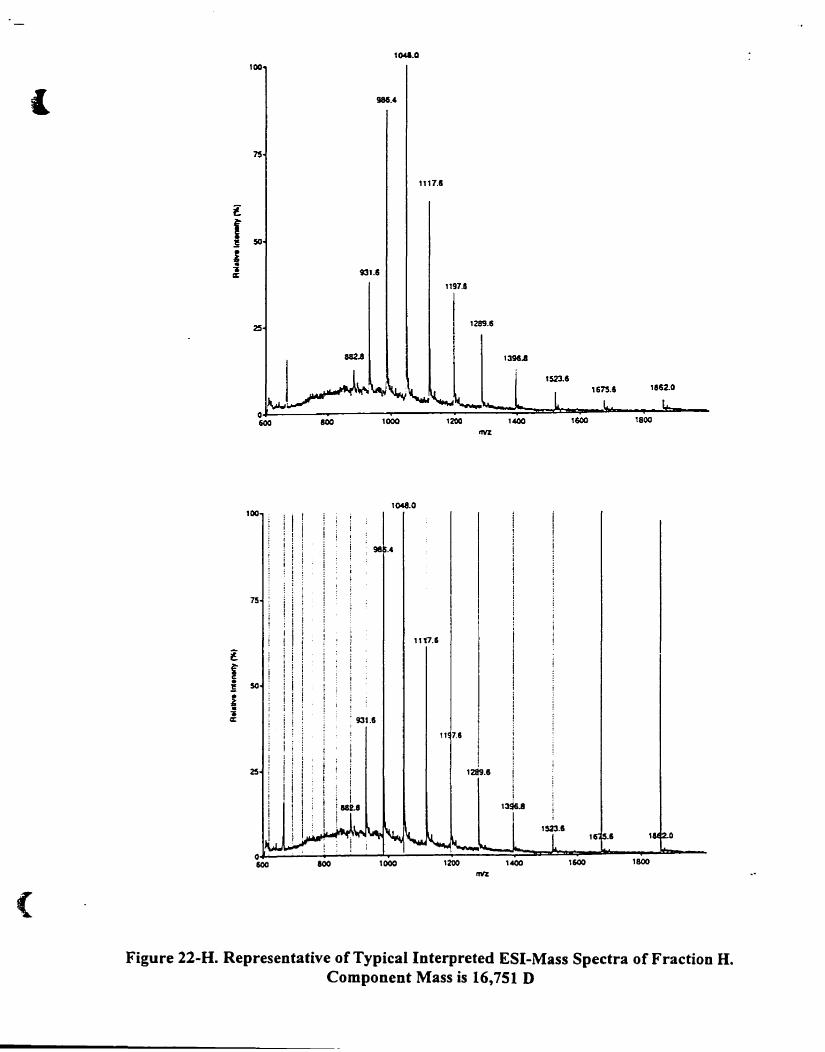
1041.0
100
1
1117.8
l
f50~
1.~ t3UlE:
1197.11
251289.8
882.8
1001048.0
j,
931.1S
n 7.1
1289.8
ii
13~.8
1
.8
800 1000 1200 1400 '600 1800
rnfZ
(
Figure 22-H. Representative of Typical Interpreted ESI-Mass Spectra of Fraction H.Component Mass is 16,751 D
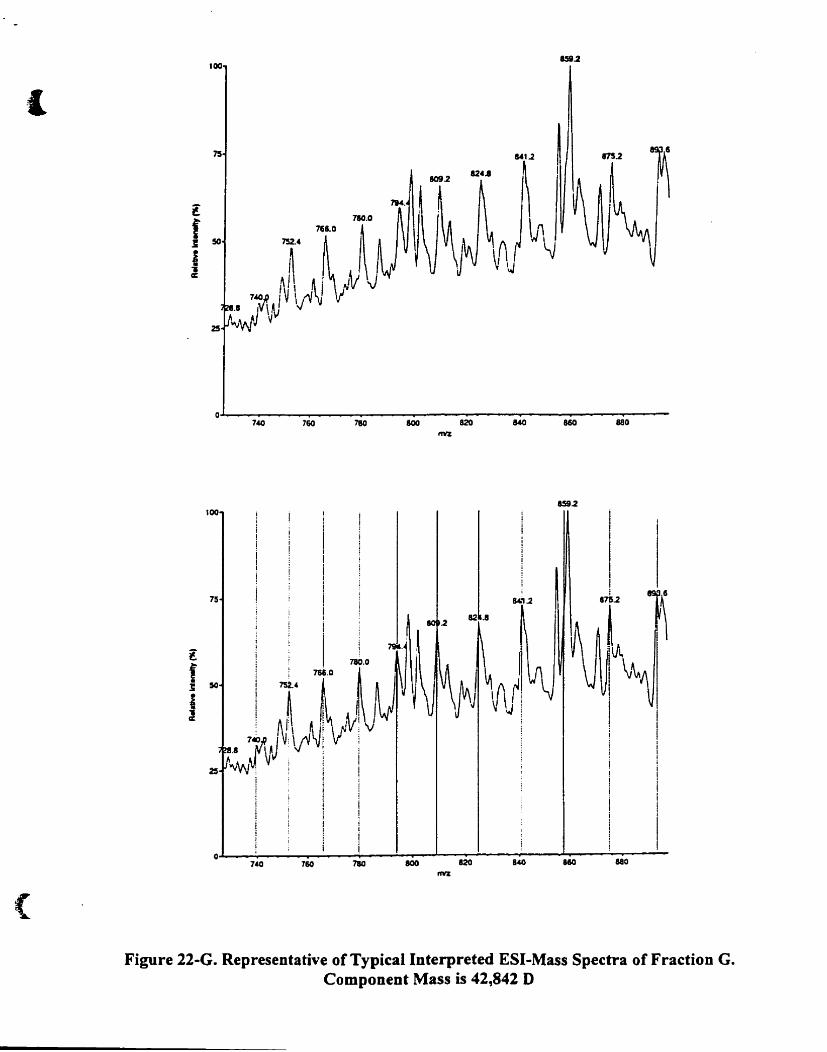
,(lOCI
o.J.-- --. -_--......-----.-----.---
(
lOCI
740 760 800 820
859.2
880
Figure 22-G. Representative of Typital Interpreted ESI-Mass Spettra of Fraction G.Component Mass is 42,842 D
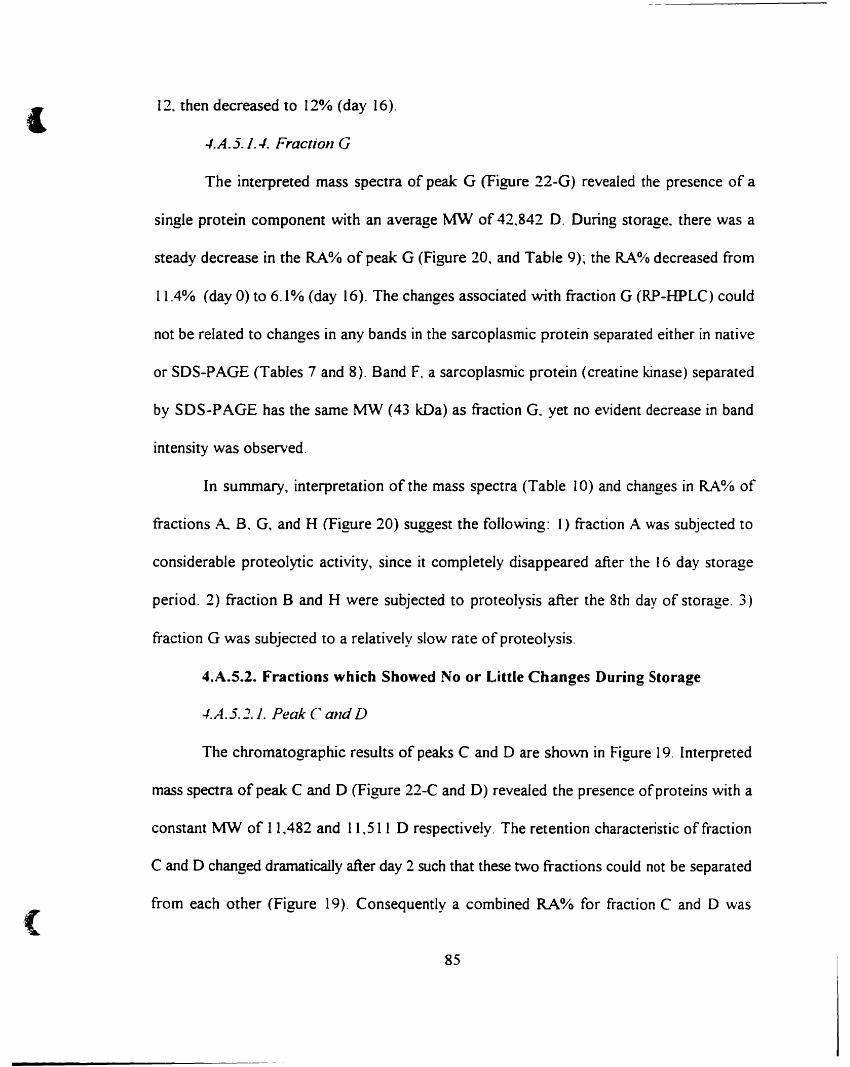
1
.(
12. then decreased ta 12% (day 16).
-I.A.5. 1../. Fraction G
The interpreted mass spectra of peak G (Figure 22-G) revealed the presence of a
single protein component with an average MW of 42.842 O. During storage. there was a
steady decrease in the RA% ofpeak G (Figure 20. and Table 9)~ the RA.% decreased from
11.4% (day 0) to 6.1% (day 16). The changes associated with fraction G (RP-HPLC) could
not be related to changes in any bands in the sarcoplasmic protein separated either in native
or SOS-PAGE (Tables 7 and 8). Band F. a sarcoplasmic protein (creatine kinase) separated
by SOS-PAGE has the same MW (43 kDa) as fraction G. yet no evident decrease in band
intensity was observed.
In surnmary. interpretation of the mass spectra (Table 10) and changes in RA% of
fractions A.. B. G. and H (Figure 20) suggest the following: 1) fraction A was subjected ta
considerable proteolytic activity, since it completely disappeared after the 16 day storage
period. 2) fraction B and H were subjected to protealysis after the 8th day of storage. 3)
fraction G was subjected to a relatively slow rate of proteolysis.
4.A.S.2. Fractions which Showed No or Little Changes During Storage
-I.A.5.2.}. Peak C and D
The chromatographie results of peaks C and 0 are shown in Figure 19. [nterpreted
mass spectra ofpeak C and 0 (Figure 22-C and 0) revealed the presence ofproteins with a
constant MW of 11.482 and 1L511 0 respectively. The retention characteristic offraction
C and 0 changed dramatically after day 2 such that these two fractions cauld not be separated
from each other (Figure 19). Consequently a combined RA.% for fraction C and D was
85
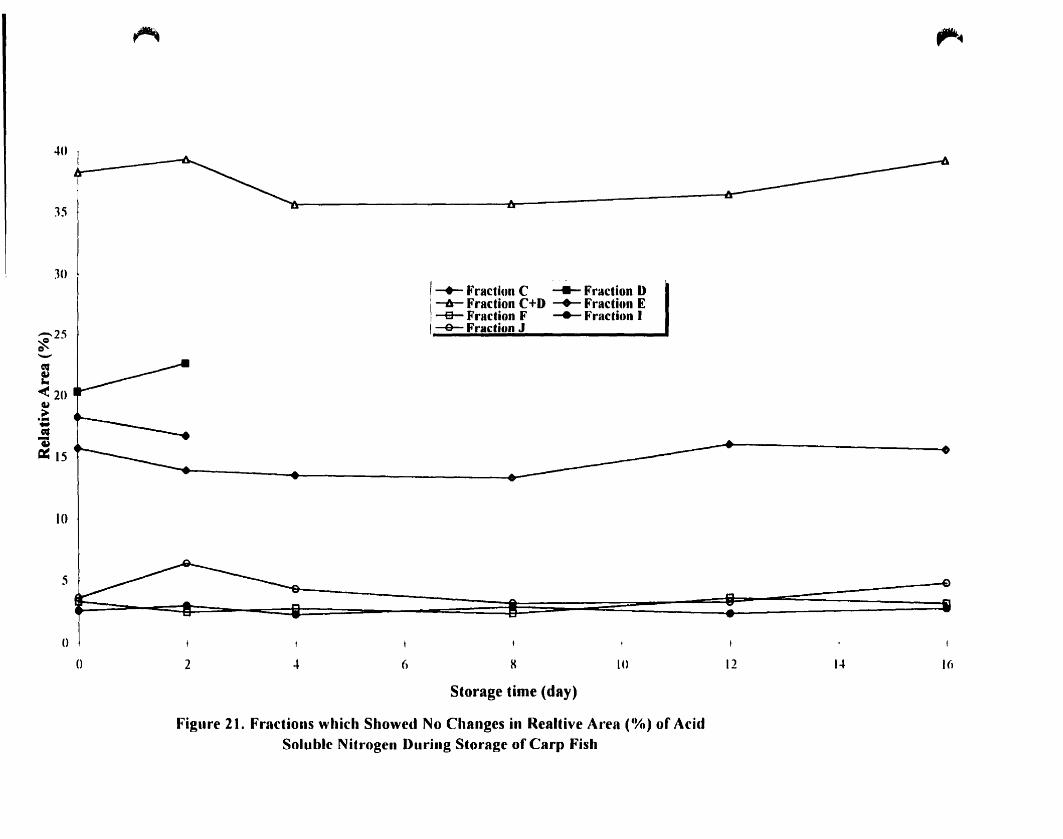
-to
J5
30
,,;,25'fi.-~-( 20~
~.-...C'#
13a= 15
10
~
-+- Fraction C --.... Fraction D--à- Fraction C+D -+- Fraction E--e- Fraction F --- Fraction 1~FractionJ
,-...
5~ ft:; 1= : ;o
() 2 .. (, H
Storage time (day)
10 12 lot ICI
Figure 21. Fractions which Showed No Changes in Realtive Area CYo) of AcidSoluble Nitrogen During Storage of Carp Fish
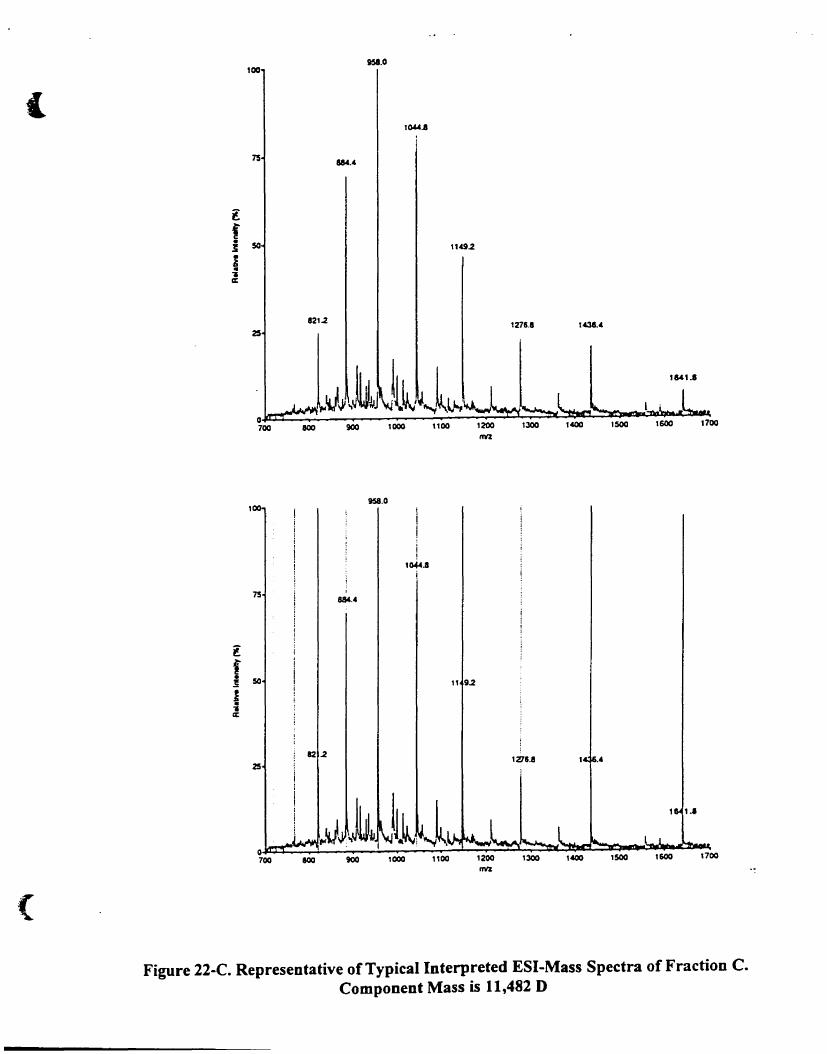
(
958.0100
lGU.I
T5
100
75
800 900
8&U
1000
958.0
1100
1149.2
1200lfVZ
1275.1
1300
143&.4
1400 1500
1641.1
1600 1700
82.2
" 9.2
t21U 1.4
1 1.'
1700
Figure 22-C. Representative of Typical Interpreted ESI-Mass Spectra of Fraction C.Component Mass is 11,482 D
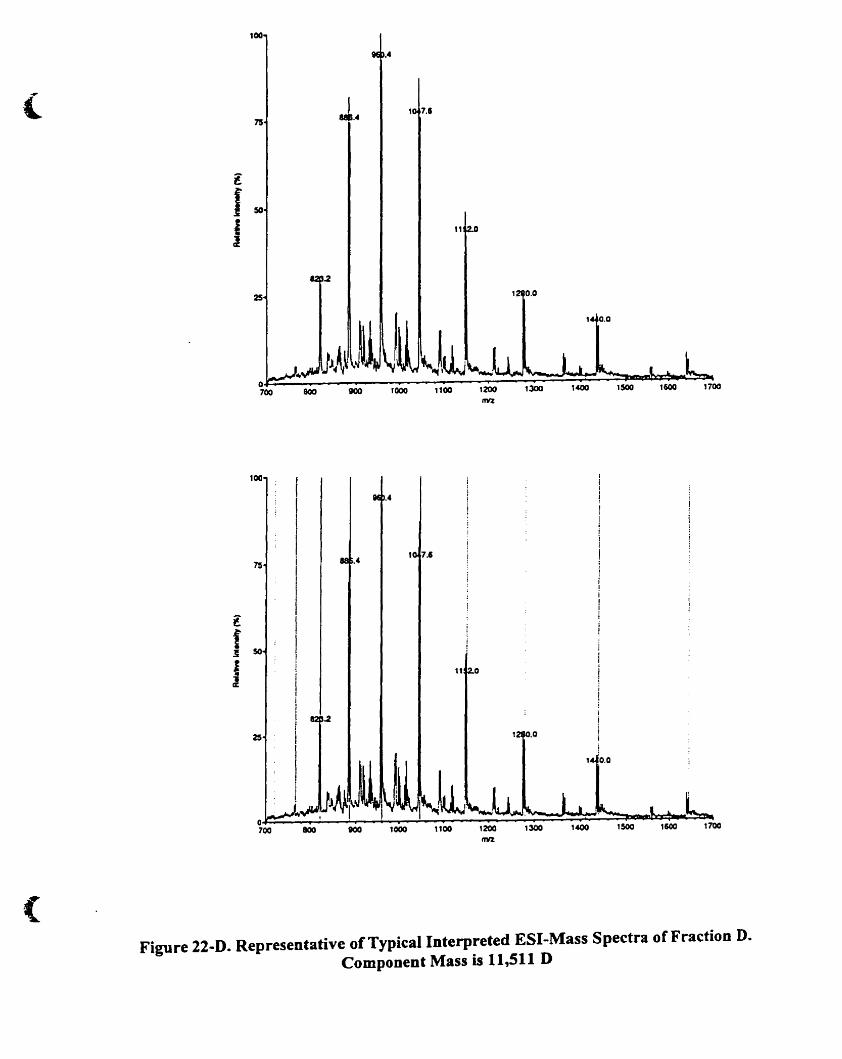
(
100
.4
1 7.1.4
11 D
.2
1700
{
100
1
11
1
.4 i!
1
!!1
1 7.11
~ i .4 1
1:
1
i!1i
l1
1
1
fi
1
1
~ 50
i..1a::1
1
.2
25
~:oo~~-~~--l:--r:--.....J--l000"""-..!--l':"'loo--::-::'200;':::::::~l::::300==~=l400~~~l~500OOII~l~&GO"~-'700/TV%
Figure 22-D. Representative of Typical Interpreted ESI-Mass Spectra of Fraction D.Component Mass is 11,511 0
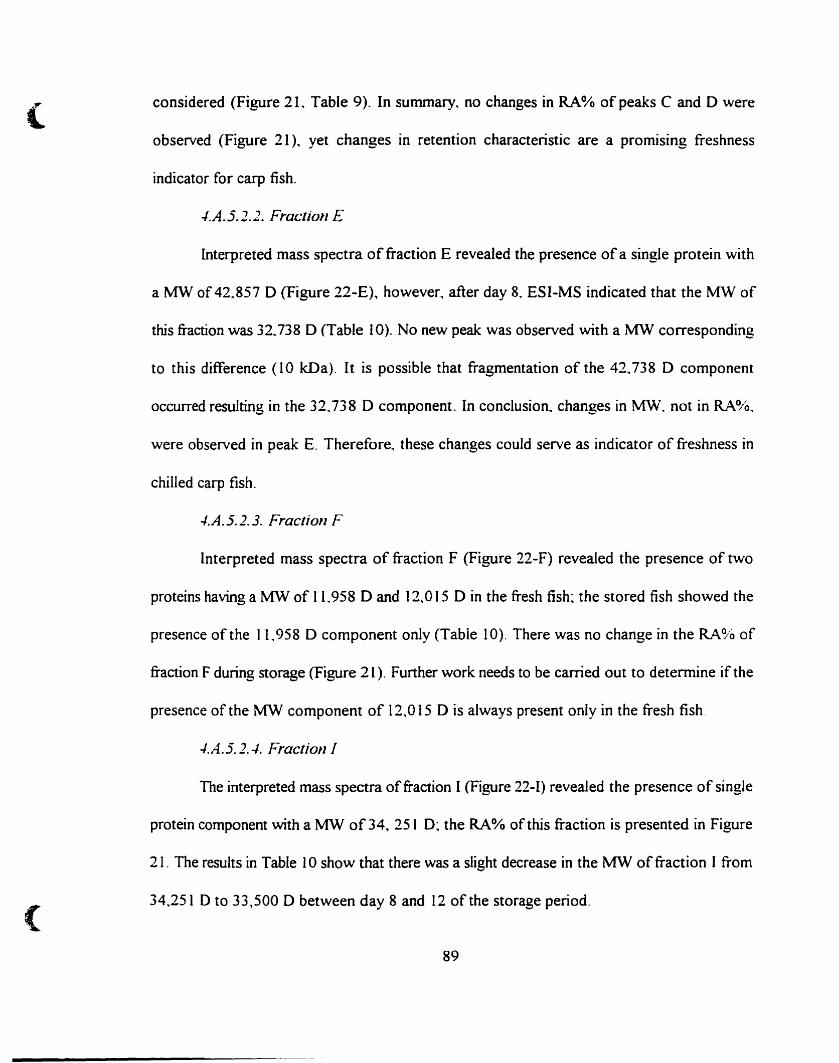
{
(
considered (Figure 21. Table 9). In summary, no changes in RA% ofpeaks C and 0 were
observed (Figure 21), yet changes in retention characteristic are a promising freshness
indicator for carp fish.
-/.A.5.2.2. Fraction E
Interpreted mass spectra of fraction E revealed the presence of a single protein with
a MW of 42.857 0 (Figure 22-E), however, after day 8, E5I-MS indicated that the MW of
this fraction was 32.738 0 (Table 10). No new peak was observed with a MW corresponding
to this difference (10 kDa). It is possible that fragmentation of the 42,738 0 component
occurred resulting in the 32.738 D component. In conclusion. changes in MW. not in RA%.
were observed in peak E. Therefore, these changes could serve as indicator of freshness in
chilled carp fish.
-I.A. 5. 2. 3. Fraction F
Interpreted mass spectra of fraction F (Figure 22-F) revealed the presence of two
proteins having a MW of 11.958 0 and 12.0 15 D in the fresh fish: the stored fish showed the
presence of the 11.958 0 component ooly (Tabie la). There was no change in the RA~ô of
fraction F during storage (Figure 21). Further work needs to be carried out to determine if the
presence of the MW component of 12,a15 D is always present only in the fresh fish.
-I.A.5.2.-I. Fraction!
The interpreted mass speetra offraction 1(Figure 22-1) revealed the presence of single
protein component with a MW of34, 251 0: the RA% ofthis fraction is presented in Figure
21. The results in Table 10 show that there was a slight decrease in the MW of fraction 1from
34,251 D to 33,5000 between day 8 and 12 of the storage period.
89
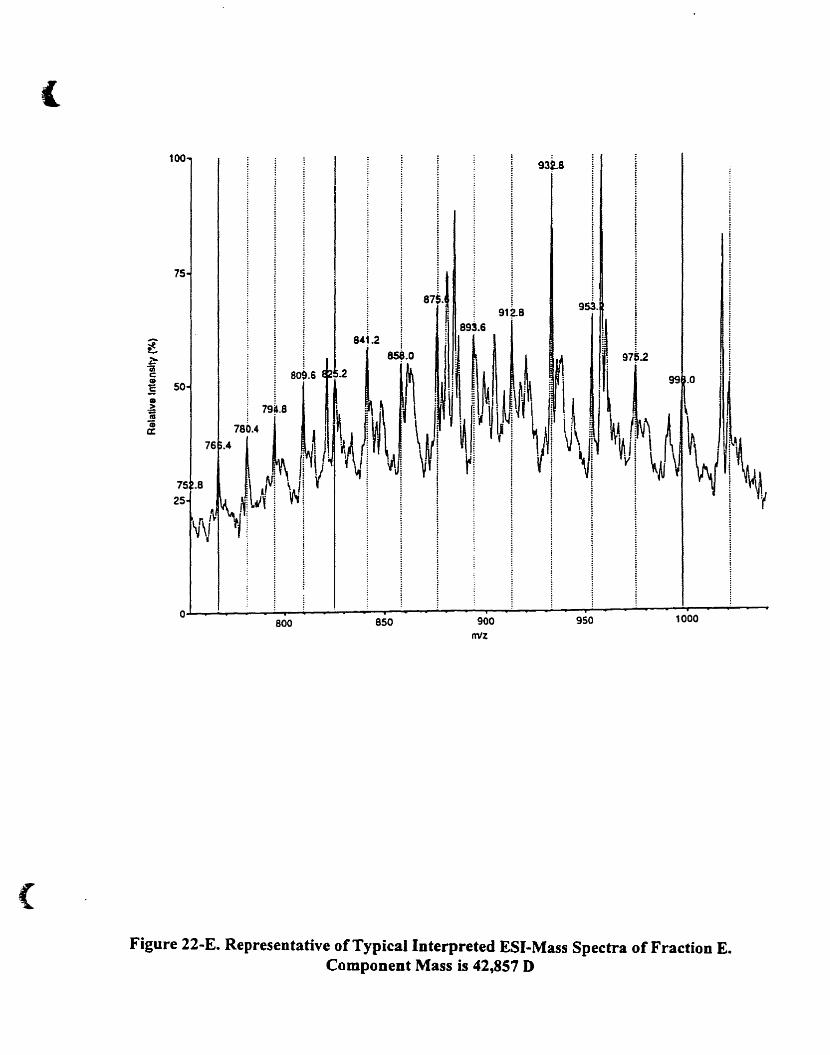
(
100932.8
!~
i1
1i:
! ~I
1
1
oLL~.J.8~OO.....L--L....-..l.-85-0.l-..,....J......----:~900:--.L-~-:9=50------~100~O---mlz
(
Figure 22-E. Representative of Typical Interpreted E8f-Mass Spectra of Fraction E.Component Mass is 42,857 D
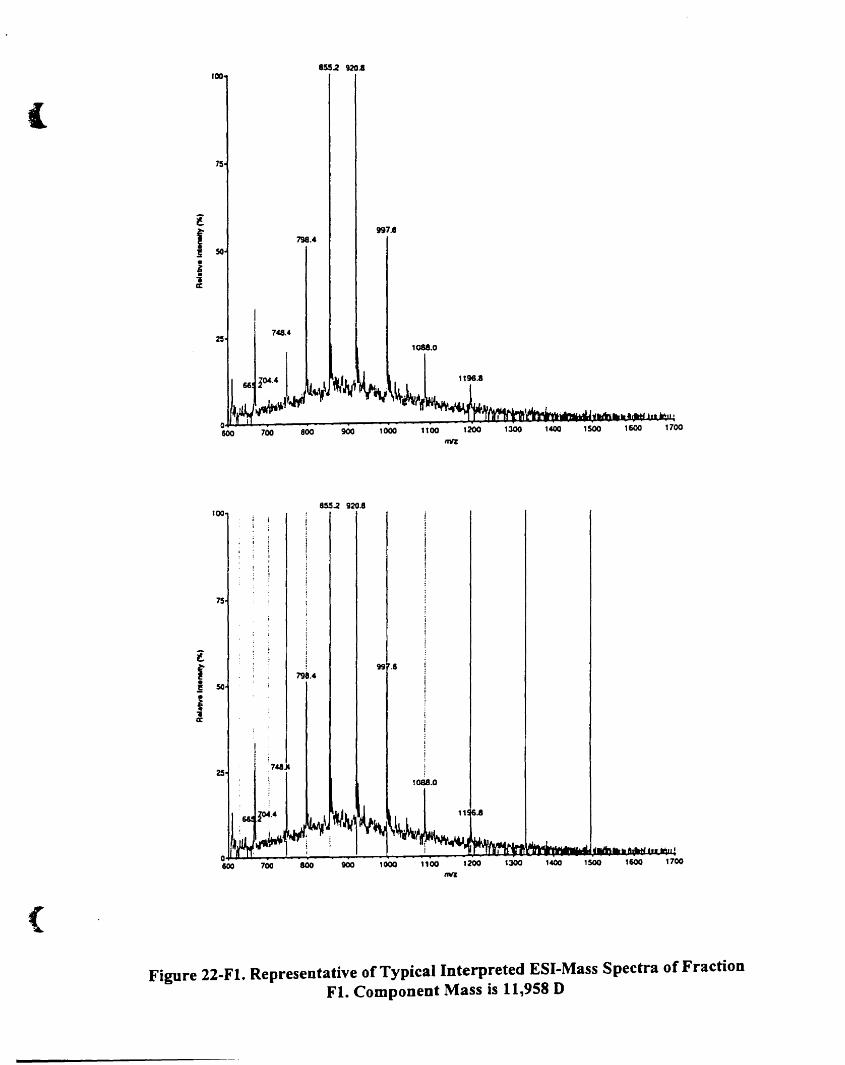
8S5.2 920.4100
(
79&••997.8
1088.0
iVr~~,l1600 17001300 1400 15001200
1196.8
11001000900800
100lI5S.2 920.8
75
99 .11
700 800 900 1000 1100 1200 1300 1400 1500 1600 1700
(
Figure 22-Ft. Representative of Typical Interpreted E8I-Mass Spectra of FractionFt. Component Mass is 11,958 D
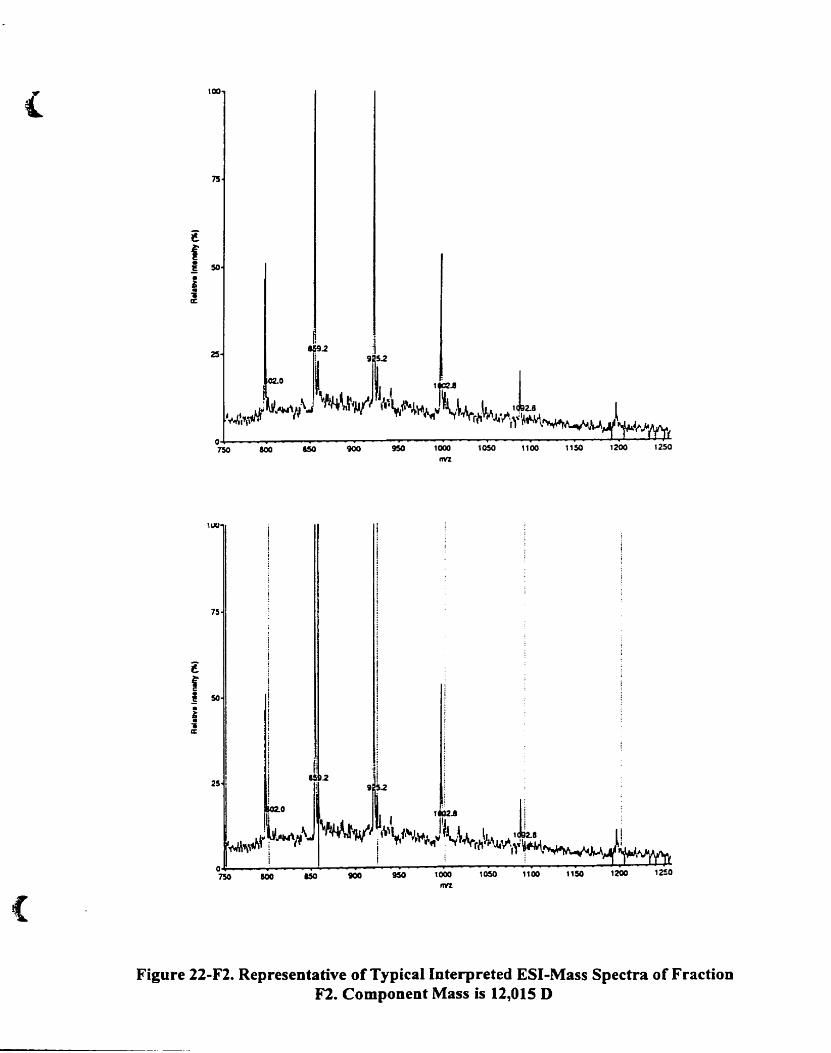
(
(
100
°750-t---IOO--....I5O...--.....900--950.........--,.....000--'05.,..O---11...-00---tt50.---.--'~200,.i-~1~2S0
nvz
\UU
Figure 22-F2. Representative of TypicaI Interpreted ESf-Mass Spectra of FractionF2. Component Mass is 12,015 D
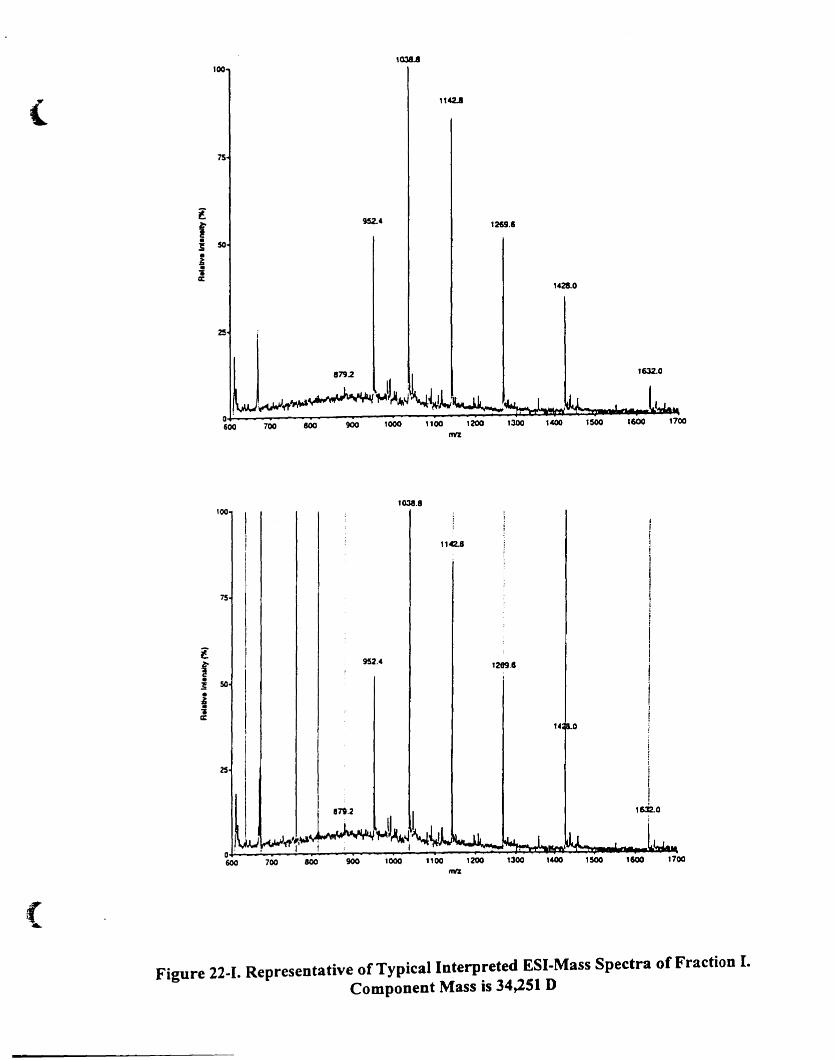
(
100
75
l!f
952.4 12ti!U
· 50~
1·•a::1428.0
2!
~ ~2 1632.0
~~Twl~""'"(1
600 700 800 900 1000 '100 1200 1300 1~ 1500 1600 1700
In'Z
1001038.8
1
1142.811
1
751i,iif
l1,
fi52.4 11289.1
· 50 1~· 1~· 1
•a::114 0 f
i2S
ii
~1
871.2
1
lmO1
(1
600 700 900 1000 1300 1400 1500 1600 1700
~
(
Figure 22.1. Representative of Typical Interpreted ESI-Mass Spectra of Fraction I.Component Mass is 34,251 D
(
(
-/.A.5.2.5. Peak J
The interpreted mass spectra of peak J revealed the presence of a single protein
component with MW of42.054 D (Figure 22-]): the RAo/a ofthis fraction is plotted in Figure
21. This fraction did not show any changes in RA% or in MW during the storage period.
94
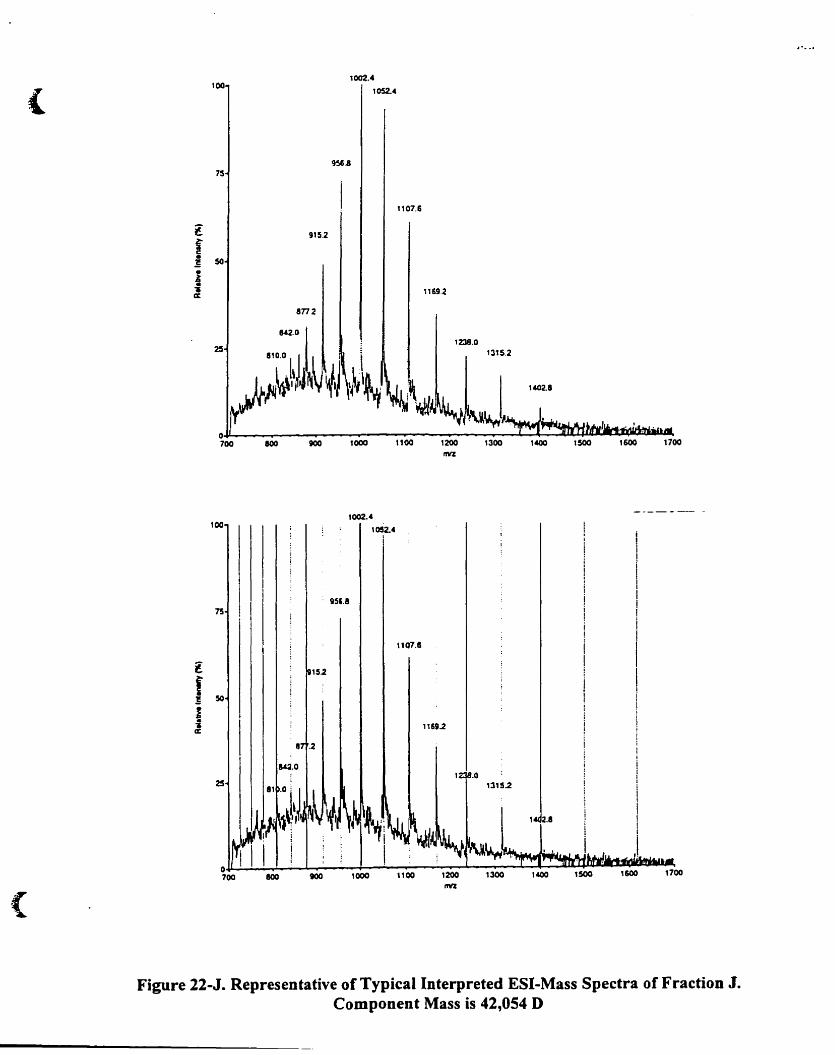
(100
1002.4
1052.4
956875
1107.&
l 9152
f· 50~·~·~ n69.2a::
8n2
842-0
251238.0
I~~II)J~ ~J I~~ 1~2.8
0700 800 iOO 1000 1100 1200 1300 1&00 1500 1600 1100
rIVZ
100lQ02..4
1052.4
(
. 9550815
11a7.11
tf
50~·!~ n1S9.2a::
~.O
25
1700
Figure 22-J. Representative of Typical Interpreted ESI-Mass Spectra of Fraction J.Component Mass is 42,054 D
(
(
B. Proteolysis of Ground and Whole Meat
4.8.1. Bacterial PlateCount
4.B.I.1. Whole Meat
Table Il shows the population ofmesophiIic~ psychrotrophic and anaerobic bacteria
ofwhole meat; the data is plotted in Figure 23. The average initial counts of mesophilic and
psychrotrophic bacteria was 3.6 x 10³; the aerobic plate counts of freshly dressed beef
carcasses ranged from 1<Y to lOs CFU/g (Grau, 1986). The mesophilic count decreased trom
log 3.71 to log 2.99 at day 0 and 2, respectively. This decrease can he attributed to the 'cold
shock' phenomena (Section 4.1). Psychrotrophic count did not change significantly during the
first 4 days ofstorage (Figure 23). Mesophilic and psychrotrophic bacteria showed identicaI
growth rates during the first 4 days of storage. The psychrotrophic count is due primally to
pseudomonas spp. which is a relatively minor component of initial mixed population (perez
de Castro et al., 1988), but eventually predominates over aerobic spoilage fiora (Seymour et
aI., 1994). Davidson et aI. (1973) demonstrated thatpseudomollas spp. accounted for 91%
of spoilage microbial population of chilled stored meat. This, along with the fact that
pseudomonas can grow in mesophilic conditions, but have optimum growth in psychrotrophic
conditions (lay, 1987), can explain the increase in psychrotrophic and mesophilic counts.
Similar observations have been reported by Prieto et al. (1991) io lamb and by Seymour et al.
e1994) in ground beef
Nortjé et al. (l990) reported that anaerobic bacteria were oot important in the shelf
life ofaerobically chilled whole meat. Table Il shows that the anaerobic couot did not exceed
log 4 throughout the storage period. Kraft (1992) demonstrated that off-odour and slime were
96
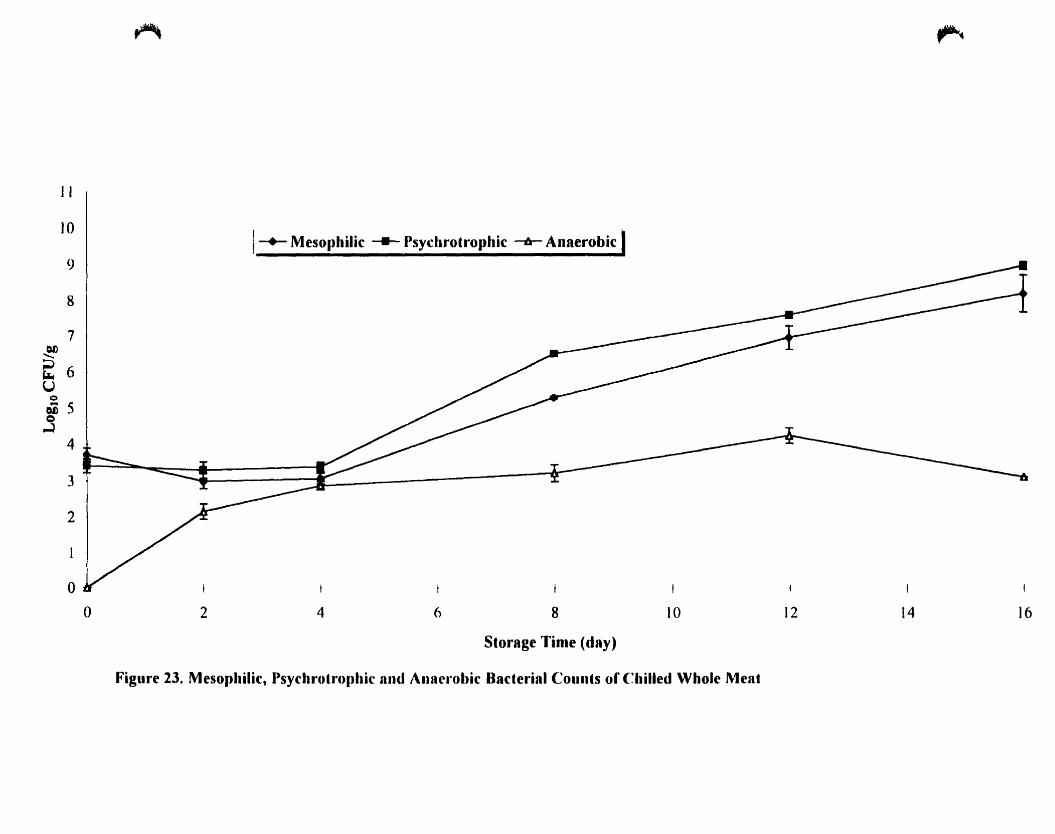
II
10
~
I-+- Mesollbilie ---- Psychrorropbie -A- Anaerobie
~
9
8
7~
~ 6U
Q
Iii 5Q
~
4
3
2
oo 2 4 6 8
Storage Tinle (day)
10 12 14 16
Figure 23. Mesophilie, Psyehrotrollhic und Alluerobie 8aclerinl Counts of Chilled Whole Meat
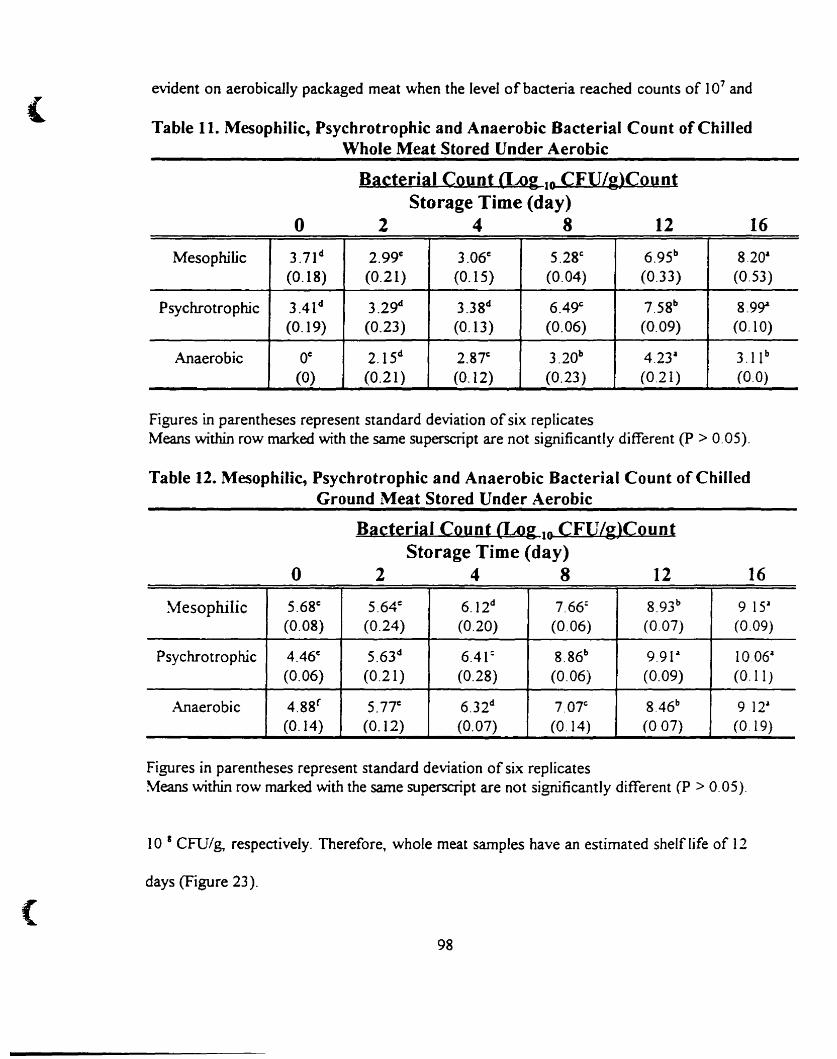
(evident on aerobieally paekaged meat when the level of baetena reaehed counts of 107 and
Table Il. Mesophilie, Psyehrotrophie and Anaerobie Hacterial Count of ChilledWhole Meat Stored Uoder Aerobic
o
Hacterial Couut (Log 10 CFUIg)CountStorage Time (day)
2 4 8 12 16
Mesophilic 3.7I d 2.99C 3.06C 5.2SI: 6.95b 8.20&(0.18) (0.21) (0.15) (0.04) (0.33) (0.53)
Psyehrotrophie 3.4Id 3.29d 3.3Sd 6.491: 7.5Sb8.9~
(0.19) (0.23) (0.13) (0.06) (0.09) (0.10)
Anaerobie OC 2.15d 2.871: 3.20b 4.23& 3.1 1b
(0) (0.21) (0.12) (0.23) (0.21 ) (0.0)
Figures in parentheses represent standard deviation ofsix replieatesMeans within row marked with the same superscript are not significantly different (P > 0.05).
Table 12. Mesophilic, Psychrotrophic and Anaerobie Hacterial Count of ChilledGround Meat Stored Under Aerobic
o
Bacterial Couut (Log 10- CFUIg)CountStorage Time (day)
2 4 8 12 16
(
Mesophilic 5.68C 5.64c 6.12d 7.66: 8.93 b 9 15"(O.OS) (0.24) (0.20) (0.06) (0.07) (0.09)
Psychrotrophic 4.46c S.63d 6.41: 8.86b 9.91" 10.06"(0.06) (0.21) (0.28) (0.06) (0.09) (0.11 )
Anaerobie 4.88 f 5.77c 6.32d 7.071: 8.46b 9 12"(0.14) (0.12) (0.07) (0.14) (007) (019)
Figures in parentheses represent standard deviation of six replicatesMeans Vlithin row marked with the same superscript are not signifieantly different (P > 0.05).
10 1 CFU/g, respeetively. Therefore, whole meat samples have an estimated shelf life of 12
days (Figure 23).
98
(
(
4.8.1.2. Ground Meat
Aerobic and anaerobic baeteria counts ofground meat are shown in Table 12: the data
is plotted in Figure 24. The initial averaged count of mesophilic and psychrotrophic was log
5. This count is within the acceptable levels of American (1- 10 x 106) (Westhotf and Felstein.
1976) and Canadian guidelines (l07) (pivnik et al.. 1976). Significant increase in mesophilic
and psychrotrophic count was observed. The 'cold shock' phenomena were not observed.
Mates ( 1983) indicated that the grinding process of meat distribute baeteria normally present
on the surface of meat throughout the product and create ideal conditions for their
multiplication. This explains the higher initial count in ground meat. Psychrotrophic and
mesophilic count in ground meat were identical during the tirst 4 days of storage. After day
4 the changes in psychrotrophic and mesophilic count was similar to that of whole meat.
The initial count ofanaerobic baeteria in ground meat samples was log 4.88 (Figure
24). This count increased significantly during the storage period (Figure 24). Mackeyand
Kerridge (1988) indica~ed that the count ofanaerobic baeteria is useful to evaluate the hygiene
and public hea1th concem ofground meat. Gill and Newton (1978) indicated that aerobically.
there is no inhibitory interaction between different bacteriaJ species until the maximum cell
density (109-1 Ol~ is reached, tbis was true in our experiment in which aerobic (mesophilic and
psychrotrophic) and anaerobic counts increased linearly throughout the storage period.
4.8.2. pH
The changes in pH of whole and ground meat are shown in Figure 25. Both meat
99
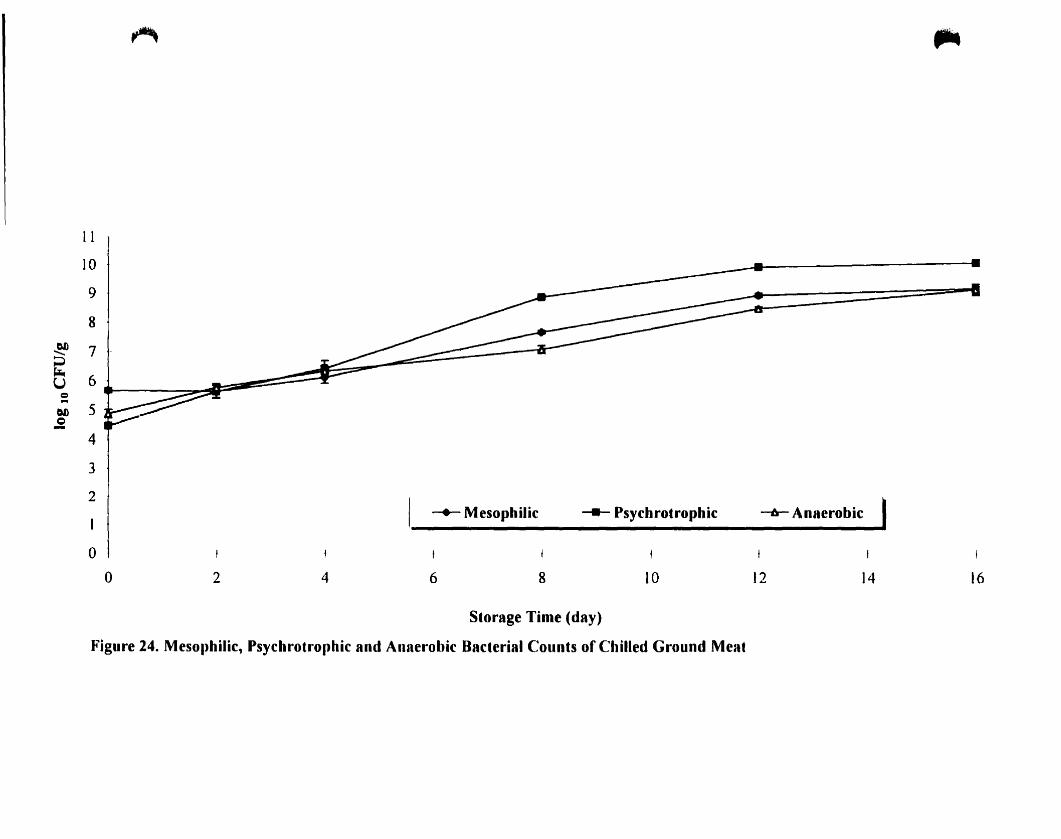
11
10
9
8
~ 7;;:>~
U 6Q-01) 5
Q- 4
3
2
~
-+- Mesophilic ......- Psychrotrophie -6- Anaerobie
,..
oo 2 4 6 8 10 12 14 16
Storage Time (day)
Figure 24. Mesophilic, Psychrotrophic and Anaerobie Bacterial Counts of Chilled Ground Meat
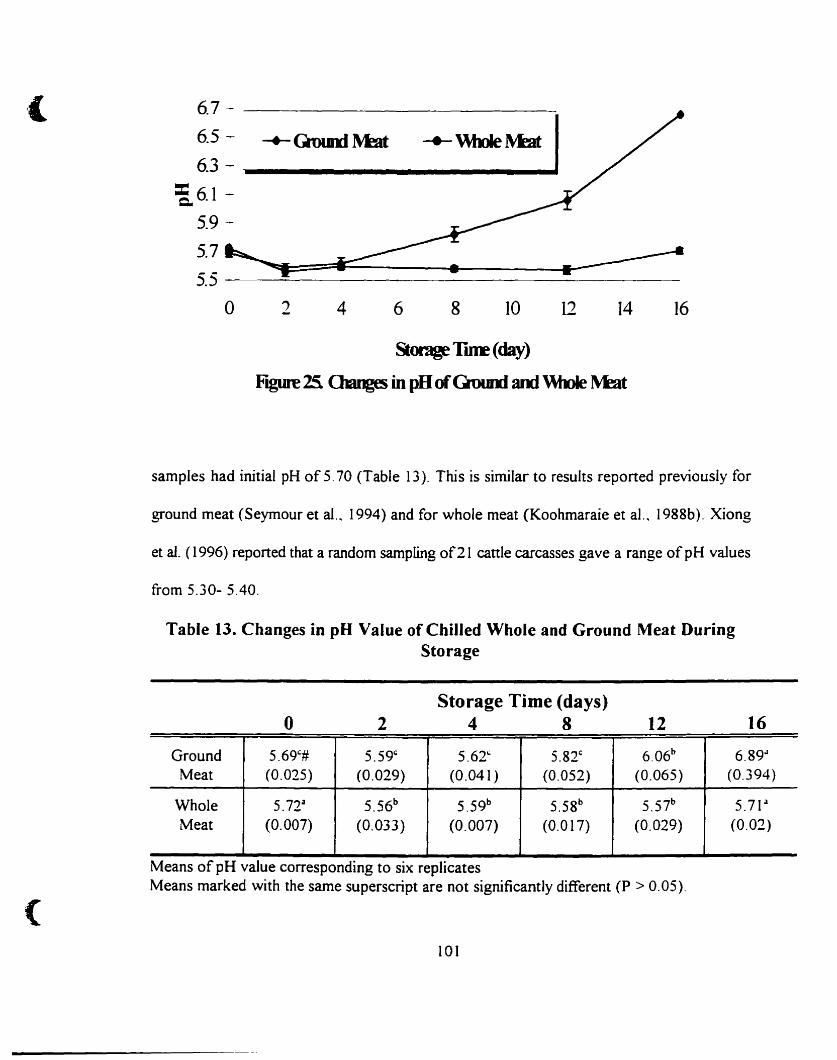
( 6.7 - -------------~
6.5 - -+-QuInt Mm -.- \\hoIe M:'3t 16.3 - ,
:a. 6.1
5.9 -
5.7
5.5 ~----==--------------------
o 2 4 6 8 10 12 ]4 16
St~Tuœ(day)
Ftgure 15. (hmgt5 in pHofGmurD and \\mie~t
samples had initial pH of 5.70 (Table 13). This is similar ta results reported previously for
ground meat (Seymour et al .. 1994) and for whole meat (Koohmaraie et aI.. 1988b). Xiong
et al. (1996) reported that a random sampling of21 cattle carcasses gave a range of pH values
from 5.30- 5.40.
Table 13. Changes in pH Value of Chilled Whole and Ground Meat DuringStorage
o 2Storage Time (days)
4 8 12 16
(
Ground 5.691:# 5.59c 5.621: 5.82' 6.06b 6.89.1Meat (0.025) (0.029) (0.041 ) (0.052) (0.065) (0.394)
Whole 5.72 iJ 5.56b 5.59b 5.58b 5.57b 5.71 iJ
Meat (0.007) (0.033) (0.007) (0.017) (0.029) (0.02)
Means ofpH value corresponding to six replicatesMeans marked with the same superscript are not significantly different (P > 0.05).
101
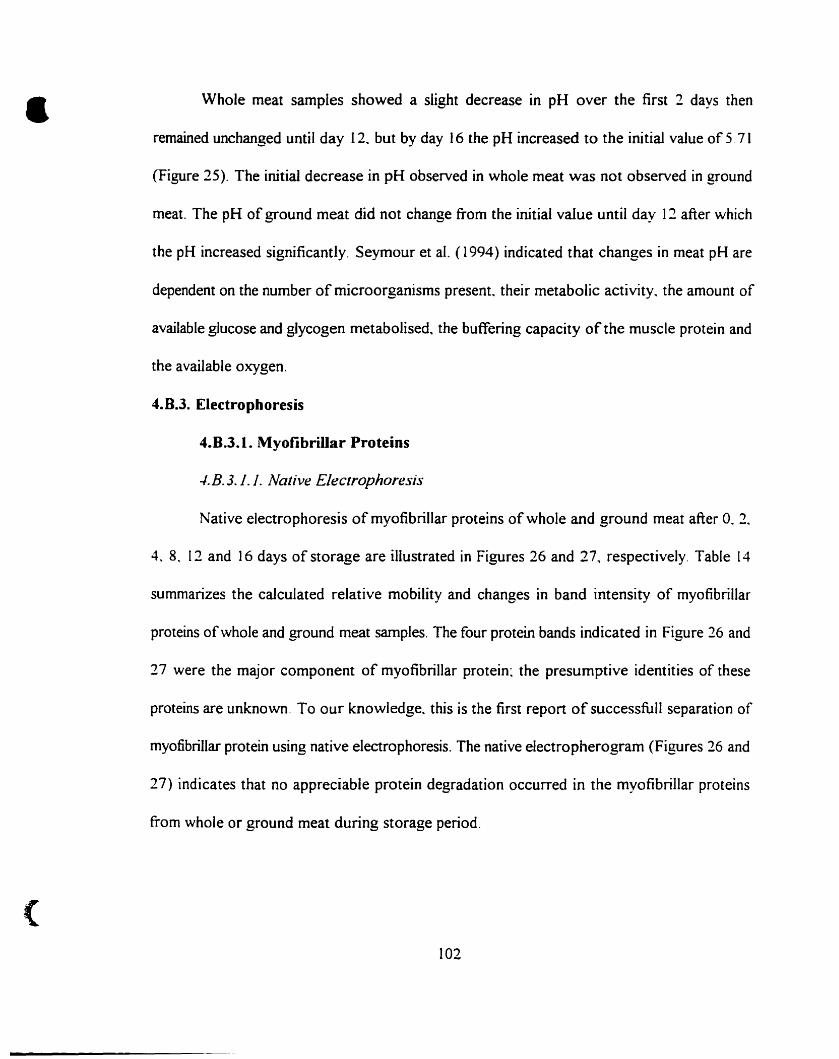
•
(
Whole meat samples showed a slight decrease in pH over the first 2 days then
remained unchanged until day 12. but by day 16 the pH increased to the initial value of 5.71
(Figure 25). The initial decrease in pH observed in whole meat was not observed in ground
meal. The pH of ground meat did not change from the initial vaIue until day 12 after which
the pH increased significantly. Seymour et al. (1994) indicated that changes in meal pH are
dependent on the number of microorganisms present. their metabolic activity. the amount of
available glucose and glycogen metabolised. the buffering capacity of the muscle protein and
the available oxygen.
4.8.3. Electrophoresis
4.8.3.1. Myofibrillar Proteins
-I.B.3.J. J. Native Eleclrophoresis
Native electrophoresis of myofibrillar proteins of whole and ground meat after O. 2.
4.8, [2 and 16 days ofstorage are illustrated in Figures 26 and 27. respectively. Table [4
summarizes the calculated relative mobility and changes in band intensity of myofibrillar
proteins ofwhole and ground meat samples. The four protein bands indicated in Figure 26 and
27 were the major component of myofibrillar protein: the presumptive identities of these
proteins are unknown. To our knowledge. this is the tirst report of successfull separation of
myofibrillar protein using native eleetrophoresis. The native electropherogram (Figures 26 and
27) indicates that no appreciable protein degradation occurred in the myofibrillar proteins
from whole or ground meat during storage period.
102
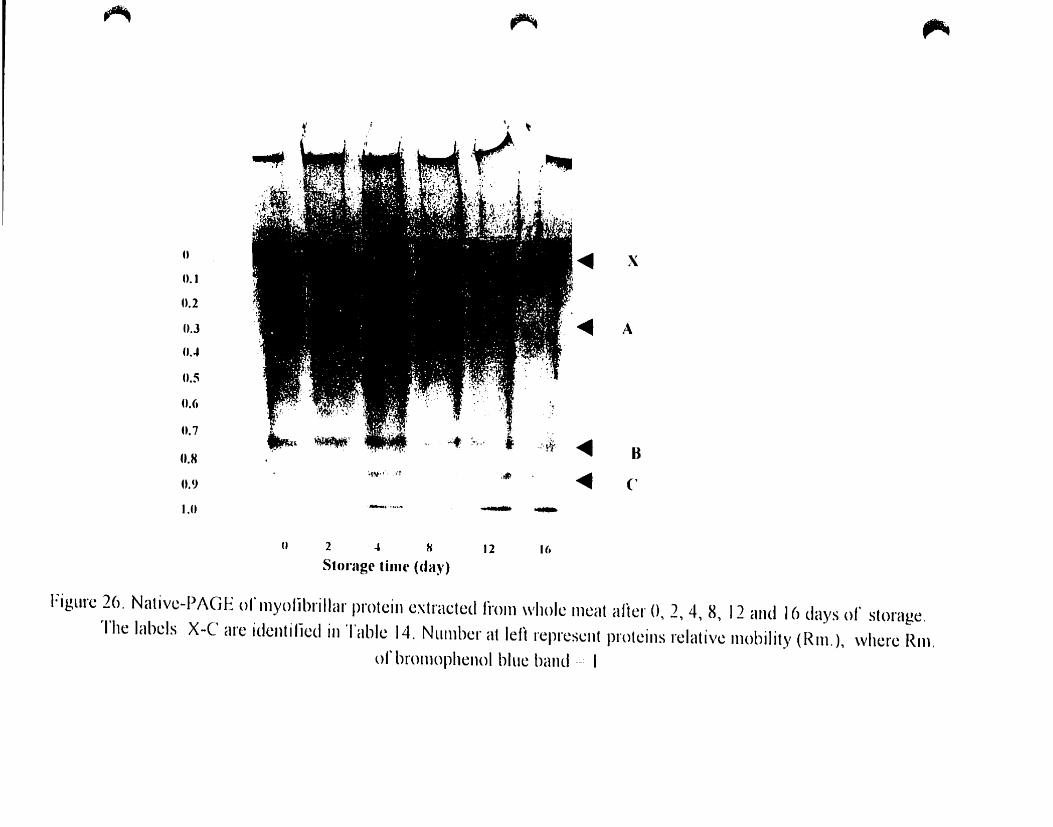
~ ~ ,..
......... ..-.
.~~,T' .. ,..~
u
lU
U.2
0.3
n...
n.su.(.
n.7
n.H
H.'"I,u
~'
.'."
~'
~t~,,'· ~'r
, ..;t :-", '.
;JÀ)
~
i; ~
", ~.:.~tr ""lIIIIIIIII
~
x
A
8
('
(12 "' HSlornge lime (da)')
12 1(.
Figure 26. Native-PAGE of Inyofibrillar protein extracted f1"<)ln \\'hole Ineat after 0, 2, 4, 8, 12 and 16 days of storage.The labels X-C are idcntified in Table 14. NllIllber al len reprcsent proleins relative 1l1obility (Rln.), \vherc Rnl.
of brolllophcnoi bille band .- 1
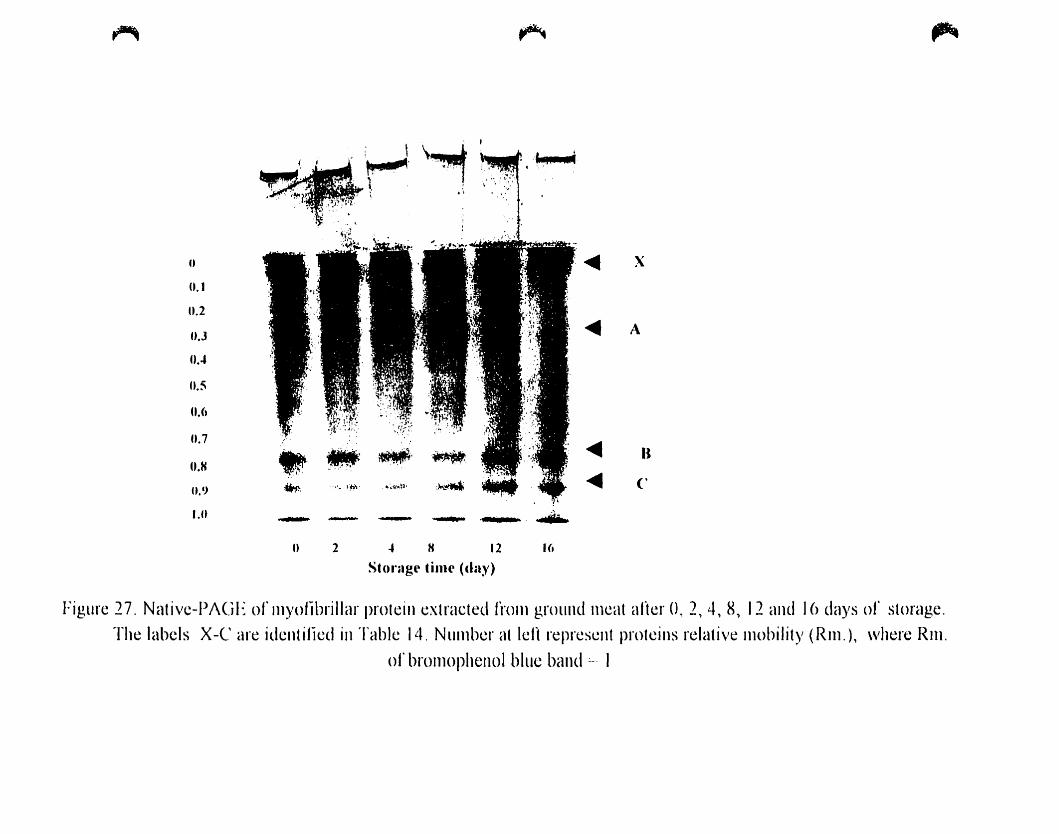
~ ~,..
x
~ A
.......................-
.~
,\\~~' .. ,., .;~~ , .. :,.;".'!) •....l',.' '''. '~ , .\" " ,.y t .
. . ., .
...... ~.•;~: ~ B. ," ...;;' .•,,";O'f'. ' . , .' • ':, III ' 1". ~
..,'.'" ''''l_. "'. 'P' .••lI1'~,:.I,.;.~ ,'.' .' ' ~ C
...--....
U.7
l.et
U,I)
U.Ct
U.H
U,I
U.2
U.J
UA
U5
U
u 2 4 H 12
Sto ..age time (da)')
1(,
Figure 27. Nativc-Pi\(JE of Illyofibrillar protein extracted fhllll grollnd Incat alter O~ 2,4,8, 12 and 16 days of storage.
The labels X-C are idcntified in Table 14. NlIInbcr at leH represent proteins relative Illobility (Rlll.)~ \vhere Rnl.
of broillophcnoi bille band :_. 1
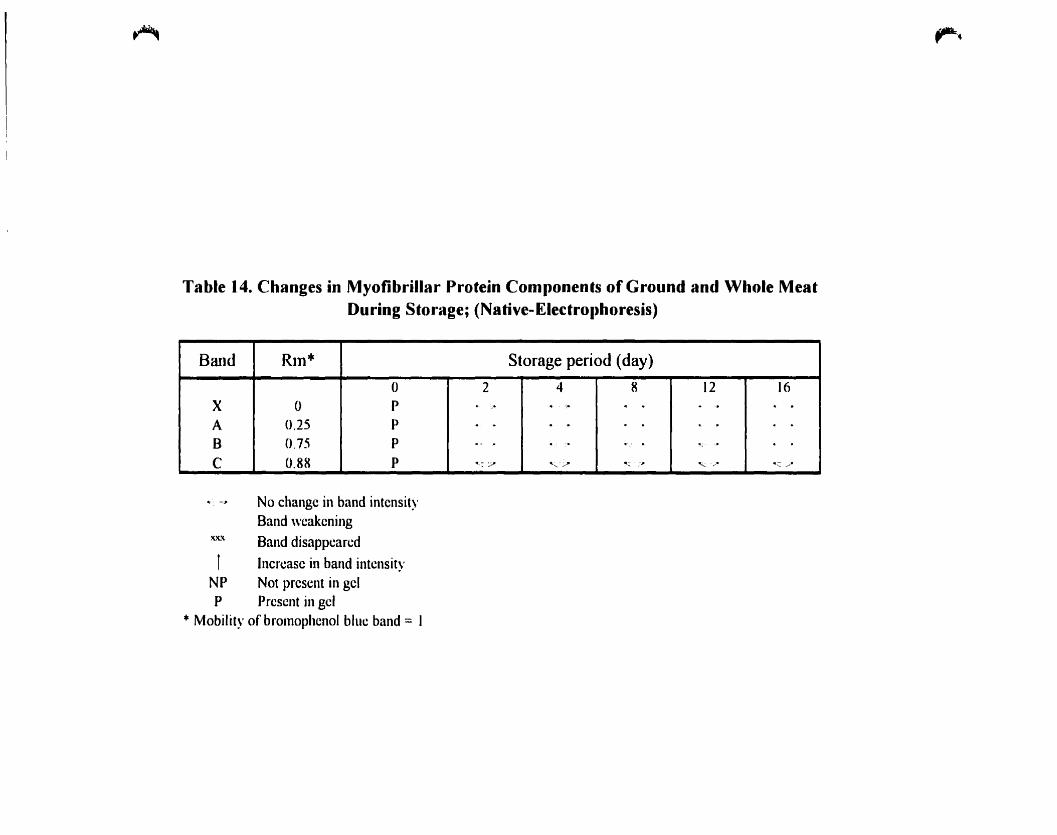
~
Table 14. Changes in Myofibrillar Protein Components of Ground and Whole MeatDuring Storage; (Native-Electrol)horesis)
Band Rln* Storage period (day)
0 2 4 8 12 16X 0 P ..- -:,. ... -:- . .A 0.25 P . - '. . ~ - . . . .B 0.75 P .. . .- -. . . .. ~ - -.C 0.88 P -.: :;? "-;...-? Olt::: ~~.- '" ./- .., .......
- -, No change in band intensityBand weakening
~~'\ Band disappcared
1 Incrcase in band intensityNP Not present in gelP Present in gel
* Mobility of bromophenol blue band:= 1
~4
(
(
-I.B. 3.f. 2. SDS-Electrophoresis
-I.B.3.f.2.f. Whole meal
SDS-electrophoresis of myofibrillar protein extracted trom whole meat stored after
0,2.4, 8. 12 and 16 days ofstorage are shown in Figure 28~ table 15 summarizes the changes
in band intensity and estimated molecular weight (MW) of myofibrillar proteins from whole
meat. SDS-electrophoresis reveaied differences in myofibrillar protein fraction at certain
storage periods. The following postmortem changes were observed: (a) The presence oftwo
bands (X and Y) migrating slower than myosin at day 16: band X and Y gave MWs of285
and 277 kDa. respeetively. (h) At day 12. band A (MW 20 1 kDa. identified as myosin heavy
chain) started to degrade with complete disappearance at day 16. (c) The formation ofbands
8 and C at day 12. (d) Band L (MW 48.6 k.Da. identified as actin) started to degrade at day
12 and disappeared at day 16. (e) The graduai appearance of bands M and N. (f) The
intensities ofhand 0 (MW 158.7 kDa. identified as M-protein) and band E increased at days
12 and 16. (g) Band G ~fW 103 k.Da. identified as (X- actinin) did not show any detectihle
changes except for a slight decrease in intensity at day 16. (h) Band K (MW 59 kDa.
presumed identity desmin) (Goll. 1983 a and Koohmaraie et aL. 1984 a) disappeared
completely at day 8. (i) Bands P and Q (MW 37.8, MW 35.8. identified as Ct and p
tropomyosin. respectively) disappeared completely at day 12. (j) Band F (MW 108.9 kDa.
identified as C-protein) did not show any detectable change throughout the storage period.
(k) At day 16, the intensities ofhands H, 1 and S (MW 89.7, MW78 and MW 31 kDa) and
trop0 nin-T increased, while the intensities ofhand J (MW 66 kOa. identified as BSA). bands
U. T. and V (MW 24.9, MW 28.2, MW 21.7 kDa. identified as troponin-I. myosin light chain
106
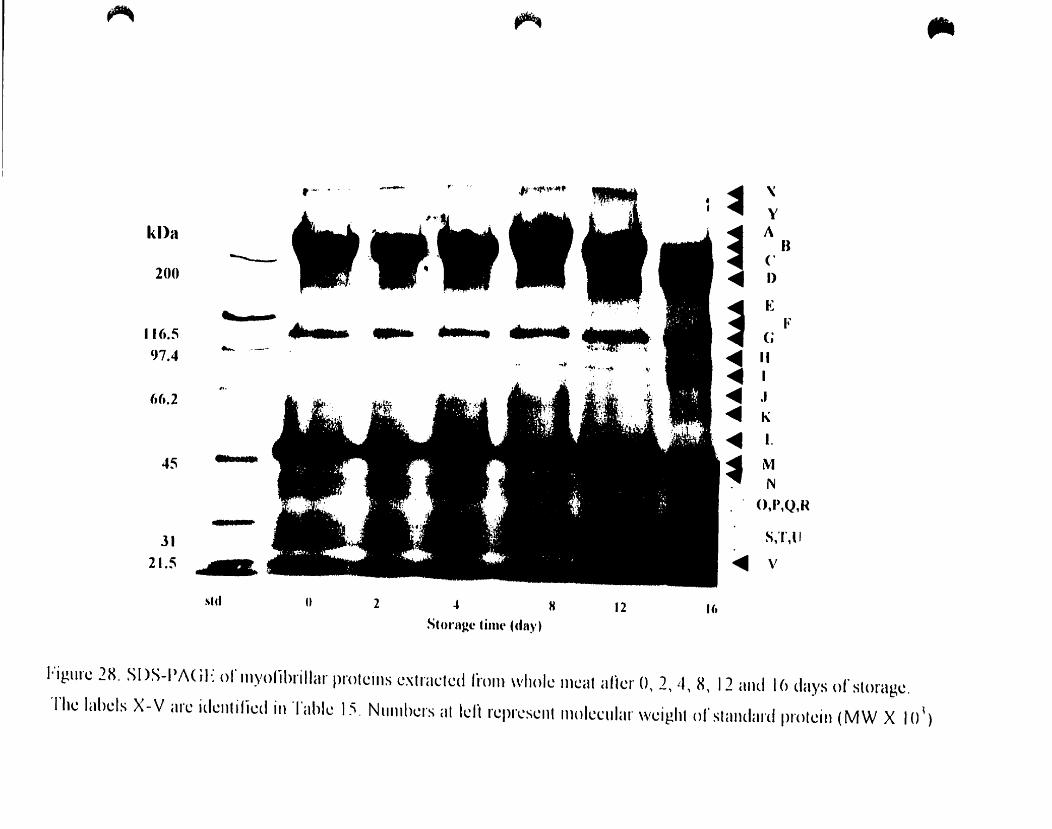
~ ~ Ile
std
---
31
21.5 ~
~~
y
~A
Il('
~ 1)
l Eli'
G
~ Il
~ 1
~ .1~ K
~ 1.
~ MN
O,I),Q,R
s;r,lI
....- V•Ilt12
~...., '~ ........
11·"'1"'··... ,
* ",.•..
~ HStorngc tim(' (day)
2
--
H
t- .
".Rf.W'wW
.......
..200
4S
(,(,.Z
klla
Il (•. S
97.4
I·'jgllr~ lX. SDS-PI\(il': orlllyofihrillar protcins cxtractcd Ji'olU \vhole nlCal aHcr 0,2,4, X, 12 alld 16 days ofslorage.
Th~ lah~ls X-V are idelliified in Table 1:'. NlIIllhers at leH n:presellt l1lolel:ular \veight ofstandard proteill (MW X I()~)
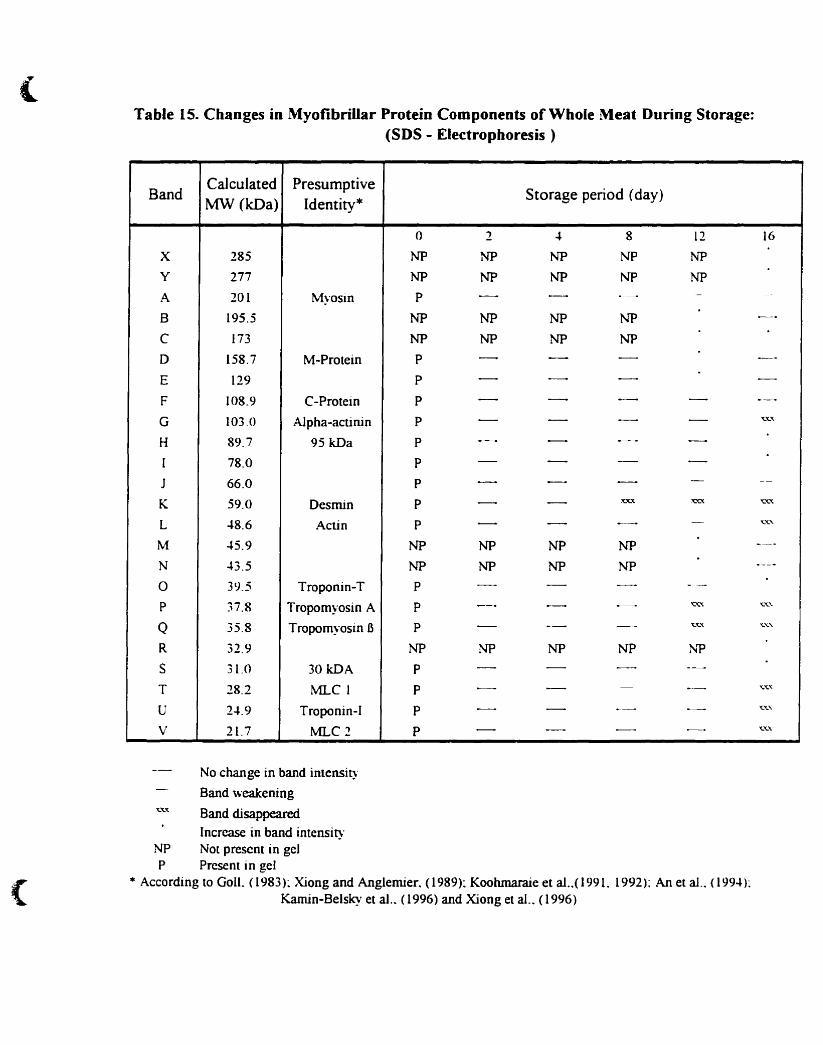
(
(
Table 15. Changes in Myofibrillar Protein Components of Whole Meat During Storage:(SOS - Electrophoresis )
BandCaIculated Presumptive
Storage period (day)MW (kDa) Identity*
0 2 ~ 8 12 16
X 285 NP NP NP NP NP
Y 277 NP NP NP NP NP
A 201 Myosin P - - -- - -
8 195.5 NP NP NP NP ~
C 173 NP NP NP NP
D 158.7 M-Protein P - - - --E 129 P - - - ~
F 108.9 C-Protein P - - - - -~
G 103.0 Alpha-actinin P - - - - ~~'(,
H 89.7 95 kDa P - - ~- -1 78.0 P - - - -J 66.0 P - - - - --
K 59.0 Desmin P - - :ccx 'C'<X 'C'<X
L ~8.6 Actin P - - - - '(.'C."
M ~5.9 NP NP NP NP ----N ~3.5 NP NP NP NP ----0 39.5 Troponin-T P - - ~
_..--..
P 37.8 Tropomyosin A P - - - 'C'<X '(.'C."
Q 35.8 Tropomyosin B P - -- -- ~'CX '1.'-"
R 32.9 NP NP NP NP NP
S 3LO 30kDA P - - - --T 28.2 tvfi..C 1 P - - -
~'(,,'C.'(
U 2~.9 Troponin-I P - - -- -- ~'C.x
V 2L7 rvtLC 2 P - - - - '(,,'C.'1.
No change in band intensit)"
Band weakening
Band disappeared
Increase in band intensityNP Not present in gelP Present in gel
* According to GolL (1983)~ Xiong and Anglemier. (1989)~ Koohmaraie et al..( 1991. 1992): An et al .. (199~):Kamin-Belsky et al.. (1996) and Xiong et aI.. (1996)
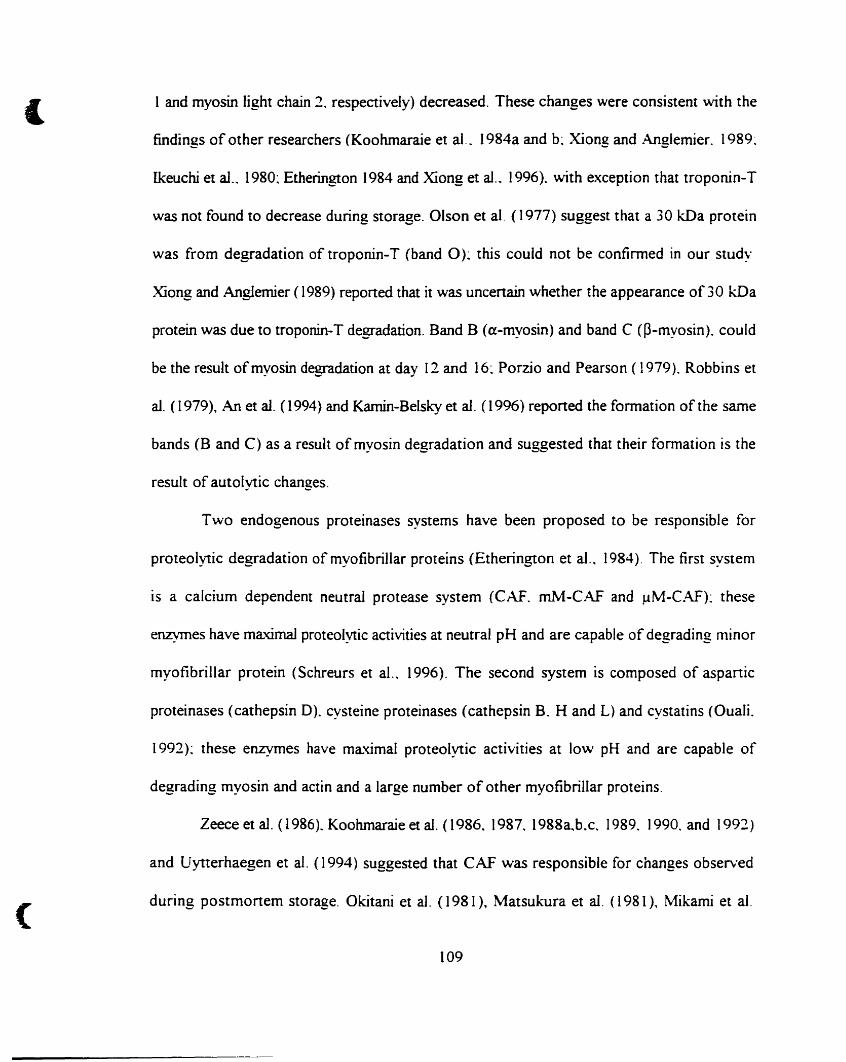
1
(
1 and myosin light chain 2. respeetively) decreased. These changes were consistent with the
findings of other researchers (Koohmaraie et aL 1984a and b: Xiong and Anglemier. 1989~
lkeuchi et al.. 1980: Etherington 1984 and Xiong et al.. 1996). with exception that troponin-T
was not found to decrease during storage. Oison et al. (1977) suggest that a 30 kDa protein
was from degradation of troponin-T (band 0): this could not be confirmed in our study
Xiong and Anglenùer (1989) reported that it was uncenain whether the appearance of 30 kDa
protein was due to troponin-T degradation. Band B (a-myosin) and band C (p-myosin). could
be the result ofmyosin degradation at day 12 and 16: Porzio and Pearson ( 1979). Robbins et
al. (1979), An et al. (1994) and Kamin-Belsky et al. (1996) reported the formation of the same
bands (B and C) as a result of myosin degradation and suggested that their formation is the
result of autolytic changes.
Two endogenous proteinases systems have been proposed to be responsible for
proteolytic degradation of myofibrillar proteins (Etherington et al.. 1984). The first system
is a calcium dependent neutral protease system (CAf. mM-CAF and J-lM-CAF): these
el1Zj1Tles have maximal proteolytic aetivities at neutral pH and are capable of degrading minor
myofibrillar protein (Schreurs et al.. 1996). The second system is composed of aspartic
proteinases (cathepsin D). cysteine proteinases (cathepsin B. H and L) and cystatins (Ouali.
1992): these enzymes have maximal proteolytic activities at low pH and are capable of
degrading myosin and actin and a large number of other myofibrillar proteins.
Zeece et al. (1986). Koohmaraie et al. (1986. 1987. 1988a.b.c. 1989. 1990. and 1992)
and Uytterhaegen et al. (1994) suggested that CAF was responsible for changes observed
during postmortem storage. Okitani et al. (1981), Matsukura et al. (1981), Mikami et aI.
109
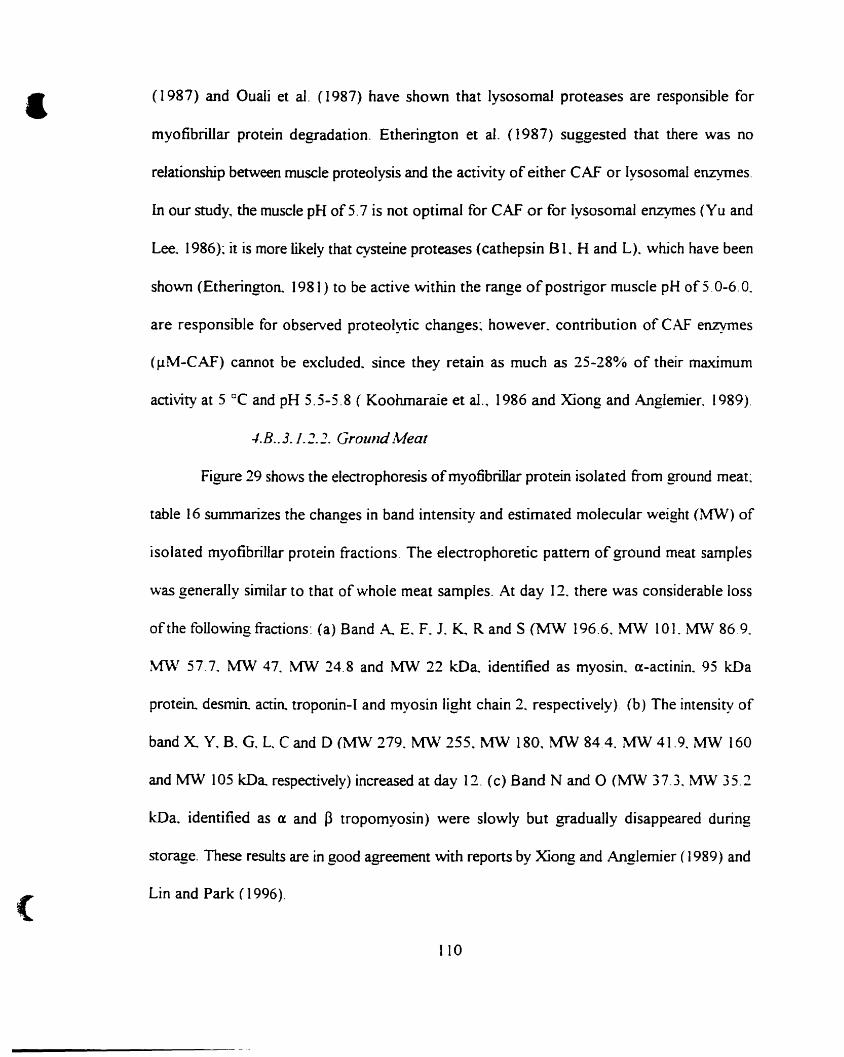
•
(
(1987) and Ouali et aL (1987) have shown that lysosomal proteases are responsible for
myofibrillar protein degradation. Etherington et al. (1987) suggested that there was no
relationship between muscle proteolysis and the activity of either CAf or lysosomal enzymes.
In our study, the muscle pH of5.7 is not optimal for CAf or for lysosomal enzymes (Vu and
Lee. 1986): it is more likely that cysteine proteases (cathepsin BI, H and L). which have been
shown (Etherington~ 1981) to be active within the range of postrigor muscle pH of 5.0-6. O.
are responsible for observed proteolytic changes~ however. contribution of CAF enzymes
(JlM-CAf) cannat be excluded. since they retain as much as 25-28% of their maximum
aetivity at 5 oC and pH 5.5-5.8 ( Koohmaraie et al., 1986 and Xiong and .Au1glemier. [989).
-I.B..3./.2.2. Ground A1eat
Figure 29 shows the electrophoresis ofmyofibrillar protein isolated from ground meat:
table 16 summarizes the changes in band intensity and estimated mo[ecular weight (MW) of
isolated myofibrillar protein fractions. The electrophoretic pattern of ground meat samples
was generally similar to that of whole meat samples. At day 12. there was considerable IOS5
ofthe foUowing fractions: (a) Band .-\. E. F. 1. K, Rand S (MW 196.6. MW 101. MW 86 9.
MW 57.7. MW 47. MW 24.8 and MW 22 kDa identified as myosin. a-actinin. 95 kDa
protein. desmin. aetiTl troponin-I and myosin light chain 2. respectively) (b) The intensity of
band X. Y. B. G. L. C and D (MW 279. M\V 255. rvtW 180, MW 844. MW 41.9. MW 160
and MW IDS kDa respectively) increased at day 12. (c) Band N and 0 (MW 37.3. MW 35.2
kDa. identified as a and P tropomyosin) were slowly but gradually disappeared during
storage. These results are in good agreement with reports by Xiong and Anglemier (1989) and
Lin and Park (1996).
1[0
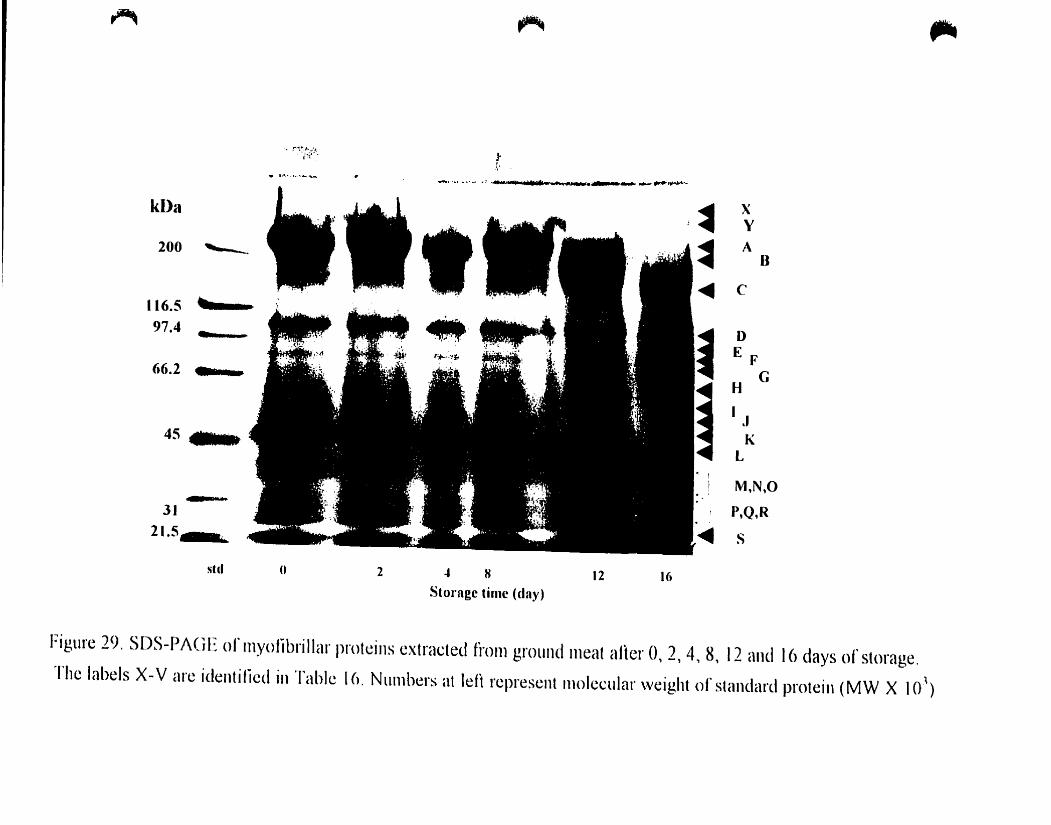
~ ~ "..
Figure 29. SDS-PAGE of myolibril1ar prolcins extracted thm1 groulld meal allcr 0, 2, 4, 8, 12 and 16 days of slorage.
Thc labels X- V are identilied in Table 16. Numbers al leH represent 1l10lecular ,wight of standard protein (MW X 10')
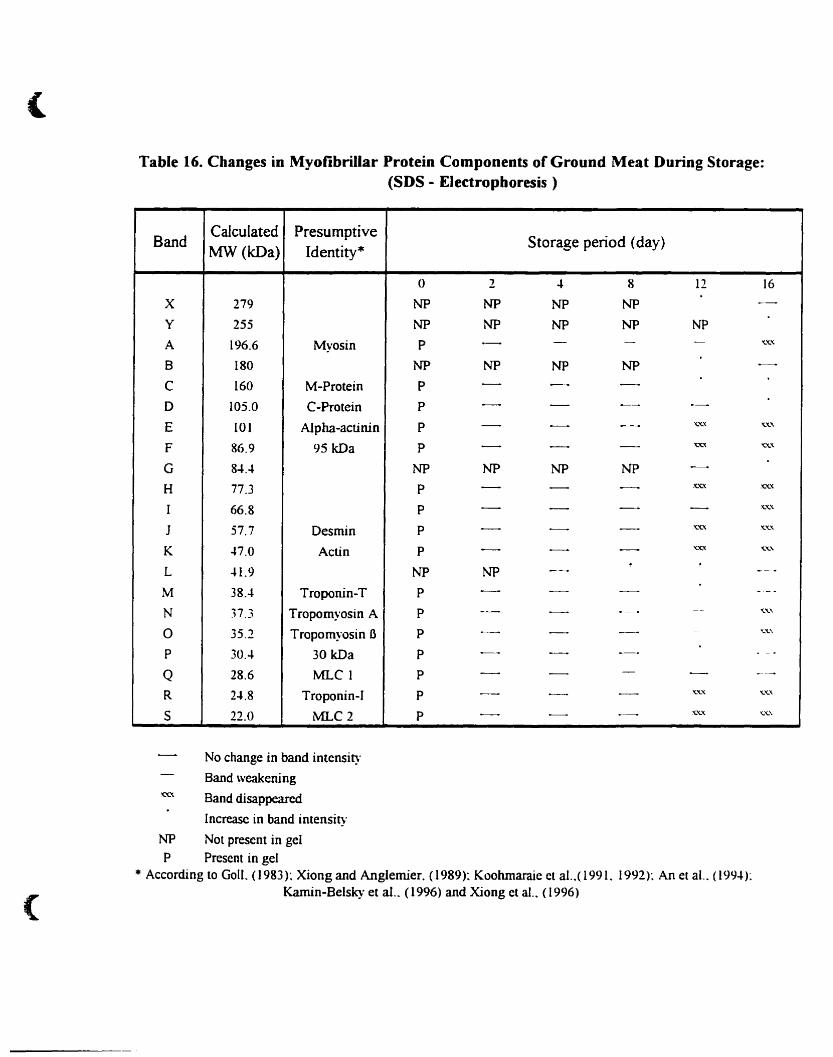
.'CXX
(
(
Table 16. Changes in Myofibrillar Protein Components of Ground Meat During Storage:(SDS - Electrophoresis )
BandCalculated Presumptive
Storage period (day)MW (kDa) Identity*
0 2 4 8 12 16
X 279 NP NP NP NP --Y 255 NP NP NP NP NP
A 196.6 Myosin P - - ~ - "t.x.x
B 180 NP NP NP NP ~
C 160 M-Protein P - - -D 105.0 C-Protein P - - - -E 101 AJpha-actinin P - - - 't."(.x 't.'tx
F 86.9 95 kDa P - - - .~ 't.,.'\
G 80JA NP NP NP NP -H 77.3 P - - - xxx :c<.x
1 66.8 P - - - - 't."(.x
J 57.7 Desmin P - - - xxx 't.'tx
K 017.0 Actin P - - - 't."C'l 't.x."
. .L 01 1.9 NP NP - _-0
M 38.4 Troponin-T P - - - ---.
N 37.3 Tropomyosin A P - - 0-' -~ 't.....,
a 35.2 Tropomyosin 6 P - - _0 - '-....'\
P 30A 30 kDa P - - - .. - ..
Q 28.6 rvn...C 1 p - - - - --.R 24.8 Troponin-I P - - - ........,. x,"(.\
S 22.0 rvn...C 2 P - ~ -- :x.x.x '(,.'(.'\
No change in band intensity
Band weakening
Band disappeared
Increase in band intensity
NP Not present in gel
P Present in gel* According to Goll. (1983): Xiong and Anglemier. (1989): Koohmaraie ct al..(199 L 1992): An et al.. (1994):
Kamin-Belsky et aL (1996) and Xiong ct al.. (1996)
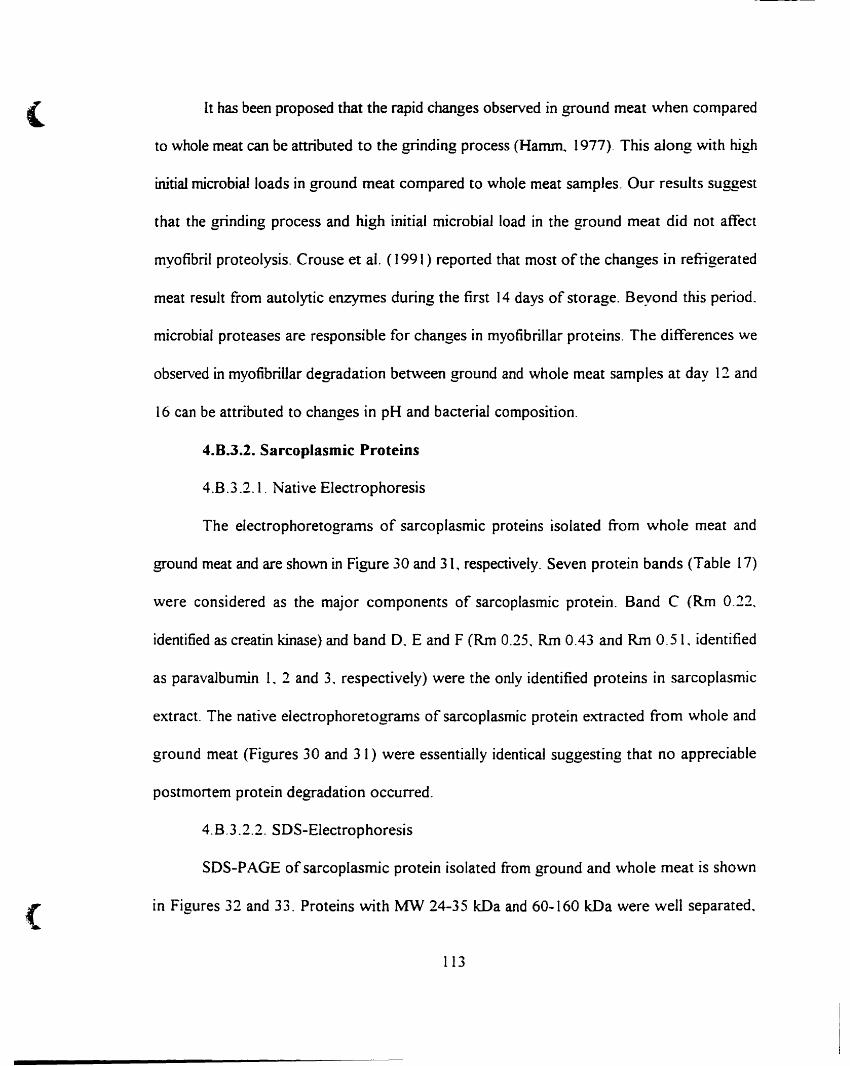
(
lt has been proposed that the rapid changes observed in ground meat when compared
to whole meat can be attributed to the grinding process (Hamm. 1977). This along with high
initial microbialloads in ground meat compared to whole meat samples. Our results suggest
that the grinding process and high initial microbial load in the ground meat did not affect
myotibril proteolysis. Crouse et al. (1991) reported that most of the changes in refrigerated
meat result from autolytic enzymes during the tirst 14 days of storage. Beyond trus period.
microbial proteases are responsible for changes in myofibrillar proteins. The differences we
observed in myofibrillar degradation between ground and whole meat samples at day 12 and
16 can be attributed to changes in pH and bacterial composition.
4.8.3.2. Sarcoplasmic Proteins
4.B.3.2. 1. Native Electrophoresis
The electrophoretograms of sarcoplasmic proteins isolated from whole meat and
ground meat and are shown in Figure 30 and 31. respeetively. Seven protein bands (Table 17)
were considered as the major components of sarcoplasmic protein. Band C (Rm 0.12.
identified as creatin kinase) and band O. E and F (Rm 0.15. Rm 0.43 and Rm 0.51. identified
as paravalbumin 1. 2 and 3. respectively) were the only identified proteins in sarcoplasmic
extract. The native electrophoretograms of sarcoplasmic protein extracted from whole and
ground meat (Figures 30 and 31) were essentially identical suggesting that no appreciable
postmortem protein degradation occurred.
4.8.3.2.2. SDS-Electrophoresis
SOS-pAGE of sarcoplasmic protein isolated from ground and whole meat is shown
in Figures 32 and 33. Proteins with MW 24-35 kDa and 60-160 kDa were weil separated.
113
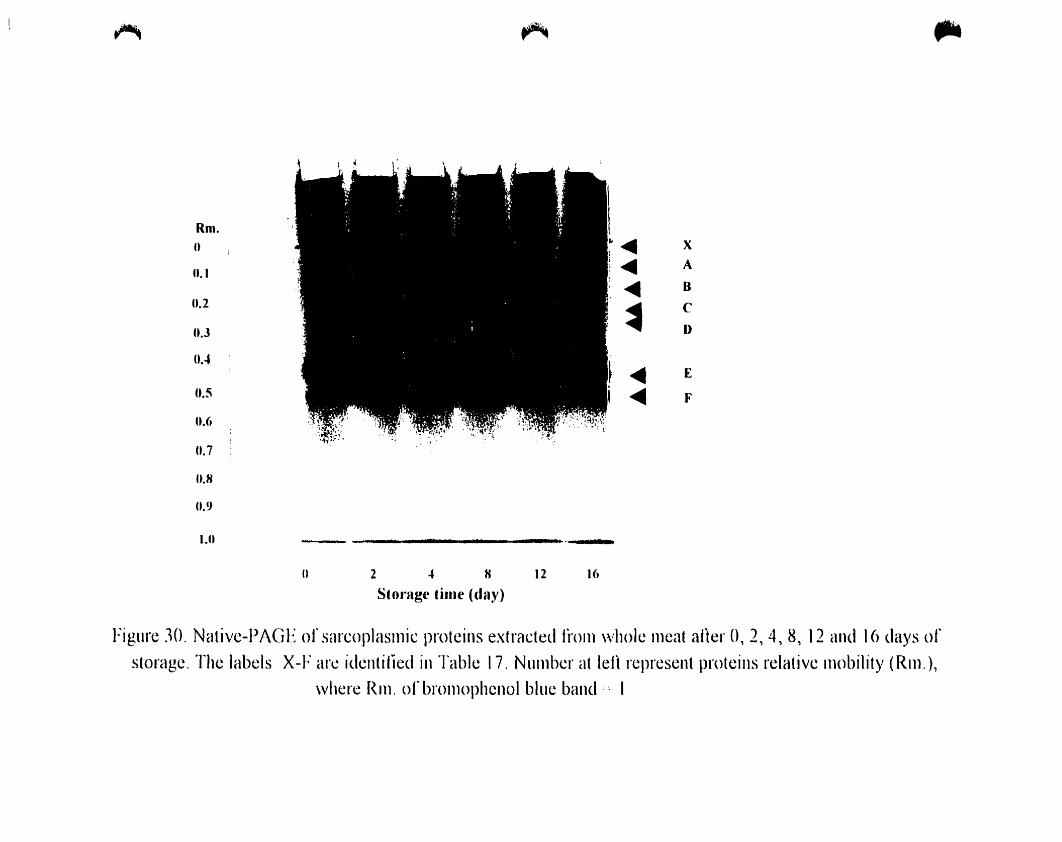
~
Rm.U
CU
U.2
n.]
n...
n.s
U.6
n.7'·:~1tr:\;. :.,(~ ·'w-'
0.8
U.9
LU
~
......~
~
~~
X
A
B
C
D
E
F
--
o 2 .. H
Stol'age thue (day)12 l(t
Figure 30. Native-PAGE ofsarcoplaslllic proteins extracted f-j'OIn \vhole Incat afler 0,2,4,8,12 and 16 days ofstoragc. The labels X-F are identiticd in Table 17. NllInbcr at letl represent proteins relative 11lObility (Rnl.),
\vhere Rnl. of broJl1ophenol bille band ,:- 1
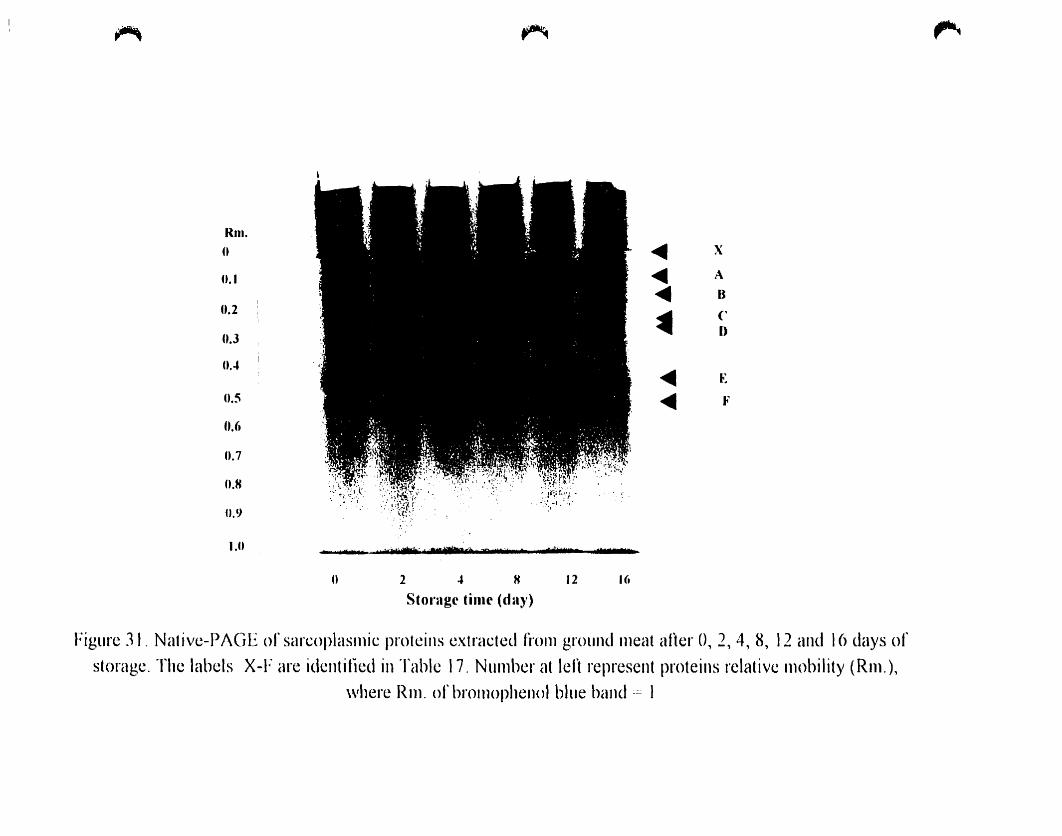
~ ~
ROI.
ft
0.1
0.2
U.J
nA
n5
H.f.
n.7
n.H
0.9 ',1
LU _ r k hM ·'M t• th 'f :-t ' tt
~ X
~ A
<4lIII 8
~('
D
<4lIII E
~ Ji'
~
fi 2 4 fi
Slorage lime (day)
12 1(,
Figure 31. Native-PAGE of sarcoplasnlic protcins cxtractcd Il'0111 ground 111eat aiter 0, 2, 4, 8, 12 and 16 days of
storage. The labels X-F are idcntiiied in Table 17. NlIIllbcr at len represent proteins relative Illobility (Rnl.),
\vhere Rnl. of broillophenol bIlle band '''' ]
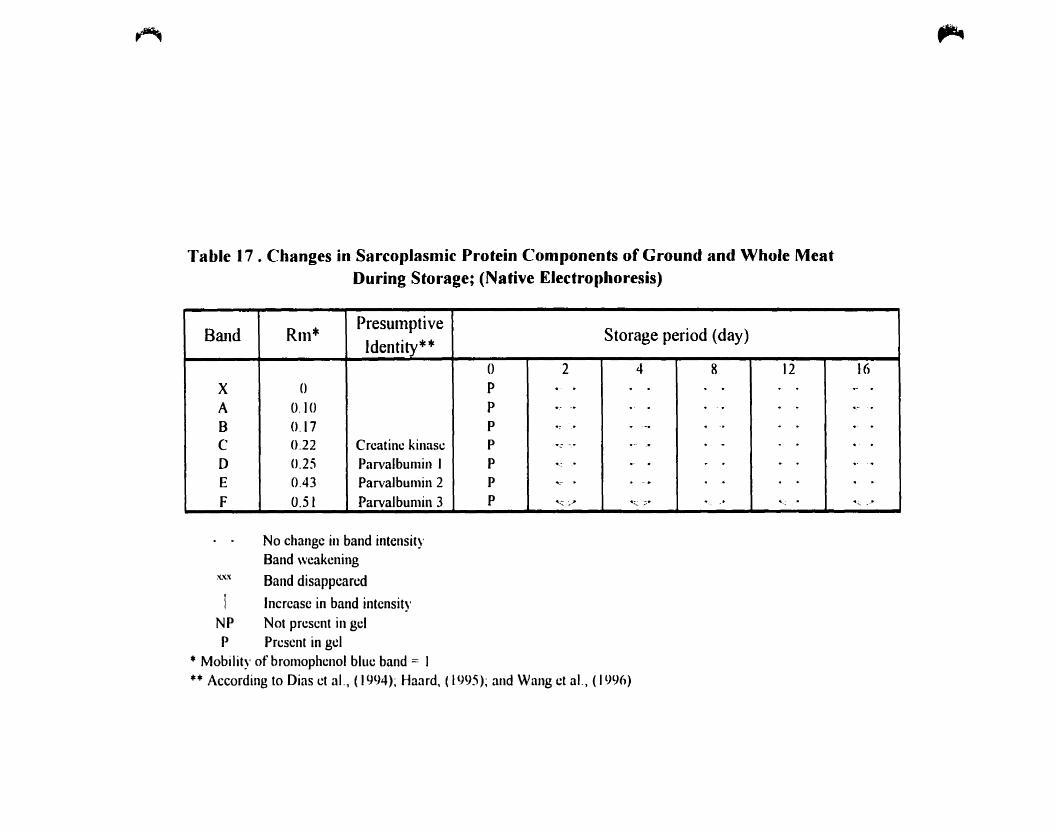
~
Table 17 . Changes in Sarcoplasmic Protein Components of Ground and Whole MeatDuring Storage; (Native Electrophoresis)
Band Rlu*PresUluptive
Starage period (day)Identity**
0 2 4 8 12 16X 0 P « . · .- .A O. ]0 P e-- -. · .- .B 0.17 P . -- · -. · .- .C 0.22 Creatine kinase P .' . .0 0.25 Parvalbumin ] P ".,. · · · .- .E 0.43 Parva]bumin 2 P ~ . · · -.F 0.51 Parva]bumin 3 P " >- "-: ;;- ·" . ,- . .., ".
No change in band intensityBand weakening
:'l'l" Band disappcarcd
1 Increase in band intensityNP Not present in gelP Present in gel
* Mobility of bromophenol bille band =: 1** According to Dias ct al., (1994); Haard, (1995); and Wang ct aL, (1996)
~
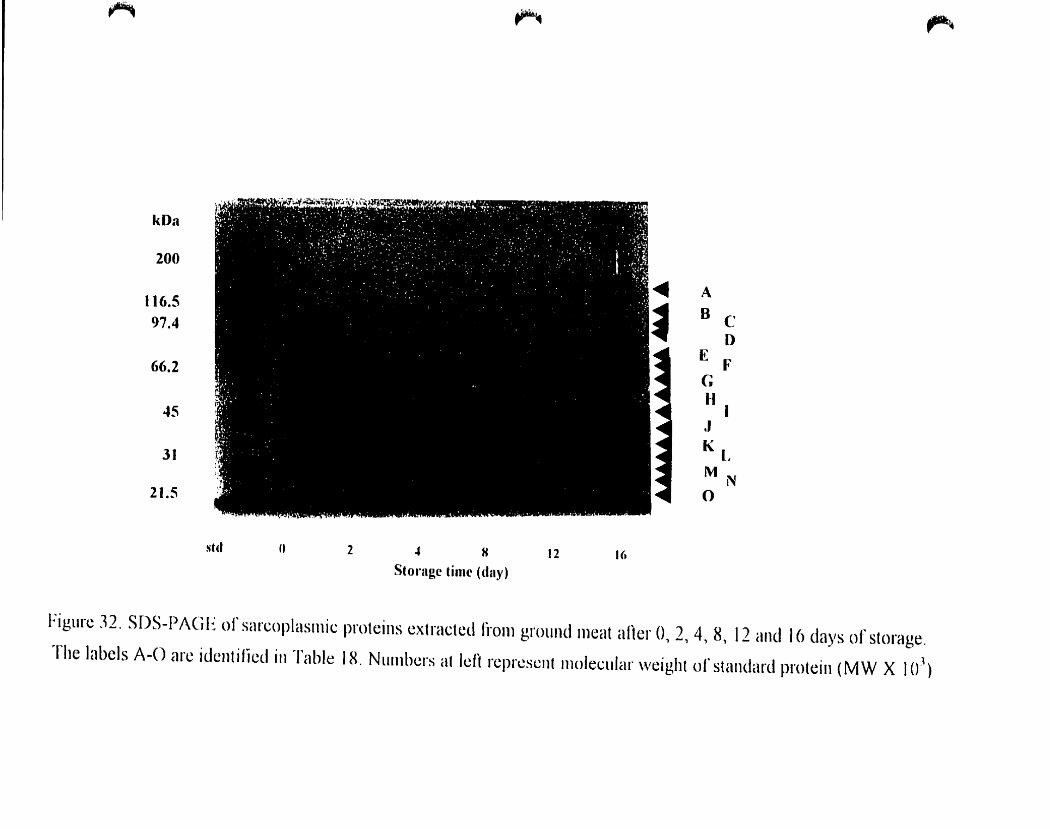
~ ~ ,.,.
•1
l., " . .:.. J ':';\:~,f •• '
1••
, ~
.~: :~if.
r
.~:" "~
std " 2 ., H
Storage lime (day)12 1(.
Figure 32. SDS-PAGE of sarcoplasmic proteins extractcd li"OIIl grollnd meat aner 0, 2, 4, 8, 12 and 16 days of storage.
Thc labels A-O arc idcntificd in Table 18. Numhers al IcH rcprescnl Illoleclllar \vcight of standard prolein (MW X 101)
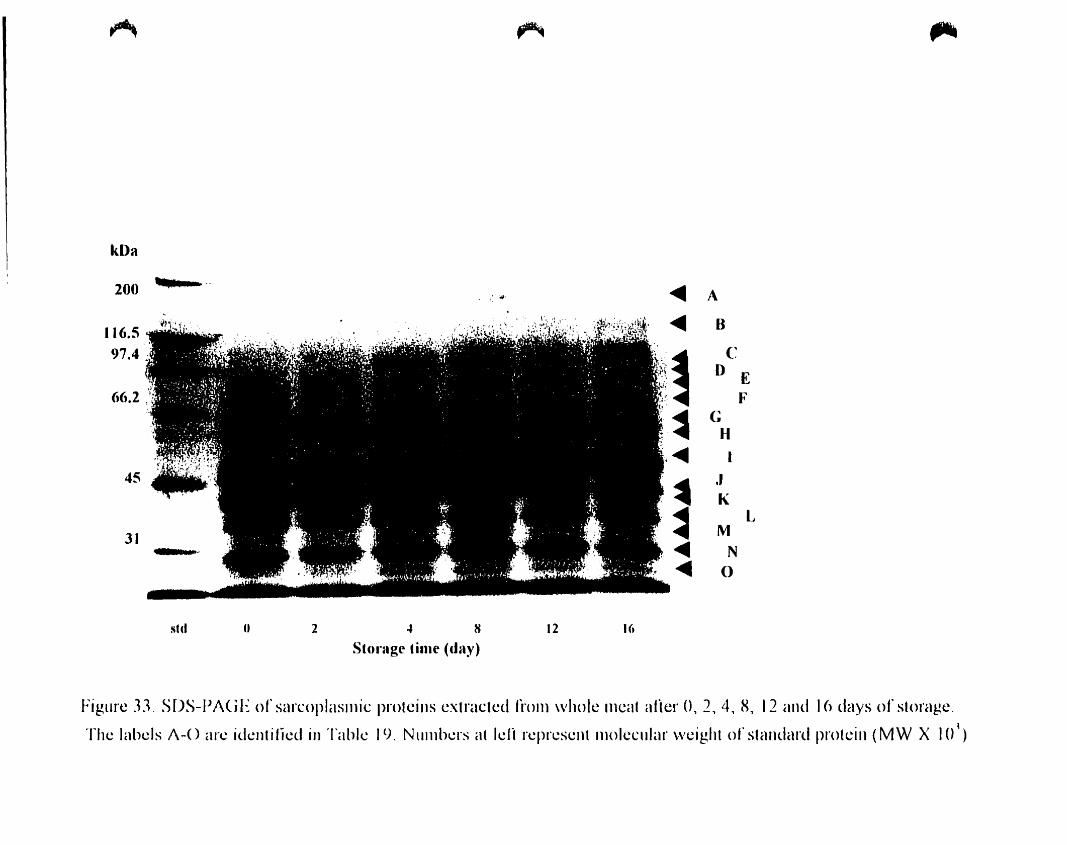
~ ~ ".
kDa
~ A200 ;
.. ,'~
8
CD E
FG
H'i~ 1
~.1K
~L
1 MFt?t ....j n.:~ ;,
~ N. 4.t
~ '. t31 ;l
~ 0
std u 2 4 HStornge time (dny)
12 1(,
Figure .1.1 SDS-PI\GE of san:oplasnlic protcins cxtractcd fh)Jll \vhole 1l1cat aHer 0, 2,4, 8, 12 and 16 days of storage.
The labels I\-() arc idcllt ified in Table 1C). NlII11bcrs al !cH reprcsent IlH)!ccular \veight of standard protein (MW X 10 ~ )
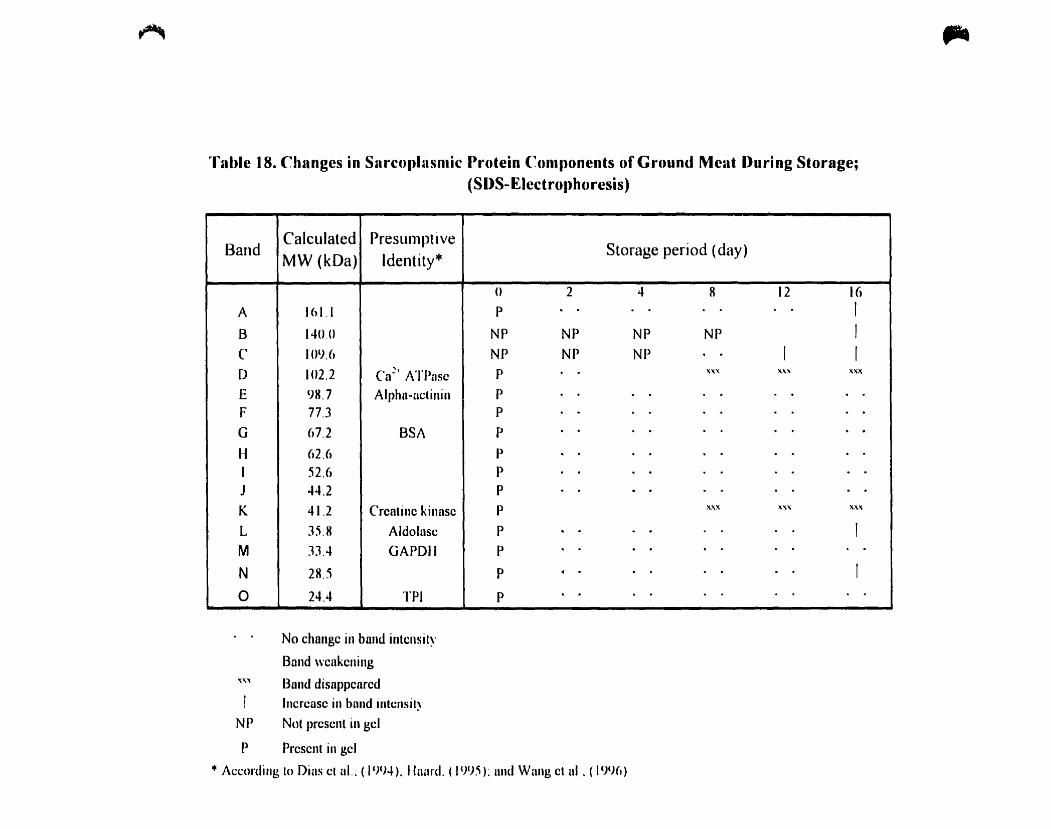
~
Tnble 18. Chnnges in Snrcoillnsruic Protein Components of Ground Meut Iluring Storage;(SDS-Electrophoresis)
BandCalculated Presulnptive
Storage period (day)MW (kDa) Identity·
0 2 4 ft 12 16
A 161.1 P · . 1
B 140,(1 NP NP NP NP 1
C 1(Il). ft NP NP NP 1 1
D 102.2 Ca~1 ATPlIsc P "".. ......\ ",x.'<
E 98.7 Alphll-aclinin P · . · . · .F 77.3 P · . . . · .G 67.2 BSA P · . . · .H 62.6 P · . · . · . · .1 52.6 P · . · .J 44.2 P · . · . · .K 41.2 Creatine kinasc P x..... ....., .......'<
L 35.8 Aldolasc P · . · . 1
M JJ.4 GAPDU P · .N 28.5 P · . 1
0 24.4 TPI P
No change in band intcnsily
Band wcnkcning
.... '1 Band disnppcarcd
! Incrcnse in band inlensil~
NP Not prescnt in gel
P Prescnl in gel
• Accordillg ln Dias cl al.. (l'N4). Huard. ()')l))): und Wang cl ni, (l'J')(,)
,..
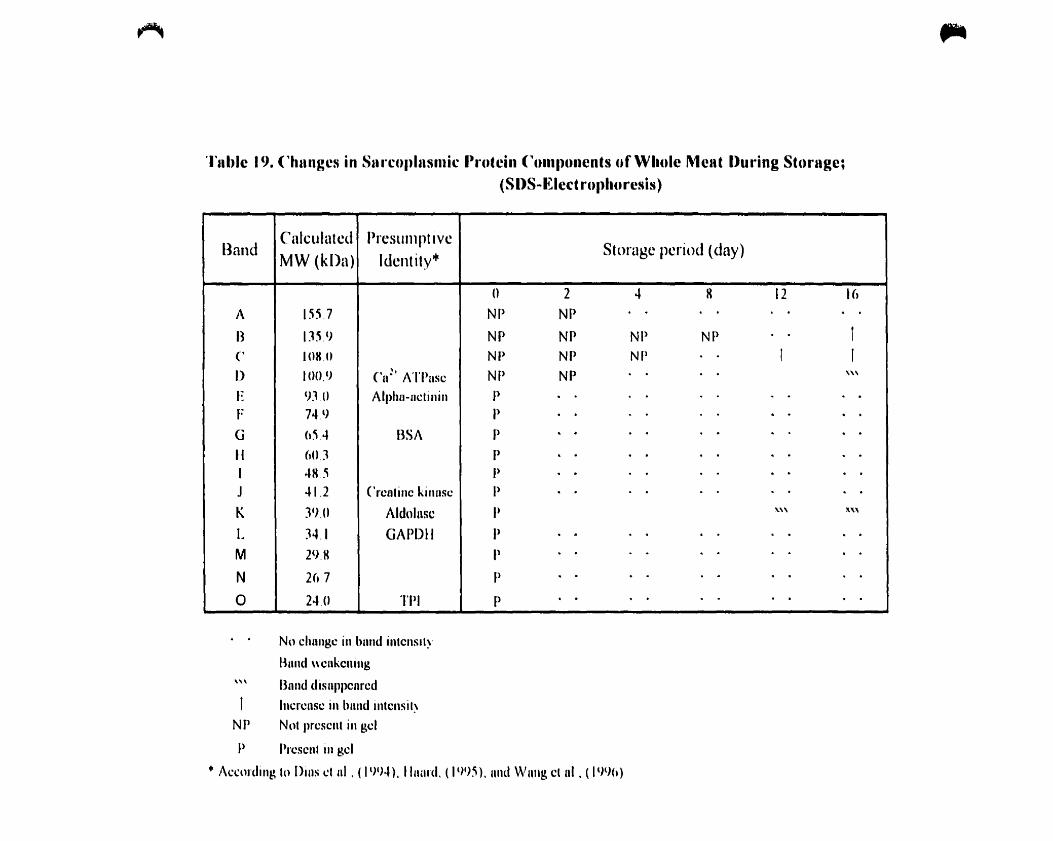
~
Tnble 19. Changes in Snrcoillnsmic ....utcin COllllloncnts of Wholc Ment Iluring Storage;(SIlS-li:lect"ollhuresis)
BandCalculutcd PreSlllllptivc
Storage pcriod (day)MW (kDa) Identity+
() 2 .. R 12 16A 1557 NP NP ·B 1]5.9 NP NP NP NP 1
C 10H11 NP NP NP 1 1() 100.e) ('n~1 ATPnsc NP NP '"E en.1l Alphu-m:tinin Il . · .F 74. C) P · . . .G h5.4 BSA P · . · .Il 60J P · .1 -tHj P · . .J 41.2 Creatinc kinllsc P
K )CJ.O Aldolnsc P '1..\\ Il,"
L 34.1 GAPDlf P · . · .M 29H P · . . .
N 26.7 P · . .
0 24.0 l'PI P
No chnngc in hnnd intcnslly
Bund wcnkcning
,\\ Blind disnppclIrcd
1 Incrcnsc in bnnd intcnsil~
NP Not prcsent in gel
P Present in gel
+ AccoHling to Dins ct ni . ( PN4), Humd, (P)l)5), und \\Jung ct ni . ( 199h)
,..
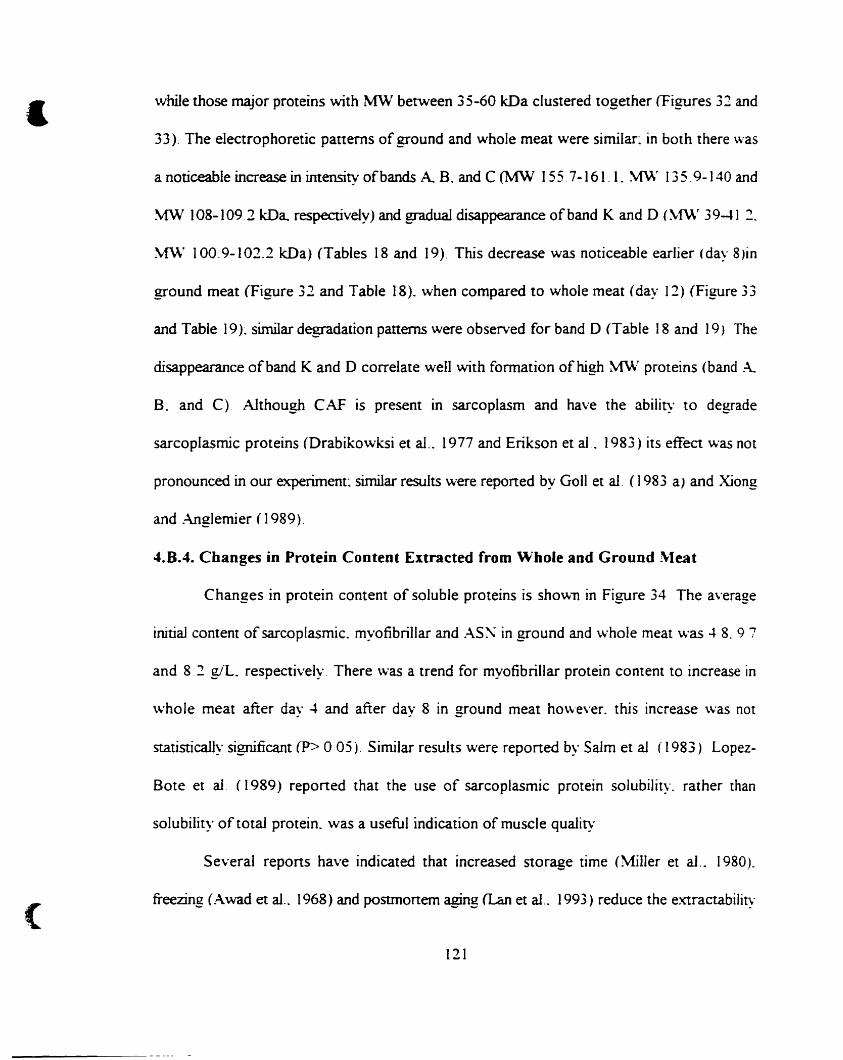
&
(
\vhile those major proteins with MW between 35-60 kDa cIustered together (Figures 32 and
33). The eleetrophoretic panerns ofground and whole meat were similac in both there was
a noticeable inCTease in intensity ofbands A B. and C (MW 155.7-161. 1. \1\\' 135.9-140 and
MW 108-109.2 kDa. respectively) and graduaI disappearance ofhand K and 0 (\f\\r 39-41.2.
\1\\' 100.9-102.2 kDa) (Tables 18 and 19). This decrease was noticeable earlier (da\" S)in
ground meat (Figure 32 and Table 18). when compared to whole meat (day 12) (Figure 33
and Table 19)~ similar degradation patterns were observed for band 0 (Table 18 and 19) The
disappearance ofband K and 0 correlate weIl with formation ofhigh M\V proteins (band A..
B. and C) Although CAF is present in sarcoplasm and have the ability to degrade
sarcoplasrnic proteins (Drabikowksi et al .. 1977 and Erikson et aL 1983) its effect was not
pronounced in our experiment~sirnilar results were reponed by Gall et ai. (1983 a) and Xiong
and Anglemier (1989).
4.8.4. Changes in Protein Content Extracted from Whole and Ground ~Ieat
Changes in protein content of soluble proteins is sho\l;ll in Figure 34. The average
initial content of sarcoplasmic. myofibrillar and AS0i in ground and ,vhole meat was 4 8. 9 7
and 8.2 g/L. respectively. There was a trend for myofibrillar protein content to increase in
''''hole meat after day 4 and after day 8 in ground meat ho\vever. this increase \vas not
statistically significant (1)> 0 05). Similar results were reponed by Salm et al (1983) Lopez
Bote et aL (1989) reponed that the use of sarcoplasmic protein solubility. rather than
solubility of total protein. \vas a useful indication of muscle quality
Several repons have indicated that increased starage time (Miller et ai .. 1980).
freezing (Awad et al.. 1968) and postrnortem aging (Lan et al.. 1993) reduce the extraetability
121
---------_._- -
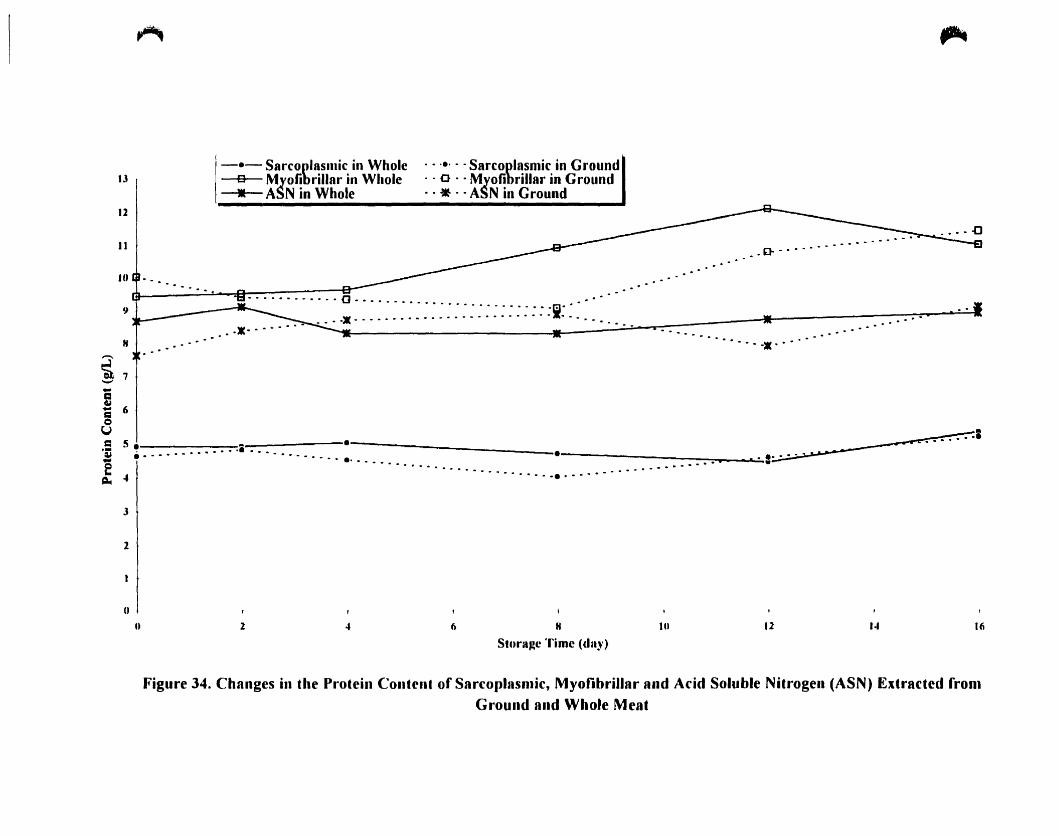
,.... "..
... - .•• D- - ••••
...................* .
· . ·e· . - Sarcoplasmic in Ground· - 0 .. M)'ofibrillar in Ground· ..... ASN in Ground
. .
~:::::::~~:::::::::::::::::~:::::: ..
-e-Sarcoplasmic in Wholee-- Myofibrillar in Whole.-ASN in Whole
H
Il
12
Il
lU
~.........
9
~7---=~1:i 6 ••
'" . . ...~ 5: a :...........................•............•...Ë of 1~
J
2
CI
(1 2 of 6 H
Stnra~c 'rime (da'J)
111 12 ... 16
Figure 34. Changes in the Protein Content of Sarroplasmir, Myolibrillar and Add Soluble Nitrogen (ASN) Extracted fronl
Ground and Whole Meat
1
(
ofmuscle proteins as a result ofprotein denaturation. On the other hand. severa) other reports
indicated that changes in protein content during storage are insignificant (Xiong and Brekke.
1989 and Lin and Park 1996). Salm et al. (1983) suggested that myofibrillar protein solubility
in KI buffer increased with ageing ofbeef These reports demonstrate the difficulty associated
with protein solubility as an indicator of quality.
4.8.5. Liquid Chromatography - Mass Spectrometry
The chromatograms obtained from HPLC analysis of sarcoplasmic proteins isolated
from ground and whole meat is shown in Figures 35 and 36. respectively: at least 12 peaks
having MWs ranging trom Il to 42 kDa were identified by electrospray ionization-mass
spectrometry (ESI-MS). A representative. interpreted mass spectra oftypical ESI-MS of the
major peaks are presented in Figure 37 a. b. c.d.e. The results suggest that proteolytic changes
were observed in sarcoplasmic protein extraeted from ground and whole meat. Changes in RA
0/0 of protein with a MW of 35.7 kDa are shown in Figure 38. These data indicated that RA
0/0 of this protein decreased progressively at day 12 and completely disappeared at day 16
(Figure 38): this decrease was more pronounced in whole meat when compared with ground
meat. Since the bacterialload in whole meat was lower than that ofground meat (Tables 9
and 10), the decrease in RA % ofthis protein in whole meat can be attributed to the autolytic
changes rather than rnicrobial degradation.
123
(
o
1~ -î ~lj V\ (----,,-..~_.-~-----
48
(
(_-_-1
1216
1 ~ ! •
J ~I d~\ {J\ r.\. ~ .~ ..J J
~---.-
1Figure 35. RP-HPLC Chromatogram of Sarcoplasmic Proteins Extracted from
Whole Meat During 16 Days of Storage
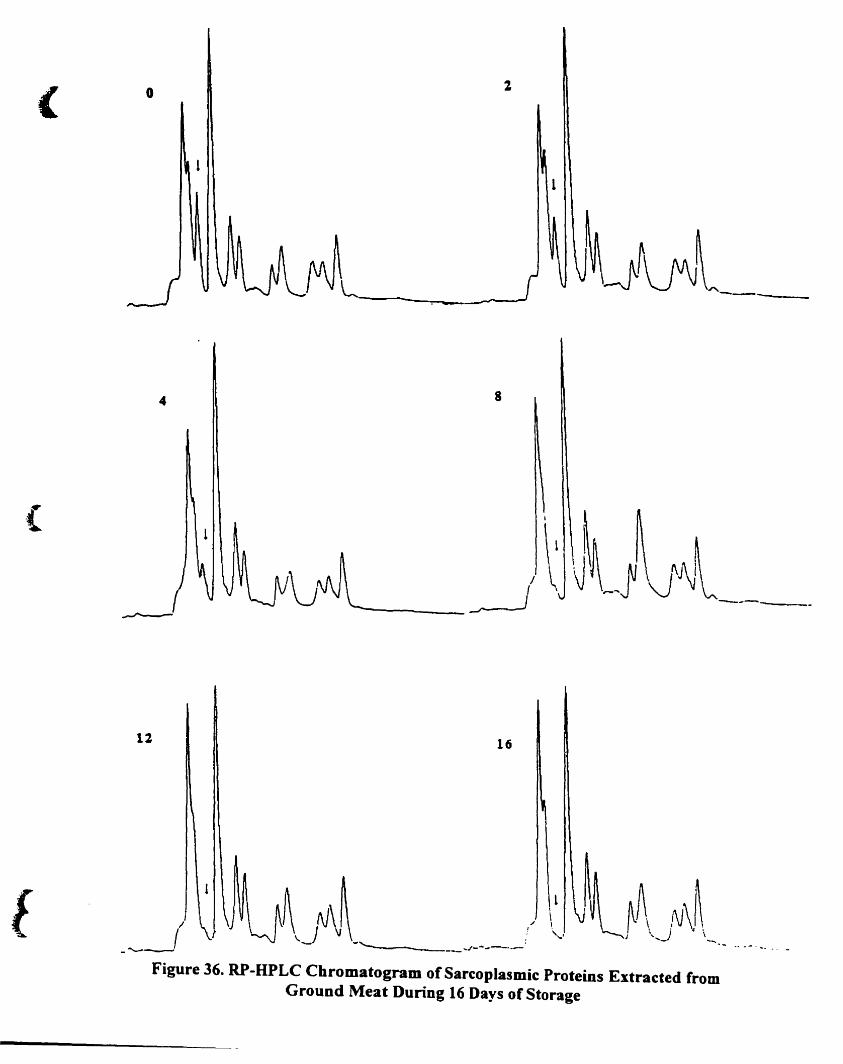
( o
rJ\~---..,.--._--
.{
l
4
12
(""----
8
1 t
'lJ~ _~j ~ J~_} ~\~ _----
16
1\
,/ 1
! \.'..../-----
Figure 36. RP-HPLC Chromatogram of Sarcoplasmic Proteins Extracted fromGround Meat During 16 Days of Storage
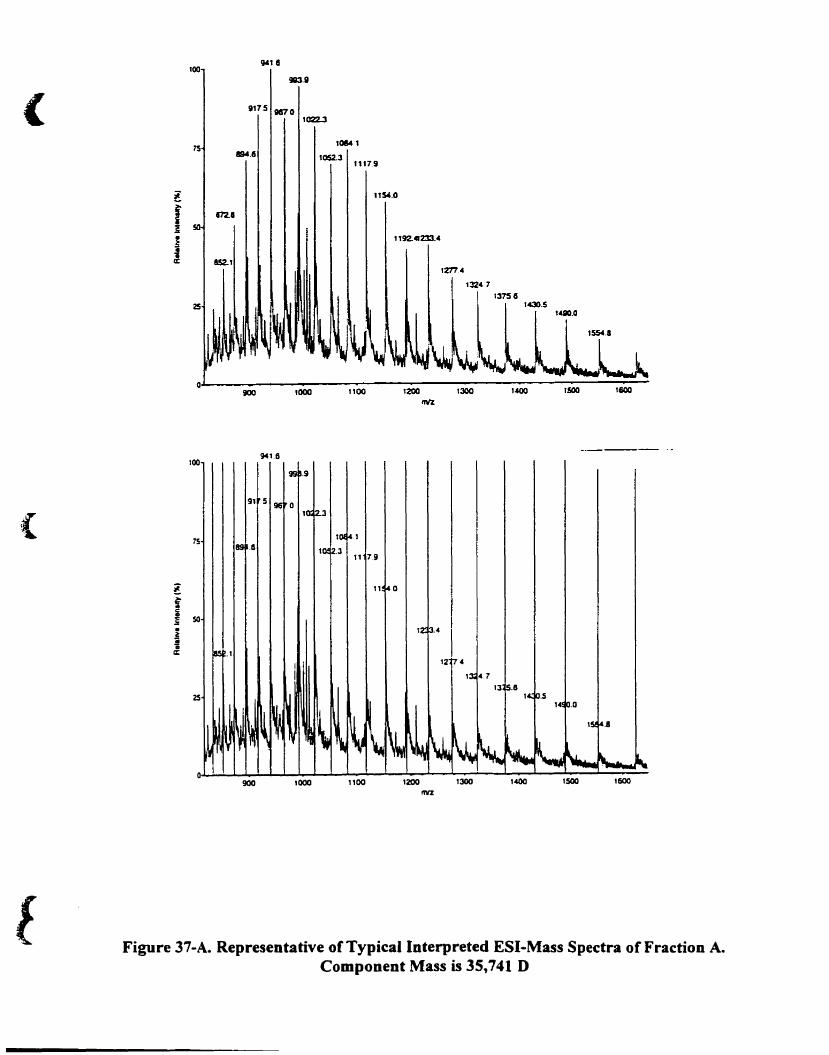
CJCU100
( 1175 ifS'701022..3
1014 1
1192.41233.4
11506.0
16001500
14110.01430.5
lJOO
12774
13247137S6
1200mIZ
tt17.9
1100
t052.3
'000
75194.15
lf S12.11
S 50
•~.!..~ 152..1
25
~
100941.6
11 0
(75
lfi
50~.~jIl~
25
.8
900 1000
1
11 79
1,00
.4
1200l'IVZ
1300 lSOQ 1600
l Figure 37-A. Representative of Typical Interpreted ESI-Mass Spectra of Fraction A.Component Mass is 35,741 D
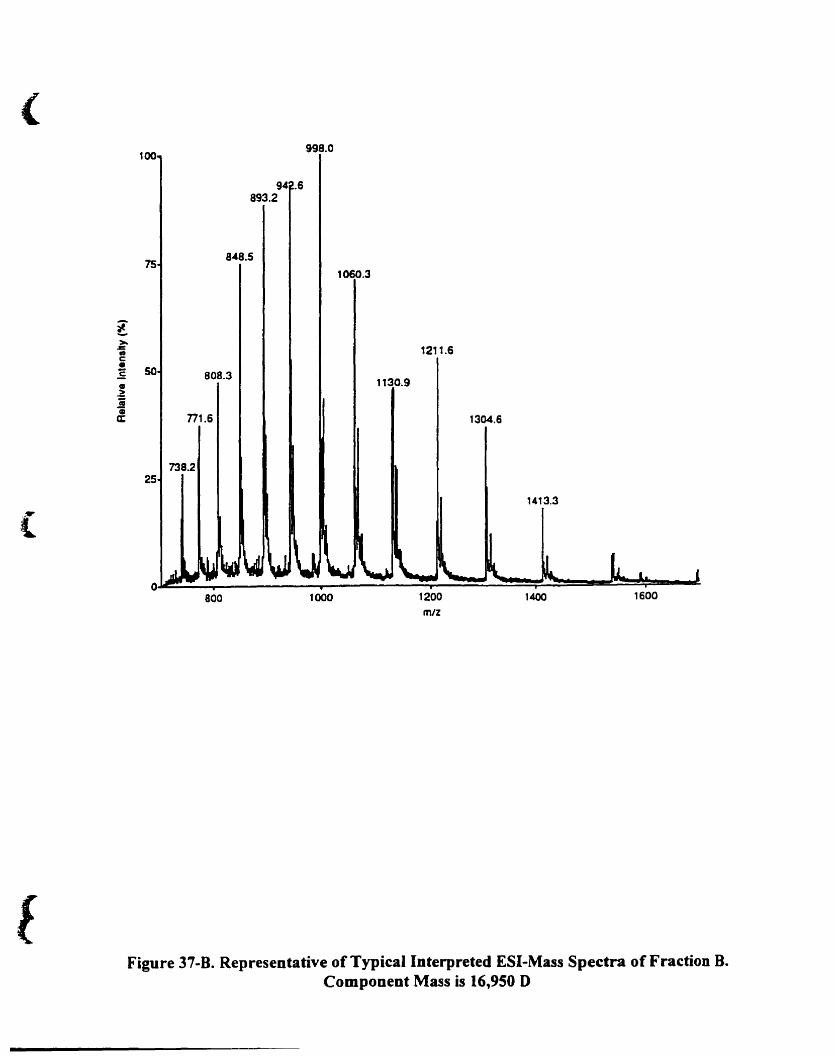
7S848.5
1060.3
~
>0-z 1211.6..c:•:Ë 50 808.3• 1130.9~ii~
n1.6a: 1304.6
738.225
1413.3
(
.~
l
[
100
800
94 .6893.2
998.0
1000 1200mlZ
1400
Figure 37-B. Representative of Typical Interpreted ESI-Mass Spectra of Fraction B.Component Mass is 16,950 D
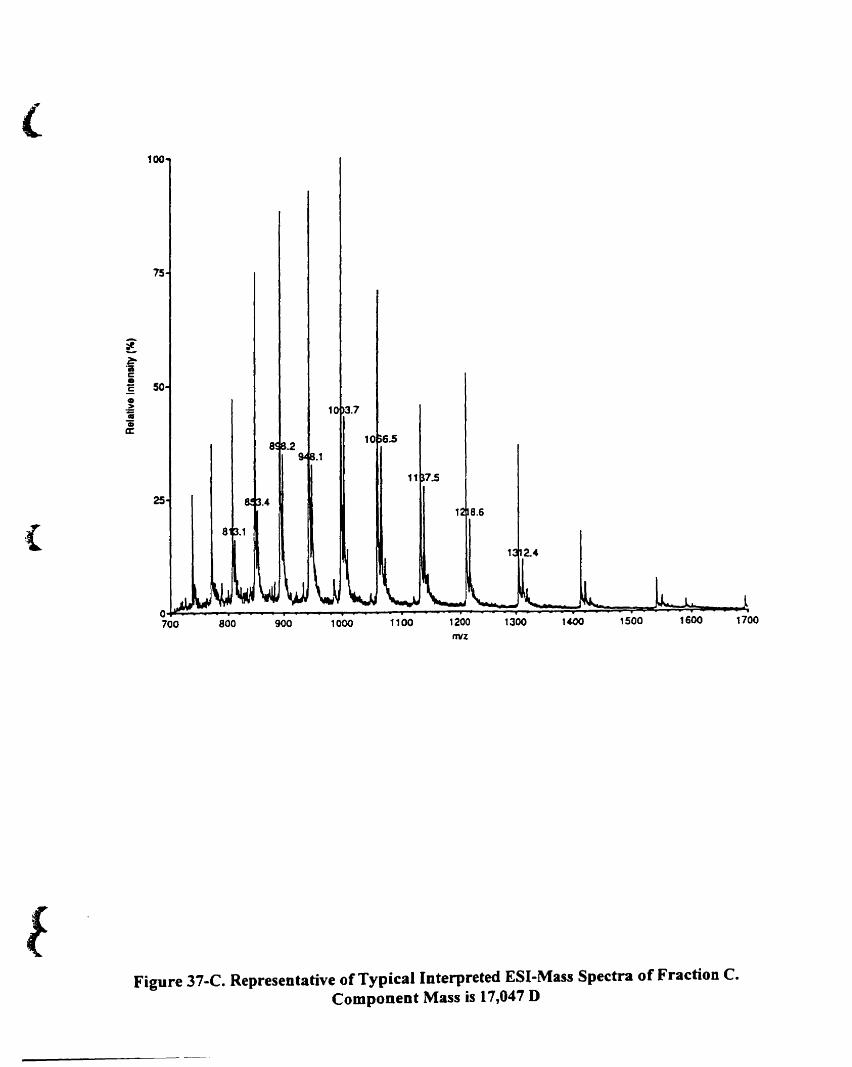
(100
75
~
tc•~ 50•~ 10 3.7aiCI:
8 .2.1
10 .s
11 7.5
{
25
800
.4
900 1000 1100
1 S.6
1200ITVI
1300 1400 1500 1600 1700
Figure 37-C. Representative of Typical Interpreted ESI-Mass Spectra of Fraction C.Component Mass is 17,047 D
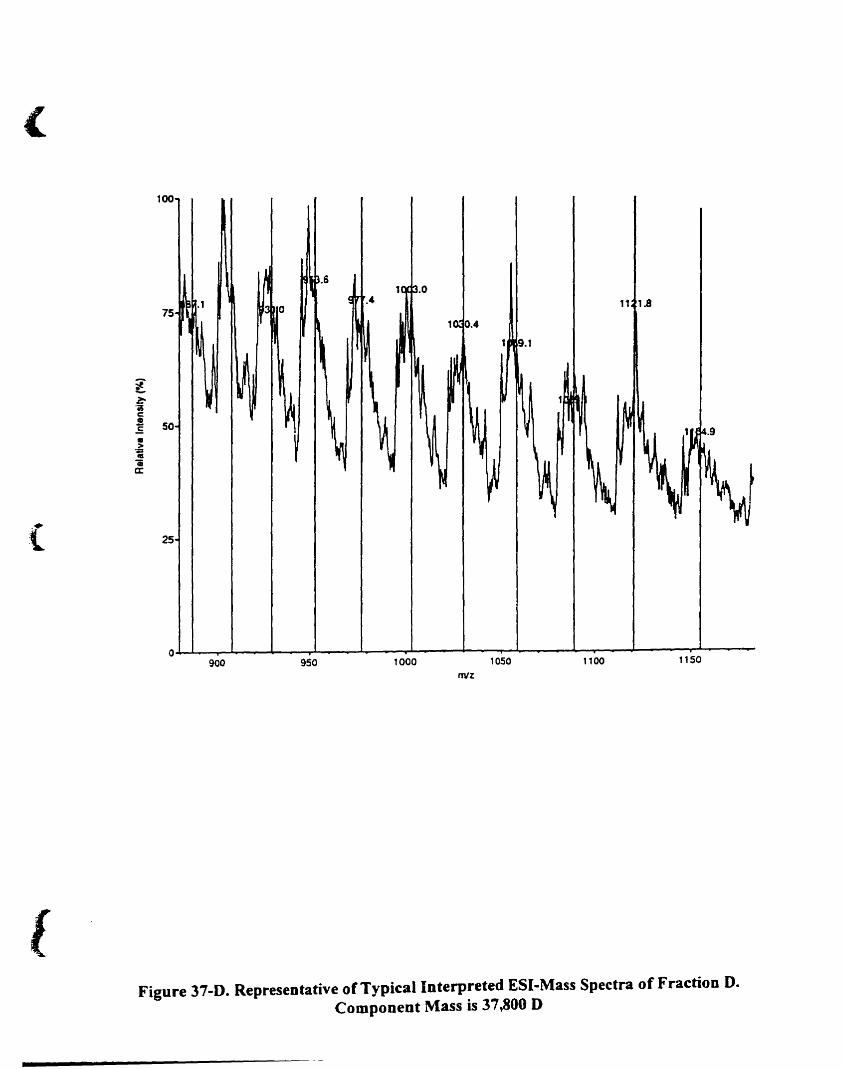
(
100
11 1.8.0
.4
.6
75
50
25(
1150110010501000
O--"'~:-",,:,,"..L..-_"""""__-r.L..__J.--_-.,..L__....,J.._.......,..-J..__-L-....-_--J-_-.~---
900 950mlZ
lFigure 37-D. Representative of Typical Interpreted E81-Mass Spectra of Fraction D.
Component Mass is 37,800 D
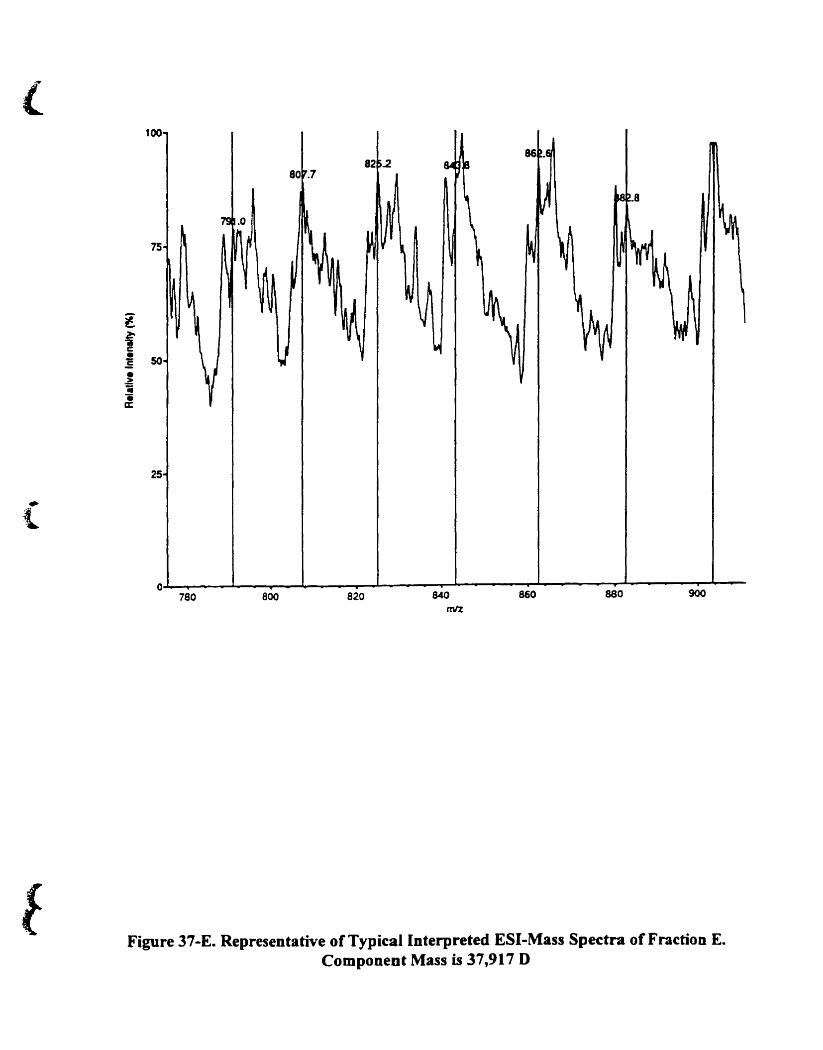
l100
75
lf•:s 50
lii..a:
25
900880860840mIZ
820800780o.J.-__-~-._...__.-J.-- -Ji.-------r-...&-------........----..........---...-,.--&".--
lFigure 37-E. Representative of Typical Interpreted ESI-Mass Spectra of Fraction E.
Component Mass is 37,917 0
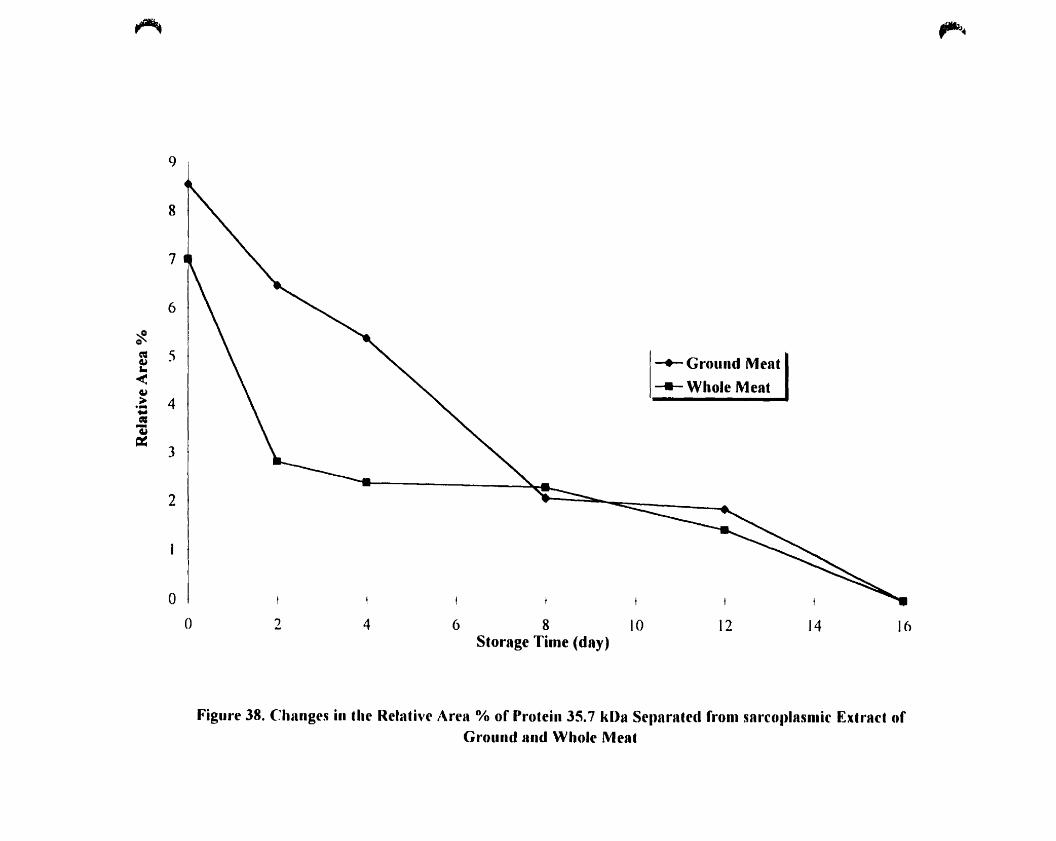
~ ,-.
1614126 8 10Storage Time (day)
42oo
9
8
7
6
'tcu
5 1 \ "'"[-- Ground Meal~...
-(--- Whole Meat~
~ 4.-.."~g::
3
2
Figure 38. Changes in the Relative Aren 'Yu of Protein 35.7 k()n Selunnted from SarCOI)lasmic [:dract of
Grollnd and Whole Meat
1.
(
5. GENERAL CONCLUSIONS
MicrobiologicaI analysis indicated that carp fish stored aerobically at temperature 0-2
oC for 16 days supponed baeterial growth to a level which did not result in noticeable
deterioration.
2. Changes in carp 6sh pH during storage was significant under controlled experimentaI
conditions.
3. Major changes in carp 6sh myofibrillar took place after day 2 of storage. No changes
in large MW proteins were observed~ however, reductions in band intensity of low
MW proteins identified as tropomyosin, myosin light chain 1. troponin-I and myosin
light chain 2 occurred. These changes can be related to autolytic activity rather than
bacterial action since the bacterial counts in carp 6sh were relatively low.
4. The disappearance ofbands D (66 kDa) and A (140 kDa) and the graduaI increase in
band intensity of band F (creatin kinase) and band G (aldolase) were the major
changes in sarcoplasmic proteins: they are potential indicators for the state of
freshness of chiIIed carp fish.
5. In carp fish, changes in relative area (0/0) of the polypeptides with MW 10.9. 16.7.
32.8 and 42.8 kDa and changes in MW of polypeptides with MW 12.34.2 and 42.8
kDa were observed.
6. No significant changes in pH were observed in whole meat. and only at day 12 and 16
for ground meat. This cao be attributed to the buffering capacity of meat muscle
proteins.
132
7.(
(
Changes in band intensity ofhigh myofibrillar proteins MW identified as myosin. actin
and desmin of ground and whole meat were observed~ these changes were more
noticeable in ground meat samples. It appears that the proteolytic activity of cysteine
proteases could be responsible for myofibrillar degradation in meat. since optimal pH
ofthese enzymes is within muscle pH.
8. Changes in band intensity of a sarcoplasmic protein with MW of 39-41 kOa was
identified as potential indicator of freshness in ground and whole meat samples.
9. In generaL native electrophoretograms of sarcoplasmic and myofibrillar proteins in
6sh and meat (ground and whole) revealed no significant changes in band intensity of
separated proteins. Thus, proteolysis cannot be monitored by native electrophoresis.
10. No significant changes in content ofsoluble proteins, either in fish or in meat (ground
and whole) was observed. Therefore, changes in protein extractibility were not
identified as potential indicators of freshness in fish and meat.
11. Change in RA % of sarcoplasmic protein with a MW of 35.7 kDa extracted from
ground and whole meat was observed, with a progressive decrease until day 12 and
complete disappearance at day 16: this decrease was more noticeable in whole meat.
Since the baeterial load in whole meat was lower than that of ground meat, then rapid
decrease in RA o~ in whole meat can be attributed more to autolytic changes than
bacterial changes.
133
(
6. REFERENCES
Aksnes, Anders. 1988. Location of enzyme responsible for analysis in Bulk-stored eapelin(Mallotus Villosus). J Sci Food Agrie. 44: 263-271.
Alicia, L. 1986. Proteolytic enzymes: sources and application. Food Technol. 40 (1): 63-70.
Allen., M.B. 1953. The thennophilic aerobic spore forming baeteria. Bacteriol. Rev. 17: 125173.
Alli, L, Gibbs, B.F., Okoniewska, M.K., Konishi, Y. and Dumas. f. 1993. Identification andeharaeterization ofphaseolin polypeptides in a erystalline protein isolated trom white kidneybeans (Phaseo/us vu/garis). J Agric. Food Chem. 41: 1830-1834.
Alli, L, Gibbs, B.f., Okoniewska, M.K., Konishi, Y. and Dumas, F. 1994. Identification ofphaseolin polypeptide subunits in a crystalline food protein isolation trom large lima beans(Phaseo/us lunatus). J. Agric. Food Chem. 42: 2679-2683.
Altemueller. A.G. and Rosenberg, M. 1996. Monitoring proteolysis during ripening offull-fatand low fat cheddar cheese by reverse-phase HPLC. J. Food Sei. 61: 295-298.
An, H., Marshall, M.R., OtwelL W.S. and Wei, C.I. 1988. Eleetrophoretic identification ofrawand cooked shrimp using various protein extraction systems. 1. Food Sei. 53: 313-318.
An, H.. Peters, M.Y., Seymour, A.T., Morrissey, M.T. 1995. Isolation and activation ofcathepsin L-Inhibitor complex trom pacific whiting (Merluccills products). J. Agnc. foodChem. 43: 327-330.
An, H.. Weerasinghe, V., Seymour, T.A. and Morrisse. Y. 1994. Cathepsin degradation ofpacifie whiting surimi proteins. 1. Food Sei. 59: 1013-1033.
An, H .. Wei, C.L, Zhao. J.• Marshall, M.R. and Lee, C.M. 1989. Electrophoreticidentification offish species used in surimi products. J. food Sei. 54: 253-257.
Anders, A. 1989. Effeet ofproteinases inhibition trom potato on the quality of stored Herring.1. Food Agne. 49: 225-234.
AOAC 1975. Official Method') of Ana/ysis, 12th ed. Association of Official AnalytieaIChemist, Washington, D.C.
AGAC 1990. Official Methods of Analysis. 15th ed. Association of Official AnalyticalChemists, Washington, D.C.
134
(
(
Armstrong, S.G.. Leach, D.N. and Wyllie, S.G. 1992. The use ofHPLC protein profiles infish species identification. Food Chem. 44: 147-155.
Arnold, S.H., Brown, W.D. 1978. Histamine (?) toxicity from 6sh product scombroidtoxicity. Adv. Food Res. 24: 113- 154.
Asghar A. and Bhatti, A.R. 1987. Endogenous proteolytic enzymes in skeletal muscle: theirsignificance in muscle physiology and during postmortem aging events in carcasses. Ad\!.Food Res. 31:343-451.
Asme, LN., Smith, 1.P. and Simpson, B.K. 1996. Spoilage and shelflife extension of fresh fishand shellfish. Crit. Rev. Food Sci. and Nut. 36: 87-121.
Ashoor, S.H. and KnOx. M.J. 1985. Identification of fish species by high perfonnance liquidchromatography. 1. Chromatography. 324: 199-202.
Ashoor. S.H.. Monte. W.C. and Stiles. P.G. 1988. Liquid chromatographie identification ofmeat. J Assoc. Off Anal. Chem. 71: 396-403.
Awad. A. Powrie, W.D. and Fennema. O. 1968. Chemical deterioration of frozen bovinemuscle at -4 °C.J. Food Sci. 33: 227-235.
Baeza.. G.. Correa. D. S. and Salas. C. 1990. Proteolytic enzymes in Carica candamareensis.J. Sci. Food Agrie. 51: 1-9.
Bandsman, E. and Zandis, D. 1988. An immunological method to assess protein degradationin postmortem muscle. Meat Sei. 22: 1-21.
Barker. S.B. and Summerson, W.H. 1941. The calorimetrie determination of laetie acid inbiologieal material. J. Biol. Chem. 138: 535-554.
Beatly. S.A. and Gibbons. N.E. 1936. The measurement of spoilage in 6sh. 1. Biol. Bd. Cano3: 77-91.
Bechtel, P.J. and Parrish, F.C. 1983. Etfeet ofpostmortem storage and temperature on muscleprotein degradation: analysis by SOS-gel eleetrophoresis. J. Food Sei. 48: 294-295. 297.
Bell. P.M. 1963. A eritieal study of methods for the detennination of nonprotein nitrogen.Anal. Biochem. 5: 443-451.
Bennour, M.. EI-Marrakehi. A.. Bouchriti, N.. Hamama, A. and EI-Ouadda. M. 1991.Chemical and microbiologieal assessments of mackerel (Scomber scombnls) stored in ice. J.Food Proto 54: 789-792.
135
(
Bilinski, E.. Jonas, R.E.E. and Peters, M.D. 1983. Factors controlling the deterioration ofspiny Dogfish (squa/us acanthias) during iced storage. J. Food Sci. 48: 808-812.
Bojork. S.A. and Karin~ Y. 1990. Interaction between chicken cystatin and the cysteinproteinases actindin, chymopapain A.. Ficin. Biochem. 29: 1770-1776.
Borton~ R.J., Webb. N.B. and Bratzler. L.J. 1968. The effect of microorganism on theemulsifying capacity and extract release volume offresh porcine tissue. Food Technol. 22:94-96.
Botta. 1.R.. Lauder. J.T. and Jewer. M.A. 1984. Eifect of methodology on total volatile basicnitrogen (TVB-N) detennination as an index of quality of fresh Atlantic cod. (Gadu."imorhlla). 1. Food Sci. 49: 734-736.
Busconi. L.. Folco, E.J., Martone. C.B. Trucco. R.E. and Sanchez~ J.J. 1989. Fish musclecytoskeletal network: Its special organization ant its degradation by endogenous serineprotease. Arch. Biochem. Biophys. 268: 203-208.
Byrne. P. and Chapman~ D. 1964. Liquid crystalline nature ofphospholipids. Nature. 202:987-988.
Caprioli, A. and Bruner, F. 1993. Microflow particle beam interface for capillary liquidchromatographylMass Spectrometry. Anal. Chem. 65: 1281-1287.
Chang, G.W.. Chang, W.L. and Lew. B.K. 1976. A research note. Trimethylamine-Specificelectrode for fish quality control. 1. Food Sci. 41: 723-724.
Charbonneau. H. 1993. Strategies for obtaining partial amino acid sequence data from smallquantities « 500 pmol) of pure or partially purified protein. In: H A practical guide to proteinand peptide purification for micro sequencing". 2th ed. Matsudaira. P.(Ed.). pp. 17-40.
Cheyne. A. 1975. How the GR Torrymeter aids quality control in the fishing industry. FishNew Intem. 14: 71-76.
Chirife. J. 1994. Specifie solute effect with special reference to Staphylococclis aurells. 1.Food Eng. 22: 409-419.
Chirife.1. and Buera. M.D.P. 1994. Water aetivity, glass transition and mierobial stability inconeentratedlsemi moist food system. A eritieal review. J. Food Sei. 59: 921-926.
Church. F.C.. Swaisgood. H.E.. Porter. D.H. and Catignani. G.L. 1983. Spectrophotometricassay using O-phthaldiaIdehyde for determination~of proteolysis in milk and isolated milkprotein.1. Dairy Sei. 66: 1219-1227.
136
1
{
Claeys~ E.. Uytterhaegen. L.. Buts. B. and Demeyer. D. 1995. Quantification of beefmyofibrillar proteins by SOS-PAGE. Meat Sei. 39: 177-193.
Cliffe. A.1. and Law. B.A. 1991. Time course study of peptide production in acceleratedripened cheddar cheese using reverse phase high performance liquid chromatography. Food.Biotechnol. 5: 1-17.
ConneU~ 1.1., Howgate, P.F.. Madcie, I.M., Sanders, H.R. and Smith. G.L. 1976. Comparisonofmethod ofwet fish. IV. Assessment ofcommercial fish at port market 1. Food Technol. II:297-308.
Conway. E.1. and Byme. A. 1933. An absorption apparatus for the micro-detennination ofcertain volatile substances. 1. The micro-determination of ammonia. Biochemic. 1. 27: 41 9429.
Cordoba. J.1.. Antequera~ T., Garcia.. C.. Ventanas, 1.. Lapez-Bote. C. and Asensio, M.A.1994. Evolution offree amino acid and amines during ripening of Iberian cured ham. J. Agric.Chem. 42: 2296-2301.
Corlette, D.A. Jr. and Brown., M.H. 1980. PH and acidity. In:" Microbial Ecology ofFoods".Silliker, J.H.(Ed.). Vol. L, Chap 5. Academie Press Inc., New York. pp. 213-265.
Cotter. RJ. 1980. Mass spectrometry ofnonvolatile compound desorption from extendedprobes. Anal. Chem. 52: 1589A-1606A.
Covery, T.R.. Huang E.C., Henio~ J.O. 1991. Structural characterization of protein trypticdigest via liquid chromatography mass spectrometry and collision induced dissociation oftheirdoubly charged molecular ion. Anal. Chem. 63: 1193-1200.
Creighton, T.E. 1983. Proteins: Structure and Molecular Principles. Freeman~ W.H. andcompany. New York. pp 33-34
Crouse. J.O.. Koohmaraie, M. and Dickson~ 1.S. 1991. Storage and bacterial contaminationeffected on myofibrillar proteins and shear force ofbeef. J. Food Sei. 56: 903-905.
Dainty, R.H., Shaw, S.G. and Robert. T.A. 1983. Microbial and ehemical changes in chilistored red meal. In: "Food Mierobiology-Advances and Prospect". Roberts. T.A. andSkinner, f.A. (Eds.). Academie Press~ London. pp. 151- 178.
Dainty, R.H., Shaw, S.G.. De Boer, K.A. and Seheps, E.S.J. 1975. Protein changes causedby baeterial growth in beef. J Appl. Baet. 39: 73 -8 1.
Davidson. C.M.. Dowdell, M.J. and Bord, R.G. 1973. Properties ofgram-negative aerobes
137
(
(
isolate from meat. 1. Food Sei. 38: 303-305.
Davis. B.l. 1964. Ann. New York Acad. Sei. 121: 404-427.
Davis, C.E. and Anderson, 1.B. 1984. Size exclusion HPLC of heated water soluble bovineand porcine muscle proteins. J. Food Sei. 49: 598-602.
DeMasi, T.W., WardIaw, F.B., Dick R.L. and Aeton.. lC. 1990. Nonprotein nitrogen (NPN)and free amino acid content ofdry, fennented and non fennented sausage. Meat Sei. 27: 1-12.
Dhananjaya, S. and Stroud, G.D. 1994. Chemical and sensory changes in haddock and herringstored under modified atmosphere. Int.1. Food Sei. Tech. 29: 575-583.
Dias. J., Nunes. M.L. and Mendes. R. 1994. Effect offrozen storage on the chemical andphysical properties ofblack and sliver scabbard fish. J. Sei. Agne. 66: 327-335
Drabikowski. W .. Gorecka A. and Jakubiec-Puka. A. 1977. Endogenous proteinases invertebrate skeletal muscle. [nt. J. Biochem. 8: 61-69.
Dunn, M.l. 1989. Electrophoretic analysis methods. ln: "Protein Purification Methods. APraetical Approach". Harris. E.L. V. (Ed). and angals. Oxford University Press. New York.pp. 18-64.
Dutson.. T. 1983. Relationship ofpH and temperature to disruption of specifie muscle proteinand activity oflysosomal proteases. 1. Food Biochem. 7: 223-245.
Dyer. 1.W.. French. H. V. and Snow. J.M. 1950. Proteins in fish muscle 1. Extraction ofprotein fractions on fresh fish. 1. Fish Bd. Cano 7: 585-593.
Edward. R.S .. Dainty. R.H. and Hibbard. C.M. 1985. Putrescine and cadaverine formationin vacuum packed beef J. Appl. Bacteriol. 58: 13-19.
EI-Marrakchi. A.. Bennour. M., Bounchriti. N., Harnarna, A. and Tagafait. H. 1990. Sensory.chemieal and microbiological assessments of Moroccan sardines (sardilla pilchards) storedin ice. 1. Food Prat. 53: 600-605.
Endo. A., Murakawa. S .. Shimizu. H. and Shiraishi. Y. 1987. Purification and properties ofcollagenase from a streptomyces species. 1. Bioehem. 102: 163-170.
Eriekson. M. C.. Gordon, D.T. and Anglemier. A.f. 1983. Proteolytie aetivity in thesarcoplasmie fluid of parasitized Pacifie Whiting (Merluccius producills) and unparasitizedtrue cod (Gadus macrocephalus). J. food Sei. 48: 13 15- 13 17.
138
l
(
Eskin. N.A.M. 1990. Bioehemistry of Foods. 2th Edition. San Diego. Academie Press [nepp. 151-327.
Espe, M., HaaIand. H. and Njaa.. L.R. 1992. Substitution of fish silage protein and free aminoaeid mixture for fish meal protein in a chieken diet. J. Sei. Agrie. 58: 315-319.
Etherington. D.1. 1981. Enzyme action in the eonditioning ofmeat. In:" Proteinases and Theirlnhibitors: Structure. Funetion and Applied Aspect". Turk. V. and VitaL L. (Eds.). Pergamonpress. London. pp. 279-300.
Etherington. D.1. 1984. The contribution of proteolytic enzymes to postmortem changes inmuscle. 1. Anim. Sei. 59: 1644-1649.
Etherington. D.1.• Taylor, M.A. and Dransfield. E. 1987. Conditioning of meat From differentspecies. Relationship between tenderizing and level of cathepsin B. Cathepsin L. Calpain I.Calpain II and B-glucoronidase. Meat Sei. 20: 1-18.
Farrel.1. and Rose. A.H. 1968. Cold shoek in mesophilic and psychrophilic pseudomonads.J. Gen. Microbiol. 50: 450-455.
Feng. R.. Konishi. Y. and Bell A.W. 1991. High aceuracy molecular weight determination andvariation charaeterization ofprotein up to 80 KD by ionspray mass speetrometry. 1. Arn. Soc.Mass Spectrom. 2: 382-410.
Franks. F. 1991. Water activity: A credible measure offood safety and quality ? Trends inFood Sei and TeehnoJ. pp. 68-72.
Fritz. J.O., Swartz. O.R. and Greaser. M.L. 1989. Factors affecting polyacrylamide gelelectrophoresis and electroblotting of high-molecular-weight myofibrillar proteins. Anal.Biochem. 180: 205-210.
Fujimaki. M. and Deatherage, F.E. 1964. Chromatographie fractionation of sarcoplasmicproteins ofbeef skeletal muscle on ion-exchange cellulose. 1. Food Sei. 29: 316-326.
Fullmer. C.S. and Wassennan. R.H. 1979. Analytical peptide mappening by high performanceliquid chromatography. Application to bovine and chick intestinal calcium-binding proteins.J. Biol Chem. 254: 7208-7212.
Gallagher. 1.. Kanekanian. A.O. and Evans, E.P. 1994. Hydrolysis of casein: A comparativeoftwo proteases and their peptide map. Int. J. Food Sei. Technol. 29: 279-285.
Gardner. G. A. and Stewart. D.J. 1966. Changes in the free amino and other nitrogeneompounds in stored beefmuscle.l. Sei. Food Agne. 17: 491-496.
139
«
(
Gaughran, E.R.L. 1947. The thermophilic micro-organisrns. Bacterial. Rev. Il: 189-225.
Gelman. A.. Pasteur, R. and Rave. M. 1990. Quality changes and storage life ofeomman carp(cyprilllls carpio) at various storage ternperatures. J. Sci. Agne. 52: 231-247.
Gill. C.O. 1979. A review: Intrinsic bacteria in meat. J. Appl. Bacteriol. 47: 367-378.
Gill. C.O. 1986. The control of microbial spoilage in fresh meats. In:" Advanees in MeatResearch". Vol. II. Meat and POllltry Mierobiology. Persan. A.M. and Olltson. T.R. (Eds.).Westport. Connecticut. AVI Pllbl. Co. Inc. pp. 49-88.
Gill. C.O. and Newton, K.G. 1978. The eeology ofbacterial spoilage offresh meat at chilItemperature. Meat Sei. 2: 207-217.
Gill. C.O. and Newton, K.G. 1980. Growth ofbaeteria on meat at room temperature. l Appl.Bacteriol. 49: 315-323.
Gill. T.A.. Keith. R.A. and Smith-LaU. B. 1979. Texturai deterioration of red hake andhaddock muscle in frozen storage as related to chemical parameters and changes in themyofibrillar protein. 1. Food Sei. 44: 661-667.
Glass, K.A. and Doyle, M.A. 1991. Relationship between water aetivity of fresh pasta andtoxin production by proteolytie Clostridium botulinum. 1. Food Proto 54: 162-165.
GolL D.E., Otsuka. Y.. Nagainis, P.A.. Shannon. 1.D.. Sheridhar, K.S. and Muguruma. M.1983a. Role of muscle proteinases in maintenance of muscle integrity and mass. 1. FoodBiochem. 7: 137-177.
GolL D.E.. Robson. R.M. and Stromer. M.H. 1977. Muscle proteins. In:"Food proteins"Whitaker. J.R. and Tannenbaum. S.R. (Eds.). AVI Publ. Co.. Westpon. CT. pp. 123- [43
Goll. D.E.. Shannon, J.O.• Edmunds. T.E.. Sathe. S.K.. KIeese. W.C. and Nagainis. P.A.1983b. Properties and regulation of the Cal· -dependent proteinase. Bernard B. de et al.(Ed.). Elsevier. North Holland Biomedical. New York. pp 755-800.
Gould. E. 1971. Part 1. On testing the freshness offrozen fish. Gould. E. and Peters. lA.(Eds.). Fishing News Book Ltd.. London. pp. 7-70.
Grandi~r-Vazeille, X. and Tetaert. O. 1984. Methodology for purification of largehydrophobie peptides by high-perfonnanee liquid chromatography. 1. Chromatogra. 296: 301308.
Grau. F.H. 1986. Meat and poultI)' mierobiologicaI, microbial eeology ofmeat and poultry.
140
(
{
In: aAdvances in Meat Researeh". Pearso~ A.M. and Dutson, T.R. (Eds.). MaeMillian Publ..Basingstoke. EngIand. pp. 1-47.
Gray, J.I. 1978. Measurement oflipid oxidation: A review. 1. Am. Oil Chem. Soc. 55: 539546.
Gray. R.J.H. and Sorhaug, T. 1983. Response. regulation and utilization and microbiaIactivities at low temperature. In: .... Food Mierobiology. Economie Microbiology". Vol. 8.Rose. A.H. Ed. Academie press, New York Chap. l. pp. 1-35.
Greer. G.G. 1989. Red meats. poultry and fish in enzymes of psychrotrophs in raw food.McKellar R.C. Ed. CRC press. Boea Raton. FL. Chap. Il. pp 267-292.
Haard, N.f 1995. Composition and nutritive value of 6sh proteins and other nitrogencompounds. In: '''Fish and Fishery Produets~ Composition, Nutritive Properties and Stability"Ruiter. A. (Ed.). CAB International. UK. pp .120-365.
Hamm, R. 1977. Postmortem breakdown of ATP and glycogen in ground muscle: A reviev..·,Meat Sei. l: 15-39.
Hanus, F.1. and Morita, R. Y. 1968. Significance of the temperature characteristic ofgrowth.1. Baeterio. 95: 736-737.
Harrington. D.B. 1960. Time offlight spectrometry. In:" Encyclopaedia ofSpectroscopy"Clark, C.F. (Ed.). Reinhold. New York. pp. 628-647.
Harrington. M.G. and Henahan. M.M. 1982. Studies of sareoplasmic proteins by sodiumdodecyl sulfate polyacrylamide gel electrophoresis. Proc. 28th Europ. Meet. Meat Res.Workers 1: 63-68.
Hanree. E.f. 1972. Detennination ofprotein: A modification of the lowry method that givesa linear photometric response. Anal. Biochem. 48: 422-427.
Hay. J.O.. Currie. R. W. and Wolfe. F.H. 1973. Polyacrylamid disc gel electrophoresis offreshand aged chicken muscle proteins in sodium dodecyl sulfate. J. Food Sci. 38: 987-990
Hayes. R.R. 1992. Food spoilage. In: .. Food Microbiology and Hygiene'·. 2th Ed.. Elsevierapplied science. London. Chap. 3. pp 1-25.
Hisano. T.. Abe. T.S., Michio. W.. Akira.. K. and Kousaku, M. 1989. Isolation and propertiesof a collagenase with caseinolytic activity from pseudomonas spp. 1. Fermentation Bioeng.68: 399-403.
141
(
(
Hjorth-Hansen. S. and Bakken, K. 1947. Investigations on analytical methods for estimationof ammonia and methylamines in fish. Reports from the Norwegian Fisheries ResearchLahoratory. 1: 6-10.
Hobbs. G. 1983. Microbial Spoilage of fish. In: "'Food Microbiology". Roben, T.A. andSkinner. F.A.(Eds.). Academie Press. London. pp.2 17-229.
Hobbs. G. 1987. Microbiology offish. In ., Essay in agricultural and Food Mierobiology"Noms. 1.R. and Pettipher. G.L. Wiley. pp. 199-226.
Hodgekiss. W. and Jones. N.R. 1955. The free amino acids offish. Biochem. 1. 61: 4-5.
Hoffman, A.. Disney. J.G.. Pinegar. A. and Cameron~ J.D. 1974. The preservation ofsomeEast- African freshwater fish. Afr. 1. Trop. Hydrobiol. Fish. 3: 1-13.
Holland, J.F., Allison, C.G.. Stuits, J.T.. Pinkston. J.D., Newcome. B. and Watson. J.T. 1983.Mass spectrometry on the chromatographie time scale: Realistic expectations. Anal. Chem.55: 997A-112A.
Howard~ G.A. and Martin, A.J.P. 1950. The separation of the C1!-C 11l fatty acids by reveredphase partition chromatography. Biochem. J. 46: 532-538.
Howgate. P.F. 1982. Quality assessment and quality control. In:" Fish Handling andProcessing'" 2nd ed. Aitken A. et al.. (Eds.). Her Majesty Stationary. Edinburgh. pp. 177186.
Huang. T.S .. Marty. R.. MarshalL R. and Wei. C.I. 1995. Identification of red snapper(Lutjalllls lampechal1l1s) using electrophoresis techniques. J. Food Sei. 60: 279-283.
Ikeuchi. Y.• ho. T. and Fukazawa. T. 1980. Change in the properties ofmyofibrillar proteinsduring postmortem storage of muscle at high temperature. J. Agne. Food Chem. 28: 11971202.
Imafidoo' G.I. and Sosulski. F.W. 1990. Non nitrogen content of animal and plant foods. 1.Agrie. Food Chem. 38: 114-118.
Jahus. F.O.. Howe. J.L.. Codury. R.J. and Rand, A.G.Jr. 1976. A rapid visual enzyme test toassess fish freshness. Food Technol. 30: 27-30.
Jay. J.M. 1964. Beefmierobial quality determination by extract release volume (ERV). FoodTechnol. 18: 1637-1641.
Jay, J.M. 1987. The tentative recognition ofpsyehrotrophic gram-negative bacteria in 48h by
142
(
(
their surface growth at 10 oC. Int. J. Microbiol. 4: 25-32.
Jay. J.M. 1992. Low-temperature food preservation and characteristics of psychrotrophiemicroorganisms. In: "Modem Food Microbiology·'. pp. 314-334.
Jay. 1.M. and Hollingshed. A.M. 1990. Two methods for determining extract release volume(ERV) offresh and spoilaged beefand poultry meat. 1. Food Sei. 55: 1475-1476.
Jiang, S.H. and Lee, T.C. 1985. Changes in free amino acids and protein denaturation offishmuscle during frozen storage. 1. Agric. Food Chem. 33: 839-844.
Jin. Y.K. and Park. Y.W. 1996. SOS-PAGE ofproteins in goat milk cheese ripened underdifferent conditions. J. Food Sei. 61: 490-494.
Kalchayanand, N.. Rays, B.. Field, R.A. and Johnson. M.C. 1989. Spoilage of vacuumpackaged refrigerated beefby Clostridium. J. Food Proto 52: 424-426.
Kamin-Belsky. N.. Brillon. A.A.. Arav. R. and ShakIai, N. 1996. Degradation ofmyosin byenzymes of the digestive system: Comparison between native and oxidative cross-linkedprotein. 1. Agne. Food Chem. 44: 1641-1645.
Karas. M. and HilIenkamp, P. 1988. Laser desorption ionization of proteins with moleeularmass exeeeding 10000 daltons. Anal. Chem. 60: 2299-2301
Kata. H.. Rhue. M.R. and Nishimura T. 1989. Role offree amino aeids and peptides in foodtaste. ln" Flavor Chemistry. Trends and Developments". Teranishi, R.T., Buttery. R.G. andShahidi. F. (Eds.). AmerieanChemieal Society: Washington. O.C. pp. 158-174.
Kim. H.J. and Haering, C. 1994. Evaluation ofprotein cross-linking and biodegradability bydetennination oftryptophan released by pronase using reversed-phase HPLC with photodiodearray detection. 1. Agne. Food Chem. 42: 915-918.
Kim. Y.A. and Barbeau. W.E. 1991. Evaluation of SOS-PAGE for estimating proteindigestibility. 1. Food Sei 56: 1082- 1086.
Kimberly. Y. and Flurkey. W.H. 1986. Effect offreezing and mierowave heating on proteinsfrom eodfish fillets: Analysis by SDS polyacrylamide gel eleetrophoresis. 1. Food Sei. 51.508-509.
Kirk, R.S. and Sawyer. R. 1991. Pearson's composition and analysis of food. 9th edition.Kirk. R.S. and Sawyer. R. eEds.). Longman Scientifie and Technical. New York. NY. p. 440502.
143
(
(
Kirschke. H. and Barret.. A.J. 1987. Chemistry oflysosomal proteinases. In: "Lysosome: TheirRole in Protein Breakdown'·. Glaumann. H. and Ballard. F.l. (Eds.). Academie Press.London. pp. 193-240.
Klotz. C.. Leger. 1.1 .. Marotte. F. and Mendes. H. 1978. The separation of the myosin lightchains on agarose beads. Biochem Biophys Acta 532: 369-372.
Konosu. S., Hamoir, G. and Pechere, 1.F. 1965. Carp myogens of white and red muscles:properties and amino acid composition of the main low molecular weight components ofwhite muscle. Biochem. J. 96: 98-112.
Koohmaraie, M. 1992. The role of ca:!'-dependent protease (CaIpains) ln postmortemproteolysis and meat tendemess. Biochimie 74: 239-243.
Koohmaraie. M.. Babiker. A.S .. MerkeL R.A. and Dutson. T.R. 1988a. Role of Ca·' dependant proteases and lysosomaI enzymes in postmortem changes in bovine skeletaI muscle.1. Food Sci. 53: 1253-1257.
Koohmaraie, M.. Crouse. 1.0. and Mersmann. H.J. 1989 Acceleration of postmortemtenderization in bovine carcasses through infusion ofcalcium chloride: Effect of concentrationand ionic strength. J. AnÏm. Sci. 67: 934-942.
Koohmaraie. M.. Kennick. W.H.. Anglemier. A.f.. Eigasim. E.A. and Jones. T.K. 1984a.Effect of postmonem storage on cold-shonened bovine muscle: Analysis by SDSPolyacrylamide gel eIectrophoresis. J. Food Sci. 49: 290-291.
Koohmaraie. M.. Kennick. W.H.. EIgasim. E.A. and Anglemier. A.F. 1984b. Effect ofpostmortem on muscle proteins degradation: anaIysis by SDS-polyacrylamide gelelectrophoresis. J. Food Sci. 49: 292-293.
Koohmararie. M.. Schollmeyer. J.E. and Outson. T.R. 1986. Effect of low calciumrequirement calcium activated factor on myofibrils under varYÎng pH and temperatureconditions. J Food Sci. 51: 28-32.
Koohmaraie. M.. Seidamn. S.C. and Crouse.J.O. 1988b. Effect ofsubcutaneous fat and hightemperature condition on bovine meat tendemess. Meat Sci. 23: 99-109
Koohmaraie. M.. Seidman. S.C .. Schollmeyer. J.E.. Outson, T.R. and Babiker. A.S. 1988c.Factors associated with the tendemess ofthree bovine muscles. J. Food Sci. 53: 407-410.
Koohrnararie. M.. Seideman. S.C., Schollmeyer. J.E.. Outson. T.R. and Crouse. J.O. 1987.Effect of postmortem storage on Ca---dependent proteases. their inhibitor and myofibrilfragmentation. Meat Sei. 19: 187-196.
144
&
(
Koohmaraie, M., Whipple, G. and Crouse, J.O. 1990. Acceleration of postmonemtenderization in lamb and Brahman-cross beef carcasses through infusion of Cael:!. 1. AnimSei. 68: 1278-1283.
Kraft. A.A. 1992. Health hazards vs. Food spoilage. In:"" Psyehrotrophic Bacteria in Food:Oisease and Spoilage. Elsevier Science Publ. New York. pp85-225.
Kwan, K.K.H., Nakai. S., Skura, B.1. 1983. Comparison of four method for determiningprotease activity in milk absorbence at 280 manometers, the lowey method. thefluorescanmine method, and trinitrobenzene sulphonie aeid method. J . Food Sci. 48: 14181421.
Laird. W.M., Madcie, LM. and Ritehie. A.H. 1982. Differentiation of species of fish byisoeleetric focusing on agarose and polyacrylamide gels- eomparison. 1. Assn. Publ. Anal. 20:125-135.
Lambert, A.D., Smith, J.P. and Dodds, K.L. 1991. Shelf life extension of microbiologicalsafety offresh meat- A review. Food Microbiology 8: 262-297.
Lan, Y.H., Novakofski, J., Carr. T.R. and McKeith. F.K. 1993. Assay and storage conditionsaffect yield of salt soluble protein from muscle. J. Food Sci. 58: 963-967.
Lasalle, F.. Robson. R.M., Lusby, M.L.. Porerish, F.C .. Stroemr, M.H. and Huiatt. T.W.1983. Loealization of tinin in bovine skeletal: muscle by immunotluorescence andimmunoeleetron microscope labelling. J. CeH Biol. 97: 258a (Abstraet).
Lasta. J.A., PenseI. N., Mosana. M., Rodrignez, H.R. and Carcia. P.T. 1995. Microbialgrowth and biochemical changes on naturally contaminated ehilled-beef subcutaneous adiposetissue stored aerobicaIly. Meat Sei. 39: 149-158.
LeBlance. E.L. and LeBlance, R.J. 1989. Separation of eod (Gadus morhua) fillet protein byelectrophoresis and HPLC after various frozen storage treatments. 1. Food Sei. 54: 827-834.
Lee. K.D. and Warthesen, 1.1. 1996. Mobile phase in reversed-phase HPLC for detenninationofbiter peptides in cheese. J. Food Sei. 61: 291-294.
Lee. Y.H. and Chang. H.W. 1990. Production of alkaline protease by Baci/lus Licheniformi.\·in an aqueous two-phase system. J. Fermentation Bio. Eng. 69: 89-92.
Lemieux, L. and Amiot. J. 1989. Application of reversed phase high performance liquidchromatography to the separation of peptides from phosphorylated and dephosphorylatedcasein hydrolysates. J. Chromatogr. 473: 189-206.
145
1 Lerke, P.A. and Bell, L.D. 1976. A rapid fluorometric method for the determination ofhistamine in canned tuna. J. Food Sei. 41: 1282-1284.
Libera. L.D., Betto, R. and Carraro, U. 1984. Separation ofmyosin light ehains by reversedphase high perfonnance liquid ehromatography on wide pore supports. J. Chromatogra. 299:293-300.
Lin, T.M. and Park., J.W. 1996. Protein Solubility in pacifie whiting affect by proteolysisduring storage. 1. Food Sci. 61: 536-539.
Little, E.L., Jean Sonne, M.S. and Foley, J.P. 1991. Sequential rnultimodal elution for pseudornultidimensionalliquid ehromatography on a single eolumn. Anal. Chem. 63: 33-44.
Lobley, G.E. and Lovie, J.M. 1979. The synthesis of myosin, actin and the major proteinfractions in rabbit skeletal muscle. Biochem. J. 182: 867-874.
Loo, lA., Udset~ H.R. and Smith. R.D. 1989. Peptides and protein analysis by eleetronsprayionization mass spectrometry and capillary eleetrophoresis mass speetrometry. Anal.Bioehem. 179: 404-412.
Lopez-Bote, C., Warriss, P.O. and Brown, S.N. 1989. The use of muscle protein solubilitymeasurement to assess pig lean meat quality. Meat Sei. 26: 167-175.
Loung, J.H.T., Male, K.B. and Huynh, M.D. 1991. Application of polarography forassessment offish freshness. J. Food Sei. 56: 335-340.
Loung, J.H.T.. Male, K.B. and Nauyer. A.L. 1989. Application of polarography formonitoring the fish postmortem metabolite transformation. Enz. Minob. Technol. Il: 277281.
Lowry, O.H., Rosebrough, N.J.. farr, A.L. and Randall, R.1. 1951. Protein measurement withthe Folin phenol reagent. J. Biol. Chem. 193: 256-275.
Lusby, M.L., Ridpath., J.F., Ir. and Robson, R.M. 1983. Effeet of postmortem storage ondegradation of the myofibrillar protein titin in bovine longissimus muscle. J. Food Sei. 48:1787-1790.
Machado, M.G.S. and Sgarbieri. V.C. 1991. Partial characterization and nutritionai value ofproteins from paeu (Colossoma mitrei. Berg 1895). J. Agne. Food Chem. 39: 1715- 1718
Maekey. a.M. and Kerridge, A.L. 1988. The effeet ofineubation temperature and inoculumsize on growth ofsalmonellae in minced beef Inter. J. Food Micro. 6: 57-65.
146
(
(
Mackie. LM. 1969. Identification of fish species In modified polyacrylamid diseelectrophoresis technique. J Assn. Publ. Anal. 7: 83-87.
Maclcie, LM. 1972. Sorne improvements in the polyacrylamide disc electrophoresis methodofidentifying the species of cooked fish. J. Assn. Publ. Anal. 10: 18-20.
Mackie. LM. 1980. A review of sorne recent applications of electrophoresis and isoelectricfocusing in the identification ofspecies offish and fish produets. In" Advances in Fish Scienceand Technology". ConneiL 1.1. Ed. Fishing New Books. London. pp 444-451
Maeda. O.. Ojima. T. and Nishit~ K. 1992. Calpain II like proteinase of scallop(Patinopecten Yessoensis) striated adduetor muscle. Comp. Biochem. Physio. 102B: 149-153.
Maia. E.L.. Rodrignez-Amaya. O.B. and Moraes, M.A.C. 1983. Sensory and chemicalevaluation of the keeping quality of the Brazilian fresh-water fish prochilodus scrofe in icestorage. J. Food Sci. 48: 1075-1077.
Makinen, M.. Gregg, G.B. and Kang, S. 1985. Structure and mechanism ofcarboxy peptidaseA. In:" Advances in Inorganic Biochemistry". Elichhom. G.L. and Marzilli. L.G. (Eds.).Elsevier Science Pub!. New York. pp.63-90.
Makinodan, Y., Hirotsuka. M. and Ikeda S. 1979. NaturaI proteinases of carp muscle. J. FoodSei. 44: 1110-1 113.
Maruayam~ K., Kimura, S.. Toyota, N. and Ohashi. K. 1980. Connection and elastic proteinofmuscle. In: .. Fibrous Protein: Scientific Industrial and Medical Aspect". Pawry, D.A.O..Creamer, L.K. (Eds.). Academie Press. London. pp. 33-41.
Mates. A. 1983. Microbiological survey of frozen ground meat and proposed standard. J.Food Prat. 46: 87-89.
Matsubara. H. and Ferler. J. 1971. The enzyme. Vol. 3, 3 rd. Boyer. P.O. (Ed.). AcademiePress.. New York. pp. 721-733.
Matsukura, U .. Okitani, A. Nishimuro. T. and Kato, H. 1981. Mode of degradation ofmyofibrillar proteins by endogenous protease. cathepsin L. Biochem. Biophys. Acta. 622: 4147.
Matthews, A.O., Park, G.R. and Anderson. E.M. 1979. Evidence for the formation ofcovalent cross-Iinked myosin in frozen-stored cod minces. ln .. Advances in Fish Science andTechnology". Connell~ 1.1. (Ed.). Fishing News Book Ltd. Publ., Famham, England. pp. 438465.
147
(
{
McCormick. R.J.• Reeck G.R. and Kropt: D.H. 1988. Separation and identification ofporcine sarcoplasmic proteins by reversed phase high performance liquid chromatography andpolyacrylamide gel electrophoresis. J. Agric. Chem. 36: 1193-1196.
McKellar. R. C. 1984. Comparison of the hide powder azure and casein-trinitrobenzenesulfonic acid methods for determining proteolysis in skim milk (psychrotrophic origin inspoilage). 1. Food Prot. 47: 476-480.
McMeekiIL T.A. 1982. Microbial spoilage ofmeat. ln:" Development in Food Microbiology"Davies. R.(Ed.). Applied Science Publ. London. pp. 1-40.
Mikami. M.. Whiting, A.. Taylor. M .. Maciewicz.. R. and Etherington. D. 1987. Degradationof myofibrils from rabbit. chicken and beef by cathepsin Iysates. Meat Sci. 2 1: 8 1-97.
Miller. A.J., Ackerman. S.A. and Palumbo. S.A. 1980. Effect of frozen storage onfunctionality ofmeat for processing. J. Food Sei. 45: 1466-1471.
Minagawa. E.. Kaminogawa. S.. Tshukasaki. F. and Yamauchi. K. 1989. Debitteringmechanism in bitter peptides of enzymatic hydrolysis from milk casein by aminopeptidase T.J. Food Sei. 54: 1225-1229.
Molina, 1. and Toldià, F. 1992. Detection of proteolytic activity in microorganism isolatedfrom dry-cured harn. J. Food Sci. 57: 1308-1310.
Morihara.. K. and Tsuzuki. H. 1971. Comparative study ofvarious neutral proteinases frommicroorganisms: specificity with oligopeptides (Asperigllus orydIe). Arch. Biochem. Biophys.146: 291-296.
Morin. J. F. 1989. Determination of K value by Biosenser. In:" Advance in FisheriesTechnology and Biotechnology for Increased profitability". Voigt. N.N. and Botta. J. R.(Eds.). pp.481-485.
Morita. R. Y. 1975. Psychrophilic bacteria. Bacteriol Rev. 39: 144-167.
Mossel. D.A.A. 1971. Physiological and metabolic attributes of microbial groups associatedwith foods. J Appl. Bacteriol. 34: 95-118.
Mozersky. S.M.. Valentine. K.M.. Gugger. R.E. and Tunick, M. 1981. Further observationon the chrornatography ofmyosin preparation on hydroxyapatite. 1. Chromatogra. 207: 395402.
Murch. S.1.. Bruce. H.L. and BalI. R.O. 1992. Rapid separation and quantification ofmyofibrillar proteins by high perfonnance gel chromatography. Food Res. Inter. 25: 109-1 15.
148
1
(
Naguib, K.. Ayesh, A.M. and Shalaby. A.R. 1995. Studies on the determination ofbiogenicamines in food. 1 development of a TLC method for the determination of eight biogenicamines in fish. 1. Agric. Food Chem. 43: 134-139.
Nakagawa, T.. Watabe, S. and Hashimoto. K.. 1988a. Electrophoresis analysis ofsarcoplasmic proteins from fish muscle on polyacrylamide gels. Bull. Jap. Soc. Sci. Fish 54:993-998.
Nakagawa, T.. Watabe, S. and Hashirnoto. K. 1988b. Identification of three major componentin fish sarcoplasmic proteins. Bull. Jap. Soc. Fish. 54: 999-1004.
Negishi. H.. Yamamoto. E. and Kuwata, T. 1996. The origin of the 30 kDa componentappearing during post-mortem ageing of bovine muscle. Meat Sci. 42: 289-303.
Nortjè. G.L.. Nel, L.. 10rdaan.. E.. Badenhorst, K.. Goedhart, E. and HolzapfeL W.H. 1990.The aerobic psychrotrophic population on meat and meat contact surface in meat productionsystem and on meat stored at chili temperatures. 1. Appl. Bact. 68: 335-344.
Nortjè, G.L.. Nel. L., 10rdaan. E.. Naudè, R.T., Holzapfel, W.H. and Grimbeek. R.1. 1989.A microbiological survey of fresh meat in the supermarket trade. Part 1: Carcasses andcontact surface. Meat Sci. 25: 81-97.
Ohashi, E.. Okamoto. M.. Ozawa A. and Fujita. T. 1991. Characterization of common squidusing several freshens indicators. J Food Sci. 56: 161-163. 174.
Okitani. A.. Matsumoto. T.. Kitamura, Y. and Kato, H. 1981. Purification of cathepsin 0from rabbit skeletal muscle and its action towards myofibrils. Biochem. Biophys. Acta. 662:202-210.
Oison. D.G.. Parrish, F.C .. Dayton. W.R. and Goll. D.E. 1977. Effect ofpostmortem storageand calcium aetivated factors on the myofibrillar proteins ofbovine skeletal muscle. 1. FoodSci. 42: 117- 124.
Osm~ M.A.. Ashoor. S.H. and Paul. C.M. 1987. Liquid chromatographic identification ofcommon 6sh species. 1. Assoc. Off Anal. Chem. 70: 618-625.
Ouali. A. 1992. Proteolytic and physicochemical mechanisms involved in meat texturedevelopment. Biochimie 74: 251-265.
Ouali. A., GarelL N., Obled, A.. DevaI. C.. Valin. C. and Penny, I.F. 1987. Comparativeaction of cathepsins D, B, H and L and of a new Iysosomal cysteine proteinase on rabbitmyofibrils. Meat Sei. 19: 83- 100.
149
(
(
Owusu-Ansah, Y.J. and Hultin. H.O. 1986. Chemical and physical changes in red hake flUetsduring frozen storage. J. Food Sei. 51: 1402- 1406.
O'Hare. M.l. and Nice. E.C. 1979. Hydrophobie high-performance liquid chromatographyofhormonal polypeptides and proteins on alkylisilane bonded silica. J. Chromatogr. 171: 209226.
Palumbo. S.A. 1985. Is refiigeration enough to restrain food born pathogens? 1. Food Prot.49: 1003-1009.
Pan. B. S. 1989. Recovery of shrimp waste for flavourant. In: ,. Advances in FisheriesTeehnology and Bioteehnology for Increased Profitability··. Voigt. N.M. and Botta. 1.R.(Eds.). pp. 437-447.
Park. S. Brewer. M.S. McKeith. F.K.. Bechtel, P.J. and Novakofski. J. 1996. Compositionof surimi-like material from beef or pork. J. Food Sei. 61: 717-720.
Patterson. lT. and Gibbs, P.A. 1977. Incidence and spoilage potential of isolates fromvacuum packaged meat ofhigh pH value. J. Appl. Bacteriol. 43: 25-38.
Pedrosa, A.M. and Regenstein. J.M. 1988. Shelf life extension of fresh fish- A review Part......
I-Spoilage offish. J. Food Quality. Il: 117- 127.
Pedrosa, A.M. and Regenstein. J.M. 1990. Shelflife extension offresh fish- A review. Part111- Fish quality and method of assessment. J. Food Quality. 13: 209-223.
Penny. I.F. 1980. The enzymology of conditioning. In ., Developments in Meat Science-I"Lawrie R. (Ed.) Appl. Sei. Publ., London. pp. 115-130.
Perez De Castro. B.. Asensio. M.A.. Sanz, B. and Ordonez, J.A. 1988. A method to assessthe bacterial content ofrefrigerated meat. Applied and Environ. Micro. 54: 1462-1465.
Petrides. P.E.. Jones. R.T. and Sahlen. P. 1980. Reversed-phase high performance liquidchromatography ofprotein: the separation ofhemoglobin chain variants. Anal. Biochem. lOS:383-388.
Pivnick. H. Erdman, I.E.. Collins-Thompson. D.. Robert. G.. Johnstone. M.A.. Conley. O.R..Lachapelle. G.. Purvis, V.T. and Foster. R. 1976. Microbiological standards for ground beefbased on a Canadian survey. J. Milk Food Technol. 39: 408-412.
Polo. M.C.. Gonzalez de Liano and Ramos. M. 1992. Determination and liquidchromatographie separation of peptides. ln "Food Analysis by HPLC". Nollet. L. Ed. MarcelDekker. New York, NY. p. 117-125.
150
(
(
Porzio, M.A. and Pearson, A.M. 1979. Instability of SDS-denatured proteins prepared frommuscle myofibrils. Meat Sei. 3: 255-260.
Prieto, M., Garei~ M.L., Garei~ M.R.. Gtero, A. and Moreno. B. 1991. Distribution andevolution ofbaeteria on Lamb carcasses during aerobic storage. 1. Food Proto 54: 945-949
Raghunath, M.R.. Sackar. T.V.. Ammu, K. and Devadasan. K. 1995. Biochemieal andnutritional changes in fish proteins during drying. 1. Sei. Food Agric. 67: 197-204.
Ragnarsson. K., and Regenstein, 1.M. 1989. Changes in electrophoresis patterns of gadoidand non-gadoid 6sh muscle during frozen storage. 1. Food Sei. 54: 819-823.
Rampton, 1.H., Anglemier. A. F. and Montgomery. M.W. 1965. Fractionation of Bovinesarcoplasmie proteins by DEAE-eellulose chromatography. 1. Food Sei. 30: 636-640.
Reddy. N.R.. Villanveva, M. and Kautter, D.A. 1995. Shelf life of modified atmospherepackaged Tilapia filIets stored under remgeration and temperature abuse conditions. 1. FoodProt. 58: 908-914.
Regnier, F.E. and Gooding., K.M. 1980. High performance liquid chromatography ofproteins.Anal. Biochem. 103: 1-25.
Reimerdes, E.H. and Klostermeyer. H. 1976. Determination of proteolytie aetivities on caseinsubstrate. Method Enzymol. 45: 26-28.
Reppond. K.O. and Collins, 1. 1983. Pacifie cod (Gadus macrocephalus): changes in sensoryand chemica1 properties when held in carbon dioxide modified refiigerated sea water. 1 FoodSei. 48: 1552-1553.
Rinehart, K.L. 1982. Fast atom bombardment mass spectrometry. Science 218: 254-260.
Ritchner. D., Lee, M.H. and Hill. D. 1941. The rate of removal of amines from the bloodBiochem. J. 35: 1225-1230.
Robbins, F.M., Walker,1., Cohen.. S. and Chatterjee. S. 1979. Action ofproteolytic enzymeson bovine myofibrils. J. Food Sei. 44: 1672-1677, 1680.
Robinson, S.D. 1987. Enzyme-catalysed hydrolysis ofprotein. ln:" Food Biochemistry andNutritional Value". Longman Scientific and Technical. New York. pp. 210-322.
Rose, A.H. 1968. Physiology ofmicroorganisms at low temperatures. J. Appl. BacteriaL 31:1-11.
151
(
(
Ryder. J.M.. Buisson. O.H.. Scott. D.N. and Fletcher. G.C. 1984. Storage of New-ZeaIandmackerel (Trachurus nova =e/andiae) in ice: chemicaI. microbiological and sensoryassessment. l Food Sei. 49: 1453- 1456.
Salm. C.P.. Forrest. le.. AberIe. E.D.. Mills. E.W.. Snyder. A.C. and Judge. M.O 1983Bovine muscle shoning and protein degradation after eleetrical stimulation. excision andchilling. Meat Sci. 8: 163- 183
Savage. A.W.1.. Richardson. R.I.. JoUey. P.D.. Hargin. K.O. and Stewan. C.A. 1995Investigation of methods to deteet mechanically recovered meat in meat produets-II. geleleetrophoresis. Meat Sei. 40: 303-317.
Sayem-EI-Daher. H. and Simard. R.E. 1985. Putrefaction amine changes in relation tamicrobial count ofground beefduring storage. 1. Food Proto 48: 54-58.
Schaich. K.M. 1980. Free radical initiation in proteins and amino aeids by ionization andultraviolet radiation and lipid oxidation. mFree radical transfer from oxidizing lipids. Crit.Re\". Food Sei. Nutr. Chem. 13' 189-244.
Schreurs. F.1.G.. Van der Heide. D.. Leenstra. F.R. and \Vit de. \V. 1996 Endogenousproteolytic enzymes in chicken muscle. Differences among strains with different gro\\tlh ratesand protein efficiencies. Poultry Sei. 74: 523-537.
Schreurs. V. V.A.M.. Boekholt. H..~ and Koopmanschap. R.E. 1983. Gel filtration in sodiumdodecyl sulphate of hydrophobie muscle proteins on sephaeryl S-400 superfine. JChromatogra. 254: 203-210.
Schwartz.. N.!\'. and Brid. J. \V C. 1977 Degradation of myofibrillar proteins by cathepsinsBand D. Biochem. 1. 167: 811-820
Schwimmer. S. 1995. Fifty one years of food related enzymes research- a review 1 FoodBiochem. 19: 1-25.
Scopes. R.K. 1977. Multiple enzyme purifications from muscle extracts by using affinityelution chromatographie procedures. Biochem. 1. 161. 265-277
Scott. O.:!\i .. Fletcher. G.C .. Hoge. M.G. and Ryder. 1.M. 1986. Comparison ofwhole withheading and guned orange roughly stored in ice: Sensory. microbiology and chemicalassessment. J. Food Sei. 51 79-83.
Seymour. 1.1.. Cole. M.B. and Coote. P.J. 1994. A substrate-mediated assay of bacteriaJproton effiux/influx ta prediet the degree of spoilage of beef mince stored at chilitemperatures. 1. Appl. Bact. 76: 608-615.
152
(
(
Shelef L_A and Jay. lN. 1970. Use oftitrimetric method to assess the baeteriaJ spoilage offresh beef Appl. \ficrobiol. 19: 902-905.
Shelet: L.A.. and Jay. J_M. 1971. Hydration capacity as an index of shrimp microbiaJ quaJityJ. Food Sei. 36: 994-997
Shewan. lM. 1962_ The bacteriology offresh and spoiJage fish and sorne related chemicaIchanges. In: "Recent Advances in Food Science'· Hawthom. J and Leitch. 1.(Eds)Butterworths. London. pp. 167-193.
Shewan.lM.. Gibson. O.M. and Murray. C.K. 1971. The estimation oftrimethylamine in fishmuscle. In:'~Fish Inspection and Quality Control" Kreuzer. R_ (Ed.) Fishing 'ev,/s (Book)Ltd. London- pp 183-186.
Shimizu. E .. Kiguchi. S. and Yorifuji. T. 1989. A simple approximation of weight-basedprotein measurement \\'ith HPLC apparatus. Agric_ Biol. Chem. 53 2801-2803
Smith. O.S. and Kitts. 0.0. 1995. Enzyme immunoassay for the determination ofOomie acidin mussell extracts. J Agric. Food Chem 43: 367-371
Startuszkie\vicz.. \\'.F. and Bond. lF. 1981. Gas Chromatographie determination ofcadaverine putrescine histamine in food. 1. Assoc. Off. Anal. Chem. 64: 584-591.
Sutherland. J.P .. Gibbs. P.A.. Patterson. 1.T. and Murray.1.G. 1976. Biochemical changesin vacuum packaged beef occurring during st0 rage at 0-2cC. 1. Food Technol. 11 171-1 80
Tang. 1. and \\'ong. R_~.5 1987 Evolution in the structure and function of aspanicproteinases. J CeH Biochem. 33 53-63
Tapia-de-Daza. \15 .. \·-ùlegas. Y.. and \1artinez.. A. 1991. Minimal water activity for gro'hthoflisteria monocytogenes as affeeted by solute and temperature. Int. J Food Microbiol 14333-337
Tarladgis. B.G.. Person. A.M and Dugan. L.R. 1962 The chemistry of the 2-thiobarbituricacid test for the detennination ofoxidative rancidity in food. 1. Sorne important side reaetion1. Am. Oil Chem. Soc. 39' 34-39
Taylor. S.L. 1983. Monograph on Histamine poisoning Comminee of Food HygieneFAOfWHO CX/FH 83/1 1. FAO· Rome.
Trevor. P 1991. Cnderstanding Enzymes. 3 th Ed- Ellis Harwood_ ;\;TD pp 87-88
Ushio. H. And \\'atabe. S. 1994. Carp sarcoplasmic reticulum changes due to heat treatment
153
1
(
J Food Sci 59· 80-84
C~tterhaegen.L.. Cfaeys. E. and Demeyer. D. 1994. Effect of exogenous protease effect onbeef tendemess development and myofibrillar degradation and solubility J Arum Sei 721209-1223
Ventanas. 1.. Cérdoba. 1.1.. Antequera. T .. Gareia. C .. Lôpez-Bote. C and Asensio. \1:\1992 Hydrolysis and maillard reaetion during ripening of Iberian haro. 1. Food Sci 57 813815.
\\7ang. K.. ~cClure. 1. and Tu. A. 1979 Titin: Major myofibrillar component of strainedmuscle. Proc. ~atl. Acad. Sei C.SA. 76 2698-3702
\Vang. S.F.. Abouzied. \1.\1. and Smith. D.~1. 1996 Protein as potential endpointtemperature indicators for ground beef panies. J Food Sci 61 5-7
\Vard. OP 1983 Proteinases ln:"\1icrobial Enzymes and Biotechnology" Forgarrhy. \\" \1(Ed.) Applied science Publ ~ew York 251 -317
\Vatabe. S .. Hwang. GC. Cshio. H.. Hatae. K.. Yamanaka. H. and Hashimoto. K 1990Acceleration of physicochemicaJ change in carp muscle by washing in either chilled or heatedv..·ater. J Food Sci. 55· 674-677
\\·atson.. TB] 1985 Introduetionto \fassSpectrometry. RavenPress. ~ewYork 1-16
\Vesthoff. D and Felstein. F 1976 Baeteriological analysis of ground beef J \filk Technol39 401-404
\\"olf. \\' 1.. Sehaer. \f.L and Abbott. TP 1994 ~onprotein nitrogen content of defanedjojoba mea1s J Sci Food .-\gric 65 177-188
\\·ong. ~ P. Damieo. J ~ and Sal\\in.. H 1967 Investigation of volatile compounds in codfish by gas chromatography and mass speetrometry J. Assac Off Agric Chem 50 8- 15
Xiong.. y L and Anglemier. A.F 1989 Gel electrophoresis analysis of protein changes inground beefstored at 1=C J Food Sci 54 187-190
Xiong. YL and Brekke. C] 1989 Changes in protein solubility and gelation propenies ofchicken myofibriIs during storage J Food Sei 54: 1141 -1 146.
Xiong. 'Y.L.. \foody. \VG. Blanchard. SP. Liu. G and Burns. \\'R 1996 Postmonemproteol~1ic and organoleptic changes in hot-boned muscle from grass- and grain-fed andzeranol-implanted cattle Food Res. Int. 19 17-34
154
Yamamoto, K., Samejima, K. and Yusui, T. 1979. Changes produced in muscle proteinsduring incubation of muscle homogenates. 1. Food Sei. 44: 51-55.
Yamanaka, H. 1990. Polyamines as potential indexes for freshness of fish and squid. FoodRev. Int. 6: 591-602.
Yates, L.D., Dutso~ T.R, Caldwell, J. and Carpenter, Z.L. 1983. Effect oftemperature andpH on the post-mortem degradation ofmyofibrillar proteins. Meat Sei. 9: 157-179.
Yen, G.C. and Hsieh, C.L. 1991. Simultaneous analysis ofbiogenic amines in eanned fish byHPLC. J. Food Sei. 56: 158-160.
YowelJ, K. and Flurkey, W.H. 1986. Effeet offreezing and mierowave heating on proteinfram cod 6sh fillets: analysis by SDS-polyacrylamide gel electraphoresis. J. Food Sei 51: 508509.
Yu, L.P. and Lee, Y.B. 1986. Effeet afpostmortem pH and temperature on bovine musclestructure and meat tendemess. 1. Food Sei. 51: 774-780.
Zeece, M.G. and Katoh, K. 1989. Cathepsin D and its effeet on myofibrillar protein: Areview. J. Food Bioehem. 13: 157-178.
Zeece, M.G., Rabson, RM., Lusby, M.L. and Panish, F. C. 1986. Effect of calcium aetivatedprotease (CAF) on bovine myofibrils under different conditions of pH and temperature. 1.Food Sei. SI: 797-803.
Zhu, H., Guo, D.C. and Dancik, B.P. 1990. Purification and charaeterization of anextracellular acid proteinase fram the Ectomycoohizal Fungus Hebeloma Crustiniform. Appl.Enviro. Mierobl. 56: 834-837.
155
IMAGE EVALUATIONTEST TARGET (QA-3)
10 ~ 12.8 1IID25• Lii - IIUJ~
~ :: I~ 111112.2
L.1i:. -
1.1 ~ ~ 11111 2.0
1I111~ LLO ~~ 1.8
111111.25 111111.4 111111.6
1
'---J1l..-...-
- lS0mm ----aJ-......
6"______-.J
APPLIED ~ II\MGE 1_ . ne...=: 1653 East Main Street~....:: Rochester. NY 14609 USA~-== Phone: 7161482-0300
_ ~ Fax: 7161288-5989
C , 993 Applied 1. mage. rne.. Ali Rights Reserved
![UMI - McGill Universitydigitool.library.mcgill.ca/thesisfile27329.pdf · actions in the b~we have examined by in situ hybridization the distribution ofthe ... TyrO[DTrp 8] somatostatine](https://img.pdfslide.net/doc/110x75/5ba2566109d3f2b25b8b9841/umi-mcgill-actions-in-the-bwe-have-examined-by-in-situ-hybridization-the.jpg)