Embed Size (px)
DESCRIPTION
UMTS RF Planning Guidelines
Citation preview
T-Mobile USA, Inc. May 26, 2010 1 of 52 Strictly Confidential and Proprietary
T-MOBILE USA
UMTS RF Planning and Design Guidelines
(Ericsson's equipment)
NOTICE TO READERS
ALL MATERIALS INCLUDED HEREIN ARE COPYRIGHTED AND CONFIDENTIAL UNLESS OTHERWISE INDICATED. The information contained herein is intended only for the person or entity to which it is addressed and may contain confidential and/or privileged material. Any review, retransmission, dissemination, or other use or reliance upon this information by persons or entities other than the intended recipient is prohibited. The information provided herein is subject to protection from disclosure, reproduction and use as set forth in the Mutual Non-disclosure Agreement entered in to by Supplier and T-Mobile USA Inc.
This document is subject to change without notice. Please verify that you are in possession of the most recent version of this document. Copyright © 2006 T-Mobile USA, Inc.
May 26, 2010
T-Mobile USA, Inc. May 26, 2010 2 of 52 Strictly Confidential and Proprietary
Document Summary
Document Version: Version 3.7 Last Revision Date: May 26, 2010 Document Author: Christophe Vidal Contributors: Allan Orbigo
David Siren Jeff Anderson Sharad Sriwastawa TMUS NE Region Engineering Team TMUS South Region Engineering Team TMUS Central Region Engineering Team
TMUS West Region Engineering Team Ericsson’s reviewers: Damian Dimarzio
Jose Ramon Bacas-Malo
(Ericsson's equipment)
T-Mobile USA, Inc. May 26, 2010 3 of 52 Strictly Confidential and Proprietary
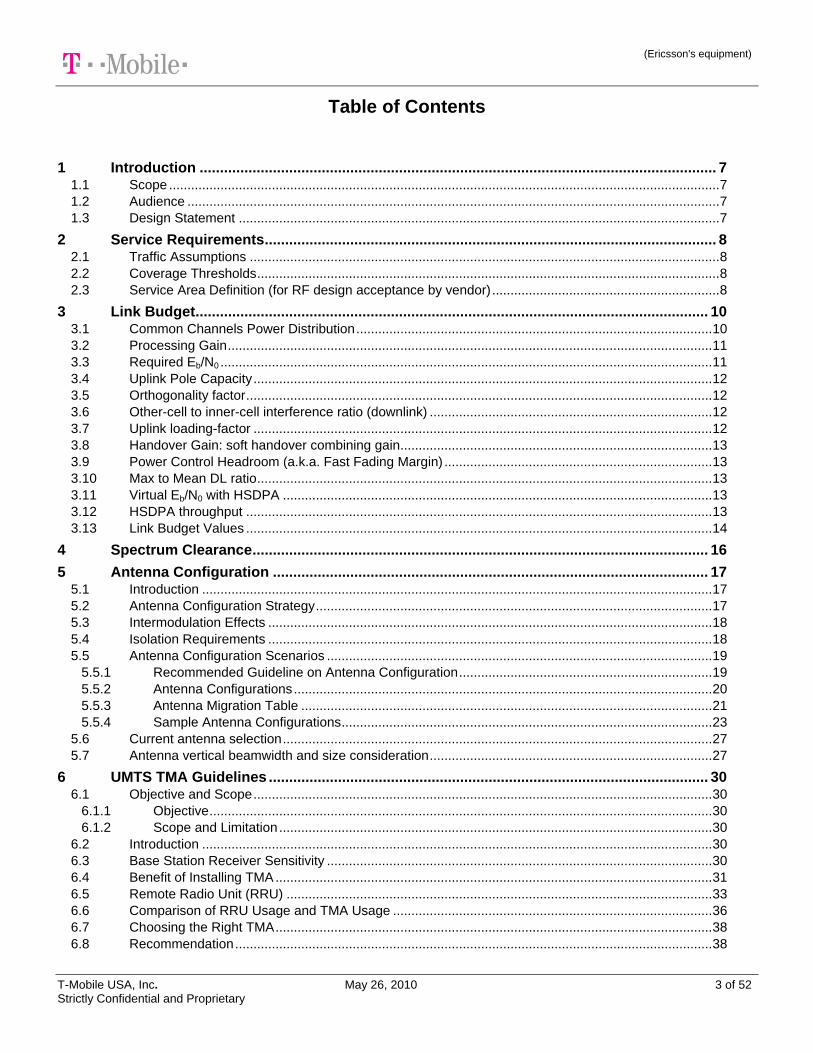
Table of Contents
1 Introduction ............................................................................................................................... 7 1.1 Scope ...................................................................................................................................................... 7 1.2 Audience ................................................................................................................................................. 7 1.3 Design Statement ................................................................................................................................... 7
2 Service Requirements ............................................................................................................... 8 2.1 Traffic Assumptions ................................................................................................................................ 8 2.2 Coverage Thresholds .............................................................................................................................. 8 2.3 Service Area Definition (for RF design acceptance by vendor) .............................................................. 8
3 Link Budget .............................................................................................................................. 10 3.1 Common Channels Power Distribution ................................................................................................. 10 3.2 Processing Gain .................................................................................................................................... 11 3.3 Required Eb/N0 ...................................................................................................................................... 11 3.4 Uplink Pole Capacity ............................................................................................................................. 12 3.5 Orthogonality factor ............................................................................................................................... 12 3.6 Other-cell to inner-cell interference ratio (downlink) ............................................................................. 12 3.7 Uplink loading-factor ............................................................................................................................. 12 3.8 Handover Gain: soft handover combining gain ..................................................................................... 13 3.9 Power Control Headroom (a.k.a. Fast Fading Margin) ......................................................................... 13 3.10 Max to Mean DL ratio ............................................................................................................................ 13 3.11 Virtual Eb/N0 with HSDPA ..................................................................................................................... 13 3.12 HSDPA throughput ............................................................................................................................... 13 3.13 Link Budget Values ............................................................................................................................... 14
4 Spectrum Clearance ................................................................................................................ 16
5 Antenna Configuration ........................................................................................................... 17 5.1 Introduction ........................................................................................................................................... 17 5.2 Antenna Configuration Strategy ............................................................................................................ 17 5.3 Intermodulation Effects ......................................................................................................................... 18 5.4 Isolation Requirements ......................................................................................................................... 18 5.5 Antenna Configuration Scenarios ......................................................................................................... 19
5.5.1 Recommended Guideline on Antenna Configuration ..................................................................... 19 5.5.2 Antenna Configurations .................................................................................................................. 20 5.5.3 Antenna Migration Table ................................................................................................................ 21 5.5.4 Sample Antenna Configurations ..................................................................................................... 23
5.6 Current antenna selection ..................................................................................................................... 27 5.7 Antenna vertical beamwidth and size consideration ............................................................................. 27
6 UMTS TMA Guidelines ............................................................................................................ 30 6.1 Objective and Scope ............................................................................................................................. 30
6.1.1 Objective ......................................................................................................................................... 30 6.1.2 Scope and Limitation ...................................................................................................................... 30
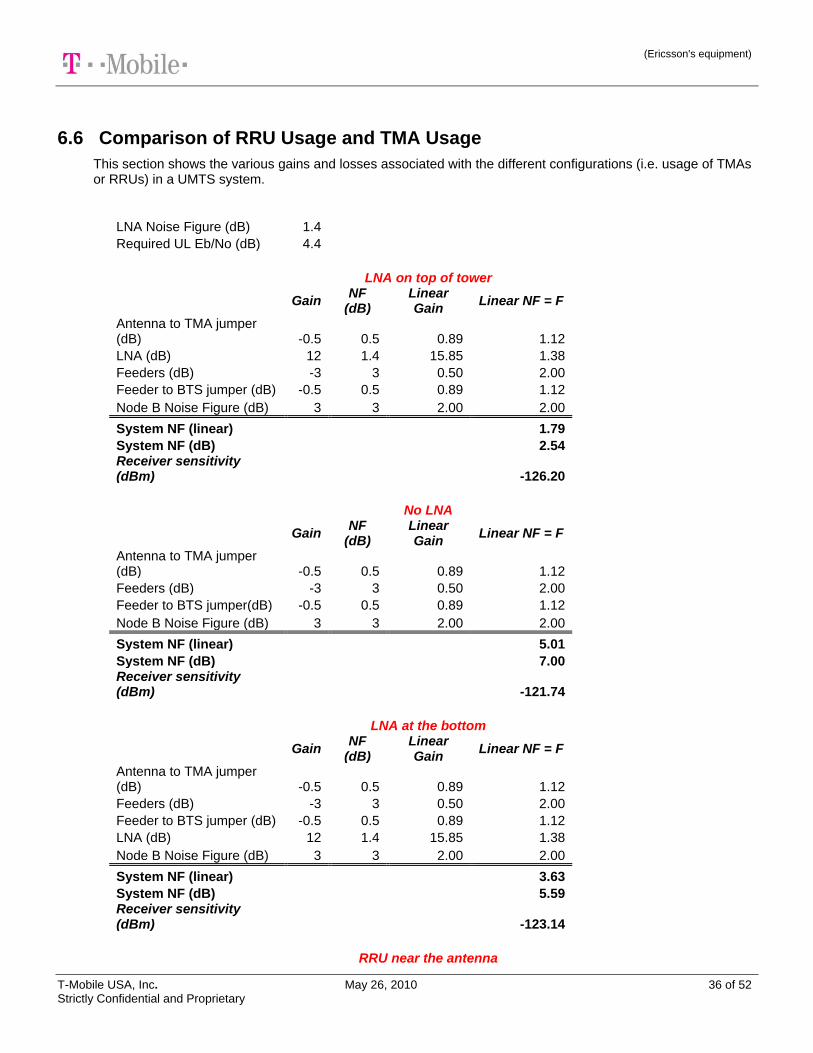
6.2 Introduction ........................................................................................................................................... 30 6.3 Base Station Receiver Sensitivity ......................................................................................................... 30 6.4 Benefit of Installing TMA ....................................................................................................................... 31 6.5 Remote Radio Unit (RRU) .................................................................................................................... 33 6.6 Comparison of RRU Usage and TMA Usage ....................................................................................... 36 6.7 Choosing the Right TMA ....................................................................................................................... 38 6.8 Recommendation .................................................................................................................................. 38
(Ericsson's equipment)
T-Mobile USA, Inc. May 26, 2010 4 of 52 Strictly Confidential and Proprietary
6.9 Current TMA selection .......................................................................................................................... 39
7 Site location and design criteria ............................................................................................ 40
8 Indoor Coverage ...................................................................................................................... 41 8.1 Indoor coverage by outdoor sites .......................................................................................................... 41 8.2 Indoor coverage by repeaters ............................................................................................................... 42 8.3 Indoor coverage by dedicated indoor sites ........................................................................................... 42 8.4 Summary on indoor coverage ............................................................................................................... 42
9 Repeaters ................................................................................................................................. 44
10 Scrambling Code Planning ..................................................................................................... 45
11 Planning and Design process ................................................................................................ 46 11.1 Step 1: 2G site audits ............................................................................................................................ 46 11.2 Step 2: 2G site database check ............................................................................................................ 46 11.3 Step 3: 3G site database and 3G blueprint ........................................................................................... 46 11.4 Step 4: 2G traffic audit .......................................................................................................................... 46 11.5 Step 5: Link budget ............................................................................................................................... 46 11.6 Step 6: Setting parameters for coverage analysis and Monte-Carlo simulation ................................... 47 11.7 Step 7: Verification ................................................................................................................................ 47 11.8 Step 8: Iterations ................................................................................................................................... 47 11.9 Step 9: Finalize ..................................................................................................................................... 47 11.10 Step 10: Automatic Cell Planning (ACP) .............................................................................................. 48 11.11 Step 11: Data transfer to Ericsson ........................................................................................................ 48
12 Appendix A .............................................................................................................................. 49 12.1 Definitions ............................................................................................................................................. 49 12.2 References ............................................................................................................................................ 50
13 AWS Band ................................................................................................................................ 51
(Ericsson's equipment)
T-Mobile USA, Inc. May 26, 2010 5 of 52 Strictly Confidential and Proprietary
List of Figures
Figure 1: Noise Figure improvement at different TMA gains ........................................................................................... 33 Figure 2: Typical RRU installation. Fiber optic cables are practically lossless so the 3 dB feeder loss (typical case) is
eliminated. RRUs are connected to the antenna via short jumper cables. ............................................................. 35 Figure 3: TMA and RRU usage comparison ................................................................................................................... 37
(Ericsson's equipment)
T-Mobile USA, Inc. May 26, 2010 6 of 52 Strictly Confidential and Proprietary
List of Tables
Table 1: Coverage thresholds values (acceptance targets) .............................................................................................. 8 Table 2: Coverage thresholds values (internal targets) .............................................................................................. 8 Table 3: Power settings (without HSDPA) ....................................................................................................................... 10 Table 4: Power settings (with HSDPA) ............................................................................................................................ 10 Table 5: Link Budget Values for Ericsson‟s Eb/N0 ........................................................................................................... 12 Table 6: HSDPA Values for Ericsson‟s Eb/N0 .................................................................................................................. 14 Table 7: Assumed common values ................................................................................................................................. 14 Table 8: Clutter-dependant orthogonality values (for simulations) .................................................................................. 14 Table 9: Environment dependant values ......................................................................................................................... 15 Table 10: Current antenna selection ............................................................................................................................... 27 Table 11: Receiver sensitivity of various services with and without TMA ....................................................................... 31 Table 12: Current TMA selection ..................................................................................................................................... 39 Table 13: Threshold of the indoor coverage zone ........................................................................................................... 43
(Ericsson's equipment)
T-Mobile USA, Inc. May 26, 2010 7 of 52 Strictly Confidential and Proprietary
1 Introduction
1.1 Scope
This document outlines the RF Planning Guidelines to be used for designing UMTS networks for T-Mobile USA. It provides design requirements and assumptions (e.g. service quality, link budgets, etc) that should be used for planning a UMTS network; it provides the recommended antenna configuration scenarios for co-locating antennas for UMTS on existing GSM sites; the RF network design process is outlined keeping in mind that the UTRAN RF design will be an overlay on the existing 2G GSM network.
It is overall assumed in this document that T-Mobile-USA will be deploying UMTS networks in the 1700 / 2100 MHz band (3GPP band IV).
1.2 Audience
The document is intended for all RF engineers who will be involved in the nominal RF design and cell planning of UMTS networks for T-Mobile USA. The document outlines the steps involved in the design and provides requirements that should be considered as T-Mobile standards for the RF design of a UMTS network.
1.3 Design Statement
T-Mobile will design and deploy an UMTS network across all markets nationwide that will be capable of providing voice and packet data (including HSDPA) services. The design (voice centric but data capable) will be an overlay on the existing GSM network. While designing the UMTS RF network, it should be looked as the design of a next generation network that will eventually become the primary network and carry most of T-Mobile‟s total voice and data traffic. The objective of the design is an UMTS network that will provide same coverage and same or better performance as the current GSM/EDGE network. Within a pre-defined UMTS coverage area, T-Mobile will do an overlay design on the existing GSM sites. Examples of exceptions to the overlay principle would be GSM sites purely built for capacity reasons which may not be needed in the UMTS design. Another exception would be high-sites that would be counter-productive to UMTS design. Other exceptions would be GSM sites which cannot accommodate the extra antennas, lines and equipment for UMTS. GSM sites that are in development (hard cost approved, soft cost approved with on-air dates projected within the launch date of the UMTS network) should also be considered in the UMTS overlay design. As is the case with most initial designs of mobile networks, the minimum requirement of the UMTS network within a pre-defined UMTS design polygon would be to provide in-vehicle coverage for voice service. The primary design objectives and considerations for the UMTS network can be summarized as follows:
1. The UMTS network will be a voice centric, but data capable network 2. Traffic forecast to be used for the design will be based on FP&A projections that will be converted into
users/cell based on the GSM traffic profile. This input will come from the RAN Capacity Planning Group. The goal is to design for a traffic load that is projected for 12 months past launch of the network.
3. UMTS simulations (in the RF Planning tool) will be done for a traffic distribution of up to 60% indoor (depending on the clutter type) and 40% outdoor traffic
4. The UMTS RF network design that will result from the above coverage and capacity requirements will be evaluated for other call mix scenarios i.e. a mix of voice and non-HSDPA data, a mix of voice and HSDPA services etc. This will provide a reasonable estimate of the performance of data services that can be provided by the voice-centric network
(Ericsson's equipment)
T-Mobile USA, Inc. May 26, 2010 8 of 52 Strictly Confidential and Proprietary
2 Service Requirements
2.1 Traffic Assumptions
As mentioned in Section 1.3, this will be based on traffic projections for UMTS provided by the RAN Capacity Planning Group. The methodology of spreading this traffic will be outlined in the internal document named „UMTS Design using Asset 3G‟ [A3G].
2.2 Coverage Thresholds
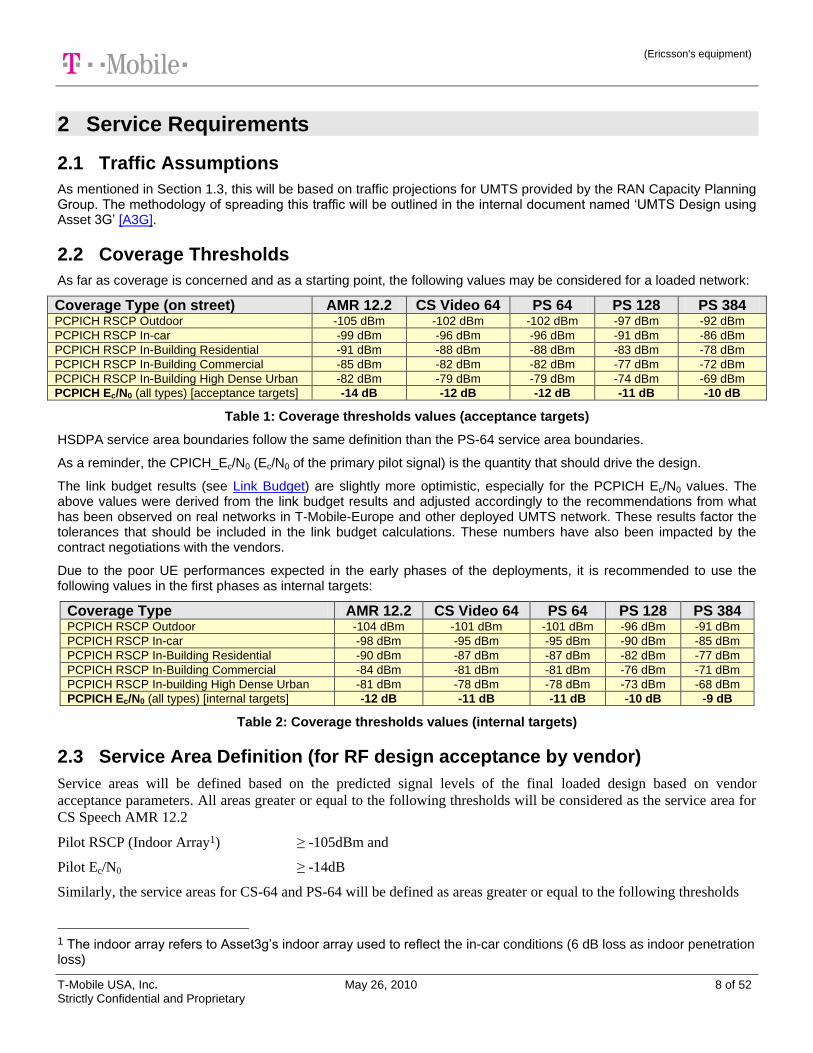
As far as coverage is concerned and as a starting point, the following values may be considered for a loaded network:
Coverage Type (on street) AMR 12.2 CS Video 64 PS 64 PS 128 PS 384 PCPICH RSCP Outdoor -105 dBm -102 dBm -102 dBm -97 dBm -92 dBm
PCPICH RSCP In-car -99 dBm -96 dBm -96 dBm -91 dBm -86 dBm
PCPICH RSCP In-Building Residential -91 dBm -88 dBm -88 dBm -83 dBm -78 dBm
PCPICH RSCP In-Building Commercial -85 dBm -82 dBm -82 dBm -77 dBm -72 dBm
PCPICH RSCP In-Building High Dense Urban -82 dBm -79 dBm -79 dBm -74 dBm -69 dBm
PCPICH Ec/N0 (all types) [acceptance targets] -14 dB -12 dB -12 dB -11 dB -10 dB
Table 1: Coverage thresholds values (acceptance targets)
HSDPA service area boundaries follow the same definition than the PS-64 service area boundaries.
As a reminder, the CPICH_Ec/N0 (Ec/N0 of the primary pilot signal) is the quantity that should drive the design.
The link budget results (see Link Budget) are slightly more optimistic, especially for the PCPICH Ec/N0 values. The above values were derived from the link budget results and adjusted accordingly to the recommendations from what has been observed on real networks in T-Mobile-Europe and other deployed UMTS network. These results factor the tolerances that should be included in the link budget calculations. These numbers have also been impacted by the contract negotiations with the vendors.
Due to the poor UE performances expected in the early phases of the deployments, it is recommended to use the following values in the first phases as internal targets:
Coverage Type AMR 12.2 CS Video 64 PS 64 PS 128 PS 384 PCPICH RSCP Outdoor -104 dBm -101 dBm -101 dBm -96 dBm -91 dBm
PCPICH RSCP In-car -98 dBm -95 dBm -95 dBm -90 dBm -85 dBm
PCPICH RSCP In-Building Residential -90 dBm -87 dBm -87 dBm -82 dBm -77 dBm
PCPICH RSCP In-Building Commercial -84 dBm -81 dBm -81 dBm -76 dBm -71 dBm
PCPICH RSCP In-building High Dense Urban -81 dBm -78 dBm -78 dBm -73 dBm -68 dBm
PCPICH Ec/N0 (all types) [internal targets] -12 dB -11 dB -11 dB -10 dB -9 dB
Table 2: Coverage thresholds values (internal targets)
2.3 Service Area Definition (for RF design acceptance by vendor)
Service areas will be defined based on the predicted signal levels of the final loaded design based on vendor
acceptance parameters. All areas greater or equal to the following thresholds will be considered as the service area for
CS Speech AMR 12.2
Pilot RSCP (Indoor Array1) ≥ -105dBm and
Pilot Ec/N0 ≥ -14dB
Similarly, the service areas for CS-64 and PS-64 will be defined as areas greater or equal to the following thresholds
1 The indoor array refers to Asset3g‟s indoor array used to reflect the in-car conditions (6 dB loss as indoor penetration loss)
(Ericsson's equipment)
T-Mobile USA, Inc. May 26, 2010 9 of 52 Strictly Confidential and Proprietary
Pilot RSCP (Indoor Array1) ≥ -102dBm and
Pilot Ec/N0 ≥ -12dB
The service area for HSDPA services will be the same as that for PS-64.
Exemption areas will be areas which do not meet the above coverage thresholds. Coverage exports of RSCP and Ec/N0
plots will be done in MapInfo and queries will be used to derive the intersection of areas which satisfy both the RSCP
and Ec/N0 conditions. The intersection will define the service areas and the gaps will be the exemption areas.
(Ericsson's equipment)
T-Mobile USA, Inc. May 26, 2010 10 of 52 Strictly Confidential and Proprietary
3 Link Budget One of the first steps for planning consists of evaluating the cell coverage and capacity, insuring a correct balance between uplink and downlink coverage. Link budgets include margins that are prone to interpretations and variations. Link budgets are a start but cannot replace RF planning tools and tuned RF-models, especially in CDMA where Monte-Carlo simulations are needed to include the tight coupling between coverage, quality and capacity. In CDMA, the coverage is uplink-limited, based on the fact that the UE maximum transmitted power is more limited than the power the Node-B is able to deliver to the same UE (assuming no other mobiles). The capacity is downlink-limited, since the Node-B must share its transmitted power between the system information broadcast (common channels) and each UE connected to the cell. Due to the complexity of UMTS with its multiple service capabilities (e.g. speech, video, data transfers) and the limitations of the accuracy of link budgets, it has been decided to focus on a link budget per service type to avoid adding the issue of the call mix. Typically the design should focus on the most constraining service chosen to be provided reliably over all the targeted covered area. As stated in the document preamble, all the link budget terms will not be detailed hereafter. We will focus instead on the newly UMTS required inputs, giving some more explanations on hidden terms when needed.
3.1 Common Channels Power Distribution
Since the design is done as an overlay, we assume a site densification already higher than a phase-one voice-only green-field-network design. The main concern is therefore to control the radio and maximize the capacity.
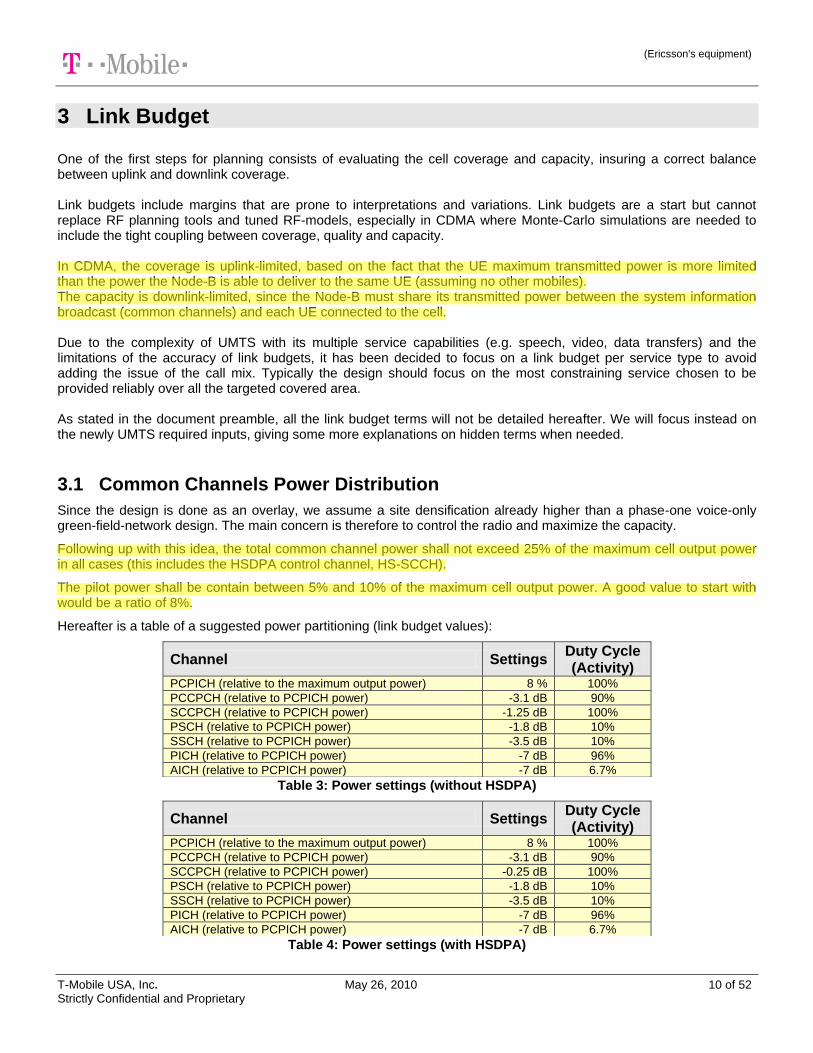
Following up with this idea, the total common channel power shall not exceed 25% of the maximum cell output power in all cases (this includes the HSDPA control channel, HS-SCCH).
The pilot power shall be contain between 5% and 10% of the maximum cell output power. A good value to start with would be a ratio of 8%.
Hereafter is a table of a suggested power partitioning (link budget values):
Table 3: Power settings (without HSDPA)
Table 4: Power settings (with HSDPA)
Channel Settings Duty Cycle (Activity)
PCPICH (relative to the maximum output power) 8 % 100%
PCCPCH (relative to PCPICH power) -3.1 dB 90%
SCCPCH (relative to PCPICH power) -1.25 dB 100%
PSCH (relative to PCPICH power) -1.8 dB 10%
SSCH (relative to PCPICH power) -3.5 dB 10%
PICH (relative to PCPICH power) -7 dB 96%
AICH (relative to PCPICH power) -7 dB 6.7%
Channel Settings Duty Cycle (Activity)
PCPICH (relative to the maximum output power) 8 % 100%
PCCPCH (relative to PCPICH power) -3.1 dB 90%
SCCPCH (relative to PCPICH power) -0.25 dB 100%
PSCH (relative to PCPICH power) -1.8 dB 10%
SSCH (relative to PCPICH power) -3.5 dB 10%
PICH (relative to PCPICH power) -7 dB 96%
AICH (relative to PCPICH power) -7 dB 6.7%
(Ericsson's equipment)
T-Mobile USA, Inc. May 26, 2010 11 of 52 Strictly Confidential and Proprietary
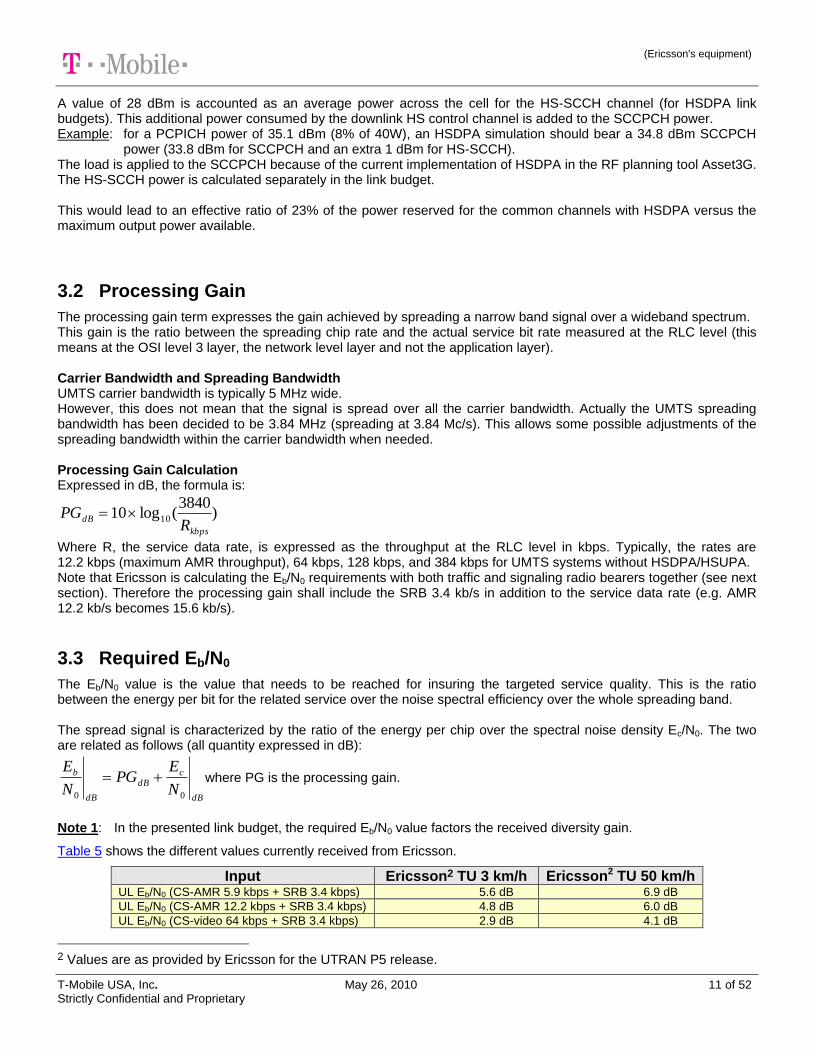
A value of 28 dBm is accounted as an average power across the cell for the HS-SCCH channel (for HSDPA link budgets). This additional power consumed by the downlink HS control channel is added to the SCCPCH power. Example: for a PCPICH power of 35.1 dBm (8% of 40W), an HSDPA simulation should bear a 34.8 dBm SCCPCH
power (33.8 dBm for SCCPCH and an extra 1 dBm for HS-SCCH). The load is applied to the SCCPCH because of the current implementation of HSDPA in the RF planning tool Asset3G. The HS-SCCH power is calculated separately in the link budget. This would lead to an effective ratio of 23% of the power reserved for the common channels with HSDPA versus the maximum output power available.
3.2 Processing Gain
The processing gain term expresses the gain achieved by spreading a narrow band signal over a wideband spectrum. This gain is the ratio between the spreading chip rate and the actual service bit rate measured at the RLC level (this means at the OSI level 3 layer, the network level layer and not the application layer). Carrier Bandwidth and Spreading Bandwidth UMTS carrier bandwidth is typically 5 MHz wide. However, this does not mean that the signal is spread over all the carrier bandwidth. Actually the UMTS spreading bandwidth has been decided to be 3.84 MHz (spreading at 3.84 Mc/s). This allows some possible adjustments of the spreading bandwidth within the carrier bandwidth when needed. Processing Gain Calculation Expressed in dB, the formula is:
)3840
(log10 10
kbps
dBR
PG
Where R, the service data rate, is expressed as the throughput at the RLC level in kbps. Typically, the rates are 12.2 kbps (maximum AMR throughput), 64 kbps, 128 kbps, and 384 kbps for UMTS systems without HSDPA/HSUPA. Note that Ericsson is calculating the Eb/N0 requirements with both traffic and signaling radio bearers together (see next section). Therefore the processing gain shall include the SRB 3.4 kb/s in addition to the service data rate (e.g. AMR 12.2 kb/s becomes 15.6 kb/s).
3.3 Required Eb/N0
The Eb/N0 value is the value that needs to be reached for insuring the targeted service quality. This is the ratio between the energy per bit for the related service over the noise spectral efficiency over the whole spreading band. The spread signal is characterized by the ratio of the energy per chip over the spectral noise density Ec/N0. The two are related as follows (all quantity expressed in dB):
dB
cdB
dB
b
N
EPG
N
E
00
where PG is the processing gain.
Note 1: In the presented link budget, the required Eb/N0 value factors the received diversity gain.
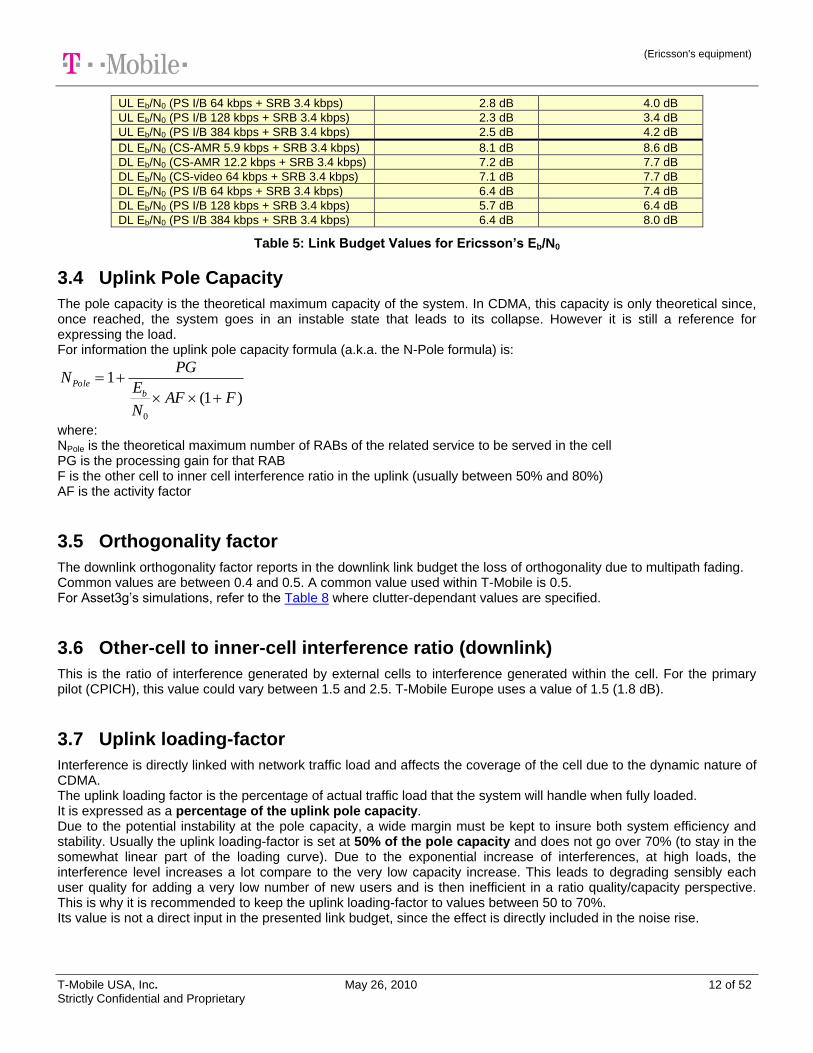
Table 5 shows the different values currently received from Ericsson.
Input Ericsson2 TU 3 km/h Ericsson2 TU 50 km/h UL Eb/N0 (CS-AMR 5.9 kbps + SRB 3.4 kbps) 5.6 dB 6.9 dB
UL Eb/N0 (CS-AMR 12.2 kbps + SRB 3.4 kbps) 4.8 dB 6.0 dB
UL Eb/N0 (CS-video 64 kbps + SRB 3.4 kbps) 2.9 dB 4.1 dB
2 Values are as provided by Ericsson for the UTRAN P5 release.
(Ericsson's equipment)
T-Mobile USA, Inc. May 26, 2010 12 of 52 Strictly Confidential and Proprietary
UL Eb/N0 (PS I/B 64 kbps + SRB 3.4 kbps) 2.8 dB 4.0 dB
UL Eb/N0 (PS I/B 128 kbps + SRB 3.4 kbps) 2.3 dB 3.4 dB
UL Eb/N0 (PS I/B 384 kbps + SRB 3.4 kbps) 2.5 dB 4.2 dB
DL Eb/N0 (CS-AMR 5.9 kbps + SRB 3.4 kbps) 8.1 dB 8.6 dB
DL Eb/N0 (CS-AMR 12.2 kbps + SRB 3.4 kbps) 7.2 dB 7.7 dB
DL Eb/N0 (CS-video 64 kbps + SRB 3.4 kbps) 7.1 dB 7.7 dB
DL Eb/N0 (PS I/B 64 kbps + SRB 3.4 kbps) 6.4 dB 7.4 dB
DL Eb/N0 (PS I/B 128 kbps + SRB 3.4 kbps) 5.7 dB 6.4 dB
DL Eb/N0 (PS I/B 384 kbps + SRB 3.4 kbps) 6.4 dB 8.0 dB
Table 5: Link Budget Values for Ericsson’s Eb/N0
3.4 Uplink Pole Capacity
The pole capacity is the theoretical maximum capacity of the system. In CDMA, this capacity is only theoretical since, once reached, the system goes in an instable state that leads to its collapse. However it is still a reference for expressing the load. For information the uplink pole capacity formula (a.k.a. the N-Pole formula) is:
)1(
1
0
FAFN
E
PGN
bPole
where: NPole is the theoretical maximum number of RABs of the related service to be served in the cell PG is the processing gain for that RAB F is the other cell to inner cell interference ratio in the uplink (usually between 50% and 80%) AF is the activity factor
3.5 Orthogonality factor
The downlink orthogonality factor reports in the downlink link budget the loss of orthogonality due to multipath fading. Common values are between 0.4 and 0.5. A common value used within T-Mobile is 0.5. For Asset3g‟s simulations, refer to the Table 8 where clutter-dependant values are specified.
3.6 Other-cell to inner-cell interference ratio (downlink)
This is the ratio of interference generated by external cells to interference generated within the cell. For the primary pilot (CPICH), this value could vary between 1.5 and 2.5. T-Mobile Europe uses a value of 1.5 (1.8 dB).
3.7 Uplink loading-factor
Interference is directly linked with network traffic load and affects the coverage of the cell due to the dynamic nature of CDMA. The uplink loading factor is the percentage of actual traffic load that the system will handle when fully loaded. It is expressed as a percentage of the uplink pole capacity. Due to the potential instability at the pole capacity, a wide margin must be kept to insure both system efficiency and stability. Usually the uplink loading-factor is set at 50% of the pole capacity and does not go over 70% (to stay in the somewhat linear part of the loading curve). Due to the exponential increase of interferences, at high loads, the interference level increases a lot compare to the very low capacity increase. This leads to degrading sensibly each user quality for adding a very low number of new users and is then inefficient in a ratio quality/capacity perspective. This is why it is recommended to keep the uplink loading-factor to values between 50 to 70%. Its value is not a direct input in the presented link budget, since the effect is directly included in the noise rise.
(Ericsson's equipment)
T-Mobile USA, Inc. May 26, 2010 13 of 52 Strictly Confidential and Proprietary
3.8 Handover Gain: soft handover combining gain
Soft handover gain is achieved due to the fact that when two or more radio links are supporting a communication link, the probability of both (or all) links fading will be small. The soft handover gain is realized though different combining techniques used to process the frames from different paths in soft handover. Soft Handover combining is done at RNC level by using frame selection. Softer Handover combining is done at the Node-B by using maximal ratio combining. The macrodiversity gain can be defined as the difference in the shadow margins experienced when served by only one radio link and when served by multiple radio links. Soft handover gain values can go from as low as 1 dB up to 4 dB. T-Mobile-USA link budget value is 2 dB in the downlink and 1.5 dB in the uplink, as agreed with Ericsson. It must be emphasized that HSDPA may lower the impact of macrodiversity gain since the HSDPA design will limit as much as possible the overlap (there is no soft handover for HS channels).
3.9 Power Control Headroom (a.k.a. Fast Fading Margin)
Power control headroom is a link budget allowance term for fast fading margin in the uplink. This margin is necessary to allow a mobile station at the cell edge to have enough power left to follow the fast fading dips. This margin is most effective for slow moving mobiles. Usual values are going from 1 dB to 5 dB, the lowest values for the highest mobility, and the highest values for low mobile UEs. T-Mobile-Europe is using 2 dB for CS-Speech. We decided to keep 2 dB for all services.
3.10 Max to Mean DL ratio
This ratio is giving a crude representation of the UE distribution in the cell for calculating the mean power used per RAB. As indicated by the name, this number gives the ratio between the maximum value (the UE requiring the most power to maintain its service quality) and the average value across all UEs of the cell.
A ratio of 3 or 5 dB is assumed. Values from 2 to 6 (3 dB to 7 dB) may be assumed depending on the expected UE distribution across the cells.
3.11 Virtual Eb/N0 with HSDPA
The uplink difference between a system without HSDPA and with HSDPA is the introduction of the HS-DPCCH. The power consumed by the HS-DPCCH is inducing higher Eb/N0 requirements to compensate for the diminution of power dedicated to DTCHs. This is calculated from the relative values of the gain factors and leads to adjusted Eb/N0 values.
Currently, the link budget considers an UL-ADCH channel at 128 kb/s, which should be enough for HSDPA-Category-12 UEs. If HSDPA-Category-6 (or better) UEs are used, then the link budget might need to be upgraded to an UL-ADCH at 384 kb/s to allow reaching the maximum possible throughput on the downlink.
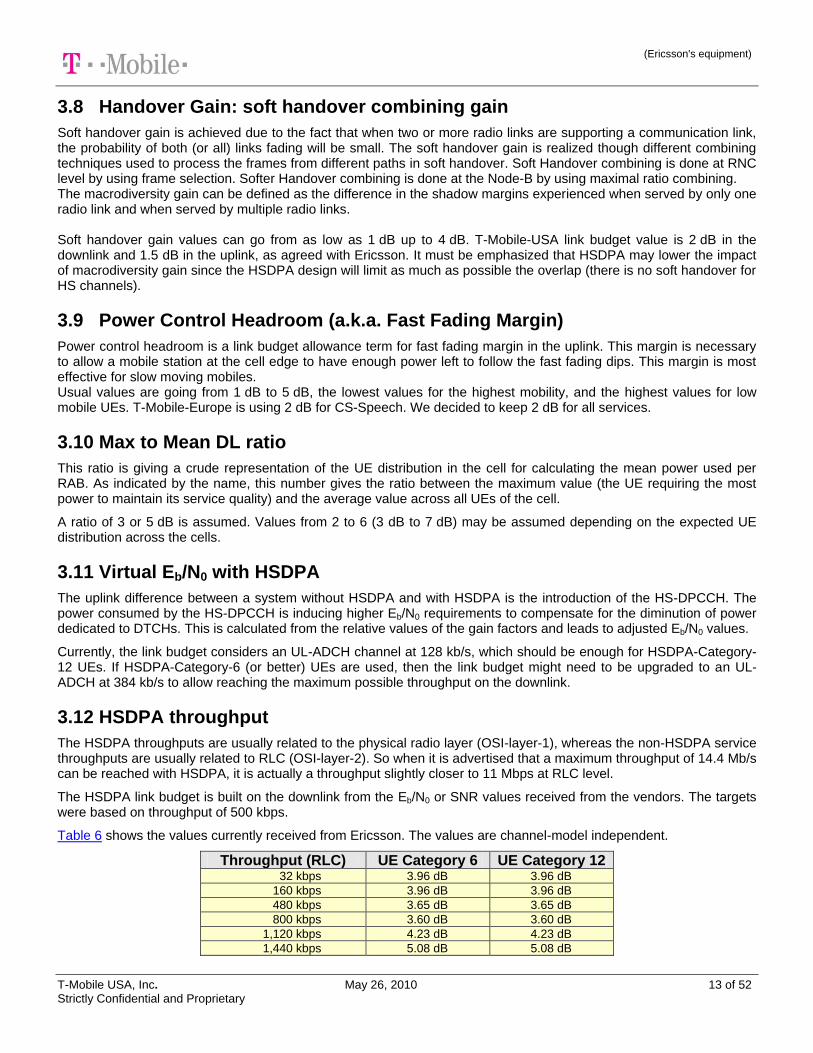
3.12 HSDPA throughput
The HSDPA throughputs are usually related to the physical radio layer (OSI-layer-1), whereas the non-HSDPA service throughputs are usually related to RLC (OSI-layer-2). So when it is advertised that a maximum throughput of 14.4 Mb/s can be reached with HSDPA, it is actually a throughput slightly closer to 11 Mbps at RLC level.
The HSDPA link budget is built on the downlink from the Eb/N0 or SNR values received from the vendors. The targets were based on throughput of 500 kbps.
Table 6 shows the values currently received from Ericsson. The values are channel-model independent.
Throughput (RLC) UE Category 6 UE Category 12 32 kbps 3.96 dB 3.96 dB
160 kbps 3.96 dB 3.96 dB
480 kbps 3.65 dB 3.65 dB
800 kbps 3.60 dB 3.60 dB
1,120 kbps 4.23 dB 4.23 dB
1,440 kbps 5.08 dB 5.08 dB
(Ericsson's equipment)
T-Mobile USA, Inc. May 26, 2010 14 of 52 Strictly Confidential and Proprietary
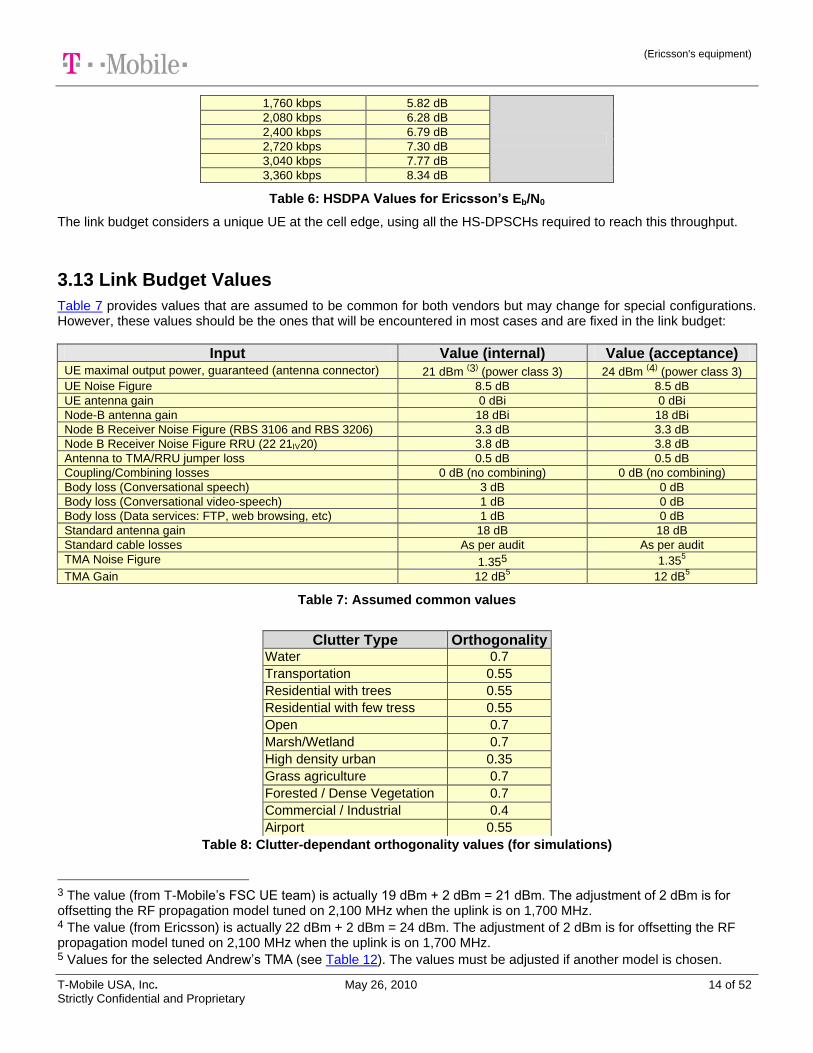
1,760 kbps 5.82 dB
2,080 kbps 6.28 dB
2,400 kbps 6.79 dB
2,720 kbps 7.30 dB
3,040 kbps 7.77 dB
3,360 kbps 8.34 dB
Table 6: HSDPA Values for Ericsson’s Eb/N0
The link budget considers a unique UE at the cell edge, using all the HS-DPSCHs required to reach this throughput.
3.13 Link Budget Values
Table 7 provides values that are assumed to be common for both vendors but may change for special configurations. However, these values should be the ones that will be encountered in most cases and are fixed in the link budget:
Input Value (internal) Value (acceptance) UE maximal output power, guaranteed (antenna connector) 21 dBm
(3) (power class 3) 24 dBm
(4) (power class 3)
UE Noise Figure 8.5 dB 8.5 dB
UE antenna gain 0 dBi 0 dBi
Node-B antenna gain 18 dBi 18 dBi
Node B Receiver Noise Figure (RBS 3106 and RBS 3206) 3.3 dB 3.3 dB
Node B Receiver Noise Figure RRU (22 21IV20) 3.8 dB 3.8 dB
Antenna to TMA/RRU jumper loss 0.5 dB 0.5 dB
Coupling/Combining losses 0 dB (no combining) 0 dB (no combining)
Body loss (Conversational speech) 3 dB 0 dB
Body loss (Conversational video-speech) 1 dB 0 dB
Body loss (Data services: FTP, web browsing, etc) 1 dB 0 dB
Standard antenna gain 18 dB 18 dB
Standard cable losses As per audit As per audit
TMA Noise Figure 1.355 1.355
TMA Gain 12 dB5 12 dB
5
Table 7: Assumed common values
Table 8: Clutter-dependant orthogonality values (for simulations)
3 The value (from T-Mobile‟s FSC UE team) is actually 19 dBm + 2 dBm = 21 dBm. The adjustment of 2 dBm is for offsetting the RF propagation model tuned on 2,100 MHz when the uplink is on 1,700 MHz. 4 The value (from Ericsson) is actually 22 dBm + 2 dBm = 24 dBm. The adjustment of 2 dBm is for offsetting the RF propagation model tuned on 2,100 MHz when the uplink is on 1,700 MHz. 5 Values for the selected Andrew‟s TMA (see Table 12). The values must be adjusted if another model is chosen.
Clutter Type Orthogonality Water 0.7
Transportation 0.55
Residential with trees 0.55
Residential with few tress 0.55
Open 0.7
Marsh/Wetland 0.7
High density urban 0.35
Grass agriculture 0.7
Forested / Dense Vegetation 0.7
Commercial / Industrial 0.4
Airport 0.55
(Ericsson's equipment)
T-Mobile USA, Inc. May 26, 2010 15 of 52 Strictly Confidential and Proprietary
In case a new clutter type would appear in the geographical data, the above table of this document shall be updated. Please contact the FCS / RF Planning team to make it so.
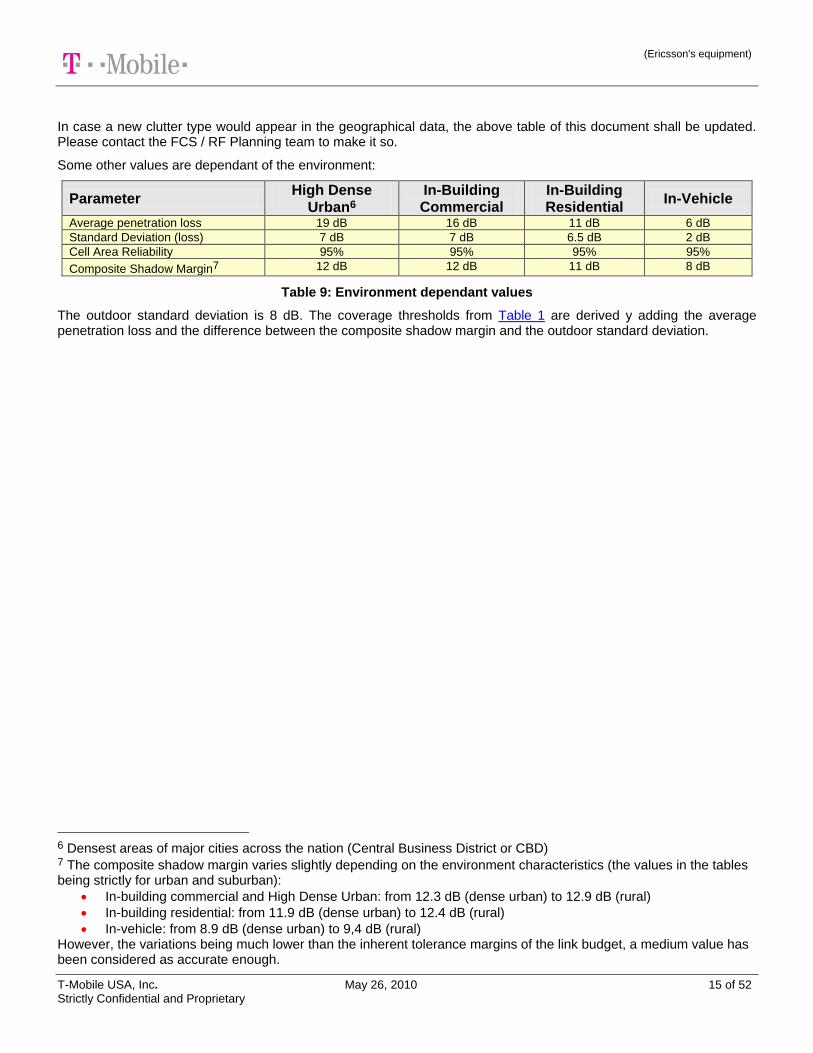
Some other values are dependant of the environment:
Parameter High Dense
Urban6 In-Building Commercial
In-Building Residential
In-Vehicle
Average penetration loss 19 dB 16 dB 11 dB 6 dB
Standard Deviation (loss) 7 dB 7 dB 6.5 dB 2 dB
Cell Area Reliability 95% 95% 95% 95%
Composite Shadow Margin7 12 dB 12 dB 11 dB 8 dB
Table 9: Environment dependant values
The outdoor standard deviation is 8 dB. The coverage thresholds from Table 1 are derived y adding the average penetration loss and the difference between the composite shadow margin and the outdoor standard deviation.
6 Densest areas of major cities across the nation (Central Business District or CBD) 7 The composite shadow margin varies slightly depending on the environment characteristics (the values in the tables being strictly for urban and suburban):
In-building commercial and High Dense Urban: from 12.3 dB (dense urban) to 12.9 dB (rural)
In-building residential: from 11.9 dB (dense urban) to 12.4 dB (rural)
In-vehicle: from 8.9 dB (dense urban) to 9,4 dB (rural) However, the variations being much lower than the inherent tolerance margins of the link budget, a medium value has been considered as accurate enough.
(Ericsson's equipment)
T-Mobile USA, Inc. May 26, 2010 16 of 52 Strictly Confidential and Proprietary
4 Spectrum Clearance The carrier spectrum (5 MHz band per carrier) will be assumed to be cleared. The analysis and clearance will be done most probably by a third-party company. The first analyses shall be available during the design stage since any limitation due to un-cleared spectrum must be included in the design targets.
(Ericsson's equipment)
T-Mobile USA, Inc. May 26, 2010 17 of 52 Strictly Confidential and Proprietary
5 Antenna Configuration
5.1 Introduction
The antenna configuration herein shall recommend various setups to incorporate the UMTS antenna system with the existing GSM system (co-located GSM and UMTS). Configurations using vertically polarized antennas were included for markets who still utilize such antennas. Antenna migration (i.e. change out of current antenna system to prepare for UMTS) is also covered in this document.
It is possible that not all antenna configuration cases will be presented here but the basic matrix is covered. Assumption of 4 antennas per sector as maximum is used. All antenna configurations assume that the number of antenna ports available equals the number of feeder lines that can be installed.
The combining method for the GSM radios is not discussed here as it can vary between vendors and depends on market strategies.
Antenna selection and MHA selection guidelines are covered in a separate document.
5.2 Antenna Configuration Strategy
There are various strategies that can be used to integrate the UMTS antenna system in a co-located GSM site. Each would present its advantages and disadvantages. These include deploying single band, broadband, dual/triple band antennas or some combination that then requires higher performance and more complex duplex or triplex transmit and receive filtering to reduce the co-site interference. The key technical performance implications that have to be considered in these co-location situations include the effect of spurious emissions, intermodulation and receiver blocking. The preferred solution is to have a separate antenna system for UMTS (add a new antenna or free up an existing GSM antenna). The main advantage is that it would allow separate control of antenna configuration (tilt, azimuth, height) for the two systems and better isolation due to space separation between antenna systems. For details on this solution
refer to section 5.5.1. In the worst case (RRUs located away from the antenna), this approach will require more feeder
cables (for additional antenna) or additional losses in the GSM system due to combining of TRXs. In situation where antenna sharing is unavoidable due to certain constraints (e.g. leasing, space limitation, zoning or too much structural loading), the use of wideband cross-polarized antennas are recommended. In this case, cross polarized antennas with four connectors would be preferred, as they would help to reduce the number of separate physical antennas resulting in cost and space reductions. The cross polarized antenna system can be configured without diplexers or with two diplexers depending on the number of feeder lines available. The use of diplexer helps to reduce the number of feeder cables by allowing multiplexing the UMTS 1700/2100 band with the GSM 1900 band on the same feeder. However care should be taken to make sure any losses (which can range from 0.5 dB to about 3.5 dB) are compensated in the link budget. Depending on which specific GSM 1900 and UMTS 1700/2100 transmit frequencies are utilized in the site, it is possible that IM3 products could land on the 5 MHz uplink of the UMTS 1700 carrier. A quantitative analysis of IM products was done as part of the TMA requirements document. Based on the analysis the following cases have been found:
IM product can result in 1.5 dB of degradation in UMTS receiver sensitivity when sharing feeder cables and/or antenna ports among UMTS and GSM systems. While the sensitivity degradation in dB may not seem significant, the issue could become much more serious with imperfect installation and infrastructure aging. Therefore, feeder cable sharing should be avoided.
Because of port-to-port isolation, IM product does not result in degradation in UMTS receiver sensitivity when sharing a dual polarized antenna among UMTS and GSM systems, via separate antenna ports and separate feeder cables.
(Ericsson's equipment)
T-Mobile USA, Inc. May 26, 2010 18 of 52 Strictly Confidential and Proprietary
Another option is the use of wideband antenna covering both the GSM 1900 and UMTS bands (antenna with multiple ports to allow separate UMTS and GSM signals on each port). The pros for a wideband antenna system are the space reduction achieved. Current wideband antenna can provide separate electrically-controlled downtilt control systems with multiple antenna ports having adequate isolation of around 30 dB. The only disadvantage would be the inability to have different azimuth settings between the GSM and UMTS systems.
5.3 Intermodulation Effects
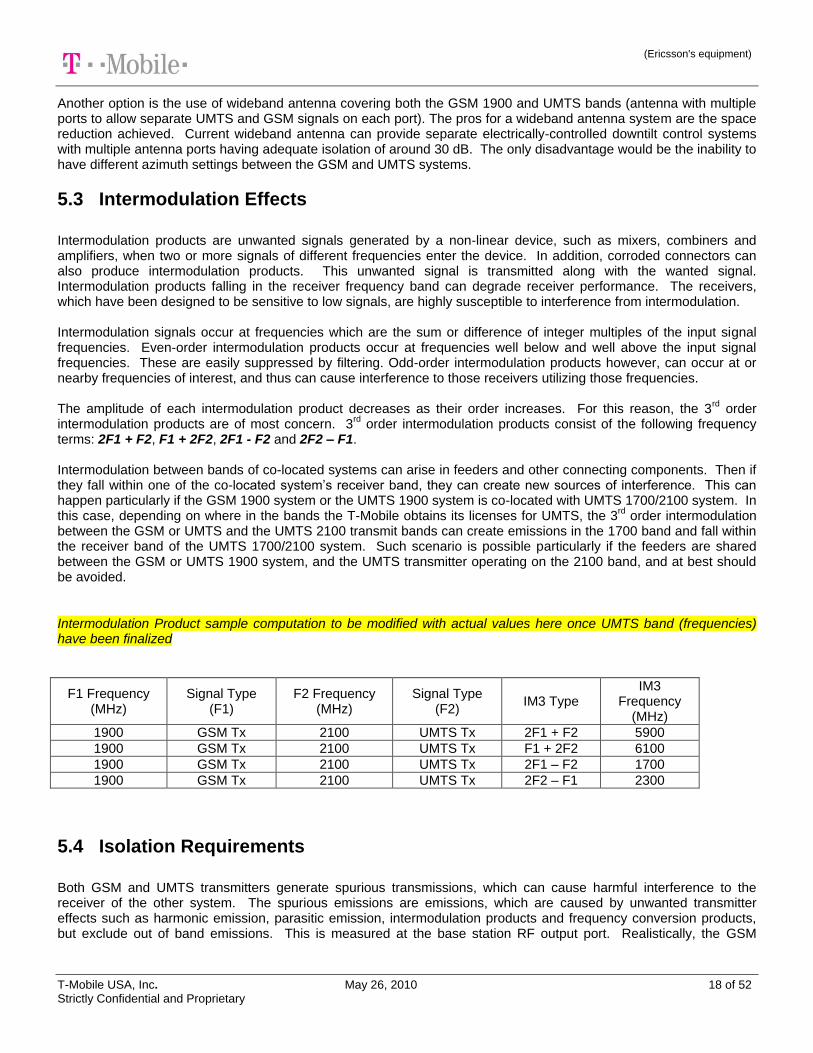
Intermodulation products are unwanted signals generated by a non-linear device, such as mixers, combiners and amplifiers, when two or more signals of different frequencies enter the device. In addition, corroded connectors can also produce intermodulation products. This unwanted signal is transmitted along with the wanted signal. Intermodulation products falling in the receiver frequency band can degrade receiver performance. The receivers, which have been designed to be sensitive to low signals, are highly susceptible to interference from intermodulation. Intermodulation signals occur at frequencies which are the sum or difference of integer multiples of the input signal frequencies. Even-order intermodulation products occur at frequencies well below and well above the input signal frequencies. These are easily suppressed by filtering. Odd-order intermodulation products however, can occur at or nearby frequencies of interest, and thus can cause interference to those receivers utilizing those frequencies. The amplitude of each intermodulation product decreases as their order increases. For this reason, the 3
rd order
intermodulation products are of most concern. 3rd
order intermodulation products consist of the following frequency terms: 2F1 + F2, F1 + 2F2, 2F1 - F2 and 2F2 – F1. Intermodulation between bands of co-located systems can arise in feeders and other connecting components. Then if they fall within one of the co-located system‟s receiver band, they can create new sources of interference. This can happen particularly if the GSM 1900 system or the UMTS 1900 system is co-located with UMTS 1700/2100 system. In this case, depending on where in the bands the T-Mobile obtains its licenses for UMTS, the 3
rd order intermodulation
between the GSM or UMTS and the UMTS 2100 transmit bands can create emissions in the 1700 band and fall within the receiver band of the UMTS 1700/2100 system. Such scenario is possible particularly if the feeders are shared between the GSM or UMTS 1900 system, and the UMTS transmitter operating on the 2100 band, and at best should be avoided.
Intermodulation Product sample computation to be modified with actual values here once UMTS band (frequencies) have been finalized
F1 Frequency (MHz)
Signal Type (F1)
F2 Frequency (MHz)
Signal Type (F2)
IM3 Type IM3
Frequency (MHz)
1900 GSM Tx 2100 UMTS Tx 2F1 + F2 5900
1900 GSM Tx 2100 UMTS Tx F1 + 2F2 6100
1900 GSM Tx 2100 UMTS Tx 2F1 – F2 1700
1900 GSM Tx 2100 UMTS Tx 2F2 – F1 2300
5.4 Isolation Requirements
Both GSM and UMTS transmitters generate spurious transmissions, which can cause harmful interference to the receiver of the other system. The spurious emissions are emissions, which are caused by unwanted transmitter effects such as harmonic emission, parasitic emission, intermodulation products and frequency conversion products, but exclude out of band emissions. This is measured at the base station RF output port. Realistically, the GSM
(Ericsson's equipment)
T-Mobile USA, Inc. May 26, 2010 19 of 52 Strictly Confidential and Proprietary
system could produce a more harmful effect on the UMTS system because of the higher power and higher power spectral density being used in GSM (20 W normally per TRX, in some cases even up to 40 W per TRX). The 3GPP specification 45.05 (section 4.3.2.3) recommends an upper limit of -96 dBm per 100 kHz spurious emission for a GSM transmitter in a co-located GSM 1900 and UMTS systems (both UMTS 1900 and UMTS 1700/2100). This translates to an upper limit of -80 dBm per 4 MHz. Considering a reference noise reference power of -110 dBm then the isolation required should be around 30 dB. Likewise, 3GPP specification 25.104 (section 6.6.3.2.1) specifies that the UMTS BS transmitter can generate spurious emissions outside their allocated bands up to -96 dBm per 100 kHz or -93 dBm per 200 kHz of the GSM channel bandwidth. This would result in 17 dB isolation requirement between the transmit antenna of the UMTS and a co-located GSM receiver, assuming a reference sensitivity level of -110 dBm for GSM receiver. This level of isolation would normally be materialized by the 30 dB isolation between antenna ports provided by antenna manufacturers. The blocking characteristic is a measure of the receiver‟s ability to receive a wanted signal at its assigned channel frequency in the presence of an unwanted interferer on frequencies other than those of the adjacent channels. The blocking requirement to protect the UMTS receiver from 3GPP 25.104 standards (section 7.5.2) recommends a limit of 16 dBm interference signal mean power from a co-located GSM 1900 system. Considering a 40 W GSM transmitter (46dBm), the isolation required will be 30 dB to protect the UMTS receiver from blocking. The 3GPP standard 45.005 specified that the blocking characteristics of a GSM receiver operating in the PCS 1900 band (receive frequencies 1830-1910 MHz) is not applicable from a 2100 MHz UMTS transmitter, which is considered out of band. Current wideband antennas for UMTS 1700/2100 and GSM 1900 specify at least 30 dB of isolation between antenna ports. As long as antenna ports and feeders will not be shared between the GSM and UMTS systems the 30 dB isolation requirement can be met. Additional isolation can be obtained also by using separate physical antenna between UMTS and GSM.
5.5 Antenna Configuration Scenarios
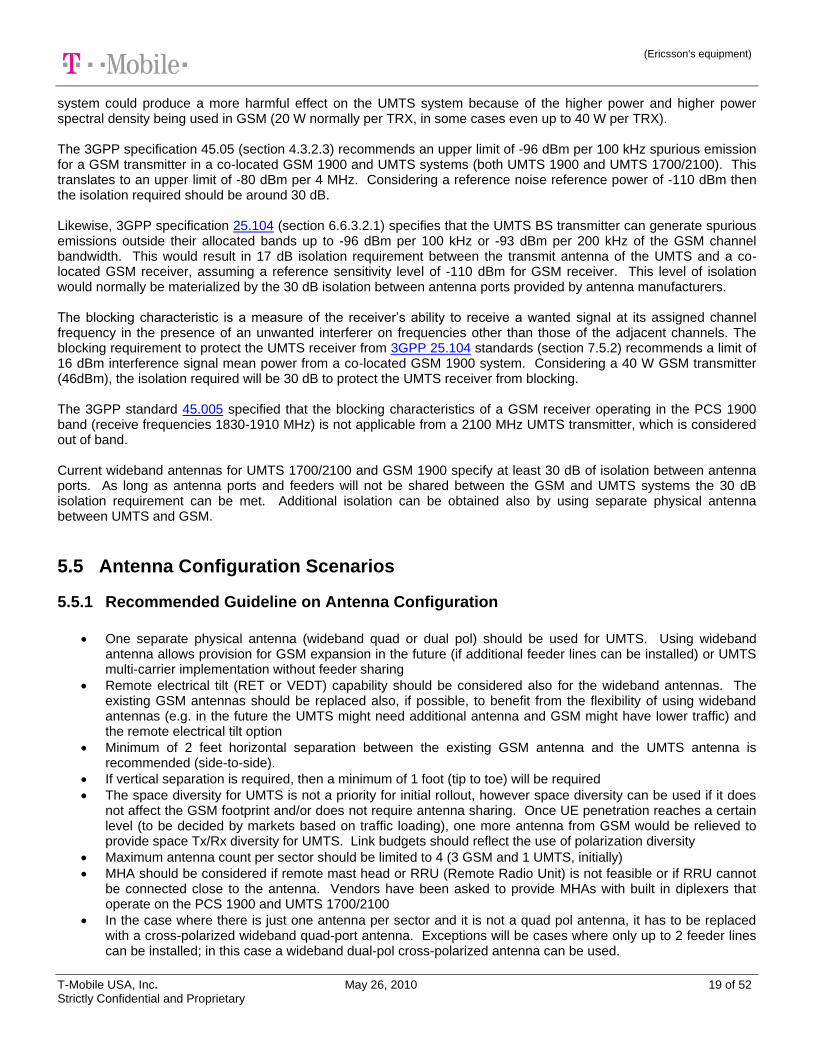
5.5.1 Recommended Guideline on Antenna Configuration
One separate physical antenna (wideband quad or dual pol) should be used for UMTS. Using wideband antenna allows provision for GSM expansion in the future (if additional feeder lines can be installed) or UMTS multi-carrier implementation without feeder sharing
Remote electrical tilt (RET or VEDT) capability should be considered also for the wideband antennas. The existing GSM antennas should be replaced also, if possible, to benefit from the flexibility of using wideband antennas (e.g. in the future the UMTS might need additional antenna and GSM might have lower traffic) and the remote electrical tilt option
Minimum of 2 feet horizontal separation between the existing GSM antenna and the UMTS antenna is recommended (side-to-side).
If vertical separation is required, then a minimum of 1 foot (tip to toe) will be required
The space diversity for UMTS is not a priority for initial rollout, however space diversity can be used if it does not affect the GSM footprint and/or does not require antenna sharing. Once UE penetration reaches a certain level (to be decided by markets based on traffic loading), one more antenna from GSM would be relieved to provide space Tx/Rx diversity for UMTS. Link budgets should reflect the use of polarization diversity
Maximum antenna count per sector should be limited to 4 (3 GSM and 1 UMTS, initially)
MHA should be considered if remote mast head or RRU (Remote Radio Unit) is not feasible or if RRU cannot be connected close to the antenna. Vendors have been asked to provide MHAs with built in diplexers that operate on the PCS 1900 and UMTS 1700/2100
In the case where there is just one antenna per sector and it is not a quad pol antenna, it has to be replaced with a cross-polarized wideband quad-port antenna. Exceptions will be cases where only up to 2 feeder lines can be installed; in this case a wideband dual-pol cross-polarized antenna can be used.
(Ericsson's equipment)
T-Mobile USA, Inc. May 26, 2010 20 of 52 Strictly Confidential and Proprietary
The effect on the GSM system should be kept to minimum as possible. Space diversity may be reduced or sacrificed to avoid antenna sharing, however if antenna and line sharing cannot be avoided the following can be employed:
o The GSM radios can be combined; if that affects the footprint then boosters (MCPA) could be used to
minimize loss. It should be noted that the boosting of GSM signals could affect the isolation between the two systems. Spectrum analyzer measurement should be taken to determine the additional noise level, if any are produced
o If adding boosters is not possible then IUO, HCS or concentric cells (GSM feature) can be used so that high path loss calls are always on uncombined radios
o TMAs can be deployed to compensate for space diversity loss, if any on the GSM side
Feeder line and antenna sharing should be avoided
o Sharing feeder lines would imply use of diplexers which may cause losses from 0.5 to 3.5 dB and the possibility of having decreased sensitivity due to possible 3
rd order intermodulation product
5.5.2 Antenna Configurations
The preferred approach would be to replace all existing antennas (GSM included) to wideband antennas for each sector with remote electrical tilt and have a separate antenna for UMTS (separate physical antenna or separate ports as long as 2 feeder lines will be accommodated) . Advantages:
Ability to share the antenna between UMTS and GSM but using different ports for each technology to meet the required isolation
Zoning should not be an issue as same antenna count will be maintained
This allows future-proofing of antenna system as we don‟t have to change antenna in the future if there‟s a need to expand the UMTS once the GSM subscriber count starts to go down (depends on the migration strategy). This is also true for maintenance purposes, where it takes a long time to replace a broken antenna
Ability to control tilt remotely without the need of tower crews
Disadvantages:
High up front cost due to massive antenna change out needed
Risk of degrading the performance of the system due to poor installation The decision between quad pol and dual pol antenna will depend on the total number of feeder lines and antennas that can be installed considering space limitation, structural loading, leasing agreement and zoning restrictions. Each market should be able to determine based on traffic forecasting the need for additional capacity, which could translate to the need of installing additional feeder lines. Currently, the FSC has approved wideband antennas that are dual pol and quad pol types. Sharing of feeder cables should be avoided at all cost. Below are some of the reasons why
Sharing feeder lines subject the UMTS receive band (1700 MHz) to a possible 3rd
order intermodulation interference
If the shared feeder line (GSM and UMTS) terminates to a shared antenna port, the required isolation requirement of 30 dB will not be met. This also eliminates the possibility of controlling the tilt for each system. This could be alleviated by using diplexer on both ends (before and after the shared feeder line) but it presents another problem below
(Ericsson's equipment)
T-Mobile USA, Inc. May 26, 2010 21 of 52 Strictly Confidential and Proprietary
If diplexers are used to maintain the required isolation by using separate antenna ports, then we have to take into account the additional loss from the diplexers. If the amount of combining loss in GSM (to allow separate feeder and antenna for both systems) is equal to the loss that will be incurred by using diplexers, the former case should be used as it offers more flexibility
There‟s a possibility that the shared element (feeder lines, diplexers, antenna) could break and it will affect both systems, i.e. no backup at all even for voice
Antenna Migration Minimum Requirements
Minimum of 2 feeder lines (4 lines preferably) for UMTS only
Separate antenna (or ports in case of quad pol) for UMTS
Feeder loss (between Node B antenna connector and antenna connector) should be minimized as much as possible (maximum of 4 dB). The reason for this is to minimize the power loss, which is very important for UMTS. To minimize the feeder loss, cable type, antenna location and NodeB location should be selected properly
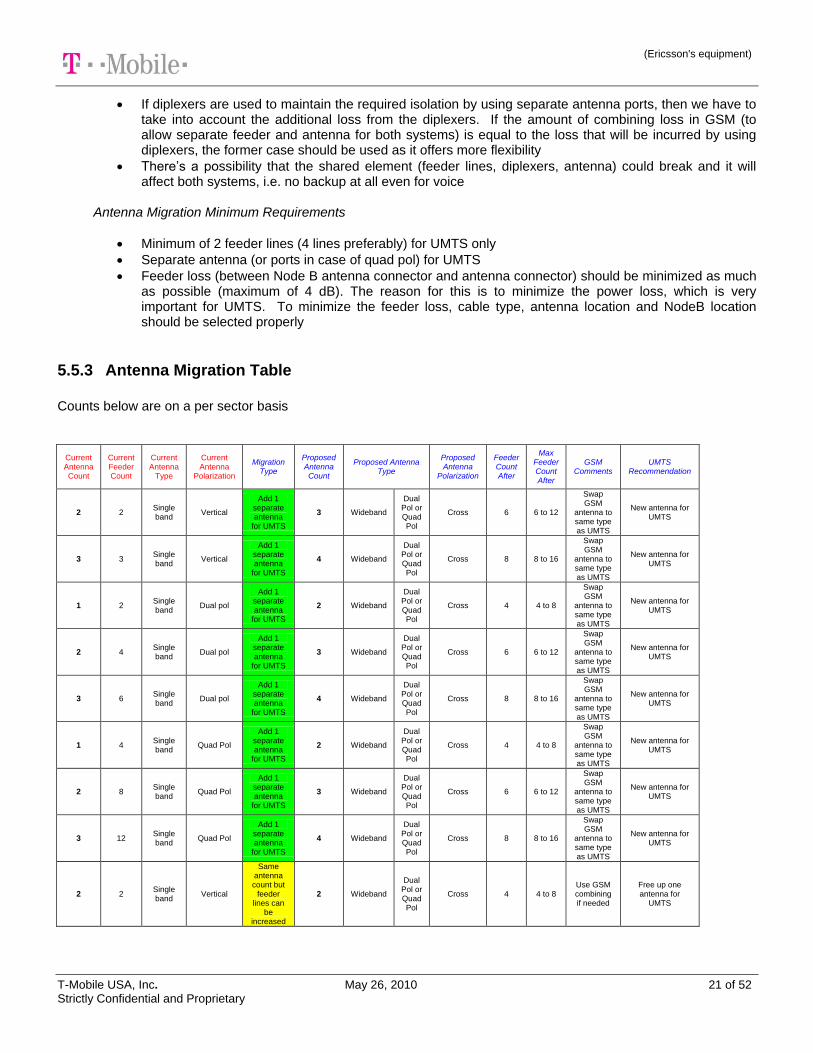
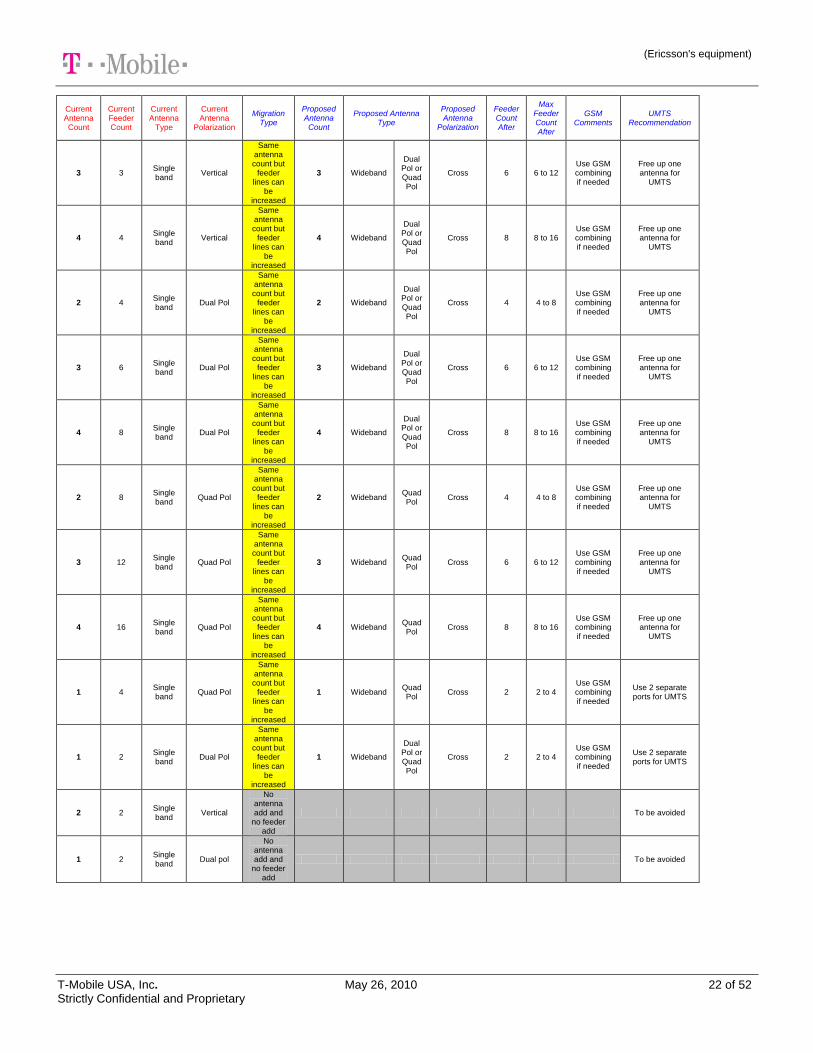
5.5.3 Antenna Migration Table
Counts below are on a per sector basis
Current Antenna Count
Current Feeder Count
Current Antenna
Type
Current Antenna
Polarization
Migration Type
Proposed Antenna Count
Proposed Antenna Type
Proposed Antenna
Polarization
Feeder Count After
Max Feeder Count After
GSM Comments
UMTS Recommendation
2 2 Single band
Vertical
Add 1 separate antenna
for UMTS
3 Wideband
Dual Pol or Quad Pol
Cross 6 6 to 12
Swap GSM
antenna to same type as UMTS
New antenna for UMTS
3 3 Single band
Vertical
Add 1 separate antenna
for UMTS
4 Wideband
Dual Pol or Quad Pol
Cross 8 8 to 16
Swap GSM
antenna to same type as UMTS
New antenna for UMTS
1 2 Single band
Dual pol
Add 1 separate antenna
for UMTS
2 Wideband
Dual Pol or Quad Pol
Cross 4 4 to 8
Swap GSM
antenna to same type as UMTS
New antenna for UMTS
2 4 Single band
Dual pol
Add 1 separate antenna
for UMTS
3 Wideband
Dual Pol or Quad Pol
Cross 6 6 to 12
Swap GSM
antenna to same type as UMTS
New antenna for UMTS
3 6 Single band
Dual pol
Add 1 separate antenna
for UMTS
4 Wideband
Dual Pol or Quad Pol
Cross 8 8 to 16
Swap GSM
antenna to same type as UMTS
New antenna for UMTS
1 4 Single band
Quad Pol
Add 1 separate antenna
for UMTS
2 Wideband
Dual Pol or Quad Pol
Cross 4 4 to 8
Swap GSM
antenna to same type as UMTS
New antenna for UMTS
2 8 Single band
Quad Pol
Add 1 separate antenna
for UMTS
3 Wideband
Dual Pol or Quad Pol
Cross 6 6 to 12
Swap GSM
antenna to same type as UMTS
New antenna for UMTS
3 12 Single band
Quad Pol
Add 1 separate antenna
for UMTS
4 Wideband
Dual Pol or Quad Pol
Cross 8 8 to 16
Swap GSM
antenna to same type as UMTS
New antenna for UMTS
2 2 Single band
Vertical
Same antenna count but
feeder lines can
be increased
2 Wideband
Dual Pol or Quad Pol
Cross 4 4 to 8 Use GSM combining if needed
Free up one antenna for
UMTS
(Ericsson's equipment)
T-Mobile USA, Inc. May 26, 2010 22 of 52 Strictly Confidential and Proprietary
Current Antenna Count
Current Feeder Count
Current Antenna
Type
Current Antenna
Polarization
Migration Type
Proposed Antenna Count
Proposed Antenna Type
Proposed Antenna
Polarization
Feeder Count After
Max Feeder Count After
GSM Comments
UMTS Recommendation
3 3 Single band
Vertical
Same antenna count but
feeder lines can
be increased
3 Wideband
Dual Pol or Quad Pol
Cross 6 6 to 12 Use GSM combining if needed
Free up one antenna for
UMTS
4 4 Single band
Vertical
Same antenna count but
feeder lines can
be increased
4 Wideband
Dual Pol or Quad Pol
Cross 8 8 to 16 Use GSM combining if needed
Free up one antenna for
UMTS
2 4 Single band
Dual Pol
Same antenna count but
feeder lines can
be increased
2 Wideband
Dual Pol or Quad Pol
Cross 4 4 to 8 Use GSM combining if needed
Free up one antenna for
UMTS
3 6 Single band
Dual Pol
Same antenna count but
feeder lines can
be increased
3 Wideband
Dual Pol or Quad Pol
Cross 6 6 to 12 Use GSM combining if needed
Free up one antenna for
UMTS
4 8 Single band
Dual Pol
Same antenna count but
feeder lines can
be increased
4 Wideband
Dual Pol or Quad Pol
Cross 8 8 to 16 Use GSM combining if needed
Free up one antenna for
UMTS
2 8 Single band
Quad Pol
Same antenna count but
feeder lines can
be increased
2 Wideband Quad Pol
Cross 4 4 to 8 Use GSM combining if needed
Free up one antenna for
UMTS
3 12 Single band
Quad Pol
Same antenna count but
feeder lines can
be increased
3 Wideband Quad Pol
Cross 6 6 to 12 Use GSM combining if needed
Free up one antenna for
UMTS
4 16 Single band
Quad Pol
Same antenna count but
feeder lines can
be increased
4 Wideband Quad Pol
Cross 8 8 to 16 Use GSM combining if needed
Free up one antenna for
UMTS
1 4 Single band
Quad Pol
Same antenna count but
feeder lines can
be increased
1 Wideband Quad Pol
Cross 2 2 to 4 Use GSM combining if needed
Use 2 separate ports for UMTS
1 2 Single band
Dual Pol
Same antenna count but
feeder lines can
be increased
1 Wideband
Dual Pol or Quad Pol
Cross 2 2 to 4 Use GSM combining if needed
Use 2 separate ports for UMTS
2 2 Single band
Vertical
No antenna add and
no feeder add
To be avoided
1 2 Single band
Dual pol
No antenna add and
no feeder add
To be avoided
(Ericsson's equipment)
T-Mobile USA, Inc. May 26, 2010 23 of 52 Strictly Confidential and Proprietary
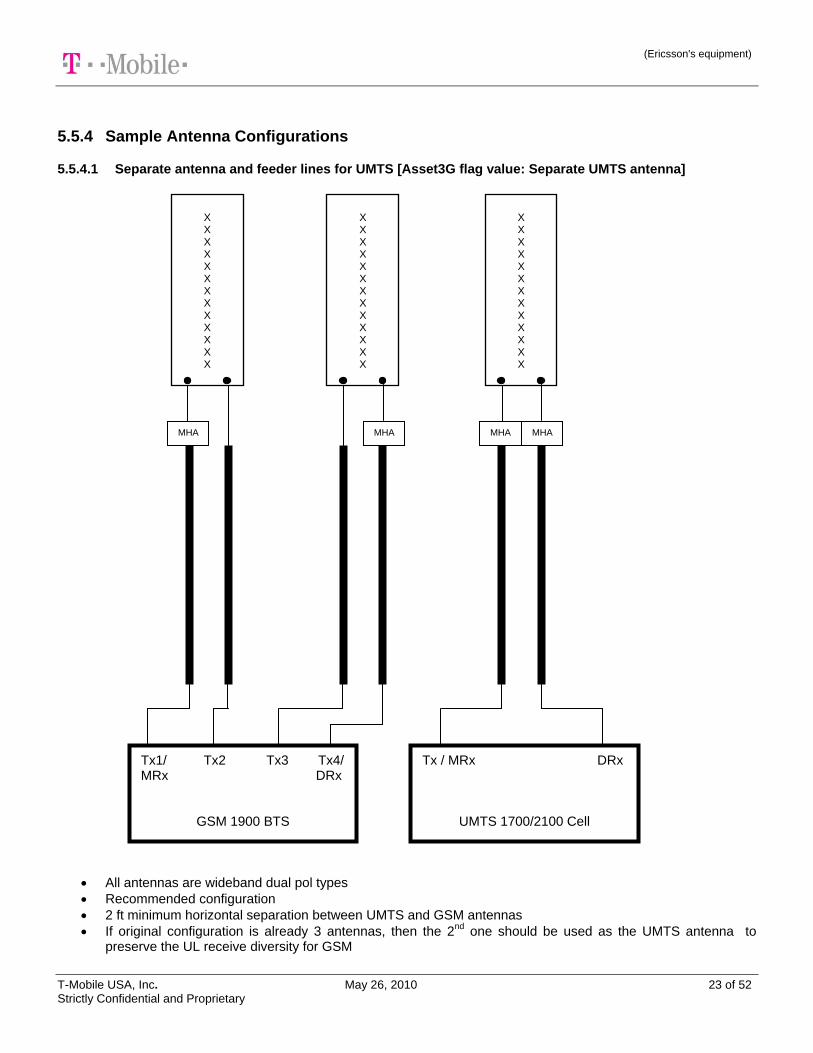
5.5.4 Sample Antenna Configurations
5.5.4.1 Separate antenna and feeder lines for UMTS [Asset3G flag value: Separate UMTS antenna]
All antennas are wideband dual pol types
Recommended configuration
2 ft minimum horizontal separation between UMTS and GSM antennas
If original configuration is already 3 antennas, then the 2nd
one should be used as the UMTS antenna to preserve the UL receive diversity for GSM
X X X X X X X X X X X X X
X X X X X X X X X X X X X
Tx1/ Tx2 Tx3 Tx4/ MRx DRx
GSM 1900 BTS
X X X X X X X X X X X X X
Tx / MRx DRx
UMTS 1700/2100 Cell
MHA MHA MHA MHA
(Ericsson's equipment)
T-Mobile USA, Inc. May 26, 2010 24 of 52 Strictly Confidential and Proprietary
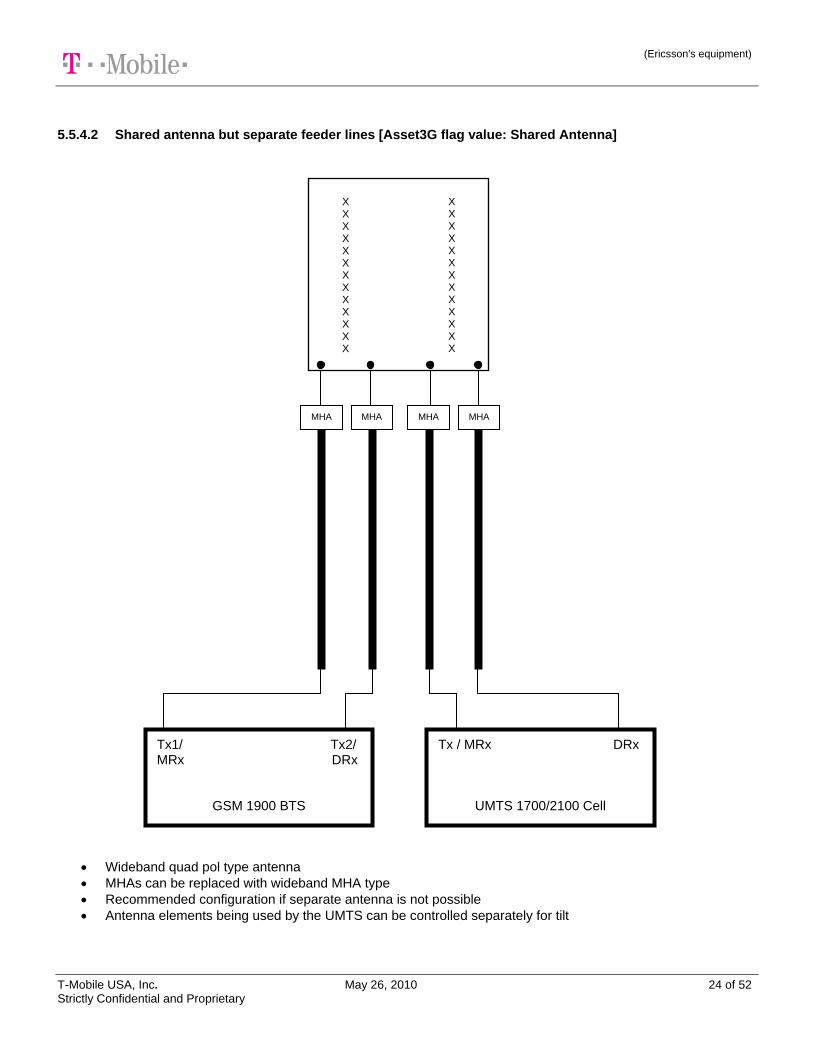
5.5.4.2 Shared antenna but separate feeder lines [Asset3G flag value: Shared Antenna]
Wideband quad pol type antenna
MHAs can be replaced with wideband MHA type
Recommended configuration if separate antenna is not possible
Antenna elements being used by the UMTS can be controlled separately for tilt
Tx1/ Tx2/ MRx DRx
GSM 1900 BTS
Tx / MRx DRx
UMTS 1700/2100 Cell
MHA MHA MHA MHA
X X X X X X X X X X X X X
X X X X X X X X X X X X X
(Ericsson's equipment)
T-Mobile USA, Inc. May 26, 2010 25 of 52 Strictly Confidential and Proprietary
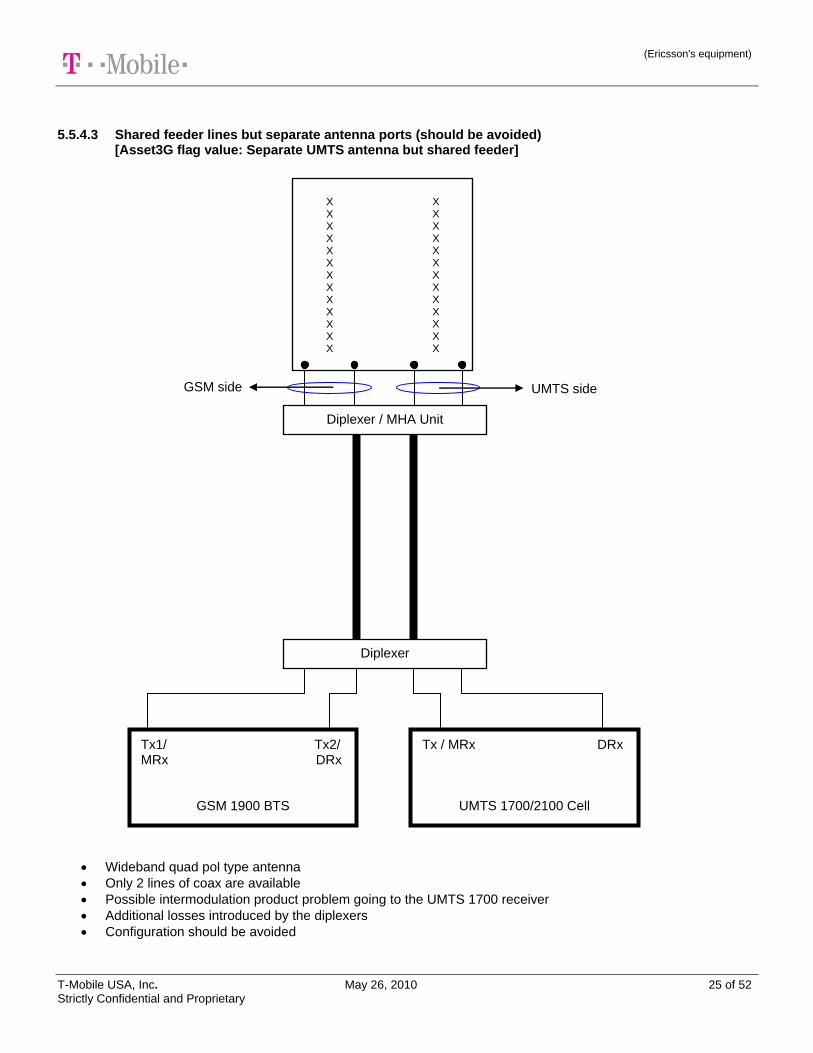
5.5.4.3 Shared feeder lines but separate antenna ports (should be avoided) [Asset3G flag value: Separate UMTS antenna but shared feeder]
Wideband quad pol type antenna
Only 2 lines of coax are available
Possible intermodulation product problem going to the UMTS 1700 receiver
Additional losses introduced by the diplexers
Configuration should be avoided
UMTS side GSM side
Tx1/ Tx2/ MRx DRx
GSM 1900 BTS
Tx / MRx DRx
UMTS 1700/2100 Cell
X X X X X X X X X X X X X
X X X X X X X X X X X X X
Diplexer
Diplexer / MHA Unit
(Ericsson's equipment)
T-Mobile USA, Inc. May 26, 2010 26 of 52 Strictly Confidential and Proprietary
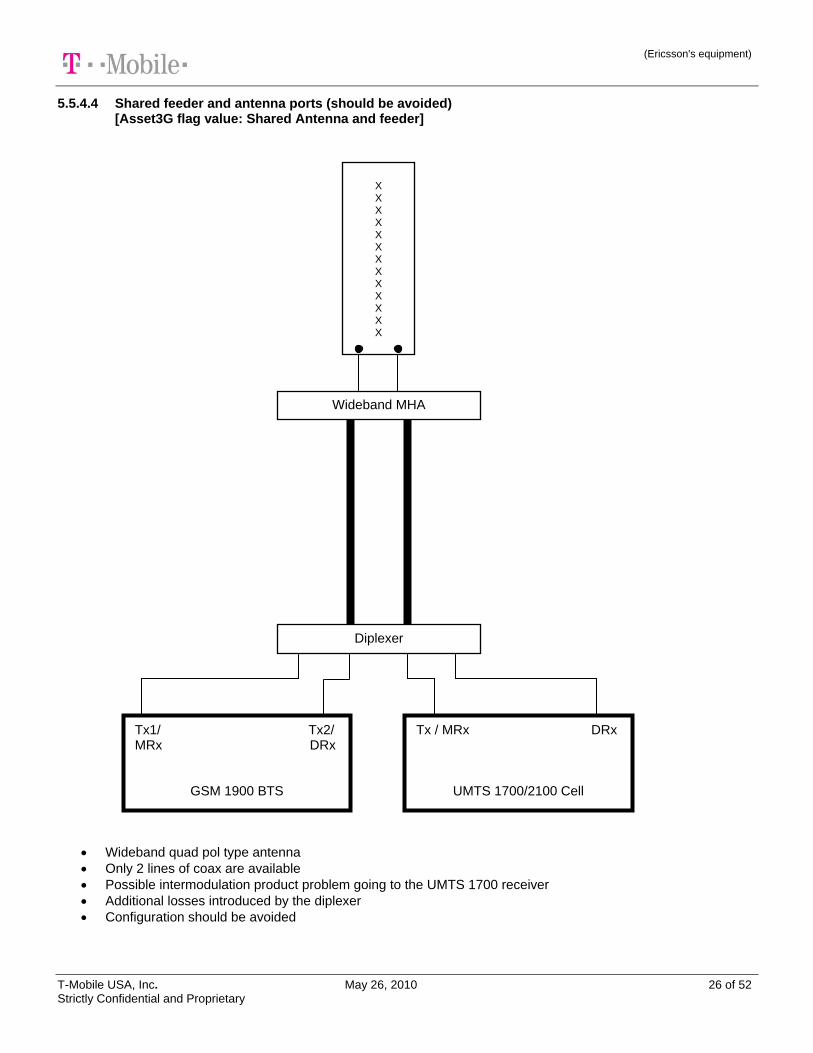
5.5.4.4 Shared feeder and antenna ports (should be avoided) [Asset3G flag value: Shared Antenna and feeder]
Wideband quad pol type antenna
Only 2 lines of coax are available
Possible intermodulation product problem going to the UMTS 1700 receiver
Additional losses introduced by the diplexer
Configuration should be avoided
Tx1/ Tx2/ MRx DRx
GSM 1900 BTS
Tx / MRx DRx
UMTS 1700/2100 Cell
Diplexer
Wideband MHA
X X X X X X X X X X X X X
(Ericsson's equipment)
T-Mobile USA, Inc. May 26, 2010 27 of 52 Strictly Confidential and Proprietary
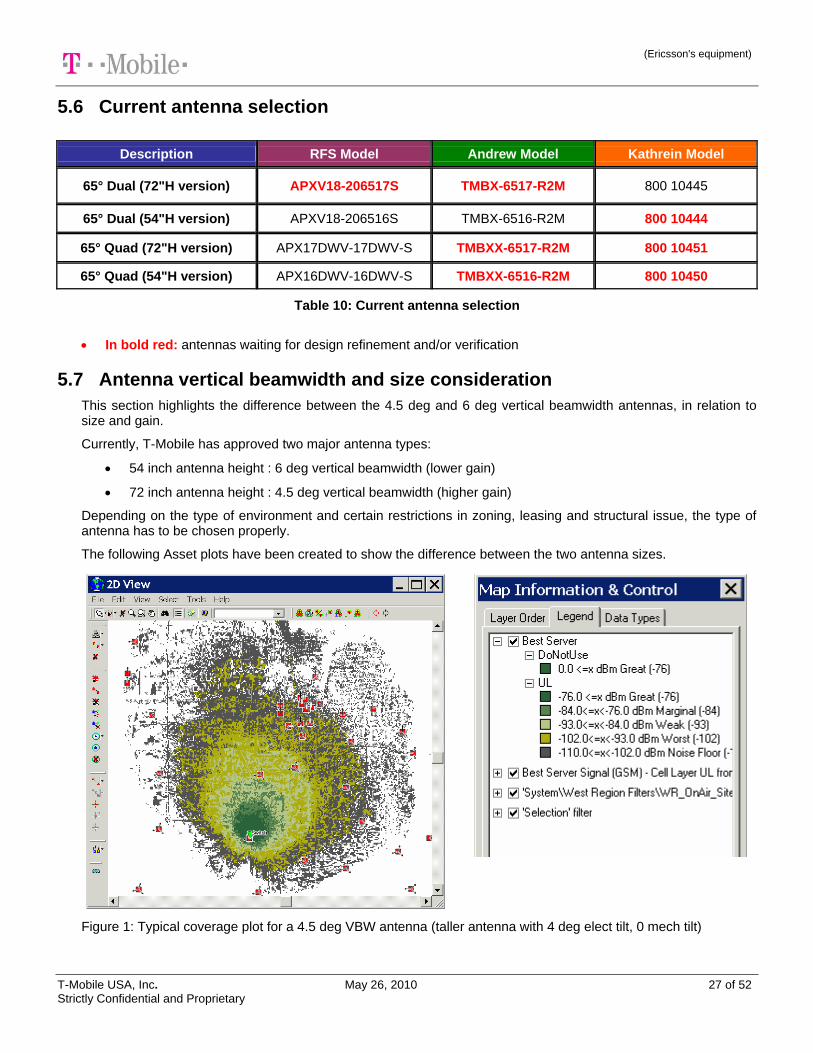
5.6 Current antenna selection
Description RFS Model Andrew Model Kathrein Model
65° Dual (72"H version) APXV18-206517S TMBX-6517-R2M 800 10445
65° Dual (54"H version) APXV18-206516S TMBX-6516-R2M 800 10444
65° Quad (72"H version) APX17DWV-17DWV-S TMBXX-6517-R2M 800 10451
65° Quad (54"H version) APX16DWV-16DWV-S TMBXX-6516-R2M 800 10450
Table 10: Current antenna selection
In bold red: antennas waiting for design refinement and/or verification
5.7 Antenna vertical beamwidth and size consideration
This section highlights the difference between the 4.5 deg and 6 deg vertical beamwidth antennas, in relation to size and gain.
Currently, T-Mobile has approved two major antenna types:
54 inch antenna height : 6 deg vertical beamwidth (lower gain)
72 inch antenna height : 4.5 deg vertical beamwidth (higher gain)
Depending on the type of environment and certain restrictions in zoning, leasing and structural issue, the type of antenna has to be chosen properly.
The following Asset plots have been created to show the difference between the two antenna sizes.
Figure 1: Typical coverage plot for a 4.5 deg VBW antenna (taller antenna with 4 deg elect tilt, 0 mech tilt)
(Ericsson's equipment)
T-Mobile USA, Inc. May 26, 2010 28 of 52 Strictly Confidential and Proprietary
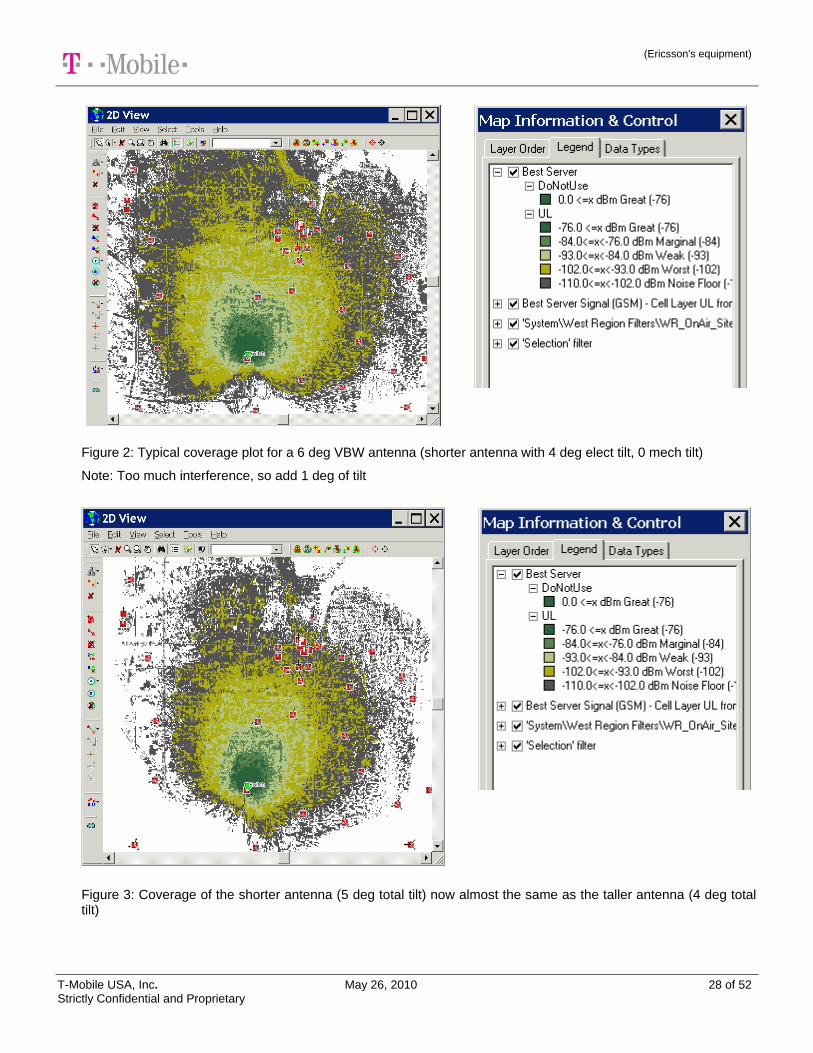
Figure 2: Typical coverage plot for a 6 deg VBW antenna (shorter antenna with 4 deg elect tilt, 0 mech tilt)
Note: Too much interference, so add 1 deg of tilt
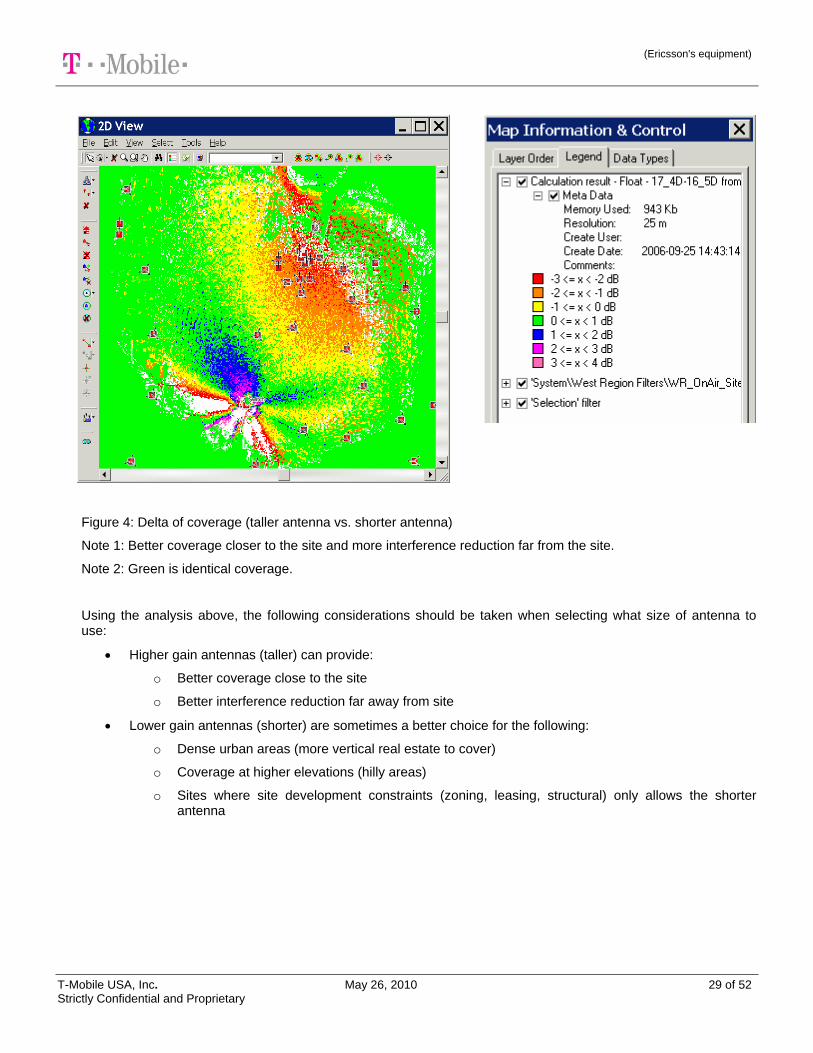
Figure 3: Coverage of the shorter antenna (5 deg total tilt) now almost the same as the taller antenna (4 deg total tilt)
(Ericsson's equipment)
T-Mobile USA, Inc. May 26, 2010 29 of 52 Strictly Confidential and Proprietary
Figure 4: Delta of coverage (taller antenna vs. shorter antenna)
Note 1: Better coverage closer to the site and more interference reduction far from the site.
Note 2: Green is identical coverage.
Using the analysis above, the following considerations should be taken when selecting what size of antenna to use:
Higher gain antennas (taller) can provide:
o Better coverage close to the site
o Better interference reduction far away from site
Lower gain antennas (shorter) are sometimes a better choice for the following:
o Dense urban areas (more vertical real estate to cover)
o Coverage at higher elevations (hilly areas)
o Sites where site development constraints (zoning, leasing, structural) only allows the shorter antenna
(Ericsson's equipment)
T-Mobile USA, Inc. May 26, 2010 30 of 52 Strictly Confidential and Proprietary
6 UMTS TMA Guidelines
6.1 Objective and Scope
6.1.1 Objective
This chapter provides guidelines on the use of TMAs on a WCDMA cell.
6.1.2 Scope and Limitation
This chapter briefly covers the criteria for selecting TMAs but it does not specify which particular model to use. The document assumes that specific TMA brand and models have been picked by the Ancillary group. The figures used for the sensitivity computation were obtained from the UMTS link budget. Figures such as Noise Figure and Eb/No are based on vendor recommended values.
6.2 Introduction
Utilizing maximum coverage is one of the key objectives of designing and optimizing a network. Achieving maximum coverage is often as easy as boosting the uplink signal from the network users phone at the base station. The uplink limitation is always the case because of lower transmit power used by the mobile station.
Coverage in UMTS networks is largely considered to be uplink limited in low traffic conditions. The basis for this is that the base station has typically 10-40 W (40-46 dBm) output power available, while the mobile unit has 0.125-0.250 W (21-24 dBm). This means that in low traffic situations, the uplink is the limiting link, while in high traffic situations, downlink becomes the limiting link. For these reasons infrastructure vendors strongly recommend using TMAs with their base station solutions. Appropriately installed Low Noise Amplifiers (LNAs) in the uplink will significantly improve receiver system sensitivity when installed as close as possible to the receive antenna, particularly where cable losses are significant. LNAs located in this way are referred to as Tower Mounted Amplifiers (TMAs). Installing TMAs in a CDMA system (like UMTS WCDMA) is not as straightforward as in GSM. In GSM it is easy to determine when to install TMAs using statistical data like the link balance report, where it shows how much imbalance you have between uplink and downlink.
6.3 Base Station Receiver Sensitivity
In WCDMA receiver sensitivity is a combination of four fundamental factors within a network:
Thermal Noise Density – is a measure of the radio signal noise in nature. In the bandwidth of a WCDMA carrier this is -174 dBm/Hz at 290 K.
Eb/No – it is the energy per bit to total noise spectrum density ratio. This is the signal to (interference + noise) ratio after the despreading process. It contains the processing gain. The values are vendor-specific and based on specific service.
(Ericsson's equipment)
T-Mobile USA, Inc. May 26, 2010 31 of 52 Strictly Confidential and Proprietary
Noise Figure (NF) – is a measure of extra noise caused by the receiver circuitry. For the WCDMA Node B this is typically 3 dB.
User data rate – the data rate of the type of service (e.g. 12.2 AMR, 384 kbps PS)
The maximum sensitivity of a WCDMA receiver channel is (e.g. using 12.2 kbps AMR):
Sensitivity = Thermal Noise Density + Noise Figure + Eb/no + 10log (user data rate) Sensitivity = -174 + 3 + 8 + 10log (12.2 kbps) Sensitivity = -121 dBm
Considering additional losses coming from feeder and connectors, typically around 4 dB, the sensitivity can go down to -117 dBm.
Being a function of the WCDMA carrier bandwidth and circuit design, Thermal Noise Density and Eb/No are fixed as far as the network operator is concerned (Eb/No is normally set by vendor as specific to their equipment). The only component affecting receiver sensitivity that may be improved by the operator is the system Noise Figure (NF).
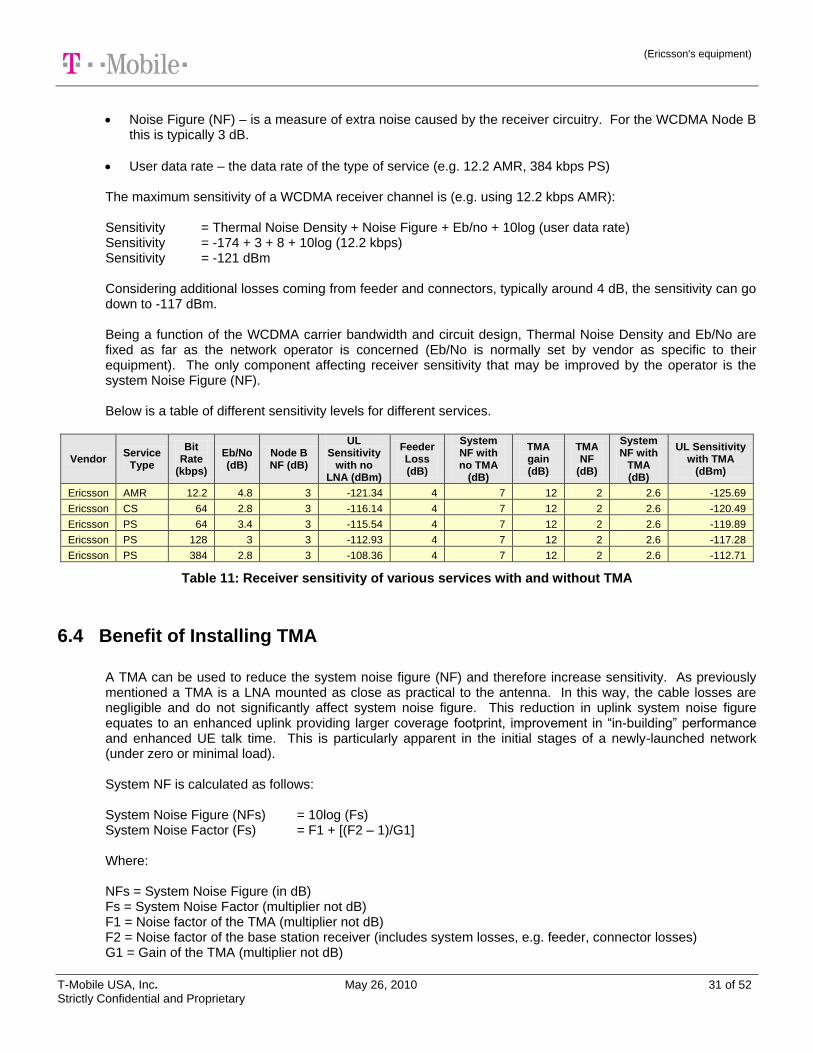
Below is a table of different sensitivity levels for different services.
Vendor Service
Type
Bit Rate
(kbps)
Eb/No (dB)
Node B NF (dB)
UL Sensitivity
with no LNA (dBm)
Feeder Loss (dB)
System NF with no TMA
(dB)
TMA gain (dB)
TMA NF
(dB)
System NF with
TMA (dB)
UL Sensitivity with TMA
(dBm)
Ericsson AMR 12.2 4.8 3 -121.34 4 7 12 2 2.6 -125.69
Ericsson CS 64 2.8 3 -116.14 4 7 12 2 2.6 -120.49
Ericsson PS 64 3.4 3 -115.54 4 7 12 2 2.6 -119.89
Ericsson PS 128 3 3 -112.93 4 7 12 2 2.6 -117.28
Ericsson PS 384 2.8 3 -108.36 4 7 12 2 2.6 -112.71
Table 11: Receiver sensitivity of various services with and without TMA
6.4 Benefit of Installing TMA
A TMA can be used to reduce the system noise figure (NF) and therefore increase sensitivity. As previously mentioned a TMA is a LNA mounted as close as practical to the antenna. In this way, the cable losses are negligible and do not significantly affect system noise figure. This reduction in uplink system noise figure equates to an enhanced uplink providing larger coverage footprint, improvement in “in-building” performance and enhanced UE talk time. This is particularly apparent in the initial stages of a newly-launched network (under zero or minimal load).
System NF is calculated as follows:
System Noise Figure (NFs) = 10log (Fs) System Noise Factor (Fs) = F1 + [(F2 – 1)/G1]
Where:
NFs = System Noise Figure (in dB) Fs = System Noise Factor (multiplier not dB) F1 = Noise factor of the TMA (multiplier not dB) F2 = Noise factor of the base station receiver (includes system losses, e.g. feeder, connector losses) G1 = Gain of the TMA (multiplier not dB)
(Ericsson's equipment)
T-Mobile USA, Inc. May 26, 2010 32 of 52 Strictly Confidential and Proprietary
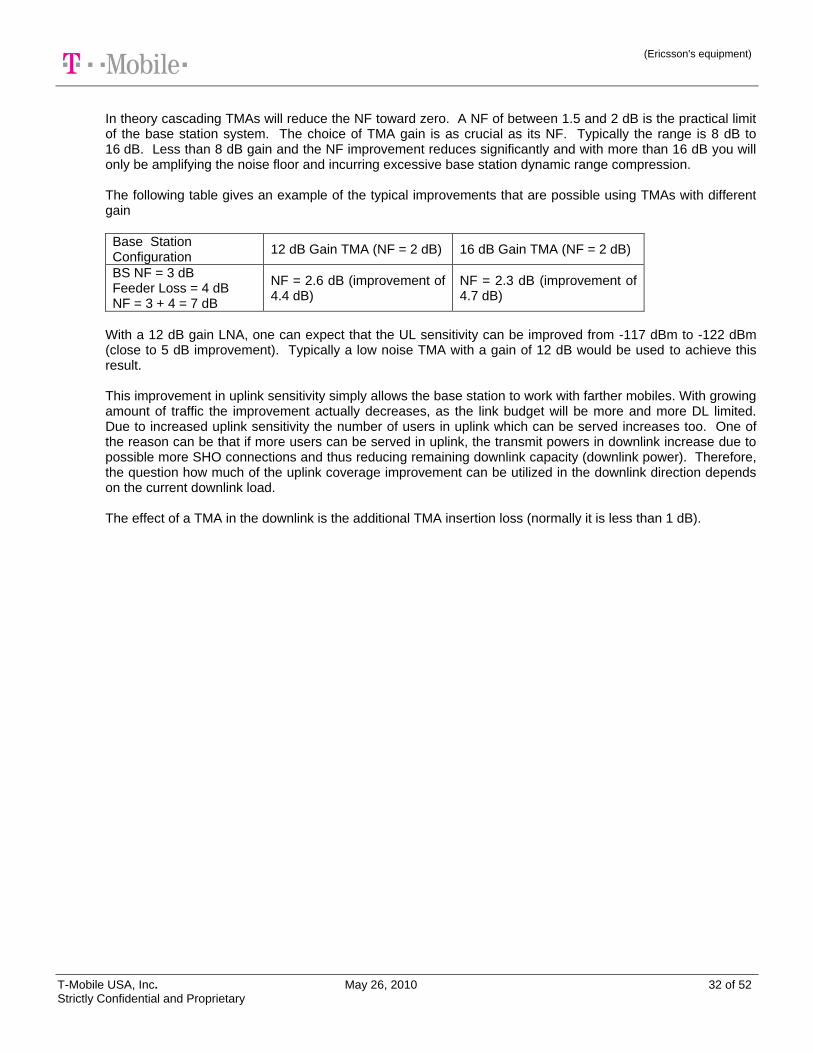
In theory cascading TMAs will reduce the NF toward zero. A NF of between 1.5 and 2 dB is the practical limit of the base station system. The choice of TMA gain is as crucial as its NF. Typically the range is 8 dB to 16 dB. Less than 8 dB gain and the NF improvement reduces significantly and with more than 16 dB you will only be amplifying the noise floor and incurring excessive base station dynamic range compression.
The following table gives an example of the typical improvements that are possible using TMAs with different gain
Base Station Configuration
12 dB Gain TMA (NF = 2 dB) 16 dB Gain TMA (NF = 2 dB)
BS NF = 3 dB Feeder Loss = 4 dB NF = 3 + 4 = 7 dB
NF = 2.6 dB (improvement of 4.4 dB)
NF = 2.3 dB (improvement of 4.7 dB)
With a 12 dB gain LNA, one can expect that the UL sensitivity can be improved from -117 dBm to -122 dBm (close to 5 dB improvement). Typically a low noise TMA with a gain of 12 dB would be used to achieve this result.
This improvement in uplink sensitivity simply allows the base station to work with farther mobiles. With growing amount of traffic the improvement actually decreases, as the link budget will be more and more DL limited. Due to increased uplink sensitivity the number of users in uplink which can be served increases too. One of the reason can be that if more users can be served in uplink, the transmit powers in downlink increase due to possible more SHO connections and thus reducing remaining downlink capacity (downlink power). Therefore, the question how much of the uplink coverage improvement can be utilized in the downlink direction depends on the current downlink load.
The effect of a TMA in the downlink is the additional TMA insertion loss (normally it is less than 1 dB).
(Ericsson's equipment)
T-Mobile USA, Inc. May 26, 2010 33 of 52 Strictly Confidential and Proprietary
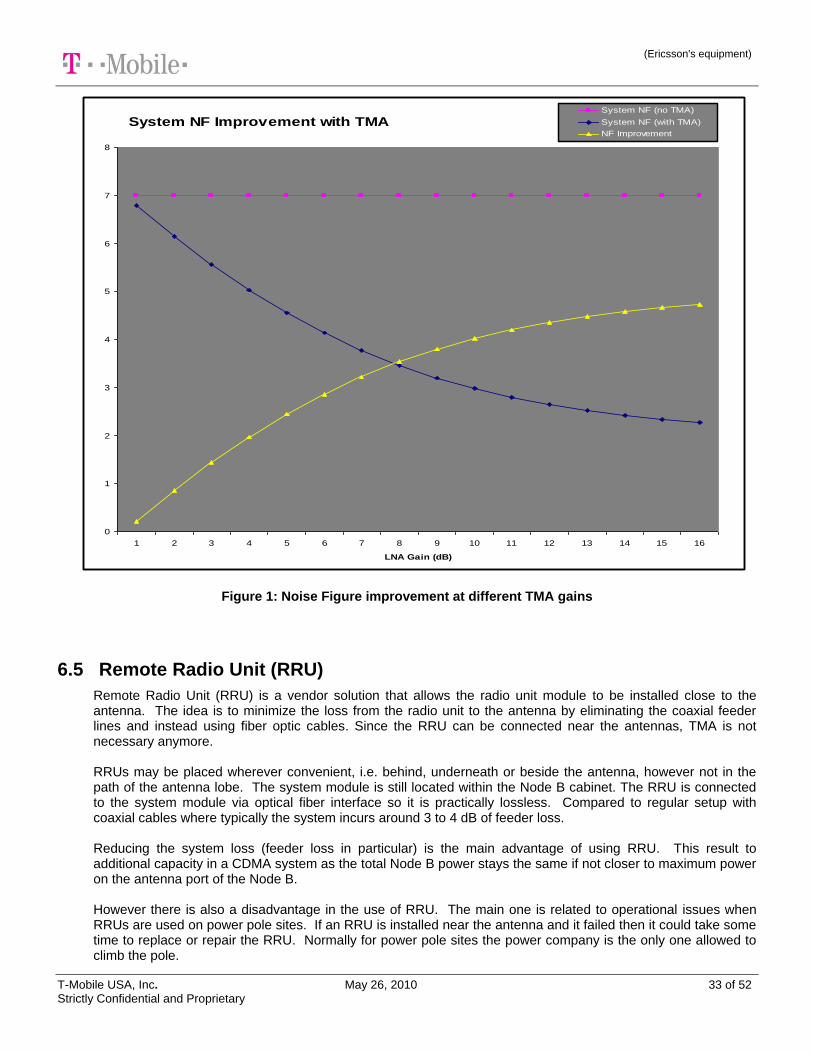
Figure 1: Noise Figure improvement at different TMA gains
6.5 Remote Radio Unit (RRU)
Remote Radio Unit (RRU) is a vendor solution that allows the radio unit module to be installed close to the antenna. The idea is to minimize the loss from the radio unit to the antenna by eliminating the coaxial feeder lines and instead using fiber optic cables. Since the RRU can be connected near the antennas, TMA is not necessary anymore. RRUs may be placed wherever convenient, i.e. behind, underneath or beside the antenna, however not in the path of the antenna lobe. The system module is still located within the Node B cabinet. The RRU is connected to the system module via optical fiber interface so it is practically lossless. Compared to regular setup with coaxial cables where typically the system incurs around 3 to 4 dB of feeder loss. Reducing the system loss (feeder loss in particular) is the main advantage of using RRU. This result to additional capacity in a CDMA system as the total Node B power stays the same if not closer to maximum power on the antenna port of the Node B. However there is also a disadvantage in the use of RRU. The main one is related to operational issues when RRUs are used on power pole sites. If an RRU is installed near the antenna and it failed then it could take some time to replace or repair the RRU. Normally for power pole sites the power company is the only one allowed to climb the pole.
System NF Improvement with TMA
0
1
2
3
4
5
6
7
8
1 2 3 4 5 6 7 8 9 10 11 12 13 14 15 16
LNA Gain (dB)
System NF (no TMA)
System NF (with TMA)
NF Improvement
(Ericsson's equipment)
T-Mobile USA, Inc. May 26, 2010 34 of 52 Strictly Confidential and Proprietary
For rooftop sites RRUs can be installed near the antenna and be easily accessible so this is an ideal scenario to install them. Rooftop sites also tend to utilize longer cable runs so they could benefit significantly by using RRUs and optical cable. One of the most important things to consider when deploying RRUs is the total power on the antenna connector. Consider the case with no RRU and a 40 W output power on the node B antenna connector with 3 dB of feeder loss results in a 20 W output power on the antenna connector. Using the same PA power of 40 W but this time with RRU and zero feeder loss, we are looking at 40 W output power on the antenna connector. This amount of power on the antenna connector might be a little too much to handle in a CDMA system because of the possibility of too much interference as a result of very high transmit power, unless the density of the sites deployed is small enough. A 20 W output power on the node B antenna connector is more practical if RRUs are to be used. Another thing that needs to be considered also is the power requirements. As of the moment Ericsson can provide DC power to RRU up to a certain length, which might not be enough for T-Mobile‟s requirements. The last thing to consider is the form factor of the RRU itself. The RRU will basically replace your TMA on top of the tower and it might be an issue for zoning. Current RRU solutions from vendors are bigger in dimension, significantly bigger than a regular TMA. As far as uplink sensitivity is concerned the sensitivity is around -125 dBm as computed on section 6.6 (TMA and RRU usage comparison)
(Ericsson's equipment)
T-Mobile USA, Inc. May 26, 2010 35 of 52 Strictly Confidential and Proprietary
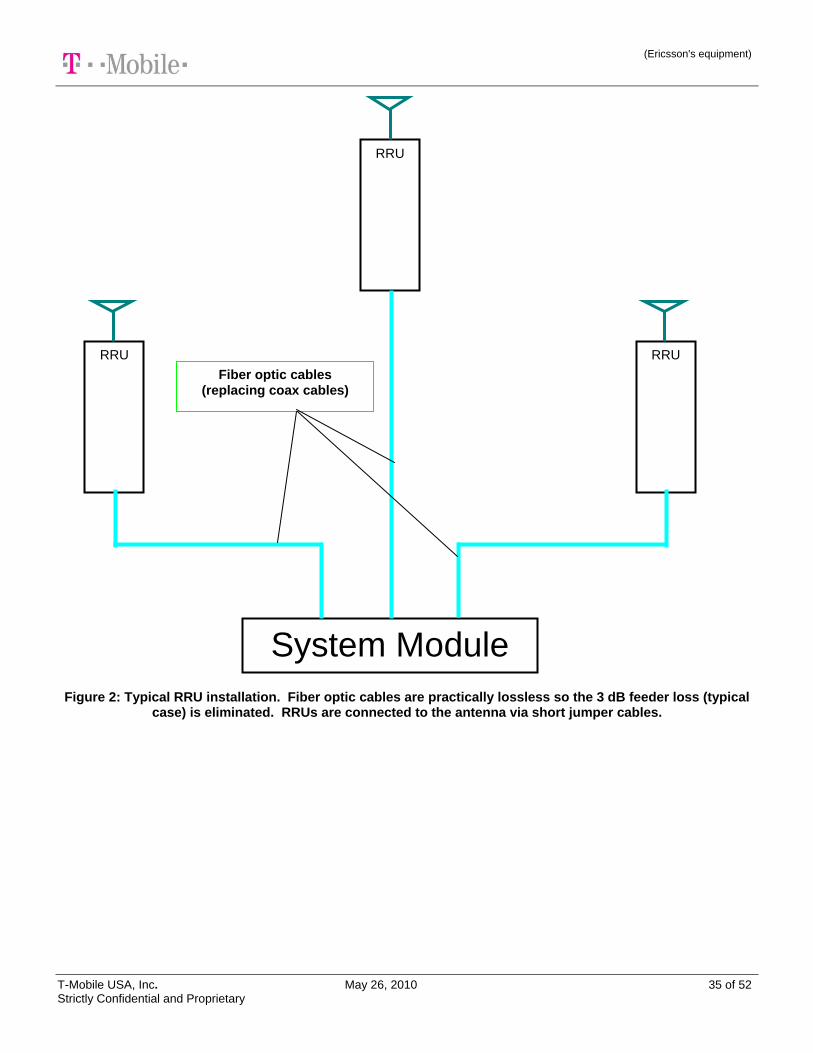
Figure 2: Typical RRU installation. Fiber optic cables are practically lossless so the 3 dB feeder loss (typical case) is eliminated. RRUs are connected to the antenna via short jumper cables.
RRU
RRU RRU
System Module
Fiber optic cables
(replacing coax cables)
(Ericsson's equipment)
T-Mobile USA, Inc. May 26, 2010 36 of 52 Strictly Confidential and Proprietary
6.6 Comparison of RRU Usage and TMA Usage
This section shows the various gains and losses associated with the different configurations (i.e. usage of TMAs or RRUs) in a UMTS system.
LNA Noise Figure (dB) 1.4
Required UL Eb/No (dB) 4.4
LNA on top of tower
Gain NF
(dB) Linear Gain
Linear NF = F
Antenna to TMA jumper (dB) -0.5 0.5 0.89 1.12
LNA (dB) 12 1.4 15.85 1.38
Feeders (dB) -3 3 0.50 2.00
Feeder to BTS jumper (dB) -0.5 0.5 0.89 1.12
Node B Noise Figure (dB) 3 3 2.00 2.00
System NF (linear) 1.79
System NF (dB) 2.54 Receiver sensitivity (dBm) -126.20
No LNA
Gain NF
(dB) Linear Gain
Linear NF = F
Antenna to TMA jumper (dB) -0.5 0.5 0.89 1.12
Feeders (dB) -3 3 0.50 2.00
Feeder to BTS jumper(dB) -0.5 0.5 0.89 1.12
Node B Noise Figure (dB) 3 3 2.00 2.00
System NF (linear) 5.01
System NF (dB) 7.00 Receiver sensitivity (dBm) -121.74
LNA at the bottom
Gain NF
(dB) Linear Gain
Linear NF = F
Antenna to TMA jumper (dB) -0.5 0.5 0.89 1.12
Feeders (dB) -3 3 0.50 2.00
Feeder to BTS jumper (dB) -0.5 0.5 0.89 1.12
LNA (dB) 12 1.4 15.85 1.38
Node B Noise Figure (dB) 3 3 2.00 2.00
System NF (linear) 3.63
System NF (dB) 5.59 Receiver sensitivity (dBm) -123.14
RRU near the antenna
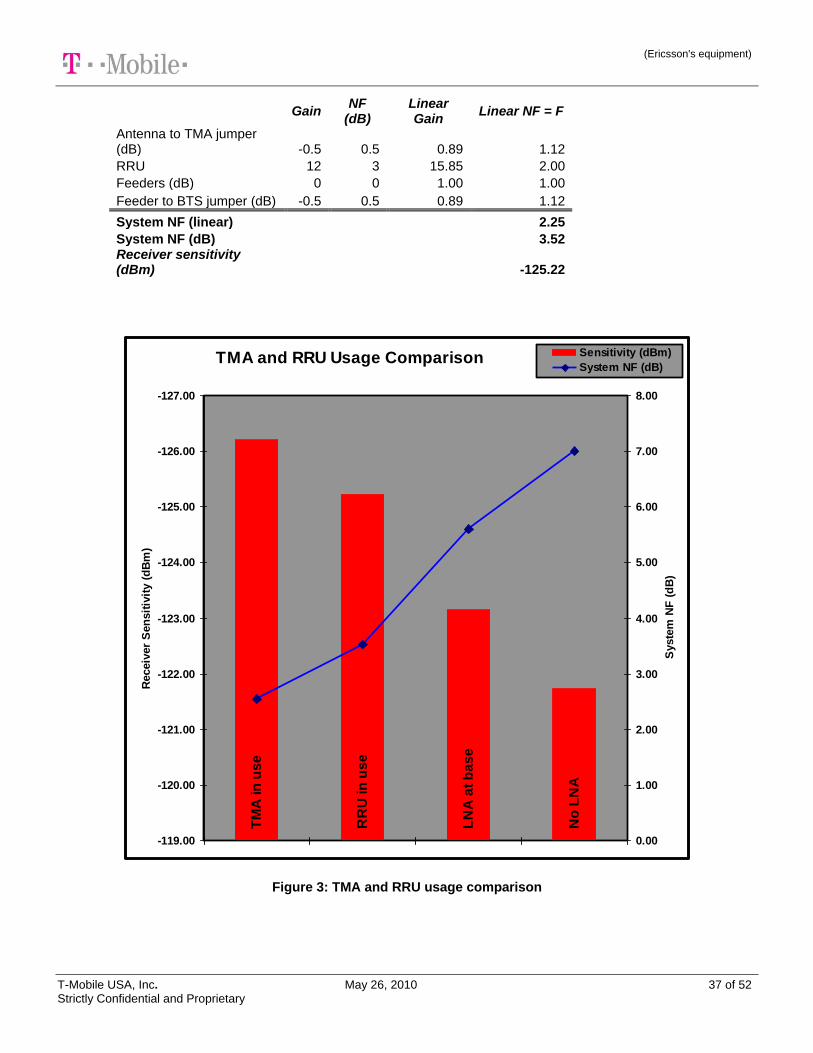
(Ericsson's equipment)
T-Mobile USA, Inc. May 26, 2010 37 of 52 Strictly Confidential and Proprietary
Gain NF
(dB) Linear Gain
Linear NF = F
Antenna to TMA jumper (dB) -0.5 0.5 0.89 1.12
RRU 12 3 15.85 2.00
Feeders (dB) 0 0 1.00 1.00
Feeder to BTS jumper (dB) -0.5 0.5 0.89 1.12
System NF (linear) 2.25
System NF (dB) 3.52 Receiver sensitivity (dBm) -125.22
Figure 3: TMA and RRU usage comparison
TMA and RRU Usage Comparison
-127.00
-126.00
-125.00
-124.00
-123.00
-122.00
-121.00
-120.00
-119.00
TM
A in
us
e
RR
U in
us
e
LN
A a
t b
as
e
No
LN
A
Receiv
er
Sen
sit
ivit
y (
dB
m)
0.00
1.00
2.00
3.00
4.00
5.00
6.00
7.00
8.00
Syste
m N
F (
dB
)
Sensitivity (dBm)
System NF (dB)
(Ericsson's equipment)
T-Mobile USA, Inc. May 26, 2010 38 of 52 Strictly Confidential and Proprietary
6.7 Choosing the Right TMA
Adding TMAs increases the investment in the network. Selecting the right product is paramount to achieving greater returns without increasing maintenance costs.
The TMA should be selected, installed and forgotten. It should be as reliable as the coaxial cable it is connected to.
The TMA must:
Be easily added to a site installation
Include excellent “out of band” frequency rejection
Include Antenna Interface Standards Group (AISG) recommended specifications for digital remote control and monitoring
Use heavily de-rated electronic components and robust moisture-proof coaxial cable connectors
Be housed in a strong weatherproof enclosure made from materials that are corrosion-resistant
Be lightning-strike protected
Be physically tested for the following at time of design and manufacture
A. Sound design and construction by vibration testing B. Thermal reliability and stability by temperature testing C. Pressure tested to ensure the design continues to work over a range of different installation
altitudes
These last three tests can only be achieved using the right laboratory equipment
6.8 Recommendation
TMAs shall be implemented on all cells to enhance coverage/penetration by offsetting the feeder loss and improving the uplink sensitivity and overall system noise figure. However, there are situations where TMAs may not be required. The exceptions are outlined below:
1. In case RRUs can be used and can be installed close to the antennas, then TMAs are not recommended, even if the GSM system has TMAs or the site is serving rural or dense urban areas. This recommendation is applicable only if the regular coax cables are not being used; instead fiber optic cables are used so there is no feeder loss to be considered.
2. Microcells in any type of environment that are intended to cover short distances.
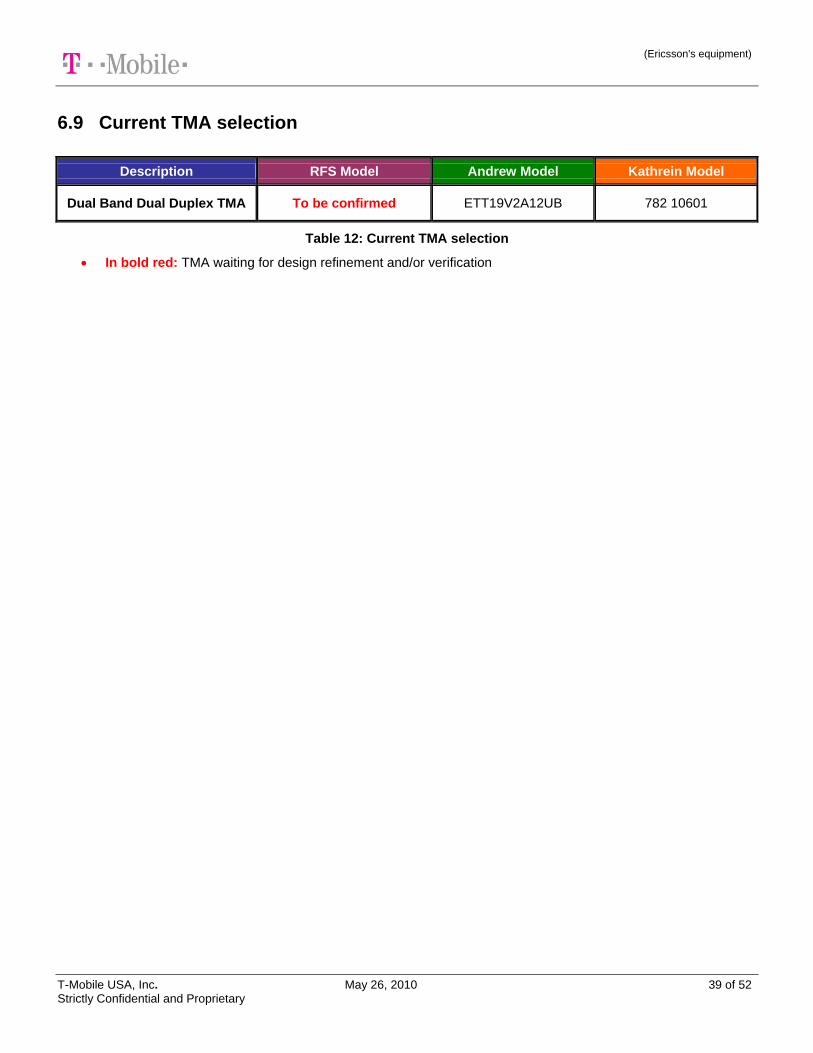
(Ericsson's equipment)
T-Mobile USA, Inc. May 26, 2010 39 of 52 Strictly Confidential and Proprietary
6.9 Current TMA selection
Description RFS Model Andrew Model Kathrein Model
Dual Band Dual Duplex TMA To be confirmed ETT19V2A12UB 782 10601
Table 12: Current TMA selection
In bold red: TMA waiting for design refinement and/or verification
(Ericsson's equipment)
T-Mobile USA, Inc. May 26, 2010 40 of 52 Strictly Confidential and Proprietary
7 Site location and design criteria Site positioning
The constraints brought by the existing 2G-network need to be included into the design of the 3G-network. This section is highlighting the major items:
The 3G-network should come as an almost one-to-one overlay over the 2G-network. This means that the 2G-sites must be considered for co-location and provides the grid for the 3G-design in a best-effort mode. This must be assessed on a per-market basis though, since the 2G-site-density varies a lot across the country; some areas may not justify the same site density in 3G-phase-One, some others may already require site densification to cope with 3G requirements.
The 2G system performance shall not be impacted whatsoever solution is chosen for the 3G design. This implies that azimuths cannot be tuned for 3G if antennas are shared by both 2G and 3G systems.
High sites8 must be avoided in all circumstances.
If a 2G site is too high, then it must be excluded. Solutions using other existing sites must be all exhausted before considering adding a new site.
If the specific configuration of a site constrains the two systems (both 3G and 2G) to use the same antenna tuning (tilts and/or azimuths), then the site may be excluded since the traffic increase may impact the 3G quality (and if the antenna system is retuned, then the 2G quality may be impacted)
A certain degree of cell coverage overlap is required for the smooth functioning of soft and softer handovers and thus provides ubiquitous service coverage. However, if cell-overlap in the network exceeds certain limits, it is increasing the interference level for a low actual contribution to the macrodiversity. The site overlap should occur only in areas of fast-decreasing energy fields to limit at maximum the outer-cell interference levels. As an example, assuming a 2-slope radio propagation model (if d is the distance from the site, first slope would be proportional to 1/d
2, second slope would be proportional to 1/d
4), the site overlap should happen only
in the 1/d4-slope zone. This should insure the best outer-cell interference control.
Use antennas with no more than 65 degrees horizontal beam width for 3-sectored sites, and no more than 33 degrees for 6-sectored sites.
Neighbor list control
From existing CDMA networks (i.e. cdma2000 and WCDMA-UMTS), it has been highlighted that RF control efficiency will translate first in controlling the neighbor list length and accuracy.
The neighbor list (either direct neighbor list or compounded neighbor list) shall be limited to allow the mobile to update its measurements on neighbors often enough, as well as reducing the amount of information transmitted across the network interfaces.
As a reference number, the UMTS-intra-carrier-neighbor list length after network optimization shall not be longer than 15 to 20 neighbors. This order of magnitude applies as well for the UMTS-inter-carrier-neighbor list and the IRAT-neighbor list. Exceptions may exist but shall stay in low traffic areas.
8 We would define a “high site” as a relative notion. All site heights should be homogeneous: a high site would be a site that is 25% higher than its neighbors (up to the third tier). The site heights shall be also coherent with the clutter height to insure clearance without covering further than the intended coverage.
(Ericsson's equipment)
T-Mobile USA, Inc. May 26, 2010 41 of 52 Strictly Confidential and Proprietary
8 Indoor Coverage The description “Indoor Coverage” encompasses all location where radiating elements (either UEs or UMTS Base Station Antennas) are located inside a construction or a closed area. So for this purposes “Indoor Coverage” includes areas such as buildings or groups of buildings (commercial buildings, suburban houses, shopping malls, university campuses, airport terminals, etc) and also tunnels.
The main constraints and aims of indoor coverage can be listed as:
Provide a high quality coverage inside the closed area (e.g. on all floors of a commercial building)
Avoid leakage outside of the building or closed structure
Minimize the deployment cost
Minimize the side effects (health regulation, electromagnetic compatibility, etc)
Offer dedicated capacity for the indoor traffic levels and application requirements
As far as the design is concerned, indoor remains a challenge by itself:
Indoor propagation is specific to each building and therefore difficult to model
All floors should be covered the same way, which imply planning on a very large vertical scale for some of the commercial buildings or housing buildings (e.g. towers in city downtowns).
Indoor coverage often means deep indoor coverage to the users
Indoor capacity requirements will vary from floor to floor and from day time to evening time (e.g. parking levels versus office levels; business hours versus evening and night hours); services need to be planned accurately including these differences
The previous bullet is directly link to the difficulty of containing the RF. It may be difficult to provide the needed capacity for indoor users of a commercial building during office hours and avoid important RF leakage when the traffic demand is not met anymore (at evenings and nights, during the weekends)
Indoor users profile highly differs from typical outdoor user profiles (indoor profiles have typically a much lower mobility, higher throughput expectations).
UMTS cell size is dependent of the number of simultaneous users, hence no predefined cell size can be reliably stated
Most often in indoor the multipath delays are much lower than outdoor and lower than 1 chip9. The Rake receiver is not able to distinguish the different multipaths at such low delays and there is a loss in time diversity compared to outdoor results.
The indoor coverage may be provided in three different ways:
From outdoor Node-Bs
From repeaters with outdoor feeders
From indoor sites
8.1 Indoor coverage by outdoor sites
Typically the indoor coverage from outdoor sites is targeting limited and strictly localized indoor traffic.
Covering building from outdoor sites induce coverage limitations that need to be acknowledged in the first place during the design:
9 Typical values to be considered would be less than 50 ns in homes, less than 100 ns in offices and less than 250 ns in manufactures. As a reminder, a UMTS chip is slightly larger than 260 ns, which would be the minimum delay spread to consider for the Rake receiver to distinguish between multipaths.
(Ericsson's equipment)
T-Mobile USA, Inc. May 26, 2010 42 of 52 Strictly Confidential and Proprietary
Building penetration losses and composite standard deviations should be used in the link budgets
In case of macrocell sites (antennas above roof level), only the upper floors will have deep indoor coverage whereas the lowest floors may have barely indoor coverage.
In case of microcell sites (antennas under roof level, at the level of second or third floors maximum), lower floors may be well covered in case the microcell antenna is pointing directly at the building. The in-building coverage is factored in the microcell design and is one of its main targets.
The link budget for outdoor coverage will be unbalanced compared to the indoor link budget: the outdoor node-Bs will transmit at high power to reach the indoor UEs, hence increasing strongly the downlink outdoor noise level.
Clutter homogeneity is important.
The indoor coverage by outdoor sites is a solution to be applied in suburban areas and for low-penetration-loss buildings but must be avoided for high indoor traffic commercial areas or in high-rise building locations.
8.2 Indoor coverage by repeaters
Repeaters with outdoor donors (e.g. outdoor neighbor macrocell) may be used to feed an indoor Distributed Antenna System (DAS). The optical repeaters (the signal is conveyed through optical links between the donor and the repeater remote unit) may be the easiest solution although not the cheapest.
Because of in-building penetration losses, this is the most spectrum-efficient solution. Losses of external walls, ceiling or floors in-between stories need to be assessed accurately first (most often by measurements).
However, this is reliable only for low indoor traffic capacity and it assumes that the outdoor macrocell is fairly over-dimensioned to support the indoor capacity requirement without sacrificing outdoor services.
In case of RF repeaters (the link between the donor and the repeater is an RF link) the gains need to be accurately tuned to avoid any node-B desensitizing or Node-B receiver blocking.
Repeater uses may be restricted due to E-911 requirements (see Repeaters).
8.3 Indoor coverage by dedicated indoor sites
The best solution for high indoor traffic sites and high-rise buildings is to provide the coverage from the indoor.
This is best done by specific indoor coverage (e.g. distributed antenna systems from an indoor-node-B; picocells distributed in the building; leaky cables).
Design need to be carefully planned for avoiding outdoor leakage. Antennas shall be directed inwards to the center of the building and potential back-lobes should be contained by protections behind the antennas (e.g. concrete walls or reflectors).
Handover areas must be contained. Even with containing as much as possible the signal within the building and tuning the outdoor signal to avoid as much as possible any in-building penetration, the UEs close to windows will most probably enter in macrodiversity with outdoor sectors. This can bring about capacity issues, since the outdoor site should not provide any gain in the RF but codes and channel elements will be used on the outdoor sites for traffic coming from indoor. The efficiency of indoor sites will decrease with low-penetration-loss building.
Indoor-to-and-from-outdoor transitions must be carefully planned and tuned.
If the RF can be efficiently contains between indoor and outdoor, indoor capacity may be boosted by the fact that the specific indoor site will behave as a single isolated cell without or with very low out-of-cell interference.
8.4 Summary on indoor coverage
Indoor coverage from outdoor sites is suitable to buildings with limited and localized indoor traffic and buildings with low-penetration losses. This is the preferred solution for homes in suburban areas. This solution brings usually a high increase in downlink noise level for outdoor UEs.
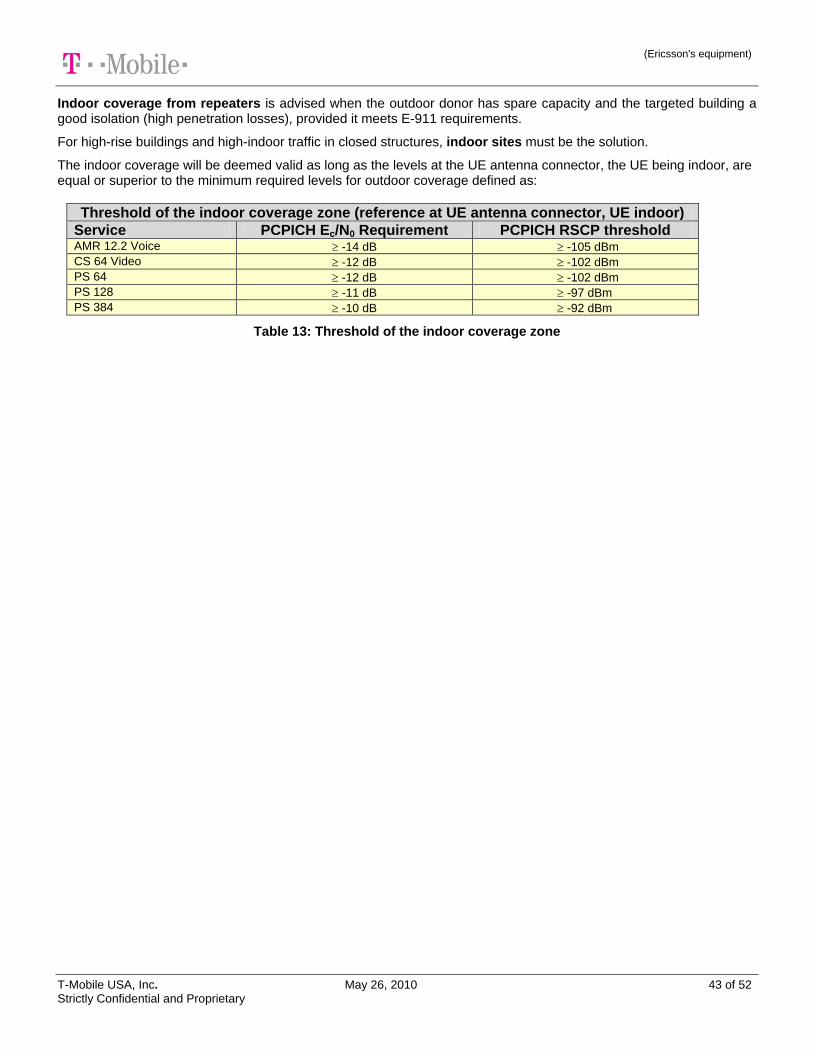
(Ericsson's equipment)
T-Mobile USA, Inc. May 26, 2010 43 of 52 Strictly Confidential and Proprietary
Indoor coverage from repeaters is advised when the outdoor donor has spare capacity and the targeted building a good isolation (high penetration losses), provided it meets E-911 requirements.
For high-rise buildings and high-indoor traffic in closed structures, indoor sites must be the solution.
The indoor coverage will be deemed valid as long as the levels at the UE antenna connector, the UE being indoor, are equal or superior to the minimum required levels for outdoor coverage defined as:
Threshold of the indoor coverage zone (reference at UE antenna connector, UE indoor)
Service PCPICH Ec/N0 Requirement PCPICH RSCP threshold AMR 12.2 Voice -14 dB -105 dBm
CS 64 Video -12 dB -102 dBm
PS 64 -12 dB -102 dBm
PS 128 -11 dB -97 dBm
PS 384 -10 dB -92 dBm
Table 13: Threshold of the indoor coverage zone
(Ericsson's equipment)
T-Mobile USA, Inc. May 26, 2010 44 of 52 Strictly Confidential and Proprietary
9 Repeaters Due to E-911 legal requirements, there is currently no product available as UMTS repeaters.
However, would an E-911-compliant UMTS repeater appear on the market, it should be considered as an efficient solution to provide coverage using spare capacity of low loaded sites into hot spots or coverage holes. It would also be handy for providing indoor coverage from outdoor low-loaded macrocells, avoiding the penetration loss issues.
Repeater can however be considered for indoor coverage if they do not hamper with the E-911 coverage.
(Ericsson's equipment)
T-Mobile USA, Inc. May 26, 2010 45 of 52 Strictly Confidential and Proprietary
10 Scrambling Code Planning This section focuses on downlink scrambling code planning.
Scrambling codes can be planned for UE-to-network synchronization efficiency or for UE-battery efficiency:
1. A few number of code groups are used for a site and its neighbors, all cells of a same site bear different scrambling codes of the same group. This allows shortening the synchronization time on neighbor cells, hence increasing the initial network acquisition and the soft handover efficiency. However the cost is more processing required from the UE (for symbol-to-symbol correlations), hence a shorter battery life and higher processing efficiency requirements.
2. Different scrambling code groups are used on all cells. This will lower the UE processing requirements at the expense of the synchronization time. This may then result in poorer network performance.
Obviously, a trade-off between both methods should be found, even though it sounds better in a network point of view to choose the first proposition. The reason is that UMTS will be first deployed in high-density environments where cell acquisition efficiency may matter the most.
In this context it shall be also considered to tune the frame timing offset between cells. A shorter or no timing offset may lead to increase the synchronization efficiency on P-SCH and S-SCH.
Details on the specific scrambling code planning methodology can be found on the UMTS RF Design using Asset 3G (section 13) [A3G].
(Ericsson's equipment)
T-Mobile USA, Inc. May 26, 2010 46 of 52 Strictly Confidential and Proprietary
11 Planning and Design process This part proposes a process to be followed jointly by T-Mobile USA‟s teams and the vendor teams.
11.1 Step 1: 2G site audits
All 2G sites on the area targeted for 3G-coverage must be thoroughly audited during site visits. All characteristics of each site shall be reported through a site audit document.
From this first audit, a list of 3G-nonconforming sites must be created. These sites shall not be considered for 3G build-out due to miscellaneous reasons:
Too high8
Too many constraints for co-location (must use shared antennas between 2G and 3G, not enough space, imply a move of 2G-aerials or a re-engineering of the site, etc)
No 3G-diversity possible when needed
etc
11.2 Step 2: 2G site database check
The 2G-site database must be crosschecked and updated with the site audit results. This includes, but is not limited to: feeders and jumpers characteristics (e.g. actual losses), TMAs, clutter accuracy (model in the planning tool vs. observations during the site visit), mechanical tilts, electronic tilts, azimuths, antenna types and numbers, antenna RCs, etc
11.3 Step 3: 3G site database and 3G blueprint
Create the 3G-site database from the list of 3G-conforming sites identified through the 2G-site audit. The 2G-sites to be considered for 3G shall be at least the on-air and hard-cost sites, meaning all sites that will be reliably on-air within the launch date plus 3 months.
Selected 3G-antennas, vendor equipment characteristics, UE characteristics must be entered in the design-tool database.
This step includes the default settings of all parameters such as (but not limited to) power settings, neighbor lists, macrodiversity parameters, etc.
This will constitute the 3G blueprint of the network for the first estimation.
11.4 Step 4: 2G traffic audit
From the 2G-network, the real traffic levels shall be audited and localized as precisely as possible: GSM-voice traffic and GPRS/EDGE-data traffic, if possible by type of service.
From this traffic map and the 3G UE-penetration forecasts, a 3G-anticipation shall be drafted to forecast the voice, data and video-call traffic expected at the end of the first year after launch on the targeted 3G-area.
This will give the 3G-traffic raster.
11.5 Step 5: Link budget
A 3G-link-budget must be created and adjusted to the market specificities and vendor specificities. This will lead to a first estimation of the number of sites and can be quickly compared to the 3G blueprint to anticipate the needed corrections: too few sites, too many sites, etc. The 3G-link-budget values will be also of importance for the simulations.
(Ericsson's equipment)
T-Mobile USA, Inc. May 26, 2010 47 of 52 Strictly Confidential and Proprietary
11.6 Step 6: Setting parameters for coverage analysis and Monte-Carlo simulation
Details on all settings and how to set them are provided under the UMTS RF Design Using Asset 3G
11.7 Step 7: Verification
The WCDMA Monte-Carlo simulation can be run on the design resulting from the ACP output. The following analyses must be considered on the simulation results:
Primary Pilot Coverage: from the PCPICH_RSCP plot, check the areas without coverage. These identify the coverage holes due to lack of RF energy. These holes need to be fixed by providing enough RF energy in them.
Primary Pilot Pollution Control: the downlink best server plot will show how well the RF is controlled, showing the containment efficiency. Each of the best server must be contained in the area of coverage and must not overshoot or resurge in unexpected places. Deeper analyses may be done by plotting the actual coverage of one cell only: this will show all the containment issues for this very cell, compared to the target coverage area.
Primary Pilot Quality Control: from the PCPICH_Ec/N0 plot, an estimation of the signal quality can be done. The poor PCPICH_Ec/N0 areas will identify the bad quality areas. This may be due to lack of RF energy (but this should have been already identified), pilot pollution (this should have been also mostly solved previously by the RF control and containment) or inadequacy between the design and the traffic level.
Macrodiversity control: from the soft-handover plot, the macrodiversity zones shall be checked. The areas with too many pilots planned in the active set must be reduced to the very minimum, where areas with too low macrodiversity may be reviewed.
3G and 2G: overlaps between both networks at the 3G-coverage border must be checked; also, no holes within the 3G-network should allow a UE to go down to the 2G-network, especially when the network is loaded.
These analyses may suggest a number of changes to be made even after running the ACP: adding sites, removing sites, improving sites, changing hard-parameters (typically aerial parameters), changing soft-parameters (SHO thresholds, triggers, minimum and maximum power allowed, etc). Changing the overall power distribution (starting with CPICH power changed on a site-by-site basis) shall be avoided or kept as a last-resource solution.
11.8 Step 8: Iterations
The improvements deduced from the previous step are entered into the network and a new simulation is run.
Commencing from the results of the new simulation, the same analyses shall be repeated, at a possibly deeper level.
Iterations shall be continued until the network reached the desired quality level for the estimated traffic. The final exit criteria may be defined on a market-by-market basis, but in any case they should be better or equal to the best of the GSM quality performances for the related area and the values stated in the KPI document [KPI]. Please refer to [A3G], section “Optimal Design (loaded case)” for the exact design target values.
The number of iterations must be reduced to a couple, since the ACP must have given a result close to the best possible design.
As a final step after the final iteration, a simulation with low load shall be run to check that the quality level is kept within a satisfying margin with the network tuned for higher loads.
11.9 Step 9: Finalize
When the latest iteration is completed and the result is deemed satisfactory, then the final plots must be stored and a final report written, including the rationales for the different modifications and all the special cases.
This will be of importance for the network follow-up and especially for the pre-launch optimization.
(Ericsson's equipment)
T-Mobile USA, Inc. May 26, 2010 48 of 52 Strictly Confidential and Proprietary
11.10 Step 10: Automatic Cell Planning (ACP)
ACP tool can be used to check and optimize the design. Currently there are trials evaluating 3 different ACP vendors.
11.11 Step 11: Data transfer to Ericsson
The outputs to be sent to Ericsson for the RF design verification are the following:
Mapdata
Model Tuning Info
1. CW raw data
2. Measurement site info
3. Model tuning Results and Parameters
Complete Asset Project
1. XML format
2. Traffic per cell files (*.tpc and/or *.tri/*.trr)
3. UMTS and GSM (as needed for inter-RAT verification)
Successful Simulations for Speech
1. Arrays - Best Server, Traffic, Monte Carlo (*.3gr file)
2. Plots - CPICH RSCP, CPICH Ec/No, SHO Areas
3. Statistics - ASSET Generated Report containing all statistics in Excel format.
Polygons
1. Service Area Polygons for Speech, CS64, PS64 in Mapinfo tab format, based on speech simulations.
2. Exemption Area Polygons in Mapinfo tab format
Equipment Specs
1. Antenna Patterns for all tilts
2. Antenna Line Product specs
Access to Site Audit Information
1. Optimization Constrains per cell
2. Summary spreadsheet from RFDS and Site Audit documentation.
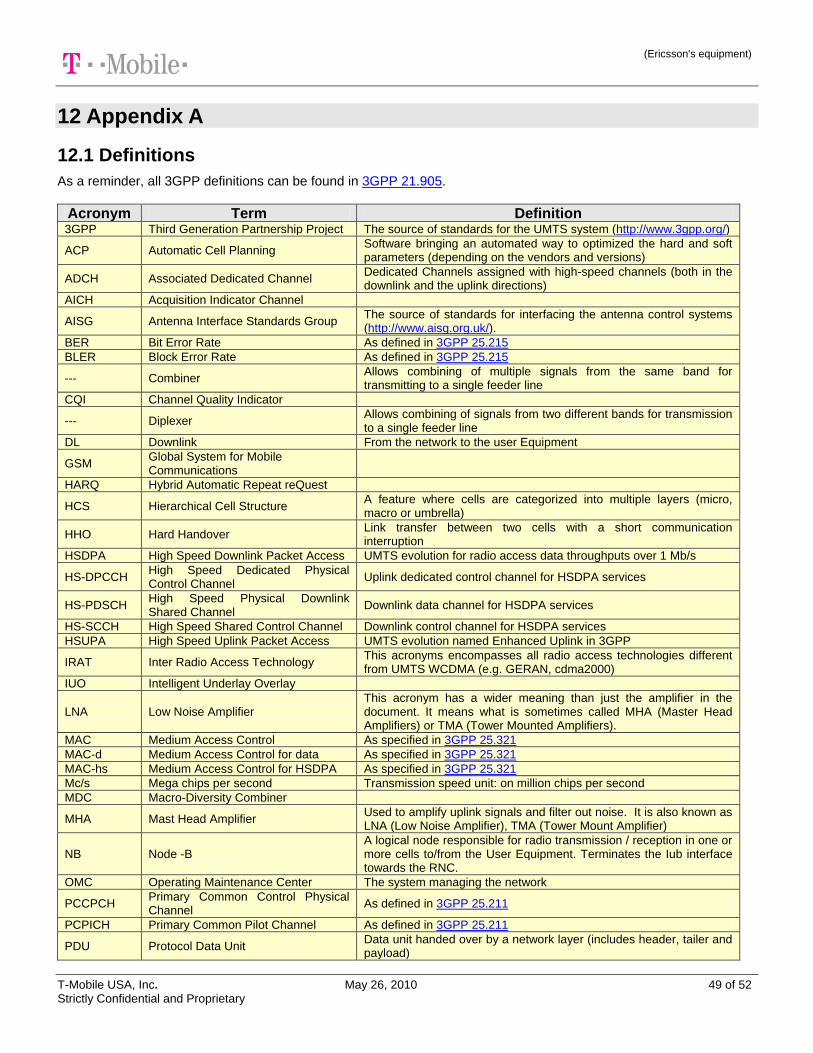
(Ericsson's equipment)
T-Mobile USA, Inc. May 26, 2010 49 of 52 Strictly Confidential and Proprietary
12 Appendix A
12.1 Definitions
As a reminder, all 3GPP definitions can be found in 3GPP 21.905.
Acronym Term Definition 3GPP Third Generation Partnership Project The source of standards for the UMTS system (http://www.3gpp.org/)
ACP Automatic Cell Planning Software bringing an automated way to optimized the hard and soft parameters (depending on the vendors and versions)
ADCH Associated Dedicated Channel Dedicated Channels assigned with high-speed channels (both in the downlink and the uplink directions)
AICH Acquisition Indicator Channel
AISG Antenna Interface Standards Group The source of standards for interfacing the antenna control systems (http://www.aisg.org.uk/).
BER Bit Error Rate As defined in 3GPP 25.215
BLER Block Error Rate As defined in 3GPP 25.215
--- Combiner Allows combining of multiple signals from the same band for transmitting to a single feeder line
CQI Channel Quality Indicator
--- Diplexer Allows combining of signals from two different bands for transmission to a single feeder line
DL Downlink From the network to the user Equipment
GSM Global System for Mobile Communications
HARQ Hybrid Automatic Repeat reQuest
HCS Hierarchical Cell Structure A feature where cells are categorized into multiple layers (micro, macro or umbrella)
HHO Hard Handover Link transfer between two cells with a short communication interruption
HSDPA High Speed Downlink Packet Access UMTS evolution for radio access data throughputs over 1 Mb/s
HS-DPCCH High Speed Dedicated Physical Control Channel
Uplink dedicated control channel for HSDPA services
HS-PDSCH High Speed Physical Downlink Shared Channel
Downlink data channel for HSDPA services
HS-SCCH High Speed Shared Control Channel Downlink control channel for HSDPA services
HSUPA High Speed Uplink Packet Access UMTS evolution named Enhanced Uplink in 3GPP
IRAT Inter Radio Access Technology This acronyms encompasses all radio access technologies different from UMTS WCDMA (e.g. GERAN, cdma2000)
IUO Intelligent Underlay Overlay
LNA Low Noise Amplifier This acronym has a wider meaning than just the amplifier in the document. It means what is sometimes called MHA (Master Head Amplifiers) or TMA (Tower Mounted Amplifiers).
MAC Medium Access Control As specified in 3GPP 25.321
MAC-d Medium Access Control for data As specified in 3GPP 25.321
MAC-hs Medium Access Control for HSDPA As specified in 3GPP 25.321
Mc/s Mega chips per second Transmission speed unit: on million chips per second
MDC Macro-Diversity Combiner
MHA Mast Head Amplifier Used to amplify uplink signals and filter out noise. It is also known as LNA (Low Noise Amplifier), TMA (Tower Mount Amplifier)
NB Node -B A logical node responsible for radio transmission / reception in one or more cells to/from the User Equipment. Terminates the Iub interface towards the RNC.
OMC Operating Maintenance Center The system managing the network
PCCPCH Primary Common Control Physical Channel
As defined in 3GPP 25.211
PCPICH Primary Common Pilot Channel As defined in 3GPP 25.211
PDU Protocol Data Unit Data unit handed over by a network layer (includes header, tailer and payload)
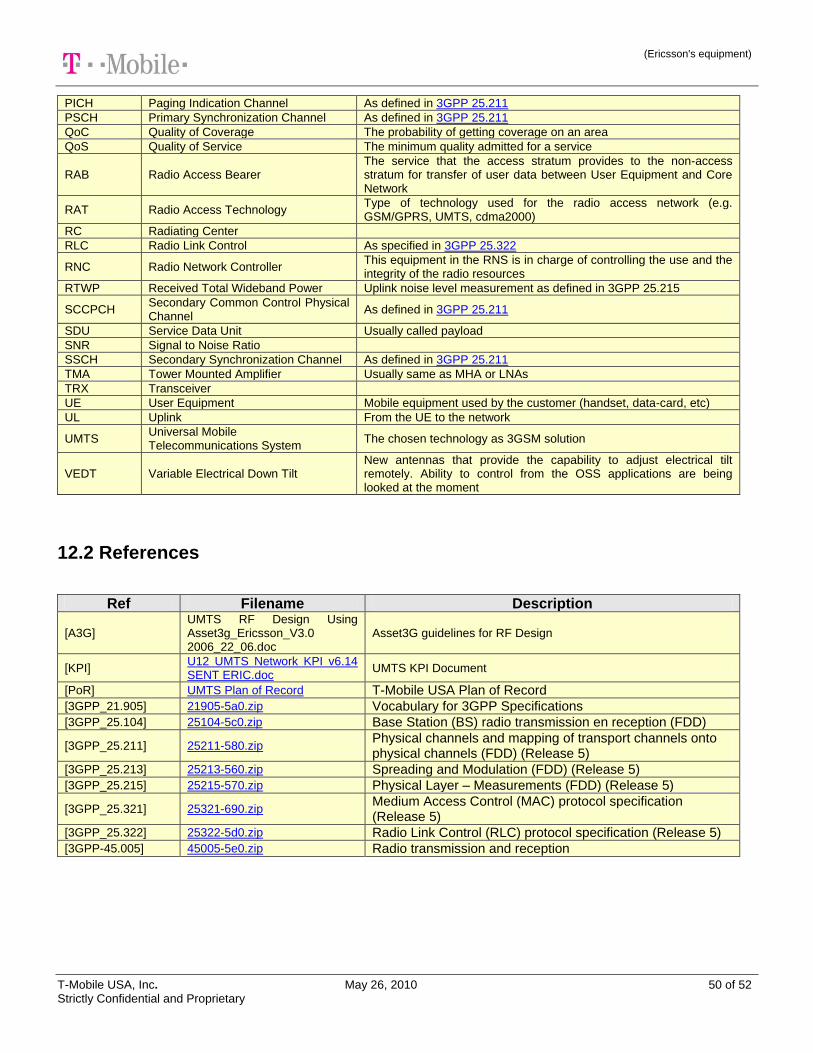
(Ericsson's equipment)
T-Mobile USA, Inc. May 26, 2010 50 of 52 Strictly Confidential and Proprietary
PICH Paging Indication Channel As defined in 3GPP 25.211
PSCH Primary Synchronization Channel As defined in 3GPP 25.211
QoC Quality of Coverage The probability of getting coverage on an area
QoS Quality of Service The minimum quality admitted for a service
RAB Radio Access Bearer The service that the access stratum provides to the non-access stratum for transfer of user data between User Equipment and Core Network
RAT Radio Access Technology Type of technology used for the radio access network (e.g. GSM/GPRS, UMTS, cdma2000)
RC Radiating Center
RLC Radio Link Control As specified in 3GPP 25.322
RNC Radio Network Controller This equipment in the RNS is in charge of controlling the use and the integrity of the radio resources
RTWP Received Total Wideband Power Uplink noise level measurement as defined in 3GPP 25.215
SCCPCH Secondary Common Control Physical Channel
As defined in 3GPP 25.211
SDU Service Data Unit Usually called payload
SNR Signal to Noise Ratio
SSCH Secondary Synchronization Channel As defined in 3GPP 25.211
TMA Tower Mounted Amplifier Usually same as MHA or LNAs
TRX Transceiver
UE User Equipment Mobile equipment used by the customer (handset, data-card, etc)
UL Uplink From the UE to the network
UMTS Universal Mobile Telecommunications System
The chosen technology as 3GSM solution
VEDT Variable Electrical Down Tilt New antennas that provide the capability to adjust electrical tilt remotely. Ability to control from the OSS applications are being looked at the moment
12.2 References
Ref Filename Description
[A3G] UMTS RF Design Using Asset3g_Ericsson_V3.0 2006_22_06.doc
Asset3G guidelines for RF Design
[KPI] U12 UMTS Network KPI v6.14 SENT ERIC.doc
UMTS KPI Document
[PoR] UMTS Plan of Record T-Mobile USA Plan of Record [3GPP_21.905] 21905-5a0.zip Vocabulary for 3GPP Specifications [3GPP_25.104] 25104-5c0.zip Base Station (BS) radio transmission en reception (FDD)
[3GPP_25.211] 25211-580.zip Physical channels and mapping of transport channels onto physical channels (FDD) (Release 5)
[3GPP_25.213] 25213-560.zip Spreading and Modulation (FDD) (Release 5) [3GPP_25.215] 25215-570.zip Physical Layer – Measurements (FDD) (Release 5)
[3GPP_25.321] 25321-690.zip Medium Access Control (MAC) protocol specification (Release 5)
[3GPP_25.322] 25322-5d0.zip Radio Link Control (RLC) protocol specification (Release 5) [3GPP-45.005] 45005-5e0.zip Radio transmission and reception
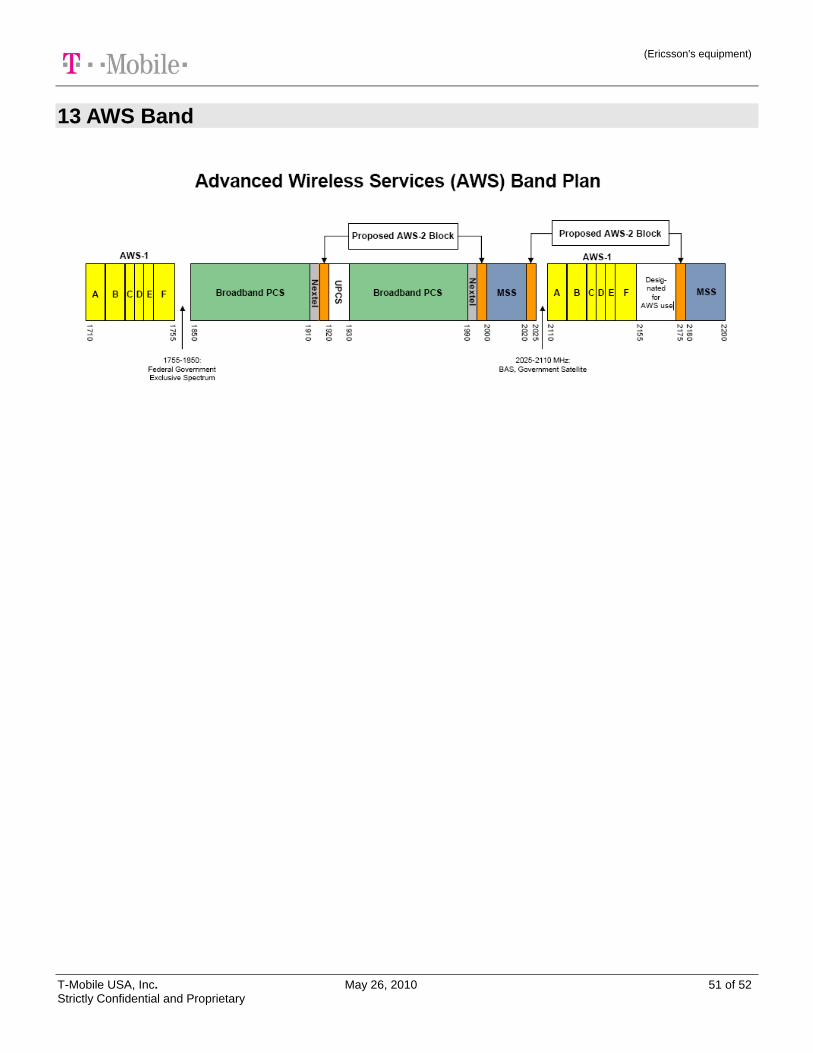
(Ericsson's equipment)
T-Mobile USA, Inc. May 26, 2010 51 of 52 Strictly Confidential and Proprietary
13 AWS Band
(Ericsson's equipment)
T-Mobile USA, Inc. May 26, 2010 52 of 52 Strictly Confidential and Proprietary
Document History
Version Date Comments 1.0 08/17/2006 Initial version from internal document
2.0 10/02/2006 Integrated the first round of comments
3.0 10/10/2006 Final update and final agreed document
3.1 10/16/2006 Update on the HS-SCCH power for link budget and Asset3g simulations
3.2 11/14/2006 Updated the deliverables and the internal targets
3.3 11/20/2006 Duplicated the power settings table (without and with HSDPA) for more clarity
3.4 11/22/2006 Agreed version
3.5 11/30/2006 Change of the internal UeMaxTxPwr (TRP = 16 dBm from TMO‟s UE team)
3.6 12/22/2006 Update the internal coverage threshold targets (Table 2) due to expected
poorer UE performances
3.7 01/17/2007 Correction in the sensitivity table (TMA section)