Embed Size (px)
Citation preview
1
SASOL SOUTH AFRICA (PTY) LTDUnaudited Financial Information
30 June 2017

2
Sasol South Africa (Pty) Ltd
Registration number 1968/013914/07
Unaudited Financial Information for the year ended 30 June 2017
Contents
Page
Income statement 3
Statement of comprehensive income 3
Statement of financial position 4
Statement of changes in equity 5
Statement of cash flows 6
Notes to the financial information 7
This financial information has not been audited or approved by the directors.

3
Income Statementfor the year ended 30 June
2017 2016Note Rm Rm
Turnover 1 80 083 77 948Materials, energy and consumables used 2 (35 641) (31 564)Selling and distribution costs (2 624) (2 977)Maintenance expenditure (4 749) (5 017)Employee-related expenditure 3 (12 584) (11 043)Exploration expenditure and feasibility costs (591) (672)Depreciation and amortisation (8 447) (8 067)Other expenses and income (4 649) (4 934)
Translation (losses)/gains 4 (619) 1 020Other operating expenses and income 5 (4 030) (5 954)
Remeasurement items 7 (6 165) (16 317)Equity accounted profits net of tax 18 10 6Operating profit/(loss) 4 643 (2 637)Finance income 6 1 253 739Finance costs 6 (2 578) (1 744)Profit/(loss) before tax 3 318 (3 642)Taxation 9 47 981
Profit/(loss) for the year 3 365 (2 661)
Statement of comprehensive incomefor the year ended 30 June
2017 2016Rm Rm
Profit/(loss) for the year 3 365 (2 661)Other comprehensive income, net of taxItems that can be subsequently reclassified to the income statement 3 4 Effect of cash flow hedges 4 5 Tax on items that can be subsequently reclassified to the income statement (1) (1)Items that cannot be subsequently reclassified to the income statement (5) 245 Remeasurement on post-retirement benefit obligation (7) 341 Tax on items that cannot be subsequently reclassified to the income statement 2 (96)
Total comprehensive income/(loss) for the year 3 363 (2 412)
4
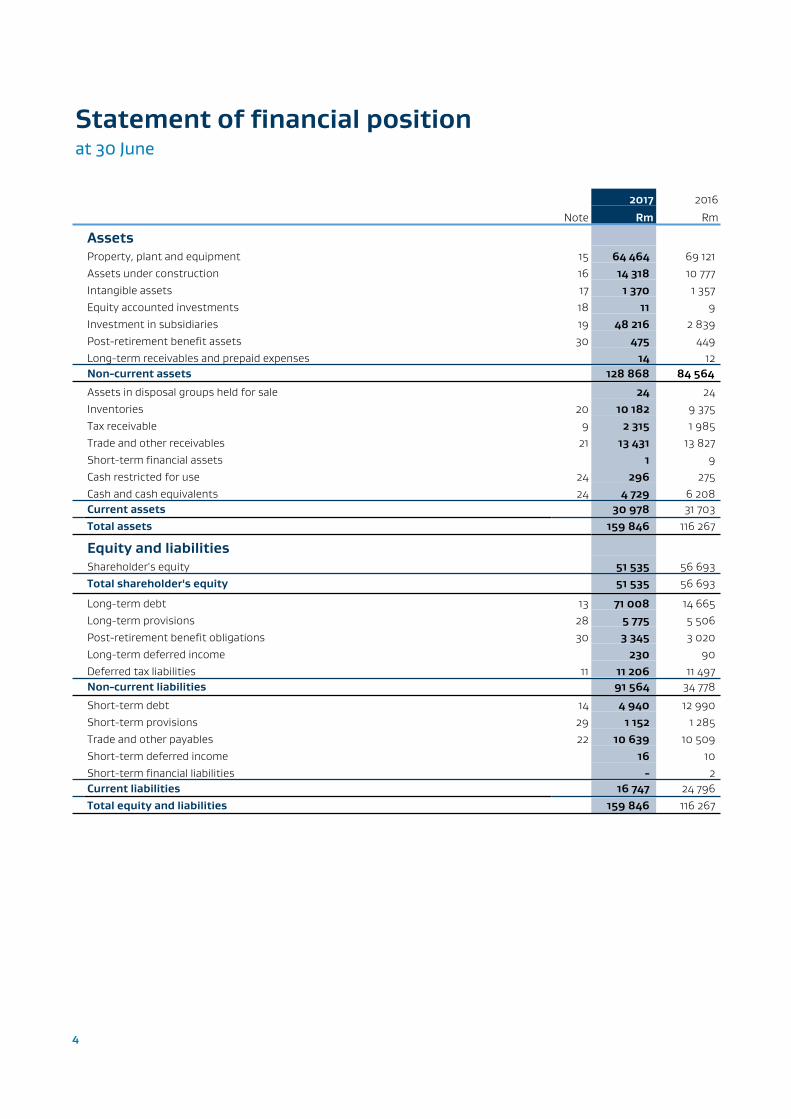
Statement of financial positionat 30 June
2017 2016
Note Rm Rm
AssetsProperty, plant and equipment 15 64 464 69 121Assets under construction 16 14 318 10 777Intangible assets 17 1 370 1 357Equity accounted investments 18 11 9Investment in subsidiaries 19 48 216 2 839Post-retirement benefit assets 30 475 449Long-term receivables and prepaid expenses 14 12Non-current assets 128 868 84 564
Assets in disposal groups held for sale 24 24Inventories 20 10 182 9 375Tax receivable 9 2 315 1 985Trade and other receivables 21 13 431 13 827Short-term financial assets 1 9Cash restricted for use 24 296 275Cash and cash equivalents 24 4 729 6 208Current assets 30 978 31 703Total assets 159 846 116 267
Equity and liabilitiesShareholder's equity 51 535 56 693Total shareholder's equity 51 535 56 693
Long-term debt 13 71 008 14 665Long-term provisions 28 5 775 5 506Post-retirement benefit obligations 30 3 345 3 020Long-term deferred income 230 90Deferred tax liabilities 11 11 206 11 497Non-current liabilities 91 564 34 778
Short-term debt 14 4 940 12 990Short-term provisions 29 1 152 1 285Trade and other payables 22 10 639 10 509Short-term deferred income 16 10Short-term financial liabilities - 2Current liabilities 16 747 24 796Total equity and liabilities 159 846 116 267
5
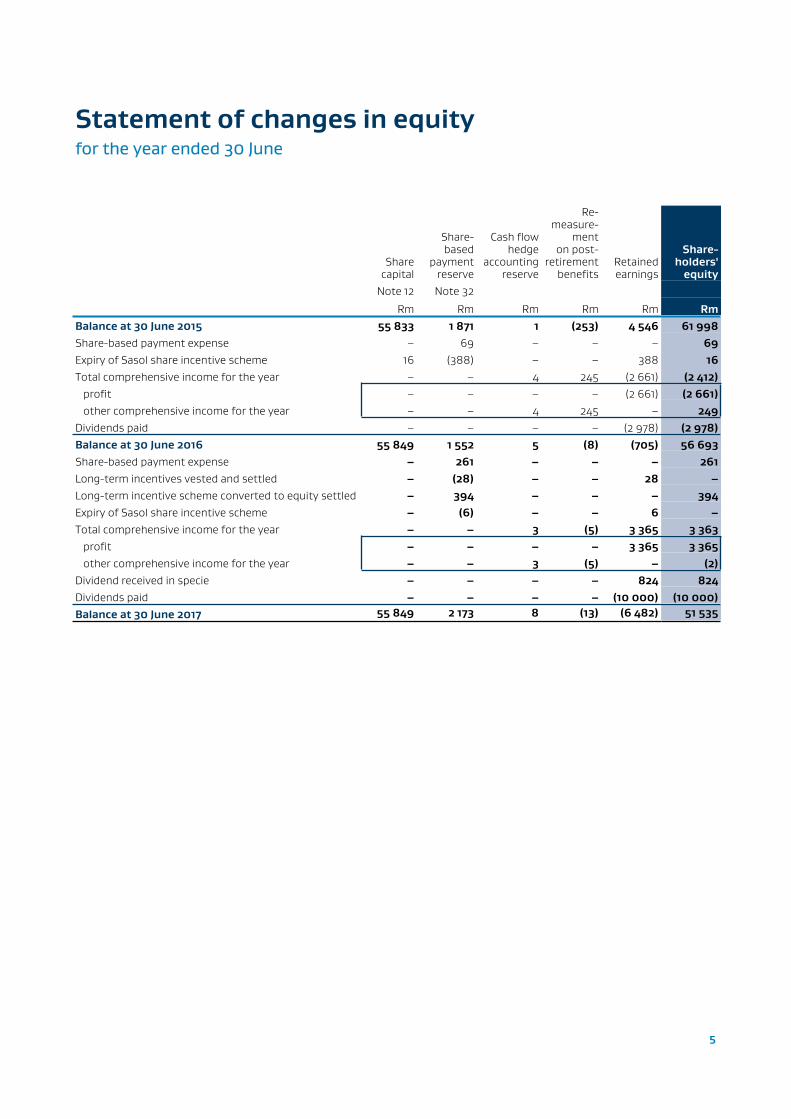
Statement of changes in equityfor the year ended 30 June
Share capital
Share-based
payment reserve
Cash flow hedge
accountingreserve
Re-measure-
menton post-
retirementbenefits
Retainedearnings
Share-holders'
equityNote 12 Note 32
Rm Rm Rm Rm Rm RmBalance at 30 June 2015 55 833 1 871 1 (253) 4 546 61 998Share-based payment expense – 69 – – – 69Expiry of Sasol share incentive scheme 16 (388) – – 388 16Total comprehensive income for the year – – 4 245 (2 661) (2 412) profit – – – – (2 661) (2 661) other comprehensive income for the year – – 4 245 – 249Dividends paid – – – – (2 978) (2 978)Balance at 30 June 2016 55 849 1 552 5 (8) (705) 56 693Share-based payment expense – 261 – – – 261Long-term incentives vested and settled – (28) – – 28 –Long-term incentive scheme converted to equity settled – 394 – – – 394Expiry of Sasol share incentive scheme – (6) – – 6 –Total comprehensive income for the year – – 3 (5) 3 365 3 363 profit – – – – 3 365 3 365 other comprehensive income for the year – – 3 (5) – (2)Dividend received in specie – – – – 824 824Dividends paid – – – – (10 000) (10 000)Balance at 30 June 2017 55 849 2 173 8 (13) (6 482) 51 535
6
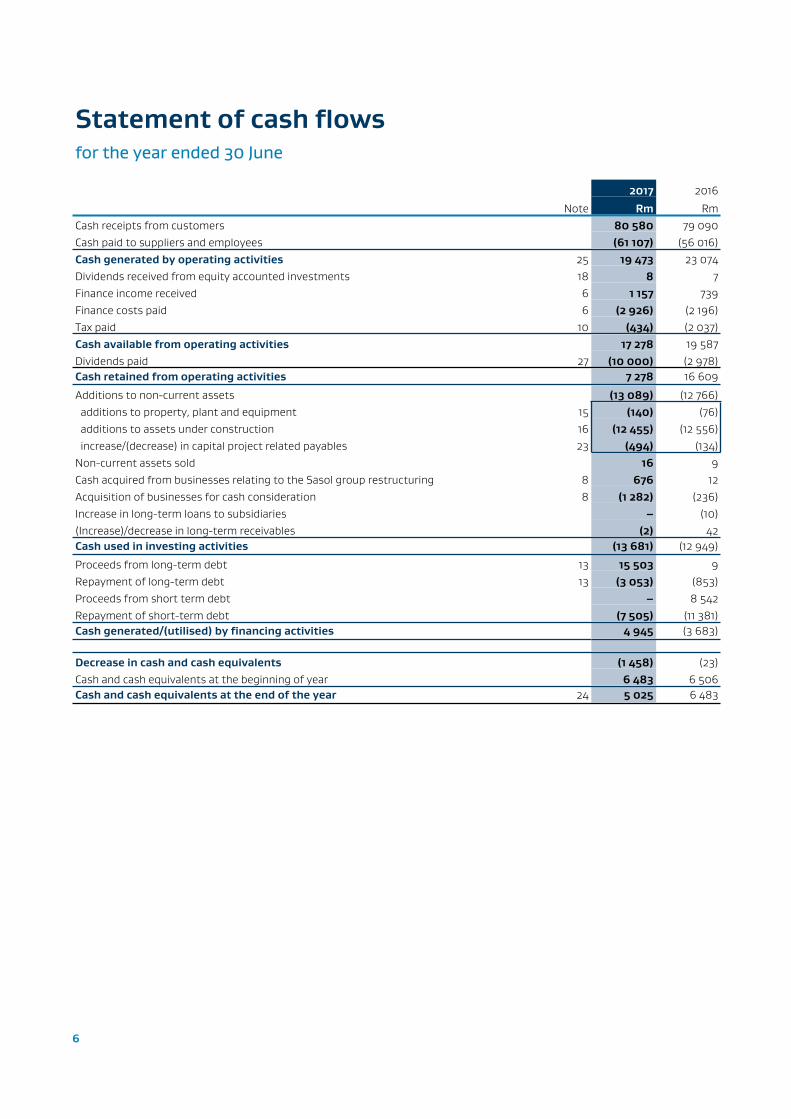
Statement of cash flowsfor the year ended 30 June
2017 2016
Note Rm RmCash receipts from customers 80 580 79 090Cash paid to suppliers and employees (61 107) (56 016)Cash generated by operating activities 25 19 473 23 074Dividends received from equity accounted investments 18 8 7Finance income received 6 1 157 739Finance costs paid 6 (2 926) (2 196)Tax paid 10 (434) (2 037)Cash available from operating activities 17 278 19 587Dividends paid 27 (10 000) (2 978)Cash retained from operating activities 7 278 16 609
Additions to non-current assets (13 089) (12 766) additions to property, plant and equipment 15 (140) (76) additions to assets under construction 16 (12 455) (12 556) increase/(decrease) in capital project related payables 23 (494) (134)Non-current assets sold 16 9Cash acquired from businesses relating to the Sasol group restructuring 8 676 12Acquisition of businesses for cash consideration 8 (1 282) (236)Increase in long-term loans to subsidiaries – (10)(Increase)/decrease in long-term receivables (2) 42Cash used in investing activities (13 681) (12 949)
Proceeds from long-term debt 13 15 503 9Repayment of long-term debt 13 (3 053) (853)Proceeds from short term debt – 8 542Repayment of short-term debt (7 505) (11 381)Cash generated/(utilised) by financing activities 4 945 (3 683)
Decrease in cash and cash equivalents (1 458) (23)Cash and cash equivalents at the beginning of year 6 483 6 506Cash and cash equivalents at the end of the year 24 5 025 6 483
7
Notes to the financial information
2017 2016
for the year ended 30 June Rm Rm
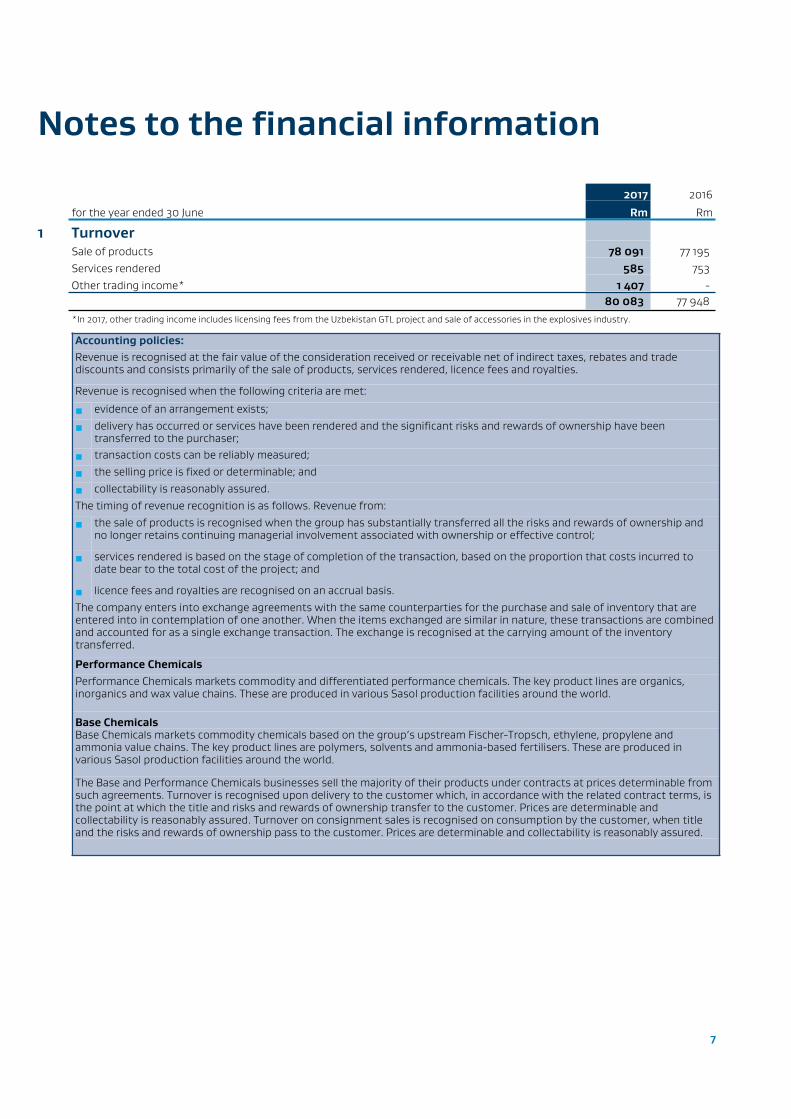
1 TurnoverSale of products 78 091 77 195Services rendered 585 753Other trading income* 1 407 -
80 083 77 948
*In 2017, other trading income includes licensing fees from the Uzbekistan GTL project and sale of accessories in the explosives industry.
Accounting policies:Revenue is recognised at the fair value of the consideration received or receivable net of indirect taxes, rebates and trade discounts and consists primarily of the sale of products, services rendered, licence fees and royalties.
Revenue is recognised when the following criteria are met:
■ evidence of an arrangement exists;
■ delivery has occurred or services have been rendered and the significant risks and rewards of ownership have been transferred to the purchaser;
■ transaction costs can be reliably measured;
■ the selling price is fixed or determinable; and
■ collectability is reasonably assured.The timing of revenue recognition is as follows. Revenue from:
■ the sale of products is recognised when the group has substantially transferred all the risks and rewards of ownership and no longer retains continuing managerial involvement associated with ownership or effective control;
■ services rendered is based on the stage of completion of the transaction, based on the proportion that costs incurred to date bear to the total cost of the project; and
■ licence fees and royalties are recognised on an accrual basis.The company enters into exchange agreements with the same counterparties for the purchase and sale of inventory that are entered into in contemplation of one another. When the items exchanged are similar in nature, these transactions are combined and accounted for as a single exchange transaction. The exchange is recognised at the carrying amount of the inventory transferred.
Performance ChemicalsPerformance Chemicals markets commodity and differentiated performance chemicals. The key product lines are organics, inorganics and wax value chains. These are produced in various Sasol production facilities around the world.
Base ChemicalsBase Chemicals markets commodity chemicals based on the group’s upstream Fischer-Tropsch, ethylene, propylene and ammonia value chains. The key product lines are polymers, solvents and ammonia-based fertilisers. These are produced in various Sasol production facilities around the world.
The Base and Performance Chemicals businesses sell the majority of their products under contracts at prices determinable from such agreements. Turnover is recognised upon delivery to the customer which, in accordance with the related contract terms, is the point at which the title and risks and rewards of ownership transfer to the customer. Prices are determinable and collectability is reasonably assured. Turnover on consignment sales is recognised on consumption by the customer, when title and the risks and rewards of ownership pass to the customer. Prices are determinable and collectability is reasonably assured.
8
The date of delivery is determined in accordance with the contractual agreements entered into with customers which are as follows:
Delivery terms Title and risks, and rewards of ownership pass to the customer:
Ex-tank salesWhen products are loaded into the customer’s vehicle or unloaded from the seller’s storage tanks.
Ex-works When products are loaded into the customer’s vehicle or unloaded at the seller’s premises.Carriage Paid To On delivery of products to a specified location (main carriage is paid for by the seller).Free on Board When products are loaded into the transport vehicle – the customer is responsible for
shipping and handling costs.
Cost of Insurance Freight and Cost Freight Railage
When products are loaded into the transport vehicle – the seller is responsible for shipping and handling costs which are included in the selling price.
Proof of Delivery When products are delivered to and signed for by the customer.
Consignment Sales As and when products are consumed by the customer.
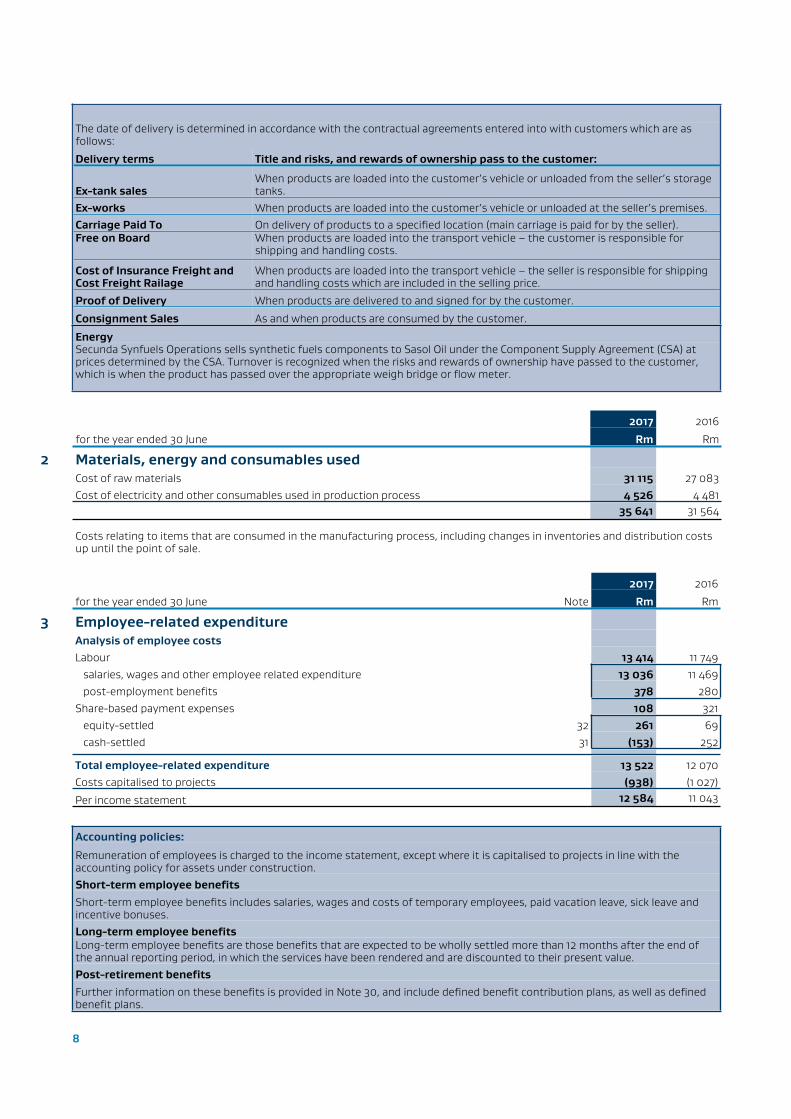
EnergySecunda Synfuels Operations sells synthetic fuels components to Sasol Oil under the Component Supply Agreement (CSA) at prices determined by the CSA. Turnover is recognized when the risks and rewards of ownership have passed to the customer, which is when the product has passed over the appropriate weigh bridge or flow meter.
2017 2016
for the year ended 30 June Rm Rm
2 Materials, energy and consumables usedCost of raw materials 31 115 27 083Cost of electricity and other consumables used in production process 4 526 4 481
35 641 31 564
Costs relating to items that are consumed in the manufacturing process, including changes in inventories and distribution costs up until the point of sale.
2017 2016
for the year ended 30 June Note Rm Rm
3 Employee-related expenditureAnalysis of employee costsLabour 13 414 11 749 salaries, wages and other employee related expenditure 13 036 11 469 post-employment benefits 378 280Share-based payment expenses 108 321 equity-settled 32 261 69 cash-settled 31 (153) 252
Total employee-related expenditure 13 522 12 070Costs capitalised to projects (938) (1 027)
Per income statement 12 584 11 043
Accounting policies:
Remuneration of employees is charged to the income statement, except where it is capitalised to projects in line with the accounting policy for assets under construction. Short-term employee benefitsShort-term employee benefits includes salaries, wages and costs of temporary employees, paid vacation leave, sick leave and incentive bonuses. Long-term employee benefits Long-term employee benefits are those benefits that are expected to be wholly settled more than 12 months after the end of the annual reporting period, in which the services have been rendered and are discounted to their present value.Post-retirement benefitsFurther information on these benefits is provided in Note 30, and include defined benefit contribution plans, as well as defined benefit plans.
9
2017 2016
for the year ended 30 June Rm Rm
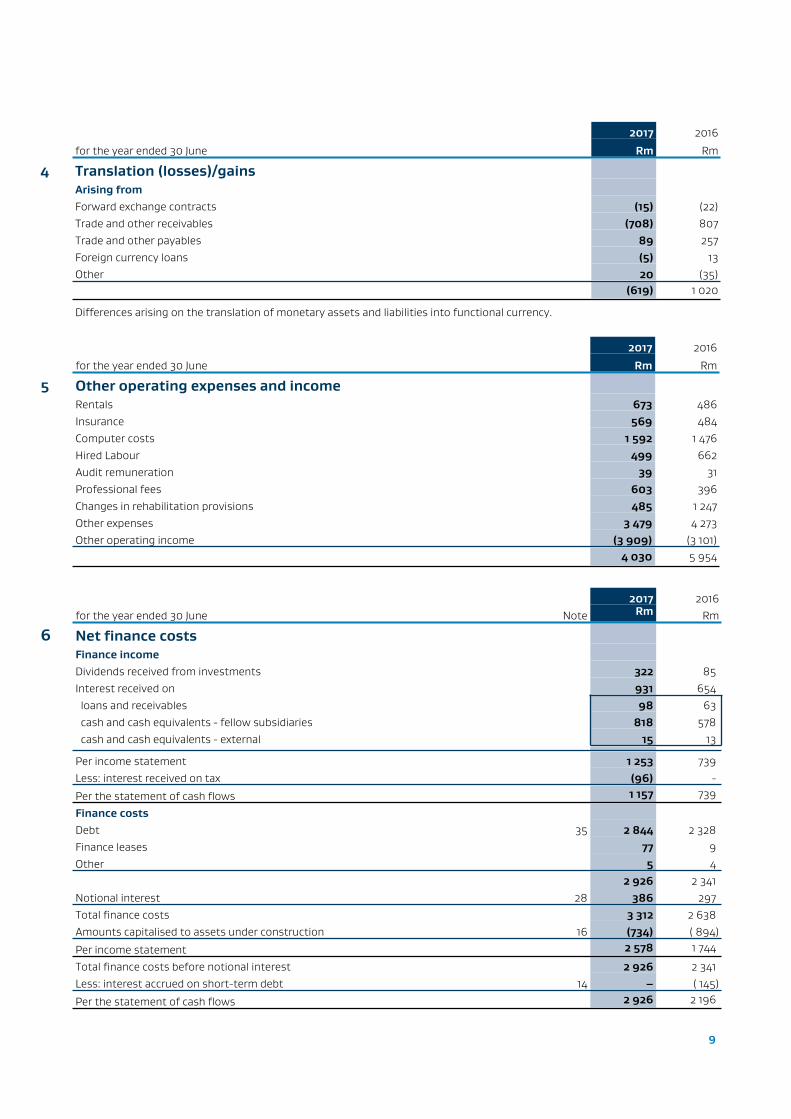
4 Translation (losses)/gainsArising fromForward exchange contracts (15) (22)Trade and other receivables (708) 807Trade and other payables 89 257Foreign currency loans (5) 13Other 20 (35)
(619) 1 020
Differences arising on the translation of monetary assets and liabilities into functional currency.
2017 2016
for the year ended 30 June Rm Rm
5 Other operating expenses and incomeRentals 673 486Insurance 569 484Computer costs 1 592 1 476Hired Labour 499 662Audit remuneration 39 31Professional fees 603 396Changes in rehabilitation provisions 485 1 247Other expenses 3 479 4 273Other operating income (3 909) (3 101)
4 030 5 954
2017 2016for the year ended 30 June Note Rm Rm
6 Net finance costsFinance incomeDividends received from investments 322 85Interest received on 931 654 loans and receivables 98 63 cash and cash equivalents - fellow subsidiaries 818 578 cash and cash equivalents - external 15 13
Per income statement 1 253 739Less: interest received on tax (96) -
Per the statement of cash flows 1 157 739
Finance costsDebt 35 2 844 2 328Finance leases 77 9Other 5 4
2 926 2 341Notional interest 28 386 297Total finance costs 3 312 2 638Amounts capitalised to assets under construction 16 (734) ( 894)
Per income statement 2 578 1 744
Total finance costs before notional interest 2 926 2 341Less: interest accrued on short-term debt 14 – ( 145)
Per the statement of cash flows 2 926 2 196
10
2017 2016
for the year ended 30 June Note Rm Rm
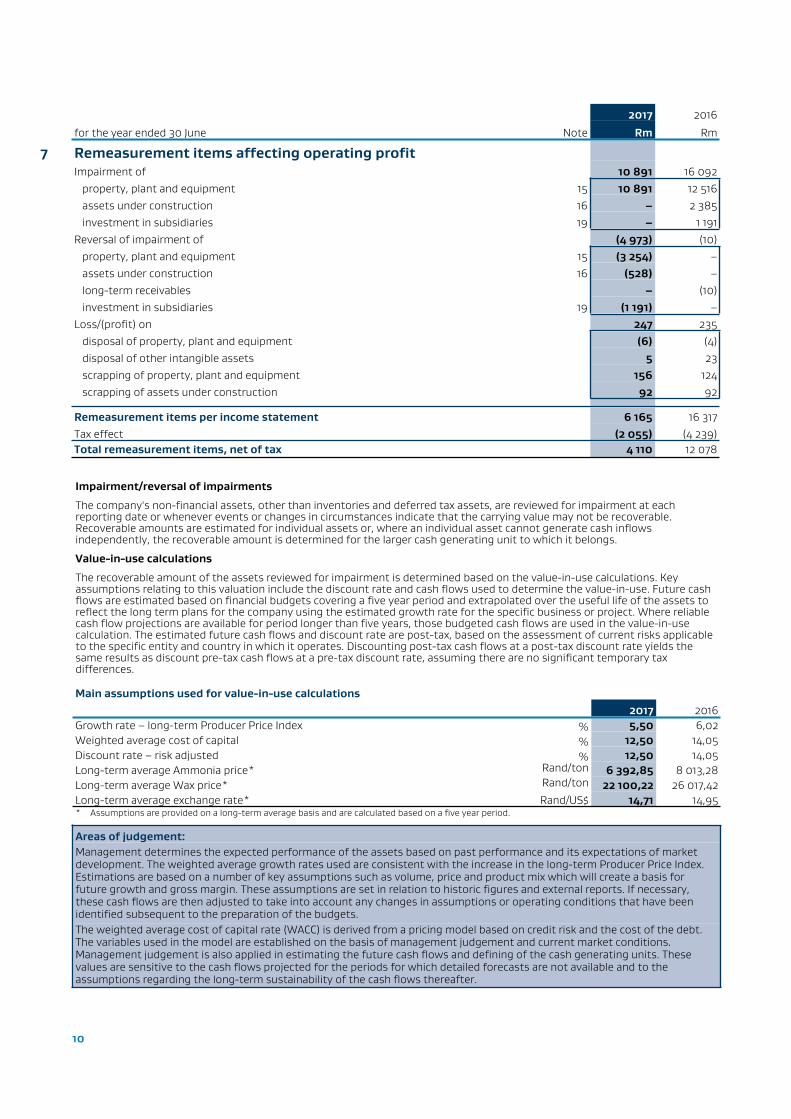
7 Remeasurement items affecting operating profitImpairment of 10 891 16 092 property, plant and equipment 15 10 891 12 516 assets under construction 16 – 2 385 investment in subsidiaries 19 – 1 191Reversal of impairment of (4 973) (10) property, plant and equipment 15 (3 254) – assets under construction 16 (528) – long-term receivables – (10) investment in subsidiaries 19 (1 191) –Loss/(profit) on 247 235 disposal of property, plant and equipment (6) (4) disposal of other intangible assets 5 23 scrapping of property, plant and equipment 156 124 scrapping of assets under construction 92 92
Remeasurement items per income statement 6 165 16 317Tax effect (2 055) (4 239)Total remeasurement items, net of tax 4 110 12 078
Impairment/reversal of impairments
The company's non-financial assets, other than inventories and deferred tax assets, are reviewed for impairment at each reporting date or whenever events or changes in circumstances indicate that the carrying value may not be recoverable. Recoverable amounts are estimated for individual assets or, where an individual asset cannot generate cash inflows independently, the recoverable amount is determined for the larger cash generating unit to which it belongs.
Value-in-use calculations
The recoverable amount of the assets reviewed for impairment is determined based on the value-in-use calculations. Key assumptions relating to this valuation include the discount rate and cash flows used to determine the value-in-use. Future cash flows are estimated based on financial budgets covering a five year period and extrapolated over the useful life of the assets to reflect the long term plans for the company using the estimated growth rate for the specific business or project. Where reliable cash flow projections are available for period longer than five years, those budgeted cash flows are used in the value-in-use calculation. The estimated future cash flows and discount rate are post-tax, based on the assessment of current risks applicable to the specific entity and country in which it operates. Discounting post-tax cash flows at a post-tax discount rate yields the same results as discount pre-tax cash flows at a pre-tax discount rate, assuming there are no significant temporary tax differences.
Main assumptions used for value-in-use calculations2017 2016
Growth rate – long-term Producer Price Index % 5,50 6,02Weighted average cost of capital % 12,50 14,05Discount rate – risk adjusted % 12,50 14,05Long-term average Ammonia price* Rand/ton 6 392,85 8 013,28Long-term average Wax price* Rand/ton 22 100,22 26 017,42Long-term average exchange rate* Rand/US$ 14,71 14,95* Assumptions are provided on a long-term average basis and are calculated based on a five year period.
Areas of judgement:Management determines the expected performance of the assets based on past performance and its expectations of market development. The weighted average growth rates used are consistent with the increase in the long-term Producer Price Index. Estimations are based on a number of key assumptions such as volume, price and product mix which will create a basis for future growth and gross margin. These assumptions are set in relation to historic figures and external reports. If necessary, these cash flows are then adjusted to take into account any changes in assumptions or operating conditions that have been identified subsequent to the preparation of the budgets.The weighted average cost of capital rate (WACC) is derived from a pricing model based on credit risk and the cost of the debt. The variables used in the model are established on the basis of management judgement and current market conditions. Management judgement is also applied in estimating the future cash flows and defining of the cash generating units. These values are sensitive to the cash flows projected for the periods for which detailed forecasts are not available and to the assumptions regarding the long-term sustainability of the cash flows thereafter.

11
7 Remeasurement items affecting operating profit continuedSignificant impairments of assets in 2017
Base Chemicals cash generating units (CGUs)
At 30 June 2017 the prior period impairment in the Polythene and the Mining Reagents and Chlor Vinyls CGU’s were reversed by R2 036 million and R1 211 million, respectively. At 30 June 2017 the recoverable amounts of the Polythene and the Mining Reagents and Chlor Vinyls CGU’s are R10 176 million and R3 083 million, respectively.
The impairment reversals were largely due to stronger product prices driven by a revised outlook in respect of new on-stream global ethylene capacity.
The Blends and Mining Chemicals and the Methanol CGU’s were further impaired by R15 million and R207 million, respectively. At 30 June 2017 the recoverable amounts of the Blends and Mining Chemicals and the Methanol CGUs are negative R707 million and negative R226 million, respectively.
The performance of the Polythene and Mining Reagents and Chlor Vinyls CGUs is highly sensitive to Rand / US$ exchange rate and WACC movements. A 5% change in the exchange rate assumption could change the recoverable amount by approximately R5 353 million for the Polythene CGU and R3 352 million for the Mining Reagents and Chlor Vinyls CGU. A 1% change in the WACC could change the recoverable amount by approximately R661 million for the Polythene CGU and R237 million for the Mining Reagents and Chlor Vinyls CGU. The macro-economic factors are outside of the control of management. We continue to monitor these asset CGUs for further impairments or signs of recovery indicating a reversal of impairment.
Performance Chemicals CGUs
The Performance Chemicals CGUs were further impaired by R10 669 million at 30 June 2017 due to the R6 154 million and R4 155 million impairments in the Wax and the Ammonia CGUs, respectively. At 30 June 2017 the recoverable amounts of the Wax and Ammonia CGUs are R4 052 million and R109 million, respectively.
The performance of the Wax CGU is highly sensitive to the prevailing market prices of Wax, the Rand/US$ and Rand/EUR exchange rate movements. The impairment was largely driven by lower margins resulting from lower sales prices & volumes as well as the strengthening of the Rand against the US Dollar and EURO, when compared to financial year 2016. A 5% change in the Wax sales prices would result in R 2 800 million change in the recoverable amount, whereas a 5% change in the Rand/US$ and Rand/EUR would result in a change of R2 016 million in the recoverable amount. A 1% change in WACC would change the recoverable amount by approximately R370 million.
The impairment in the Ammonia value chain CGU is as a result of the downturn in the commodity and agricultural industries impacting negatively on the performance of the Fertiliser and Explosive businesses within the Ammonia value chain CGU. A further drop in the Ammonia sales prices, due to a global over supply, also contributed to further lowering product margins in 2017.
The recoverable amount of the Ammonia CGU is largely impacted by global Ammonia prices and the Rand/US$ exchange rate. A 5% change in the global Ammonia price or Rand/US$ exchange rate assumptions, could change the recoverable amount by approximately R1 961 million. A 1% change in WACC could change the recoverable amount by approximately R220 million.
The global market prices and macro-economic factors are outside the control of management. We continue to monitor these CGUs for further impairments and signs of recovery indicating a reversal of impairment.
Sasol Acrylates Group
The impairment in the investment in the Sasol Acrylates Group was fully reversed by R1 191 million at 30 June 2017. Sasol Acrylates South Africa (Pty) Ltd fully reversed the impairment of its own assets at 30 June 2017, based on an update in the distributorship agreement between Sasol Acrylates (South Africa) (Pty) Ltd and Sasol Base Chemicals, a division of Sasol South Africa (Pty) Ltd, confirming that the value of the investment in the Sasol Acrylates Group is recoverable.
Significant impairments of assets in prior periods
Base Chemicals cash generating units (CGUs)
The Base Chemicals CGUs were impaired by R7 063 million at 30 June 2016 mainly due to a R3 130 million impairment in the Polythene CGU, a R3 115 million impairment in the Mining Reagents and Chlor Vinyls CGU and a R581 million impairment in the Methyl Isobutl Ketone (MIBK) CGU. At 30 June 2016 the recoverable amounts of the Polythene, Mining Reagents and Chlor Vinyls and MIBK CGUs are R6 515 million, R1 831 million and zero, respectively.
These impairments were largely driven the strengthening of the Rand against the US Dollar and an increase in the WACC. The performance of the Polythene and Mining Reagents and Chlor Vinyls CGUs is highly sensitive to Rand / US$ exchange rate and WACC movements. A 5% change in the exchange rate assumption could change the recoverable amount by approximately R2 123 million for the Polythene CGU and R1 653 million for the Mining Reagents and Chlor Vinyls CGU. A 1% change in the WACC could change the recoverable amount by approximately R340 million for the Polythene CGU and R200 million for the Mining Reagents and Chlor Vinyls CGU. The macro-economic factors are outside of the control of management. We continue to monitor these asset CGUs for further impairments or signs of recovery indicating a reversal of impairment.
Performance Chemicals CGUs
The Performance Chemicals CGUs were impaired by R7 220 million at 30 June 2016 due to the R5 231 million and R1 989 million impairments in the Wax and the Ammonia CGUs, respectively. At 30 June 2016 the recoverable amounts of the Wax and Ammonia CGUs are R10 062 million and R4 833 million, respectively.
The performance of the Wax CGU is highly sensitive to prevailing market prices of Wax and Rand/US$ exchange rate movements. The interdependency of these factors on the sales volumes also has a significant impact on the value in use. The impairment was largely driven by lower margins due to lower sales prices as well as the strengthening of the Rand against the US Dollar. A 5% overall change in the Wax market price and Rand/US$ exchange rate assumptions could change the recoverable amount by approximately R1,3 billion. A 1% change in the WACC could change the recoverable amount by approximately R630 million.
12
The impairment in the Ammonia value chain CGU is as a result of the downturn in the commodity and agricultural industries impacting negatively on the performance of the Fertiliser and Explosive businesses within the Ammonia value chain CGU. A significant drop in Ammonia sales prices, due to a global over supply, also contributed to lower product margins.
The value in use of the Ammonia CGU is heavily impacted by global ammonia prices, the Rand/US$ exchange rate and WACC movements. A 5% change in the global ammonia price and Rand/US$ exchange rate assumptions, considering the related impact on volumes, could change the recoverable amount by approximately R750 million. A 1% change in the WACC could change the recoverable amount by approximately R300 million.
The global market prices and macro-economic factors are outside of the control of management. We continue to monitor these CGUs for further impairments or signs of recovery indicating a reversal of impairment.
Sasol Acrylates Group
The net investment value in the Sasol Acrylates Group was fully impaired by R1 191 million at 30 June 2016. The investment value is not considered to be recoverable, due to the current and expected future product selling prices in the Acrylates market being depressed because of the low global oil price outlook. Sasol Acrylates SA (Pty) Ltd fully impaired its own assets at 30 June 2016 confirming that the value of Sasol South Africa (Pty) Ltd’s (SSA) investment is not recoverable.
Sensitivity to changes in assumptions
Management has considered the sensitivity of the value-in-use calculations to various key assumptions such as commodity prices, exchange rates and the WACC rate. These sensitivities have been taken into consideration in determining the required impairments and reversals of impairments.
Accounting policies:
Remeasurement items are items of income and expense recognised in the income statement that are less closely aligned to the operating or trading activities of the reporting entity and includes, inter alia, the impairment of non-current assets, profit or loss on disposal of non-current assets and scrapping of assets. The company’s non-financial assets, other than inventories and deferred tax assets, are reviewed at each reporting date or whenever events or changes in circumstances indicate that the carrying amount may not be recoverable, to determine whether there is any indication of impairment. An impairment test is performed on all goodwill, intangible assets not yet in use and intangible assets with indefinite useful lives at each reporting date.
The recoverable amount of an asset is defined as the amount that reflects the greater of the fair value less costs of disposal and value in use that can be attributed to an asset as a result of its ongoing use by the entity. Value in use is estimated using a discounted cash flow model. The future cash flows are adjusted for risks specific to the asset and are discounted using a discount rate derived from the group's weighted average cost of capital. The recoverable amount may be adjusted to take into account recent market transactions for a similar asset.
Some assets are an integral part of the value chain but are not capable of generating independent cash flows because there is no active market for the product streams produced from these assets, or the market does not have the ability to absorb the product streams produced from these assets or it is not practically possible to access the market due to infrastructure constraints that would be costly to construct. Product streams produced by these assets form an input into another process and accordingly do not have an active market. These assets are classified as corporate assets in terms of IAS 36 when their output supports the production of multiple product streams that are ultimately sold into an active market.
The company’s corporate assets are allocated to the relevant cash generating unit based on a cost or volume contribution metric. Costs incurred by the corporate asset are allocated to the appropriate cash generating unit at cost. If there is an indication that a corporate asset may be impaired, then the recoverable amount is determined for the cash-generating unit to which the corporate asset belongs.
In Southern Africa, the coal value chain originates with feedstock mined in Secunda and Sasolburg and continues along the integrated processes of the operating business units, ultimately resulting in fuels and chemicals-based product lines. Similarly, the gas value chain starts with the feedstock obtained in Mozambique and continues along the refinement processes in Secunda and Sasolburg, ultimately resulting in fuels and chemicals-based product lines. The groups of assets which support the different product lines, including corporate asset allocations, are considered to be separate cash generating units.
Certain products are sometimes produced incidentally from the main conversion processes and can be sold into active markets. When this is the case, the assets that are directly attributable to the production of these products, are classified as separate cash generating units. The cost of conversion of these products is compared against the revenue when assessing the asset for impairment.

13
2017 2016
for the year ended 30 June Rm Rm
8 Acquisition of businessProperty, plant and equipment 1 152 292Assets under construction 58 2Intangible assets 100 –Post-retirement benefit assets 34 –Deferred tax asset/(liability) 43 (58)Inventory 53 –Trade and other receivables 1 095 –Long-term provisions (449) –Retirement benefit obligations (132) –Trade and other payables (1 339) –Other short-term provisions (9) –Other – –Net book value (excluding cash) 606 236Cash acquired per cash flow statement 676 –Net book value acquired 1 282 236
On 1 July 2016 Sasol South Africa (Pty) Ltd acquired the net book value of Sasol Technology (Pty) Ltd, excluding current registered intellectual property, for a cash consideration of R1,3 billion.
Accounting policies:Common control transactions are business combinations between entities which are ultimately controlled by Sasol Limited. The company applies the predecessor accounting method when accounting for common control transactions, whereby the assets and liabilities of the combining entities are not adjusted to fair value but are rather transferred at their carrying amounts at the date of the transaction. Any difference between the consideration paid/transferred and the net asset value ‘acquired’ is recognised in retained earnings. No new goodwill will be recognised as a result of the common control transaction. The statement of financial position and income statement will be adjusted from the date of the transaction.
2017 2016
for the year ended 30 June Note Rm Rm
9 TaxationSouth African normal tax 200 1 623 current year 360 1 730 prior years (160) (107)Foreign tax – current year – 6
Income tax 200 1 629Deferred tax – South Africa 11 (249) (2 610) current year (260) (2 699) prior years 11 89
Deferred tax – foreign – prior year 11 2 –(47) (981)
14
2017 2016
for the year ended 30 June % %
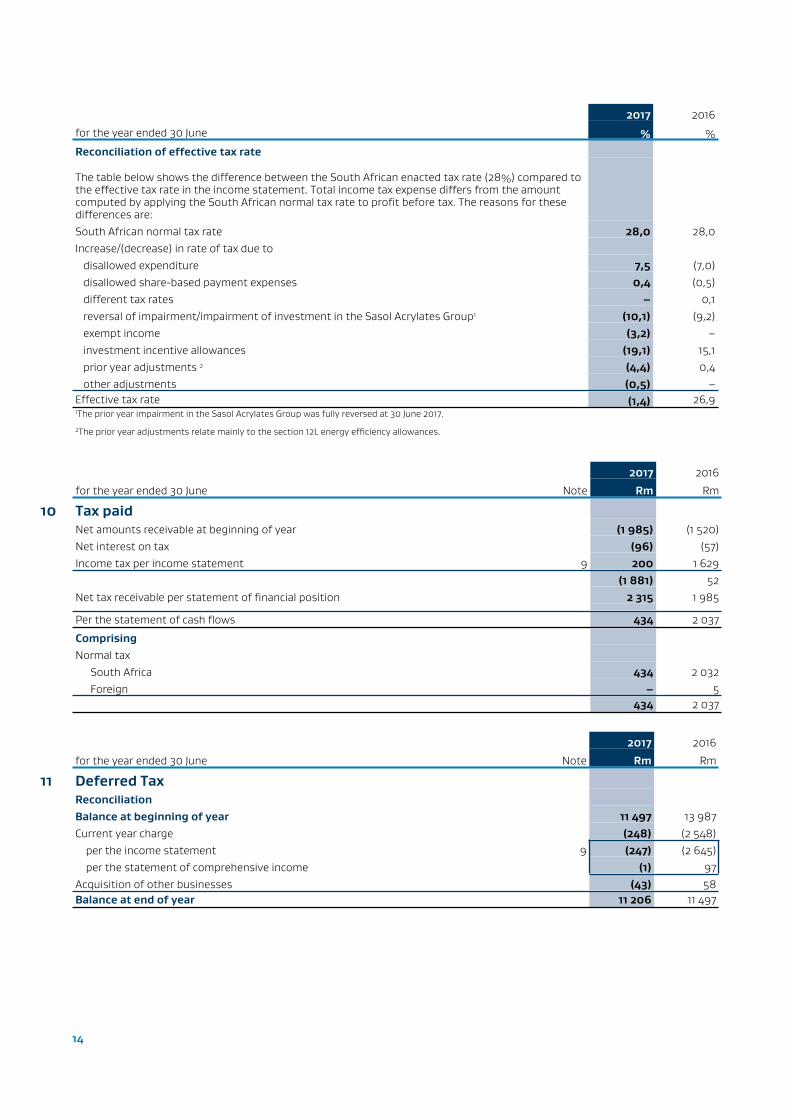
Reconciliation of effective tax rate
The table below shows the difference between the South African enacted tax rate (28%) compared to the effective tax rate in the income statement. Total income tax expense differs from the amount computed by applying the South African normal tax rate to profit before tax. The reasons for these differences are:South African normal tax rate 28,0 28,0Increase/(decrease) in rate of tax due to disallowed expenditure 7,5 (7,0) disallowed share-based payment expenses 0,4 (0,5) different tax rates – 0,1 reversal of impairment/impairment of investment in the Sasol Acrylates Group1 (10,1) (9,2) exempt income (3,2) – investment incentive allowances (19,1) 15,1 prior year adjustments 2 (4,4) 0,4 other adjustments (0,5) –Effective tax rate (1,4) 26,91The prior year impairment in the Sasol Acrylates Group was fully reversed at 30 June 2017.
2The prior year adjustments relate mainly to the section 12L energy efficiency allowances.
2017 2016
for the year ended 30 June Note Rm Rm
10 Tax paidNet amounts receivable at beginning of year (1 985) (1 520)Net interest on tax (96) (57)Income tax per income statement 9 200 1 629
(1 881) 52Net tax receivable per statement of financial position 2 315 1 985
Per the statement of cash flows 434 2 037
ComprisingNormal tax
South Africa 434 2 032Foreign – 5
434 2 037
2017 2016
for the year ended 30 June Note Rm Rm
11 Deferred TaxReconciliationBalance at beginning of year 11 497 13 987Current year charge (248) (2 548) per the income statement 9 (247) (2 645) per the statement of comprehensive income (1) 97Acquisition of other businesses (43) 58Balance at end of year 11 206 11 497

15
2017 2016
for the year ended 30 June Rm Rm
11 Deferred Tax continuedDeferred tax is attributable to temporary differences on the followingNet deferred tax liabilities:Property, plant and equipment 14 675 15 080Current assets (24) 7Current liabilities (193) (195)Short- and long-term provisions (3 090) (2 894)Financial liabilities 2 –Other (161) (501)
11 206 11 497
Accounting policies:The income tax charge is determined based on net income before tax for the year and includes deferred tax.
The current tax charge is the tax payable on the taxable income for the financial year applying enacted or substantively enacted tax rates and includes any adjustments to tax payable in respect of prior years.
Deferred tax is provided for using the liability method, on all temporary differences between the carrying amount of assets and liabilities for accounting purposes and the amounts used for tax purposes and on any tax losses. No deferred tax is provided on temporary differences relating to:■ the initial recognition of goodwill;
■ the initial recognition (other than in a business combination) of an asset or liability to the extent that neither accounting nor taxable profit is affected on acquisition; and
■ investments in subsidiaries, associates and interests in joint arrangements to the extent that the temporary difference will probably not reverse in the foreseeable future and the control of the reversal of the temporary difference lies with the parent, investor, joint venturer or joint operator.
The provision for deferred tax is calculated using enacted or substantively enacted tax rates at the reporting date that are expected to apply when the asset is realised or liability settled.Deferred tax assets and liabilities are offset when the related income taxes are levied by the same taxation authority, there is a legally enforceable right to offset and there is an intention to settle the balances on a net basis.
Areas of judgement:A deferred tax asset is recognised to the extent that it is probable that future taxable profits will be available against which the deferred tax asset can be utilised. The provision of deferred tax assets and liabilities reflects the tax consequences that would follow from the expected recovery or settlement of the carrying amount of its assets and liabilities.
16
2017 2016
for the year ended 30 June Rm Rm
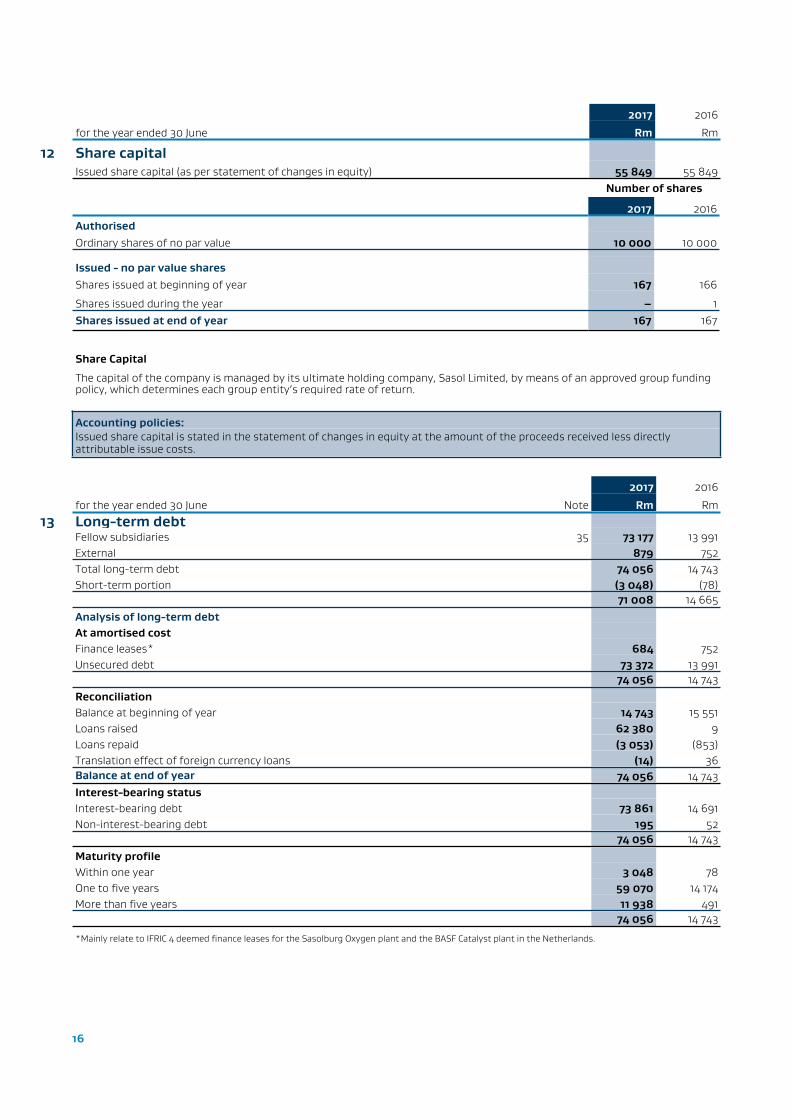
12 Share capitalIssued share capital (as per statement of changes in equity) 55 849 55 849
Number of shares
2017 2016AuthorisedOrdinary shares of no par value 10 000 10 000
Issued - no par value sharesShares issued at beginning of year 167 166
Shares issued during the year – 1Shares issued at end of year 167 167
Share Capital
The capital of the company is managed by its ultimate holding company, Sasol Limited, by means of an approved group funding policy, which determines each group entity’s required rate of return.
Accounting policies:Issued share capital is stated in the statement of changes in equity at the amount of the proceeds received less directly attributable issue costs.
2017 2016
for the year ended 30 June Note Rm Rm
13 Long-term debtFellow subsidiaries 35 73 177 13 991External 879 752Total long-term debt 74 056 14 743Short-term portion (3 048) (78)
71 008 14 665Analysis of long-term debtAt amortised costFinance leases* 684 752Unsecured debt 73 372 13 991
74 056 14 743ReconciliationBalance at beginning of year 14 743 15 551Loans raised 62 380 9Loans repaid (3 053) (853)Translation effect of foreign currency loans (14) 36Balance at end of year 74 056 14 743Interest-bearing statusInterest-bearing debt 73 861 14 691Non-interest-bearing debt 195 52
74 056 14 743Maturity profileWithin one year 3 048 78One to five years 59 070 14 174More than five years 11 938 491
74 056 14 743
*Mainly relate to IFRIC 4 deemed finance leases for the Sasolburg Oxygen plant and the BASF Catalyst plant in the Netherlands.
17
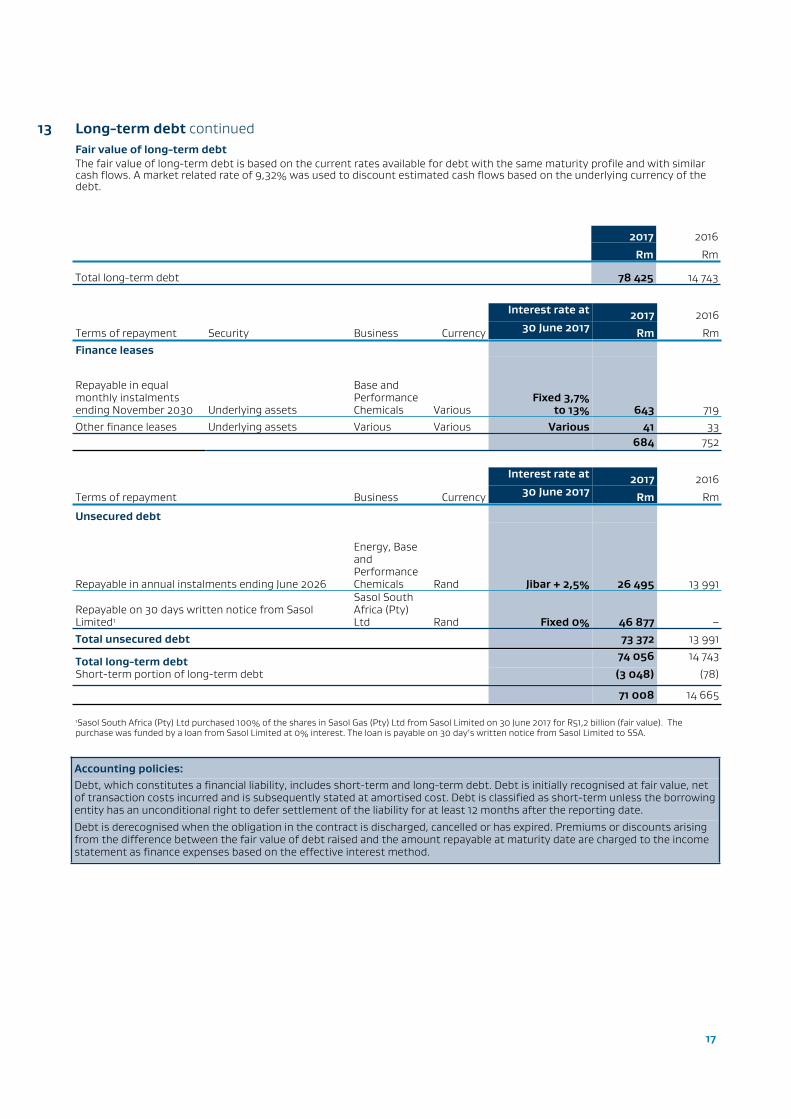
13 Long-term debt continuedFair value of long-term debt The fair value of long-term debt is based on the current rates available for debt with the same maturity profile and with similar cash flows. A market related rate of 9,32% was used to discount estimated cash flows based on the underlying currency of the debt.
2017 2016
Rm Rm
Total long-term debt 78 425 14 743
Interest rate at 2017 2016
Terms of repayment Security Business Currency 30 June 2017 Rm RmFinance leases
Repayable in equal monthly instalments ending November 2030 Underlying assets
Base and Performance Chemicals Various
Fixed 3,7%to 13% 643 719
Other finance leases Underlying assets Various Various Various 41 33684 752
Interest rate at 2017 2016
Terms of repayment Business Currency 30 June 2017 Rm Rm
Unsecured debt
Repayable in annual instalments ending June 2026
Energy, Base and Performance Chemicals Rand Jibar + 2,5% 26 495 13 991
Repayable on 30 days written notice from Sasol Limited1
Sasol South Africa (Pty) Ltd Rand Fixed 0% 46 877 –
Total unsecured debt 73 372 13 991
Total long-term debt 74 056 14 743
Short-term portion of long-term debt (3 048) (78)
71 008 14 665
1Sasol South Africa (Pty) Ltd purchased 100% of the shares in Sasol Gas (Pty) Ltd from Sasol Limited on 30 June 2017 for R51,2 billion (fair value). The purchase was funded by a loan from Sasol Limited at 0% interest. The loan is payable on 30 day’s written notice from Sasol Limited to SSA.
Accounting policies:Debt, which constitutes a financial liability, includes short-term and long-term debt. Debt is initially recognised at fair value, net of transaction costs incurred and is subsequently stated at amortised cost. Debt is classified as short-term unless the borrowing entity has an unconditional right to defer settlement of the liability for at least 12 months after the reporting date.Debt is derecognised when the obligation in the contract is discharged, cancelled or has expired. Premiums or discounts arising from the difference between the fair value of debt raised and the amount repayable at maturity date are charged to the income statement as finance expenses based on the effective interest method.
18
2017 2016
for the year ended 30 June Rm Rm
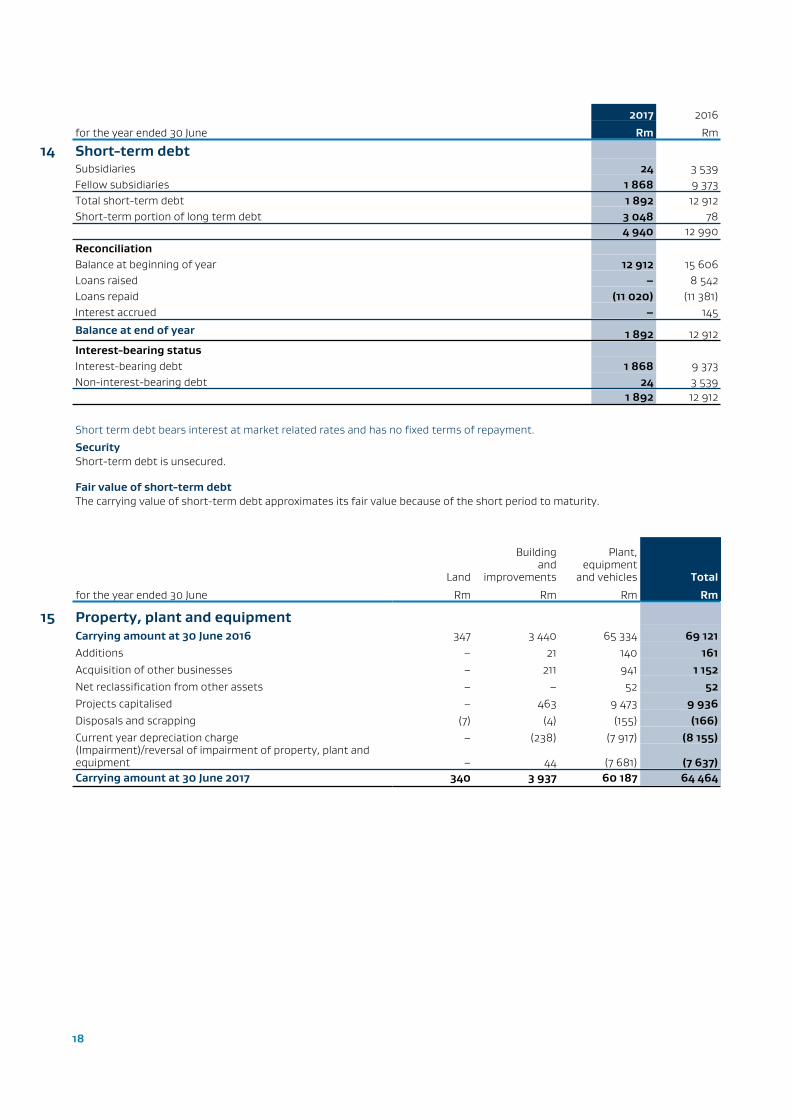
14 Short-term debtSubsidiaries 24 3 539Fellow subsidiaries 1 868 9 373Total short-term debt 1 892 12 912Short-term portion of long term debt 3 048 78
4 940 12 990ReconciliationBalance at beginning of year 12 912 15 606Loans raised – 8 542Loans repaid (11 020) (11 381)Interest accrued – 145
Balance at end of year 1 892 12 912Interest-bearing statusInterest-bearing debt 1 868 9 373Non-interest-bearing debt 24 3 539
1 892 12 912
Short term debt bears interest at market related rates and has no fixed terms of repayment.
SecurityShort-term debt is unsecured.
Fair value of short-term debt The carrying value of short-term debt approximates its fair value because of the short period to maturity.
Land
Buildingand
improvements
Plant,equipment
and vehicles Total
for the year ended 30 June Rm Rm Rm Rm
15 Property, plant and equipmentCarrying amount at 30 June 2016 347 3 440 65 334 69 121Additions – 21 140 161Acquisition of other businesses – 211 941 1 152Net reclassification from other assets – – 52 52Projects capitalised – 463 9 473 9 936Disposals and scrapping (7) (4) (155) (166)Current year depreciation charge – (238) (7 917) (8 155)(Impairment)/reversal of impairment of property, plant and equipment – 44 (7 681) (7 637)Carrying amount at 30 June 2017 340 3 937 60 187 64 464
19
15 Property, plant and equipment continued
Land
Buildingand
improvements
Plant,equipment
and vehicles Total
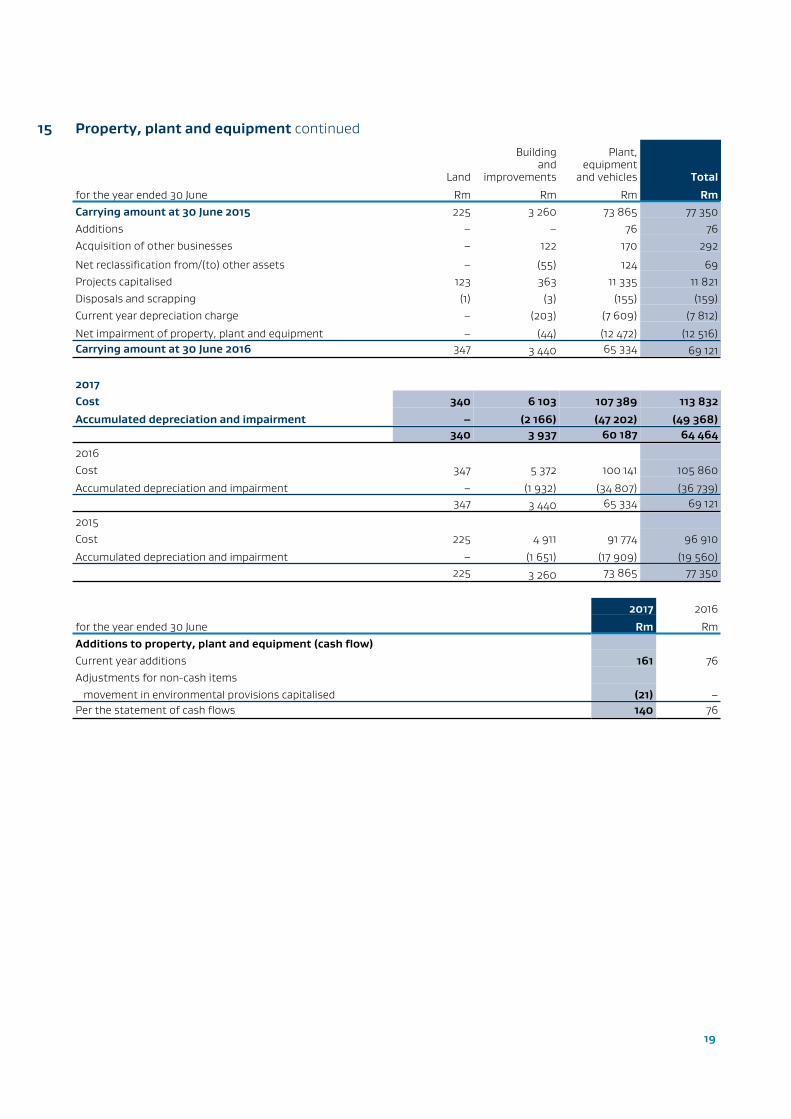
for the year ended 30 June Rm Rm Rm RmCarrying amount at 30 June 2015 225 3 260 73 865 77 350Additions – – 76 76Acquisition of other businesses – 122 170 292
Net reclassification from/(to) other assets – (55) 124 69Projects capitalised 123 363 11 335 11 821Disposals and scrapping (1) (3) (155) (159)Current year depreciation charge – (203) (7 609) (7 812)
Net impairment of property, plant and equipment – (44) (12 472) (12 516)Carrying amount at 30 June 2016 347 3 440 65 334 69 121
2017Cost 340 6 103 107 389 113 832
Accumulated depreciation and impairment – (2 166) (47 202) (49 368)340 3 937 60 187 64 464
2016Cost 347 5 372 100 141 105 860
Accumulated depreciation and impairment – (1 932) (34 807) (36 739)347 3 440 65 334 69 121
2015Cost 225 4 911 91 774 96 910
Accumulated depreciation and impairment – (1 651) (17 909) (19 560)225 3 260 73 865 77 350
2017 2016
for the year ended 30 June Rm RmAdditions to property, plant and equipment (cash flow)Current year additions 161 76Adjustments for non-cash items movement in environmental provisions capitalised (21) –Per the statement of cash flows 140 76

20
2017 2016
for the year ended 30 June Rm RmLeased assetsCarrying value of capitalised leased assets (included in plant, equipment and vehicles) 923 916 cost 1 307 1 250 accumulated depreciation (384) (334)
Capital commitments (excluding equity accounted investments)
Capital commitments, excluding capitalised interest, include all projects for which specific board approval has been obtained. Projects still under investigation for which specific board approvals have not yet been obtained are excluded from the following:Authorised and contracted for 16 038 15 744Authorised but not yet contracted for 13 608 11 365
Less expenditure to the end of year (11 473) (12 907)18 173 14 202
Estimated expenditureWithin one year 12 077 12 913
One to five years 6 096 1 28918 173 14 202
FundingCapital expenditure will be financed from funds generated out of normal business operations, exisitng borrowing facilities, specific project financing and additional capital contributions from Sasol Limited.
Accounting policies:Property, plant and equipment is stated at cost less accumulated depreciation and accumulated impairment losses. Land is not depreciated.When plant and equipment comprises major components with different useful lives, these components are accounted for as separate items.
Property, plant and equipment is depreciated to its estimated residual value on a straight- line basis over its expected useful life.
Areas of judgement:
The depreciation methods, estimated remaining useful lives and residual values are reviewed at least annually. The estimation of the useful lives of property, plant and equipment is based on historic performance as well as expectations about future use and therefore requires a significant degree of judgement to be applied by management.The following depreciation rates apply in the company:Buildings and improvements 2 – 5 %
Plant 4 – 5 %Equipment 10 – 33 %
Vehicles 20 – 33 %
21
Propertyplant and
equipmentconstruction
under
Otherintangible
assets underdevelopment Total
for the year ended 30 June Rm Rm Rm
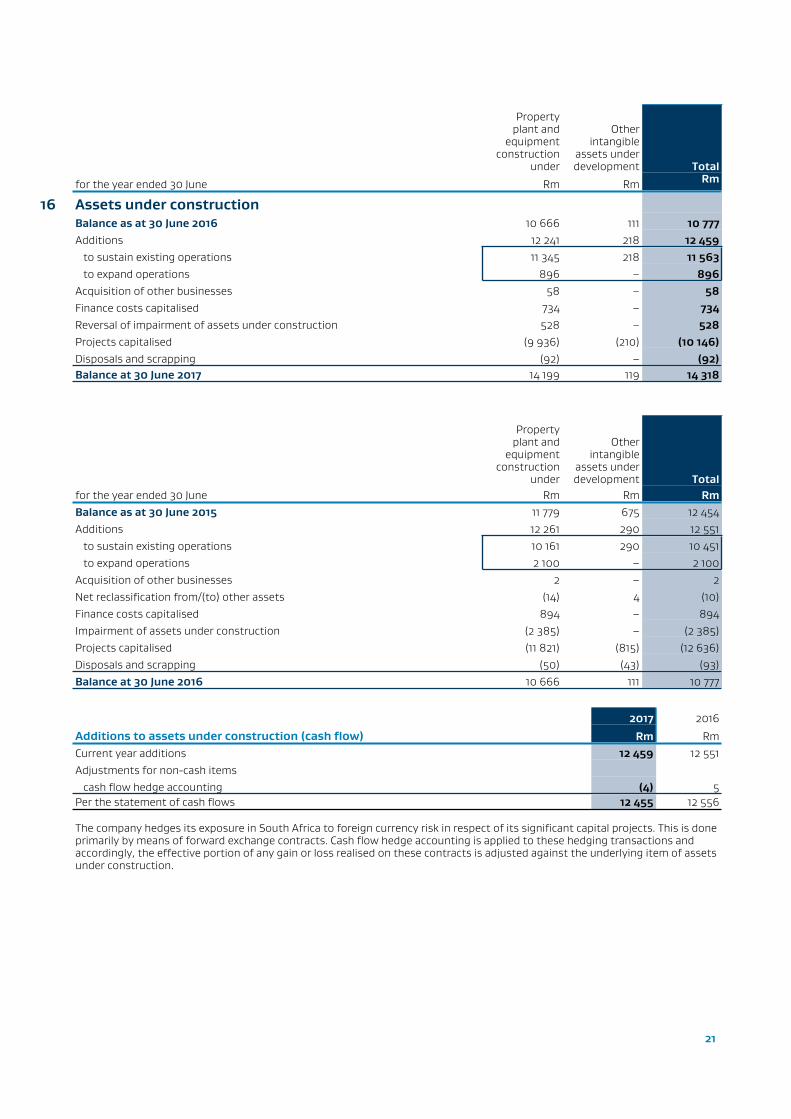
16 Assets under constructionBalance as at 30 June 2016 10 666 111 10 777Additions 12 241 218 12 459 to sustain existing operations 11 345 218 11 563 to expand operations 896 – 896Acquisition of other businesses 58 – 58Finance costs capitalised 734 – 734Reversal of impairment of assets under construction 528 – 528Projects capitalised (9 936) (210) (10 146)Disposals and scrapping (92) – (92)Balance at 30 June 2017 14 199 119 14 318
Propertyplant and
equipmentconstruction
under
Otherintangible
assets underdevelopment Total
for the year ended 30 June Rm Rm RmBalance as at 30 June 2015 11 779 675 12 454Additions 12 261 290 12 551 to sustain existing operations 10 161 290 10 451 to expand operations 2 100 – 2 100Acquisition of other businesses 2 – 2Net reclassification from/(to) other assets (14) 4 (10)Finance costs capitalised 894 – 894Impairment of assets under construction (2 385) – (2 385)Projects capitalised (11 821) (815) (12 636)Disposals and scrapping (50) (43) (93)Balance at 30 June 2016 10 666 111 10 777
2017 2016
Additions to assets under construction (cash flow) Rm RmCurrent year additions 12 459 12 551Adjustments for non-cash items cash flow hedge accounting (4) 5Per the statement of cash flows 12 455 12 556
The company hedges its exposure in South Africa to foreign currency risk in respect of its significant capital projects. This is done primarily by means of forward exchange contracts. Cash flow hedge accounting is applied to these hedging transactions and accordingly, the effective portion of any gain or loss realised on these contracts is adjusted against the underlying item of assets under construction.
22
Accounting policies:Assets under constructionAssets under construction are non-current assets, which includes land and expenditure capitalised for work in progress in respect of activities to develop, expand or enhance items of property, plant and equipment and intangible assets. The cost of self-constructed assets includes expenditure on materials, direct labour and an allocated proportion of project overheads. Cost also includes the estimated costs of dismantling and removing the assets and site rehabilitation costs to the extent that they relate to the construction of the asset as well as gains or losses on qualifying cash flow hedges attributable to that asset. When regular major inspections are a condition of continuing to operate an item of property, plant and equipment, and plant shutdown costs will be incurred, an estimate of these shutdown costs are included in the carrying value of the asset at initial recognition. Land acquired, as well as costs capitalised for work in progress in respect of activities to develop, expand or enhance items of property, plant and equipment are classified as part of assets under construction.
Finance expenses in respect of specific and general borrowings are capitalised against qualifying assets as part of assets under construction. Where funds are borrowed specifically for the purpose of acquiring or constructing a qualifying asset, the amount of finance expenses eligible for capitalisation on that asset is the actual finance expenses incurred on the borrowing during the period less any investment income on the temporary investment of those borrowings.
Where funds are made available from general borrowings and used for the purpose of acquiring or constructing qualifying assets, the amount of finance expenses eligible for capitalisation is determined by applying a capitalisation rate to the expenditures on these assets. The capitalisation rate is the weighted average of the interest rates applicable to the borrowings of the company that are outstanding during the period, other than borrowings made specifically for the purpose of obtaining qualifying assets. The amount of finance expenses capitalised will not exceed the amount of borrowing costs incurred.
2017 2 016
for the year ended 30 June Rm Rm
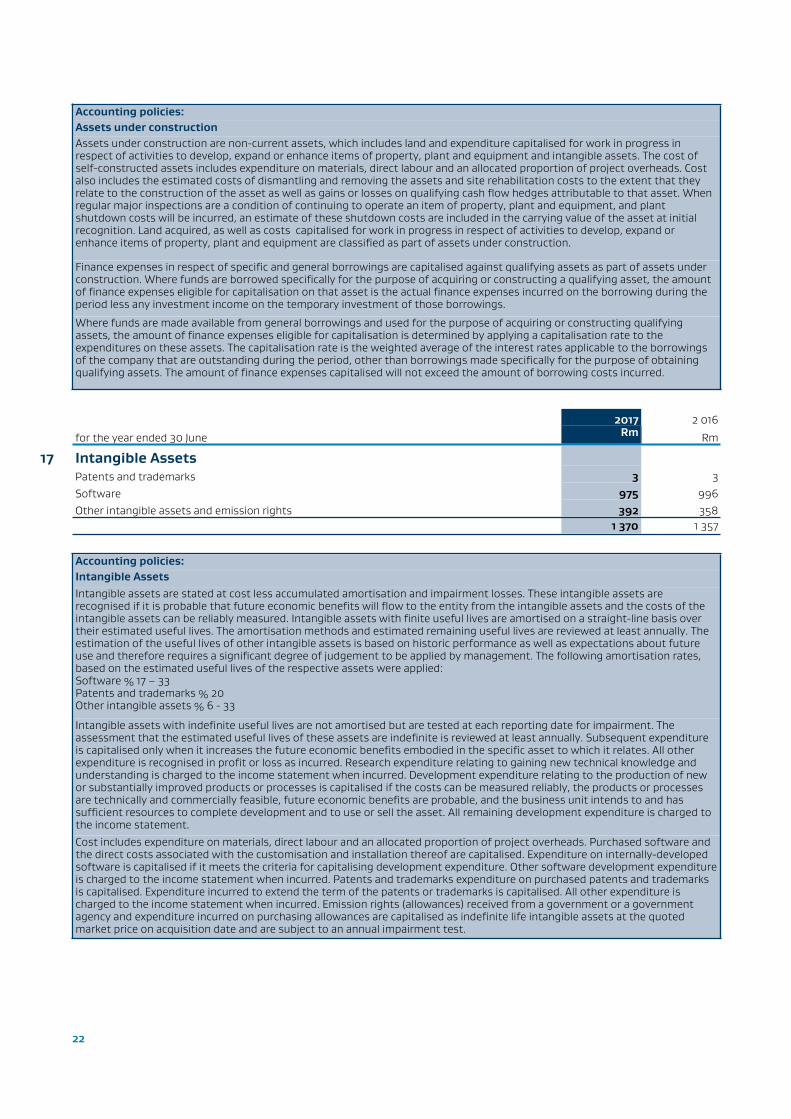
17 Intangible AssetsPatents and trademarks 3 3Software 975 996Other intangible assets and emission rights 392 358
1 370 1 357
Accounting policies:Intangible AssetsIntangible assets are stated at cost less accumulated amortisation and impairment losses. These intangible assets are recognised if it is probable that future economic benefits will flow to the entity from the intangible assets and the costs of the intangible assets can be reliably measured. Intangible assets with finite useful lives are amortised on a straight-line basis over their estimated useful lives. The amortisation methods and estimated remaining useful lives are reviewed at least annually. The estimation of the useful lives of other intangible assets is based on historic performance as well as expectations about future use and therefore requires a significant degree of judgement to be applied by management. The following amortisation rates, based on the estimated useful lives of the respective assets were applied:Software % 17 – 33Patents and trademarks % 20Other intangible assets % 6 - 33
Intangible assets with indefinite useful lives are not amortised but are tested at each reporting date for impairment. The assessment that the estimated useful lives of these assets are indefinite is reviewed at least annually. Subsequent expenditure is capitalised only when it increases the future economic benefits embodied in the specific asset to which it relates. All other expenditure is recognised in profit or loss as incurred. Research expenditure relating to gaining new technical knowledge and understanding is charged to the income statement when incurred. Development expenditure relating to the production of new or substantially improved products or processes is capitalised if the costs can be measured reliably, the products or processes are technically and commercially feasible, future economic benefits are probable, and the business unit intends to and has sufficient resources to complete development and to use or sell the asset. All remaining development expenditure is charged to the income statement.
Cost includes expenditure on materials, direct labour and an allocated proportion of project overheads. Purchased software and the direct costs associated with the customisation and installation thereof are capitalised. Expenditure on internally-developed software is capitalised if it meets the criteria for capitalising development expenditure. Other software development expenditure is charged to the income statement when incurred. Patents and trademarks expenditure on purchased patents and trademarks is capitalised. Expenditure incurred to extend the term of the patents or trademarks is capitalised. All other expenditure is charged to the income statement when incurred. Emission rights (allowances) received from a government or a government agency and expenditure incurred on purchasing allowances are capitalised as indefinite life intangible assets at the quoted market price on acquisition date and are subject to an annual impairment test.
23
2017 2016
for the year ended 30 June Rm Rm
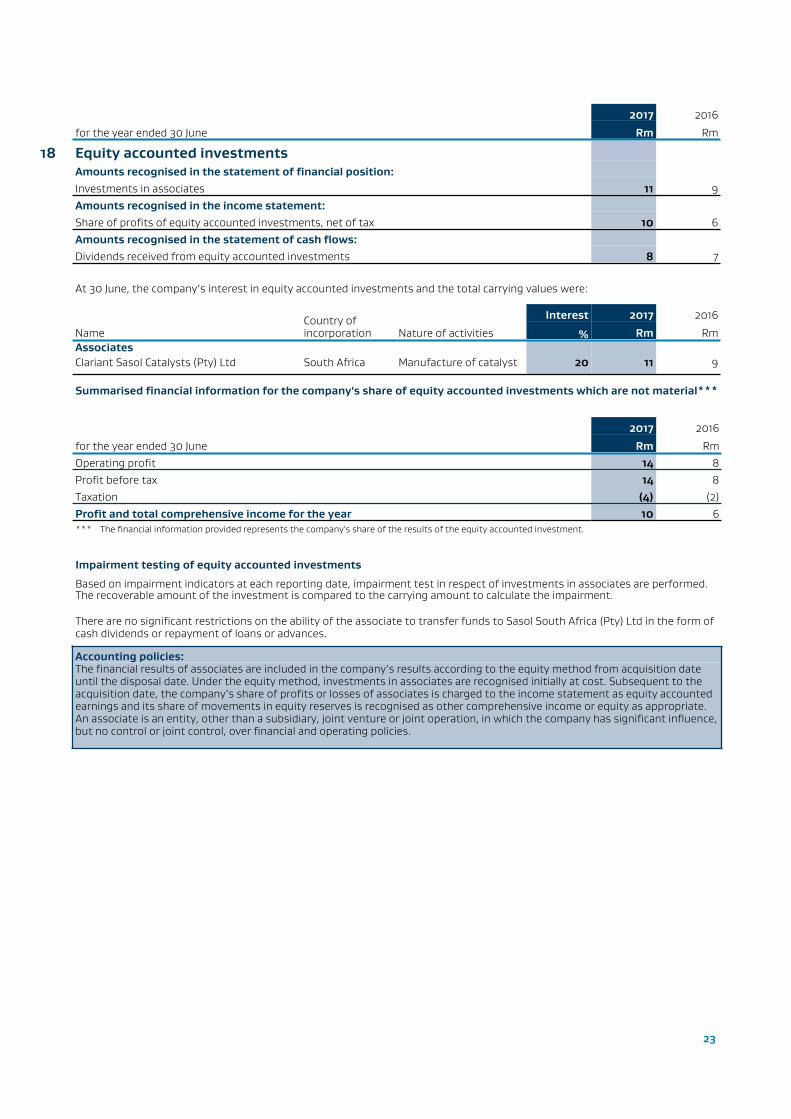
18 Equity accounted investmentsAmounts recognised in the statement of financial position:Investments in associates 11 9Amounts recognised in the income statement:Share of profits of equity accounted investments, net of tax 10 6Amounts recognised in the statement of cash flows:Dividends received from equity accounted investments 8 7
At 30 June, the company’s interest in equity accounted investments and the total carrying values were:
Interest 2017 2016
NameCountry of incorporation Nature of activities % Rm Rm
AssociatesClariant Sasol Catalysts (Pty) Ltd South Africa Manufacture of catalyst 20 11 9
Summarised financial information for the company's share of equity accounted investments which are not material***
2017 2016
for the year ended 30 June Rm RmOperating profit 14 8Profit before tax 14 8Taxation (4) (2)Profit and total comprehensive income for the year 10 6*** The financial information provided represents the company's share of the results of the equity accounted investment.
Impairment testing of equity accounted investments
Based on impairment indicators at each reporting date, impairment test in respect of investments in associates are performed. The recoverable amount of the investment is compared to the carrying amount to calculate the impairment.
There are no significant restrictions on the ability of the associate to transfer funds to Sasol South Africa (Pty) Ltd in the form of cash dividends or repayment of loans or advances.
Accounting policies:The financial results of associates are included in the company’s results according to the equity method from acquisition date until the disposal date. Under the equity method, investments in associates are recognised initially at cost. Subsequent to the acquisition date, the company’s share of profits or losses of associates is charged to the income statement as equity accounted earnings and its share of movements in equity reserves is recognised as other comprehensive income or equity as appropriate. An associate is an entity, other than a subsidiary, joint venture or joint operation, in which the company has significant influence, but no control or joint control, over financial and operating policies.

24
2017 2016
for the year ended 30 June Rm Rm
19 Investment in subsidiariesReflected as non-current assetsInvestments at costBalance at the beginning of the year 2 820 4 006Reversal of impairment/(impairment) of investment in subsidiary 1 191 (1 191)Acquisition of investment in subsidiary 46 877 5Repayment of capital (2 691) –Balance at end of year 48 197 2 820Shareholder loans to subsidiaries 19 19
48 216 2 839Reflected as non-current liabilitiesShort-term loans from subsidiariesBalance at the beginning of the year 3 539 3 539Loans repaid (3 515) –
24 3 539
Interest in significant operating subsidiaries
The following table presents each of the company’s significant subsidiaries (including direct and indirect holdings), the nature of activities, the percentage of shares of each subsidiary owned and the country of incorporation at 30 June.
There are no significant restrictions on the ability of the company’s subsidiaries to transfer funds to Sasol South Africa (Pty) Ltd in the form of cash dividends or repayment of loans or advances.
% of equity owned Investment at cost
NameCountry of incorporation Nature of activities 2017 2016 2017 2016
% % Rm RmSignificant operating subsidiariesDirectSasol Dyno Nobel (Pty) Ltd Republic of
South AfricaProduction and marketing of commercial explosive accessories and detonating cord
50 50 114 114
Sasol Acrylates (South Africa) (Pty) Ltd
Republic of South Africa
Production of acrylic acid and acrylates
50 50 819 –
Sasol Acrylates (Pty) Ltd Republic of South Africa
Marketing of acrylic acid and acrylates
100 100 372 –
Sasol General Holdings (Pty) Ltd
Republic of South Africa
Dormant 100 100 – 2 691
The Republic of Mozambique Pipeline Investment Company (Pty) Ltd (ROMPCO (Pty) Ltd)
Republic of South Africa
Operation of natural gas transmission pipeline between Temane and Secunda
50 50 5 5
Sasol Gas (Pty) Ltd 1 Republic of South Africa
Marketing, distribution and transportation of pipeline gas and the maintenance of pipelines used to transport gas
100 – 46 877 –
Our other interest in subsidiaries are not considered significant
1As from 30 June 2017 the Sasol Gas (Pty) Ltd investment is held by Sasol South Africa (Pty) Ltd. Refer to note 13 for more details.
25
2017 2016
for the year ended 30 June Rm Rm
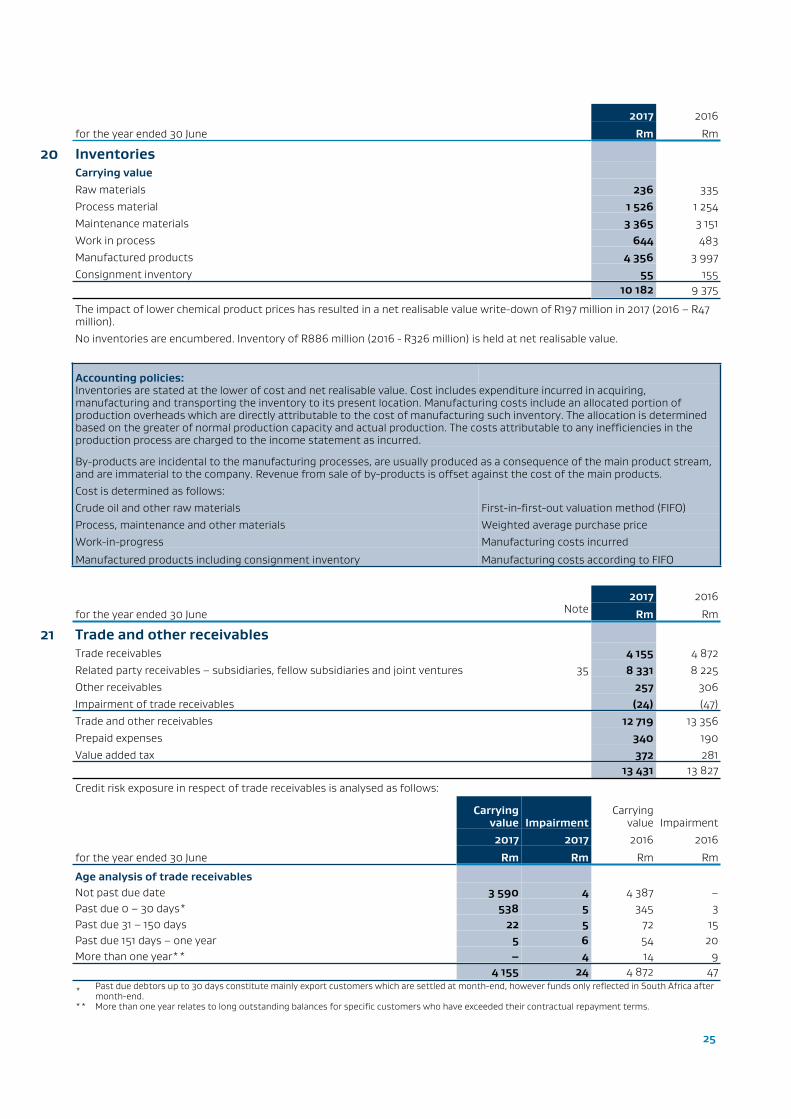
20 InventoriesCarrying valueRaw materials 236 335Process material 1 526 1 254Maintenance materials 3 365 3 151Work in process 644 483Manufactured products 4 356 3 997Consignment inventory 55 155
10 182 9 375
The impact of lower chemical product prices has resulted in a net realisable value write-down of R197 million in 2017 (2016 – R47 million).No inventories are encumbered. Inventory of R886 million (2016 - R326 million) is held at net realisable value.
Accounting policies:Inventories are stated at the lower of cost and net realisable value. Cost includes expenditure incurred in acquiring, manufacturing and transporting the inventory to its present location. Manufacturing costs include an allocated portion of production overheads which are directly attributable to the cost of manufacturing such inventory. The allocation is determined based on the greater of normal production capacity and actual production. The costs attributable to any inefficiencies in the production process are charged to the income statement as incurred.
By-products are incidental to the manufacturing processes, are usually produced as a consequence of the main product stream, and are immaterial to the company. Revenue from sale of by-products is offset against the cost of the main products.Cost is determined as follows:Crude oil and other raw materials First-in-first-out valuation method (FIFO)Process, maintenance and other materials Weighted average purchase priceWork-in-progress Manufacturing costs incurred
Manufactured products including consignment inventory Manufacturing costs according to FIFO
2017 2016
for the year ended 30 June Note Rm Rm
21 Trade and other receivablesTrade receivables 4 155 4 872Related party receivables – subsidiaries, fellow subsidiaries and joint ventures 35 8 331 8 225Other receivables 257 306Impairment of trade receivables (24) (47)Trade and other receivables 12 719 13 356Prepaid expenses 340 190Value added tax 372 281
13 431 13 827
Credit risk exposure in respect of trade receivables is analysed as follows:
Carrying value Impairment
Carryingvalue Impairment
2017 2017 2016 2016
for the year ended 30 June Rm Rm Rm Rm
Age analysis of trade receivablesNot past due date 3 590 4 4 387 –Past due 0 – 30 days* 538 5 345 3Past due 31 – 150 days 22 5 72 15Past due 151 days – one year 5 6 54 20More than one year** – 4 14 9
4 155 24 4 872 47
* Past due debtors up to 30 days constitute mainly export customers which are settled at month-end, however funds only reflected in South Africa after month-end.
** More than one year relates to long outstanding balances for specific customers who have exceeded their contractual repayment terms.

26
Impairment of trade receivables
Trade receivables that are not past their due date are not considered to be impaired, except where they are part of individually impaired trade receivables. The individually impaired trade receivables mainly relate to certain customers who are trading in difficult economic circumstances.
The following customers represent more than 10% of the company’s trade and other receivables:
Sasol Oil (Pty) Ltd – R2 644 million (2016 – R2 969 million)
Sasol Chemicals North America LLC – R1 714 million (2016 – R1 628 million)
Fair value of trade receivables
The carrying value approximates fair value because of the short period to maturity of these instruments.
Collateral
The company holds no collateral over the trade receivables which can be sold or pledged to a third party.
Accounting policies:
Trade and other receivables are recognised initially at fair value and subsequently stated at amortised cost using the effective interest method, less impairment losses.
2017 2016
for the year ended 30 June Note Rm Rm
22 Trade and other payablesTrade payables external 3 595 3 775Related party payables - subsidiaries, fellow subsidiaries and joint ventures 35 2 840 3 385Accrued expenses 1 074 947Related party payables - third parties 18 51Trade payables 7 527 8 158Other payables* 3 108 2 351Value added tax 4 –
10 639 10 509* Other payables includes inter alia employee-related payables and capital project related payables.
The following entities represents more than 10% of the company's trade payables:
Sasol Mining (Pty) Ltd (2017 – R1 519 million; 2016 - R1 343 million)
Eskom (2016 – R488 million)
Fair value of trade and other payables
The carrying value approximates fair value because of the short period to settlement of these obligations.
Accounting policies:Trade and other payables are initially recognised at fair value and subsequently stated at amortised cost. Capital project related payables are excluded from working capital, as the nature and risks of these payables are not considered to be aligned to operational trade payables.
27
2017 2016Rm Rm
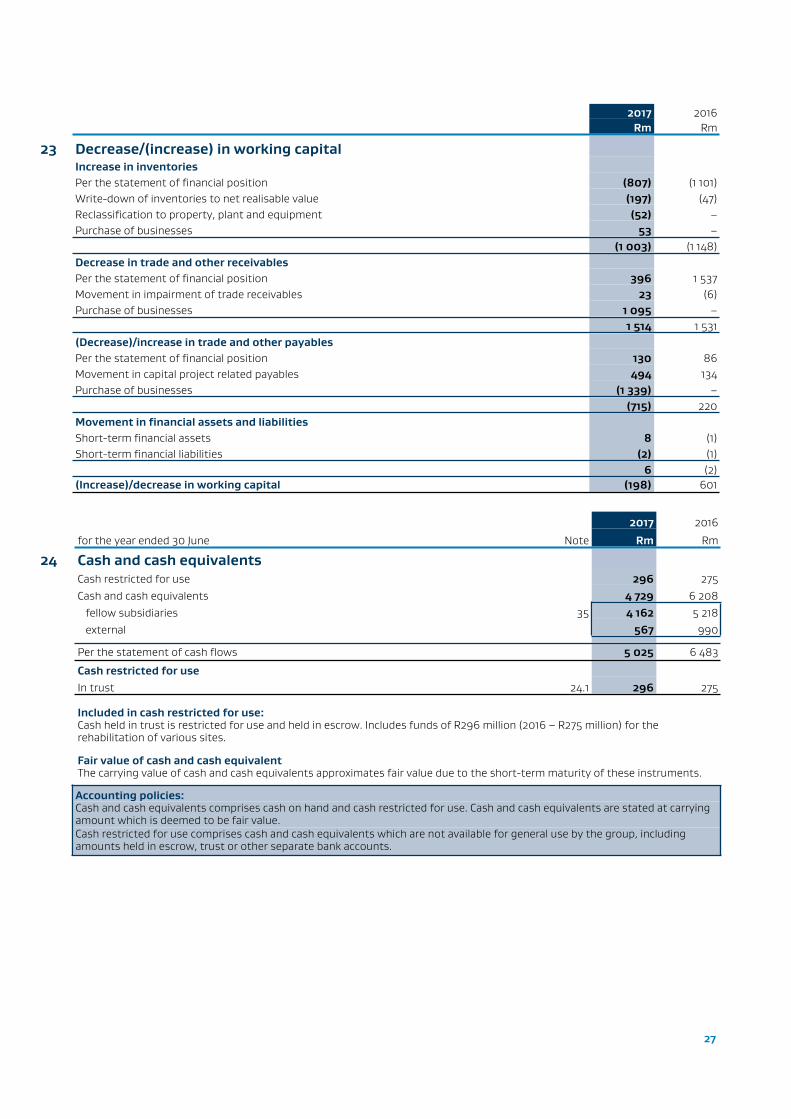
23 Decrease/(increase) in working capitalIncrease in inventoriesPer the statement of financial position (807) (1 101)Write-down of inventories to net realisable value (197) (47)Reclassification to property, plant and equipment (52) –Purchase of businesses 53 –
(1 003) (1 148)Decrease in trade and other receivablesPer the statement of financial position 396 1 537Movement in impairment of trade receivables 23 (6)Purchase of businesses 1 095 –
1 514 1 531(Decrease)/increase in trade and other payablesPer the statement of financial position 130 86Movement in capital project related payables 494 134Purchase of businesses (1 339) –
(715) 220Movement in financial assets and liabilitiesShort-term financial assets 8 (1)Short-term financial liabilities (2) (1)
6 (2)(Increase)/decrease in working capital (198) 601
2017 2016
for the year ended 30 June Note Rm Rm
24 Cash and cash equivalentsCash restricted for use 296 275Cash and cash equivalents 4 729 6 208 fellow subsidiaries 35 4 162 5 218 external 567 990
Per the statement of cash flows 5 025 6 483
Cash restricted for useIn trust 24.1 296 275
Included in cash restricted for use:Cash held in trust is restricted for use and held in escrow. Includes funds of R296 million (2016 – R275 million) for the rehabilitation of various sites.
Fair value of cash and cash equivalentThe carrying value of cash and cash equivalents approximates fair value due to the short-term maturity of these instruments.
Accounting policies:Cash and cash equivalents comprises cash on hand and cash restricted for use. Cash and cash equivalents are stated at carrying amount which is deemed to be fair value. Cash restricted for use comprises cash and cash equivalents which are not available for general use by the group, including amounts held in escrow, trust or other separate bank accounts.
28
2017 2016
for the year ended 30 June Note Rm Rm
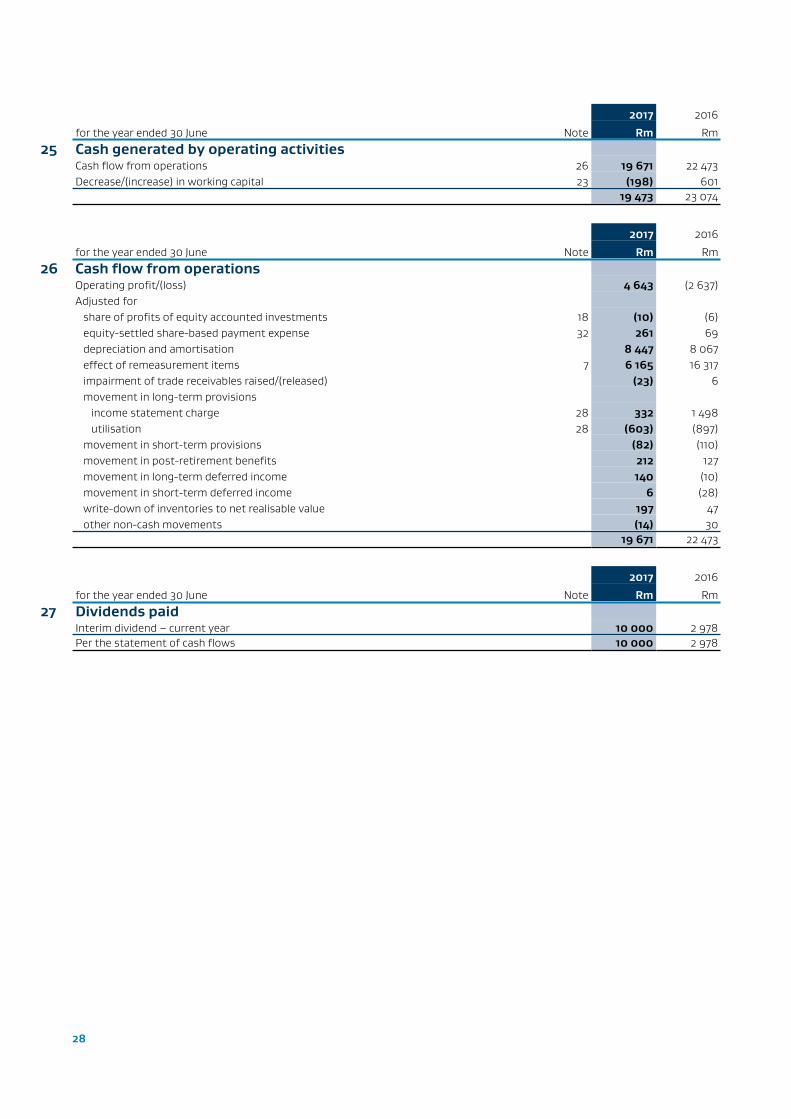
25 Cash generated by operating activitiesCash flow from operations 26 19 671 22 473Decrease/(increase) in working capital 23 (198) 601
19 473 23 074
2017 2016
for the year ended 30 June Note Rm Rm
26 Cash flow from operationsOperating profit/(loss) 4 643 (2 637)Adjusted for share of profits of equity accounted investments 18 (10) (6) equity-settled share-based payment expense 32 261 69 depreciation and amortisation 8 447 8 067 effect of remeasurement items 7 6 165 16 317 impairment of trade receivables raised/(released) (23) 6 movement in long-term provisions income statement charge 28 332 1 498 utilisation 28 (603) (897) movement in short-term provisions (82) (110) movement in post-retirement benefits 212 127 movement in long-term deferred income 140 (10) movement in short-term deferred income 6 (28) write-down of inventories to net realisable value 197 47 other non-cash movements (14) 30
19 671 22 473
2017 2016
for the year ended 30 June Note Rm Rm
27 Dividends paidInterim dividend – current year 10 000 2 978Per the statement of cash flows 10 000 2 978
29
Environ-mental
Share-based
payments* Other Totalfor the year ended 30 June Rm Rm Rm Rm
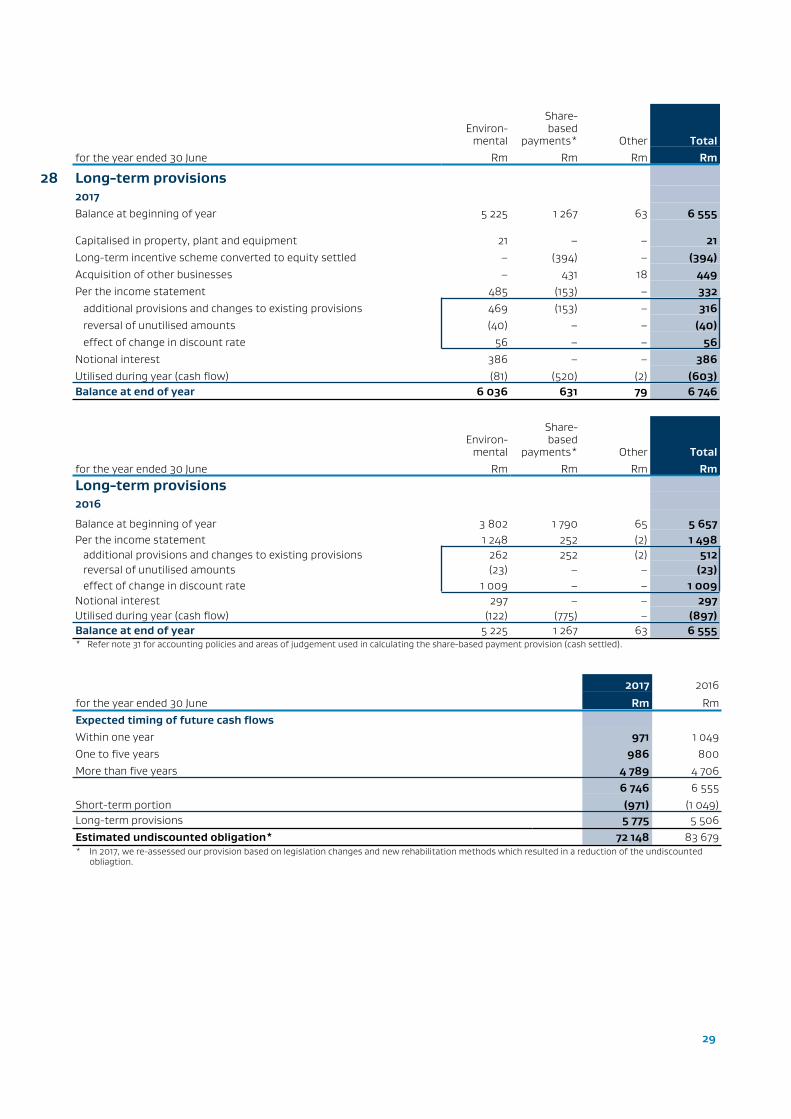
28 Long-term provisions2017Balance at beginning of year 5 225 1 267 63 6 555
Capitalised in property, plant and equipment 21 – – 21Long-term incentive scheme converted to equity settled – (394) – (394)Acquisition of other businesses – 431 18 449Per the income statement 485 (153) – 332 additional provisions and changes to existing provisions 469 (153) – 316 reversal of unutilised amounts (40) – – (40) effect of change in discount rate 56 – – 56Notional interest 386 – – 386Utilised during year (cash flow) (81) (520) (2) (603)Balance at end of year 6 036 631 79 6 746
Environ-mental
Share-based
payments* Other Totalfor the year ended 30 June Rm Rm Rm RmLong-term provisions2016
Balance at beginning of year 3 802 1 790 65 5 657Per the income statement 1 248 252 (2) 1 498 additional provisions and changes to existing provisions 262 252 (2) 512 reversal of unutilised amounts (23) – – (23) effect of change in discount rate 1 009 – – 1 009Notional interest 297 – – 297Utilised during year (cash flow) (122) (775) – (897)Balance at end of year 5 225 1 267 63 6 555* Refer note 31 for accounting policies and areas of judgement used in calculating the share-based payment provision (cash settled).
2017 2016
for the year ended 30 June Rm RmExpected timing of future cash flowsWithin one year 971 1 049One to five years 986 800More than five years 4 789 4 706
6 746 6 555Short-term portion (971) (1 049)Long-term provisions 5 775 5 506Estimated undiscounted obligation* 72 148 83 679* In 2017, we re-assessed our provision based on legislation changes and new rehabilitation methods which resulted in a reduction of the undiscounted
obliagtion.
30
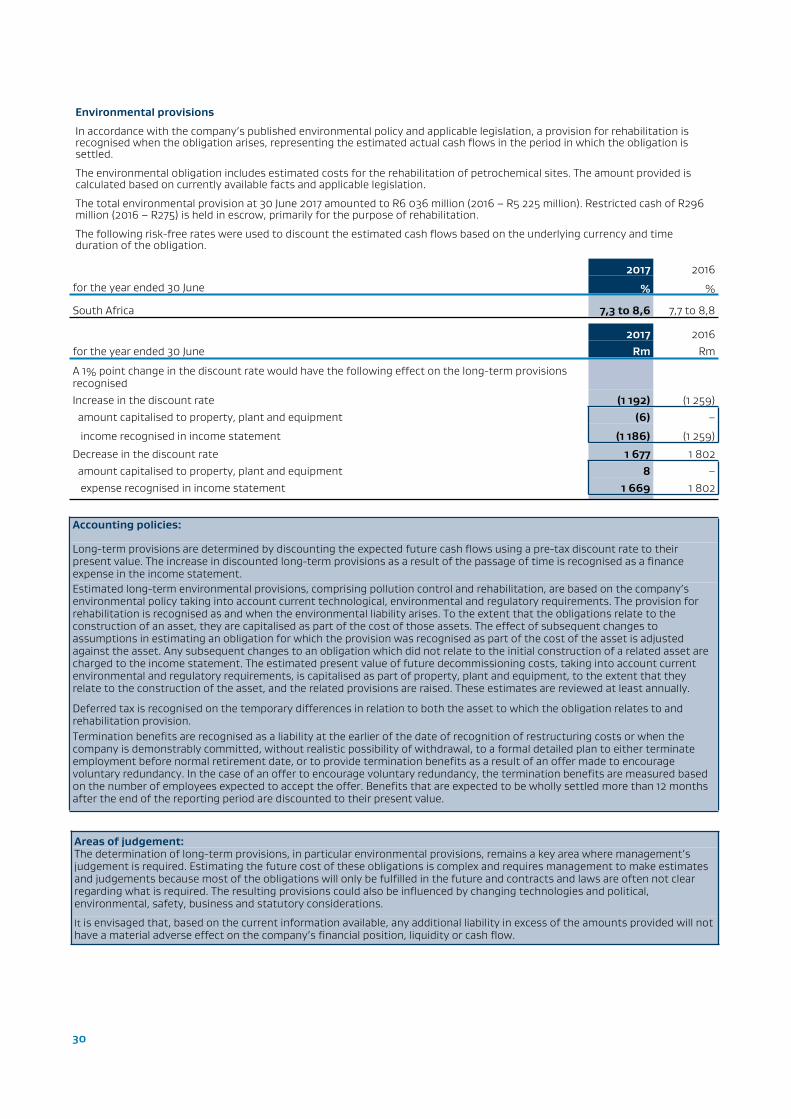
Environmental provisions
In accordance with the company’s published environmental policy and applicable legislation, a provision for rehabilitation is recognised when the obligation arises, representing the estimated actual cash flows in the period in which the obligation is settled.
The environmental obligation includes estimated costs for the rehabilitation of petrochemical sites. The amount provided is calculated based on currently available facts and applicable legislation.
The total environmental provision at 30 June 2017 amounted to R6 036 million (2016 – R5 225 million). Restricted cash of R296 million (2016 – R275) is held in escrow, primarily for the purpose of rehabilitation.
The following risk-free rates were used to discount the estimated cash flows based on the underlying currency and time duration of the obligation.
2017 2016
for the year ended 30 June % %
South Africa 7,3 to 8,6 7,7 to 8,8
2017 2016for the year ended 30 June Rm Rm
A 1% point change in the discount rate would have the following effect on the long-term provisions recognisedIncrease in the discount rate (1 192) (1 259) amount capitalised to property, plant and equipment (6) –
income recognised in income statement (1 186) (1 259)
Decrease in the discount rate 1 677 1 802 amount capitalised to property, plant and equipment 8 – expense recognised in income statement 1 669 1 802
Accounting policies:
Long-term provisions are determined by discounting the expected future cash flows using a pre-tax discount rate to their present value. The increase in discounted long-term provisions as a result of the passage of time is recognised as a finance expense in the income statement.Estimated long-term environmental provisions, comprising pollution control and rehabilitation, are based on the company’s environmental policy taking into account current technological, environmental and regulatory requirements. The provision for rehabilitation is recognised as and when the environmental liability arises. To the extent that the obligations relate to the construction of an asset, they are capitalised as part of the cost of those assets. The effect of subsequent changes to assumptions in estimating an obligation for which the provision was recognised as part of the cost of the asset is adjusted against the asset. Any subsequent changes to an obligation which did not relate to the initial construction of a related asset are charged to the income statement. The estimated present value of future decommissioning costs, taking into account current environmental and regulatory requirements, is capitalised as part of property, plant and equipment, to the extent that they relate to the construction of the asset, and the related provisions are raised. These estimates are reviewed at least annually.
Deferred tax is recognised on the temporary differences in relation to both the asset to which the obligation relates to and rehabilitation provision.Termination benefits are recognised as a liability at the earlier of the date of recognition of restructuring costs or when the company is demonstrably committed, without realistic possibility of withdrawal, to a formal detailed plan to either terminate employment before normal retirement date, or to provide termination benefits as a result of an offer made to encourage voluntary redundancy. In the case of an offer to encourage voluntary redundancy, the termination benefits are measured based on the number of employees expected to accept the offer. Benefits that are expected to be wholly settled more than 12 months after the end of the reporting period are discounted to their present value.
Areas of judgement:The determination of long-term provisions, in particular environmental provisions, remains a key area where management’s judgement is required. Estimating the future cost of these obligations is complex and requires management to make estimates and judgements because most of the obligations will only be fulfilled in the future and contracts and laws are often not clear regarding what is required. The resulting provisions could also be influenced by changing technologies and political, environmental, safety, business and statutory considerations.
It is envisaged that, based on the current information available, any additional liability in excess of the amounts provided will not have a material adverse effect on the company’s financial position, liquidity or cash flow.

31
2017 2016
for the year ended 30 June Note Rm Rm
29 Short-term provisionsOther provisions 40 113Short-term portion of long-term provisions 28 971 1 049 post-retirement benefit obligations 30 141 123
1 152 1 285
2017 2016
for the year ended 30 June Rm Rm
30 Post-retirement benefit obligationsPost-retirement benefit asset 475 449
The post-retirement benefit assets form part of the asset recognised in terms of the Sasol Pension Fund's defined benefit plan. Full disclosure is provided in the consolidated annual financial statements of Sasol Limited.
2017 2016
for the year ended 30 June Rm RmPost-retirement benefit obligations 3 486 3 143Less short-term portion post-retirement healthcare benefits (141) (123)Total long-term post retirement benefit obligations 3 345 3 020
Post-retirement healthcare benefits
The company provides post-retirement healthcare benefits to certain of its retirees employed prior to 1 January 1998, who retire and satisfy the necessary requirements of the medical fund. The post-retirement healthcare liability forms part of the Sasol Limited group's post-retirement benefit obligation. Full disclosure is provided in the Sasol Limited consolidated annual financial statements.Accounting policies:The company operates or contributes to defined contribution pension plans and defined benefit pension plans for its employees. These plans are generally funded through payments to trustee-administered funds as determined by annual actuarial calculations.
Defined contribution pension plans are plans under which the group pays fixed contributions into a separate legal entity and has no legal or constructive obligation to pay further amounts. Contributions to defined contribution pension plans are charged to the income statement as an employee expense in the period in which related services are rendered by the employee.The company’s net obligation in respect of defined benefit pension plans is actuarially calculated separately for each plan by deducting the fair value of plan assets from the gross obligation for post-retirement benefits. The gross obligation is determined by estimating the future benefit attributable to employees in return for services rendered to date.This future benefit is discounted to determine its present value, using discount rates based on government bonds that have maturity dates approximating the terms of the company’s obligations and which are denominated in the currency in which the benefits are expected to be paid. Independent actuaries perform this calculation annually using the projected unit credit method.
Defined contribution members employed before 2009 have an option to purchase a defined benefit pension with their member share. This option gives rise to actuarial risk, and as such, these members are accounted for as part of the defined benefit fund and are disclosed as such.Past service costs are charged to the income statement at the earlier of the following dates:■ when the plan amendment or curtailment occurs; and■ when the group recognises related restructuring costs or termination benefits.
Actuarial gains and losses arising from experience adjustments and changes to actuarial assumptions, the return on plan assets (excluding amounts included in net interest on the defined benefit liability/(asset)) and any changes in the effect of the asset ceiling (excluding amounts included in net interest on the defined benefit liability/(asset)) are remeasurements that are recognised in other comprehensive income in the period in which they arise.
Where the plan assets exceed the gross obligation, the asset recognised is limited to the lower of the surplus in the defined benefit plan and the asset ceiling determined using a discount rate based on government bonds.Surpluses and deficits in the various plans are not offset.
The entitlement to healthcare benefits is usually based on the employee remaining in service up to retirement age and the completion of a minimum service period. The expected costs of these benefits are accrued on a systematic basis over the expected remaining period of employment, using the accounting methodology described in respect of defined benefit pension plans above. Independent actuaries perform the calculation of this obligation annually.

32
Healthcare benefits Pension benefits
Last actuarial valuation – South Africa 31 March 2017 31 March 2017Full/interim valuation Full FullValuation method adopted Projected unit credit Projected unit creditThe plans have been assessed by the actuaries and have been found to be in sound financial positions.
Principal actuarial assumptions
Weighted average assumptions used in performing actuarial valuations determined in consultation with independent actuaries.
South Africa2017 2016
at valuation date % %Healthcare cost inflation initial 7,5 7,5 ultimate 7,5 7,5
Discount rate – post-retirement medical benefits 9,8 9,9Discount rate – pension benefits 10,1 9,8Pension increase assumption 5,2 4,9Average salary increases 5,5 * 5,5 *
Weighted average duration of the obligation – post-retirement medical obligation 15 years 17 years
Weighted average duration of the obligation – pension obligation 13 years 14 years Assumptions regarding future mortality are based on published statistics and mortality tables.* In line with our low oil price Response Plan, we are forecasting salary increases linked to inflation.
2017 2016
for the year ended 30 June Rm Rm
31 Cash-settled share-based payment provision
During the year, the following share-based payment expenses were recognised in the income statement relating to cash-settled arrangements (refer to note 32 for the equity settled share-based payment disclosure):Share-based payment expense – movement in long-term provisionsSasol Share Appreciation Rights Scheme (74) (36)Sasol Long-term Incentive Scheme* 227 288
153 252*On 25 November 2016, the cash-settled LTI scheme was converted to an equity-settled share-based payment scheme.
Sasol's share price decreased by 8% over the financial year to a closing price on 30 June 2017 of R366,50. This has resulted in a R153 million credit being recognised in the current year.
The Sasol Share Appreciation Rights Scheme (closed since 2013)
The maximum number of rights to be issued under the cash-settled Sasol Share Appreciation Rights Scheme (SARs) and the cash-settled Sasol Long-term Incentive Scheme (LTIs) shall not at any time exceed 69 million shares/rights. The maximum number of shares issued under the equity-settled LTI scheme (2016) may not exceed 32,5 million representing 5% of Sasol Limited’s issued share capital at the time of approval.
2017 2016
Total rights/units granted Number NumberShare Appreciation Rights 8 062 023 6 932 010Long-term Incentive Units1
– 2 913 3258 062 023 9 845 335
1 On 25 November 2016, the cash settled LTI scheme was converted to an equity settled share based payment scheme.
33
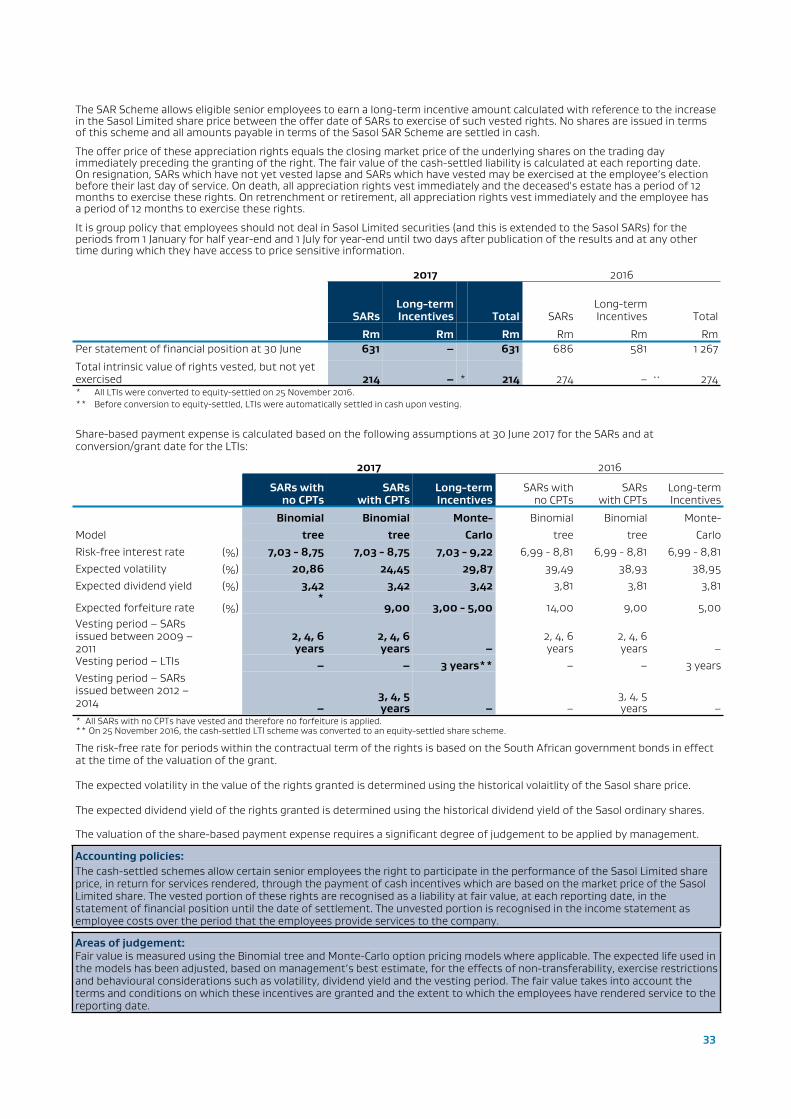
The SAR Scheme allows eligible senior employees to earn a long-term incentive amount calculated with reference to the increase in the Sasol Limited share price between the offer date of SARs to exercise of such vested rights. No shares are issued in terms of this scheme and all amounts payable in terms of the Sasol SAR Scheme are settled in cash.
The offer price of these appreciation rights equals the closing market price of the underlying shares on the trading day immediately preceding the granting of the right. The fair value of the cash-settled liability is calculated at each reporting date. On resignation, SARs which have not yet vested lapse and SARs which have vested may be exercised at the employee’s election before their last day of service. On death, all appreciation rights vest immediately and the deceased's estate has a period of 12 months to exercise these rights. On retrenchment or retirement, all appreciation rights vest immediately and the employee has a period of 12 months to exercise these rights.
It is group policy that employees should not deal in Sasol Limited securities (and this is extended to the Sasol SARs) for the periods from 1 January for half year-end and 1 July for year-end until two days after publication of the results and at any other time during which they have access to price sensitive information.
2017 2016
SARs Long-term Incentives Total SARs
Long-termIncentives Total
Rm Rm Rm Rm Rm RmPer statement of financial position at 30 June 631 – 631 686 581 1 267
Total intrinsic value of rights vested, but not yet exercised 214 – * 214 274 – ** 274* All LTIs were converted to equity-settled on 25 November 2016.** Before conversion to equity-settled, LTIs were automatically settled in cash upon vesting.
Share-based payment expense is calculated based on the following assumptions at 30 June 2017 for the SARs and at conversion/grant date for the LTIs:
2017 2016
SARs with no CPTs
SARs with CPTs
Long-term Incentives
SARs withno CPTs
SARswith CPTs
Long-termIncentives
Binomial Binomial Monte- Binomial Binomial Monte-Model tree tree Carlo tree tree CarloRisk-free interest rate (%) 7,03 - 8,75 7,03 - 8,75 7,03 - 9,22 6,99 - 8,81 6,99 - 8,81 6,99 - 8,81Expected volatility (%) 20,86 24,45 29,87 39,49 38,93 38,95Expected dividend yield (%) 3,42 3,42 3,42 3,81 3,81 3,81
Expected forfeiture rate (%)*
9,00 3,00 - 5,00 14,00 9,00 5,00Vesting period – SARs issued between 2009 – 2011
2, 4, 6years
2, 4, 6years –
2, 4, 6years
2, 4, 6years –
Vesting period – LTIs – – 3 years** – – 3 yearsVesting period – SARs issued between 2012 – 2014 –
3, 4, 5years – –
3, 4, 5years –
* All SARs with no CPTs have vested and therefore no forfeiture is applied.** On 25 November 2016, the cash-settled LTI scheme was converted to an equity-settled share scheme.
The risk-free rate for periods within the contractual term of the rights is based on the South African government bonds in effect at the time of the valuation of the grant.
The expected volatility in the value of the rights granted is determined using the historical volaitlity of the Sasol share price.
The expected dividend yield of the rights granted is determined using the historical dividend yield of the Sasol ordinary shares.
The valuation of the share-based payment expense requires a significant degree of judgement to be applied by management.
Accounting policies:The cash-settled schemes allow certain senior employees the right to participate in the performance of the Sasol Limited share price, in return for services rendered, through the payment of cash incentives which are based on the market price of the Sasol Limited share. The vested portion of these rights are recognised as a liability at fair value, at each reporting date, in the statement of financial position until the date of settlement. The unvested portion is recognised in the income statement as employee costs over the period that the employees provide services to the company.
Areas of judgement:Fair value is measured using the Binomial tree and Monte-Carlo option pricing models where applicable. The expected life used in the models has been adjusted, based on management’s best estimate, for the effects of non-transferability, exercise restrictions and behavioural considerations such as volatility, dividend yield and the vesting period. The fair value takes into account the terms and conditions on which these incentives are granted and the extent to which the employees have rendered service to the reporting date.
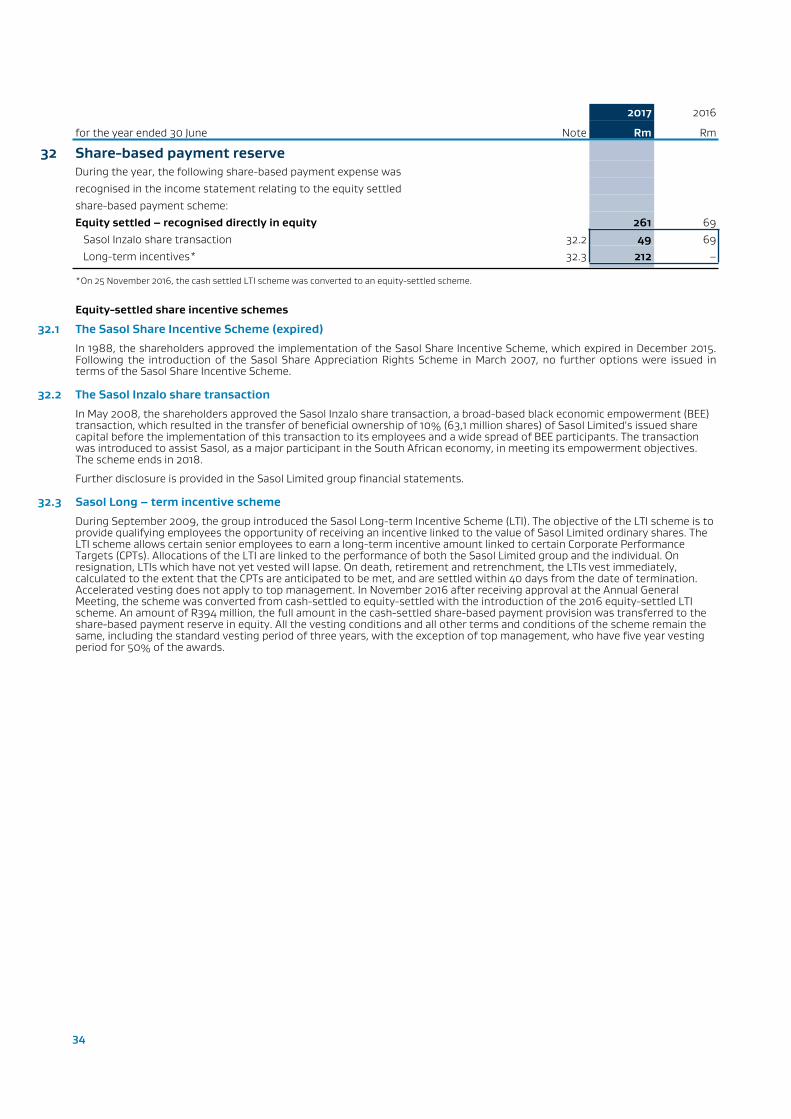
34
2017 2016
for the year ended 30 June Note Rm Rm
32 Share-based payment reserveDuring the year, the following share-based payment expense wasrecognised in the income statement relating to the equity settledshare-based payment scheme:Equity settled – recognised directly in equity 261 69 Sasol Inzalo share transaction 32.2 49 69 Long-term incentives* 32.3 212 –
*On 25 November 2016, the cash settled LTI scheme was converted to an equity-settled scheme.
Equity-settled share incentive schemes
32.1 The Sasol Share Incentive Scheme (expired)
In 1988, the shareholders approved the implementation of the Sasol Share Incentive Scheme, which expired in December 2015. Following the introduction of the Sasol Share Appreciation Rights Scheme in March 2007, no further options were issued in terms of the Sasol Share Incentive Scheme.
32.2 The Sasol Inzalo share transaction
In May 2008, the shareholders approved the Sasol Inzalo share transaction, a broad-based black economic empowerment (BEE) transaction, which resulted in the transfer of beneficial ownership of 10% (63,1 million shares) of Sasol Limited's issued share capital before the implementation of this transaction to its employees and a wide spread of BEE participants. The transaction was introduced to assist Sasol, as a major participant in the South African economy, in meeting its empowerment objectives. The scheme ends in 2018.
Further disclosure is provided in the Sasol Limited group financial statements.
32.3 Sasol Long – term incentive scheme
During September 2009, the group introduced the Sasol Long-term Incentive Scheme (LTI). The objective of the LTI scheme is to provide qualifying employees the opportunity of receiving an incentive linked to the value of Sasol Limited ordinary shares. The LTI scheme allows certain senior employees to earn a long-term incentive amount linked to certain Corporate Performance Targets (CPTs). Allocations of the LTI are linked to the performance of both the Sasol Limited group and the individual. On resignation, LTIs which have not yet vested will lapse. On death, retirement and retrenchment, the LTIs vest immediately, calculated to the extent that the CPTs are anticipated to be met, and are settled within 40 days from the date of termination. Accelerated vesting does not apply to top management. In November 2016 after receiving approval at the Annual General Meeting, the scheme was converted from cash-settled to equity-settled with the introduction of the 2016 equity-settled LTI scheme. An amount of R394 million, the full amount in the cash-settled share-based payment provision was transferred to the share-based payment reserve in equity. All the vesting conditions and all other terms and conditions of the scheme remain the same, including the standard vesting period of three years, with the exception of top management, who have five year vesting period for 50% of the awards.
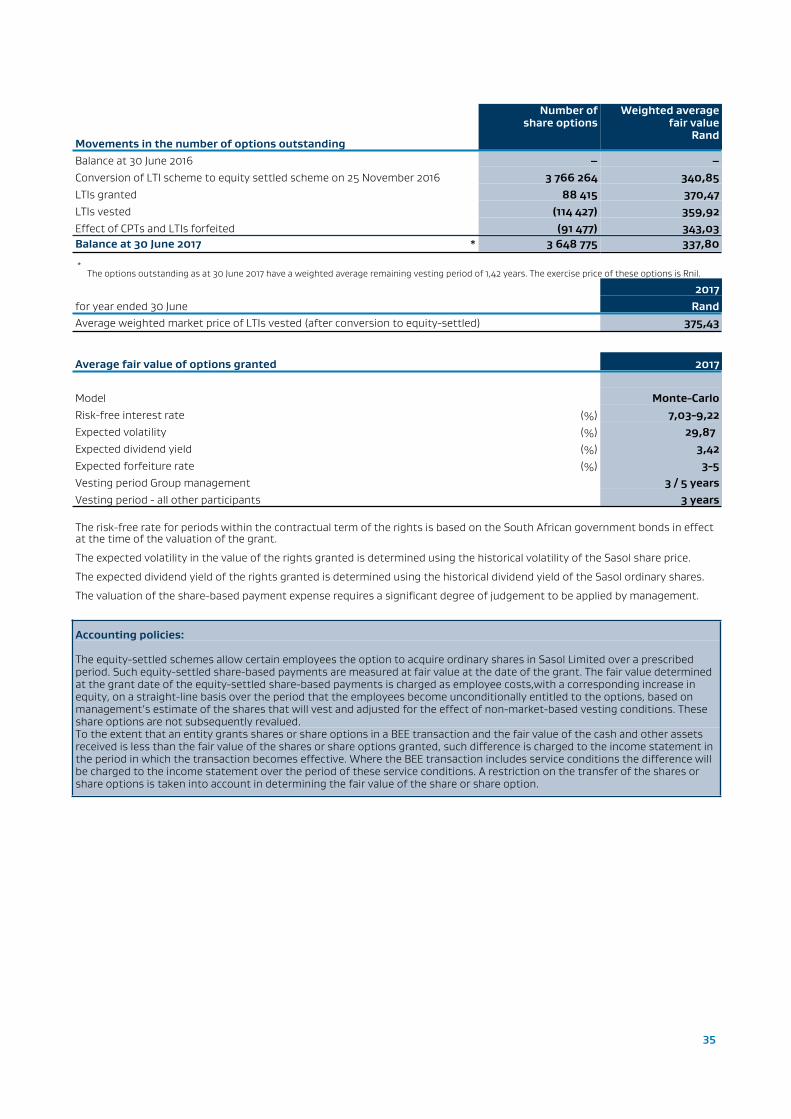
35
Movements in the number of options outstanding
Number ofshare options
Weighted averagefair value
Rand
Balance at 30 June 2016 – –Conversion of LTI scheme to equity settled scheme on 25 November 2016 3 766 264 340,85LTIs granted 88 415 370,47LTIs vested (114 427) 359,92Effect of CPTs and LTIs forfeited (91 477) 343,03Balance at 30 June 2017 * 3 648 775 337,80
*The options outstanding as at 30 June 2017 have a weighted average remaining vesting period of 1,42 years. The exercise price of these options is Rnil.
2017for year ended 30 June RandAverage weighted market price of LTIs vested (after conversion to equity-settled) 375,43
Average fair value of options granted 2017
Model Monte-CarloRisk-free interest rate (%) 7,03-9,22Expected volatility (%) 29,87Expected dividend yield (%) 3,42Expected forfeiture rate (%) 3-5Vesting period Group management 3 / 5 yearsVesting period - all other participants 3 years
The risk-free rate for periods within the contractual term of the rights is based on the South African government bonds in effect at the time of the valuation of the grant.
The expected volatility in the value of the rights granted is determined using the historical volatility of the Sasol share price.
The expected dividend yield of the rights granted is determined using the historical dividend yield of the Sasol ordinary shares.
The valuation of the share-based payment expense requires a significant degree of judgement to be applied by management.
Accounting policies:
The equity-settled schemes allow certain employees the option to acquire ordinary shares in Sasol Limited over a prescribed period. Such equity-settled share-based payments are measured at fair value at the date of the grant. The fair value determined at the grant date of the equity-settled share-based payments is charged as employee costs,with a corresponding increase in equity, on a straight-line basis over the period that the employees become unconditionally entitled to the options, based on management’s estimate of the shares that will vest and adjusted for the effect of non-market-based vesting conditions. These share options are not subsequently revalued.To the extent that an entity grants shares or share options in a BEE transaction and the fair value of the cash and other assets received is less than the fair value of the shares or share options granted, such difference is charged to the income statement in the period in which the transaction becomes effective. Where the BEE transaction includes service conditions the difference will be charged to the income statement over the period of these service conditions. A restriction on the transfer of the shares or share options is taken into account in determining the fair value of the share or share option.
36
33 Contingent liabilities33.1 Litigation
Construction disputes – Fischer Tropsch Wax Expansion Project in Sasolburg (FTWEP)
After the conclusion of construction of FTWEP at the Sasol One site in Sasolburg, a number of contractual claims have been instituted by some contractors who were involved in the construction and project management relating to this project. Certain of these claims have already been resolved, either through settlement between the parties or through the contractual dispute resolution process. Two larger matters are still ongoing. The claimants are Fluor SA (Pty) Ltd and Wetback Contracts (Pty) Ltd.
Fluor SA (Pty) Ltd – FTWEP
Fluor claimed an additional amount of R485,7 million, plus interest (R83,6 million up to May 2015). This dispute turns on the nature and quantification of Fluor’s alleged entitlement to a change to the prices and completion dates for delayed access. In June 2015, Fluor referred the claim to adjudication. In September 2015 the adjudicator rejected Fluor’s entire claim. Thereafter, Fluor notified Sasol of its dissatisfaction with the outcome of the adjudication and Fluor’s intention to refer the matter to arbitration. The arbitration process commenced with Fluor filing its statement of claim during December 2016. Sasol filed two objections against the statement of claim which had the potential to dispose of the arbitration proceedings. The arbitrator however did not decide in favour of Sasol on the objection applications and dismissed the application with costs. The objections will still be raised as a special jurisdictional plea and will be filed with Sasol’s statement of defence. The Parties have agreed on a preliminary timetable for the arbitration, which will see the arbitration hearing being concluded by 6 August 2018, in the event of the special plea not being upheld. Sasol believes that Fluor’s claim is not justified. Accordingly, no provision was recognised at 30 June 2017.
Wetback Contracts (Pty) Ltd – FTWEP
Wetback instituted a claim of R634,2 million for additional compensation. Sasol submitted three counterclaims with an aggregate value of R229,2 million. The matter has been referred to arbitration. The hearing of this dispute commenced on 9 May 2016. During the first two weeks of the hearing, Sasol successfully applied for the separation of certain key issues relating to the interpretation of the contract to be decided before the remainder of the merits of the matter could be heard. This successful separation of issues dictated the framework within which the matter proceeded. In addition to the hearing in December 2016, further hearings on the merits of the matter took place during the first half of 2017. The matter continued with the hearing of evidence during the five hearings in 2017, the last of which was concluded in August 2017. The last expert witness of Sasol still has to give evidence. His evidence was delayed due to illness and is now anticipated to be heard during January 2018; where after the closing arguments in the matter will follow. Thereafter, the Arbitrator will prepare and issue his final award in due course. Sasol South Africa (Pty) Ltd believes that Wetback’s claim is not justified. Accordingly, no provision was raised as at 30 June 2017.
Other
From time to time, Sasol South Africa (Pty) Ltd companies are involved in other litigation and similar proceedings in the normal course of business. A detailed assessment is performed on each matter and a provision is recognised where appropriate. Although the outcome of these proceedings and claims cannot be predicted with certainty, the company does not believe that the outcome of any of these cases would have a material effect on the company's financial results.
33.2 Competition matters
Sasol South Africa (Pty) Ltd continuously evaluates its compliance programmes and controls in general, including its competition law compliance programmes and controls. As a consequence of these compliance programmes and controls, including monitoring and review activities, the company has adopted appropriate remedial and/or mitigating steps, where necessary or advisable, lodged leniency applications and made disclosures on material findings as and when appropriate. These ongoing compliance activities have already revealed, and may still reveal, competition law contraventions or potential contraventions in respect of which we have taken, or will take, appropriate remedial and/or mitigating steps including lodging leniency applications.
33.3 Environmental orders
Our Sasolburg Operations have pipeline servitudes traversing a targeted mining area for which Anglo Operations Limited (Anglo) obtained an Environmental Authorisation (“EA”) for their proposed Lifex Project for sale of coal to Eskom associated with the extended operations of the Lethabo Power station. This includes, amongst others, the Suikerbosch line belonging to the Sasolburg Operations and the Sassec lines. It is Sasol’s view that the risks and impacts of the proposed mining activities in relation to Sasol’s existing pipelines and the associated cost with the potential relocation of the pipelines, were not duly assessed, considered and addressed as part of the EA. To protect Sasol’s rights and interests in the circumstances, Sasol South Africa (Pty) Limited, amongst other Sasol entities, lodged an administrative appeal against the EA with the Minister of Environmental Affairs. The appeal is pending. Engagements with Anglo will also continue in lieu of an amicable outcome outside of this process.
Sasol South Africa (Pty) Ltd’s environmental obligation accrued at 30 June 2017 was R6 036 million compared to R5 225 million at 30 June 2016. Included in this balance is an amount accrued of approximately R5 877 million in respect of the costs of remediation of soil and groundwater contamination and similar environmental costs. These costs relate to the following activities: site assessments, soil and groundwater clean-up and remediation, and on-going monitoring. Due to uncertainties regarding future costs the potential loss in excess of the amount accrued cannot be reasonably determined.Although Sasol South Africa (Pty) Ltd has provided for known environmental obligations that are probable and reasonably estimable, the amount of additional future costs relating to remediation and rehabilitation may be material to results of operations in the period in which they are recognised. It is not expected that these environmental obligations will have a material effect on the financial position of the company.
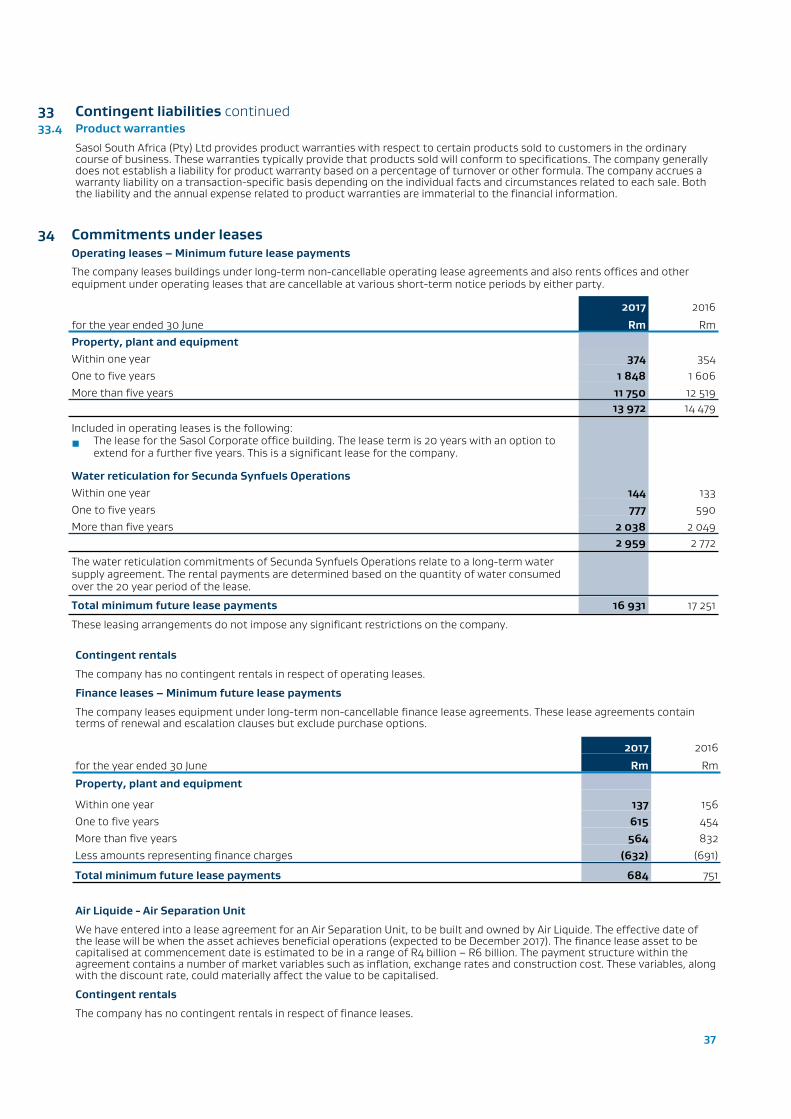
37
33 Contingent liabilities continued33.4 Product warranties
Sasol South Africa (Pty) Ltd provides product warranties with respect to certain products sold to customers in the ordinary course of business. These warranties typically provide that products sold will conform to specifications. The company generally does not establish a liability for product warranty based on a percentage of turnover or other formula. The company accrues a warranty liability on a transaction-specific basis depending on the individual facts and circumstances related to each sale. Both the liability and the annual expense related to product warranties are immaterial to the financial information.
34 Commitments under leasesOperating leases – Minimum future lease payments
The company leases buildings under long-term non-cancellable operating lease agreements and also rents offices and other equipment under operating leases that are cancellable at various short-term notice periods by either party.
2017 2016
for the year ended 30 June Rm RmProperty, plant and equipmentWithin one year 374 354One to five years 1 848 1 606More than five years 11 750 12 519
13 972 14 479
Included in operating leases is the following:■ The lease for the Sasol Corporate office building. The lease term is 20 years with an option to
extend for a further five years. This is a significant lease for the company.
Water reticulation for Secunda Synfuels OperationsWithin one year 144 133One to five years 777 590More than five years 2 038 2 049
2 959 2 772
The water reticulation commitments of Secunda Synfuels Operations relate to a long-term water supply agreement. The rental payments are determined based on the quantity of water consumed over the 20 year period of the lease.
Total minimum future lease payments 16 931 17 251
These leasing arrangements do not impose any significant restrictions on the company.
Contingent rentals
The company has no contingent rentals in respect of operating leases.
Finance leases – Minimum future lease payments
The company leases equipment under long-term non-cancellable finance lease agreements. These lease agreements contain terms of renewal and escalation clauses but exclude purchase options.
2017 2016
for the year ended 30 June Rm Rm
Property, plant and equipment
Within one year 137 156One to five years 615 454More than five years 564 832Less amounts representing finance charges (632) (691)
Total minimum future lease payments 684 751
Air Liquide - Air Separation Unit
We have entered into a lease agreement for an Air Separation Unit, to be built and owned by Air Liquide. The effective date of the lease will be when the asset achieves beneficial operations (expected to be December 2017). The finance lease asset to be capitalised at commencement date is estimated to be in a range of R4 billion – R6 billion. The payment structure within the agreement contains a number of market variables such as inflation, exchange rates and construction cost. These variables, along with the discount rate, could materially affect the value to be capitalised.
Contingent rentals
The company has no contingent rentals in respect of finance leases.
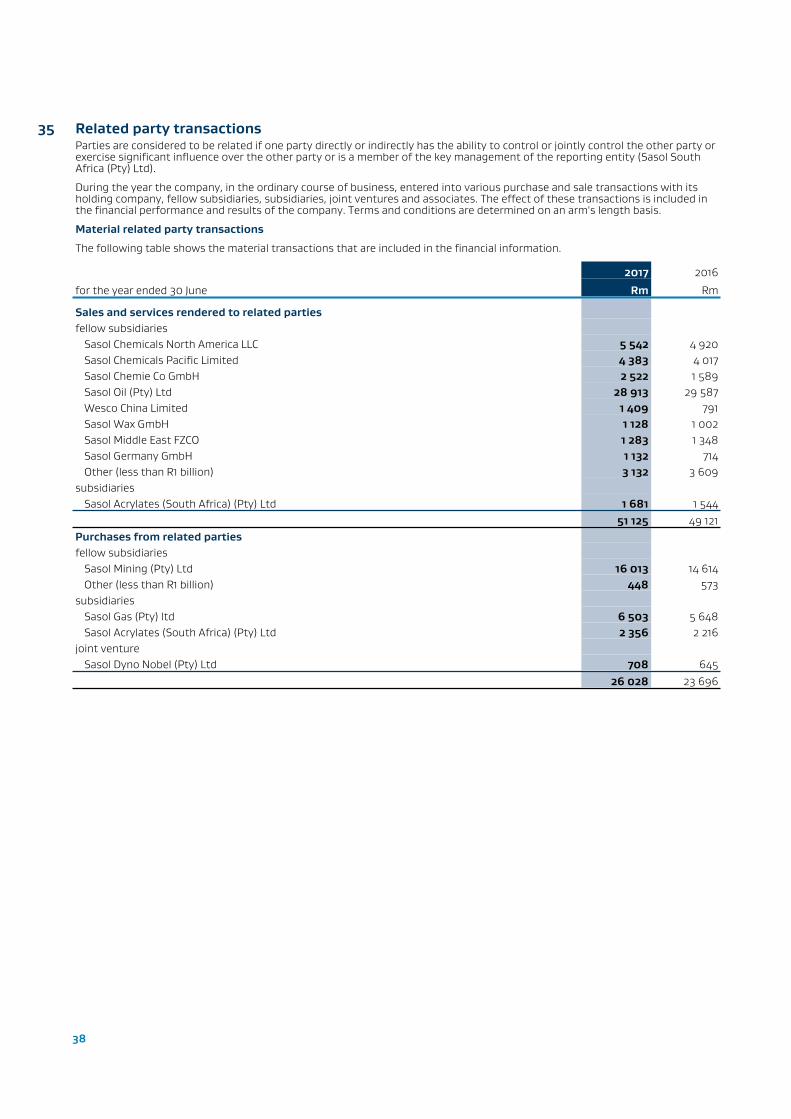
38
35 Related party transactionsParties are considered to be related if one party directly or indirectly has the ability to control or jointly control the other party or exercise significant influence over the other party or is a member of the key management of the reporting entity (Sasol South Africa (Pty) Ltd).
During the year the company, in the ordinary course of business, entered into various purchase and sale transactions with its holding company, fellow subsidiaries, subsidiaries, joint ventures and associates. The effect of these transactions is included in the financial performance and results of the company. Terms and conditions are determined on an arm's length basis.
Material related party transactions
The following table shows the material transactions that are included in the financial information.
2017 2016
for the year ended 30 June Rm Rm
Sales and services rendered to related partiesfellow subsidiaries
Sasol Chemicals North America LLC 5 542 4 920Sasol Chemicals Pacific Limited 4 383 4 017Sasol Chemie Co GmbH 2 522 1 589Sasol Oil (Pty) Ltd 28 913 29 587Wesco China Limited 1 409 791Sasol Wax GmbH 1 128 1 002Sasol Middle East FZCO 1 283 1 348Sasol Germany GmbH 1 132 714Other (less than R1 billion) 3 132 3 609
subsidiariesSasol Acrylates (South Africa) (Pty) Ltd 1 681 1 544
51 125 49 121Purchases from related partiesfellow subsidiaries
Sasol Mining (Pty) Ltd 16 013 14 614Other (less than R1 billion) 448 573
subsidiariesSasol Gas (Pty) ltd 6 503 5 648Sasol Acrylates (South Africa) (Pty) Ltd 2 356 2 216
joint ventureSasol Dyno Nobel (Pty) Ltd 708 645
26 028 23 696

39
2017 2016
for the year ended 30 June Note Rm RmOther income statement items from related partiesAdministration fees paidfellow subsidiaries
Sasol Technology (Pty) Ltd 60 2 577Finance costsfellow subsidiaries
Sasol Financing (Pty) Ltd 2 794 2 202Sasol Oil (Pty) Ltd 50 52
2 844 2 254Finance incomefellow subsidiaries
Sasol Financing (Pty) Ltd 818 578subsidiaries
Sasol General Holdings (Pty) ltd 2 50Sasol Acrylates (Pty) Ltd 5 –ROMPCO (Pty) Ltd 265 –
joint ventureSasol Dyno Nobel (Pty) Ltd 50 35
associateClariant Sasol Catalysts (Pty) Ltd* 18 8 7
1 148 670
*Not included as part of finance income but included in investment in associates
2017 2016
for the year ended 30 June Rm RmAmounts reflected as non-current assetsInvestment in subsidiaries
Sasol Dyno Nobel (Pty) Ltd 115 115Sasol Acrylates (South Africa) (Pty) Ltd 819 –Sasol Acrylates (Pty) Ltd 372 –Sasol General Holdings (Pty) Ltd – 2 691ROMPCO (Pty) Ltd 5 5Sasol Gas (Pty) Ltd 46 877 –Dormant entities 9 9Siyakha BEE procurement Iniative Trust 19 19
48 216 2 839Amounts reflected as current assetsReceivablesfellow subsidiaries
Sasol Chemicals North America LLC 1 714 1 628Sasol Oil (Pty) Ltd 2 644 2 969Sasol Chemie Co GmbH 1 032 475Sasol Nitro Mozambique Limitada 41 41Other (less than R1 billion) 2 553 2 773
subsidiariesSasol Gas (Pty) ltd 88 94Sasol Acrylates (South Africa) (Pty) Ltd 251 234ROMPCO (Pty) Ltd 1 –
joint ventureSasol Dyno Nobel (Pty) Ltd 7 11
8 331 8 225Cash and cash equivalents fellow subsidiaries
Sasol Financing (Pty) Ltd 4 159 5 218Sasol Financing International Ltd 3 –
4 162 5 218
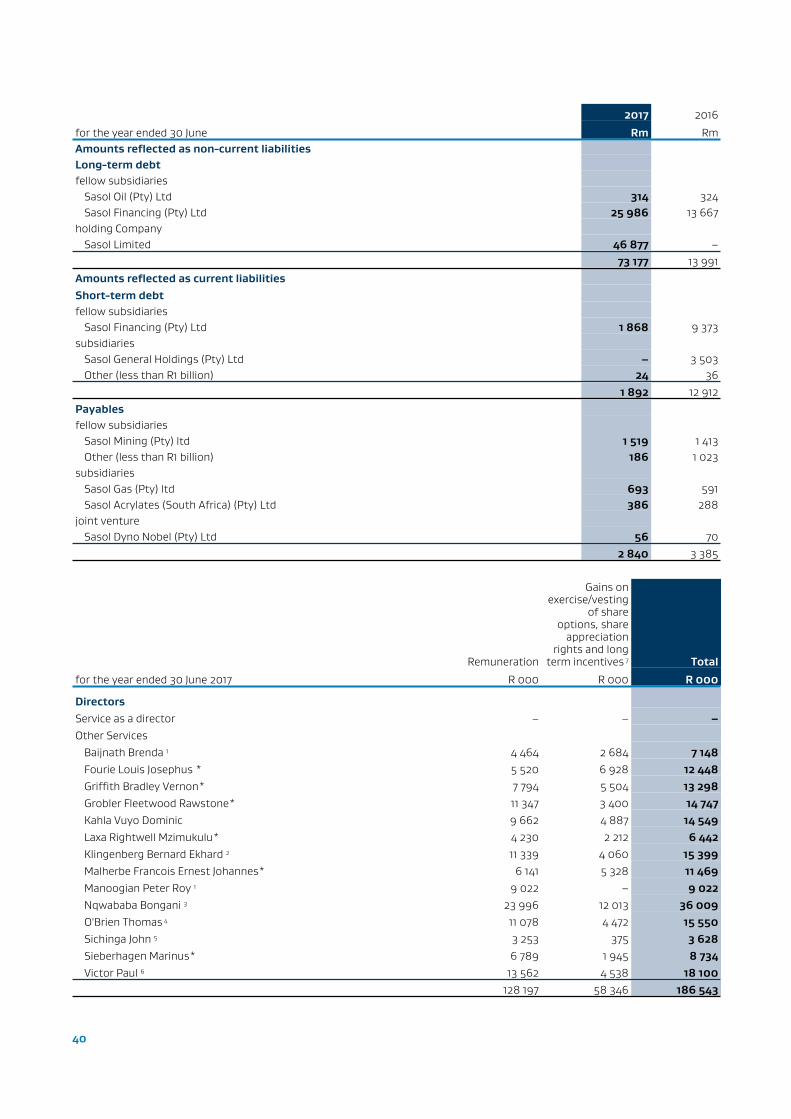
40
2017 2016
for the year ended 30 June Rm RmAmounts reflected as non-current liabilitiesLong-term debtfellow subsidiaries
Sasol Oil (Pty) Ltd 314 324Sasol Financing (Pty) Ltd 25 986 13 667
holding CompanySasol Limited 46 877 –
73 177 13 991Amounts reflected as current liabilitiesShort-term debtfellow subsidiaries
Sasol Financing (Pty) Ltd 1 868 9 373subsidiaries
Sasol General Holdings (Pty) Ltd – 3 503Other (less than R1 billion) 24 36
1 892 12 912Payablesfellow subsidiaries
Sasol Mining (Pty) ltd 1 519 1 413Other (less than R1 billion) 186 1 023
subsidiariesSasol Gas (Pty) ltd 693 591Sasol Acrylates (South Africa) (Pty) Ltd 386 288
joint ventureSasol Dyno Nobel (Pty) Ltd 56 70
2 840 3 385
Remuneration
Gains on exercise/vesting
of share options, share
appreciation rights and long
term incentives 7 Total
for the year ended 30 June 2017 R 000 R 000 R 000
DirectorsService as a director – – –Other Services
Baijnath Brenda 1 4 464 2 684 7 148Fourie Louis Josephus * 5 520 6 928 12 448Griffith Bradley Vernon* 7 794 5 504 13 298Grobler Fleetwood Rawstone* 11 347 3 400 14 747Kahla Vuyo Dominic 9 662 4 887 14 549Laxa Rightwell Mzimukulu* 4 230 2 212 6 442Klingenberg Bernard Ekhard 2 11 339 4 060 15 399Malherbe Francois Ernest Johannes* 6 141 5 328 11 469Manoogian Peter Roy 1 9 022 – 9 022Nqwababa Bongani 3 23 996 12 013 36 009O'Brien Thomas 4 11 078 4 472 15 550Sichinga John 5 3 253 375 3 628Sieberhagen Marinus* 6 789 1 945 8 734Victor Paul 6 13 562 4 538 18 100
128 197 58 346 186 543
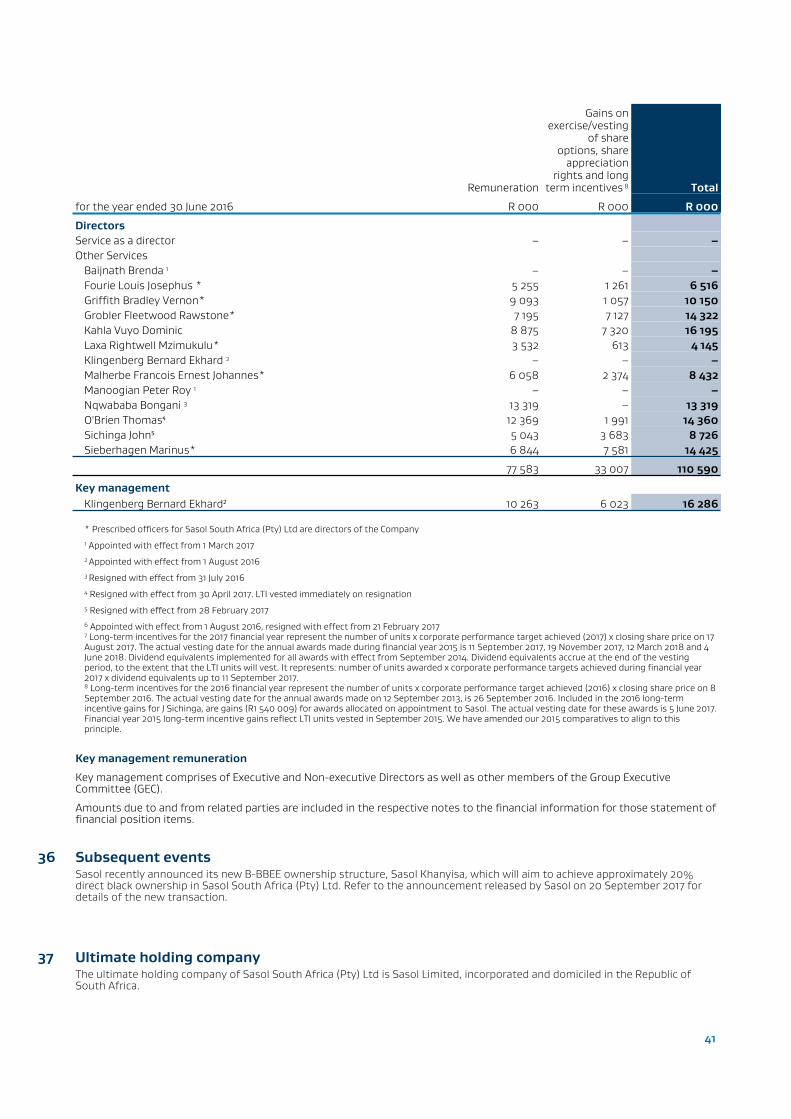
41
Remuneration
Gains on exercise/vesting
of share options, share
appreciation rights and long
term incentives 8 Total
for the year ended 30 June 2016 R 000 R 000 R 000
DirectorsService as a director – – –Other Services
Baijnath Brenda 1 – – –Fourie Louis Josephus * 5 255 1 261 6 516Griffith Bradley Vernon* 9 093 1 057 10 150Grobler Fleetwood Rawstone* 7 195 7 127 14 322Kahla Vuyo Dominic 8 875 7 320 16 195Laxa Rightwell Mzimukulu* 3 532 613 4 145Klingenberg Bernard Ekhard 2 – – –Malherbe Francois Ernest Johannes* 6 058 2 374 8 432Manoogian Peter Roy 1 – – –Nqwababa Bongani 3 13 319 – 13 319O'Brien Thomas⁴ 12 369 1 991 14 360Sichinga John⁵ 5 043 3 683 8 726Sieberhagen Marinus* 6 844 7 581 14 425
77 583 33 007 110 590
Key managementKlingenberg Bernard Ekhard² 10 263 6 023 16 286
* Prescribed officers for Sasol South Africa (Pty) Ltd are directors of the Company1 Appointed with effect from 1 March 20172 Appointed with effect from 1 August 20163 Resigned with effect from 31 July 20164 Resigned with effect from 30 April 2017. LTI vested immediately on resignation5 Resigned with effect from 28 February 20176 Appointed with effect from 1 August 2016, resigned with effect from 21 February 20177 Long-term incentives for the 2017 financial year represent the number of units x corporate performance target achieved (2017) x closing share price on 17 August 2017. The actual vesting date for the annual awards made during financial year 2015 is 11 September 2017, 19 November 2017, 12 March 2018 and 4 June 2018. Dividend equivalents implemented for all awards with effect from September 2014. Dividend equivalents accrue at the end of the vesting period, to the extent that the LTI units will vest. It represents: number of units awarded x corporate performance targets achieved during financial year 2017 x dividend equivalents up to 11 September 2017.8 Long-term incentives for the 2016 financial year represent the number of units x corporate performance target achieved (2016) x closing share price on 8 September 2016. The actual vesting date for the annual awards made on 12 September 2013, is 26 September 2016. Included in the 2016 long-term incentive gains for J Sichinga, are gains (R1 540 009) for awards allocated on appointment to Sasol. The actual vesting date for these awards is 5 June 2017. Financial year 2015 long-term incentive gains reflect LTI units vested in September 2015. We have amended our 2015 comparatives to align to this principle.
Key management remuneration
Key management comprises of Executive and Non-executive Directors as well as other members of the Group Executive Committee (GEC).
Amounts due to and from related parties are included in the respective notes to the financial information for those statement of financial position items.
36 Subsequent eventsSasol recently announced its new B-BBEE ownership structure, Sasol Khanyisa, which will aim to achieve approximately 20% direct black ownership in Sasol South Africa (Pty) Ltd. Refer to the announcement released by Sasol on 20 September 2017 for details of the new transaction.
37 Ultimate holding companyThe ultimate holding company of Sasol South Africa (Pty) Ltd is Sasol Limited, incorporated and domiciled in the Republic of South Africa.

42
38 Going concernThe directors’ have made an assessment of the company’s ability to continue as a going concern and there is no reason to believe the business will not be a going concern in the year ahead.
39 Financial risk management and financial instruments
The company classifies all its financial instruments at amortised cost except for short-term financial assets and liabilities which are classified at fair value through profit and loss.
39.1 Financial risk management
The company is exposed in varying degrees to a number of financial instrument related risks. The directors have the overall responsibility for the establishment and oversight of the company's risk management framework. The directors are responsible for providing the board with the assurance that significant business risks are systematically identified, assessed and reduced to acceptable levels. A comprehensive risk management process has been developed to continuously monitor and control these risks. The directors and divisional committees of Sasol South Africa (Pty) Ltd meet regularly to review and, if appropriate, approve the implementation of optimal strategies for the effective management of financial risks. The committee reports on a regular basis to the Group Executive Committee (GEC) on its activities.
The Sasol group has a central treasury function that manages the financial risks relating to the group's operations.
Capital allocation
The company's objectives when managing capital (which includes share capital, borrowings, working capital and cash and cash equivalents) is to maintain a flexible capital structure that reduces the cost of capital to an acceptable level of risk and to safeguard the company's ability to continue as a going concern while taking advantage of strategic opportunities in order to grow shareholder value sustainably.
The company manages the capital structure and makes adjustments to it in light of changes in economic conditions and the risk characteristics of the underlying assets. In order to maintain the capital structure, the company may adjust the amount of dividends paid to shareholders, return capital to shareholders, issue new debt, issue new debt to replace existing debt with different characteristics and/or sell assets to reduce debt.
The company monitors capital utilising a number of measures, including the gearing ratio. The gearing ratio is calculated as net borrowings (total borrowings less cash) divided by shareholders' equity. Gearing takes into account the company's substantial capital investment and susceptibility to external market factors such as crude oil prices, exchange rates and commodity chemical prices. The company's gearing level for 2017 is 138% (2016 – 38%), mainly due to the loan raised of R46,9 billion with Sasol Limited to fund the acquisition of Sasol Gas (Pty) Ltd at fair value. Excluding the loan to finance the acquisition of Sasol Gas (Pty) Ltd the gearing for 2017 is 47%.
Financing risk
Financing risk refers to the risk that financing of the company’s net debt requirements and refinancing of existing borrowings could become more difficult or more costly in the future. This risk can be decreased by managing the company within the targeted gearing ratio, maintaining an appropriate spread of maturity dates and managing short-term borrowings within acceptable levels.
The company’s target for long-term borrowings include an average time to maturity of at least two years, and an even spread of maturities.
Risk profile
Risk management and measurement relating to each of these risks is discussed under the headings below (sub-categorised into credit risk, liquidity risk, and market risk) which entails an analysis of the types of risk exposure, the way in which such exposure is managed and quantification of the level of exposure in the statement of financial position.
Credit risk
Credit risk, or the risk of financial loss due to counterparties not meeting their contractual obligations.
How we manage the risk
The risk is managed by the application of credit approvals, limits and monitoring procedures. Where appropriate, the company obtains security in the form of guarantees to mitigate risk. Counterparty credit limits are in place and are reviewed and approved by the respective divisional credit management committees. The central treasury function provides credit risk management for the group-wide exposure in respect of a diversified group of banks and other financial institutions. These are evaluated regularly for financial robustness especially in the current global economic environment. Management has evaluated treasury counterparty risk and does not expect any treasury counterparties to fail in meeting their obligations.
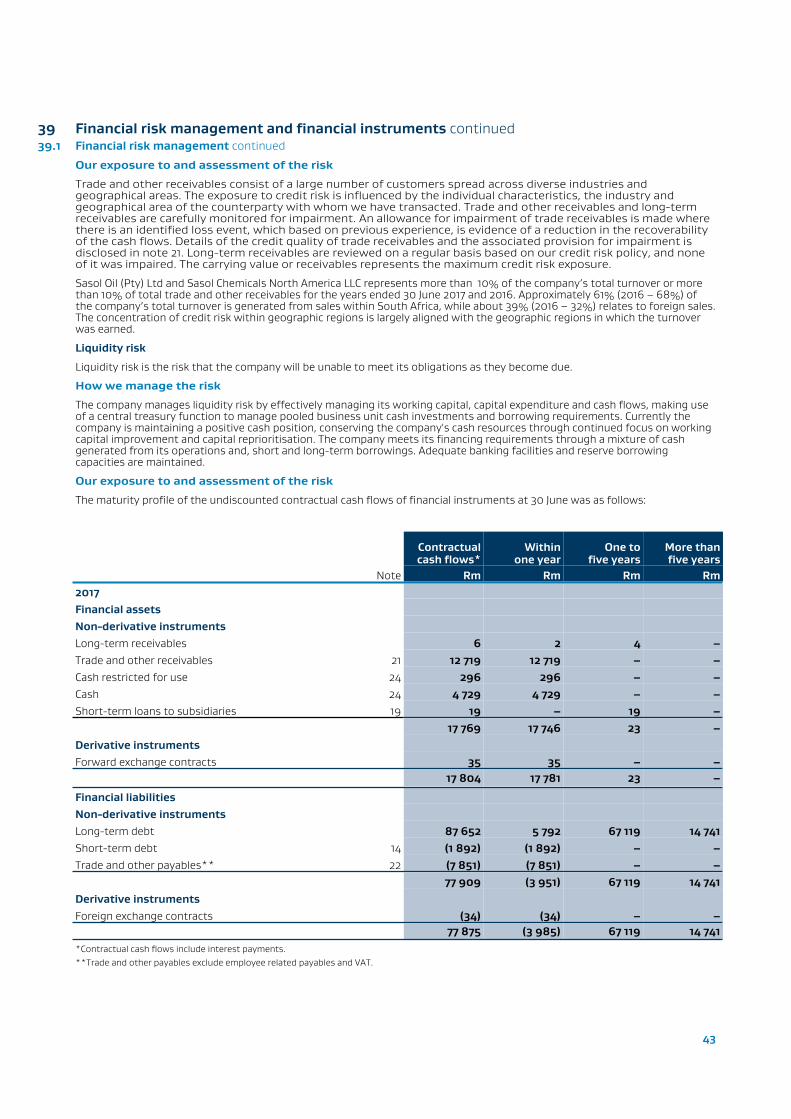
43
39 Financial risk management and financial instruments continued39.1 Financial risk management continued
Our exposure to and assessment of the risk
Trade and other receivables consist of a large number of customers spread across diverse industries and geographical areas. The exposure to credit risk is influenced by the individual characteristics, the industry and geographical area of the counterparty with whom we have transacted. Trade and other receivables and long-term receivables are carefully monitored for impairment. An allowance for impairment of trade receivables is made where there is an identified loss event, which based on previous experience, is evidence of a reduction in the recoverability of the cash flows. Details of the credit quality of trade receivables and the associated provision for impairment is disclosed in note 21. Long-term receivables are reviewed on a regular basis based on our credit risk policy, and none of it was impaired. The carrying value or receivables represents the maximum credit risk exposure.
Sasol Oil (Pty) Ltd and Sasol Chemicals North America LLC represents more than 10% of the company’s total turnover or more than 10% of total trade and other receivables for the years ended 30 June 2017 and 2016. Approximately 61% (2016 – 68%) of the company’s total turnover is generated from sales within South Africa, while about 39% (2016 – 32%) relates to foreign sales. The concentration of credit risk within geographic regions is largely aligned with the geographic regions in which the turnover was earned.
Liquidity risk
Liquidity risk is the risk that the company will be unable to meet its obligations as they become due.
How we manage the risk
The company manages liquidity risk by effectively managing its working capital, capital expenditure and cash flows, making use of a central treasury function to manage pooled business unit cash investments and borrowing requirements. Currently the company is maintaining a positive cash position, conserving the company's cash resources through continued focus on working capital improvement and capital reprioritisation. The company meets its financing requirements through a mixture of cash generated from its operations and, short and long-term borrowings. Adequate banking facilities and reserve borrowing capacities are maintained.
Our exposure to and assessment of the risk
The maturity profile of the undiscounted contractual cash flows of financial instruments at 30 June was as follows:
Contractual cash flows*
Within one year
One to five years
More than five years
Note Rm Rm Rm Rm2017Financial assetsNon-derivative instrumentsLong-term receivables 6 2 4 –Trade and other receivables 21 12 719 12 719 – –Cash restricted for use 24 296 296 – –Cash 24 4 729 4 729 – –Short-term loans to subsidiaries 19 19 – 19 –
17 769 17 746 23 –Derivative instrumentsForward exchange contracts 35 35 – –
17 804 17 781 23 –
Financial liabilitiesNon-derivative instrumentsLong-term debt 87 652 5 792 67 119 14 741Short-term debt 14 (1 892) (1 892) – –Trade and other payables** 22 (7 851) (7 851) – –
77 909 (3 951) 67 119 14 741Derivative instrumentsForeign exchange contracts (34) (34) – –
77 875 (3 985) 67 119 14 741*Contractual cash flows include interest payments.**Trade and other payables exclude employee related payables and VAT.
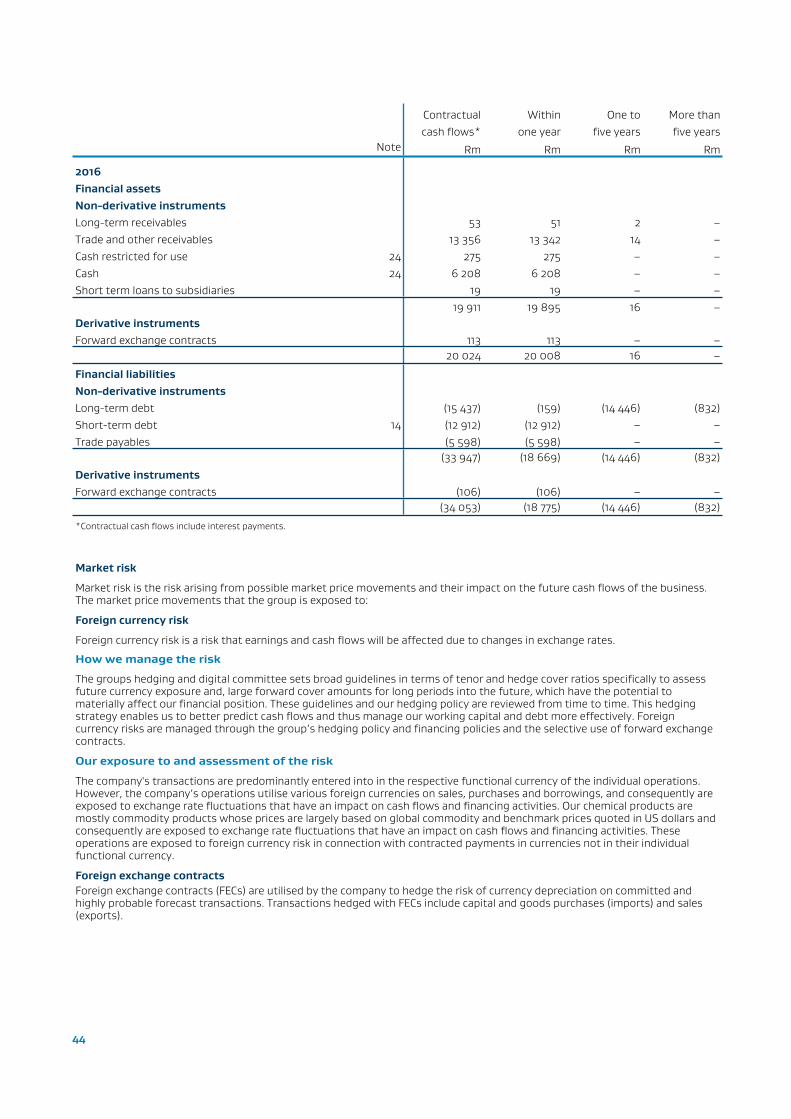
44
Contractual Within One to More thancash flows* one year five years five years
Note Rm Rm Rm Rm
2016Financial assetsNon-derivative instrumentsLong-term receivables 53 51 2 –Trade and other receivables 13 356 13 342 14 –Cash restricted for use 24 275 275 – –Cash 24 6 208 6 208 – –Short term loans to subsidiaries 19 19 – –
19 911 19 895 16 –Derivative instrumentsForward exchange contracts 113 113 – –
20 024 20 008 16 –
Financial liabilitiesNon-derivative instrumentsLong-term debt (15 437) (159) (14 446) (832)Short-term debt 14 (12 912) (12 912) – –Trade payables (5 598) (5 598) – –
(33 947) (18 669) (14 446) (832)
Derivative instrumentsForward exchange contracts (106) (106) – –
(34 053) (18 775) (14 446) (832)
*Contractual cash flows include interest payments.
Market risk
Market risk is the risk arising from possible market price movements and their impact on the future cash flows of the business. The market price movements that the group is exposed to:
Foreign currency risk
Foreign currency risk is a risk that earnings and cash flows will be affected due to changes in exchange rates.
How we manage the risk
The groups hedging and digital committee sets broad guidelines in terms of tenor and hedge cover ratios specifically to assess future currency exposure and, large forward cover amounts for long periods into the future, which have the potential to materially affect our financial position. These guidelines and our hedging policy are reviewed from time to time. This hedging strategy enables us to better predict cash flows and thus manage our working capital and debt more effectively. Foreign currency risks are managed through the group’s hedging policy and financing policies and the selective use of forward exchange contracts.
Our exposure to and assessment of the risk
The company's transactions are predominantly entered into in the respective functional currency of the individual operations. However, the company’s operations utilise various foreign currencies on sales, purchases and borrowings, and consequently are exposed to exchange rate fluctuations that have an impact on cash flows and financing activities. Our chemical products are mostly commodity products whose prices are largely based on global commodity and benchmark prices quoted in US dollars and consequently are exposed to exchange rate fluctuations that have an impact on cash flows and financing activities. These operations are exposed to foreign currency risk in connection with contracted payments in currencies not in their individual functional currency.
Foreign exchange contractsForeign exchange contracts (FECs) are utilised by the company to hedge the risk of currency depreciation on committed and highly probable forecast transactions. Transactions hedged with FECs include capital and goods purchases (imports) and sales (exports).
Not
es t
o th
e fi
nanc
ial s
tate
men
ts
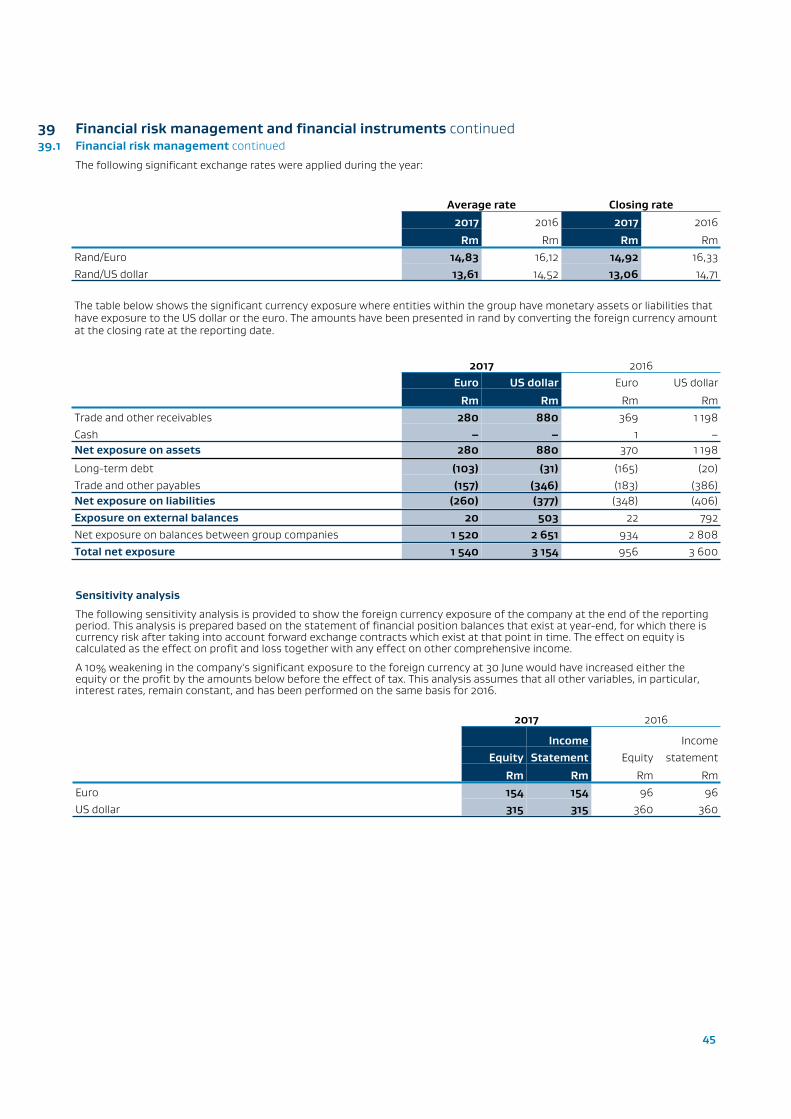
45
39 Financial risk management and financial instruments continued39.1 Financial risk management continued
The following significant exchange rates were applied during the year:
Average rate Closing rate2017 2016 2017 2016
Rm Rm Rm RmRand/Euro 14,83 16,12 14,92 16,33Rand/US dollar 13,61 14,52 13,06 14,71
The table below shows the significant currency exposure where entities within the group have monetary assets or liabilities that have exposure to the US dollar or the euro. The amounts have been presented in rand by converting the foreign currency amount at the closing rate at the reporting date.
2017 2016Euro US dollar Euro US dollar
Rm Rm Rm RmTrade and other receivables 280 880 369 1 198Cash – – 1 –Net exposure on assets 280 880 370 1 198
Long-term debt (103) (31) (165) (20)Trade and other payables (157) (346) (183) (386)Net exposure on liabilities (260) (377) (348) (406)Exposure on external balances 20 503 22 792Net exposure on balances between group companies 1 520 2 651 934 2 808Total net exposure 1 540 3 154 956 3 600
Sensitivity analysis
The following sensitivity analysis is provided to show the foreign currency exposure of the company at the end of the reporting period. This analysis is prepared based on the statement of financial position balances that exist at year-end, for which there is currency risk after taking into account forward exchange contracts which exist at that point in time. The effect on equity is calculated as the effect on profit and loss together with any effect on other comprehensive income.
A 10% weakening in the company's significant exposure to the foreign currency at 30 June would have increased either the equity or the profit by the amounts below before the effect of tax. This analysis assumes that all other variables, in particular, interest rates, remain constant, and has been performed on the same basis for 2016.
2017 2016
Income Income Equity Statement Equity statement
Rm Rm Rm RmEuro 154 154 96 96US dollar 315 315 360 360
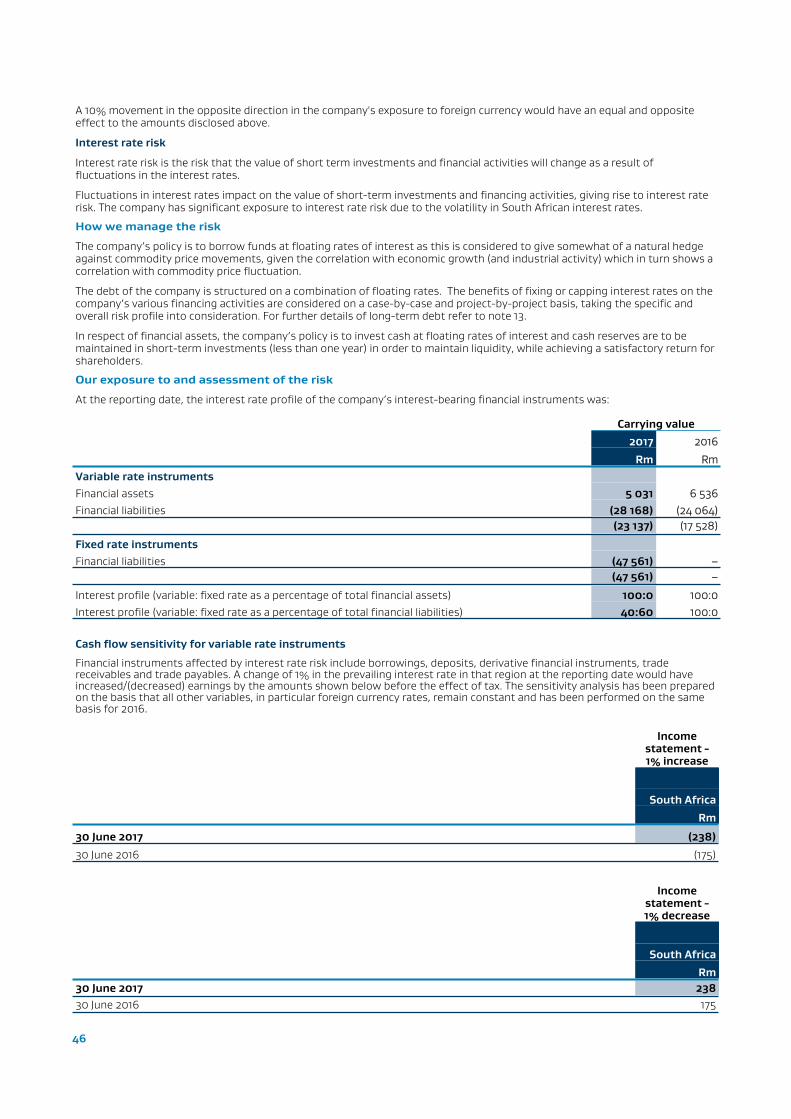
46
A 10% movement in the opposite direction in the company's exposure to foreign currency would have an equal and opposite effect to the amounts disclosed above.
Interest rate risk
Interest rate risk is the risk that the value of short term investments and financial activities will change as a result of fluctuations in the interest rates.
Fluctuations in interest rates impact on the value of short-term investments and financing activities, giving rise to interest rate risk. The company has significant exposure to interest rate risk due to the volatility in South African interest rates.
How we manage the risk
The company’s policy is to borrow funds at floating rates of interest as this is considered to give somewhat of a natural hedge against commodity price movements, given the correlation with economic growth (and industrial activity) which in turn shows a correlation with commodity price fluctuation.
The debt of the company is structured on a combination of floating rates. The benefits of fixing or capping interest rates on the company’s various financing activities are considered on a case-by-case and project-by-project basis, taking the specific and overall risk profile into consideration. For further details of long-term debt refer to note 13.
In respect of financial assets, the company’s policy is to invest cash at floating rates of interest and cash reserves are to be maintained in short-term investments (less than one year) in order to maintain liquidity, while achieving a satisfactory return for shareholders.
Our exposure to and assessment of the risk
At the reporting date, the interest rate profile of the company’s interest-bearing financial instruments was:
Carrying value2017 2016
Rm RmVariable rate instrumentsFinancial assets 5 031 6 536Financial liabilities (28 168) (24 064)
(23 137) (17 528)
Fixed rate instrumentsFinancial liabilities (47 561) –
(47 561) –
Interest profile (variable: fixed rate as a percentage of total financial assets) 100:0 100:0Interest profile (variable: fixed rate as a percentage of total financial liabilities) 40:60 100:0
Cash flow sensitivity for variable rate instruments
Financial instruments affected by interest rate risk include borrowings, deposits, derivative financial instruments, trade receivables and trade payables. A change of 1% in the prevailing interest rate in that region at the reporting date would have increased/(decreased) earnings by the amounts shown below before the effect of tax. The sensitivity analysis has been prepared on the basis that all other variables, in particular foreign currency rates, remain constant and has been performed on the same basis for 2016.
Income statement - 1% increase
South Africa
Rm
30 June 2017 (238)
30 June 2016 (175)
Income statement - 1% decrease
South Africa
Rm30 June 2017 23830 June 2016 175
Not
es t
o th
e fi
nanc
ial s
tate
men
ts
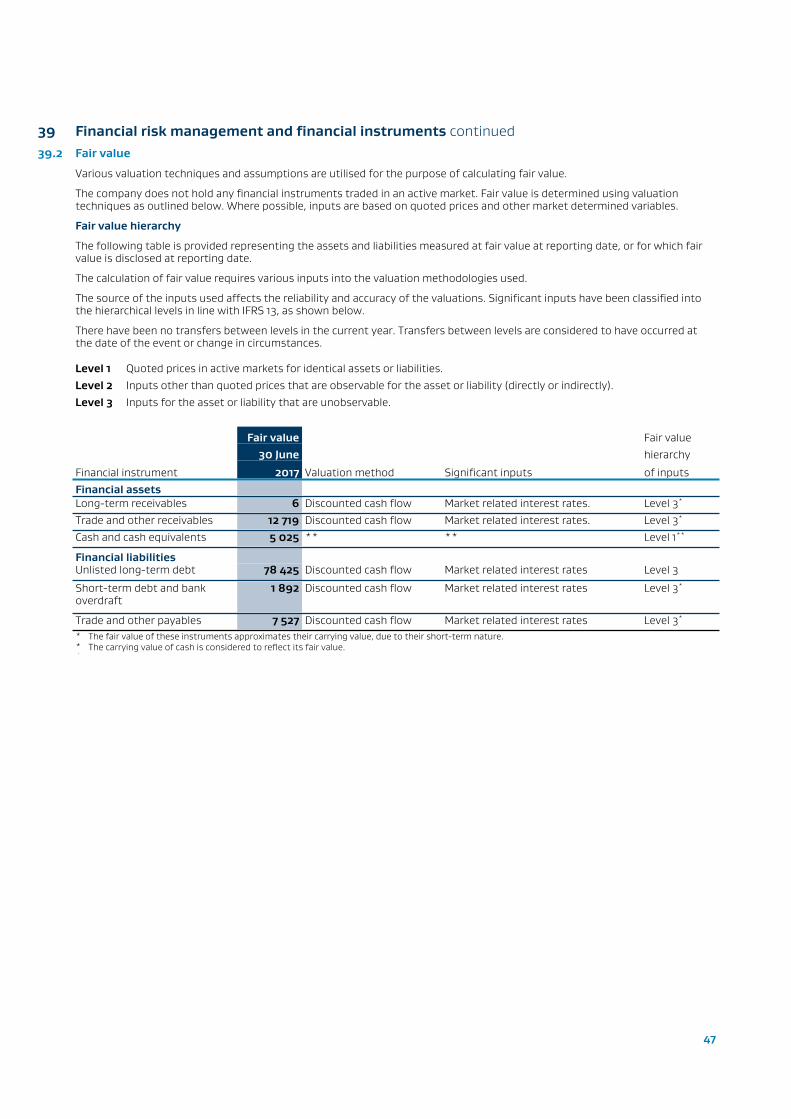
47
39 Financial risk management and financial instruments continued39.2 Fair value
Various valuation techniques and assumptions are utilised for the purpose of calculating fair value.
The company does not hold any financial instruments traded in an active market. Fair value is determined using valuation techniques as outlined below. Where possible, inputs are based on quoted prices and other market determined variables.
Fair value hierarchy
The following table is provided representing the assets and liabilities measured at fair value at reporting date, or for which fair value is disclosed at reporting date.
The calculation of fair value requires various inputs into the valuation methodologies used.
The source of the inputs used affects the reliability and accuracy of the valuations. Significant inputs have been classified into the hierarchical levels in line with IFRS 13, as shown below.
There have been no transfers between levels in the current year. Transfers between levels are considered to have occurred at the date of the event or change in circumstances.
Level 1 Quoted prices in active markets for identical assets or liabilities.Level 2 Inputs other than quoted prices that are observable for the asset or liability (directly or indirectly).Level 3 Inputs for the asset or liability that are unobservable.
Fair value Fair value30 June hierarchy
Financial instrument 2017 Valuation method Significant inputs of inputsFinancial assetsLong-term receivables 6 Discounted cash flow Market related interest rates. Level 3*
Trade and other receivables 12 719 Discounted cash flow Market related interest rates. Level 3*
Cash and cash equivalents 5 025 ** ** Level 1**
Financial liabilitiesUnlisted long-term debt 78 425 Discounted cash flow Market related interest rates Level 3
Short-term debt and bank overdraft
1 892 Discounted cash flow Market related interest rates Level 3*
Trade and other payables 7 527 Discounted cash flow Market related interest rates Level 3*
* The fair value of these instruments approximates their carrying value, due to their short-term nature.**
The carrying value of cash is considered to reflect its fair value.