Embed Size (px)
Citation preview
1
Uncertainty in Risk
ModelsErnest Lever
Gas Technology Institute
> PHMSA RMWG
> Centerpoint Building, Houston, TX
> March 7th, 2017
2
Agenda• Why do we need risk models?• Uncertainty due to data quality• How to score data quality• Example of probabilistic risk model that includes uncertainty
modeling: Aldyl A gas distribution systems• Identify the risk drivers• Make sense of the Causal factors and interactions• How to go about attaching numbers to the model• Material model• Sensitivity of the material model• Reference data• Test data for existing installations• Understanding the data• Models to address uncertainty• Model validation• Prediction• Forensics• Simplified model
• Questions + Discussion at any point during the presentation

33
Why Use Risk Models?
Subject Matter
ExpertiseCausal Modeling
Data Analysis
Constraints – Capital / Mission
Regulations
Data / Field Surveys
Institutional
Knowledge
Historical
Information
Operations Management and
Processes
Balanced
Lifecycle
Management- Risk/Cost
Optimization
- Mission success
Decision and
Policy
Optimization
Engine
4
Data PedigreePedigree LevelsThe definitions and pedigree levels below are a generalization of the ASCE standard on quality to fit with the natural gas system asset and system classes. They were reconciled with the definitions of traceable, verifiable, and complete from advisory bulletins (ADB) and Notice of Proposed Rulemaking from DOT/PHMSA. The use of “reliable” by DOT/PHMSA is addressed in the Record Integrity definitions .
5
Record Integrity
Record Integrity CharacteristicsWe have combined and taken a subset of information characteristics from GARP and ISO to develop four characteristics of Integrity: Authenticity, Compliance, Transparency, and Reliability. For each of these four characteristics one can establish one of five levels of agreement that a data/information record value has with the definitions: yes, partial, a conservative default value, no, and no info on data field.
6
Authenticity
Authenticity - information has a reasonable and suitable guarantee of authenticity •records need to be authentic, be what it purports to be•have been created by the agent purported to have created it•have been created or sent when purported•prove that the origin, time of creation or transmission, and content are what they are claimed to be•maintain the authenticity of records over time•hardware, network infrastructure, software, and storage should be monitored for the systems that control the information and records•have an acceptable audit trail•is protected against unauthorized alteration•any authorized annotation, addition or deletion to a record should be explicitly indicated and traceable.

7
Compliance
Compliance - information program complies with laws and other binding authorities, as well as organization's policies•information is entered into records in a manner/form consistent with the law•records must be maintained in the manner and for the time prescribed by law, codes, and authorities
8
Transparency
Transparency - documented in an open and verifiable manner, documents available to all personnel and appropriate interested parties•records documentation should be written and recorded in a manner that clearly sets forth the information recorded•records should be readily available to legitimately interested parties, in particularly to government authorities, auditors, and investigators, as well as the company representatives

9
Reliability
Reliability - a reliable record is one •whose contents can be trusted as full and accurate representation of the facts to which they attest•which can be depended upon in the course of subsequent activities

10
Simple Scoring of Data Quality Attributes
Pedigree Level Score
A 15
B or Default 10
C 5
D 3
No Info on Data
Field1
Score
Integrity Agreement
Authenticity Compliance Transparency Reliability
Yes 15 15 15 15
Partial 10 10 10 10
Default Value 5 5 5 5
No 3 3 3 3
No Info on Data
Field1 1 1 1
Component Score / Level Roll-Ups
Integrity
Authenticity 10
12.5Compliance 15
Transparency 15
Reliability 10
Pedigree 10 10.0
Weighted Score75% Pedigree + 25% Integrity
10.6
11
Data Quality and Uncertainty
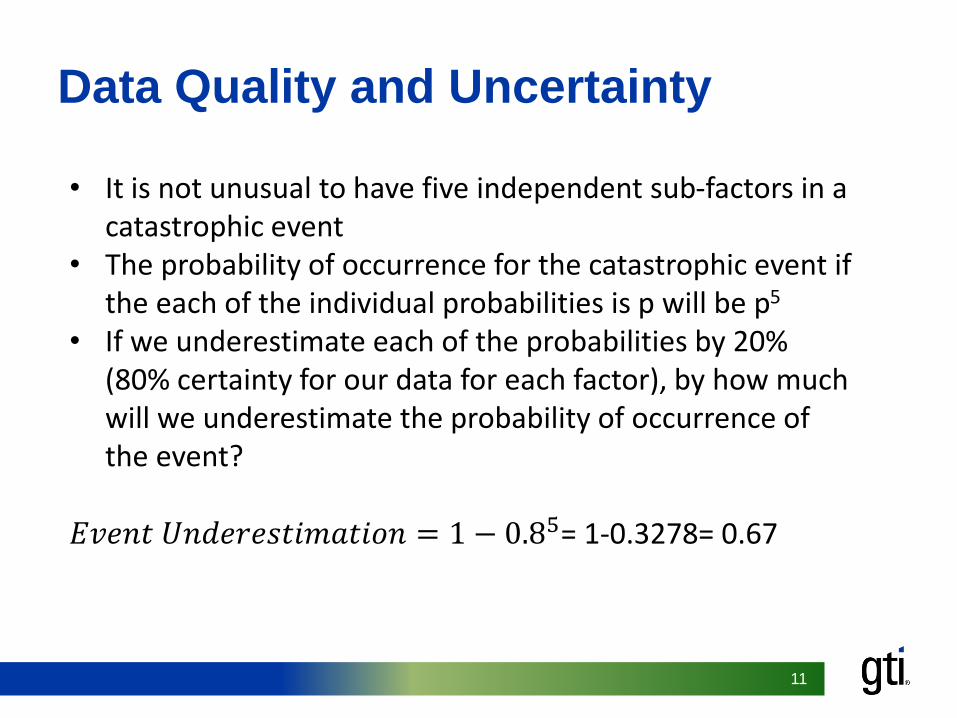
• It is not unusual to have five independent sub-factors in a catastrophic event
• The probability of occurrence for the catastrophic event if the each of the individual probabilities is p will be p5
• If we underestimate each of the probabilities by 20% (80% certainty for our data for each factor), by how much will we underestimate the probability of occurrence of the event?
𝐸𝑣𝑒𝑛𝑡 𝑈𝑛𝑑𝑒𝑟𝑒𝑠𝑡𝑖𝑚𝑎𝑡𝑖𝑜𝑛 = 1 − 0.85= 1-0.3278= 0.67

12
Uncertainty Based Data Quality Score Suggestion
Number of sub-Factors 5
sub-Factor Underestimation Event Underestimation Event Underestimation Complement Revised Score for Data Quality
0% 0% 1.0000 10000
5% 23% 0.7738 7738
10% 41% 0.5905 5905
15% 56% 0.4437 4437
20% 67% 0.3277 3277
25% 76% 0.2373 2373
30% 83% 0.1681 1681
35% 88% 0.1160 1161
40% 92% 0.0778 778
45% 95% 0.0503 504
50% 97% 0.0313 313
55% 98% 0.0185 185
60% 99% 0.0102 103
65% 99% 0.0053 53
70% 100% 0.0024 25
75% 100% 0.0010 10
80% 100% 0.0003 4
85% 100% 0.0001 1
90% 100% 0.0000 1
95% 100% 0.0000 1
100% 100% 0.0000 1
13
What have we Touched on for Data Quality?
• Propagation of uncertainty• Non-linear impact for ignorance
1414
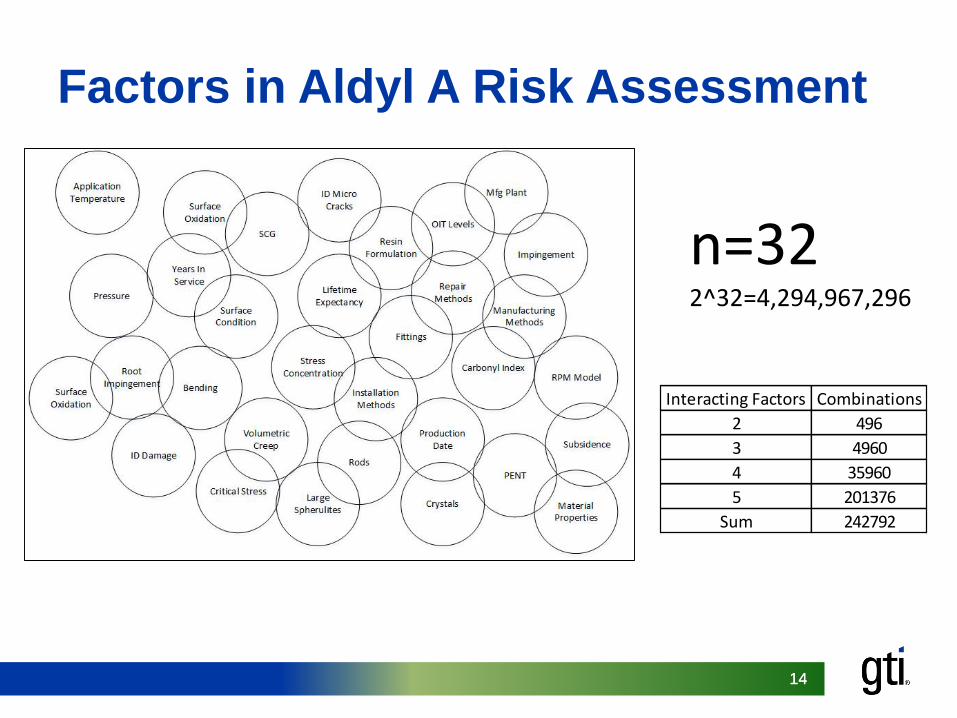
Factors in Aldyl A Risk Assessment
Interacting Factors Combinations
2 496
3 4960
4 35960
5 201376
Sum 242792
n=322^32=4,294,967,296

1515
Semantics, Ontologies, Graphs (From
Wikipedia)
Semantics (from Ancient Greek: σημαντικός sēmantikós, "significant")[1][2] is the study of meaning. It focuses on the relation between signifiers, like words, phrases, signs, and symbols, and what they stand for, their denotation
The term ontology has its origin in philosophyand has been applied in many different ways. The word element onto- comes from the Greekὤν, ὄντος, ("being", "that which is"), present participle of the verb εἰμί ("be"). The core meaning within computer science is a model for describing the world that consists of a set of types, properties, and relationship types. There is also generally an expectation that the features of the model in an ontology should closely resemble the real world (related to the object).[3]
1616
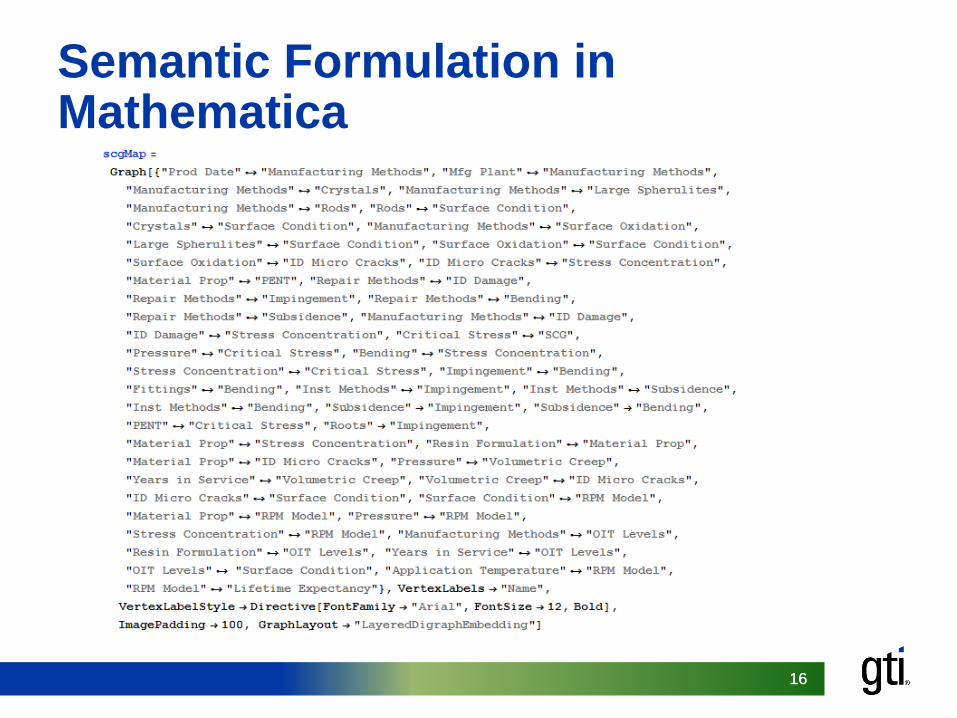
Semantic Formulation in Mathematica
1717
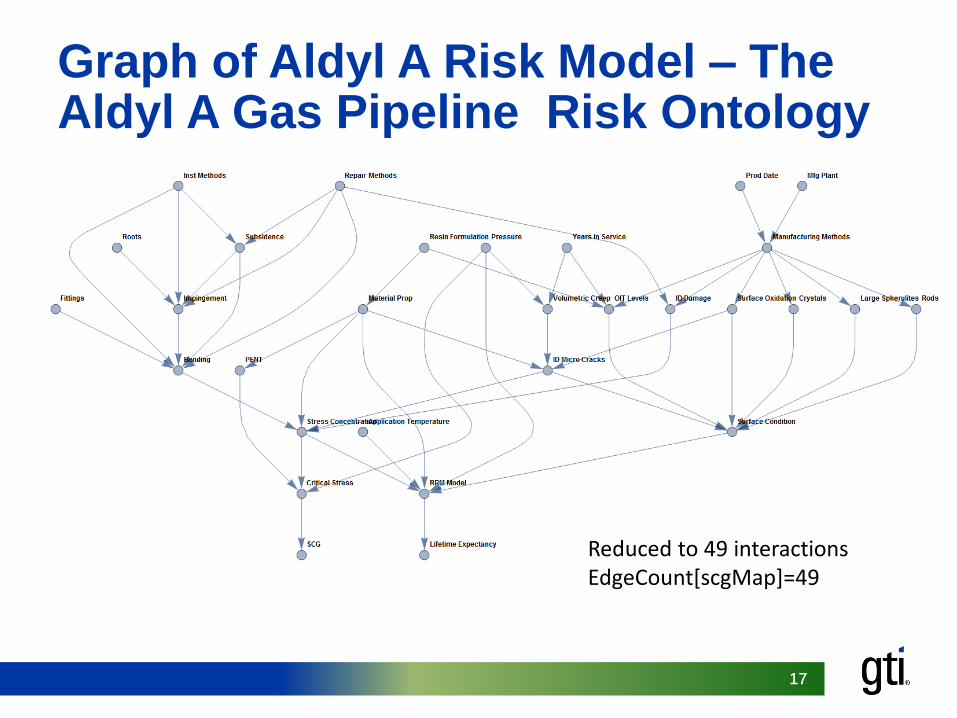
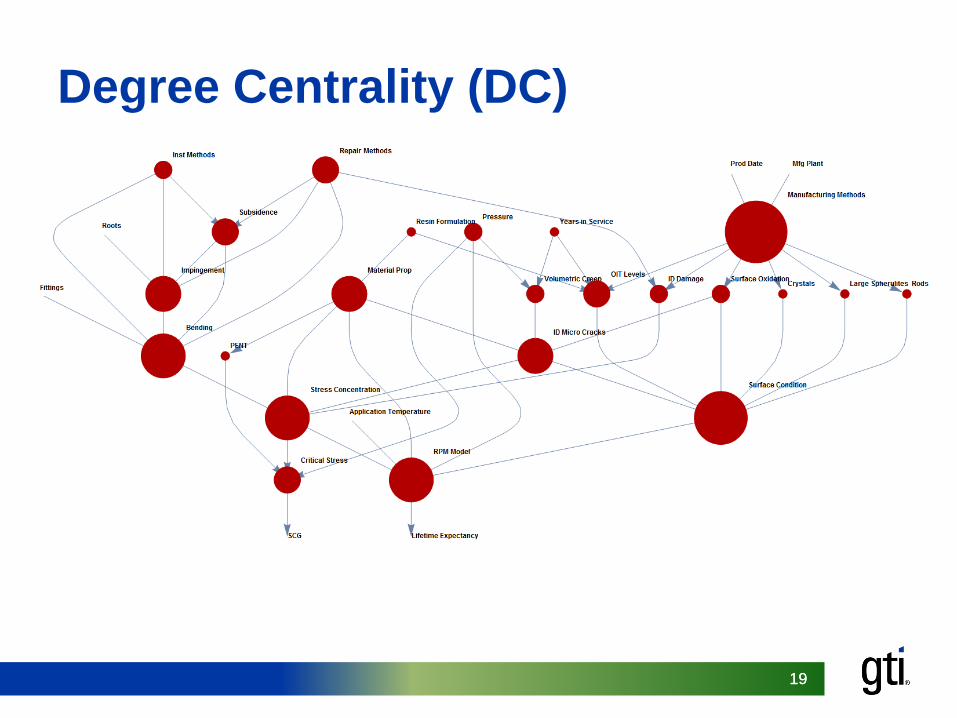
Graph of Aldyl A Risk Model – The Aldyl A Gas Pipeline Risk Ontology
Reduced to 49 interactionsEdgeCount[scgMap]=49
1818
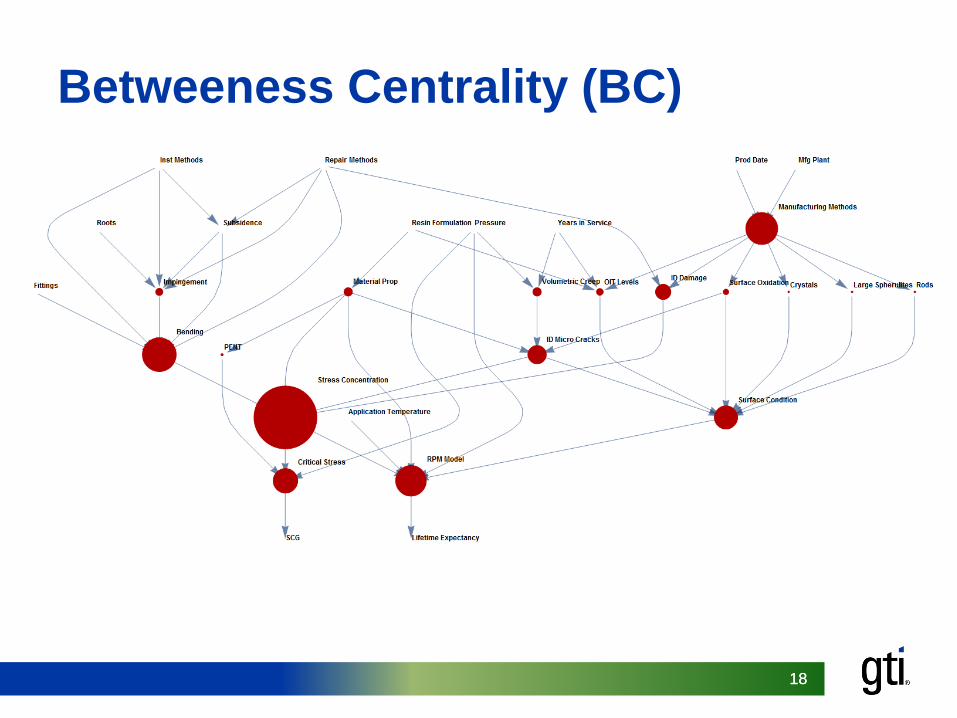
Betweeness Centrality (BC)
1919
Degree Centrality (DC)

2020
Composite Ranking (DC*BC)
2121
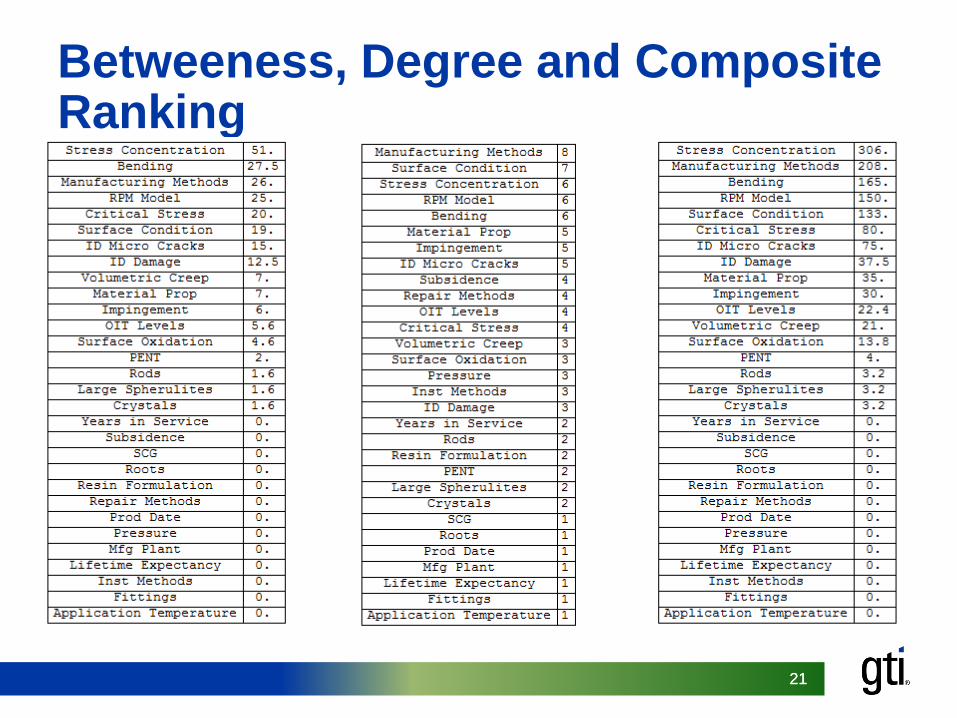
Betweeness, Degree and Composite Ranking

22
What have we learned about a semantic/ontological approach?
• Very good at capturing subject matter expertise• Lends itself to a causal description• Provides a baseline Bayesian Network• We see how information flows• Can help identify critical variables/features• We should be able see how uncertainty
propagates through the system once we insert models to calculate conditional probabilities and attach numbers
2323
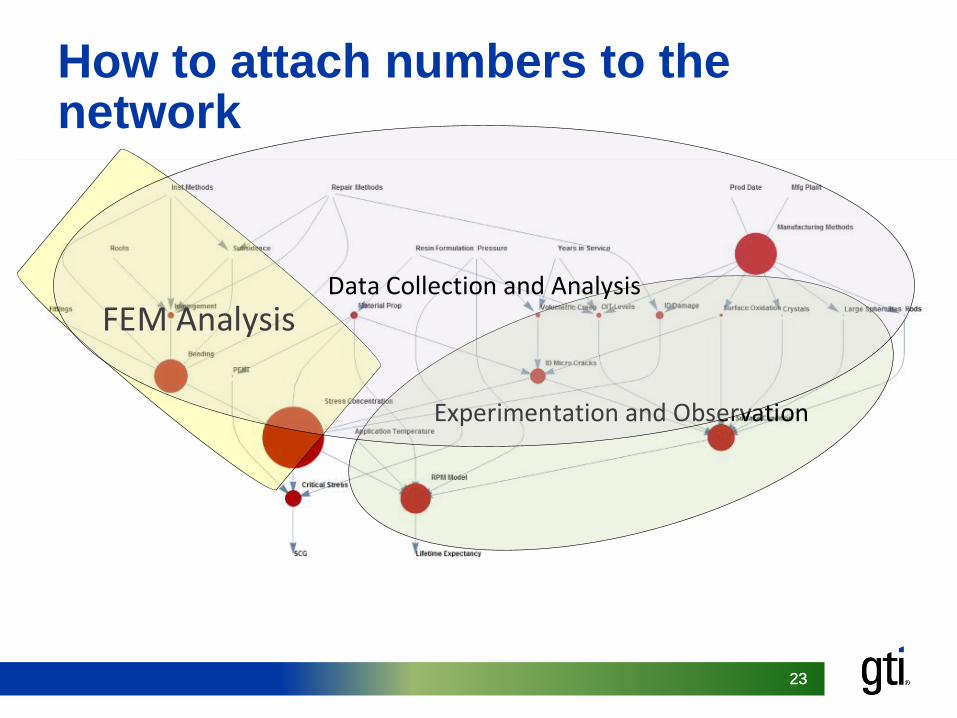
How to attach numbers to the network
Data Collection and Analysis
24
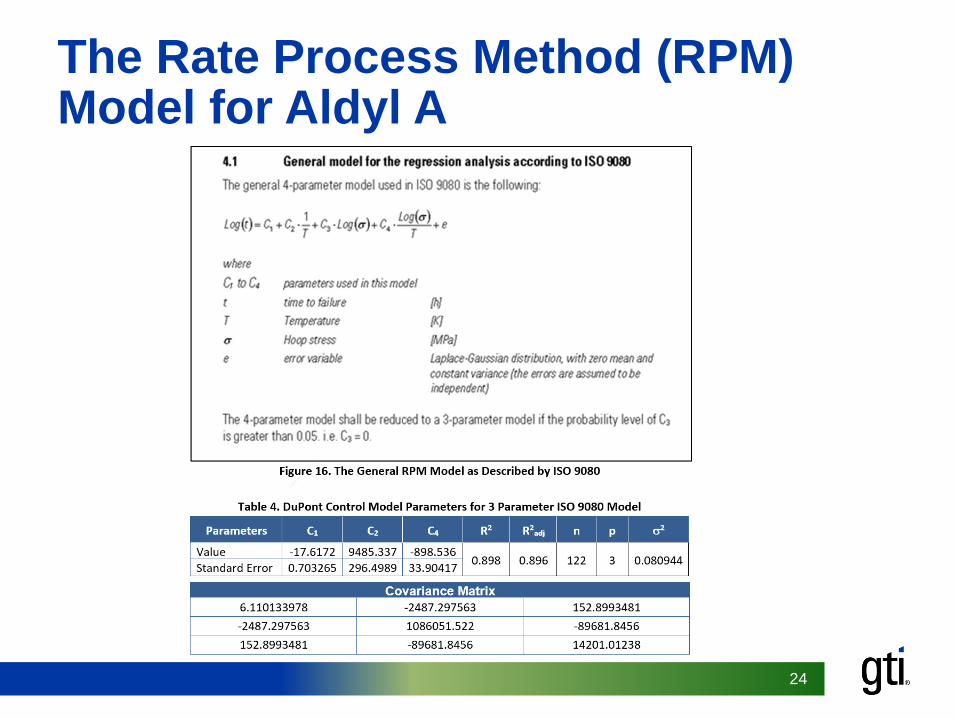
The Rate Process Method (RPM) Model for Aldyl A

25
RPM Model Sensitivity (Temperature, Stress)
26
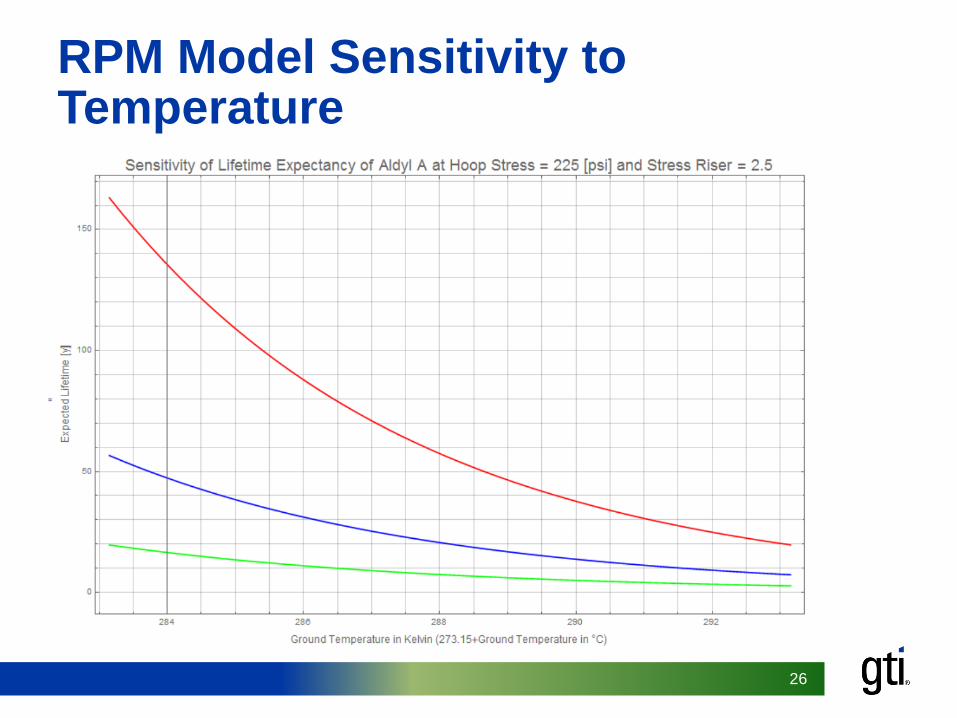
RPM Model Sensitivity to Temperature
27
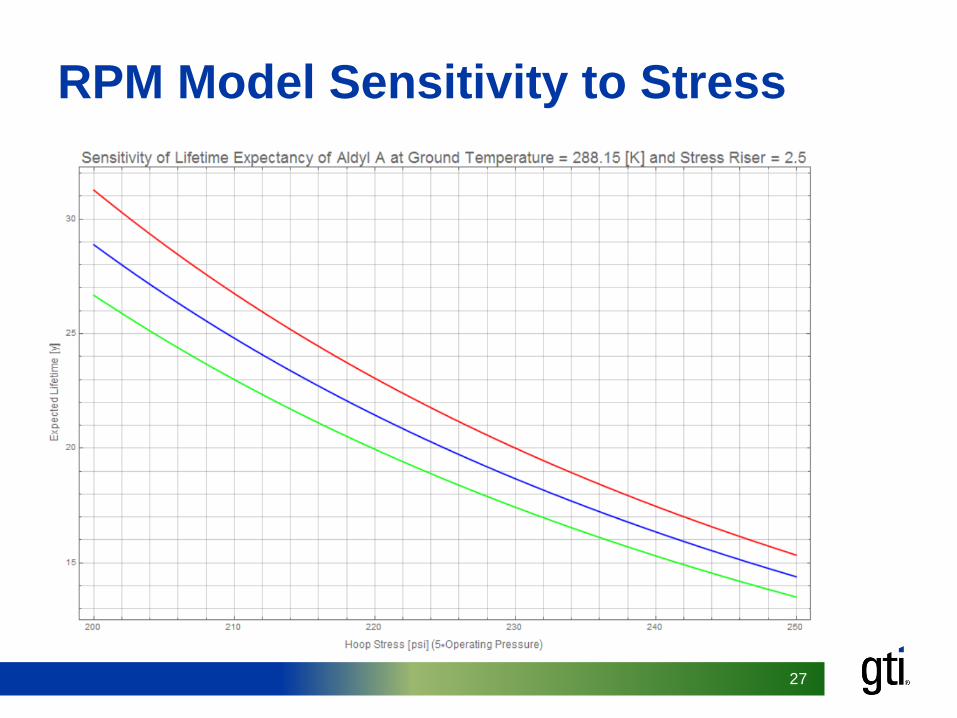
RPM Model Sensitivity to Stress
28
What have we seen so far?
• We understand that application temperature is the dominant factor
• Stress is critical and has a non-linear effect
29
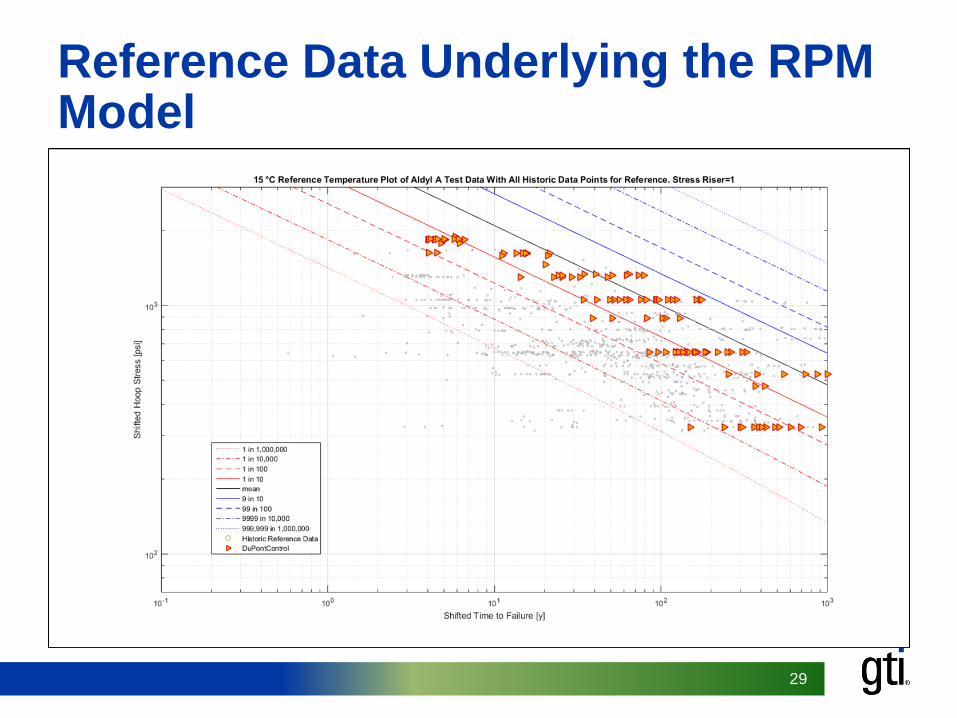
Reference Data Underlying the RPM Model
30
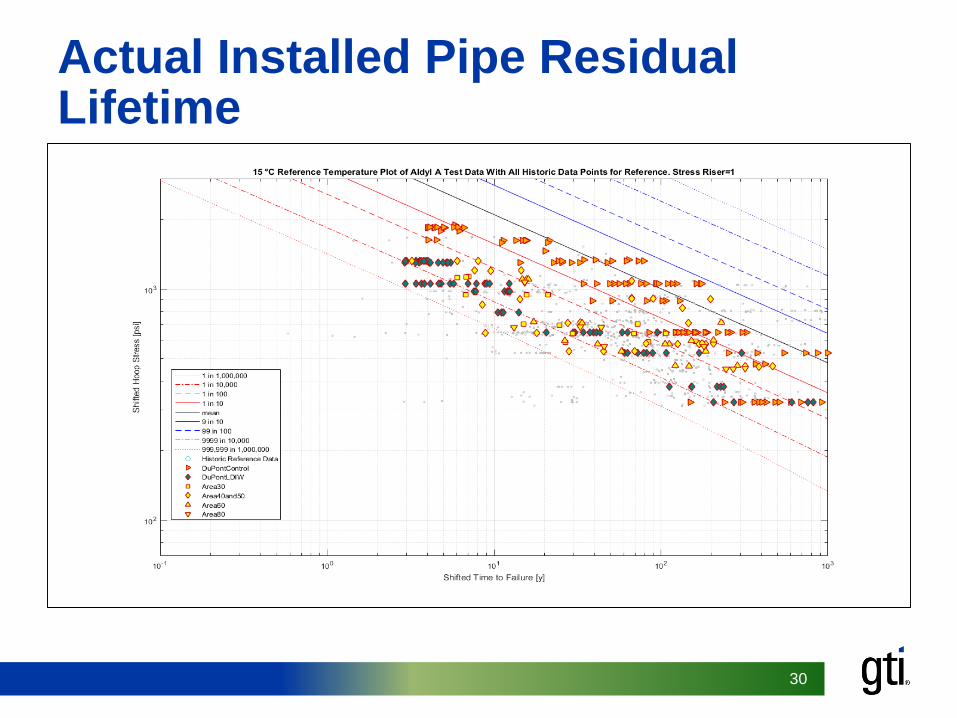
Actual Installed Pipe Residual Lifetime

31
What do we understand about the data?
• There is a large amount of uncertainty:• 250 fold variance relative to model mean at a
given stress level• Need to explain the variance and try to reduce
uncertainty gor an input stress
32
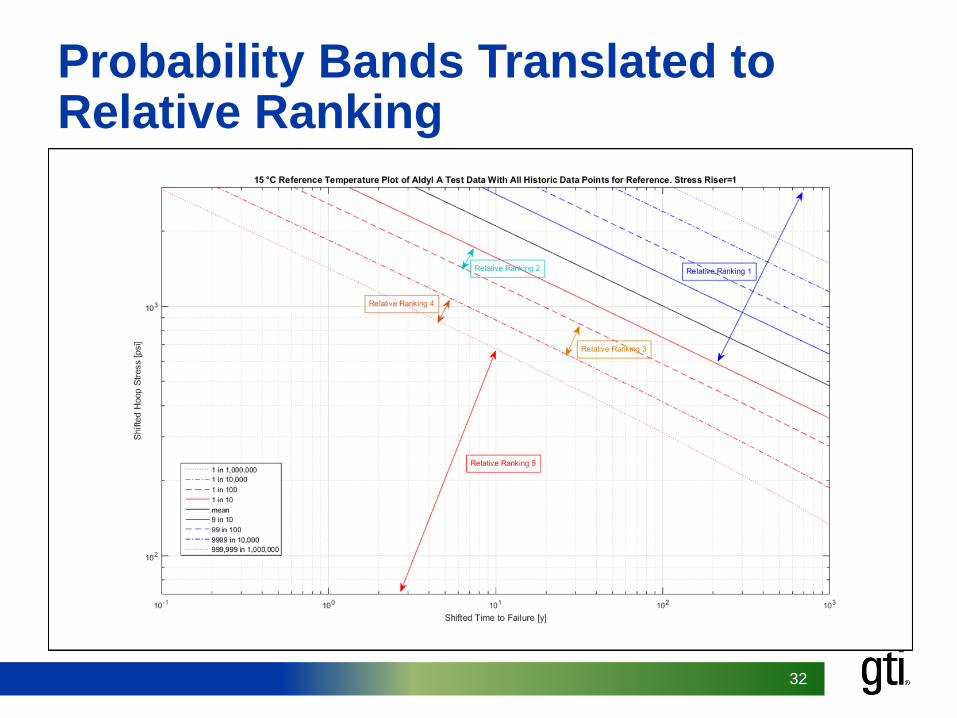
Probability Bands Translated to Relative Ranking

33
Probability Bands Used to Reduce Uncertainty of Prediction
Uncertainty for all test data 250:1 at ~500 psi hoop stress relative to mean model prediction
34
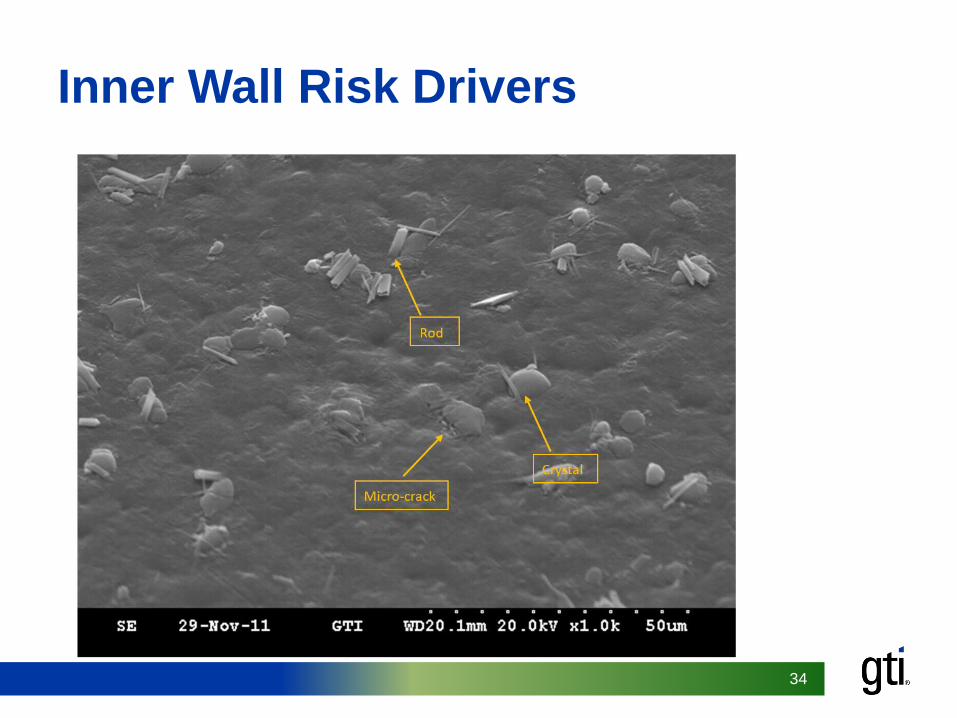
Inner Wall Risk Drivers

35
Inner Wall Dimples
36
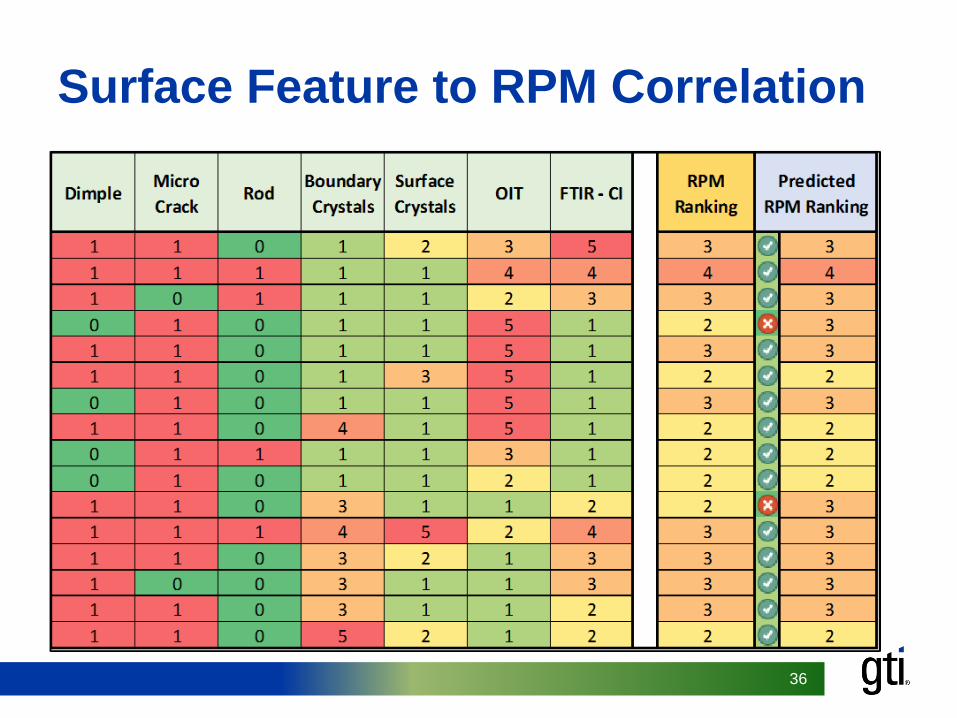
Surface Feature to RPM Correlation
37
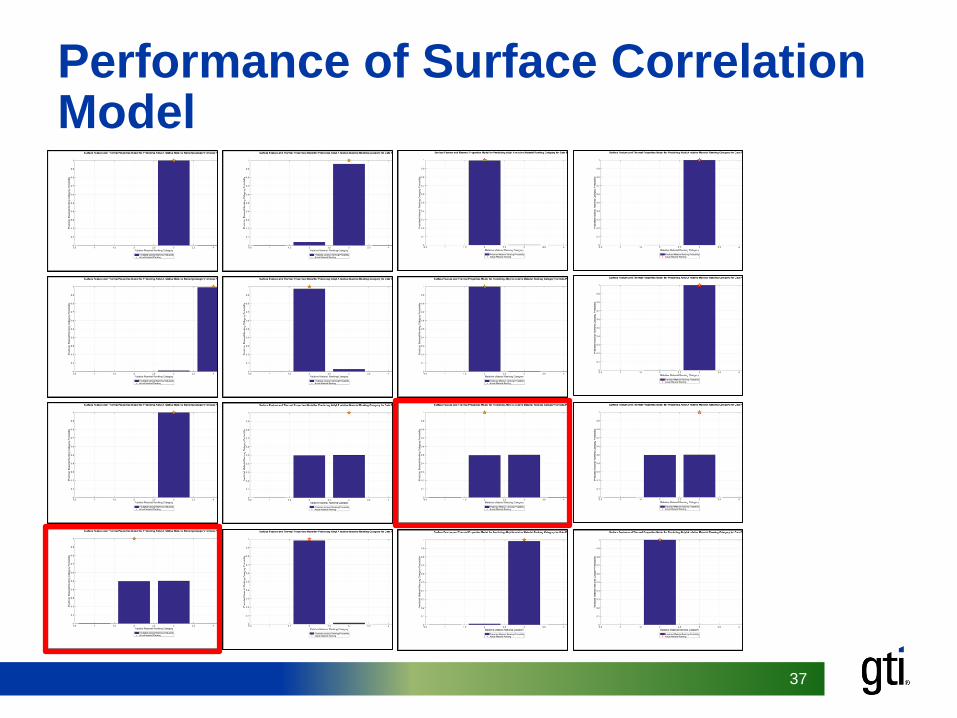
Performance of Surface Correlation Model
38
What have we learned so far?
• We have a good model for linking surface features to long term performance
• Need to explore effect of stress risers
39
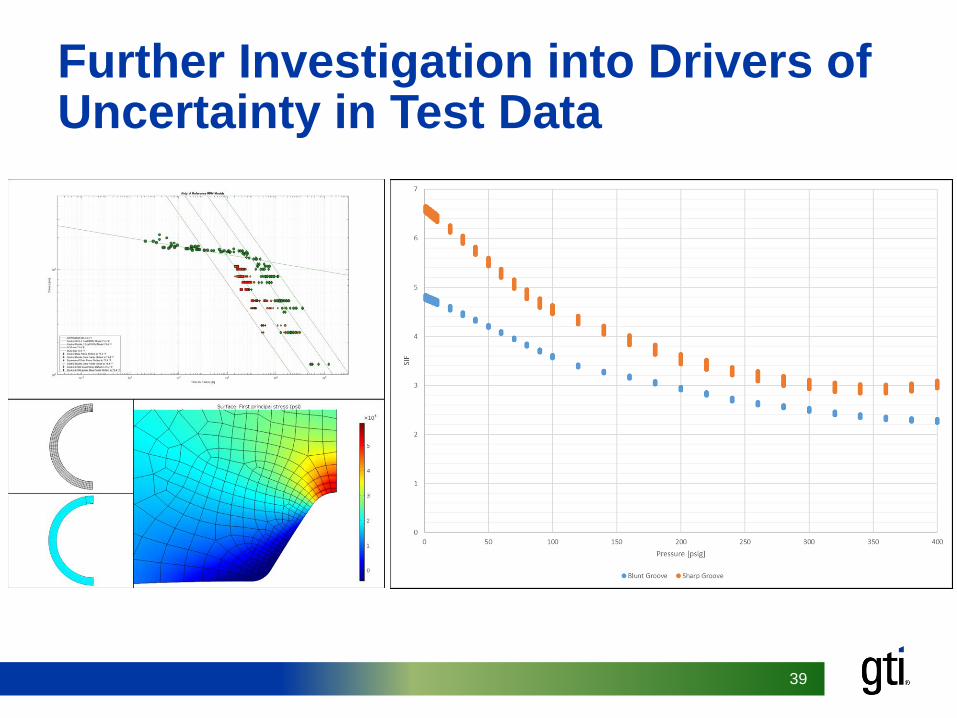
Further Investigation into Drivers of Uncertainty in Test Data

40
Stress Intensification Factors (SIF) Inferred from Ductile Failure Data

41
Inferred SIF for DuPont Data Sets
42
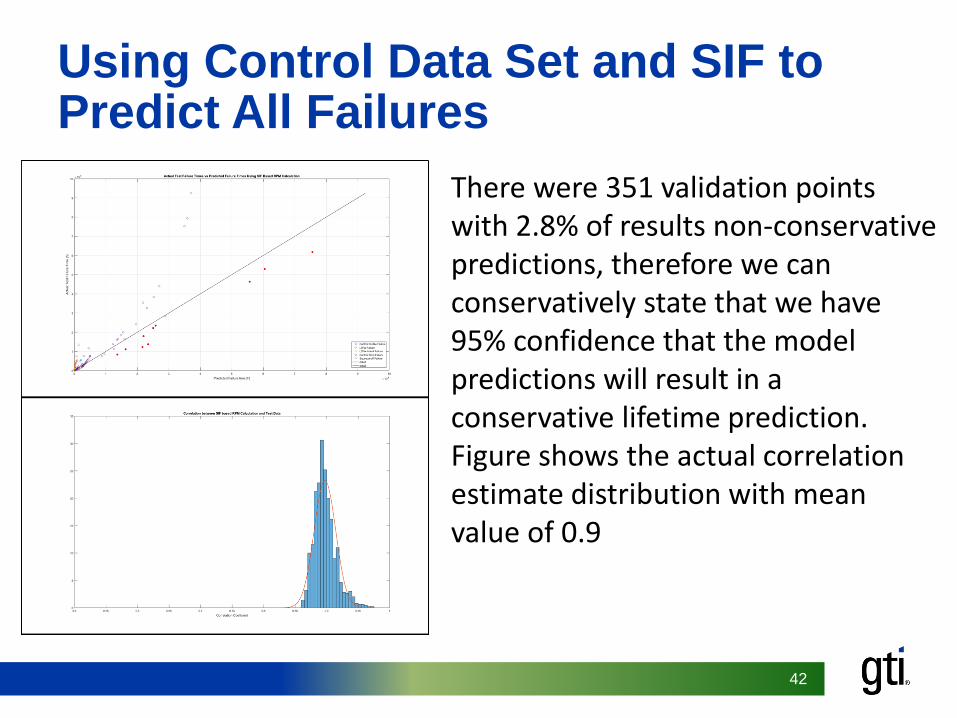
Using Control Data Set and SIF to Predict All Failures
There were 351 validation points with 2.8% of results non-conservative predictions, therefore we can conservatively state that we have 95% confidence that the model predictions will result in a conservative lifetime prediction. Figure shows the actual correlation estimate distribution with mean value of 0.9
43
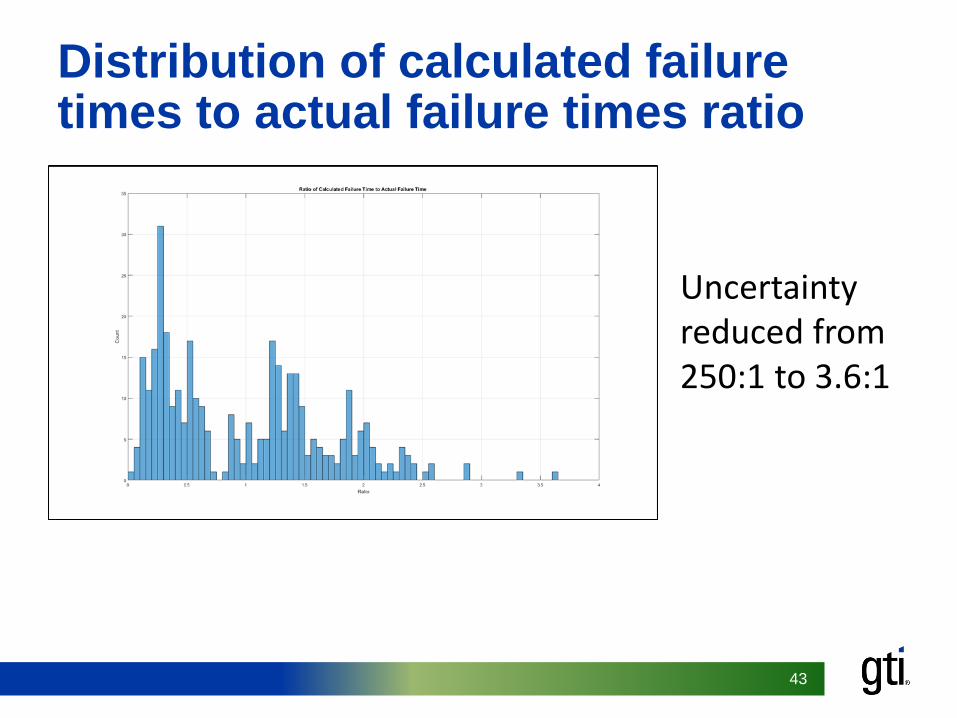
Distribution of calculated failure times to actual failure times ratio
Uncertainty reduced from 250:1 to 3.6:1
44
What have we added to our understanding
of uncertainty in the models
• We have found plausible connections between Stress Intensification Factors (SIF) and the large variability in test data at a nominal hoop stress
• We have reduced the uncertainty by two orders of magnitude
• Ready to refine the Bayesian Network
45
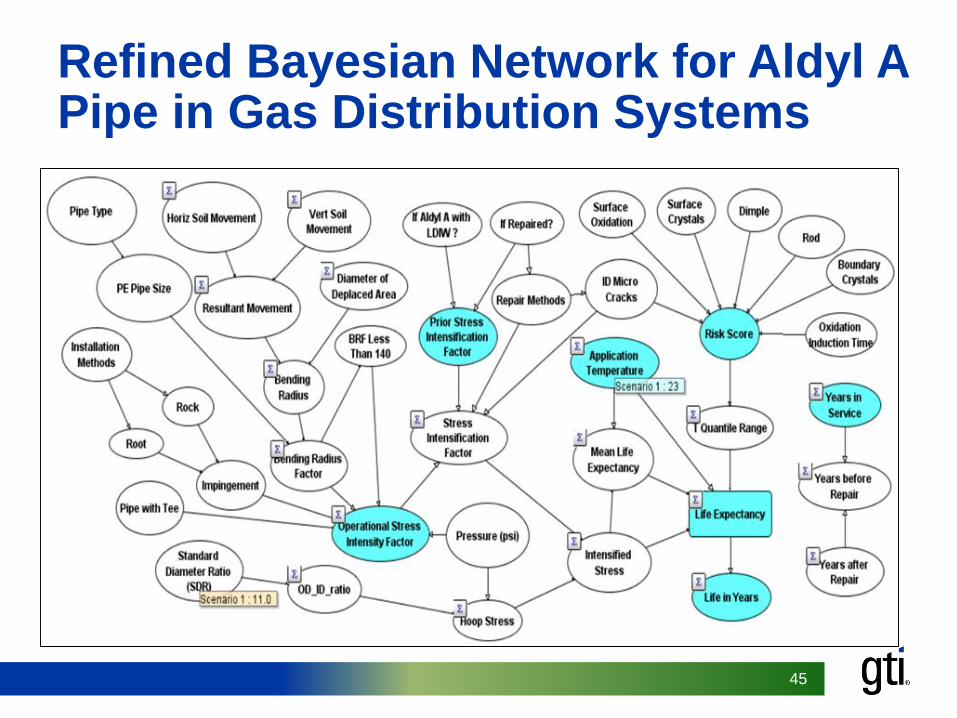
Refined Bayesian Network for Aldyl A Pipe in Gas Distribution Systems
46
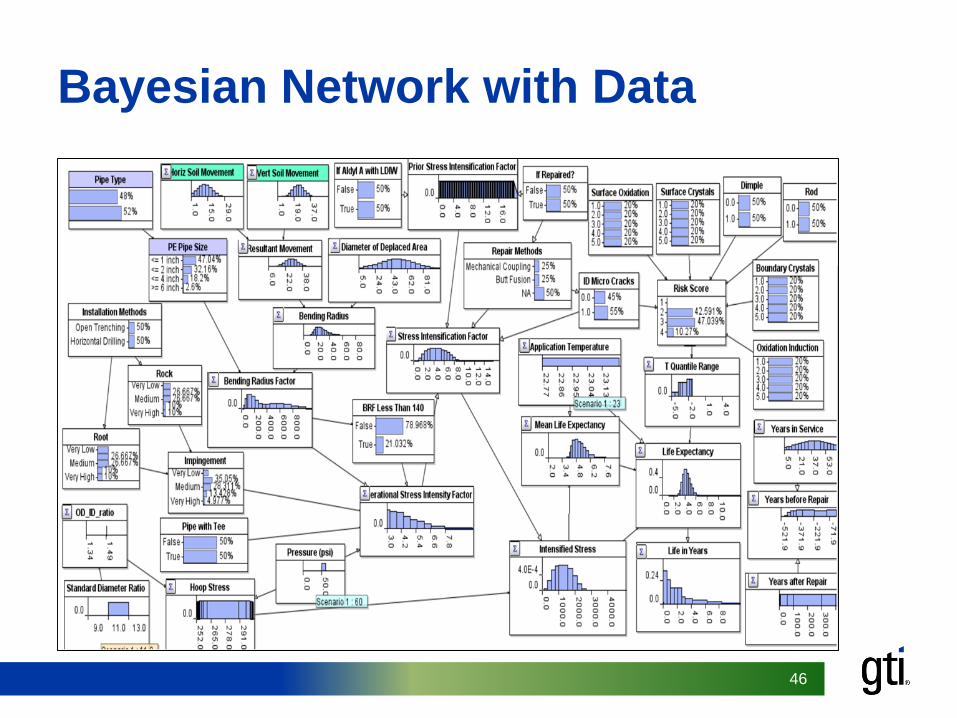
Bayesian Network with Data
47
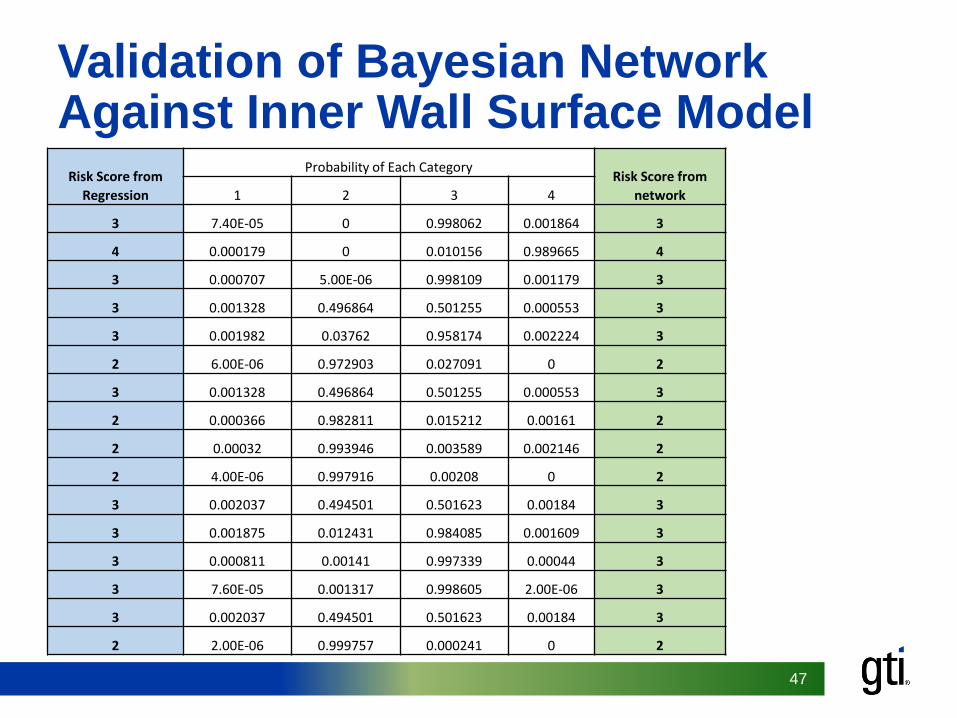
Validation of Bayesian Network Against Inner Wall Surface Model
Risk Score from
Regression
Probability of Each CategoryRisk Score from
network1 2 3 4
3 7.40E-05 0 0.998062 0.001864 3
4 0.000179 0 0.010156 0.989665 4
3 0.000707 5.00E-06 0.998109 0.001179 3
3 0.001328 0.496864 0.501255 0.000553 3
3 0.001982 0.03762 0.958174 0.002224 3
2 6.00E-06 0.972903 0.027091 0 2
3 0.001328 0.496864 0.501255 0.000553 3
2 0.000366 0.982811 0.015212 0.00161 2
2 0.00032 0.993946 0.003589 0.002146 2
2 4.00E-06 0.997916 0.00208 0 2
3 0.002037 0.494501 0.501623 0.00184 3
3 0.001875 0.012431 0.984085 0.001609 3
3 0.000811 0.00141 0.997339 0.00044 3
3 7.60E-05 0.001317 0.998605 2.00E-06 3
3 0.002037 0.494501 0.501623 0.00184 3
2 2.00E-06 0.999757 0.000241 0 2
48
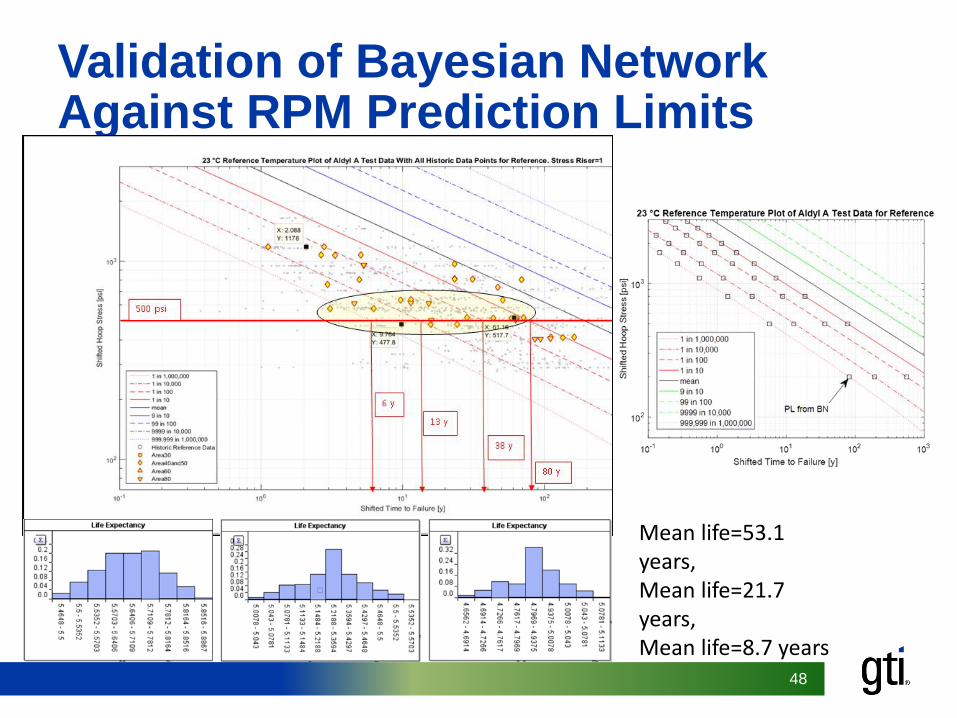
Validation of Bayesian Network Against RPM Prediction Limits
Mean life=53.1 years, Mean life=21.7 years, Mean life=8.7 years
49
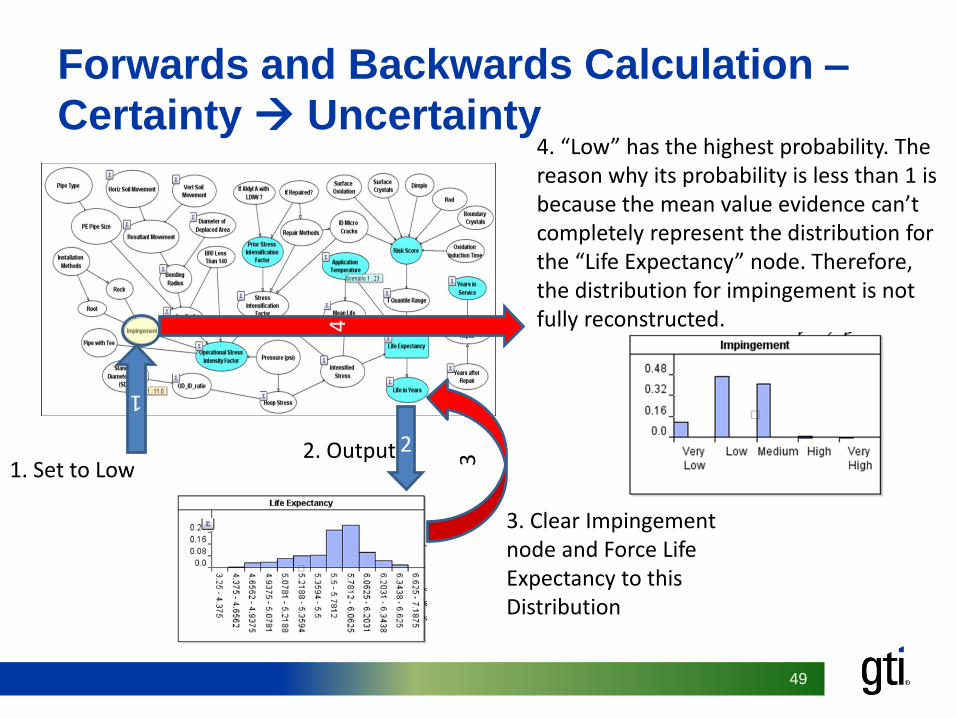
Forwards and Backwards Calculation –
Certainty Uncertainty
1
1. Set to Low22. Output 3
3. Clear Impingement node and Force Life Expectancy to this Distribution
4
4. “Low” has the highest probability. The reason why its probability is less than 1 is because the mean value evidence can’t completely represent the distribution for the “Life Expectancy” node. Therefore, the distribution for impingement is not fully reconstructed.

50
What have we seen n the refined Bayesian Network
• Good description of Aldyl A performance• Forward prediction of next state• Backwards forensic diagnosis capabilities• Can we simplify the model?

51
Simplified Model for Aldyl A
52
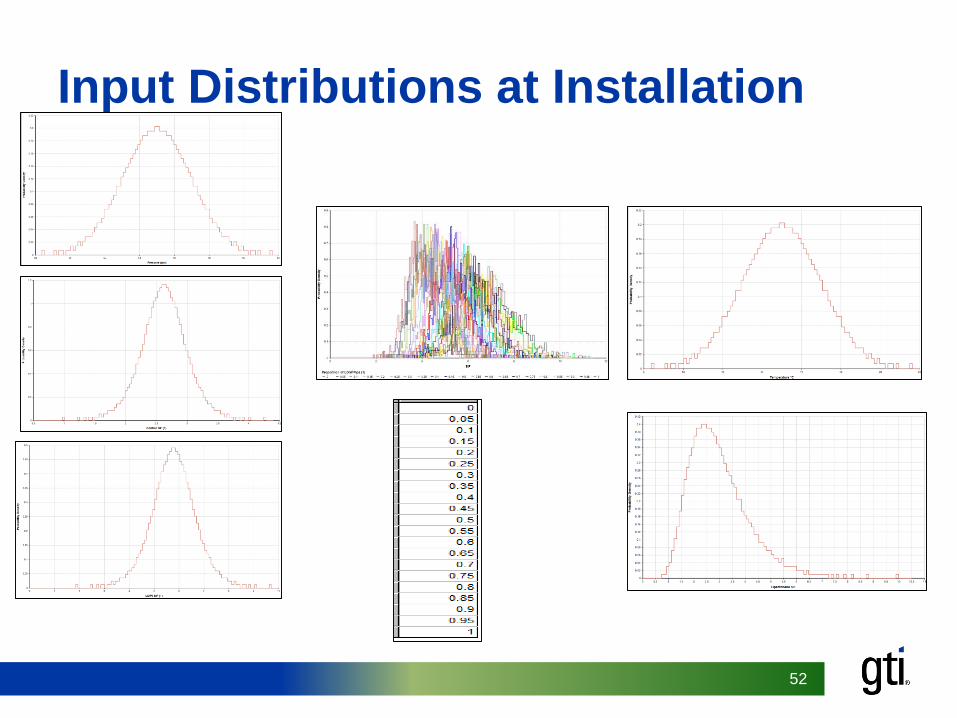
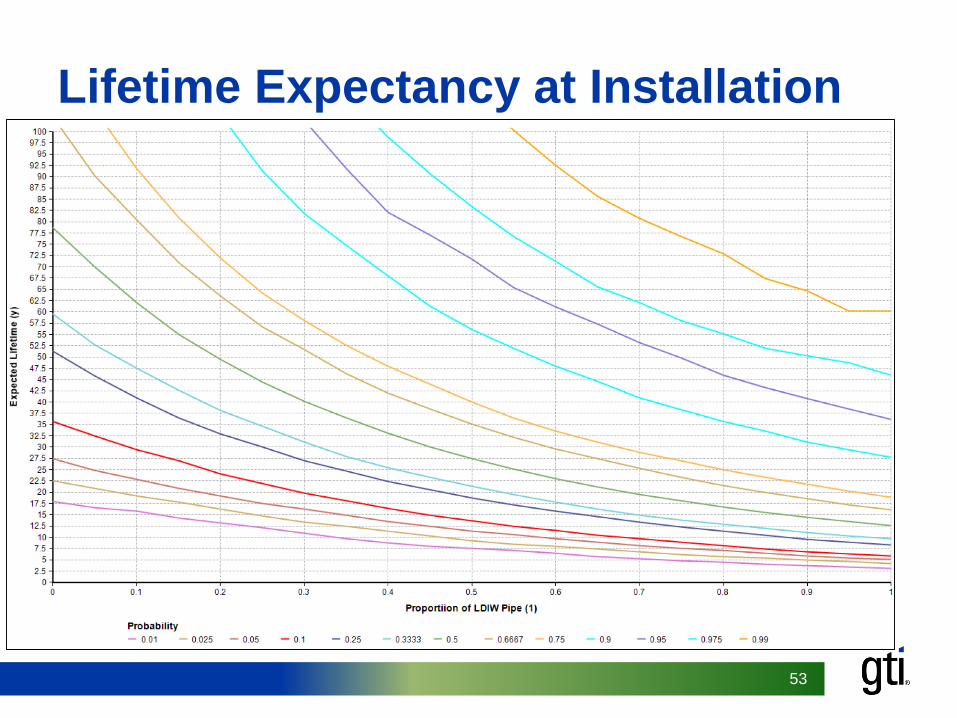
Input Distributions at Installation
53
Lifetime Expectancy at Installation

54
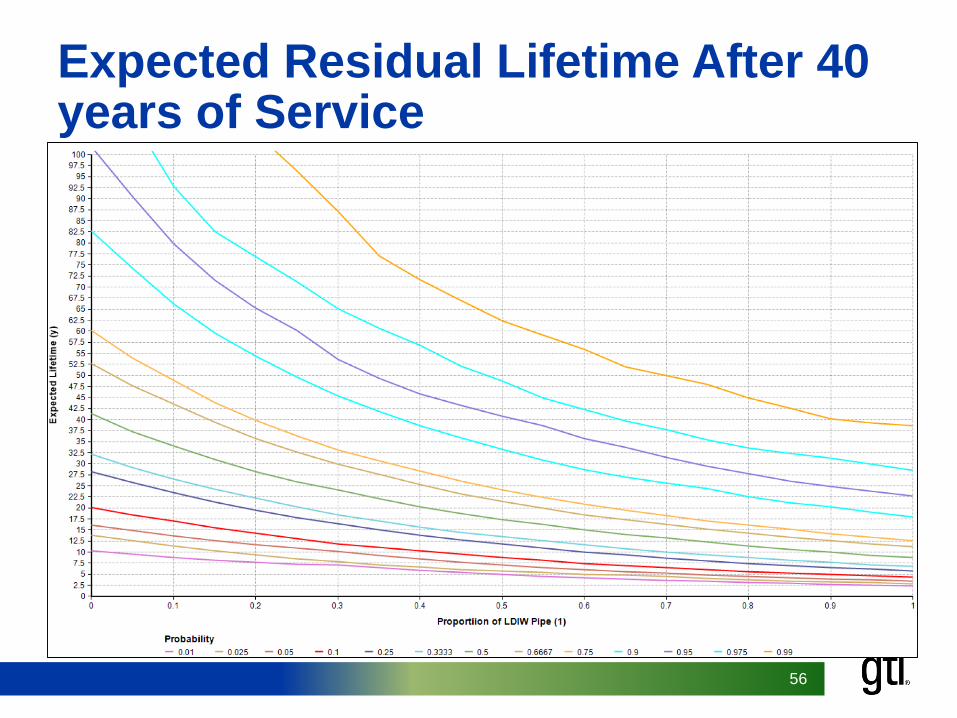
Operational SIF Reflecting 40 years of Service

55
So far so good
• Good description of variability in as installed condition
• How can we capture years in service?
56
Expected Residual Lifetime After 40 years of Service
57
Final comment on simplified model
• The equivalent SIF for years in service does a reasonable job in capturing degradation over time.

58
Questions?