Embed Size (px)
Citation preview
Honeybee R&D
A beekeepers’ guide to understanding control measures
for European Foulbrood
by Russell Goodman, Ben McKee and Peter Kaczynski
Publication No 04/091 RIRDC Project No DAV-157A

A beekeepers’ guide to
Understanding Control Measures for European Foulbrood
A report for the Rural Industries Research and Development Corporation by Russell Goodman Ben McKee Peter Kaczynski
May 2004 RIRDC Publication No 04/091 RIRDC Project No DAV 157A
ii
© 2004 Rural Industries Research and Development Corporation. All rights reserved. ISBN 1 74151 000 7 ISSN 1440-6845 A beekeepers’ guide to Understanding Control Measures for European Foulbrood Publication No. 04/091 Project No. DAV 157A The views expressed and the conclusions reached in this publication are those of the author and not necessarily those of persons consulted. RIRDC shall not be responsible in any way whatsoever to any person who relies in whole or in part on the contents of this report. Disclaimer: The advice provided in this publication is intended as a source of information only. Always read the label before using any of the products mentioned. The State of Victoria and its employees do not guarantee that the publication is without flaw of any kind or is wholly appropriate for your particular purposes and therefore disclaims all liability for any error, loss or other consequence which may arise from you relying on any information in this publication. This publication is copyright. However, RIRDC encourages wide dissemination of its research, providing the Corporation is clearly acknowledged. For any other enquiries concerning reproduction, contact the Publications Manager on phone 02 6272 3186. Researcher Contact Details Russell Goodman Primary Industries Research Victoria Department of Primary Industries Private Bag 15 Ferntree Gully Delivery Centre Victoria 3156) Phone: (03) 9210 9222 Fax: (03) 9800 3521 Email: [email protected]
In submitting this report, the researcher has agreed to RIRDC publishing this material in its edited form. RIRDC Contact Details Rural Industries Research and Development Corporation Level 1, AMA House 42 Macquarie Street BARTON ACT 2600 PO Box 4776 KINGSTON ACT 2604 Phone: 02 6272 4539 Fax: 02 6272 5877 Email: [email protected]. Website: http://www.rirdc.gov.au Published in May 2004 Printed on environmentally friendly paper by Union Offset Printers, Canberra
iii
Foreword In 2002, RIRDC produced a five year research and development plan for the Honeybee Program. This plan was formulated in consultation with industry to provide the research direction necessary for the current best practice and preparation for future development in the honey industry. The use of the antibiotic oxytetracycline hydrochloride (OTC) for the control of the honey bee brood disease, European foulbrood, occurs in all Australian states except Western Australia. The potential for oxytetracycline residues to occur in honey poses a serious threat to the future marketability of domestic and export honey. This publication is an abridged edition of the comprehensive companion RIRDC report entitled ‘European Foulbrood – investigating control measures’. This abridged edition presents outcomes of investigations concerning the application of OTC to honey bee colonies, degradation of OTC in honey extracted from treated hives and efficacy of lower doses of OTC to control European foulbrood. Studies on Melissococcus pluton, the causal organism of the disease are also reported. This project was funded from honeybee industry revenue which is matched by funds provided by the Australian Government. This report, a new addition to RIRDC’s diverse range of over 1000 research publications, forms part of our Honeybee R&D program, which aims to contribute to the productivity and profitability of the Australian beekeeping industry. Most of our publications are available for viewing, downloading or purchasing online through our website:
• downloads at www.rirdc.gov.au/reports/Index.htm • purchases at www.rirdc.gov.au/eshop
Simon Hearn Managing Director Rural Industries Research and Development Corporation
iv
Acknowledgements The project was financially supported by the Rural Industries Research and Development Corporation (RIRDC), Department of Primary Industries and the National Residue Survey (NRS) of Agriculture Fisheries and Forestry Australia. We thank Dr Heloisa Mariath, NRS; Phil Reeves, Australian Pesticides and Veterinary Medicines Authority; Keith McIlvride, Chairman, RIRDC Honeybee R & D Committee; Graham Kleinschmidt and Dr Jeff Davis, former and present RIRDC Honeybee Program Research Managers respectively, for their support. We thank the Australian Honey Bee Industry Council and Federal Council of Australian Apiarists’ Associations for helpful advice. Appreciation is extended to Max Cane, apiarist, Ararat, for apiary sites, honeybee colonies, honey extraction facilities and valuable time, expertise, support and advice throughout the project. We also thank Bob McDonald, apiarist, Castlemaine, who kindly supplied apiary sites, honeybee colonies, and advice for some of the oxytetracycline hydrochloride (OTC) trials. Trevor Richards, Amphitheatre; Dale Richards, Bendigo and Robert Kilpatrick, Joel Joel, provided apiary sites and advice for the management of hives. Apiarists Ian Fenselau, Bendigo; Ken Gell, Maryborough; Ray Hall, Dunolly and Ron Rich, Maryborough loaned hives for Melissococcus pluton and OTC dose response trials. The authors wish to acknowledge the apiarists and honey packing companies who supplied honey for the OTC spiking experiments and hemi-nested polymerase chain reaction (PCR) studies. These included apiarists, Harold Ayton, Tasmania; Ailsa J Collins, Ravenshoe; Margaret Mikits and Richard West, Mareeba and Capilano Honey, Richlands, Queensland. We thank Drs Michael Hornitzky and Steven Djordjevic, senior research scientists, Elizabeth Macarthur Agricultural Institute (EMAI), NSW Agriculture, and Dr Peter Taylor, The University of Melbourne, Parkville, Victoria, for helpful advice throughout the project. We thank Bruce Abaloz and David Paul, Department of Zoology, The University of Melbourne for assistance with histology sections of honey bee larvae. We thank Fiona Cooper, Brendan Rodoni, and Kerry Paice, Research and Development Division, Department of Primary Industries, Knoxfield, for counts of Nosema apis spores in samples of adult honey bees and assistance with PCR and culture assays for detection of Melissococcus pluton respectively. Dr Michael Hornitzky, EMAI, arranged for culture of honey samples for presence of M. pluton. Analyses of honey to determine OTC concentrations were conducted by Hugh Mawhinney, Stephen Were and Warwick Turner, Chemical Residues Laboratory, Animal and Plant Health Service, Queensland Department of Primary Industries; Christian Saywell and Heather Lindsay, State Chemistry Laboratory, Department of Primary Industries. Paul Lawicki and Phil Zeglinski, State Chemistry Laboratory, analysed adult bees and larvae for crude protein and honey for hydroxymethylfurfural content respectively. We thank Drs Stephen Tate, Senior Veterinary Officer; Jenny Turton, Veterinary Officer and John Galvin, Manager, Animal Health Operations, Department of Primary Industries, for prescribing OTC products. We thank Drs Graham Hepworth and Nam-ky Nguyen, former and present biometricians respectively, Department of Primary Industries, Knoxfield. Drs Jane Moran, Jo Luck and Stephen Doughty, Knoxfield, gave helpful comments and suggestions for this manuscript. The large proportion of the work described in this report was conducted by co-author Dr Ben McKee towards his PhD thesis entitled ‘A study of European foulbrood (Melissococcus pluton) in honey bee colonies (Apis mellifera) in Australia’. The thesis was submitted to the School of Agriculture and Food Systems, The University of Melbourne.
v
Contents Foreword ................................................................................................................................................ iii Acknowledgements ................................................................................................................................ iv Executive summary ................................................................................................................................ vi 1. Introduction..................................................................................................................................... 1 2. Oxytetracycline hydrochloride in honey ......................................................................................... 2 3. Oxytetracycline hydrochloride in larvae of treated honey bee colonies ......................................... 7 4. Efficacy of low doses of OTC applied to honey bee colonies to control European
Foulbrood disease ......................................................................................................................... 10 5. Incidence of European Foulbrood in commercially managed honey bee colonies
fed a dietary supplement ............................................................................................................... 12 6. The influence of pH in the honey bee larval gut on Melissococcus pluton................................... 16 7. Detection of Melissococcus pluton in honey bees and their products........................................... 18 8. Laboratory rearing of honey bee larvae for European Foulbrood studies..................................... 20 9. A survey of apiarists’ use of oxytetracycline hydrochloride and management of
European foulbrood....................................................................................................................... 21 10. References ..................................................................................................................................... 35
vi
Executive summary The endemic, bacterial honey bee brood disease, European Foulbrood (EFB) (Melissococcus pluton) can seriously affect honey bee colonies and reduce honey production. The disease is controlled by apiary management practices and when necessary by the antibiotic oxytetracycline hydrochloride (OTC). The extent of OTC residues in honey extracted from hives treated with the antibiotic was determined. Groups of six colonies were treated with one of three OTC products in either sugar syrup or caster sugar at the rate of 1g active ingredient and moved to a honey flow 23 days later. Honey from the supers of the six hives of each treatment group was extracted, sampled and tested for OTC. Residues were detected in honey from all treatment groups at the first extraction but not at a second later extraction. Residues were higher in honey of the sugar syrup treatments (mean 0.34 mg/kg) than the caster sugar treatments (mean 0.065 mg/kg). The rate of degradation of OTC in honey was determined by storing honey of the six treatment groups of the first extraction at ambient temperature and at 22ºC. Residues were detected in samples of honey of all six treatment groups stored at ambient temperature at twelve months from the date of OTC application to the hives. There was greater degradation of OTC in the same six lines of honey stored at 22ºC. In another degradation study, residues were still present in OTC contaminated honey stored at 25ºC 18 months from the time of application to honey bee colonies. OTC was not detected at 15.5, 8.5 and 3.5 months for the same honey stored at 30ºC, 35ºC and 40ºC respectively. Experiments were conducted to determine the concentration of OTC in larvae sampled from honey bee colonies treated with various doses of the antibiotic in caster sugar. On each of six days after treatment of colonies, mean concentrations of OTC in larvae were significantly greater in larvae of the 1.0 g OTC double-storey colonies than of the 0.5 g OTC double-storey colonies, usually by a factor of 2 to 3. In another experiment, 0.5 g OTC dissolved in 200 mL of distilled water was applied to two-storey colonies. This dose gave an equal or higher level of OTC on the first two days after treatment when compared with the same dose applied in caster sugar to two-storey colonies. All these doses of OTC in cater sugar or water, delivered sufficient antibiotic to exceed the 1-2 µg/mL minimum inhibitory concentration of OTC to Melissococcus pluton by a minimum of 4 times on the day immediately after treatment. However, because the results of the three above experiments were based on assay of whole honey bee larvae rather than larval guts where M. pluton multiplies and causes infection, it is suggested that further laboratory and field work be conducted to confirm their validity relating to the concentration of OTC in the honey bee larval guts. Field trials were conducted to determine effect of doses lower than those stipulated on OTC product labels on EFB. Single-storey colonies with advanced EFB were treated with a standard 0.5 g dose or a reduced dose of 0.3 g or 0.4 g active ingredient. All doses resulted in significantly less diseased larvae than the controls at 12 and 22 day post-treatment inspections, but not at the 41 day post-treatment inspection. No dose enabled all colonies to totally clean up the disease. It was concluded that until the efficacy of low doses of OTC are further investigated using laboratory reared honey bee larvae and subsequent field trials, the current 0.5 g and 1.0 g doses for single and double-storey colonies respectively were appropriate for control of EFB in Australia. During 2000 and 2001, commercially managed honey bee colonies were fed either 1.0g OTC, protein dietary supplement or left as untreated controls to determine their effect on the incidence of EFB. The application of OTC resulted in total protection against EFB for these colonies in 2000 and for 12 of 13 treated colonies in 2001. Over all the observations during 2001, the mean incidence of EFB in colonies fed protein supplement was 9% lower than the controls, but this result was not statistically significant.
vii
The mean number of combs of adult bees and brood in colonies of the three treatment groups did not differ significantly at any of the eleven observation dates over the two years of the trial. This suggests that regardless of antibiotic treatment or supplementary feeding, other factors such as nectar and pollen resources may have influenced the number of combs of brood and adult bees. There was a significant statistical relationship between the number of days with rain per month and incidence of EFB in colonies fed supplement. There was no significant statistical difference in spring honey production between the three treatment groups. There was no significant difference in the mean crude protein of adult bees sampled from the 3 treatments at the completion of the trial in 2001. Honey bee larvae, approximately 4-5 days old, were sampled from randomly selected colonies at five commercially managed apiaries in central and western Victoria. The mean pH varied significantly between apiary locations (range 6.258 to 6.506). This may be a result of bees foraging on different pollen and nectar plants at these locations. The pH of larval guts sampled from colonies approximately 100 km apart but foraging on the same plant species was similar at 6.277 and 6.258 respectively. Laboratory studies also indicated that honey bee larvae have a capacity to buffer their diet and consequently may not be adversely affected by changes in pH of larval food as previously suggested by other reports. An existing hemi-nested polymerase chain reaction (PCR) assay was modified to obtain increased sensitivity for the detection of M. pluton in bees and their products. The modified PCR confirmed M. pluton in the following items sampled from infected colonies: larvae, individual body components of adult bees, pollen, washes with water of brood comb cells that contained a freshly laid egg, and broodnest honey. M. pluton was found in larvae, adult bee digestive tracts and broodnest honey of healthy colonies, confirming the existence of the bacterium even though disease signs were not evident in the brood. Honey bee larvae were successfully reared in the laboratory from an age of less than 24 hours to the stage of defecation and commencement of pupation. Successful inoculation of laboratory reared larvae with suspensions of M. pluton proved to be very effective in causing disease. These procedures will enable fast, relatively inexpensive, fully controlled laboratory studies to be conducted on the effect of nutrition and other potential treatments for the control of all honey bee larval diseases. Such studies could replace costly field and cage trials that are invariably affected by uncontrollable factors such as variable pollen and nectar resources, weather conditions and bee disease. A survey of selected Victorian and Tasmanian apiarists was conducted in 1999 to determine OTC use patterns and apiary management practices used for the control of EFB. Sixty-two percent of Victorian respondents treated colonies with OTC only when EFB symptoms were present in the brood, while the remaining respondents treated colonies before symptoms were evident. Forty-nine percent of respondents chose to spot treat only infected colonies rather than blanket treat all colonies in an apiary. There was a strong indication that ‘good conditions’ (provided by good nectar and pollen flows) were very important as a means of reducing or preventing the incidence of EFB. In contrast, the feeding of protein supplement to improve honey bee nutrition did not appear to prevent EFB. Locating colonies on sunny, warm, sheltered wintering and spring apiary sites was very important. Many respondents thought that regular requeening of colonies reduced the potential for EFB. Most practiced regular replacement of aging broodnest combs in an attempt to lower the population of M. pluton in the hive.

viii
1
1. Introduction European foulbrood (EFB) is a serious economic bacterial disease of honey bee brood. In Australia, the disease was first confirmed in honey bee colonies in South Australia and Victoria in 1977 and has spread to all Australian States except Western Australia. When honey bee larvae die as a result of EFB infection there is a reduction of adult bees in the colony and a subsequent loss of honey production depending on the degree of infection. In severe cases where many larvae die, the colony may decline and eventually die. However, many colonies although seriously weakened by the disease can slowly recover when good nectar and pollen flows occur. In Australia EFB primarily occurs in spring. The incidence and intensity of EFB infections varies from year to year, but appears greatest in districts that have inclement, changeable spring weather that interrupts honey bee foraging and the collection of nectar and pollen. In Victoria, where such weather is typical, the incidence of EFB appears greatest in the southern, cooler parts of the State. Apiarists use a number of apiary management techniques to lessen the impact of EFB in their colonies. These may include:
• regular requeening of colonies to ensure a queen capable of prolific egg laying • keeping colonies warm and compact • placing colonies on apiary sites with good nectar and pollen yielding flora • feeding of dietary supplement to colonies to ensure optimum honey bee nutrition.
The antibiotic oxytetracycline hydrochloride (OTC) may be used by some apiarists to control the disease. A number of OTC products are registered by the Australian Pesticides and Veterinary Medicines Authority for application to beehives for the control of EFB. Goodman and Azuolas (1994) alluded to potential repercussions in the Australian honey industry including the possible loss of export and domestic honey markets if OTC residues were detected in extracted honey. The project described in this report was developed in 1998 following detection by the Australian National Residue Survey of OTC residues in commercially produced honey. Several experiments were conducted to provide comprehensive information on the occurrence of OTC residues in honey. In 1999, the project was modified and enlarged to include a range of studies on EFB and M. pluton in addition to further investigations about the usage of OTC. Introductory notes: • All OTC treatments mentioned in the following experiments were prescribed by registered
veterinary surgeons and some were applied to hives as an “off-label” use. Off-label use of an OTC product in these experiments does not imply endorsement by the authors, Department of Primary Industries or the Rural Industries Research and Development Corporation. OTC is an S4 drug and must be prescribed and used in accordance with the relevant regulations of the particular State or Territory.
• The application of low doses of OTC in dose-response experiments, where the amount of OTC applied to hives was lower than that stipulated by label directions, does not imply endorsement by the authors, Department of Primary Industries or the Rural Industries Research and Development Corporation. The authors advise full adherence to OTC product label directions.
• Full details of methodology used in the following investigations, together with detailed discussion and conclusions, are presented in RIRDC’s research report ‘European foulbrood – investigating control measures’.
2
2. Oxytetracycline hydrochloride in honey Residues in honey extracted from hives treated with OTC Experiment 1 Aim To determine the level of residues in honey extracted from hives treated with OTC according to doses stipulated on labels of three OTC products and according to apiary industry practice current at 1998.
Methodology Hives were located at Ararat on a yellow box (Eucalyptus melliodora) nectar flow that provided enough nectar for the colonies to only maintain themselves. These conditions mimicked those commonly found at the time of the year when apiarists would normally treat hives with OTC. Before treatment was applied, a sample of honey was obtained from each hive to determine if any residual OTC was present. There were six groups of six colonies. On 16 December 1998, each group of colonies was given one of the following OTC treatments: 1. OTC from product No. 1 - wet treatment (P1-W)
1 g equivalent active OTC in 500 ml of sugar syrup (1:1 sugar:water by volume)
2. OTC from product No. 1 - dry treatment (P1-D) 1 g equivalent active OTC in caster sugar to make a total mixture of 100 g
3. OTC from product No. 2 - wet treatment (P2-W) 1 g equivalent active OTC in 500 ml of sugar syrup (1:1 sugar:water by volume)
4. OTC from product No. 2 dry treatment (P2-D) 1 g equivalent active OTC in caster sugar to make a total mixture of 100 g
5. OTC from product No. 3 - wet treatment (P3-W) 1 g equivalent active OTC in 500 ml of sugar syrup (1:1 sugar:water by volume)
6. OTC from product No. 3 - dry treatment (P3-D) 1 g equivalent active OTC in caster sugar to make a total mixture of 100 g
OTC was applied to the brood nest after the queen excluder and supers were temporarily removed. On 9 January 1999, the colonies were moved to Moyston at the base of the Grampians in western Victoria where river tea-tree (Leptospermum obovatum) and messmate (E. obliqua) were flowering. On 28 January 1999, the supers of honey from each of the six hives belonging to a treatment group were extracted as one batch. The honey from the six supers was pooled and sampled for later analysis for OTC residues. The extractor, uncapping knife, honey tank, bucket and pipe beneath the extractor were thoroughly cleaned before extracting the honey of the next treatment group. After cleaning, honey from untreated (control) hives was extracted and sampled. These samples were analysed to demonstrate effective cleaning of the extraction equipment and absence of cross-contamination of OTC between the treatment groups. On 10 February 1999, the hives were robbed a second time and these supers were extracted on the 15 February 1999 using the above method.
Results The results of the analyses of the first and second extraction samples are presented in Table 1.
3
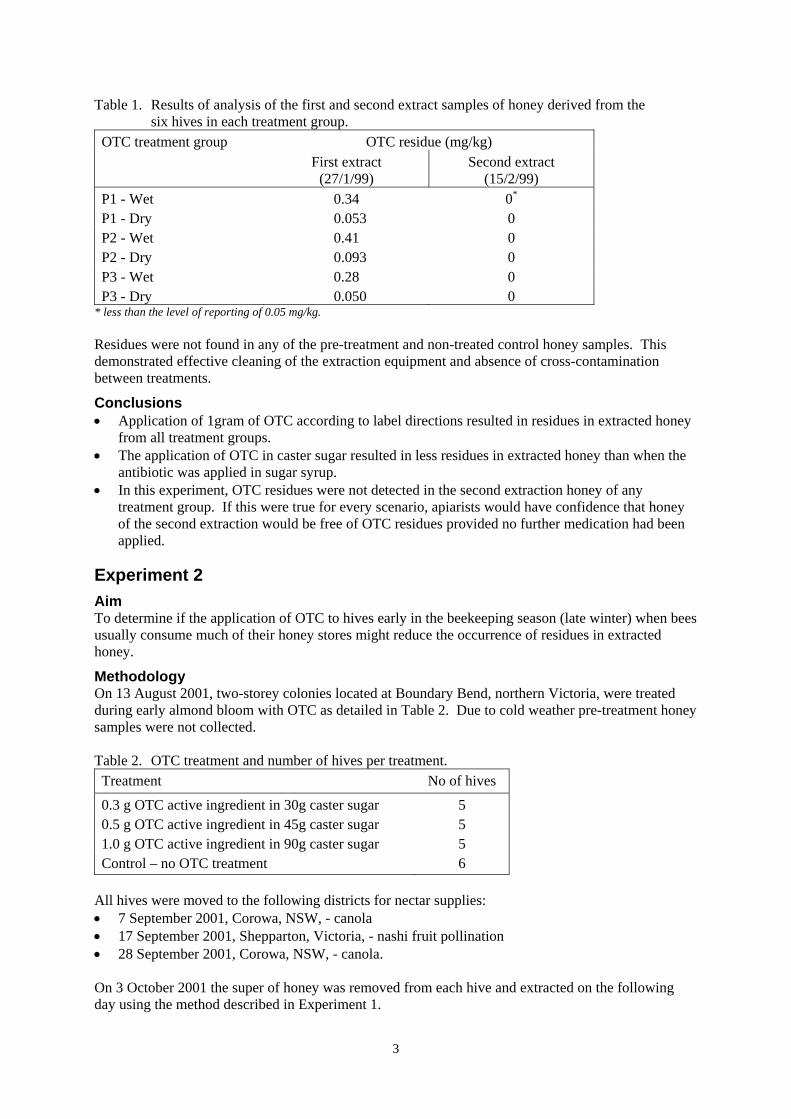
Table 1. Results of analysis of the first and second extract samples of honey derived from the six hives in each treatment group.
OTC residue (mg/kg) OTC treatment group First extract
(27/1/99) Second extract
(15/2/99) P1 - Wet 0.34 0*
P1 - Dry 0.053 0 P2 - Wet 0.41 0 P2 - Dry 0.093 0 P3 - Wet 0.28 0 P3 - Dry 0.050 0
* less than the level of reporting of 0.05 mg/kg. Residues were not found in any of the pre-treatment and non-treated control honey samples. This demonstrated effective cleaning of the extraction equipment and absence of cross-contamination between treatments.
Conclusions • Application of 1gram of OTC according to label directions resulted in residues in extracted honey
from all treatment groups. • The application of OTC in caster sugar resulted in less residues in extracted honey than when the
antibiotic was applied in sugar syrup. • In this experiment, OTC residues were not detected in the second extraction honey of any
treatment group. If this were true for every scenario, apiarists would have confidence that honey of the second extraction would be free of OTC residues provided no further medication had been applied.
Experiment 2 Aim To determine if the application of OTC to hives early in the beekeeping season (late winter) when bees usually consume much of their honey stores might reduce the occurrence of residues in extracted honey.
Methodology On 13 August 2001, two-storey colonies located at Boundary Bend, northern Victoria, were treated during early almond bloom with OTC as detailed in Table 2. Due to cold weather pre-treatment honey samples were not collected. Table 2. OTC treatment and number of hives per treatment. Treatment No of hives
0.3 g OTC active ingredient in 30g caster sugar 5 0.5 g OTC active ingredient in 45g caster sugar 5 1.0 g OTC active ingredient in 90g caster sugar 5 Control – no OTC treatment 6
All hives were moved to the following districts for nectar supplies: • 7 September 2001, Corowa, NSW, - canola • 17 September 2001, Shepparton, Victoria, - nashi fruit pollination • 28 September 2001, Corowa, NSW, - canola. On 3 October 2001 the super of honey was removed from each hive and extracted on the following day using the method described in Experiment 1.

4
Results • OTC residues were not found in any of the control honeys, demonstrating effective cleaning of the
extraction equipment and absence of cross-contamination of OTC between treatments. • Each of the four samples collected from the treatment of 1.0 g OTC had 0.07 mg/kg residues. • Residues were not found in any of the samples derived from the 0.3 g and 0.5 g treatment groups.
Conclusion • In this experiment, the treatment of colonies with 1.0 g OTC early in the beekeeping season failed
to prevent residues of OTC in the extracted honey. Readers should consider the warning in the following chapters in relation to the reduction of the standard 1 g (active ingredient) of OTC dose.
Experiment 3 Aim To determine the concentration of residues in extracted honey following the application of 0.5 g and 1.0 g OTC in caster sugar and water to hives in late spring.
Methodology Forty-two hives with no history of OTC treatment in the two previous seasons were selected. A pre-treatment sample of honey was obtained from each hive by scraping at least two combs. The hives were moved in the early morning of 22 November 2001 to an apiary site for maintenance nectar and pollen supplies. The colonies were treated as per Table 3 at midday 22 November 2001 when the bees were foraging well and bringing pollen to the hive. Table 3. OTC treatment and number of hives per treatment group. OTC treatment No of hives
1.0 g OTC active ingredient in caster sugar 5 1.0 g OTC active ingredient in caster sugar 5 1.0 g OTC active ingredient in caster sugar 5 1.0 g OTC active ingredient in distilled water 5 0.5 g OTC active ingredient in caster sugar 5 0.5 g OTC active ingredient in distilled water 5 Control – no OTC treatment 12
All colonies were moved to a yellow box nectar flow on 4 December 2001. On 2 January 2002, a super of empty combs and a honey bee clearer (escape) board, both with no history of OTC, were inserted beneath each super of honey to allow the bees to clear from the combs before extraction of the honey. The full super of honey was removed on 7 January 2002 and extracted the same day using the method of Experiment 1. The honey was then sampled and frozen for later analysis.
Results No OTC was detected in any of the pre-treatment samples and control samples.
5
Table 4. Treatment, concentration of OTC in four replicate honey samples and mean OTC residue per treatment group by HPLC.
Treatment Concentration of OTC residuein 4 replicate samples
(mg/kg)
Concentration of OTC residueMean of 4 samples
(mg/kg)
1.0 g OTC (ai) caster sugar 0.25; 0.22; 0.22; 0.23 0.23 1.0 g OTC (ai) in caster sugar 0.13; 0.13; 0.14; 0.12 0.13 1.0 g OTC (ai) in caster sugar 0.14; 0.16; 0.15; 0.13 0.145 1.0 g OTC (ai) in distilled water 0.28; 0.24; 0.23; 0.26 0.253 0.5 g OTC (ai) in caster sugar 0.07; 0.07; 0.08; <0.05 0.073*
0.5 g OTC (ai) in distilled water 0.05; 0.05; 0.05; 0.05 0.05 (ai) = active ingredient. * Mean of three samples
Conclusion and recommendation • The mean concentration of OTC was lower in honey derived from hives treated with 0.5 g OTC in
distilled water than in honey derived from hives treated with the same dose in caster sugar. • In contrast, the mean concentration of OTC was higher in honey derived from hives treated with
1.0 g OTC in distilled water than in honey derived from hives treated with the same dose in caster sugar.
• We suggest that additional trials be conducted to provide more data to confirm the appropriateness of applying OTC in water to hives.
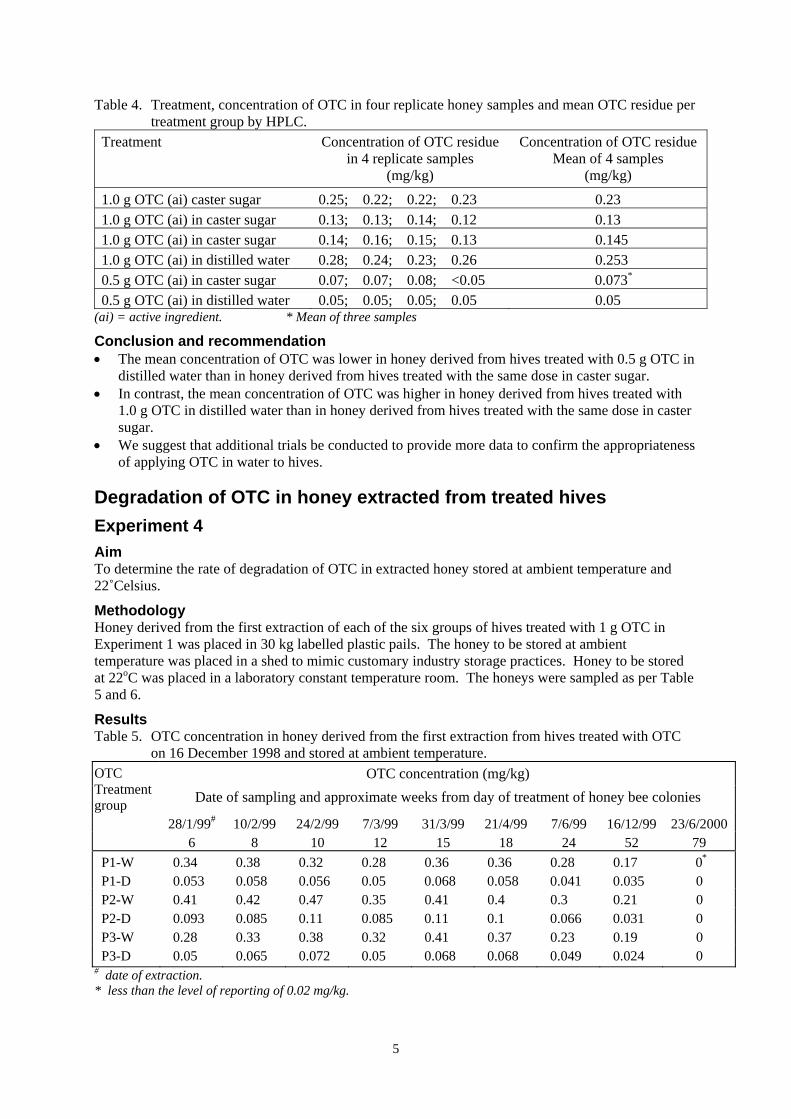
Degradation of OTC in honey extracted from treated hives Experiment 4 Aim To determine the rate of degradation of OTC in extracted honey stored at ambient temperature and 22˚Celsius.
Methodology Honey derived from the first extraction of each of the six groups of hives treated with 1 g OTC in Experiment 1 was placed in 30 kg labelled plastic pails. The honey to be stored at ambient temperature was placed in a shed to mimic customary industry storage practices. Honey to be stored at 22oC was placed in a laboratory constant temperature room. The honeys were sampled as per Table 5 and 6.
Results Table 5. OTC concentration in honey derived from the first extraction from hives treated with OTC
on 16 December 1998 and stored at ambient temperature. OTC concentration (mg/kg) OTC
Treatment group Date of sampling and approximate weeks from day of treatment of honey bee colonies
28/1/99# 10/2/99 24/2/99 7/3/99 31/3/99 21/4/99 7/6/99 16/12/99 23/6/2000 6 8 10 12 15 18 24 52 79
P1-W 0.34 0.38 0.32 0.28 0.36 0.36 0.28 0.17 0*
P1-D 0.053 0.058 0.056 0.05 0.068 0.058 0.041 0.035 0 P2-W 0.41 0.42 0.47 0.35 0.41 0.4 0.3 0.21 0 P2-D 0.093 0.085 0.11 0.085 0.11 0.1 0.066 0.031 0 P3-W 0.28 0.33 0.38 0.32 0.41 0.37 0.23 0.19 0 P3-D 0.05 0.065 0.072 0.05 0.068 0.068 0.049 0.024 0 # date of extraction. * less than the level of reporting of 0.02 mg/kg.

6
Table 6. OTC concentration in honey derived from the first extraction from hives treated with OTC on 16 December 1998 (Experiment 1) and stored at 22ºC.
OTC treatment OTC concentration (mg/kg) Date of sampling and approximate weeks from day of treatment of honey bee colonies 28/1/99# 7/6/99 16/12/99 16/3/2000 23/6/2000 6 24 52 65 79 P1-W 0.34 0.16 0.12 0.05 0*
P1-D 0.053 <0.02 - - - P2-W 0.41 0.17 0.095 0.04 0.04 P2-D 0.093 0.045 0.021 0.02 0.01 P3-W 0.28 0.16 0.14 0.05 0.05 P3-D 0.05 0.03 <0.02 - - # Date of extraction. * less than the level of reporting of 0.02 mg/kg. Key:
P1-W OTC from product No. 1 applied in sugar syrup P1-D OTC from product No. 1 applied in caster sugar P2-W OTC from product No. 2 applied in sugar syrup
P2-D OTC from product No. 2 applied in caster sugar P3-W OTC from product No. 3 applied in sugar syrup P3-D OTC from product No. 3 applied in caster sugar
Conclusion • The fact that OTC residues were still present in first extraction honey sampled 12 months after the
date of OTC treatment indicates that the antibiotic degrades only slowly in honey held at ambient temperature.
• There was a higher rate of degradation of OTC in the honey stored at 22oC when compared to the same honey stored at ambient temperature.
Experiment 5 Aim To determine the degradation of OTC in extracted honey stored at 25oC, 30oC, 35oC and 40oC.
Methodology Two, 2-storey hives were each treated with 1 g of OTC (ai) in 500 mL of sugar syrup on 19 October 2000. Honey from the super of each hive was extracted on 1 November 2000, thoroughly mixed and decanted into vials. These were kept at room temperature until they were placed in 25oC, 30oC, 35oC and 40oC incubators in equal numbers on 14 November 2000. Two vials were removed from each incubator at 14 day intervals for analysis.
Results • 25ºC honey – OTC was still detectable at almost 18 months after treatment of the colonies • 30ºC honey – residues were not detected at approximately 15.5 months after treatment • 35ºC honey – residues were not detected at approximately 8.5 months after treatment • 40ºC honey – residues were not detectable 3.5 months after treatment.
Conclusion • The data from this experiment confirms the slow rate of degradation of OTC at 25oC and a faster
rate of degradation at higher temperatures.
7
3. Oxytetracycline hydrochloride in larvae of treated honey bee colonies
Following detection of OTC residues in honey in 1998, some Australian apiarists treated colonies with doses lower than those stipulated on OTC product labels. These apiarists believed that this might reduce the potential for OTC residues to occur in their extracted honey. It is important that the dose of OTC applied to a honey bee colony is sufficient to effectively inhibit or control Melissococcus pluton. The dose must deliver sufficient antibiotic to meet or exceed the minimum inhibitory concentration (MIC) of OTC to Melissococcus pluton. The MIC is the minimum dose capable of inhibiting development of M. pluton. Hornitzky and Smith (1999) conducted OTC sensitivity assays on 104 isolates of M. pluton obtained from four Australian States and determined the MIC for all isolates to be 1-2 µg/mL. The following experiments were conducted to determine the potential for reduced doses of OTC to deliver enough antibiotic in individual honey bee larvae to meet the MIC as established by Hornitzky and Smith (1999).
Experiment 1 – Concentration of OTC in honey bee larvae following application of the antibiotic in summer and spring Aim To determine the concentration of OTC in honey bee larvae following application of OTC in caster sugar to honey bee colonies in summer and spring.
Methodology Pre-treatment samples of at least 20 larvae were taken from the trial colonies and analysed to confirm that hives were free of OTC contamination. The hives of each treatment group were standardised to ensure similar numbers of adult bees, brood and honey. A very light nectar flow was in progress during these experiments. OTC was applied to hives according to Table 1. Table 1. Oxytetracycline treatment, number of combs of brood and adult bees for each treatment
group. Treatment Number of combs of brood and bees, and hive size
OTC (g active)
Caster sugar (g)
6 combs of brood and 8 combsof bees (single storey)
6 combs of brood and 14-16 combs of bees (two storey)
0.3 33.3 5 colonies* 5 colonies*
0.5 50 5 colonies* 5 colonies*
1.0 100 5 colonies* 5 colonies*
* 4 colonies were used in the spring experiment Larvae were sampled from each colony 24 hours after treatment and thereafter on a daily basis. They were stored in a -20oC freezer for later analysis to determine the concentration of OTC.

8
Results The mean concentration of OTC in larvae sampled after treatment is presented in Table 2. Table 2. Mean concentration of OTC in larvae for each treatment group over six days from
medication. OTC concentration (mg/kg) for each treatment and size of colony
0.3 g OTC 0.5 g OTC 1.0 g OTC
Days after medication
(1)* (2)* (1) (2) (1) (2)
1 2 3 4 5 6
12.6 6.1 1.2 1.6 1.0 0.2
8.2 3.0 1.0 0.3 0.2 0
25.1 7.6 2.2 1.7 1.6 1.0
10.5 6.4 1.4 1.0 0.5 0.3
41.9 19.2 12.3 11.3 2.6 3.8
29.0 11.1 5.1 2.7 1.2 0.8
* denotes size of colony in storeys
Figure 1 - Mean concentration of OTC in larvae for each treatment group over six days from medication
Conclusions • The results, based on whole larval assays rather than the gut only, show that all treatments
delivered sufficient antibiotic to exceed the MIC by a minimum of 4 times on day 1 after treatment and a minimum of about 10 times at the time of treatment (ie immediately after treatment).
• We suggest some caution in interpreting these results on the basis that our previous work demonstrated a lower concentration of OTC in the gut when compared to the whole larva. Readers are referred to the additional conclusion and recommendation on the following page.
Degradation of oxytetracycline in larvae after medication
0
5
10
15
20
25
30
35
40
45
1 2 3 4 5 6Days post medication
Oxy
tetr
acyc
line
(mg/
kg)
0.3g OTC single0.3g OTC double0.5g OTC single0.5g OTC double1.0g OTC single1.0g OTC double
9
Experiment 3 – Application of the OTC in water Aim To determine the concentration of OTC in honey bee larvae following application of the antibiotic in water.
Methodology Ten double-storey eight frame hives were treated with either 0.3 g or 0.5 g OTC dissolved in 200 mL of distilled water on 20 November 2000. The medication was poured on the bees and top bars of the broodnest frames after first removing the queen excluder. Hives were elevated at the front so that liquid did not flow out the entrances. Larvae were sampled from each hive daily for 9 days after treatment.
Results Although the mean level of OTC in larvae was generally higher for the 0.5 g treatment than the 0.3 g treatment, the difference was not statically significant on any day. Table 3. Mean concentration of OTC in larvae for each water treatment for three days from
medication. Concentration of OTC in larvae (mg/kg) Days after
treatment 0.3 g OTC/hive 0.5 g OTC/hive 1 2 3
11.0 4.3
0.24
11.3 6.4
0.48
Conclusion • Both the 0.3 g and 0.5 g OTC water applications delivered antibiotic above the minimum
inhibitory concentration for M. pluton for 2 days. • These treatments gave equal or higher OTC levels on the first two days post-treatment when
compared with the same doses applied in caster sugar to two-storey colonies. • By day 3, the concentration of OTC in larvae treated with OTC in water was considerably lower
than that in larvae fed with medicated caster sugar.
Additional conclusion and recommendation for experiments 1 and 2 • The 1 g dose of OTC for double storey colonies has proven effective in controlling EFB in
Australia since the disease became a problem in 1997. On that basis the 1 g dose provides sufficient antibiotic to meet or exceed the MIC.
• The ability of 0.5 g and 0.3 g doses (administered to double storey colonies) to deliver sufficient OTC to the larval gut (the site where M. pluton develops) to meet the MIC has not been shown by this work. We suggest that until further experimentation, the 1 g dose should not be reduced. In addition, any reduction in OTC may also encourage M. pluton to develop resistance to the antibiotic. The current 0.5 g and 1.0 g doses administered to single-storey and double-storey colonies respectively are therefore appropriate for control of EFB in Australia.
10
4. Efficacy of low doses of OTC applied to honey bee colonies to control European Foulbrood disease
Aim To determine the efficacy of low doses of OTC and antibiotic extender patties to reduce the incidence of clinical symptoms of EFB in honey bee brood.
Methodology Forty honey bee colonies with EFB disease signs were selected. Ten colonies, were located at Dunolly, Victoria for the entire trial where yellow gum (Eucalyptus leucoxylon subsps) provided a little nectar. The other colonies were on a non-nectar flow site at Mt. Lonarch, Victoria where capeweed (Arctotheca calendula) provided light quantities of pollen. All colonies occupied a single box although some located at Dunolly had begun to expand into the second box. The number of sick and dead honey bee larvae, including scale (dried remains of larvae) showing typical EFB disease signs were counted. Colonies were allocated to the following treatment groups and treated (as per accepted industry practices) on 2 October 1999: a. 0.3 g OTC in 19 g of icing sugar b. 0.4 g OTC in 46 g of caster sugar c. 0.5 g OTC in 45 g of caster sugar (standard dose for single storey colonies) d. 0.8 g OTC in antibiotic extender patties made from 150 g hydrogenated cotton oil and 300 g
caster sugar (Delaplane and Lozano, 1994) e. control – no OTC treatment. The antibiotic extender patties were oval and about 10 mm thick. They were placed on a sheet of paper of identical size and shape positioned centrally on the top bars of the brood nest frames. A 12 mm wooden riser (rim) was placed on the brood box to accommodate the thickness of the patty when the excluder or upper box was replaced on the hive. On the night of 5 October 1999, the colonies at Mt Lonarch were moved to a yellow gum (Eucalyptus leucoxylon sp) nectar flow near Maryborough, Victoria.
Results The number of larvae showing EFB disease signs and time of inspections are detailed in Table 1. Table 1. OTC dose and mean number of diseased larvae per brood comb at each inspection. OTC treatment Observation and mean number of diseased honey bee larvae per brood comb
Days post-treatment Day before treatment 12 22 41
0.3 g 59.7 2.61a 3.40a 3.79a 0.4 g 39.8 1.48a 3.74ab 2.72a 0.5 g 73.0 0.88a 2.53a 1.97a Extender patties 40.0 9.82b 16.39bc 12.20a Control - no OTC 35.9 12.16b 11.83b 8.64a
Note: Means with different letters are significantly different at P < 0.05. The patties were of no benefit in reducing the numbers of diseased larvae. In fact, the patties were unattractive to bees and virtually remained untouched; the greatest consumption per hive being 0.97 g for the duration of the experiment.
11
Conclusions • The colonies treated with either a 0.3 g, 0.4 g or 0.5 g dose had statistically significantly less
diseased and dead larvae than the controls at the 12 and 22 day post-treatment observations, but not at the 41 day post treatment observation.
• At the beginning of the trial, EFB was well established in some of the colonies. If OTC had been applied at an earlier time when the disease was not so advanced, we may have had a better clean up of symptoms. We chose colonies with well established EFB because colonies with only a light infection (a few diseased larvae) can often spontaneously clear up. A spontaneous clear-up of disease symptoms may have wrongly attributed success to one or more of our treatments.
• The antibiotic extender patties proved to be unattractive to bees. The amount consumed by the bees was insignificant and the uptake of OTC was negligible. Consequently there was no effect on the incidence of EFB. The unattractiveness of the patties may be partly due to the fact that we used hydrogenated cotton oil in our patties. Crisco® vegetable oil used in USA patties was unavailable in Australia and after considering expert advice provided by a chemist of an Australian firm trading in vegetable oils, we chose cotton oil.
Recommendations • Australian apiarists should continue to use 0.5 g and 1.0 g doses of OTC for single-storey and
double-storey colonies respectively until further investigations are conducted. This is in line with our conclusions of the previous chapter. Until the efficacy of low doses of OTC for control of EFB can be demonstrated by trials using M. pluton infected laboratory reared honey bee larvae and back-up field investigations, these doses should not be reduced.
• The research team strongly urges apiarists not to feed OTC antibiotic extender patties to colonies. Antibiotic extender patties provide a prolonged exposure of OTC in low concentrations over the period of consumption by hive bees. This results in a potential for the development of antibiotic resistance in bacteria (Delapane 1997) associated with EFB and American Foulbrood (AFB). It is believed that strains of Paenibacillus larvae sub-species larvae (the causal bacterium of AFB) in the USA have resulted from use of OTC extender patties.
12
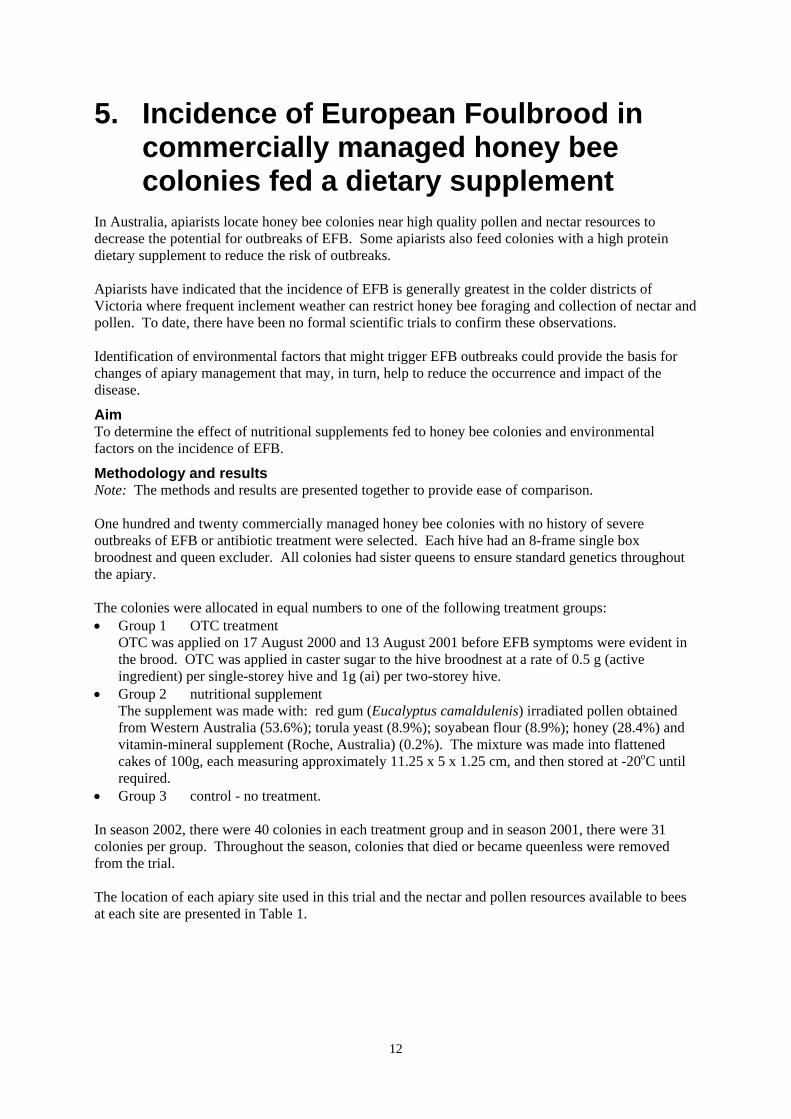
5. Incidence of European Foulbrood in commercially managed honey bee colonies fed a dietary supplement
In Australia, apiarists locate honey bee colonies near high quality pollen and nectar resources to decrease the potential for outbreaks of EFB. Some apiarists also feed colonies with a high protein dietary supplement to reduce the risk of outbreaks. Apiarists have indicated that the incidence of EFB is generally greatest in the colder districts of Victoria where frequent inclement weather can restrict honey bee foraging and collection of nectar and pollen. To date, there have been no formal scientific trials to confirm these observations. Identification of environmental factors that might trigger EFB outbreaks could provide the basis for changes of apiary management that may, in turn, help to reduce the occurrence and impact of the disease.
Aim To determine the effect of nutritional supplements fed to honey bee colonies and environmental factors on the incidence of EFB.
Methodology and results Note: The methods and results are presented together to provide ease of comparison. One hundred and twenty commercially managed honey bee colonies with no history of severe outbreaks of EFB or antibiotic treatment were selected. Each hive had an 8-frame single box broodnest and queen excluder. All colonies had sister queens to ensure standard genetics throughout the apiary. The colonies were allocated in equal numbers to one of the following treatment groups: • Group 1 OTC treatment
OTC was applied on 17 August 2000 and 13 August 2001 before EFB symptoms were evident in the brood. OTC was applied in caster sugar to the hive broodnest at a rate of 0.5 g (active ingredient) per single-storey hive and 1g (ai) per two-storey hive.
• Group 2 nutritional supplement The supplement was made with: red gum (Eucalyptus camaldulenis) irradiated pollen obtained from Western Australia (53.6%); torula yeast (8.9%); soyabean flour (8.9%); honey (28.4%) and vitamin-mineral supplement (Roche, Australia) (0.2%). The mixture was made into flattened cakes of 100g, each measuring approximately 11.25 x 5 x 1.25 cm, and then stored at -20oC until required.
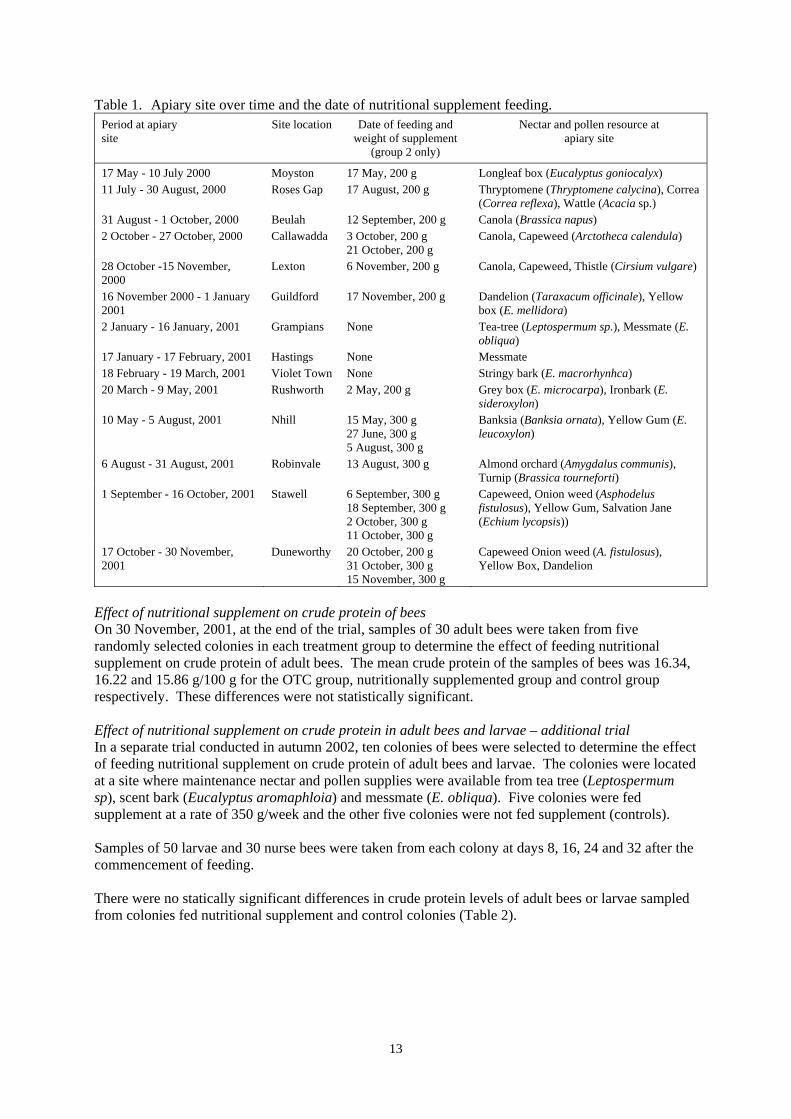
• Group 3 control - no treatment. In season 2002, there were 40 colonies in each treatment group and in season 2001, there were 31 colonies per group. Throughout the season, colonies that died or became queenless were removed from the trial. The location of each apiary site used in this trial and the nectar and pollen resources available to bees at each site are presented in Table 1.
13
Table 1. Apiary site over time and the date of nutritional supplement feeding. Period at apiary site
Site location Date of feeding and weight of supplement
(group 2 only)
Nectar and pollen resource at apiary site
17 May - 10 July 2000 Moyston 17 May, 200 g Longleaf box (Eucalyptus goniocalyx) 11 July - 30 August, 2000 Roses Gap 17 August, 200 g Thryptomene (Thryptomene calycina), Correa
(Correa reflexa), Wattle (Acacia sp.) 31 August - 1 October, 2000 Beulah 12 September, 200 g Canola (Brassica napus) 2 October - 27 October, 2000 Callawadda 3 October, 200 g
21 October, 200 g Canola, Capeweed (Arctotheca calendula)
28 October -15 November, 2000
Lexton 6 November, 200 g Canola, Capeweed, Thistle (Cirsium vulgare)
16 November 2000 - 1 January 2001
Guildford 17 November, 200 g Dandelion (Taraxacum officinale), Yellow box (E. mellidora)
2 January - 16 January, 2001 Grampians None Tea-tree (Leptospermum sp.), Messmate (E. obliqua)
17 January - 17 February, 2001 Hastings None Messmate 18 February - 19 March, 2001 Violet Town None Stringy bark (E. macrorhynhca) 20 March - 9 May, 2001 Rushworth 2 May, 200 g Grey box (E. microcarpa), Ironbark (E.
sideroxylon) 10 May - 5 August, 2001 Nhill 15 May, 300 g
27 June, 300 g 5 August, 300 g
Banksia (Banksia ornata), Yellow Gum (E. leucoxylon)
6 August - 31 August, 2001 Robinvale 13 August, 300 g Almond orchard (Amygdalus communis), Turnip (Brassica tourneforti)
1 September - 16 October, 2001 Stawell 6 September, 300 g 18 September, 300 g 2 October, 300 g 11 October, 300 g
Capeweed, Onion weed (Asphodelus fistulosus), Yellow Gum, Salvation Jane (Echium lycopsis))
17 October - 30 November, 2001
Duneworthy 20 October, 200 g 31 October, 300 g 15 November, 300 g
Capeweed Onion weed (A. fistulosus), Yellow Box, Dandelion
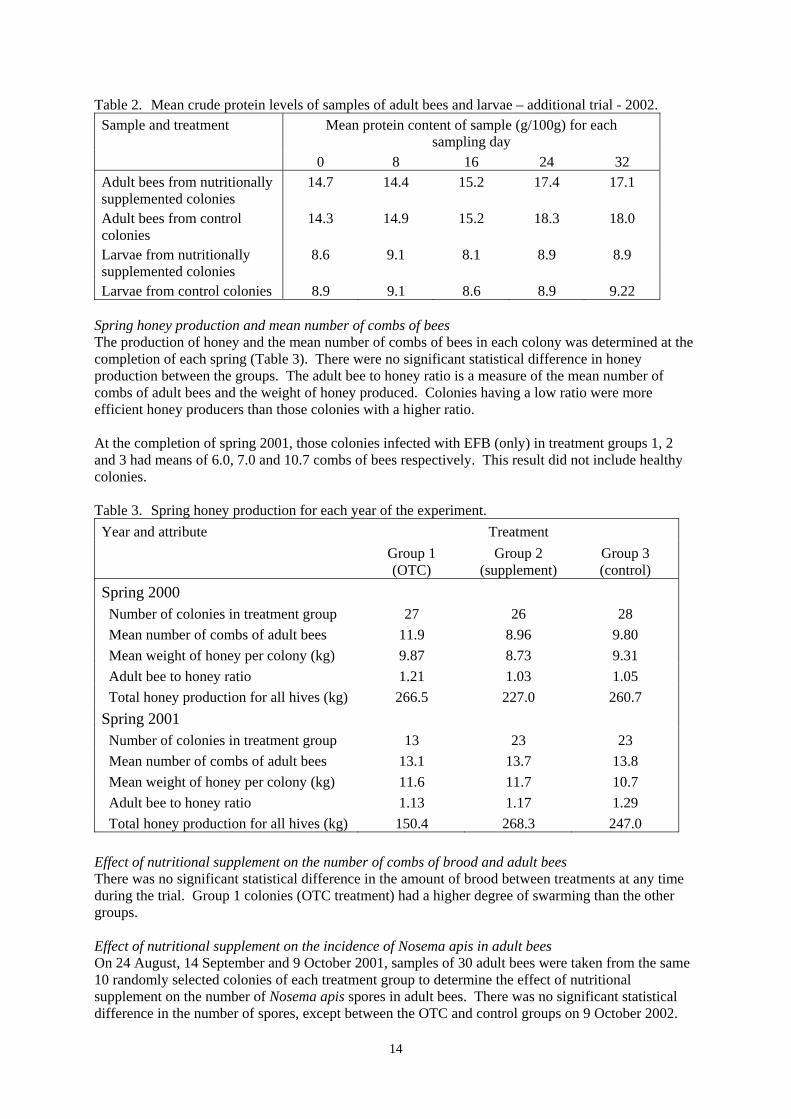
Effect of nutritional supplement on crude protein of bees On 30 November, 2001, at the end of the trial, samples of 30 adult bees were taken from five randomly selected colonies in each treatment group to determine the effect of feeding nutritional supplement on crude protein of adult bees. The mean crude protein of the samples of bees was 16.34, 16.22 and 15.86 g/100 g for the OTC group, nutritionally supplemented group and control group respectively. These differences were not statistically significant. Effect of nutritional supplement on crude protein in adult bees and larvae – additional trial In a separate trial conducted in autumn 2002, ten colonies of bees were selected to determine the effect of feeding nutritional supplement on crude protein of adult bees and larvae. The colonies were located at a site where maintenance nectar and pollen supplies were available from tea tree (Leptospermum sp), scent bark (Eucalyptus aromaphloia) and messmate (E. obliqua). Five colonies were fed supplement at a rate of 350 g/week and the other five colonies were not fed supplement (controls). Samples of 50 larvae and 30 nurse bees were taken from each colony at days 8, 16, 24 and 32 after the commencement of feeding. There were no statically significant differences in crude protein levels of adult bees or larvae sampled from colonies fed nutritional supplement and control colonies (Table 2).
14
Table 2. Mean crude protein levels of samples of adult bees and larvae – additional trial - 2002. Mean protein content of sample (g/100g) for each
sampling day Sample and treatment
0 8 16 24 32 Adult bees from nutritionally supplemented colonies
14.7 14.4 15.2 17.4 17.1
Adult bees from control colonies
14.3 14.9 15.2 18.3 18.0
Larvae from nutritionally supplemented colonies
8.6 9.1 8.1 8.9 8.9
Larvae from control colonies 8.9 9.1 8.6 8.9 9.22 Spring honey production and mean number of combs of bees The production of honey and the mean number of combs of bees in each colony was determined at the completion of each spring (Table 3). There were no significant statistical difference in honey production between the groups. The adult bee to honey ratio is a measure of the mean number of combs of adult bees and the weight of honey produced. Colonies having a low ratio were more efficient honey producers than those colonies with a higher ratio. At the completion of spring 2001, those colonies infected with EFB (only) in treatment groups 1, 2 and 3 had means of 6.0, 7.0 and 10.7 combs of bees respectively. This result did not include healthy colonies. Table 3. Spring honey production for each year of the experiment.
Treatment Year and attribute Group 1 (OTC)
Group 2 (supplement)
Group 3 (control)
Spring 2000 Number of colonies in treatment group 27 26 28 Mean number of combs of adult bees 11.9 8.96 9.80 Mean weight of honey per colony (kg) 9.87 8.73 9.31 Adult bee to honey ratio 1.21 1.03 1.05 Total honey production for all hives (kg) 266.5 227.0 260.7 Spring 2001 Number of colonies in treatment group 13 23 23 Mean number of combs of adult bees 13.1 13.7 13.8 Mean weight of honey per colony (kg) 11.6 11.7 10.7 Adult bee to honey ratio 1.13 1.17 1.29 Total honey production for all hives (kg) 150.4 268.3 247.0
Effect of nutritional supplement on the number of combs of brood and adult bees There was no significant statistical difference in the amount of brood between treatments at any time during the trial. Group 1 colonies (OTC treatment) had a higher degree of swarming than the other groups. Effect of nutritional supplement on the incidence of Nosema apis in adult bees On 24 August, 14 September and 9 October 2001, samples of 30 adult bees were taken from the same 10 randomly selected colonies of each treatment group to determine the effect of nutritional supplement on the number of Nosema apis spores in adult bees. There was no significant statistical difference in the number of spores, except between the OTC and control groups on 9 October 2002.
15
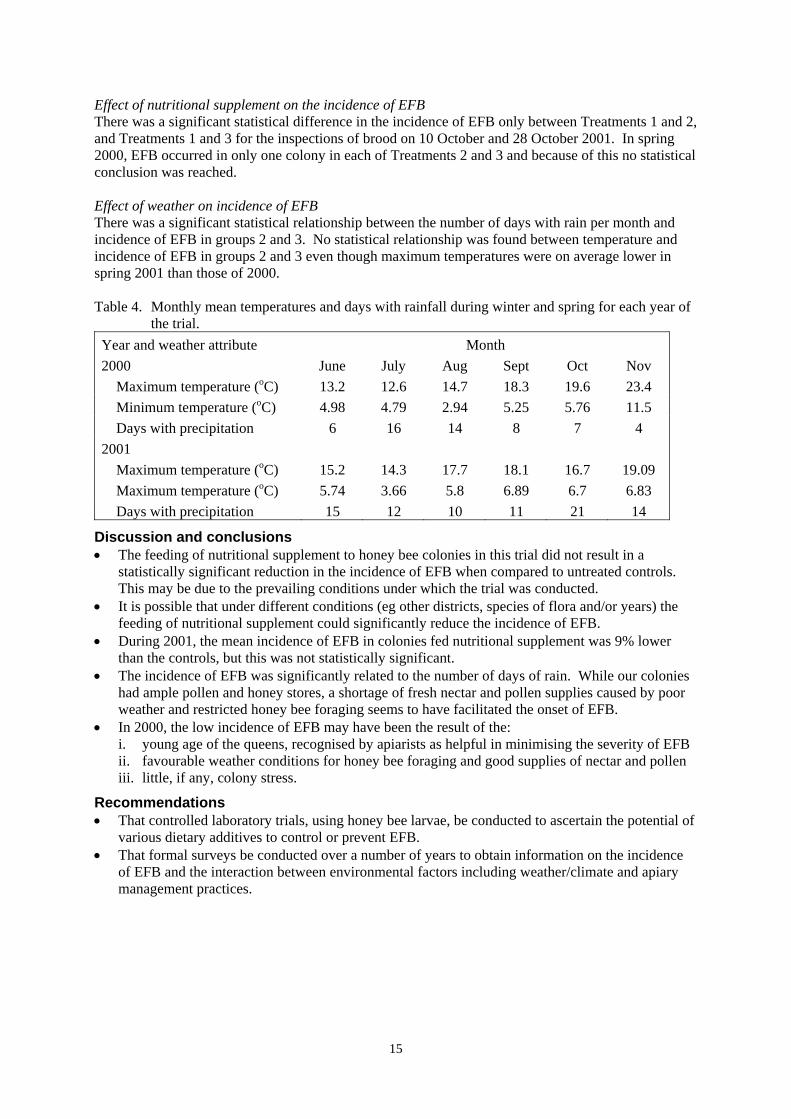
Effect of nutritional supplement on the incidence of EFB There was a significant statistical difference in the incidence of EFB only between Treatments 1 and 2, and Treatments 1 and 3 for the inspections of brood on 10 October and 28 October 2001. In spring 2000, EFB occurred in only one colony in each of Treatments 2 and 3 and because of this no statistical conclusion was reached. Effect of weather on incidence of EFB There was a significant statistical relationship between the number of days with rain per month and incidence of EFB in groups 2 and 3. No statistical relationship was found between temperature and incidence of EFB in groups 2 and 3 even though maximum temperatures were on average lower in spring 2001 than those of 2000. Table 4. Monthly mean temperatures and days with rainfall during winter and spring for each year of
the trial. Year and weather attribute Month 2000 June July Aug Sept Oct Nov Maximum temperature (oC) 13.2 12.6 14.7 18.3 19.6 23.4 Minimum temperature (oC) 4.98 4.79 2.94 5.25 5.76 11.5 Days with precipitation 6 16 14 8 7 4 2001 Maximum temperature (oC) 15.2 14.3 17.7 18.1 16.7 19.09 Maximum temperature (oC) 5.74 3.66 5.8 6.89 6.7 6.83 Days with precipitation 15 12 10 11 21 14
Discussion and conclusions • The feeding of nutritional supplement to honey bee colonies in this trial did not result in a
statistically significant reduction in the incidence of EFB when compared to untreated controls. This may be due to the prevailing conditions under which the trial was conducted.
• It is possible that under different conditions (eg other districts, species of flora and/or years) the feeding of nutritional supplement could significantly reduce the incidence of EFB.
• During 2001, the mean incidence of EFB in colonies fed nutritional supplement was 9% lower than the controls, but this was not statistically significant.
• The incidence of EFB was significantly related to the number of days of rain. While our colonies had ample pollen and honey stores, a shortage of fresh nectar and pollen supplies caused by poor weather and restricted honey bee foraging seems to have facilitated the onset of EFB.
• In 2000, the low incidence of EFB may have been the result of the: i. young age of the queens, recognised by apiarists as helpful in minimising the severity of EFB ii. favourable weather conditions for honey bee foraging and good supplies of nectar and pollen iii. little, if any, colony stress.
Recommendations • That controlled laboratory trials, using honey bee larvae, be conducted to ascertain the potential of
various dietary additives to control or prevent EFB. • That formal surveys be conducted over a number of years to obtain information on the incidence
of EFB and the interaction between environmental factors including weather/climate and apiary management practices.
16
6. The influence of pH in the honey bee larval gut on Melissococcus pluton
Honey bee larvae are fed brood food comprised of secretions from the mandibular and hypopharyngeal glands of nurse bees. This food has a pH of 4.0. The gut of the honey bee larva is the primary site where M. pluton, multiplies and causes infection. Variations in pH of the larval gut could influence the multiplication of M. pluton and therefore its pathogenic virulence on larvae. Factors such as variation in plant species, soil type, pH, moisture and fertility may influence the pH of pollen. These factors could ultimately induce changes of pH in the larval gut and thereby influence multiplication of M. pluton.
Aim To determine the pH of guts of larvae of honey bee colonies foraging on different flora.
Methodology In autumn 2001, five commercial apiaries situated in central and western Victoria were selected. The location of each apiary and the flora targeted by bees were:
Grampians tea-tree (Leptospermum species) messmate (Eucalyptus obliqua) apple box (E. bridgesiana)
Lismore sugar gum (E. cladocalyx) Pyrenees Ranges longleaf box (E. goniocalyx) Trentham manna gum (E. viminalis) Mount Cole manna gum (E. viminalis)
Ten larvae, aged approximately 4-5 days, were sampled from each of 5 randomly selected colonies at each location. The gut was dissected from each larva and the pH of its contents was measured. Laboratory studies were conducted to determine the effect of pH on the development of M. pluton. The bacterium was cultured on culture media having the following pH:
• 4.0 - adjusted medium • 6.6 - conventional medium (Hornitzky & Smith, 1998) • 8.0 - adjusted medium.
Five groups of larvae were reared in the laboratory (method described later in this report) and fed larval food of pH 3.1, 3.6, 4.1 (control), 4.6 and 5.1. The development and mortality of larvae was recorded.
Results The grand mean of pH for all larval gut contents sampled at all five sites was 6.329. The mean pH of larval guts varied from site to site and ranged from 6.258 to 6.506 (Table 1).
17
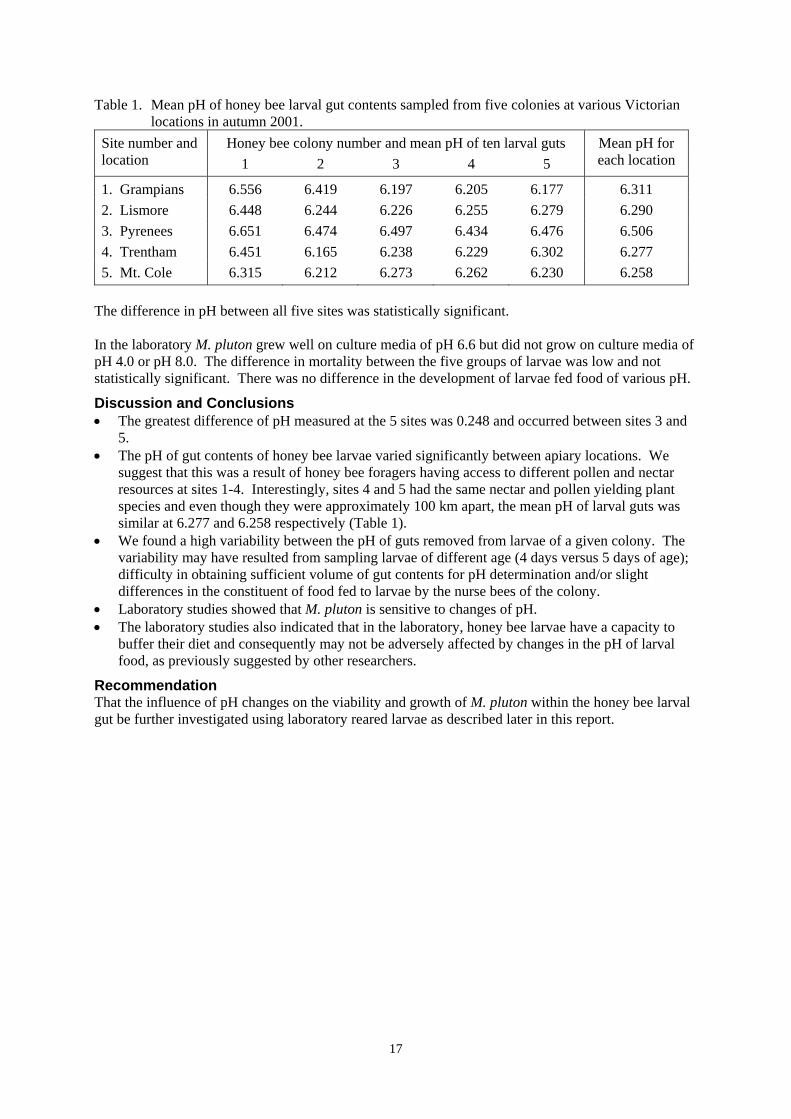
Table 1. Mean pH of honey bee larval gut contents sampled from five colonies at various Victorian locations in autumn 2001.
Honey bee colony number and mean pH of ten larval guts Site number and location 1 2 3 4 5
Mean pH for each location
1. Grampians 6.556 6.419 6.197 6.205 6.177 6.311 2. Lismore 6.448 6.244 6.226 6.255 6.279 6.290 3. Pyrenees 6.651 6.474 6.497 6.434 6.476 6.506 4. Trentham 6.451 6.165 6.238 6.229 6.302 6.277 5. Mt. Cole 6.315 6.212 6.273 6.262 6.230 6.258
The difference in pH between all five sites was statistically significant. In the laboratory M. pluton grew well on culture media of pH 6.6 but did not grow on culture media of pH 4.0 or pH 8.0. The difference in mortality between the five groups of larvae was low and not statistically significant. There was no difference in the development of larvae fed food of various pH.
Discussion and Conclusions • The greatest difference of pH measured at the 5 sites was 0.248 and occurred between sites 3 and
5. • The pH of gut contents of honey bee larvae varied significantly between apiary locations. We
suggest that this was a result of honey bee foragers having access to different pollen and nectar resources at sites 1-4. Interestingly, sites 4 and 5 had the same nectar and pollen yielding plant species and even though they were approximately 100 km apart, the mean pH of larval guts was similar at 6.277 and 6.258 respectively (Table 1).
• We found a high variability between the pH of guts removed from larvae of a given colony. The variability may have resulted from sampling larvae of different age (4 days versus 5 days of age); difficulty in obtaining sufficient volume of gut contents for pH determination and/or slight differences in the constituent of food fed to larvae by the nurse bees of the colony.
• Laboratory studies showed that M. pluton is sensitive to changes of pH. • The laboratory studies also indicated that in the laboratory, honey bee larvae have a capacity to
buffer their diet and consequently may not be adversely affected by changes in the pH of larval food, as previously suggested by other researchers.
Recommendation That the influence of pH changes on the viability and growth of M. pluton within the honey bee larval gut be further investigated using laboratory reared larvae as described later in this report.
18
7. Detection of Melissococcus pluton in honey bees and their products
Apiarists are usually able to diagnose EFB in their hives with relative ease based on the presence of specific disease signs (symptoms) in the brood. When symptoms do not provide a clear indication of the disease, apiarists may seek laboratory confirmation of the presence of M. pluton. This is usually done by microscopic examination of stained smears of diseased larvae to view the bacterium or by culture of diseased larvae to grow the organism. Other laboratory techniques that may be used include the polymerase chain reaction (PCR). PCR is a more sensitive assay than the culture. The PCR identifies and confirms the presence of specific fragments of DNA. Djordjevic et al. (1998) developed a PCR for the detection of M. pluton in bee larvae and pure cultures of the bacterium, but the assay was not successful for the detection of M. pluton in adult bees, honey and other apiary products.
Aim To modify Djordjevic’s hemi-nested PCR and to evaluate the usefulness of the modified assay for the detection of M. pluton in honey, pollen, adult bees and whole honey bee larvae.
Results The hemi-nested PCR of Djordjevic et al. (1998) was successfully modified to produce a more sensitive PCR. The modified PCR detected M. pluton in the following samples collected from a hive showing typical EFB disease signs:
• front and rear legs, wings, proboscis, ventriculus, rectum and honey crop of adult honey bees • whole honey bee larvae • pollen and honey collected from the hive broodnest • washings (using distilled water) of individual broodnest cells that contained a freshly laid egg.
The PCR also confirmed the presence of M. pluton in the following samples collected from an apparently healthy hive located adjacent to an EFB infected colony:
• front and rear legs and rectum of adult honey bees • whole honey bee larvae • honey collected from the hive broodnest.
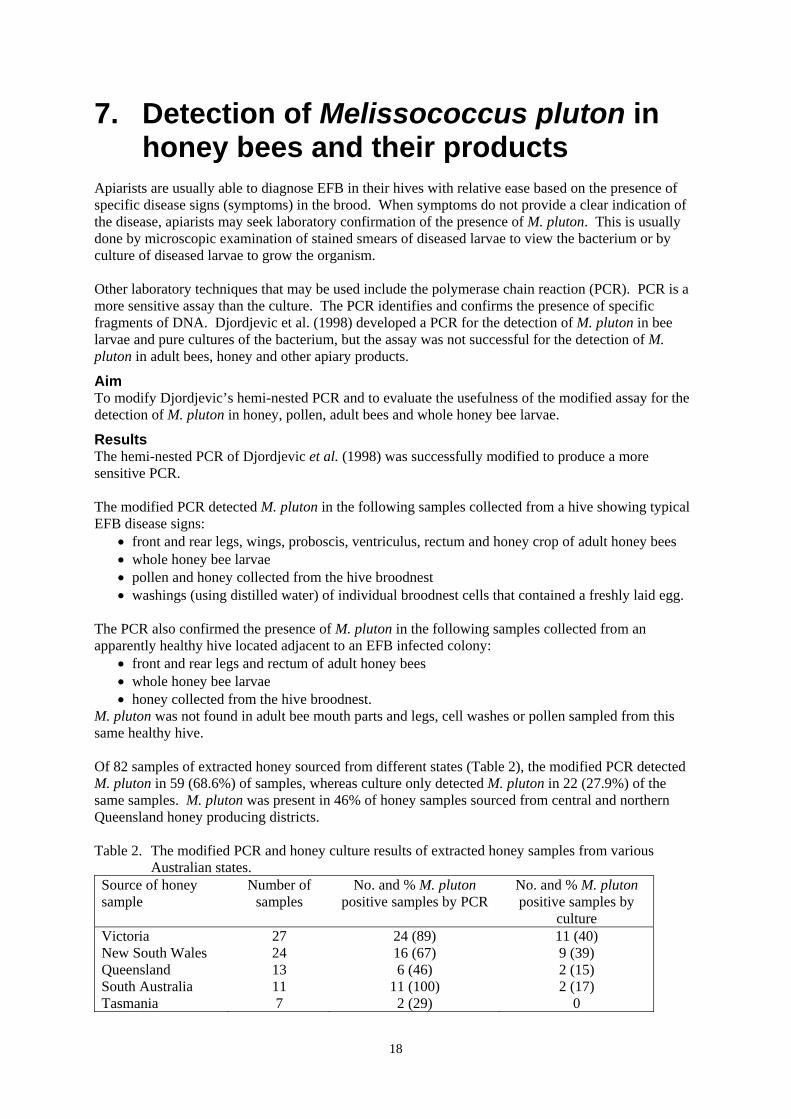
M. pluton was not found in adult bee mouth parts and legs, cell washes or pollen sampled from this same healthy hive. Of 82 samples of extracted honey sourced from different states (Table 2), the modified PCR detected M. pluton in 59 (68.6%) of samples, whereas culture only detected M. pluton in 22 (27.9%) of the same samples. M. pluton was present in 46% of honey samples sourced from central and northern Queensland honey producing districts. Table 2. The modified PCR and honey culture results of extracted honey samples from various
Australian states. Source of honey sample
Number of samples
No. and % M. pluton positive samples by PCR
No. and % M. pluton positive samples by
culture Victoria New South Wales Queensland South Australia Tasmania
27 24 13 11 7
24 (89) 16 (67) 6 (46)
11 (100) 2 (29)
11 (40) 9 (39) 2 (15) 2 (17)
0
19
Conclusions • The modified PCR proved to be more sensitive than the culture method for the detection of M.
pluton. • All individual body components of adult bees, pollen, brood comb cell washes and broodnest
honey from the infected colony were shown to contain M. pluton. This suggests that bees and bee products as well as diseased brood are a source of infection in diseased colonies.
• M. pluton may be present in larvae, adult bee digestive tracts and broodnest honey sampled from apparently healthy colonies.
• Honey was also shown to be commonly infected with M. pluton and therefore may be a constant supply of the organism to infect larvae.
• The Australian states with the highest percentage of samples of apiarist extracted honey infected with M. pluton were South Australia (100%), Victoria (89%) and New South Wales (67%).
• The modified PCR will be extremely useful for use in studies designed to evaluate the efficacy of potential new treatments for control of EFB.
20
8. Laboratory rearing of honey bee larvae for European Foulbrood studies
Honey bees freely forage on a variety of nectar and pollen plants within their general flight range of 5-6 kilometres from their hive. This is extremely beneficial to the health of the honey bee colony because it facilitates a balanced diet through a supply of various pollens, each contributing different amino acids, fatty acids, vitamins and minerals. However, the same free flying honey bee behaviour can make it difficult for some scientific experiments to deliver reliable information. For example, studies investigating supplementary diets for commercially managed honeybee colonies may be adversely influenced by various pollens which foraging bees bring to the hive. To alleviate this problem, some scientists have conducted experiments in insect proof enclosures to prevent bees gaining access to food sources that may adversely influence the outcomes of the research. There are other examples of factors that can influence experiments. Studies on EFB in beehives may be somewhat hindered because it is not possible to guarantee that the disease will occur in an apiary in any given year. Attempts to get around this problem by inoculating colonies with M. pluton have met with little success and no reliable inoculation method had been developed. Laboratory reared larvae have been used in studies of the honey bee brood diseases, chalkbrood and American foulbrood. However at the time of writing, there were no published reports indicating that laboratory reared larvae have been used in EFB studies. Peng et al. (1992) developed a method for rearing larvae in American Foulbrood disease studies. They used a basic larval diet (BLD) that contained protein (10.5%), solids (22%) and had a physical consistency to maintain moisture content while placed in incubation. The consistency enabled larvae to float on the BLD without drowning. This reduced the likelihood of mechanical damage that might have resulted from excessive handling and feeding of the larvae.
Objectives To develop a method for the laboratory rearing of honey bee larvae and their inoculation with M. pluton for future studies of potential EFB control measures.
Outcomes • Newly hatched honey bee larvae were successfully reared in the laboratory using the diet
developed by Peng et al. Larvae were reared from the age of less than 24 hours to the stage of defecation and prior to pupation.
• Laboratory reared larvae were successfully inoculated with M. pluton and they exhibited EFB disease signs identical to those of naturally infected larvae. The mortality of individual larvae increased with the dose of M. pluton.
• At all times, larvae were given a supply of food surplus to their requirements. Despite this, larvae died due to infection with M. pluton. This finding seems contrary to the suggestion of Bailey and Ball (1991) that larvae infected with M. pluton primarily die because of the inability of nurse bees to adequately feed individual larvae.
Conclusion The successful of rearing of honey bee larvae in the laboratory and their inoculation with M. pluton will enable fully controlled experiments to be conducted without the unwanted influences experienced in field trials. Such laboratory studies may include the effect of nutrition and other potential treatments for the control of EFB. In comparison to field trials, investigations involving laboratory reared larvae will deliver results more quickly and at less cost.
21
9. A survey of apiarists’ use of oxytetracycline hydrochloride and management of European foulbrood
The survey comprised the following two questionnaires: 1. apiarists’ use of oxytetracycline hydrochloride (OTC) 2. non-antibiotic management of European Foulbrood disease. The questionnaires were mailed during winter 1999 to 190 Victorian apiarists who owned 100 or more hives. In addition, the Australian Honey Bee Industry Council kindly arranged for copies of the two questionnaires to be distributed to selected Tasmanian apiarists in spring 1999. Information obtained from the Victorian and Tasmanian responses was collated on an individual State basis and is presented in the following pages.
22
Department of Natural Resources and Environment A SURVEY OF APIARISTS’ USE OF OXYTETRACYCLINE (OTC)
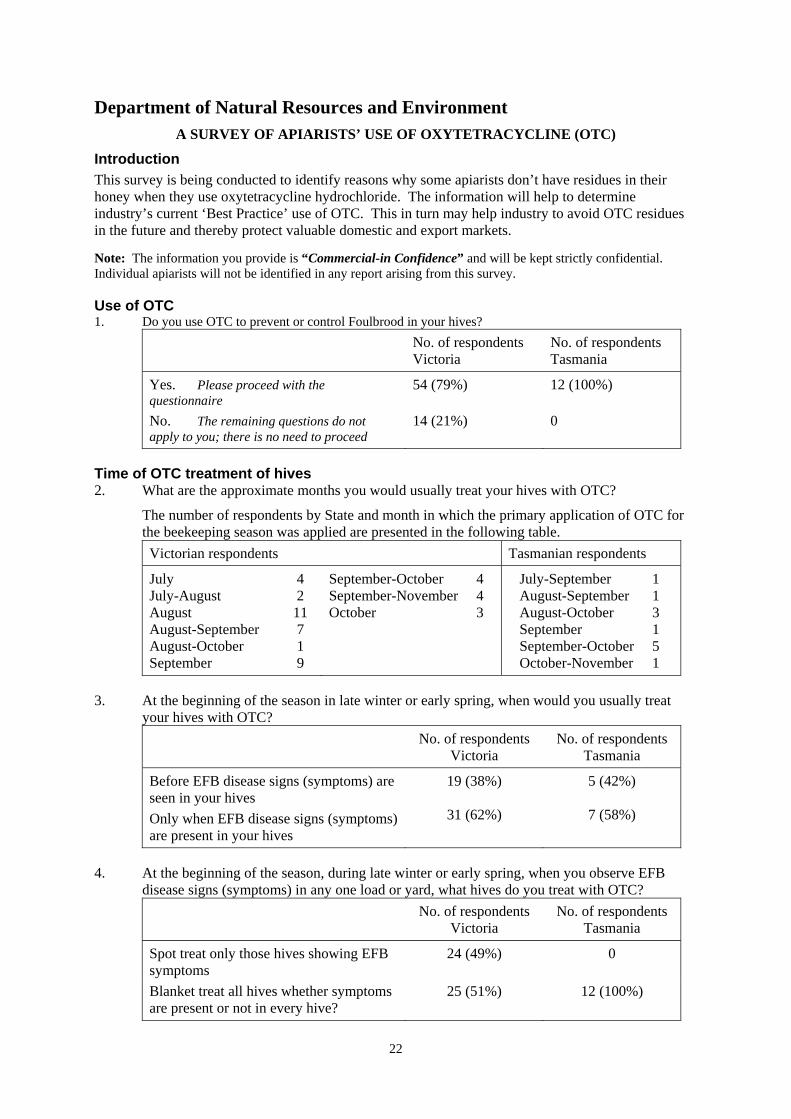
Introduction This survey is being conducted to identify reasons why some apiarists don’t have residues in their honey when they use oxytetracycline hydrochloride. The information will help to determine industry’s current ‘Best Practice’ use of OTC. This in turn may help industry to avoid OTC residues in the future and thereby protect valuable domestic and export markets.
Note: The information you provide is “Commercial-in Confidence” and will be kept strictly confidential. Individual apiarists will not be identified in any report arising from this survey.
Use of OTC 1. Do you use OTC to prevent or control Foulbrood in your hives?
No. of respondents Victoria
No. of respondents Tasmania
Yes. Please proceed with the questionnaire
54 (79%) 12 (100%)
No. The remaining questions do not apply to you; there is no need to proceed
14 (21%) 0
Time of OTC treatment of hives 2. What are the approximate months you would usually treat your hives with OTC?
The number of respondents by State and month in which the primary application of OTC for the beekeeping season was applied are presented in the following table. Victorian respondents Tasmanian respondents
July 4 July-August 2 August 11 August-September 7 August-October 1 September 9
September-October 4 September-November 4 October 3
July-September 1 August-September 1 August-October 3 September 1 September-October 5 October-November 1
3. At the beginning of the season in late winter or early spring, when would you usually treat your hives with OTC? No. of respondents
Victoria No. of respondents
Tasmania
Before EFB disease signs (symptoms) are seen in your hives
19 (38%) 5 (42%)
Only when EFB disease signs (symptoms) are present in your hives
31 (62%) 7 (58%)
4. At the beginning of the season, during late winter or early spring, when you observe EFB disease signs (symptoms) in any one load or yard, what hives do you treat with OTC? No. of respondents
Victoria No. of respondents
Tasmania
Spot treat only those hives showing EFB symptoms
24 (49%) 0
Blanket treat all hives whether symptoms are present or not in every hive?
25 (51%) 12 (100%)

23
5. What is the approximate average period of time from date of treatment of hives at the beginning of the season in late winter or early spring to the first extraction of honey?
The number of respondents by State and period (weeks) between treatment of hives and first extraction of honey are presented in the following table. Victorian respondents Tasmanian respondents
4-8 weeks 1 5-6 weeks 2 6 weeks 6 6-7 weeks 1 6-8 weeks 4 6-9 weeks 1 7 weeks 2 7-8 weeks 1 7-10 weeks 1 7-17 weeks 1
8 weeks 9 8-10 weeks 5 10-12 weeks 1 11 weeks 1 12 weeks 3 12-16 weeks 1 15-20 weeks 1 16 weeks 2 16+ weeks 1
7 weeks 1 8 weeks 1 8-10 weeks 3 12 weeks 3 16 weeks 1 18 weeks 1
6. When there is a need to treat hives with OTC at any other time of the year (that is, apart from late winter or early spring) what hives do you treat? No. of respondents
Victoria No. of respondents
Tasmania
Spot treat only those hives showing EFB symptoms
45 (94%) 10 (100%)
Blanket treat all hives whether symptoms are present or not in every hive?
5 (6%) 0
Method of feeding OTC 7. When you treated your hives with OTC in late winter or spring did you apply the antibiotic in
a single feed or did you divide the dose and apply it over three feeds? No. of respondents
Victoria No. of respondents
Tasmania
One feed - single dose 39 (83%) 3 (25%) Three feeds - multiple dose 8 (17%) 9 (75%)
8. How did you feed OTC to your hives? No. of respondents
Victoria No. of respondents
Tasmania
Liquid - wet treatment Go to question 9 16 (31%) 1 (8%) Powder - dry treatment Go to question 14 34 (65%) 11 (92%) In pollen supplement Go to question 18 1 (2%) 0 In a patty Go to question 18 1 (2%) 0
Feeding OTC in liquid ‘wet treatment’ form 9. How did you mix and apply OTC as a liquid “wet treatment”?
No. of respondents Victoria
No. of respondents Tasmania
Dissolved in sugar syrup 12 (75%) 1 (100%) Dissolved in water 4 (25%) 0
24
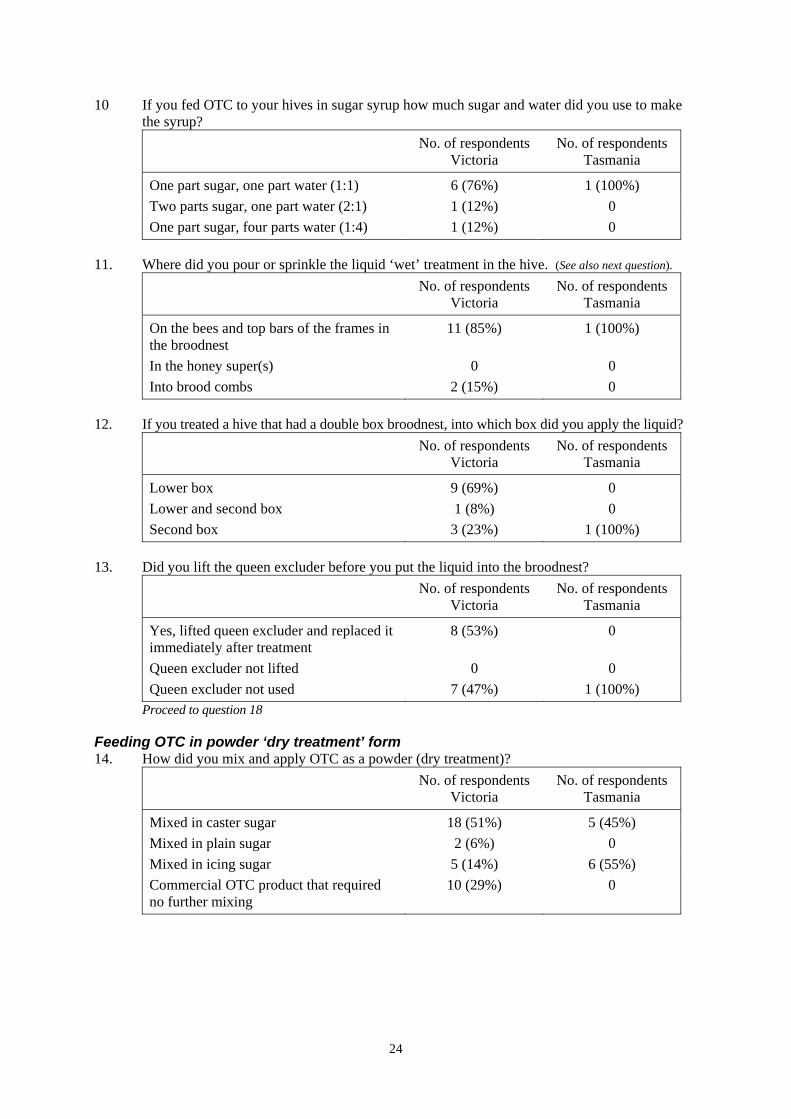
10 If you fed OTC to your hives in sugar syrup how much sugar and water did you use to make the syrup? No. of respondents
Victoria No. of respondents
Tasmania
One part sugar, one part water (1:1) 6 (76%) 1 (100%) Two parts sugar, one part water (2:1) 1 (12%) 0 One part sugar, four parts water (1:4) 1 (12%) 0
11. Where did you pour or sprinkle the liquid ‘wet’ treatment in the hive. (See also next question). No. of respondents
Victoria No. of respondents
Tasmania
On the bees and top bars of the frames in the broodnest
11 (85%) 1 (100%)
In the honey super(s) 0 0 Into brood combs 2 (15%) 0
12. If you treated a hive that had a double box broodnest, into which box did you apply the liquid? No. of respondents
Victoria No. of respondents
Tasmania
Lower box 9 (69%) 0 Lower and second box 1 (8%) 0 Second box 3 (23%) 1 (100%)
13. Did you lift the queen excluder before you put the liquid into the broodnest? No. of respondents
Victoria No. of respondents
Tasmania
Yes, lifted queen excluder and replaced it immediately after treatment
8 (53%) 0
Queen excluder not lifted 0 0 Queen excluder not used 7 (47%) 1 (100%)
Proceed to question 18
Feeding OTC in powder ‘dry treatment’ form 14. How did you mix and apply OTC as a powder (dry treatment)?
No. of respondents Victoria
No. of respondents Tasmania
Mixed in caster sugar 18 (51%) 5 (45%) Mixed in plain sugar 2 (6%) 0 Mixed in icing sugar 5 (14%) 6 (55%) Commercial OTC product that required no further mixing
10 (29%) 0
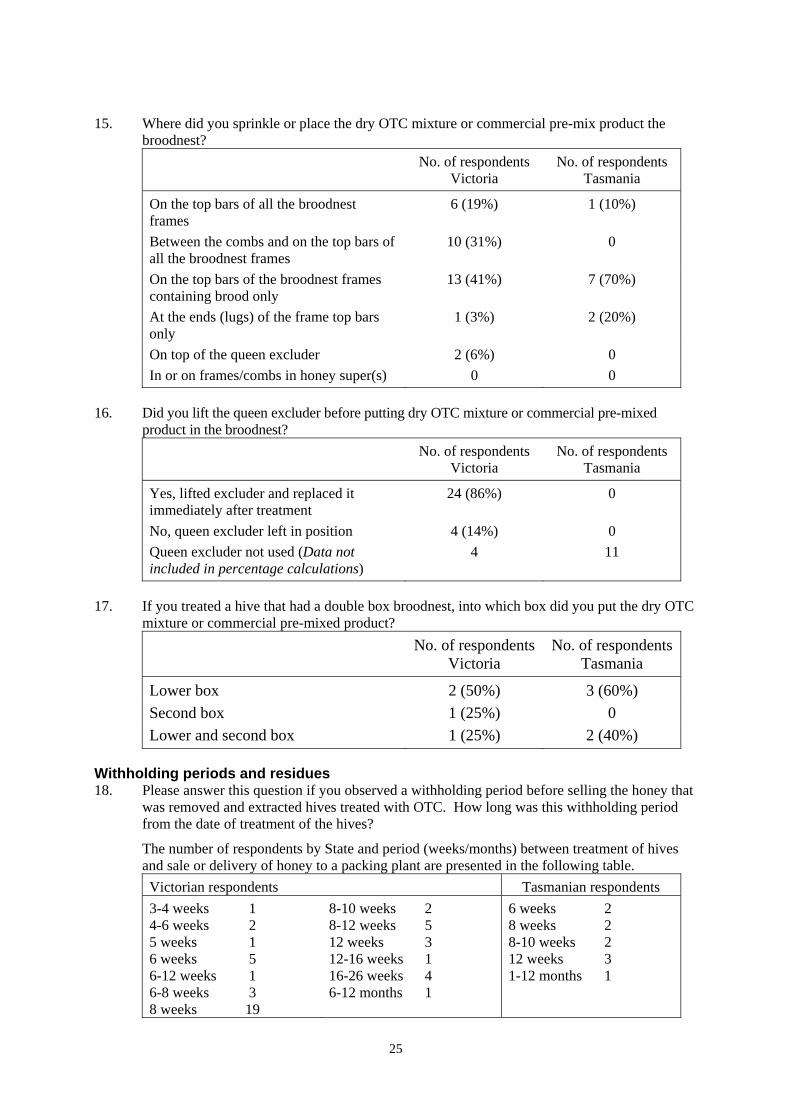
25
15. Where did you sprinkle or place the dry OTC mixture or commercial pre-mix product the broodnest? No. of respondents
Victoria No. of respondents
Tasmania
On the top bars of all the broodnest frames
6 (19%) 1 (10%)
Between the combs and on the top bars of all the broodnest frames
10 (31%) 0
On the top bars of the broodnest frames containing brood only
13 (41%) 7 (70%)
At the ends (lugs) of the frame top bars only
1 (3%) 2 (20%)
On top of the queen excluder 2 (6%) 0 In or on frames/combs in honey super(s) 0 0
16. Did you lift the queen excluder before putting dry OTC mixture or commercial pre-mixed product in the broodnest? No. of respondents
Victoria No. of respondents
Tasmania
Yes, lifted excluder and replaced it immediately after treatment
24 (86%) 0
No, queen excluder left in position 4 (14%) 0 Queen excluder not used (Data not included in percentage calculations)
4 11
17. If you treated a hive that had a double box broodnest, into which box did you put the dry OTC mixture or commercial pre-mixed product? No. of respondents
Victoria No. of respondents
Tasmania
Lower box 2 (50%) 3 (60%) Second box 1 (25%) 0 Lower and second box 1 (25%) 2 (40%)
Withholding periods and residues 18. Please answer this question if you observed a withholding period before selling the honey that
was removed and extracted hives treated with OTC. How long was this withholding period from the date of treatment of the hives?
The number of respondents by State and period (weeks/months) between treatment of hives and sale or delivery of honey to a packing plant are presented in the following table. Victorian respondents Tasmanian respondents 3-4 weeks 1 4-6 weeks 2 5 weeks 1 6 weeks 5 6-12 weeks 1 6-8 weeks 3 8 weeks 19
8-10 weeks 2 8-12 weeks 5 12 weeks 3 12-16 weeks 1 16-26 weeks 4 6-12 months 1
6 weeks 2 8 weeks 2 8-10 weeks 2 12 weeks 3 1-12 months 1

26
Department of Natural Resources and Environment A SURVEY OF EUROPEAN FOULBROOD DISEASE
Introduction This survey is designed to gather information that may provide a better understanding of European Foulbrood disease (EFB). We hope the information will help to explain:
• why EFB is more prevalent in Victoria than in other Australian States • possible links between EFB, honeybee nutrition and various pollen plants • how EFB can be a better controlled without using oxtetracycline (OTC).
Note: The information you provide is “Commercial-in Confidence” and will be kept strictly confidential. Individual apiarists will not be identified in any report arising from this survey.
Total number of respondents No. of respondents
Victoria No. of respondents
Tasmania
EFB disease signs present in one or more hives managed by respondent
58 (94%) 9 (90%)
No EFB disease signs present in one or more hives managed by respondent
4 (6%) 1 (10%)
Frequency of EFB outbreaks 1. In which years did you find disease signs (symptoms) of EFB in any of your hives? (You may
tick one or more boxes). No. of respondents
Victoria No. of respondents
Tasmania 1999-2000 (this season) 38 5 1998-99 (last season) 47 5 1997-98 43 5 1996-97 44 6 1995-96 47 6 No EFB in any of these years 4 1
2. What month of the beekeeping season do you usually observe the first symptoms of EFB? No. of respondents
Victoria No. of respondents
Tasmania
July 3 (5%) 0 August 17 (30%) 3 (33%) September 24 (42%) 6 (67%) October 11 (19%) 0 November 1 (2%) 0 February 1 (2%) 0

27
Location of apiary site and pollen/nectar flora targeted by bees 3. In what district was the apiary site that you used for pollen and nectar in the autumn prior to
the spring outbreak of EFB?
Respondents indicated the following districts: Arnold, Avoca, Baringhup, Barkly, Bealiba, Beechworth, Benalla, Bendigo, Blackwood, Broadford, Bullarto, Castlemaine, Chiltern, Cowwarr, Daylesford, Big and Little Desert, Echuca, Edenhope, Eldorado, South and East Gippsland, Goulburn Valley, Lower Goulburn Valley, Grampians, Heathcote, Henty, Howlong, Inglewood, Kingower, Lakes Entrance, Landsborough, Mt Cole, Mafeking, Menindee, Mildura, Mornington Peninsular, Muckleford, Mudgegonga, Nhill, Nyah, Red Cliffs, Rheola, Rushworth, Skipton, Smeaton, St Arnaud, St Leonards, Stawell, Swan Hill, Tarnagulla, Tatong, Tawonga, Trentham, Tooan, Wangaratta, Wedderburn, Wehla and Yarram
Figure 1. - Districts in which respondents’ apiary sites were located during the autumn prior to the spring outbreak of EFB.
Nectar and pollen flora targeted by bees in autumn prior to the spring outbreak of EFB
Victoria Tasmania
Apple Box 4 Banksia 3 Black Box 2 Blue Mallee 5 Flatweed 6 Gorse 2 Grey Box 16 Red Ironbark 5 Longleaf Box 2 Manna Gum 4
np*
np np np np np np n np np
Mallee 1 Messmate 5 Prickly Moses 1 Red Stringybark 1 Silver Banksia 1 Sugar Gum 1 Stringybark 4 Swamp Gum 1 Tea Tree 1
n np n np np np np np n
Leatherwood 6 Prickly box 1 Stringybark 1 Banksia 1 Snow gum* 1
np
One respondent indicated no incidence of EFB when bees were foraging on Capeweed. * n = nectar; p = pollen
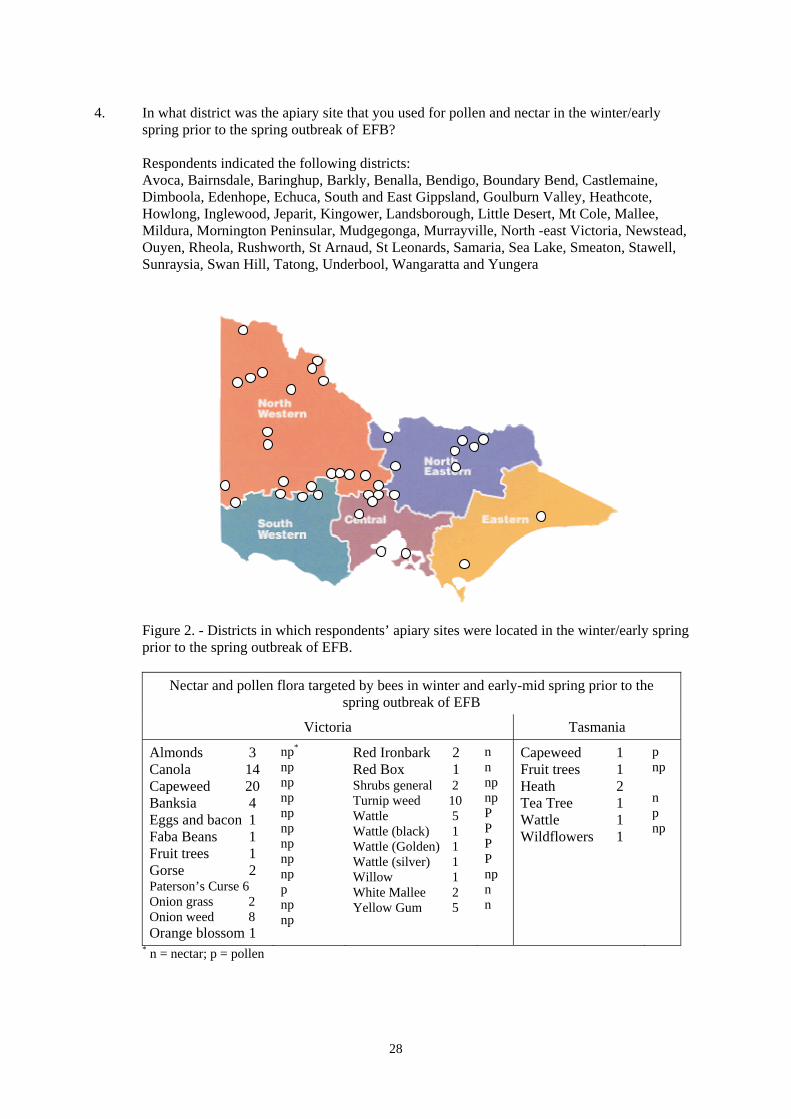
28
4. In what district was the apiary site that you used for pollen and nectar in the winter/early spring prior to the spring outbreak of EFB? Respondents indicated the following districts: Avoca, Bairnsdale, Baringhup, Barkly, Benalla, Bendigo, Boundary Bend, Castlemaine, Dimboola, Edenhope, Echuca, South and East Gippsland, Goulburn Valley, Heathcote, Howlong, Inglewood, Jeparit, Kingower, Landsborough, Little Desert, Mt Cole, Mallee, Mildura, Mornington Peninsular, Mudgegonga, Murrayville, North -east Victoria, Newstead, Ouyen, Rheola, Rushworth, St Arnaud, St Leonards, Samaria, Sea Lake, Smeaton, Stawell, Sunraysia, Swan Hill, Tatong, Underbool, Wangaratta and Yungera
Figure 2. - Districts in which respondents’ apiary sites were located in the winter/early spring prior to the spring outbreak of EFB.
Nectar and pollen flora targeted by bees in winter and early-mid spring prior to the
spring outbreak of EFB
Victoria Tasmania
Almonds 3 Canola 14 Capeweed 20 Banksia 4 Eggs and bacon 1 Faba Beans 1 Fruit trees 1 Gorse 2 Paterson’s Curse 6 Onion grass 2 Onion weed 8 Orange blossom 1
np* np np np np np np np np p np np
Red Ironbark 2 Red Box 1 Shrubs general 2 Turnip weed 10 Wattle 5 Wattle (black) 1 Wattle (Golden) 1 Wattle (silver) 1 Willow 1 White Mallee 2 Yellow Gum 5
n n np np P P P P np n n
Capeweed 1 Fruit trees 1 Heath 2 Tea Tree 1 Wattle 1 Wildflowers 1
p np n p np
* n = nectar; p = pollen
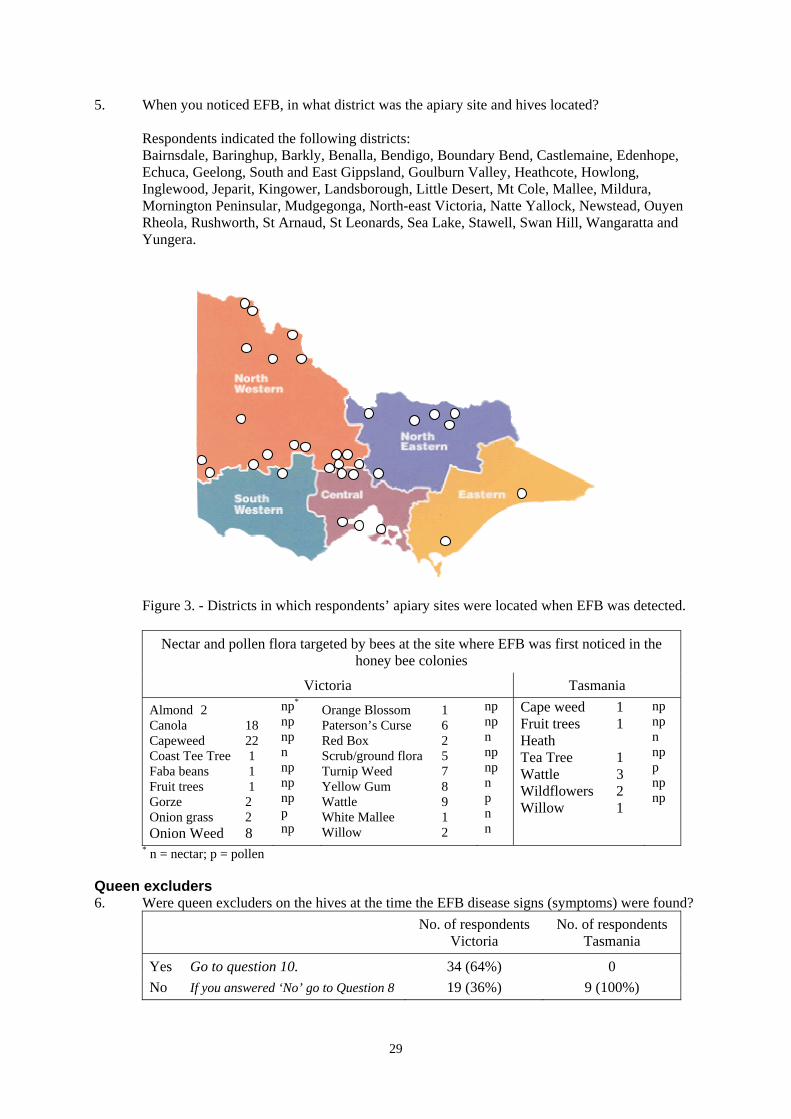
29
5. When you noticed EFB, in what district was the apiary site and hives located?
Respondents indicated the following districts: Bairnsdale, Baringhup, Barkly, Benalla, Bendigo, Boundary Bend, Castlemaine, Edenhope, Echuca, Geelong, South and East Gippsland, Goulburn Valley, Heathcote, Howlong, Inglewood, Jeparit, Kingower, Landsborough, Little Desert, Mt Cole, Mallee, Mildura, Mornington Peninsular, Mudgegonga, North-east Victoria, Natte Yallock, Newstead, Ouyen Rheola, Rushworth, St Arnaud, St Leonards, Sea Lake, Stawell, Swan Hill, Wangaratta and Yungera.
Figure 3. - Districts in which respondents’ apiary sites were located when EFB was detected.
Nectar and pollen flora targeted by bees at the site where EFB was first noticed in the honey bee colonies
Victoria Tasmania
Almond 2 Canola 18 Capeweed 22 Coast Tee Tree 1 Faba beans 1 Fruit trees 1 Gorze 2 Onion grass 2 Onion Weed 8
np* np np n np np np p np
Orange Blossom 1 Paterson’s Curse 6 Red Box 2 Scrub/ground flora 5 Turnip Weed 7 Yellow Gum 8 Wattle 9 White Mallee 1 Willow 2
np np n np np n p n n
Cape weed 1 Fruit trees 1 Heath Tea Tree 1 Wattle 3 Wildflowers 2 Willow 1
np np n np p np np
* n = nectar; p = pollen
Queen excluders 6. Were queen excluders on the hives at the time the EFB disease signs (symptoms) were found?
No. of respondents Victoria
No. of respondents Tasmania
Yes Go to question 10. 34 (64%) 0 No If you answered ‘No’ go to Question 8 19 (36%) 9 (100%)
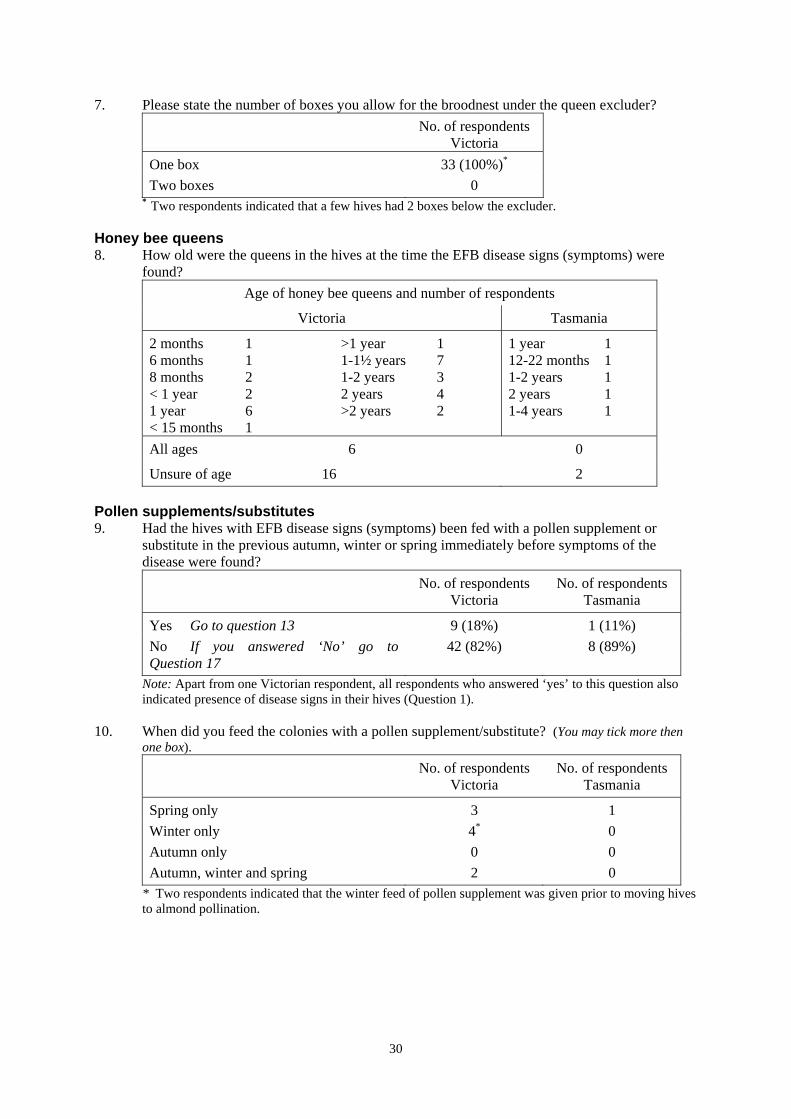
30
7. Please state the number of boxes you allow for the broodnest under the queen excluder? No. of respondents
Victoria One box 33 (100%)*
Two boxes 0 * Two respondents indicated that a few hives had 2 boxes below the excluder.
Honey bee queens 8. How old were the queens in the hives at the time the EFB disease signs (symptoms) were
found? Age of honey bee queens and number of respondents
Victoria Tasmania
2 months 1 6 months 1 8 months 2 < 1 year 2 1 year 6 < 15 months 1
>1 year 1 1-1½ years 7 1-2 years 3 2 years 4 >2 years 2
1 year 1 12-22 months 1 1-2 years 1 2 years 1 1-4 years 1
All ages 6 0
Unsure of age 16 2
Pollen supplements/substitutes 9. Had the hives with EFB disease signs (symptoms) been fed with a pollen supplement or
substitute in the previous autumn, winter or spring immediately before symptoms of the disease were found? No. of respondents
Victoria No. of respondents
Tasmania
Yes Go to question 13 9 (18%) 1 (11%) No If you answered ‘No’ go to Question 17
42 (82%) 8 (89%)
Note: Apart from one Victorian respondent, all respondents who answered ‘yes’ to this question also indicated presence of disease signs in their hives (Question 1).
10. When did you feed the colonies with a pollen supplement/substitute? (You may tick more then one box). No. of respondents
Victoria No. of respondents
Tasmania
Spring only 3 1 Winter only 4* 0 Autumn only 0 0 Autumn, winter and spring 2 0
* Two respondents indicated that the winter feed of pollen supplement was given prior to moving hives to almond pollination.
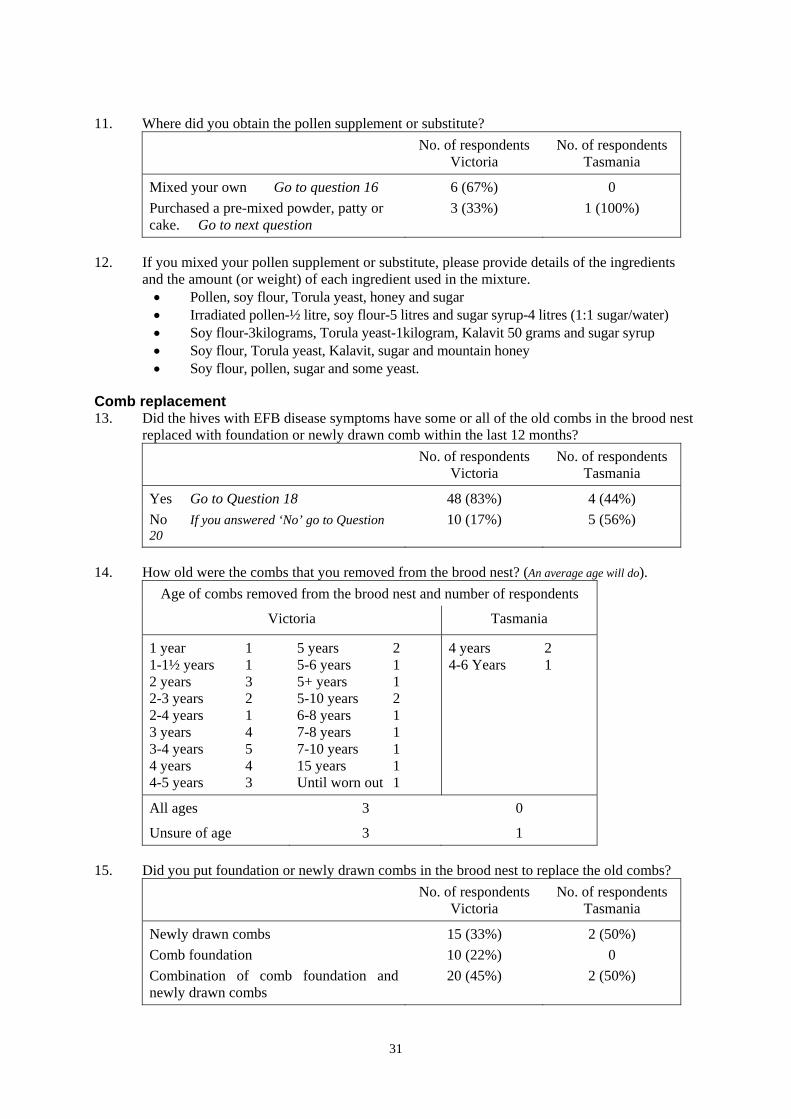
31
11. Where did you obtain the pollen supplement or substitute?
12. If you mixed your pollen supplement or substitute, please provide details of the ingredients and the amount (or weight) of each ingredient used in the mixture. • Pollen, soy flour, Torula yeast, honey and sugar • Irradiated pollen-½ litre, soy flour-5 litres and sugar syrup-4 litres (1:1 sugar/water) • Soy flour-3kilograms, Torula yeast-1kilogram, Kalavit 50 grams and sugar syrup • Soy flour, Torula yeast, Kalavit, sugar and mountain honey • Soy flour, pollen, sugar and some yeast.
Comb replacement 13. Did the hives with EFB disease symptoms have some or all of the old combs in the brood nest
replaced with foundation or newly drawn comb within the last 12 months? No. of respondents
Victoria No. of respondents
Tasmania
Yes Go to Question 18 48 (83%) 4 (44%) No If you answered ‘No’ go to Question 20
10 (17%) 5 (56%)
14. How old were the combs that you removed from the brood nest? (An average age will do). Age of combs removed from the brood nest and number of respondents
Victoria Tasmania
1 year 1 1-1½ years 1 2 years 3 2-3 years 2 2-4 years 1 3 years 4 3-4 years 5 4 years 4 4-5 years 3
5 years 2 5-6 years 1 5+ years 1 5-10 years 2 6-8 years 1 7-8 years 1 7-10 years 1 15 years 1 Until worn out 1
4 years 2 4-6 Years 1
All ages 3 0
Unsure of age 3 1
15. Did you put foundation or newly drawn combs in the brood nest to replace the old combs? No. of respondents
Victoria No. of respondents
Tasmania
Newly drawn combs 15 (33%) 2 (50%) Comb foundation 10 (22%) 0 Combination of comb foundation and newly drawn combs
20 (45%) 2 (50%)
No. of respondents Victoria
No. of respondents Tasmania
Mixed your own Go to question 16 6 (67%) 0 Purchased a pre-mixed powder, patty or cake. Go to next question
3 (33%) 1 (100%)
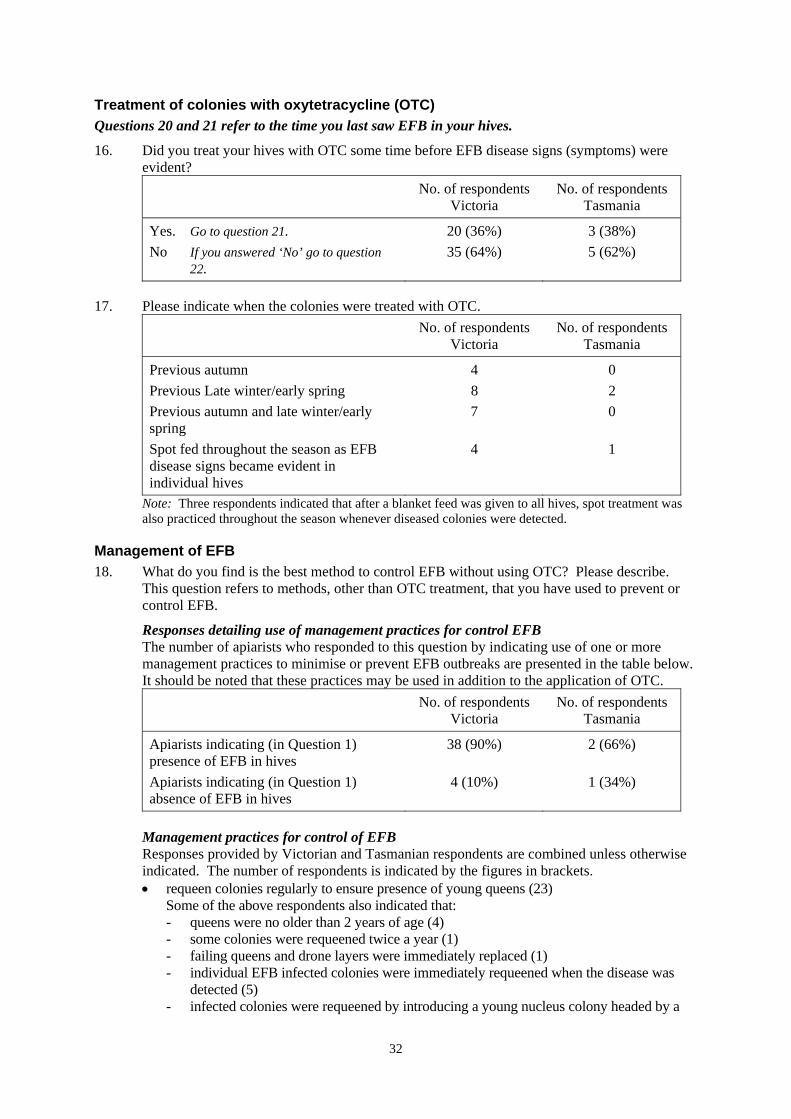
32
Treatment of colonies with oxytetracycline (OTC) Questions 20 and 21 refer to the time you last saw EFB in your hives.
16. Did you treat your hives with OTC some time before EFB disease signs (symptoms) were evident? No. of respondents
Victoria No. of respondents
Tasmania
Yes. Go to question 21. 20 (36%) 3 (38%) No If you answered ‘No’ go to question
22. 35 (64%) 5 (62%)
17. Please indicate when the colonies were treated with OTC. No. of respondents
Victoria No. of respondents
Tasmania
Previous autumn 4 0 Previous Late winter/early spring 8 2 Previous autumn and late winter/early spring
7 0
Spot fed throughout the season as EFB disease signs became evident in individual hives
4 1
Note: Three respondents indicated that after a blanket feed was given to all hives, spot treatment was also practiced throughout the season whenever diseased colonies were detected.
Management of EFB 18. What do you find is the best method to control EFB without using OTC? Please describe.
This question refers to methods, other than OTC treatment, that you have used to prevent or control EFB.
Responses detailing use of management practices for control EFB The number of apiarists who responded to this question by indicating use of one or more
management practices to minimise or prevent EFB outbreaks are presented in the table below. It should be noted that these practices may be used in addition to the application of OTC. No. of respondents
Victoria No. of respondents
Tasmania
Apiarists indicating (in Question 1) presence of EFB in hives
38 (90%) 2 (66%)
Apiarists indicating (in Question 1) absence of EFB in hives
4 (10%) 1 (34%)
Management practices for control of EFB Responses provided by Victorian and Tasmanian respondents are combined unless otherwise indicated. The number of respondents is indicated by the figures in brackets. • requeen colonies regularly to ensure presence of young queens (23)
Some of the above respondents also indicated that: - queens were no older than 2 years of age (4) - some colonies were requeened twice a year (1) - failing queens and drone layers were immediately replaced (1) - individual EFB infected colonies were immediately requeened when the disease was
detected (5) - infected colonies were requeened by introducing a young nucleus colony headed by a
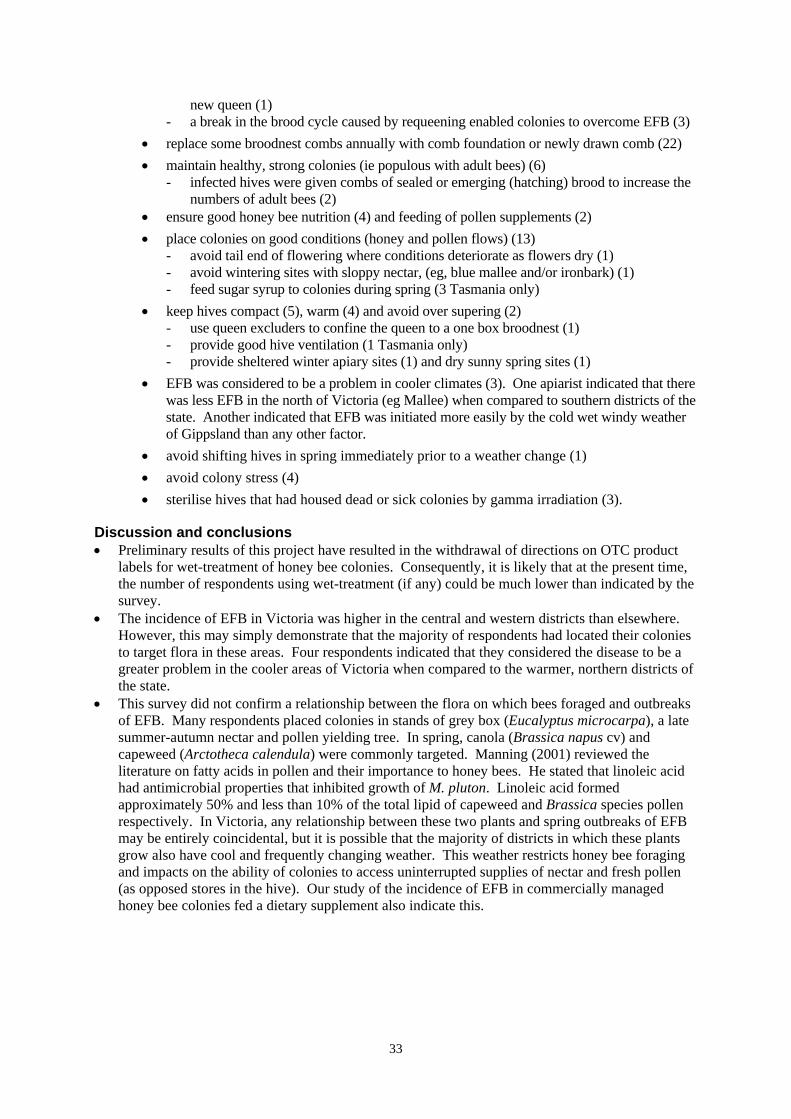
33
new queen (1) - a break in the brood cycle caused by requeening enabled colonies to overcome EFB (3)
• replace some broodnest combs annually with comb foundation or newly drawn comb (22) • maintain healthy, strong colonies (ie populous with adult bees) (6)
- infected hives were given combs of sealed or emerging (hatching) brood to increase the numbers of adult bees (2)
• ensure good honey bee nutrition (4) and feeding of pollen supplements (2) • place colonies on good conditions (honey and pollen flows) (13)
- avoid tail end of flowering where conditions deteriorate as flowers dry (1) - avoid wintering sites with sloppy nectar, (eg, blue mallee and/or ironbark) (1) - feed sugar syrup to colonies during spring (3 Tasmania only)
• keep hives compact (5), warm (4) and avoid over supering (2) - use queen excluders to confine the queen to a one box broodnest (1) - provide good hive ventilation (1 Tasmania only) - provide sheltered winter apiary sites (1) and dry sunny spring sites (1)
• EFB was considered to be a problem in cooler climates (3). One apiarist indicated that there was less EFB in the north of Victoria (eg Mallee) when compared to southern districts of the state. Another indicated that EFB was initiated more easily by the cold wet windy weather of Gippsland than any other factor.
• avoid shifting hives in spring immediately prior to a weather change (1) • avoid colony stress (4) • sterilise hives that had housed dead or sick colonies by gamma irradiation (3).
Discussion and conclusions • Preliminary results of this project have resulted in the withdrawal of directions on OTC product
labels for wet-treatment of honey bee colonies. Consequently, it is likely that at the present time, the number of respondents using wet-treatment (if any) could be much lower than indicated by the survey.
• The incidence of EFB in Victoria was higher in the central and western districts than elsewhere. However, this may simply demonstrate that the majority of respondents had located their colonies to target flora in these areas. Four respondents indicated that they considered the disease to be a greater problem in the cooler areas of Victoria when compared to the warmer, northern districts of the state.
• This survey did not confirm a relationship between the flora on which bees foraged and outbreaks of EFB. Many respondents placed colonies in stands of grey box (Eucalyptus microcarpa), a late summer-autumn nectar and pollen yielding tree. In spring, canola (Brassica napus cv) and capeweed (Arctotheca calendula) were commonly targeted. Manning (2001) reviewed the literature on fatty acids in pollen and their importance to honey bees. He stated that linoleic acid had antimicrobial properties that inhibited growth of M. pluton. Linoleic acid formed approximately 50% and less than 10% of the total lipid of capeweed and Brassica species pollen respectively. In Victoria, any relationship between these two plants and spring outbreaks of EFB may be entirely coincidental, but it is possible that the majority of districts in which these plants grow also have cool and frequently changing weather. This weather restricts honey bee foraging and impacts on the ability of colonies to access uninterrupted supplies of nectar and fresh pollen (as opposed stores in the hive). Our study of the incidence of EFB in commercially managed honey bee colonies fed a dietary supplement also indicate this.
34
Recommendations arising from the survey The research team recommends that: • OTC portion control packs containing a single hive dose be developed to ensure that colonies
receive the correct dose • scientific studies be conducted to determine the effect of:
- fatty acids on the incidence of EFB and their application to honey bee colonies to prevent -and/or control the disease
- feeding of protein supplements to improve nutrition and minimise the incidence of EFB under different field conditions
- inclement weather and restricted honey bee foraging for nectar and pollen on the incidence of EFB
- young honey bee queens on the incidence of EFB.

35
10. References Bailey L and Ball BV (1991) Honey bee pathology. Academic Press, London.
Delaplane KS (1997) Beekeeping medications and pesticides. American Bee Journal. 137(12), 859-861.
Delaplane KS and Lozano LF (1994) Using Terramycin® in honey bee colonies. American Bee Journal 134(4), 259-261.
Djordjevic SP, Noone K, Smith L and Hornitzky MAZ (1998) Development of a hemi-nested PCR assay for the specific detection of Melissococcus pluton. Journal of Apicultural Research 37(3), 165-174.
Goodman RD and Azuolas JK (1994) Oxytetracycline hydrochloride in Australian honey and the storage of oxytetracycline hydrochloride in beehives. A report produced for the Honeybee Research and Development Council.
Hornitzky MAZ and Smith L (1998) Procedures for the culture of Melissococcus pluton from diseased brood and bulk honey samples. Journal of Apicultural Research 37(4), 293-294.
Hornitzky MAZ and Smith L (1999) Sensitivity of Australian Melissococcus pluton isolates to oxytetracycline hydrochloride. Australian Journal of Experimental Agriculture 39(4), 881-883.
Manning R (2001) Fatty acids in pollen: a review of their importance for honey bees. Bee World 82(2), 60-75.
Peng CY, Mussen E, Fong A, Montague MA and Tyler T (1992) Effects of chlortetracycline of honey bee worker larvae reared in vitro. Journal of Invertebrate Pathology 60, 127-133.
partners in innovation
RIRDC
Level 1, AMA House 42 Macquarie Street Barton 2600
PO Box 4776 Kingston ACT 2604
Tel: 02 6272 4819 Fax: 02 6272 5877
Email: [email protected] Web: www.rirdc.gov.au
A beekeepers’ guide to understanding control measures for European Foulbrood
The antibiotic oxytetracycline hydrochloride (OTC) is used for the control of European foulbrood in all Australian states except Western Australia, but the potential for residues to remain in honey poses a serious threat to the honey’s future marketability.
This publication presents outcomes of investigations concerning the application of OTC to honey bee colonies, degradation of OTC in honey extracted from treated hives and efficacy of lower doses of OTC to control European foulbrood.
The report also discussed studies on Melissococcus pluton, the causal organism of the disease.
Publication No 04/091 RIRDC Project No DAV-157a

A b
eekeepers’ g
uid
e to u
nd
erstan
din
g co
ntro
l mea
sures fo
r Euro
pea
n Fo
ulb
roo
d
Pu
blicatio
n N
o 04/091