Embed Size (px)
Citation preview
UNDERSTANDING ECONOMIC CONDITIONS IN SEMINOLE COUNTY, FLORIDA
Andrew Pagano
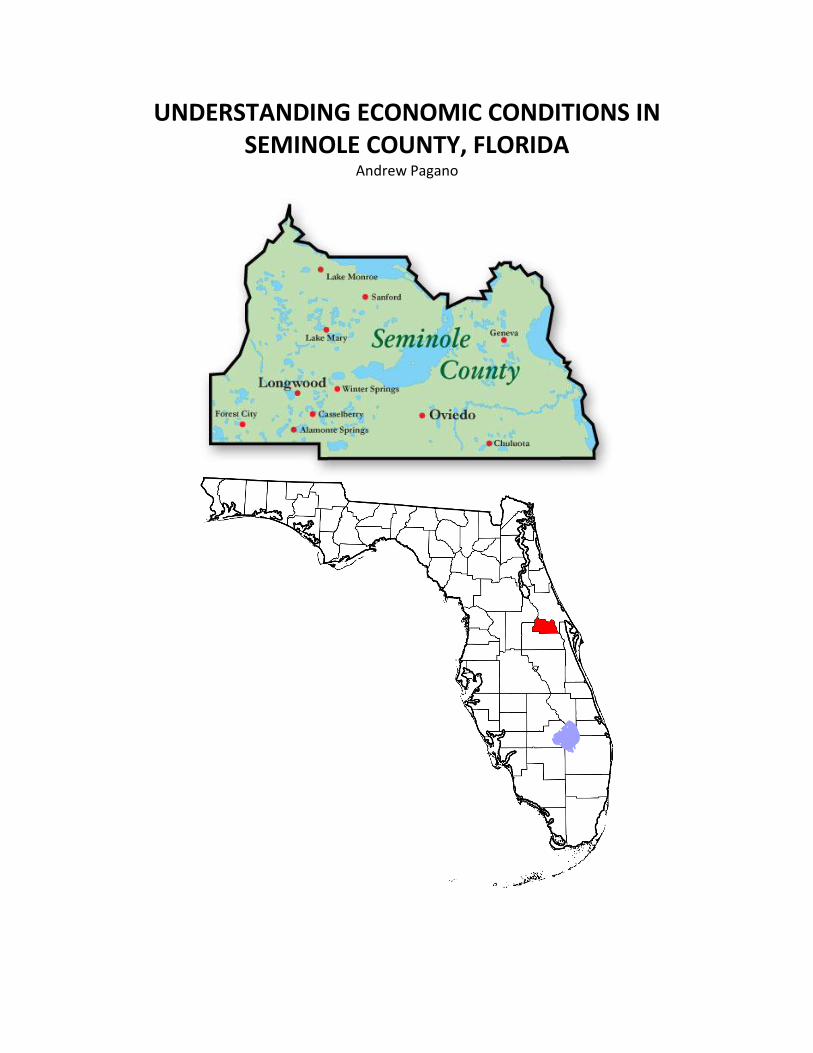
County Overview: Seminole County is located in the Central part of Florida, bordering Orange County, Volusia County, Lake County and Brevard County. There are 7 municipalities within the county which has 309 square miles of land area and 36 square miles of water area, making it the 4th smallest county in the state by land area and 3rd smallest by total area. In 2010, the total population of the county was 422,718, encompassing 2.25% of the 2010 total population in Florida. Seminole county resides within the Greater Orlando Metropolitan area containing a population of 2,134,411 in 2010, making it the third largest metropolitan area in Florida and fifth largest in the southeast. Furthering the scope, the Combined Statistical of this region is known as the Orlando–Deltona–Daytona Beach, Florida Combined Statistical Area, containing a population of 2,818,120 in 2010. The Gross Metropolitan product of The Greater Orlando region totaled around $101.2 Billion. The Greater Orlando Metropolitan Area is primarily known for its tourism industry and number of theme parks attracting millions of people from around the world every year. The best known attractions in the Greater metropolitan area include Walt Disney World, Universal Studios, SeaWorld and a few other smaller-scale theme parks. With the influx of the tourism industry, hotels, restaurants and multiple major shopping centers have followed with it. In the historical perspective, this region was primarily based in the citrus industry over the last 100 years, but has seen a steady decline over the last few decades since 1989 after a major winter freeze wiped out a large supply from the commercial citrus industry. Since then most of the major commercial citrus farmers and orange juice plants such as Cutrale Citrus Juices, Florida's Natural Growers and Minute Maid have moved operations the outer fringes of the metropolitan area. (FL CITRUS MTUTAL) Since World War II, Greater Orlando has
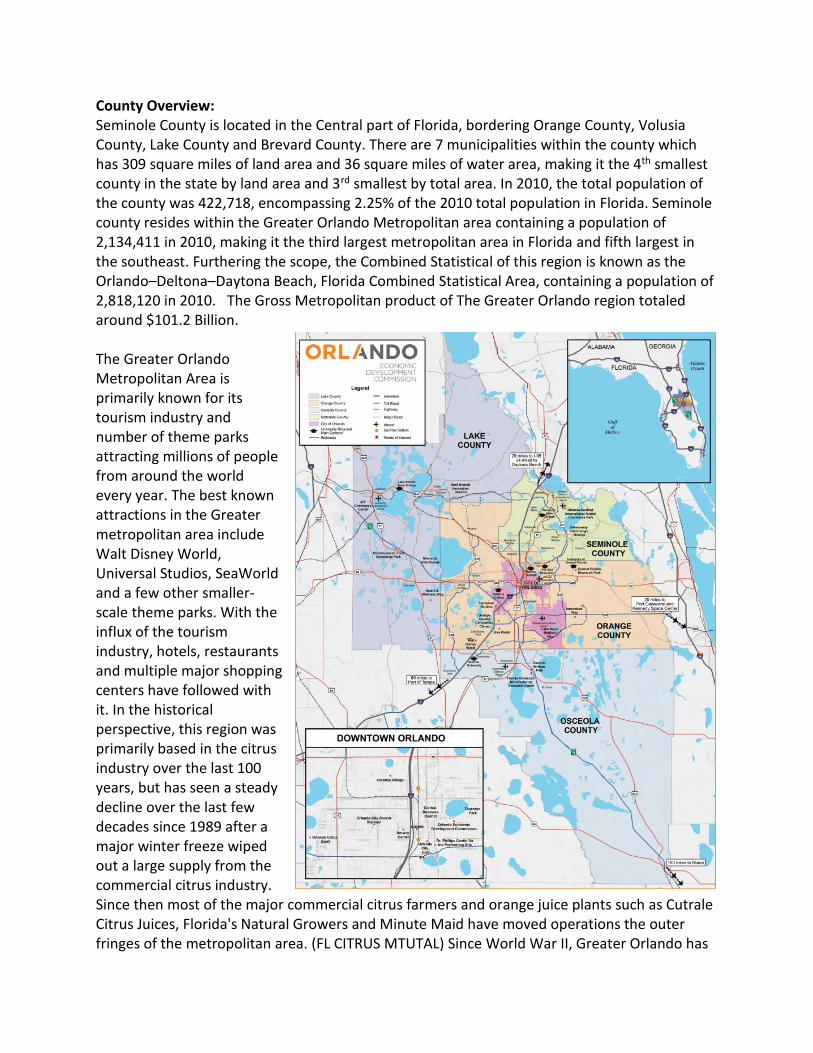
served as a major military and aerospace center, with the most prominent defense contractor being Lockheed Martin. In 1940 was the opening of McCoy air force base which eventually closed and now is known as Orlando International airport. Orlando International Airport (MCO) is ranked as number 4 among America’s best airports, with 17,017,491 passenger boardings in 2010 it is ranked as the 15th busiest airport in the United States. Within Seminole County, Orlando-Sanford Airport serving over two million passengers annually, (SFB) is ranked among the 100 busiest airports in the United States. Greater Orlando’s first major commuter rail system, Sunrail, stretches over 31 miles from Debary (In the northern Metro region) to near the Orlando International Airport (MCO). The second phase of the project is expected to extend an additional 30 miles further north into Volusia County and south into Osceola county with an expected addition of five more stations by 2016. All Aboard is a privately-funded rail project expected to serve passengers with a train connecting Orlando to Miami in 2017.
Though tourism has remained an enormous fixture within the Greater Orlando region, the economy has greatly diversified, becoming a primary powerhouse for the modeling, simulation and training (MS&T) industry and serving as a host for major hi-tech companies such as Oracle Corporation, Electronic Arts, and Siemens. Home to 60,000 Students, University of Central Florida is the second largest public university campus by enrollment and in 2006 established the UCF College of Medicine which has subsequently led to an increase in the targeting of biotechnology and life sciences industries, mainly clustered around the Lake Nona Medical City. (today.ucf.edu)
The primary employment sectors in Seminole county are Trade/Transportation/Utilities, encompassing 22.4% of the workforce, followed by Professional and Business services with 17.7% of the workforce in this sector and finally Education and Health Services with 11.7% of the workforce in this sector. The top 3 growing industries in the county are Professional Scientific and Technical Services with a 975 net job creation from 2010-2011, Accommodation and food services with a 701 net job creation from 2010-2011, Healthcare and Social assistance with a net job creation of 619 jobs from 2010-2011. (DOT.STATE.FL)
Several tools were used to analyze the scope and composition of the region’s industries and households in comparison to the nation as a whole. The first step of the analysis was location quotients, which were calculated to determine basic industries from supporting industries. The second step consisted of calculating the change within exporting industries versus the county level industry base to better understand how change within an exporting industry affects the county’s economy. Shift Share analysis determined the metrics of how the growth of a county’s industry compared to the growth to nation in general and compared the growth of industries nationally to the growth of county’s industries in order to determine how competitive the region is in particular industries compared to the nation in general. Additionally, the region’s largest employer, the retail trade industry, was examined in more depth using three-digit NAICS codes. Inequality within the county was measured by examining household income distributions and by calculating a Gini coefficient. Level of segregation in Seminole County at the municipal and census tract level was quantified by calculating dissimilarity indices. These various methods are useful in the planning process by helping to provide a better understanding of a region’s economic conditions. Finally, a quick Gravity Model analysis was performed to better plan for where to locate a New Materials Recovery Facility based on County Subdivision Centroid Points and the ton miles/cost associated with operating out of each County Subdivision. The Centroid with the lowest total miles ended up being a likely candidate for constructing thus type of facility as long as other major factors such as density or space permitted. LOCATION QUOTIENTS The export base for Seminole County was defined by using the indirect location quotient method, a method that utilized employment data from both the county and the nation as a whole. The two digit NAICS employment data was collected with the purpose of aggregating data for specific industries into categorized bins. Location quotient value is calculated by dividing the ratio of employment in a specific in industry to the total employment in the county by the ratio of employment in a specific industry nationally to total national employment. The location quotient was simply calculated by dividing the ratio of employment within a specific industry in Seminole county over the ratio of employment within that specific industry at the national level. As a result, this value helps determine the level of export employment in each industry and is displayed by a value that is either less than 1-- indicating a smaller share of employment within a region than in the nation as a whole, known as non-basic or values greater than 1--indicating the share of employment in this industry in the region is greater than the nation as a whole, known as basic. Industries considered non-basic are supportive or local
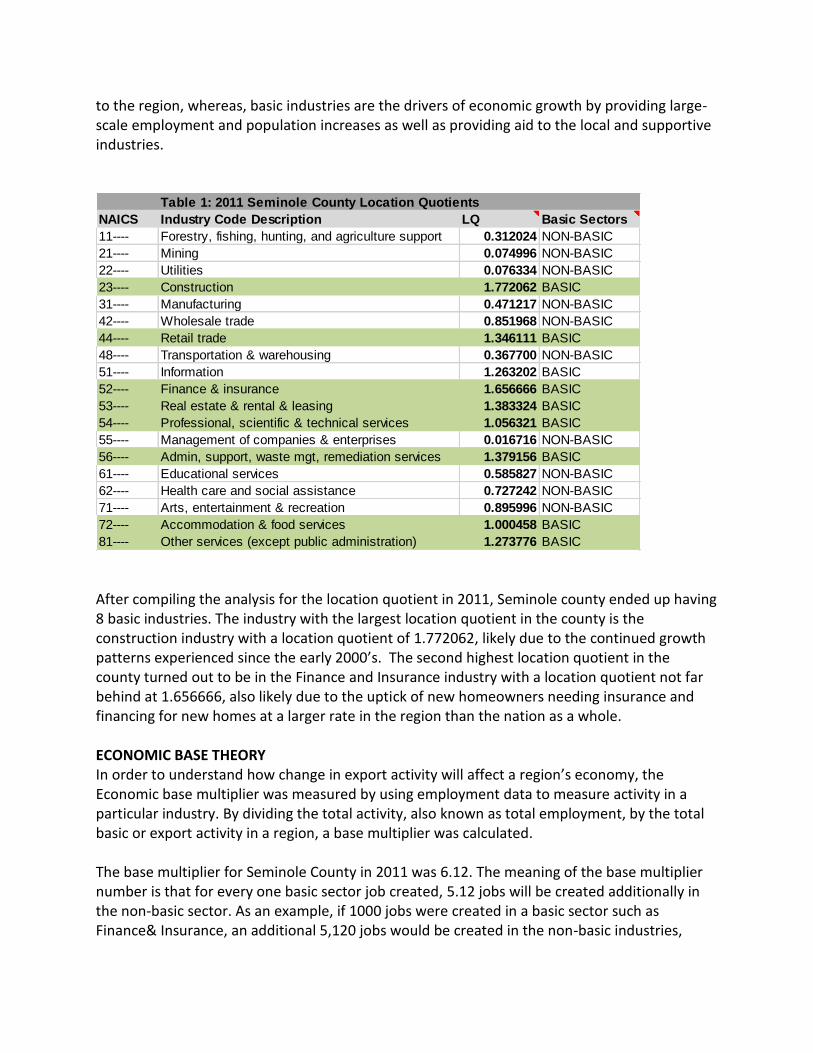
to the region, whereas, basic industries are the drivers of economic growth by providing large-scale employment and population increases as well as providing aid to the local and supportive industries.
After compiling the analysis for the location quotient in 2011, Seminole county ended up having 8 basic industries. The industry with the largest location quotient in the county is the construction industry with a location quotient of 1.772062, likely due to the continued growth patterns experienced since the early 2000’s. The second highest location quotient in the county turned out to be in the Finance and Insurance industry with a location quotient not far behind at 1.656666, also likely due to the uptick of new homeowners needing insurance and financing for new homes at a larger rate in the region than the nation as a whole. ECONOMIC BASE THEORY In order to understand how change in export activity will affect a region’s economy, the Economic base multiplier was measured by using employment data to measure activity in a particular industry. By dividing the total activity, also known as total employment, by the total basic or export activity in a region, a base multiplier was calculated. The base multiplier for Seminole County in 2011 was 6.12. The meaning of the base multiplier number is that for every one basic sector job created, 5.12 jobs will be created additionally in the non-basic sector. As an example, if 1000 jobs were created in a basic sector such as Finance& Insurance, an additional 5,120 jobs would be created in the non-basic industries,
Table 1: 2011 Seminole County Location Quotients
NAICS Industry Code Description LQ Basic Sectors
11---- Forestry, fishing, hunting, and agriculture support 0.312024 NON-BASIC
21---- Mining 0.074996 NON-BASIC
22---- Utilities 0.076334 NON-BASIC
23---- Construction 1.772062 BASIC
31---- Manufacturing 0.471217 NON-BASIC
42---- Wholesale trade 0.851968 NON-BASIC
44---- Retail trade 1.346111 BASIC
48---- Transportation & warehousing 0.367700 NON-BASIC
51---- Information 1.263202 BASIC
52---- Finance & insurance 1.656666 BASIC
53---- Real estate & rental & leasing 1.383324 BASIC
54---- Professional, scientific & technical services 1.056321 BASIC
55---- Management of companies & enterprises 0.016716 NON-BASIC
56---- Admin, support, waste mgt, remediation services 1.379156 BASIC
61---- Educational services 0.585827 NON-BASIC
62---- Health care and social assistance 0.727242 NON-BASIC
71---- Arts, entertainment & recreation 0.895996 NON-BASIC
72---- Accommodation & food services 1.000458 BASIC
81---- Other services (except public administration) 1.273776 BASIC
leaving a total of 6,210 jobs created in the county after all is said and done according to economic base theory.
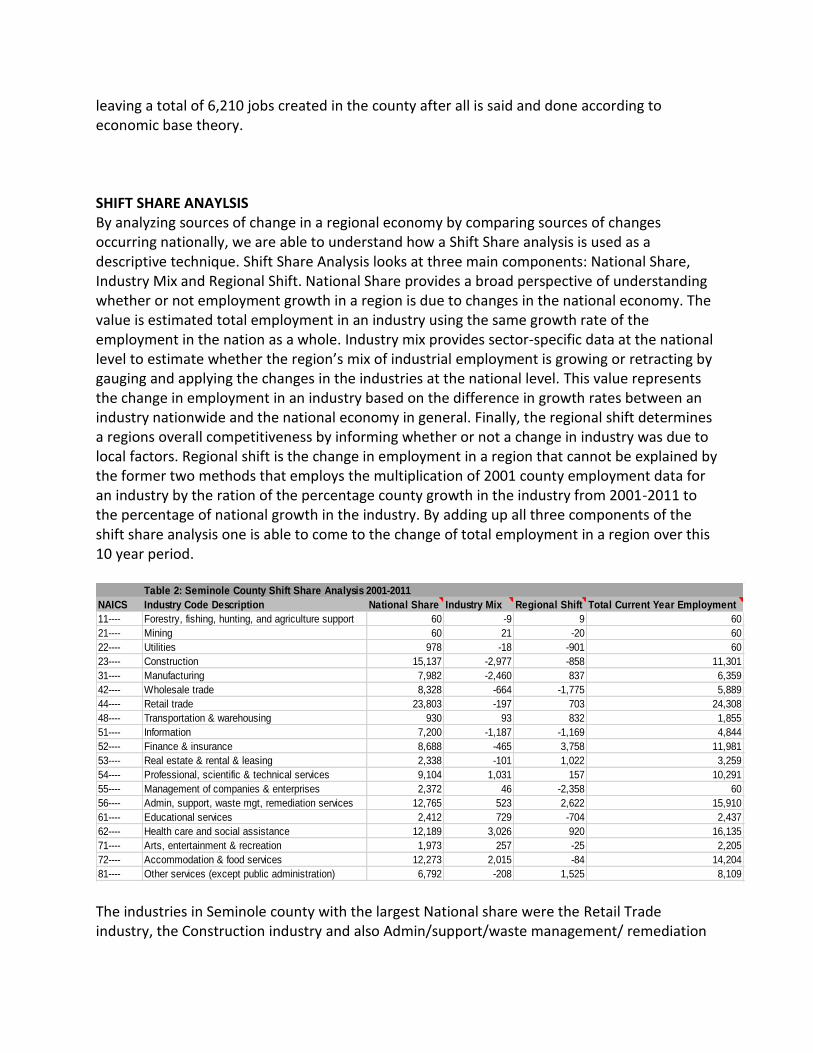
SHIFT SHARE ANAYLSIS By analyzing sources of change in a regional economy by comparing sources of changes occurring nationally, we are able to understand how a Shift Share analysis is used as a descriptive technique. Shift Share Analysis looks at three main components: National Share, Industry Mix and Regional Shift. National Share provides a broad perspective of understanding whether or not employment growth in a region is due to changes in the national economy. The value is estimated total employment in an industry using the same growth rate of the employment in the nation as a whole. Industry mix provides sector-specific data at the national level to estimate whether the region’s mix of industrial employment is growing or retracting by gauging and applying the changes in the industries at the national level. This value represents the change in employment in an industry based on the difference in growth rates between an industry nationwide and the national economy in general. Finally, the regional shift determines a regions overall competitiveness by informing whether or not a change in industry was due to local factors. Regional shift is the change in employment in a region that cannot be explained by the former two methods that employs the multiplication of 2001 county employment data for an industry by the ration of the percentage county growth in the industry from 2001-2011 to the percentage of national growth in the industry. By adding up all three components of the shift share analysis one is able to come to the change of total employment in a region over this 10 year period.
The industries in Seminole county with the largest National share were the Retail Trade industry, the Construction industry and also Admin/support/waste management/ remediation
Table 2: Seminole County Shift Share Analysis 2001-2011
NAICS Industry Code Description National Share Industry Mix Regional Shift Total Current Year Employment
11---- Forestry, fishing, hunting, and agriculture support 60 -9 9 60
21---- Mining 60 21 -20 60
22---- Utilities 978 -18 -901 60
23---- Construction 15,137 -2,977 -858 11,301
31---- Manufacturing 7,982 -2,460 837 6,359
42---- Wholesale trade 8,328 -664 -1,775 5,889
44---- Retail trade 23,803 -197 703 24,308
48---- Transportation & warehousing 930 93 832 1,855
51---- Information 7,200 -1,187 -1,169 4,844
52---- Finance & insurance 8,688 -465 3,758 11,981
53---- Real estate & rental & leasing 2,338 -101 1,022 3,259
54---- Professional, scientific & technical services 9,104 1,031 157 10,291
55---- Management of companies & enterprises 2,372 46 -2,358 60
56---- Admin, support, waste mgt, remediation services 12,765 523 2,622 15,910
61---- Educational services 2,412 729 -704 2,437
62---- Health care and social assistance 12,189 3,026 920 16,135
71---- Arts, entertainment & recreation 1,973 257 -25 2,205
72---- Accommodation & food services 12,273 2,015 -84 14,204
81---- Other services (except public administration) 6,792 -208 1,525 8,109
services, which also were the largest industries at the start of the time period in 2001. Retail trade had the largest national share with (23,803), followed by construction with ( 15,137) and Admin/support/waste management/ remediation services with (12, 765) as seen above in Table 2. The industries with the smallest national share were Mining with (60), Forestry/fishing/hunting/agricultural support with (60) and Transportation & Warehousing with (930). Industry Mix evaluated whether industry mixes were growing or retracting at the national level between 2001 and 2011. The following industries experienced growth at the national level: Mining, transportation & Warehousing, Professional, Scientific & Technical Services, Management of companies & enterprises, Admin/support/waste management/remediation services, Educational services, healthcare & Social assistance, Art/entertainment & recreation, accommodation & food services. Industries that experienced a retraction from 2001 to 2011 were: Forestry/fishing/hunting/agricultural support, utilities, construction, manufacturing, wholesale trade, retail trade, information, Finance & Insurance, Real estate & rental leasing and Other services (except public administration). The industry that experienced the most growth nationally during this period was Healthcare & Social Assistance (3,026) and the industry experiencing the most retraction in this period was construction (-2,977). Forestry/fishing/hunting/agricultural support was the industry experiencing the least change at the national level with a mere (-9) shift during this period. The region of central Florida can be defined as strong or weak within certain industries relative to the nation as whole with Regional Shift. Seminole County’s strongest industries are Finance & Insurance (3,758), Admin/support/waste management/remediation services (2,622) and other services (1,525). The weakest industries in the county relative to national outlook are Management of companies & enterprises (-2,358), Wholesale trade (-1,775) and Information (-1,169). Al of the data can be seen above in table 2. Finance & Insurance, Healthcare & Social Assistance and Admin/support/waste management/remediation services have done the best in the county, experiencing growth in the thousands for each industry from 2001 to 2011. Much of the Finance & Insurance growth has most likely been in part to a mixture of county-wide propensity of refinancing homes and the raising of insurance premiums after a decade of significant hurricane destruction within the county, contrasting the decline that occurred in the industry nationally. As expected, Healthcare & Social assistance grew significantly due to the national trend of growth, but in particular the growth rate in Seminole county has been slightly higher at almost a 33% growth since 2001 as compared to the nation’s almost 25% growth in the industry. This accelerated growth rate in healthcare may be in part due to the aging population of the county, but also may have much to do with the opening of UCF’s College of medicine in 2006, with much of the industry’s infrastructure and labor pool being developed further as a ripple effect, among other things. Admin/support/waste management/remediation services have grown significantly at an almost 25% rate as compared to the national scope of the industries slight growth of barely 4%. This particular industry’s growth in the county can be explained in part by the continuous demand for these services with population booms throughout the decade. It is a fact that this
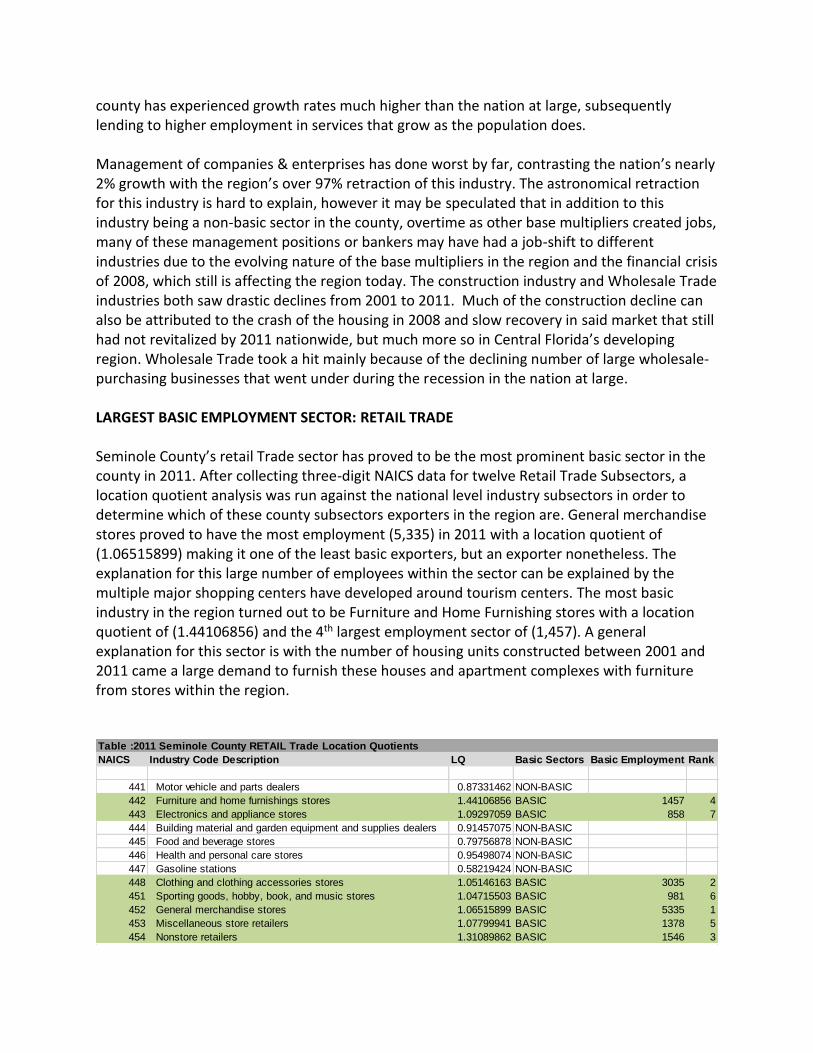
county has experienced growth rates much higher than the nation at large, subsequently lending to higher employment in services that grow as the population does. Management of companies & enterprises has done worst by far, contrasting the nation’s nearly 2% growth with the region’s over 97% retraction of this industry. The astronomical retraction for this industry is hard to explain, however it may be speculated that in addition to this industry being a non-basic sector in the county, overtime as other base multipliers created jobs, many of these management positions or bankers may have had a job-shift to different industries due to the evolving nature of the base multipliers in the region and the financial crisis of 2008, which still is affecting the region today. The construction industry and Wholesale Trade industries both saw drastic declines from 2001 to 2011. Much of the construction decline can also be attributed to the crash of the housing in 2008 and slow recovery in said market that still had not revitalized by 2011 nationwide, but much more so in Central Florida’s developing region. Wholesale Trade took a hit mainly because of the declining number of large wholesale-purchasing businesses that went under during the recession in the nation at large. LARGEST BASIC EMPLOYMENT SECTOR: RETAIL TRADE Seminole County’s retail Trade sector has proved to be the most prominent basic sector in the county in 2011. After collecting three-digit NAICS data for twelve Retail Trade Subsectors, a location quotient analysis was run against the national level industry subsectors in order to determine which of these county subsectors exporters in the region are. General merchandise stores proved to have the most employment (5,335) in 2011 with a location quotient of (1.06515899) making it one of the least basic exporters, but an exporter nonetheless. The explanation for this large number of employees within the sector can be explained by the multiple major shopping centers have developed around tourism centers. The most basic industry in the region turned out to be Furniture and Home Furnishing stores with a location quotient of (1.44106856) and the 4th largest employment sector of (1,457). A general explanation for this sector is with the number of housing units constructed between 2001 and 2011 came a large demand to furnish these houses and apartment complexes with furniture from stores within the region.
Table :2011 Seminole County RETAIL Trade Location Quotients
NAICS Industry Code Description LQ Basic Sectors Basic Employment 2011Rank
441 Motor vehicle and parts dealers 0.87331462 NON-BASIC
442 Furniture and home furnishings stores 1.44106856 BASIC 1457 4
443 Electronics and appliance stores 1.09297059 BASIC 858 7
444 Building material and garden equipment and supplies dealers 0.91457075 NON-BASIC
445 Food and beverage stores 0.79756878 NON-BASIC
446 Health and personal care stores 0.95498074 NON-BASIC
447 Gasoline stations 0.58219424 NON-BASIC
448 Clothing and clothing accessories stores 1.05146163 BASIC 3035 2
451 Sporting goods, hobby, book, and music stores 1.04715503 BASIC 981 6
452 General merchandise stores 1.06515899 BASIC 5335 1
453 Miscellaneous store retailers 1.07799941 BASIC 1378 5
454 Nonstore retailers 1.31089862 BASIC 1546 3
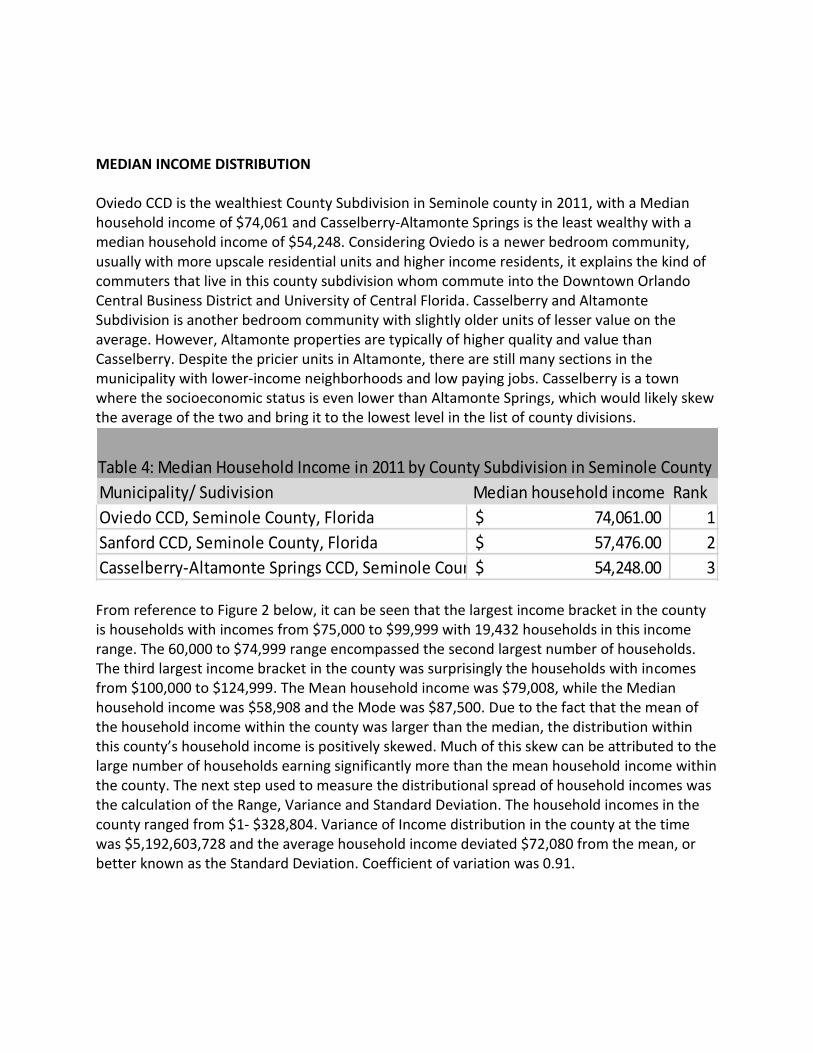
MEDIAN INCOME DISTRIBUTION Oviedo CCD is the wealthiest County Subdivision in Seminole county in 2011, with a Median household income of $74,061 and Casselberry-Altamonte Springs is the least wealthy with a median household income of $54,248. Considering Oviedo is a newer bedroom community, usually with more upscale residential units and higher income residents, it explains the kind of commuters that live in this county subdivision whom commute into the Downtown Orlando Central Business District and University of Central Florida. Casselberry and Altamonte Subdivision is another bedroom community with slightly older units of lesser value on the average. However, Altamonte properties are typically of higher quality and value than Casselberry. Despite the pricier units in Altamonte, there are still many sections in the municipality with lower-income neighborhoods and low paying jobs. Casselberry is a town where the socioeconomic status is even lower than Altamonte Springs, which would likely skew the average of the two and bring it to the lowest level in the list of county divisions.
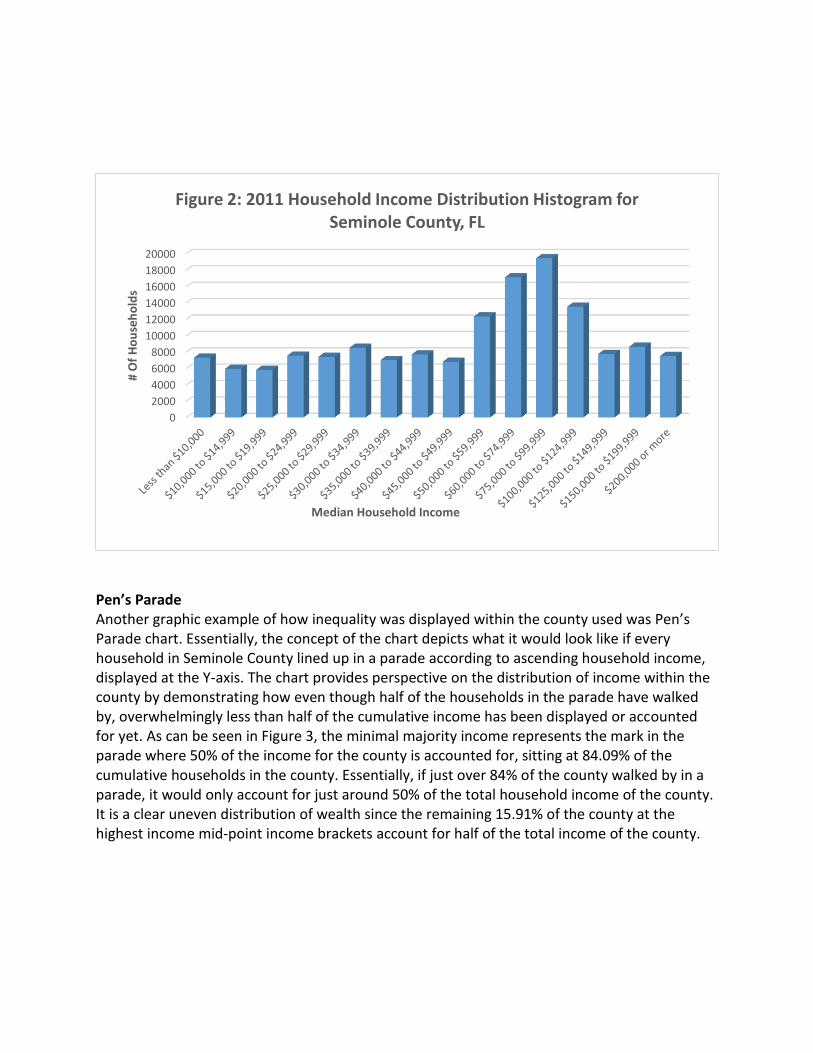
From reference to Figure 2 below, it can be seen that the largest income bracket in the county is households with incomes from $75,000 to $99,999 with 19,432 households in this income range. The 60,000 to $74,999 range encompassed the second largest number of households. The third largest income bracket in the county was surprisingly the households with incomes from $100,000 to $124,999. The Mean household income was $79,008, while the Median household income was $58,908 and the Mode was $87,500. Due to the fact that the mean of the household income within the county was larger than the median, the distribution within this county’s household income is positively skewed. Much of this skew can be attributed to the large number of households earning significantly more than the mean household income within the county. The next step used to measure the distributional spread of household incomes was the calculation of the Range, Variance and Standard Deviation. The household incomes in the county ranged from $1- $328,804. Variance of Income distribution in the county at the time was $5,192,603,728 and the average household income deviated $72,080 from the mean, or better known as the Standard Deviation. Coefficient of variation was 0.91.
Municipality/ Sudivision Median household income Rank
Oviedo CCD, Seminole County, Florida 74,061.00$ 1
Sanford CCD, Seminole County, Florida 57,476.00$ 2
Casselberry-Altamonte Springs CCD, Seminole County, Florida 54,248.00$ 3
Table 4: Median Household Income in 2011 by County Subdivision in Seminole County
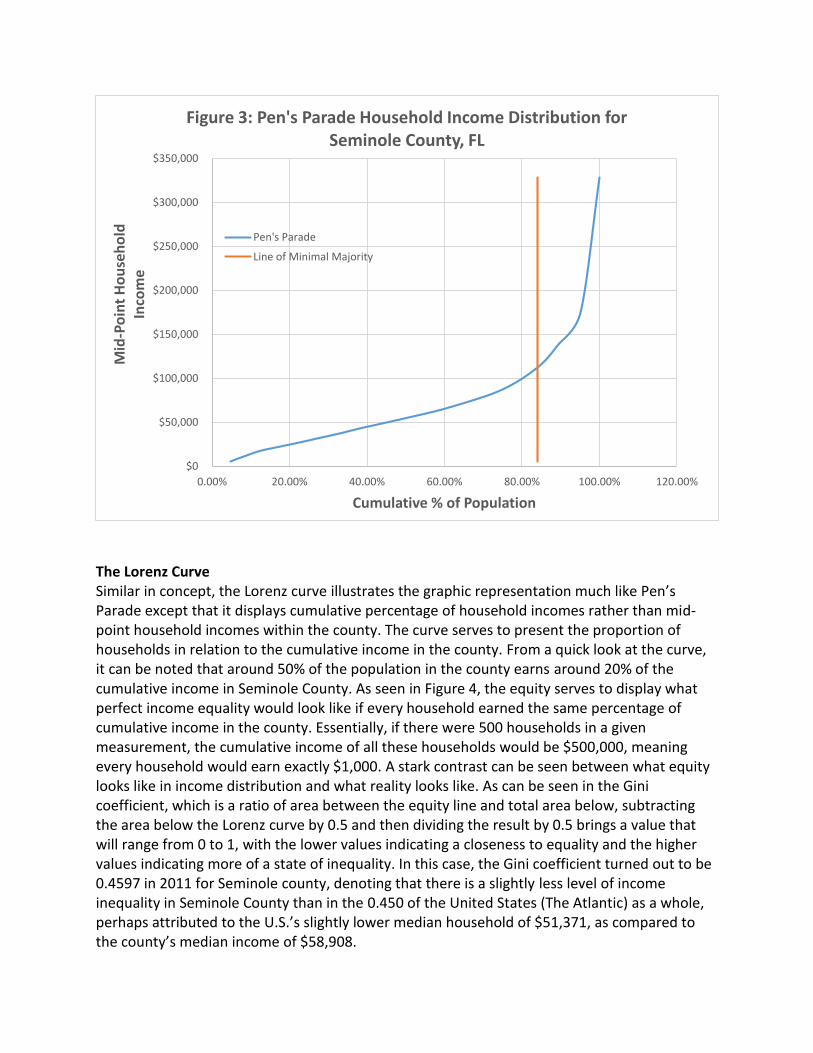
Pen’s Parade Another graphic example of how inequality was displayed within the county used was Pen’s Parade chart. Essentially, the concept of the chart depicts what it would look like if every household in Seminole County lined up in a parade according to ascending household income, displayed at the Y-axis. The chart provides perspective on the distribution of income within the county by demonstrating how even though half of the households in the parade have walked by, overwhelmingly less than half of the cumulative income has been displayed or accounted for yet. As can be seen in Figure 3, the minimal majority income represents the mark in the parade where 50% of the income for the county is accounted for, sitting at 84.09% of the cumulative households in the county. Essentially, if just over 84% of the county walked by in a parade, it would only account for just around 50% of the total household income of the county. It is a clear uneven distribution of wealth since the remaining 15.91% of the county at the highest income mid-point income brackets account for half of the total income of the county.
0
2000
4000
6000
8000
10000
12000
14000
16000
18000
20000
# O
f H
ou
seh
old
s
Median Household Income
Figure 2: 2011 Household Income Distribution Histogram for Seminole County, FL
The Lorenz Curve Similar in concept, the Lorenz curve illustrates the graphic representation much like Pen’s Parade except that it displays cumulative percentage of household incomes rather than mid-point household incomes within the county. The curve serves to present the proportion of households in relation to the cumulative income in the county. From a quick look at the curve, it can be noted that around 50% of the population in the county earns around 20% of the cumulative income in Seminole County. As seen in Figure 4, the equity serves to display what perfect income equality would look like if every household earned the same percentage of cumulative income in the county. Essentially, if there were 500 households in a given measurement, the cumulative income of all these households would be $500,000, meaning every household would earn exactly $1,000. A stark contrast can be seen between what equity looks like in income distribution and what reality looks like. As can be seen in the Gini coefficient, which is a ratio of area between the equity line and total area below, subtracting the area below the Lorenz curve by 0.5 and then dividing the result by 0.5 brings a value that will range from 0 to 1, with the lower values indicating a closeness to equality and the higher values indicating more of a state of inequality. In this case, the Gini coefficient turned out to be 0.4597 in 2011 for Seminole county, denoting that there is a slightly less level of income inequality in Seminole County than in the 0.450 of the United States (The Atlantic) as a whole, perhaps attributed to the U.S.’s slightly lower median household of $51,371, as compared to the county’s median income of $58,908.
$0
$50,000
$100,000
$150,000
$200,000
$250,000
$300,000
$350,000
0.00% 20.00% 40.00% 60.00% 80.00% 100.00% 120.00%
Mid
-Po
int
Ho
use
ho
ld
Inco
me
Cumulative % of Population
Figure 3: Pen's Parade Household Income Distribution for Seminole County, FL
Pen's Parade
Line of Minimal Majority
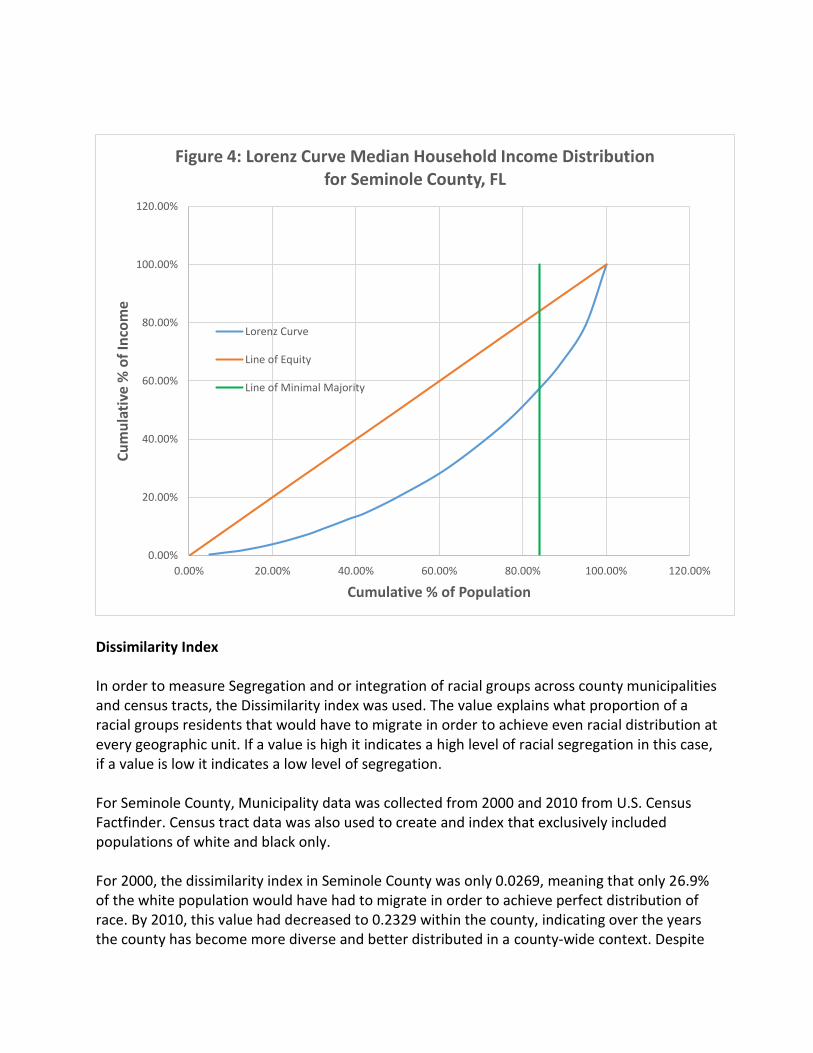
Dissimilarity Index In order to measure Segregation and or integration of racial groups across county municipalities and census tracts, the Dissimilarity index was used. The value explains what proportion of a racial groups residents that would have to migrate in order to achieve even racial distribution at every geographic unit. If a value is high it indicates a high level of racial segregation in this case, if a value is low it indicates a low level of segregation. For Seminole County, Municipality data was collected from 2000 and 2010 from U.S. Census Factfinder. Census tract data was also used to create and index that exclusively included populations of white and black only. For 2000, the dissimilarity index in Seminole County was only 0.0269, meaning that only 26.9% of the white population would have had to migrate in order to achieve perfect distribution of race. By 2010, this value had decreased to 0.2329 within the county, indicating over the years the county has become more diverse and better distributed in a county-wide context. Despite
0.00%
20.00%
40.00%
60.00%
80.00%
100.00%
120.00%
0.00% 20.00% 40.00% 60.00% 80.00% 100.00% 120.00%
Cu
mu
lati
ve %
of
Inco
me
Cumulative % of Population
Figure 4: Lorenz Curve Median Household Income Distribution for Seminole County, FL
Lorenz Curve
Line of Equity
Line of Minimal Majority
the low level of segregation at the county level, there is severe increase in segregation at the Census Tract level with a Dissimilarity value of 0.6263, meaning that 62% of the white community would have to move to different census tracts in order to create even distribution among races. Considering the significant difference between the County and census tract data, it can likely be speculated that since Seminole County is a predominantly Republican county, much of the municipal populations may live in relative proximity to each other, but that at some point lobbying at the county or state level arbitrarily drew census tract divisions at the border of minority neighborhoods to maintain voting districts predominantly white and republican, known as gerrymandering. With the statistics used in the spreadsheets are a measure of how populations are spread across specific geographic units. When the measurement of segregation was calculated at the municipal level, it became evident how diluted the evidence of potential segregation might have been considering the broad scope of measuring not only an entire municipality, but also by summing these municipalities at the county level. The data, however lacks insight into some of the other diversity factors that can be considered such as Hispanic and Asian populations, which when added together and included can have a profound effect in filling in the gaps of populations that may or may not exist within this overly-selective data index. Another factor that was not considered was the population growth, migration patterns, birth and death rates that were examined in previous problem sets. These datasets can seriously round out a story of a geographic area’s diversity scope. With the continued in-migration of Hispanics, out-migration of whites, as well as the birth and death rates of populations that occur in different frequencies since different races may have higher birth rates and other lower death rates in a particular period of time that may alter the level of perceived segregation.
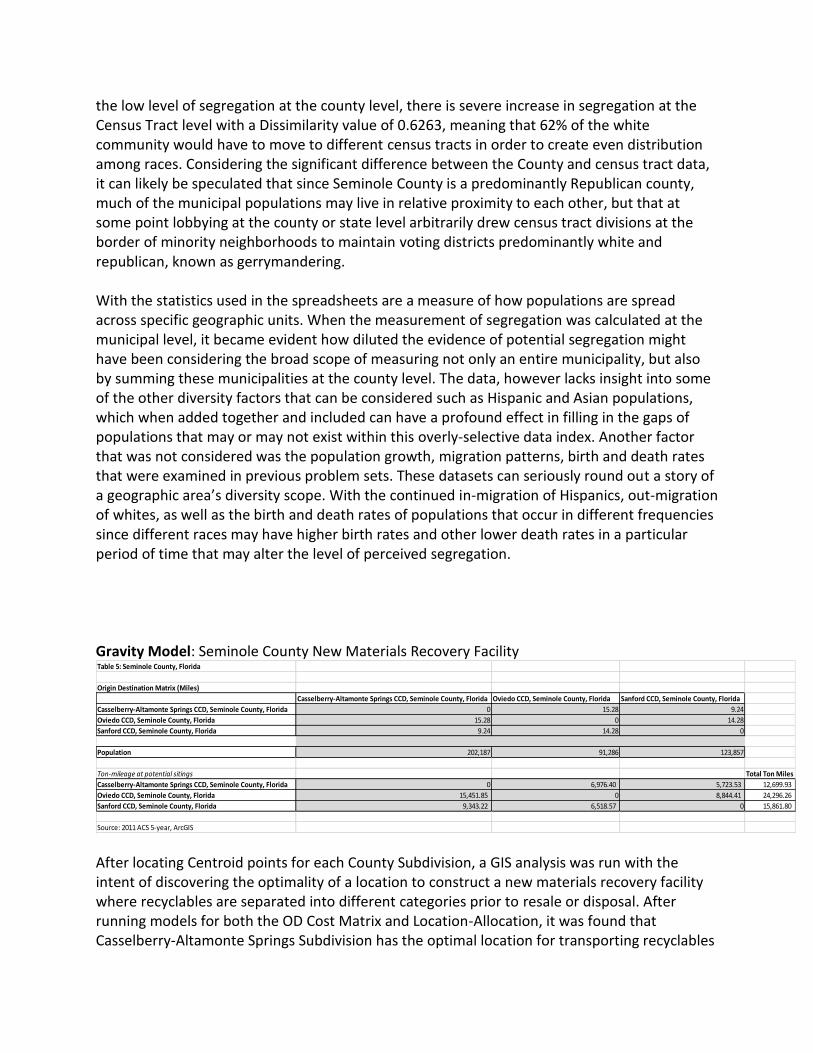
Gravity Model: Seminole County New Materials Recovery Facility
After locating Centroid points for each County Subdivision, a GIS analysis was run with the intent of discovering the optimality of a location to construct a new materials recovery facility where recyclables are separated into different categories prior to resale or disposal. After running models for both the OD Cost Matrix and Location-Allocation, it was found that Casselberry-Altamonte Springs Subdivision has the optimal location for transporting recyclables
Table 5: Seminole County, Florida
Origin Destination Matrix (Miles)
Casselberry-Altamonte Springs CCD, Seminole County, Florida Oviedo CCD, Seminole County, Florida Sanford CCD, Seminole County, Florida
Casselberry-Altamonte Springs CCD, Seminole County, Florida 0 15.28 9.24
Oviedo CCD, Seminole County, Florida 15.28 0 14.28
Sanford CCD, Seminole County, Florida 9.24 14.28 0
Population 202,187 91,286 123,857
Ton-mileage at potential sitings Total Ton Miles
Casselberry-Altamonte Springs CCD, Seminole County, Florida 0 6,976.40 5,723.53 12,699.93
Oviedo CCD, Seminole County, Florida 15,451.85 0 8,844.41 24,296.26
Sanford CCD, Seminole County, Florida 9,343.22 6,518.57 0 15,861.80
Source: 2011 ACS 5-year, ArcGIS
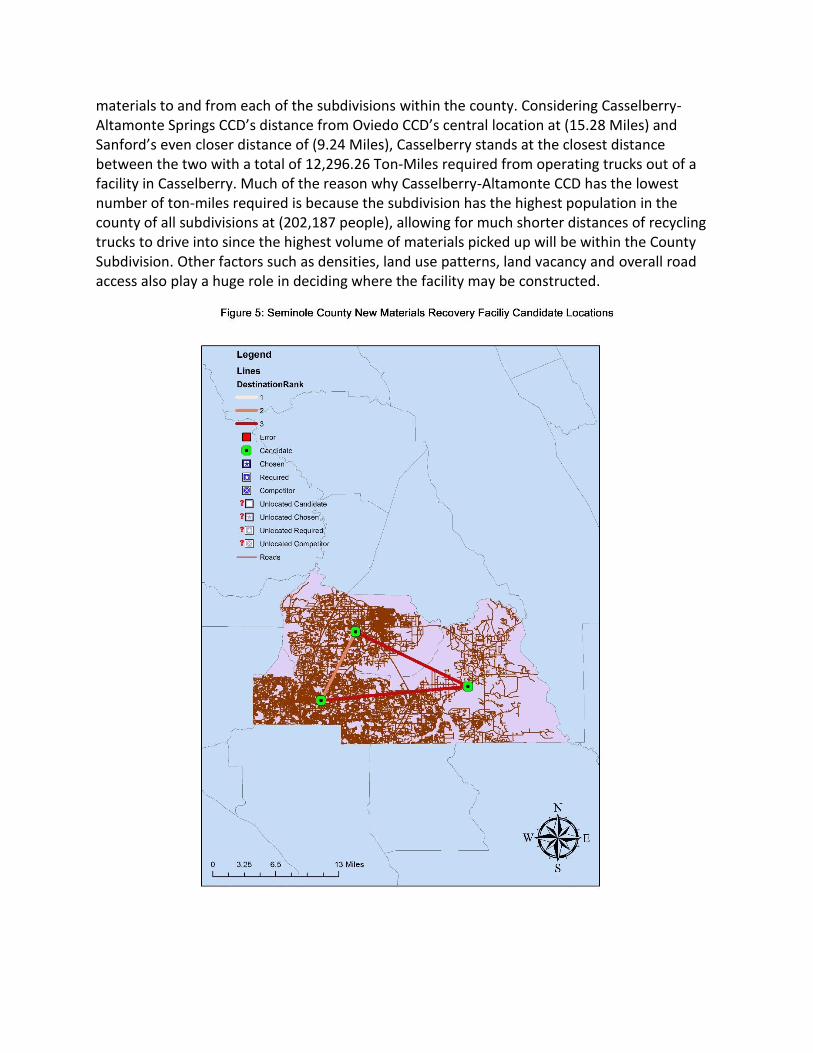
materials to and from each of the subdivisions within the county. Considering Casselberry-Altamonte Springs CCD’s distance from Oviedo CCD’s central location at (15.28 Miles) and Sanford’s even closer distance of (9.24 Miles), Casselberry stands at the closest distance between the two with a total of 12,296.26 Ton-Miles required from operating trucks out of a facility in Casselberry. Much of the reason why Casselberry-Altamonte CCD has the lowest number of ton-miles required is because the subdivision has the highest population in the county of all subdivisions at (202,187 people), allowing for much shorter distances of recycling trucks to drive into since the highest volume of materials picked up will be within the County Subdivision. Other factors such as densities, land use patterns, land vacancy and overall road access also play a huge role in deciding where the facility may be constructed.
References
http://flcitrusmutual.com/render.aspx?p=/industry-issues/weather/freeze_timeline.aspx http://www.bizjournals.com/orlando/print-edition/2013/12/06/orlando-a-model-location-
for.html http://today.ucf.edu/freshman-class-sets-new-records-fall-enrollment-may-top-60000/
http://www.research-park.org/index.cfm?fuseaction=news.details&ArticleId=188 http://www.bizjournals.com/orlando/news/2012/04/27/orlando-ranked-no4-among-
americas.html http://www.dot.state.fl.us/planning/systems/programs/mspi/pdf/Freight/onlineviewing/Semin
ole.pdf http://www.theatlantic.com/international/archive/2011/09/map-us-ranks-near-bottom-on-income-inequality/245315/