Embed Size (px)
Citation preview
Understanding Financial Statements
Douglas J. Orth, CPA, CFE, Managing Partner Orth, Chakler, Murnane and Co., CPAs
Become familiar with the basic rules governing financial reporting for credit unions.
Understand the key elements of the credit union’s balance sheet and income statement.
Learn to calculate and interpret the credit union’s key financial statement ratios.
Analytical review – can help you develop “good questions” to ask about the credit union’s financial performance.
Highlights of NCUA Call Report and Financial Performance Reports (FPRs).
NCUA Regulation – Part 741.6
Ensure that financial statements are prepared in accordance with generally accepted accounting principles (GAAP).
Ensure that accounting records/financial reports are prepared timely and accurately.

What a Director Should Know At a minimum, a director should be able to examine the credit
union’s balance sheet, income statement and be able to answer the following questions:
What does this line item mean? Why is it important to the credit union? Is the value of the line item changing over time? If so, what
does that change (either positive or negative) mean? Is the change important to the credit union?

NCUA Regulation – Part 715, Basic Responsibilities Board of Directors and Management:
1) Meet required financial reporting objectives 2) Establish practices and procedures sufficient to safeguard
members’ assets
NCUA Regulation – Part 715, Specific Responsibilities To carry out the Basic responsibilities, the Supervisory Committee
must determine whether: 1) Internal controls are established and effectively maintained 2) Accounting records and financial reports are promptly and
accurately prepared 3) The policies and control procedures established by the Board
are properly administered 4) Policies and control procedures are sufficient to safeguard
against error, conflict of interest, self dealing, and fraud

NCUA Rules and Regulations – Part 715, Mandates In carrying out these Basic and Specific responsibilities, the
Supervisory Committee must: 1) Ensure that filing requirements for (Call Reports) are met
2) Perform or obtain an Audit (as defined by regulation)
3) Perform or obtain a Verification of Members’ Accounts
4) Act to avoid sanctions for failure to comply with these requirements
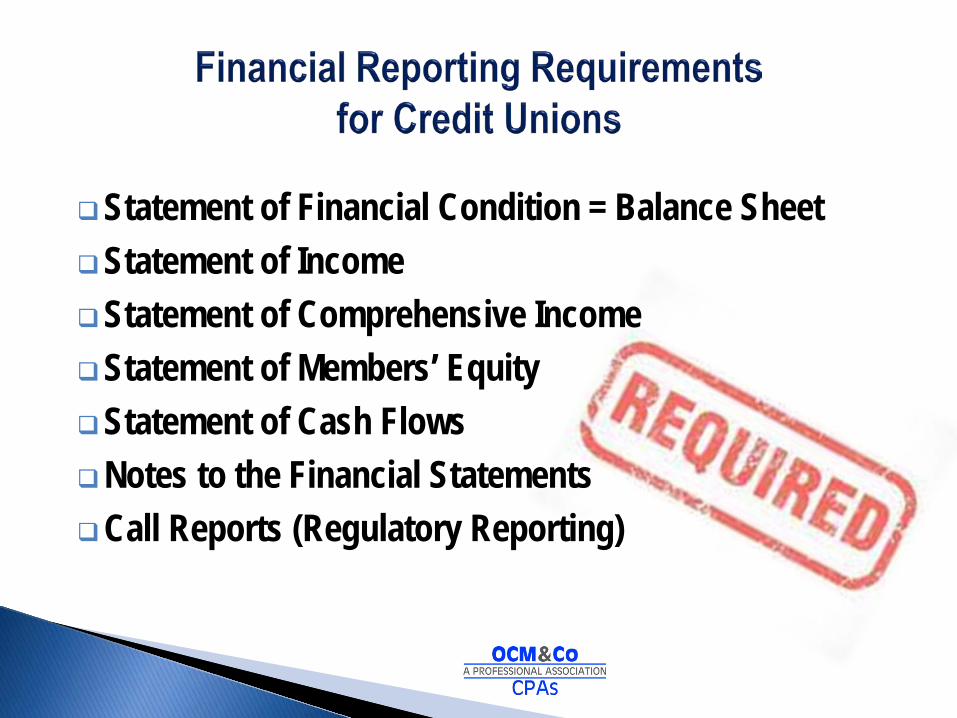
Statement of Financial Condition = Balance Sheet Statement of Income Statement of Comprehensive Income Statement of Members’ Equity Statement of Cash Flows Notes to the Financial Statements Call Reports (Regulatory Reporting)

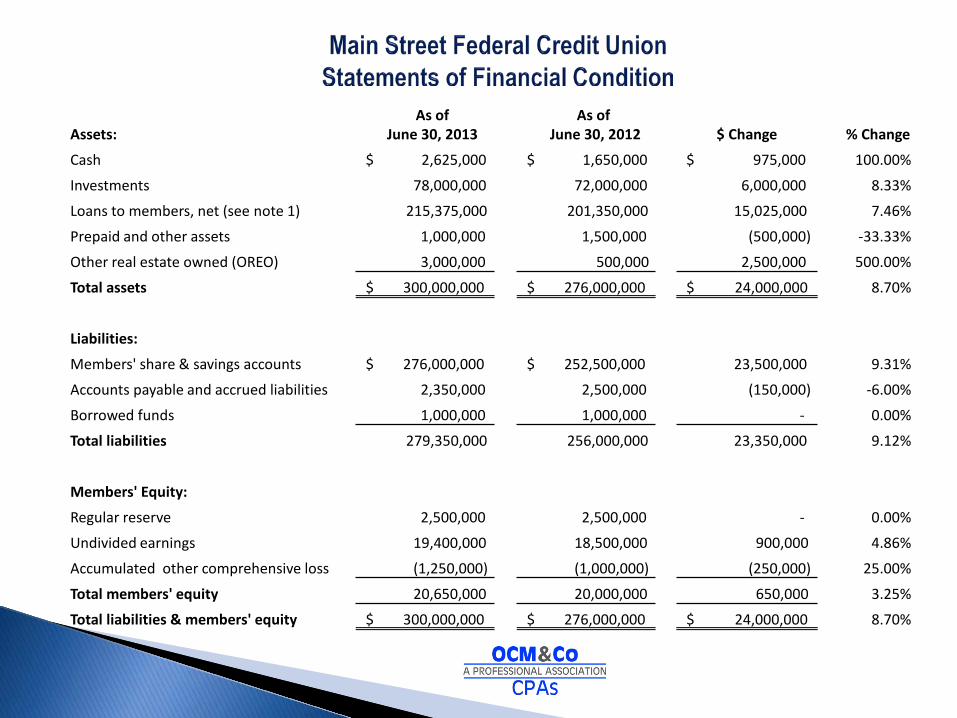
Assets: As of
June 30, 2013 As of
June 30, 2012 $ Change % Change
Cash $ 2,625,000 $ 1,650,000 $ 975,000 100.00%
Investments 78,000,000 72,000,000 6,000,000 8.33%
Loans to members, net (see note 1) 215,375,000 201,350,000 15,025,000 7.46%
Prepaid and other assets 1,000,000 1,500,000 (500,000) -33.33%
Other real estate owned (OREO) 3,000,000 500,000 2,500,000 500.00%
Total assets $ 300,000,000 $ 276,000,000 $ 24,000,000 8.70%
Liabilities:
Members' share & savings accounts $ 276,000,000 $ 252,500,000 23,500,000 9.31%
Accounts payable and accrued liabilities 2,350,000 2,500,000 (150,000) -6.00%
Borrowed funds 1,000,000 1,000,000 - 0.00%
Total liabilities 279,350,000 256,000,000 23,350,000 9.12%
Members' Equity:
Regular reserve 2,500,000 2,500,000 - 0.00%
Undivided earnings 19,400,000 18,500,000 900,000 4.86%
Accumulated other comprehensive loss (1,250,000) (1,000,000) (250,000) 25.00%
Total members' equity 20,650,000 20,000,000 650,000 3.25%
Total liabilities & members' equity $ 300,000,000 $ 276,000,000 $ 24,000,000 8.70%
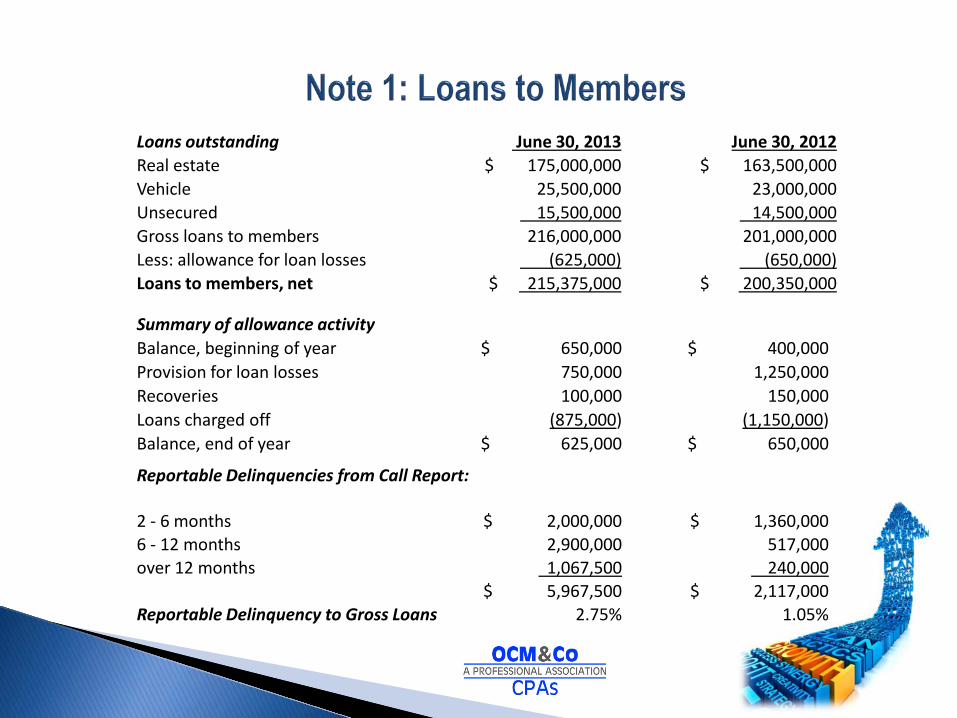
Loans outstanding June 30, 2013 June 30, 2012 Real estate $ 175,000,000 $ 163,500,000 Vehicle 25,500,000 23,000,000 Unsecured 15,500,000 14,500,000 Gross loans to members 216,000,000 201,000,000 Less: allowance for loan losses (625,000) (650,000) Loans to members, net $ 215,375,000 $ 200,350,000
Summary of allowance activity Balance, beginning of year $ 650,000 $ 400,000 Provision for loan losses 750,000 1,250,000 Recoveries 100,000 150,000 Loans charged off (875,000) (1,150,000) Balance, end of year $ 625,000 $ 650,000
Reportable Delinquencies from Call Report: 2 - 6 months $ 2,000,000 $ 1,360,000 6 - 12 months 2,900,000 517,000 over 12 months 1,067,500 240,000
$ 5,967,500 $ 2,117,000 Reportable Delinquency to Gross Loans 2.75% 1.05%
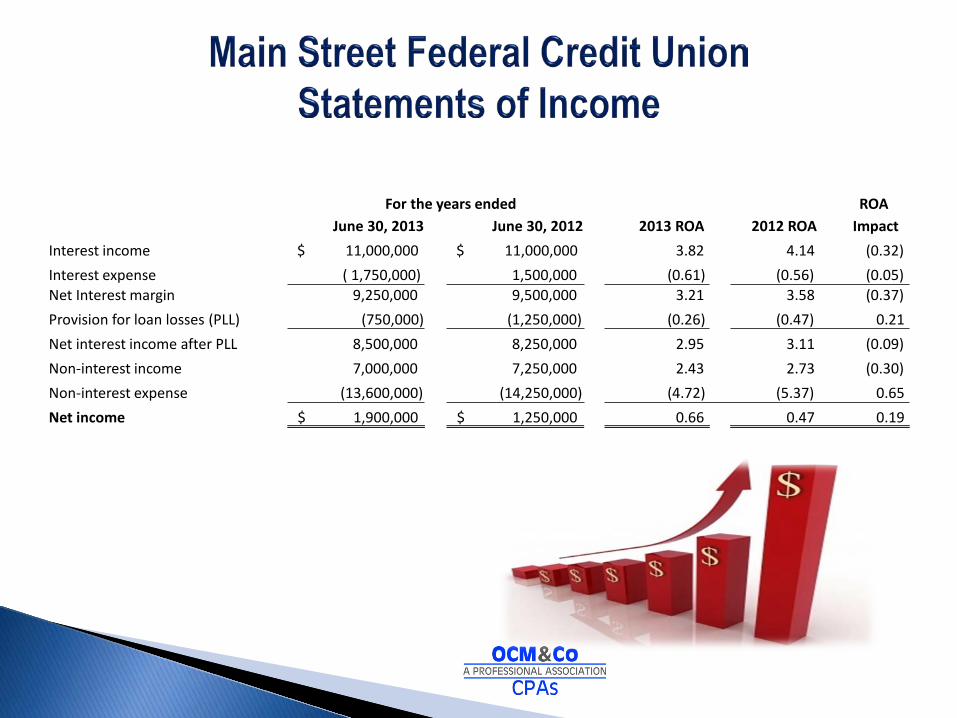
For the years ended ROA June 30, 2013 June 30, 2012 2013 ROA 2012 ROA Impact
Interest income $ 11,000,000 $ 11,000,000 3.82 4.14 (0.32) Interest expense ( 1,750,000) 1,500,000 (0.61) (0.56) (0.05) Net Interest margin 9,250,000 9,500,000 3.21 3.58 (0.37) Provision for loan losses (PLL) (750,000) (1,250,000) (0.26) (0.47) 0.21 Net interest income after PLL 8,500,000 8,250,000 2.95 3.11 (0.09) Non-interest income 7,000,000 7,250,000 2.43 2.73 (0.30) Non-interest expense (13,600,000) (14,250,000) (4.72) (5.37) 0.65 Net income $ 1,900,000 $ 1,250,000 0.66 0.47 0.19
Two Basic Points:
The balance sheet is prepared for a specific day………not a period of time. This is usually prepared monthly – As of June 30, 2013, etc. ◦ Accounting equation = Assets – Liabilities = Equity
Assets = Represents things the Credit Union owns. Liabilities = Represents things the Credit Union owes to third parties.
Members’ Equity = Mathematical difference between Assets and Liabilities.
Assets = cash on hand; cash in banks; investments; loans to members; accrued interest receivable; property and equipment; prepaid assets; and NCUSIF deposit.
Liabilities = members’ deposits; borrowed funds; interest payable; accounts payable; and accrued liabilities.
Members’ Equity = undivided earnings; regular reserve; appropriated undivided earnings; accumulated other comprehensive income/(loss); and equity acquired through merger/acquisition.
One Basic Point: ◦ The statement of income is prepared for a period of time….…not
for a specific day. This is usually prepared monthly – For the month ended June 30, 2013; For the quarter ended June 30, 2013; for the six months ended June 30, 2013, etc.
Revenues = Represents income earned from assets and services.
Expenses = Represents costs incurred on liabilities and services provided for and by the credit union.
Net Income/(Loss) = Mathematical difference between Revenues and Expenses.
Net Income/(Loss): • At the end of each accounting period, the credit union’s
net income or loss is added to or subtracted from the credit union’s undivided earnings balance.
• Inadequate net income over a prolonged period or a material net loss in any period could erode the credit union’s net worth and result in serious regulatory intervention, including conservatorship.

Loan to Share Ratio: (gross outstanding loans divided by outstanding deposits) o $216,000,000 / $276,000,000 = 78.3%
Loan to Assets Ratio: (gross outstanding loans divided by total assets) o $216,000,000 / $300,000,000 = 72.0%
What These Ratios Mean: o The portion of members’ deposits or total assets that have been invested in
loans to members. o A low ratio may indicate strict lending policies, low risk tolerance, or
unattractive loan products. o A high ratio may indicate attractive loan products, higher risk tolerance, or
strong marketing programs.
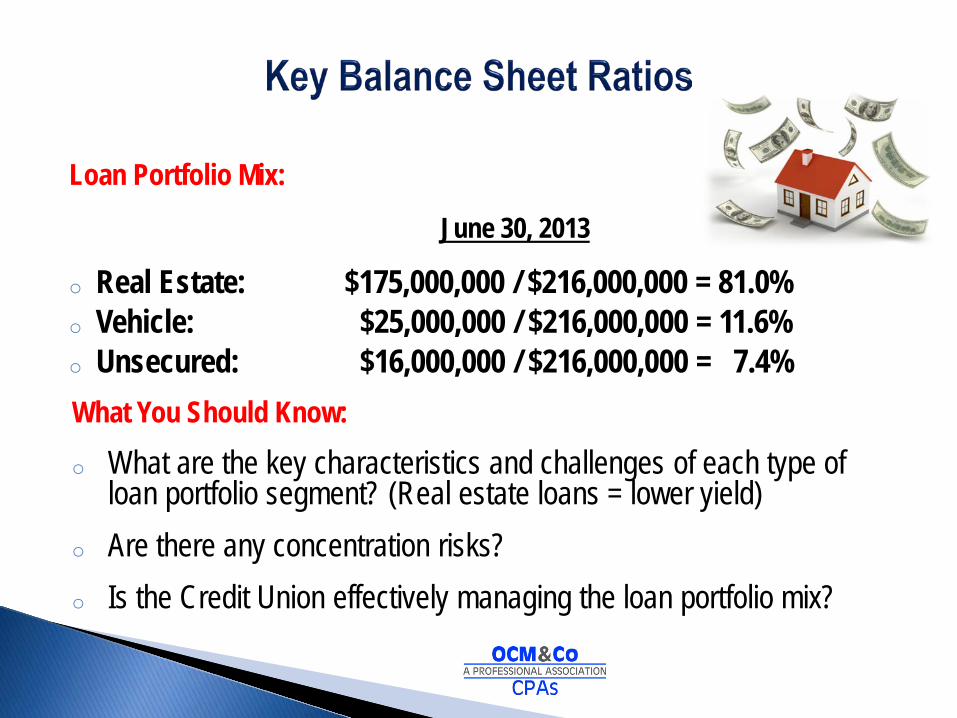
Loan Portfolio Mix:
June 30, 2013
o Real Estate: $175,000,000 / $216,000,000 = 81.0% o Vehicle: $25,000,000 / $216,000,000 = 11.6% o Unsecured: $16,000,000 / $216,000,000 = 7.4% What You Should Know: o What are the key characteristics and challenges of each type of
loan portfolio segment? (Real estate loans = lower yield) o Are there any concentration risks? o Is the Credit Union effectively managing the loan portfolio mix?
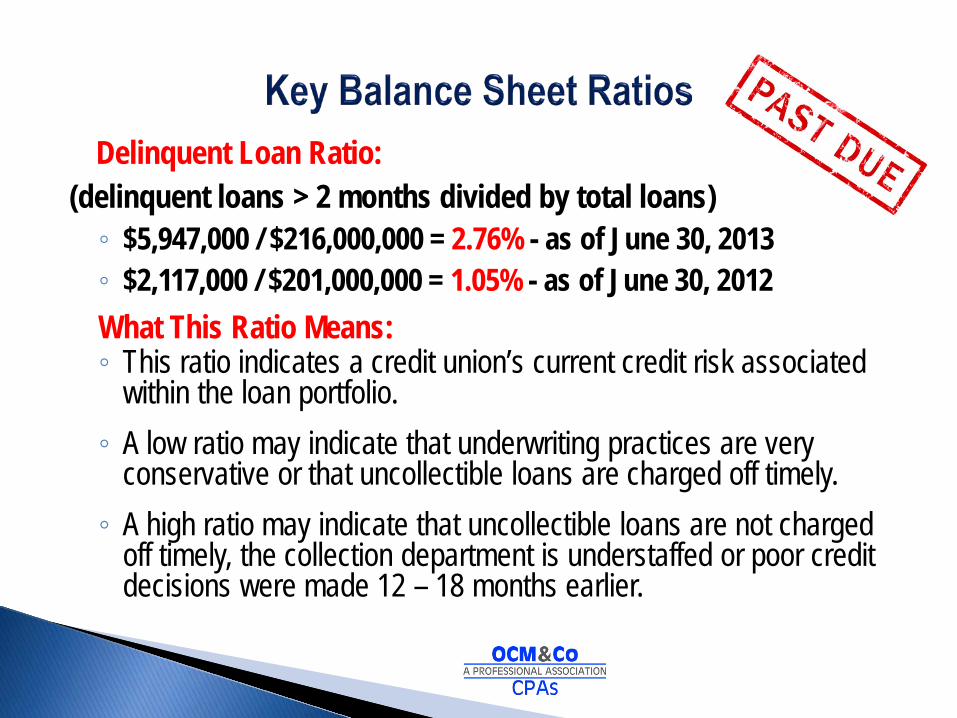
Delinquent Loan Ratio: (delinquent loans > 2 months divided by total loans) ◦ $5,947,000 / $216,000,000 = 2.76% - as of June 30, 2013 ◦ $2,117,000 / $201,000,000 = 1.05% - as of June 30, 2012
What This Ratio Means: ◦ This ratio indicates a credit union’s current credit risk associated
within the loan portfolio. ◦ A low ratio may indicate that underwriting practices are very
conservative or that uncollectible loans are charged off timely. ◦ A high ratio may indicate that uncollectible loans are not charged
off timely, the collection department is understaffed or poor credit decisions were made 12 – 18 months earlier.

Delinquent Loan Mix: Category June 30, 2013 June 30, 2012
2 – 6 months 33% 64% 6 – 12 months 49% 25% Over 12 months 18% 11%
What You Should Know: o What is the credit union’s charge off policy? Are loans being charged
off timely? o What percentage of delinquency over 6-12 months result in losses?
Is this factored into the Allowance for Loan Losses (ALL) Reserve? o How is the underlying collateral being evaluated?

Net Charge-off Ratio: (charge-offs minus recoveries divided by average loans outstanding)
$675,000 / ($216,000,000 + $201,000,000) / 2 = 0.32%
What This Ratio Means: ◦ This ratio indicates the annualized percentage of net charge-offs
recognized by a credit union in relation to its average balance of outstanding loans during the same period.
◦ A low ratio may indicate that underwriting practices are very conservative or that uncollectible loans are not being charged off timely.
◦ A high ratio may indicate that uncollectible loans are excessive, underwriting standards are poor, or collection efforts are weak.
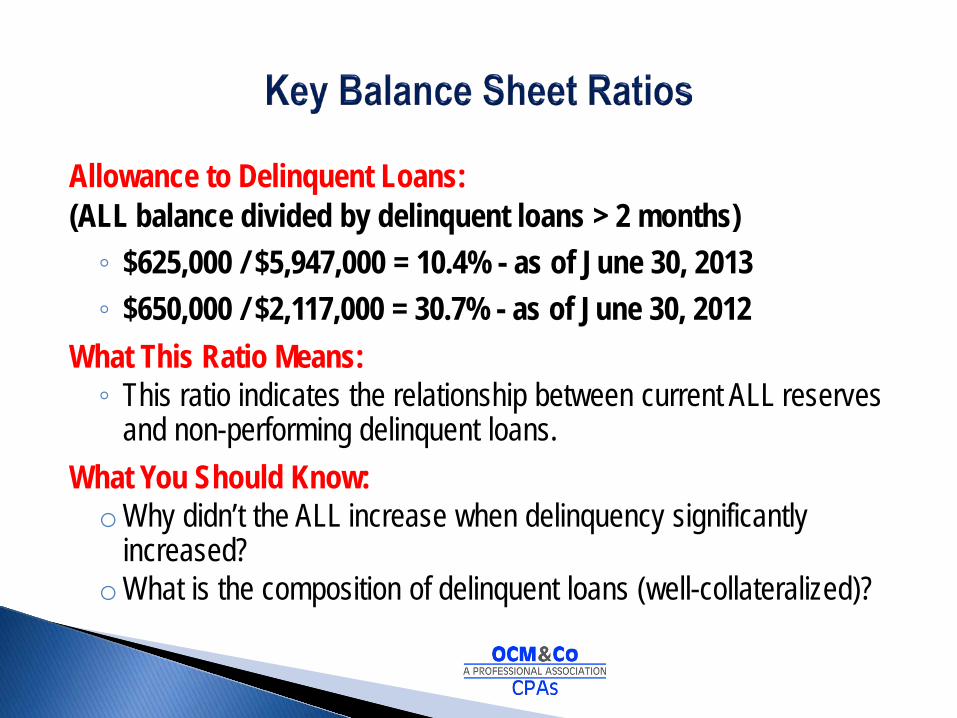
Allowance to Delinquent Loans: (ALL balance divided by delinquent loans > 2 months) ◦ $625,000 / $5,947,000 = 10.4% - as of June 30, 2013 ◦ $650,000 / $2,117,000 = 30.7% - as of June 30, 2012
What This Ratio Means: ◦ This ratio indicates the relationship between current ALL reserves
and non-performing delinquent loans. What You Should Know: oWhy didn’t the ALL increase when delinquency significantly
increased? oWhat is the composition of delinquent loans (well-collateralized)?
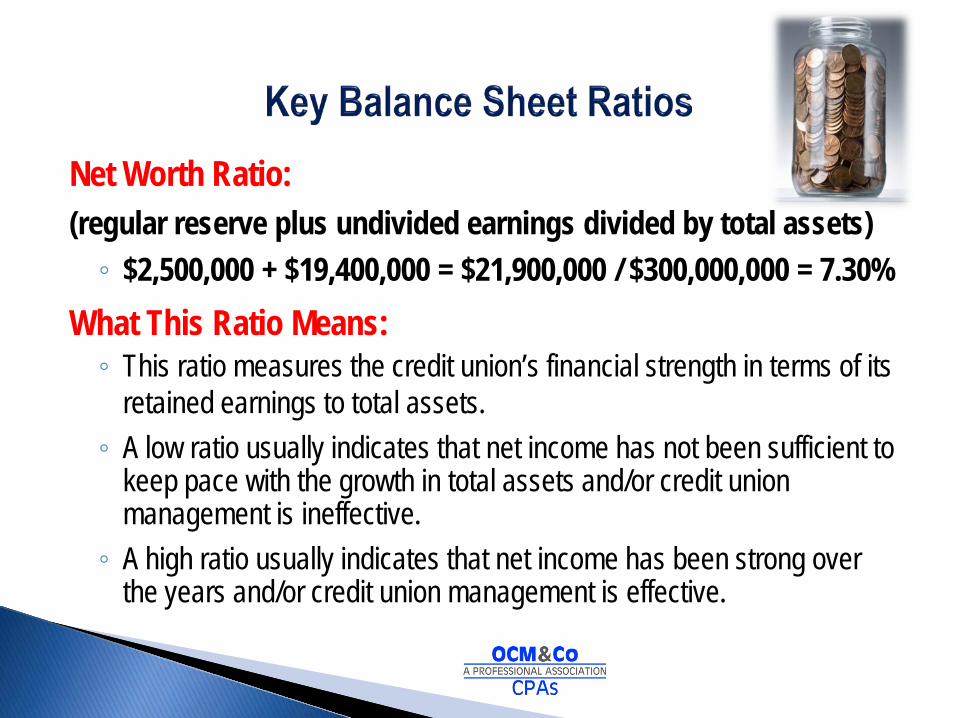
Net Worth Ratio: (regular reserve plus undivided earnings divided by total assets) ◦ $2,500,000 + $19,400,000 = $21,900,000 / $300,000,000 = 7.30%
What This Ratio Means: ◦ This ratio measures the credit union’s financial strength in terms of its
retained earnings to total assets. ◦ A low ratio usually indicates that net income has not been sufficient to
keep pace with the growth in total assets and/or credit union management is ineffective. ◦ A high ratio usually indicates that net income has been strong over
the years and/or credit union management is effective.
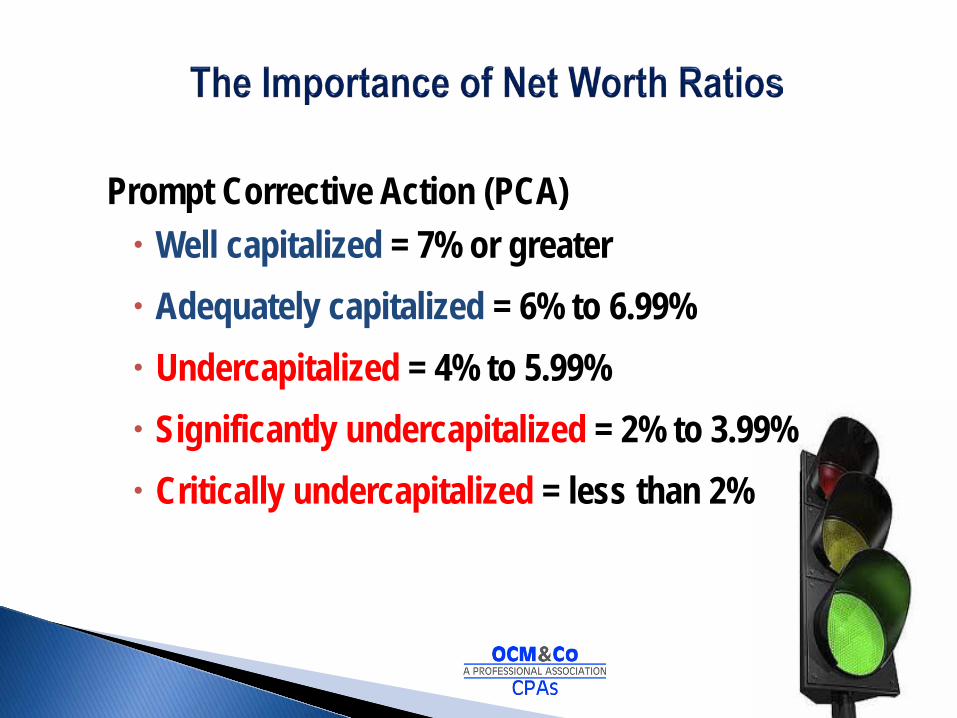
Prompt Corrective Action (PCA) Well capitalized = 7% or greater Adequately capitalized = 6% to 6.99% Undercapitalized = 4% to 5.99% Significantly undercapitalized = 2% to 3.99% Critically undercapitalized = less than 2%
Total Asset Options: oQuarter-end option. o Average of the current and three preceding calendar quarter-end
balances. o Average of the three month-end balances over the calendar quarter. o Average of daily assets over the calendar quarter.
What You Should Know: oWhich asset option does your credit union use? o Do they frequently change options to attain optimal ratios? o Are they using an alternative method to remain at a higher PCA level?
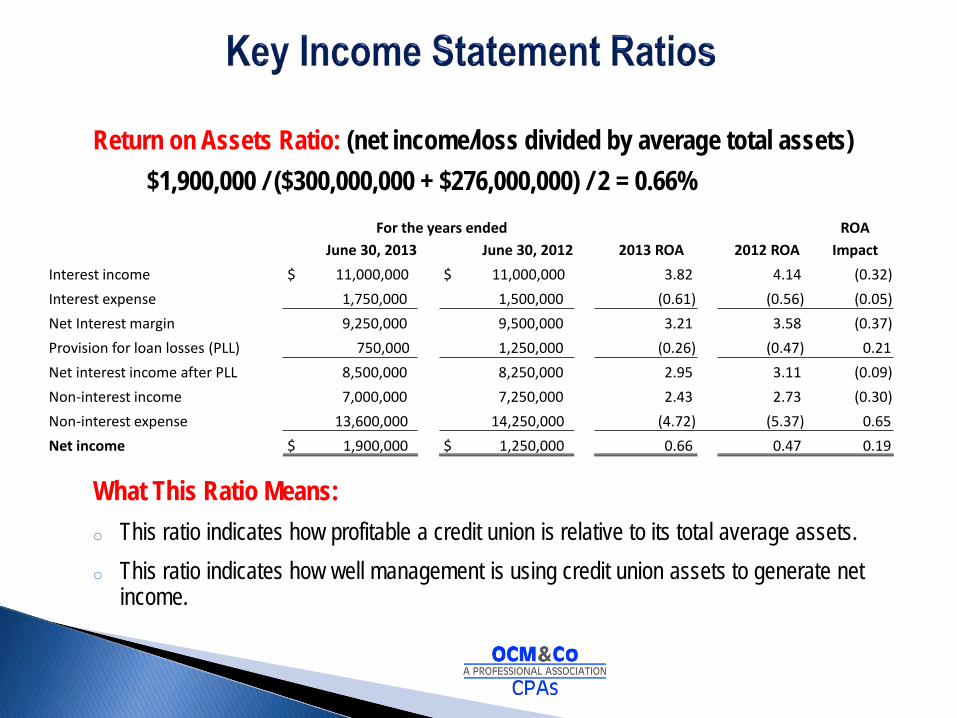
Return on Assets Ratio: (net income/loss divided by average total assets)
$1,900,000 / ($300,000,000 + $276,000,000) / 2 = 0.66%
What This Ratio Means: o This ratio indicates how profitable a credit union is relative to its total average assets. o This ratio indicates how well management is using credit union assets to generate net
income.
For the years ended ROA June 30, 2013 June 30, 2012 2013 ROA 2012 ROA Impact
Interest income $ 11,000,000 $ 11,000,000 3.82 4.14 (0.32) Interest expense 1,750,000 1,500,000 (0.61) (0.56) (0.05) Net Interest margin 9,250,000 9,500,000 3.21 3.58 (0.37) Provision for loan losses (PLL) 750,000 1,250,000 (0.26) (0.47) 0.21 Net interest income after PLL 8,500,000 8,250,000 2.95 3.11 (0.09) Non-interest income 7,000,000 7,250,000 2.43 2.73 (0.30) Non-interest expense 13,600,000 14,250,000 (4.72) (5.37) 0.65 Net income $ 1,900,000 $ 1,250,000 0.66 0.47 0.19
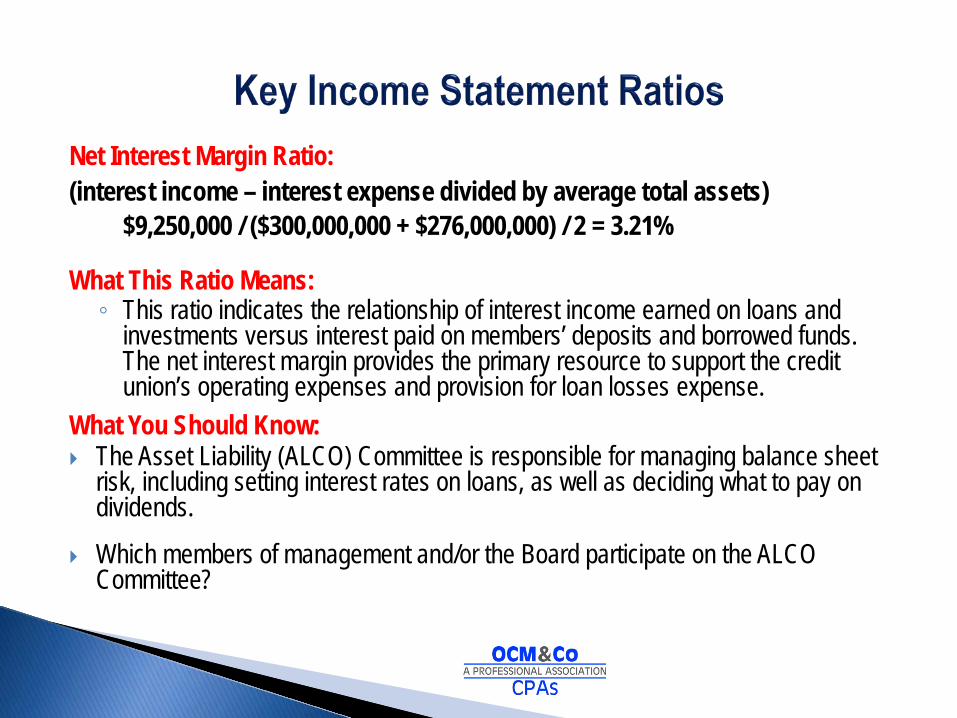
Net Interest Margin Ratio: (interest income – interest expense divided by average total assets)
$9,250,000 / ($300,000,000 + $276,000,000) / 2 = 3.21%
What This Ratio Means: ◦ This ratio indicates the relationship of interest income earned on loans and
investments versus interest paid on members’ deposits and borrowed funds. The net interest margin provides the primary resource to support the credit union’s operating expenses and provision for loan losses expense.
What You Should Know: The Asset Liability (ALCO) Committee is responsible for managing balance sheet
risk, including setting interest rates on loans, as well as deciding what to pay on dividends.
Which members of management and/or the Board participate on the ALCO Committee?
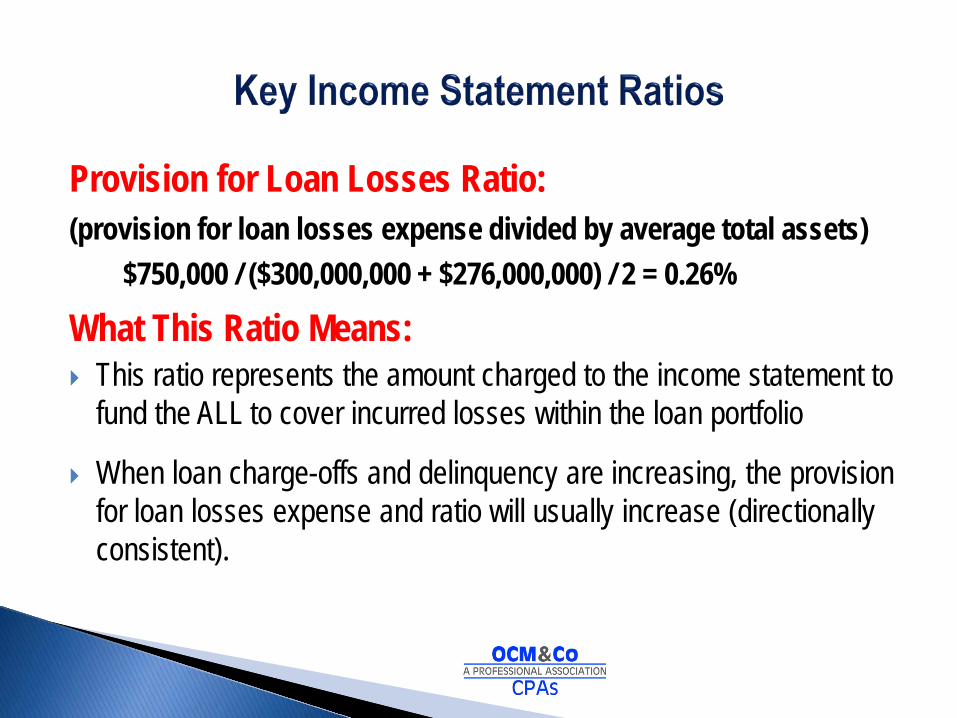
Provision for Loan Losses Ratio: (provision for loan losses expense divided by average total assets)
$750,000 / ($300,000,000 + $276,000,000) / 2 = 0.26%
What This Ratio Means: This ratio represents the amount charged to the income statement to
fund the ALL to cover incurred losses within the loan portfolio
When loan charge-offs and delinquency are increasing, the provision for loan losses expense and ratio will usually increase (directionally consistent).
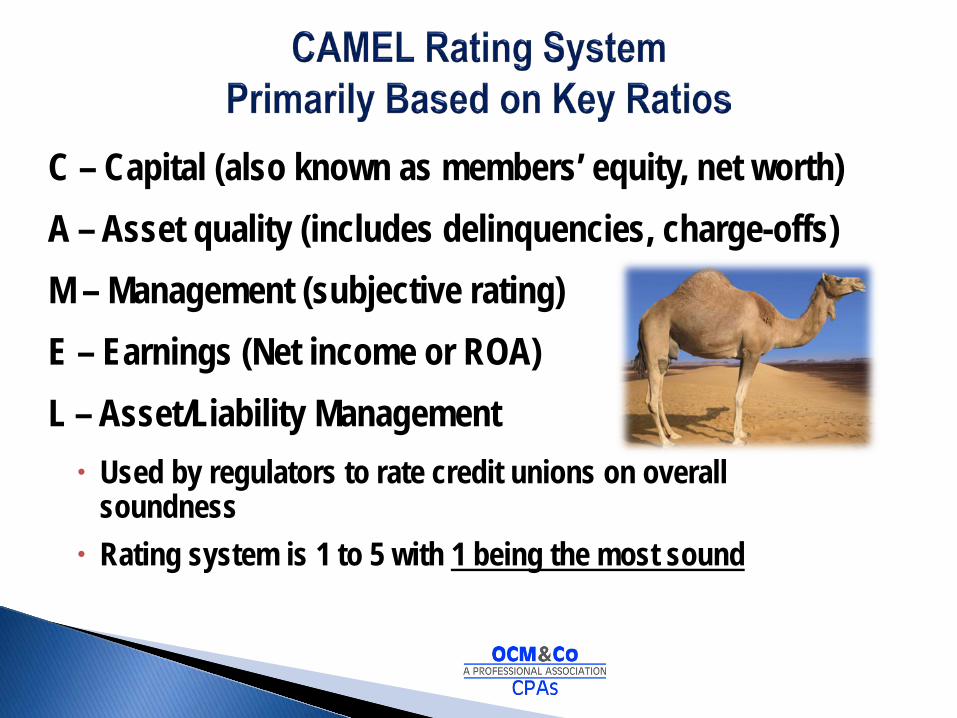
C – Capital (also known as members’ equity, net worth) A – Asset quality (includes delinquencies, charge-offs) M – Management (subjective rating) E – Earnings (Net income or ROA) L – Asset/Liability Management
Used by regulators to rate credit unions on overall soundness
Rating system is 1 to 5 with 1 being the most sound

NCUA Letter To Credit Unions – State of the CU Industry Quarterly Call Reports – NCUA website Financial Performance Report (FPR) – quarterly report from NCUA
provides historical and peer information NCUA’s Peer Groups ◦ < $2 million ◦ $2 million to < $10 million ◦ $10 million to < $50 million ◦ $50 million to < $100 million ◦ $100 million to < $500 million ◦ $500 million and greater
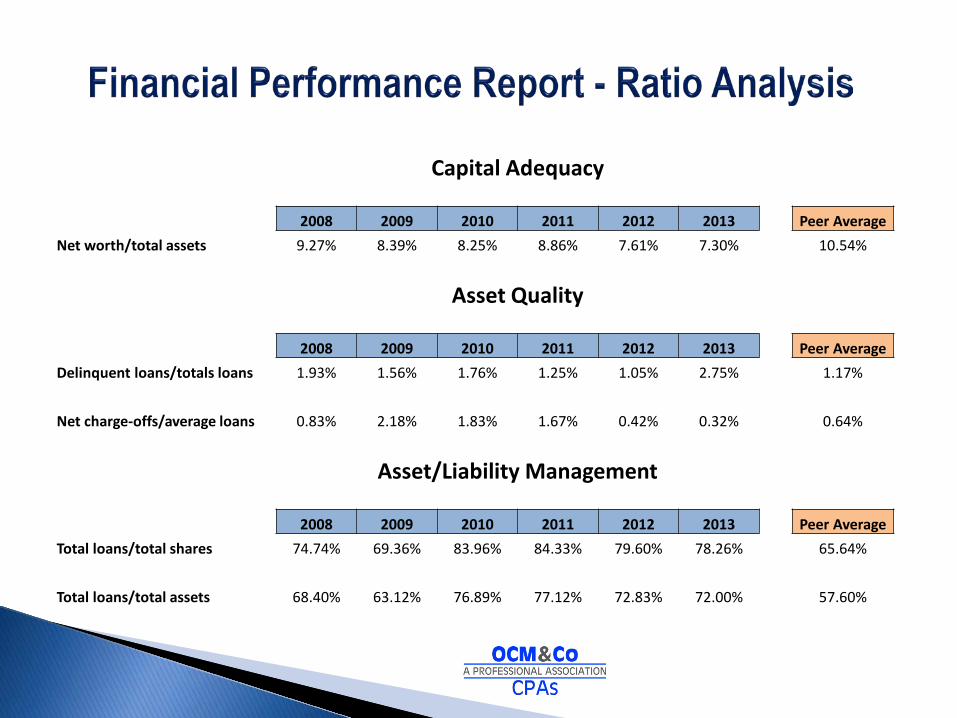
Capital Adequacy
2008 2009 2010 2011 2012 2013 Peer Average Net worth/total assets 9.27% 8.39% 8.25% 8.86% 7.61% 7.30% 10.54%
Asset Quality
2008 2009 2010 2011 2012 2013 Peer Average Delinquent loans/totals loans 1.93% 1.56% 1.76% 1.25% 1.05% 2.75% 1.17%
Net charge-offs/average loans 0.83% 2.18% 1.83% 1.67% 0.42% 0.32% 0.64%
Asset/Liability Management
2008 2009 2010 2011 2012 2013 Peer Average Total loans/total shares 74.74% 69.36% 83.96% 84.33% 79.60% 78.26% 65.64%
Total loans/total assets 68.40% 63.12% 76.89% 77.12% 72.83% 72.00% 57.60%
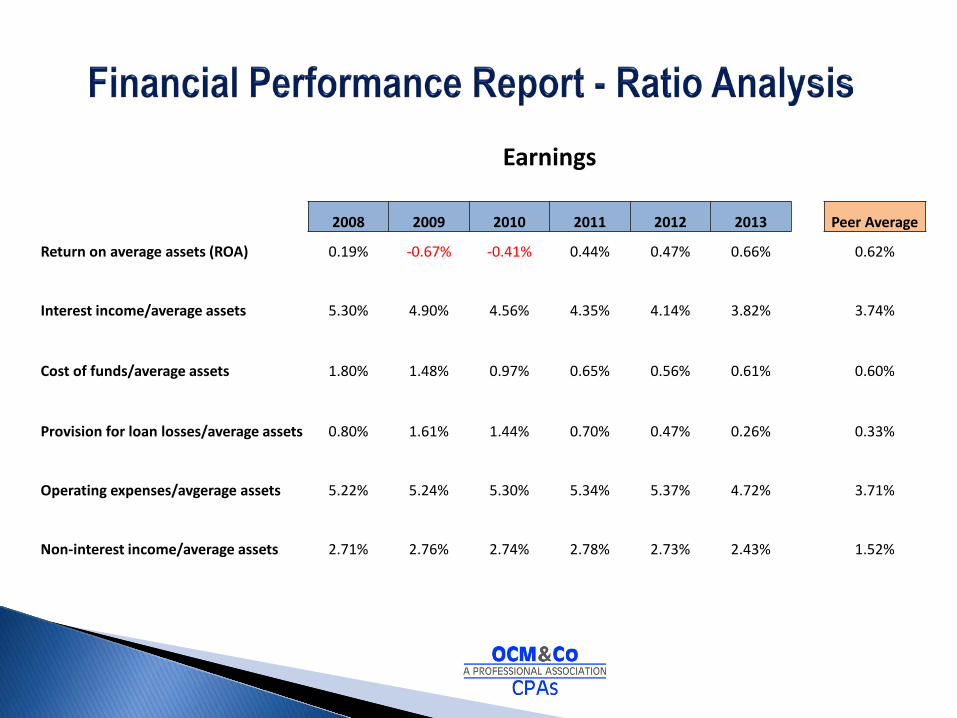
Earnings
2008 2009 2010 2011 2012 2013 Peer Average
Return on average assets (ROA) 0.19% -0.67% -0.41% 0.44% 0.47% 0.66% 0.62%
Interest income/average assets 5.30% 4.90% 4.56% 4.35% 4.14% 3.82% 3.74%
Cost of funds/average assets 1.80% 1.48% 0.97% 0.65% 0.56% 0.61% 0.60%
Provision for loan losses/average assets 0.80% 1.61% 1.44% 0.70% 0.47% 0.26% 0.33%
Operating expenses/avgerage assets 5.22% 5.24% 5.30% 5.34% 5.37% 4.72% 3.71%
Non-interest income/average assets 2.71% 2.76% 2.74% 2.78% 2.73% 2.43% 1.52%
Allowance for Loan Losses: Why is the credit union’s ALL balance as of June 30, 2013 lower
than it was as of June 30, 2012, when gross loans to members increased and delinquency has more than doubled? Why are the credit union’s recovery payments on charged-off
loans down $50,000 (33.3%) this year ($100,000) versus last year ($150,000)? Is management adhering to the credit union’s charge-off policy?
Other Real Estate Owned (OREO): Why did our real estate foreclosures increase so dramatically (From $500,000 to $2,500,000 = 500%) between years?
Are these foreclosures still part of the credit union’s reportable delinquency?
How many additional foreclosures does the credit union expect in the next six months?
What are the expected losses on the foreclosures the credit union currently owns?
How does the credit union market these properties for sale?

Allowance for Loan Losses: Management did not provide an adequate loan loss reserve to address the
significant increase in loan delinquency and the escalating number of foreclosures. A closer review of these trends disclosed that the collections department was severely understaffed and operating without a competent collections manager for more than 9 months. This error overstated loans to members, net income and undivided earnings by $2,000,000.
Other Real Estate Owned (OREO): Foreclosed property was transferred to OREO at the outstanding loan balance
versus the fair value of the property. This error overstated assets, net income and undivided earnings by $1,500,000.
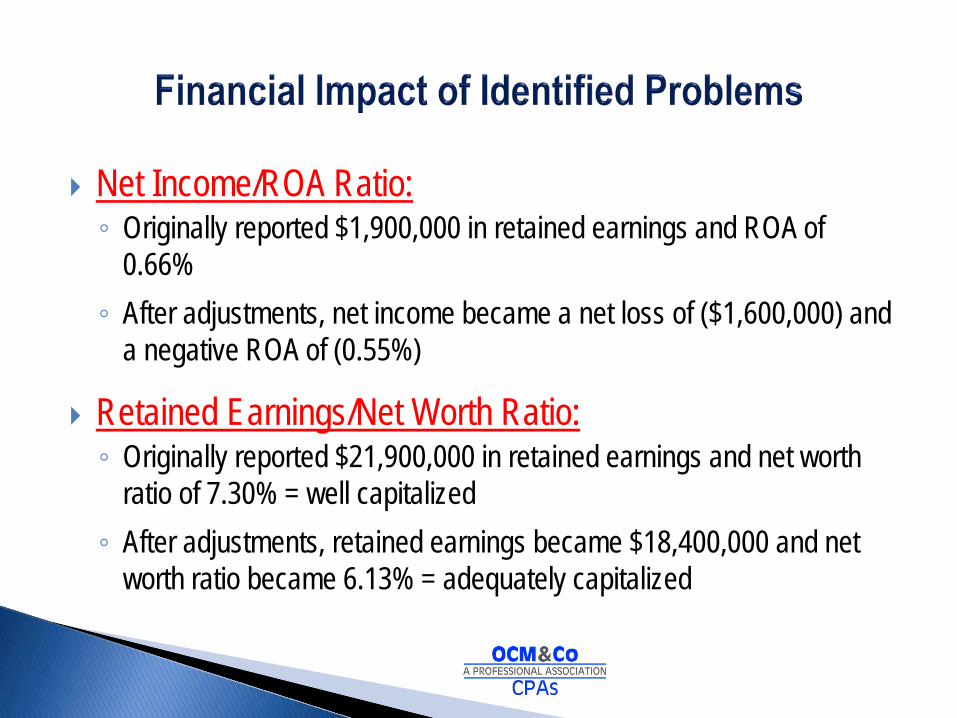
Net Income/ROA Ratio: ◦ Originally reported $1,900,000 in retained earnings and ROA of
0.66% ◦ After adjustments, net income became a net loss of ($1,600,000) and
a negative ROA of (0.55%)
Retained Earnings/Net Worth Ratio: ◦ Originally reported $21,900,000 in retained earnings and net worth
ratio of 7.30% = well capitalized ◦ After adjustments, retained earnings became $18,400,000 and net
worth ratio became 6.13% = adequately capitalized
The Call Report - What is Included: Statement of Financial Condition Statement of Income and Expense Miscellaneous Information Delinquent Loans by Collateral Type Additional Delinquency Information Loan Charge Offs and Recoveries Liquidity, Commitments and Sources
The Call Report - What is Included: PCA Net Worth Calculation Worksheet Specialized Lending Indirect Loans Real Estate Loans Purchased and Sold Business Lending
Investments, Supplemental Information Credit Union Service Organizations (CUSOs)
Issues: • Balance Sheet - Lines 27(a) and (b) - OREO and REPO assets
not reported separately
• Miscellaneous Information – Line 5 – Aggregate amount of future capital and operating lease payments on fixed assets shown as zero
• Loan Charge-offs and Recoveries – Line 8 – Totals do not reconcile to activity in the Credit Union’s ALL account
• Liquidity, Commitments and Sources – Line 2 (d) – Overdraft protection program commitments often incorrect or shown as zero
• Liquidity, Commitments and Sources – Line 7 (a) – Total lines of credit - often incorrect or excluding a new line of credit

Other Issues and Your Questions
Presented by: Doug Orth Orth, Chakler, Murnane and Co., CPAs Telephone: 305-232-8272 office 305-794-5457 cell E-mail: [email protected]