Embed Size (px)
Citation preview
UNDERSTANDING SPATIAL DISTRIBUTION OF ASTHMA USING
A GEOGRAPHICAL INFORMATION SYSTEM
Mohammad A. RobManagement Information Systems
University of Houston-Clear Lake
Contents
• Introduction
• Geographic Information System (GIS)
• Asthma Epidemic: An Example
• Applications of GIS in Spatial Distribution of Asthma
• Business Geography: A New Discipline
• Conclusion
Introduction
• Geographic Information System (GIS) is used to make strategic decisions when data have spatial (geographical) distribution
• Government agencies use it for assessment and planning in areas such as housing, healthcare, land use, transportation, and environmental monitoring
• Businesses use it to locate optimum retail location and delivery route
Introduction
• Current corporate databases do not contain geospatial reference
• However, GIS tools can be used to add geographical coordinates to existing data
• Thus existing data can be presented on a map and make strategic decisions
• Major database vendors (Microsoft, IBM, Oracle, Informix) are adding a “spatial” data type to their enterprise database systems
Introduction
• The use of GIS tools require more knowledge of information technology than geography
• GIS datasets are already available through the Web
• Most organizations perform GIS analysis without getting involved with the mapping technology
• There are GIS technicians, analysts, programmers, and managers
Introduction
• Soon there will be GIS specialists like IT specialists in every organization
• Many IT specialists will become GIS specialists
• We discuss the basic principles and functionality of a GIS
• We also illustrate how GIS tools can be used to analyze and interpret user data using an example of asthma epidemiology
Geographical Information System (GIS)
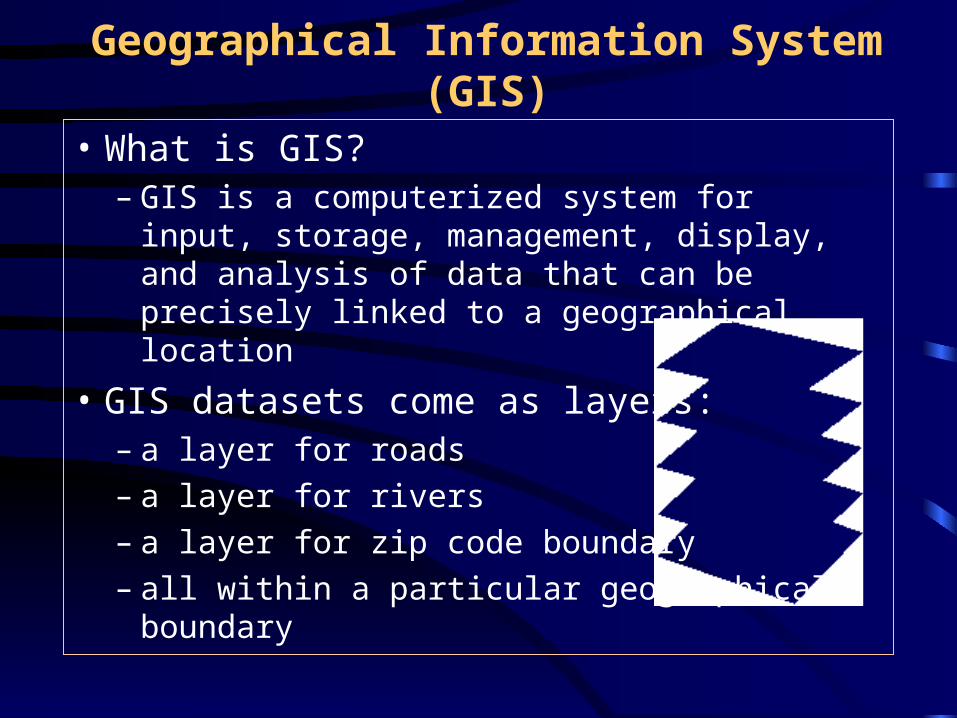
• What is GIS?– GIS is a computerized system for input, storage,
management, display, and analysis of data that can be precisely linked to a geographical location
• GIS datasets come as layers:– a layer for roads– a layer for rivers– a layer for zip code boundary– all within a particular geographical boundary
Geographical Information System (GIS)
• A layer may consists of a vector or raster
• Raster data types are images
• Vectors data types are defined by points, lines and polygons (boundary)– Points: hospitals, parks, and fire hydrants– Lines: Roads, highways, and rivers– Polygon: Zip code, county, state, and country
• A layer may consist of many features
• Several layers are combined to create a map
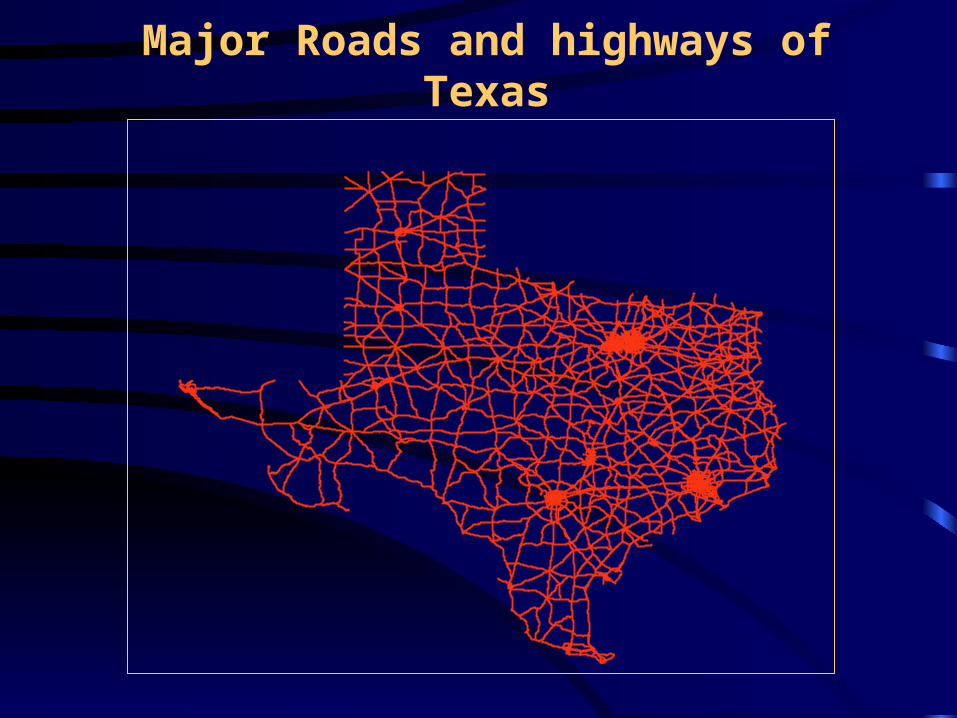
Major Roads and highways of Texas
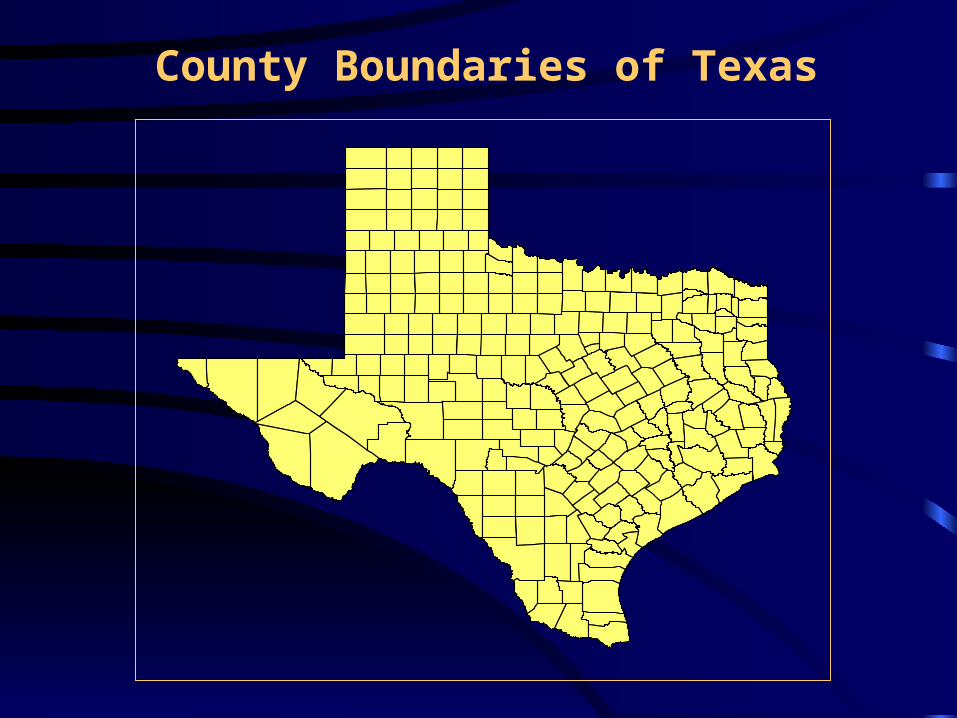
County Boundaries of Texas
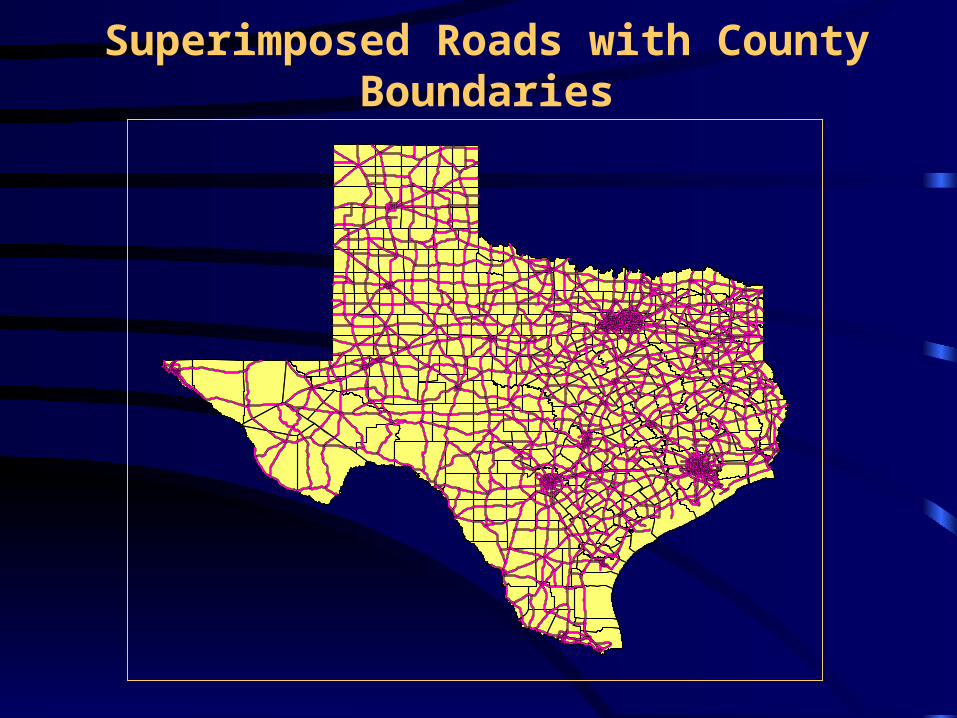
Superimposed Roads with County Boundaries
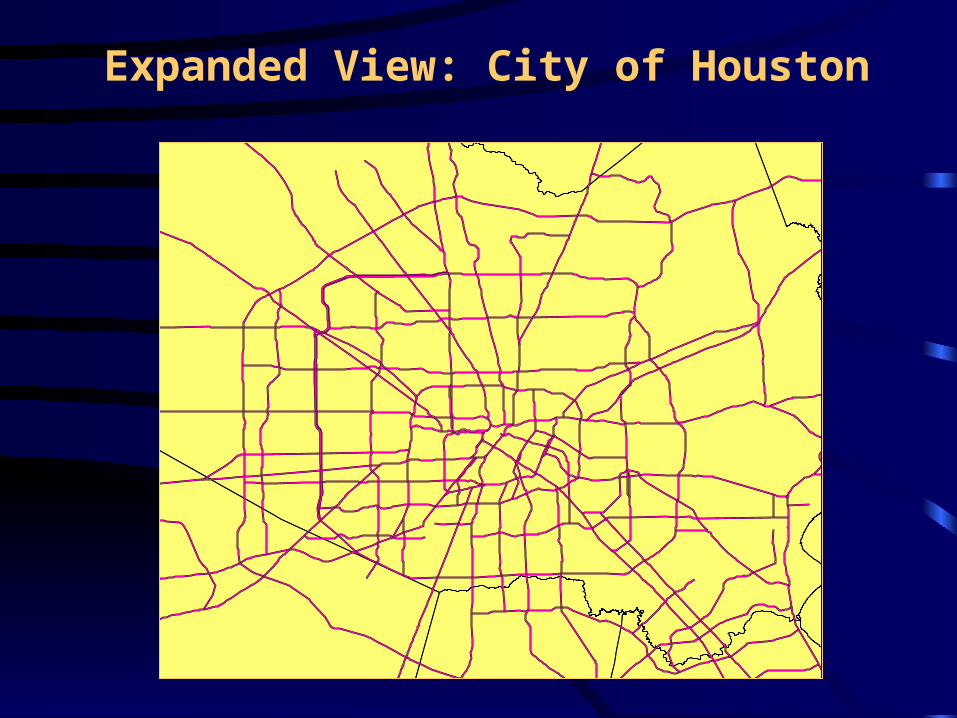
Expanded View: City of Houston
Geographical Information System (GIS)
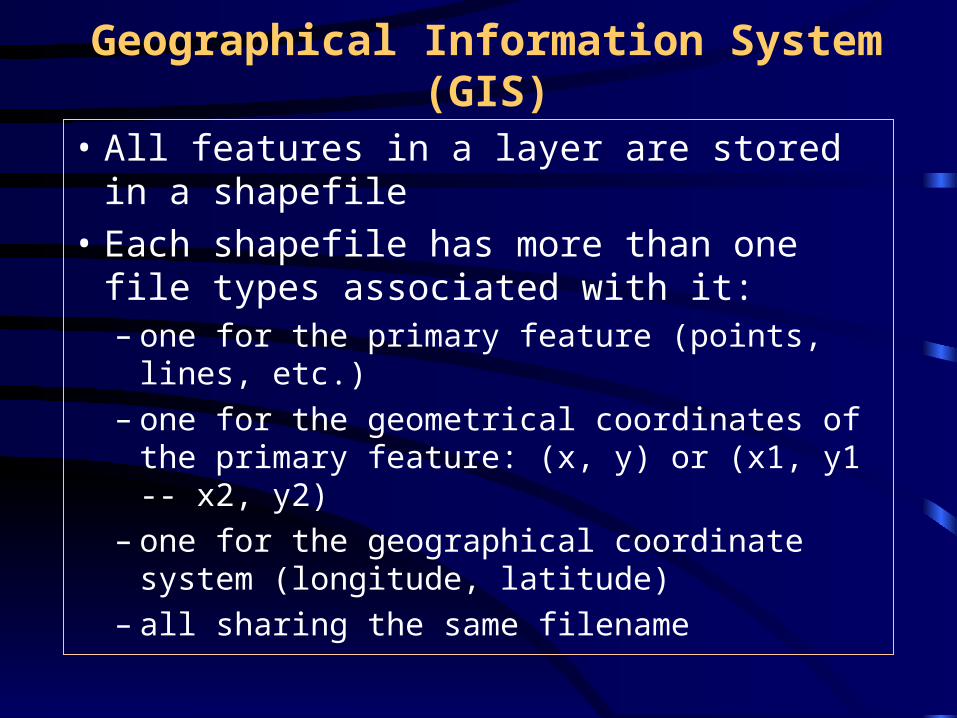
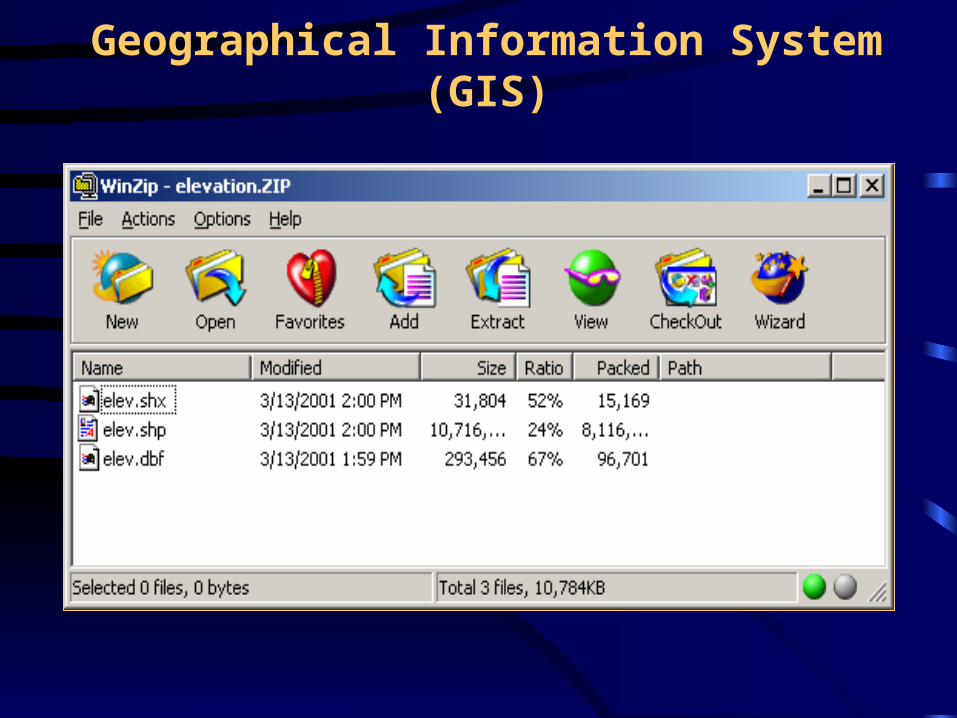
• All features in a layer are stored in a shapefile
• Each shapefile has more than one file types associated with it: – one for the primary feature (points, lines, etc.)– one for the geometrical coordinates of the
primary feature: (x, y) or (x1, y1 -- x2, y2) – one for the geographical coordinate system
(longitude, latitude)– all sharing the same filename
Geographical Information System (GIS)
Geographical Information System (GIS)
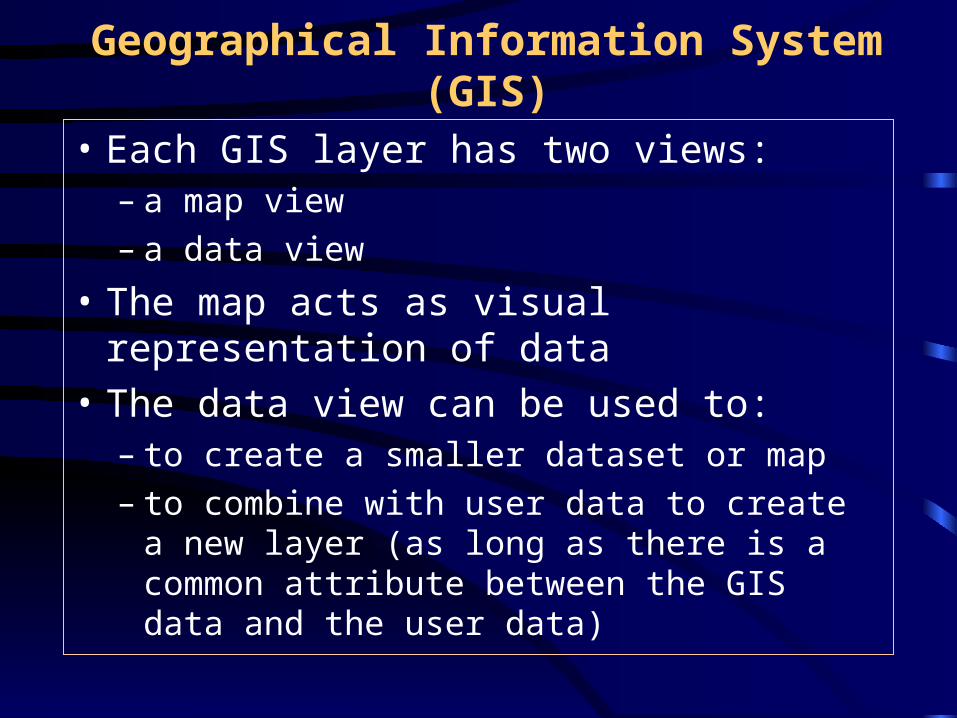
• Each GIS layer has two views:– a map view– a data view
• The map acts as visual representation of data
• The data view can be used to:– to create a smaller dataset or map– to combine with user data to create a new layer
(as long as there is a common attribute between the GIS data and the user data)
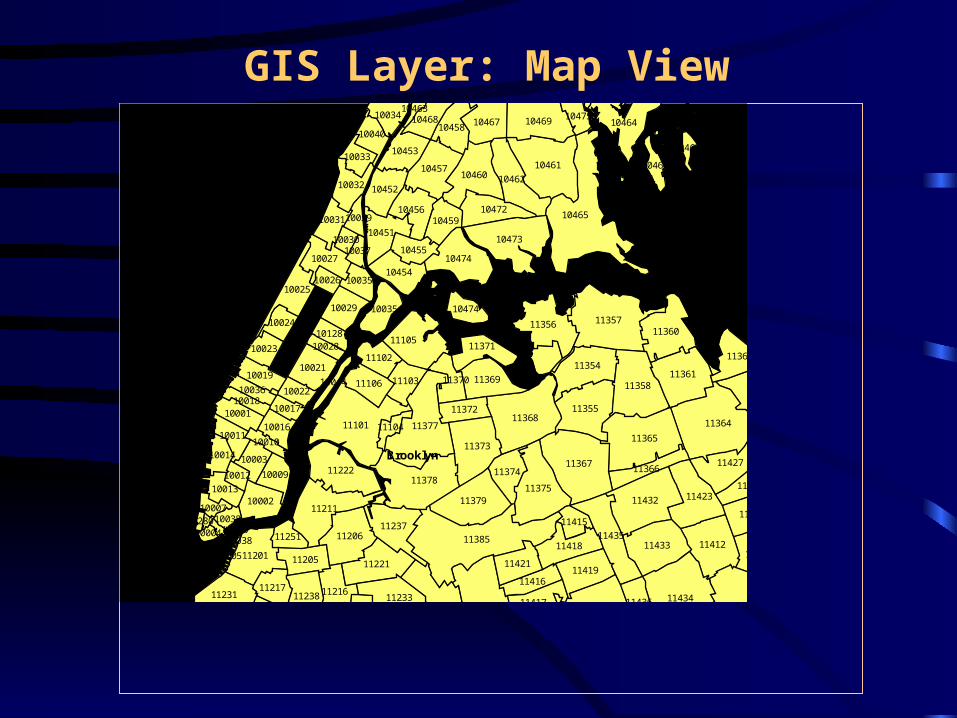
GIS Layer: Map View
Manhattan
Bronx
Brooklyn
11696
11385
10465
11413
11364
1143411208
11101
11357
11207
11367
1137711368
11365
11414
11378
10461
11215
11232
11432
10473
11354
11375
11358
11420
11422
11426
11203
11211
11362
11379
11355
11373
11361
11433
11222
1136011105
10460
11412
11423
11356
11427
11236
10469
1143511206
10474
11231
11212
11201
1046210457
11221
11233
11237
11239
11429
10464
11369
11411
11419
11226
11418
11417
10472
11213
11238
10451
10467
10456
10025
10454
11363
10452
10021
11216
11004
10453
11371
10027
10458
10002
11421
11374
11220
11225
10029 10035
11106
11205
10032
11218
10459
11436
11217
11428
11366
1137011103
11102
11372
10455
11416
10001
10019
10031
10468
10040
10009
10034
10474
10011
10023
10003
10016
10013
10035
10033
11415
11430
10014
10024
11251
10022
10128
10036
10475
10464
1001810017
11104
10026
10010
10039
10012
10007
10028
10030
10038
10037
10044
10464
10004
11219
10463
1000510280
10038
11234
10005
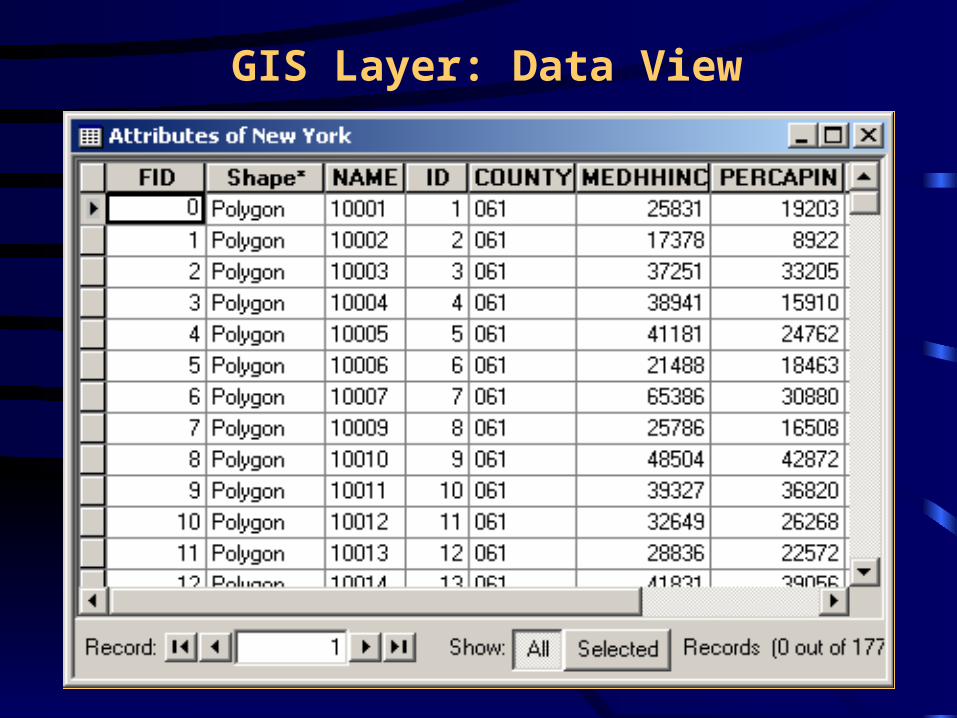
GIS Layer: Data View
Geographical Information System (GIS)
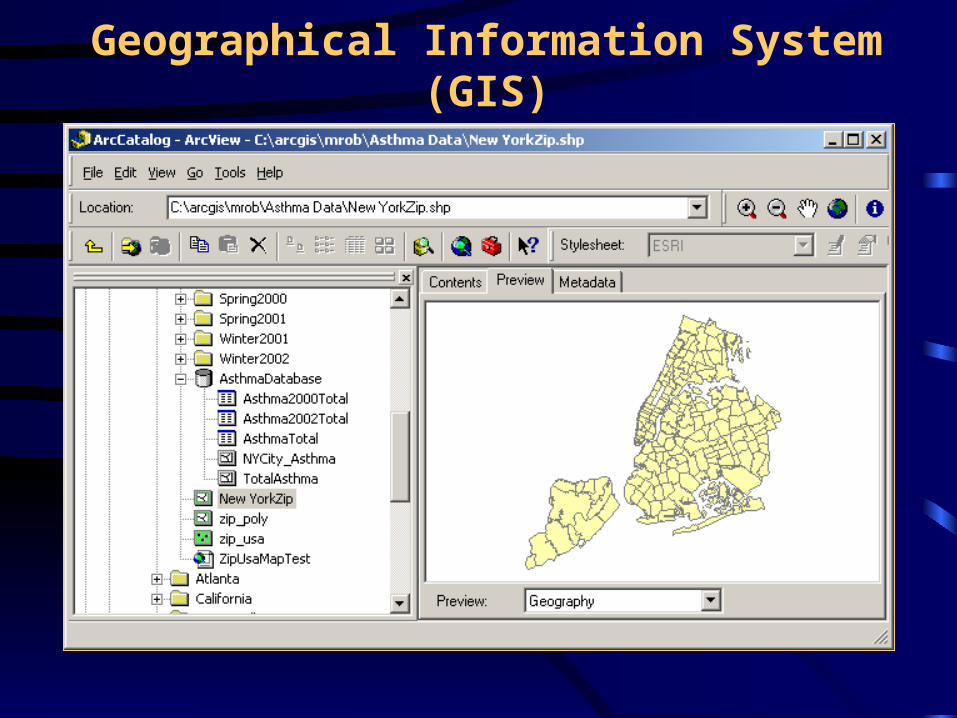
• Most commonly used GIS tool is ArcView from ESRI (Environmental Systems Research Institute)– It uses a geodatabase to store all features– Can be used as a desktop or multi-user database
• Many federal, state, and local government agencies publish GIS data in the ArcView’s shapefile format
• These files can be downloaded from the Web
Geographical Information System (GIS)
Asthma Epidemic: An Example
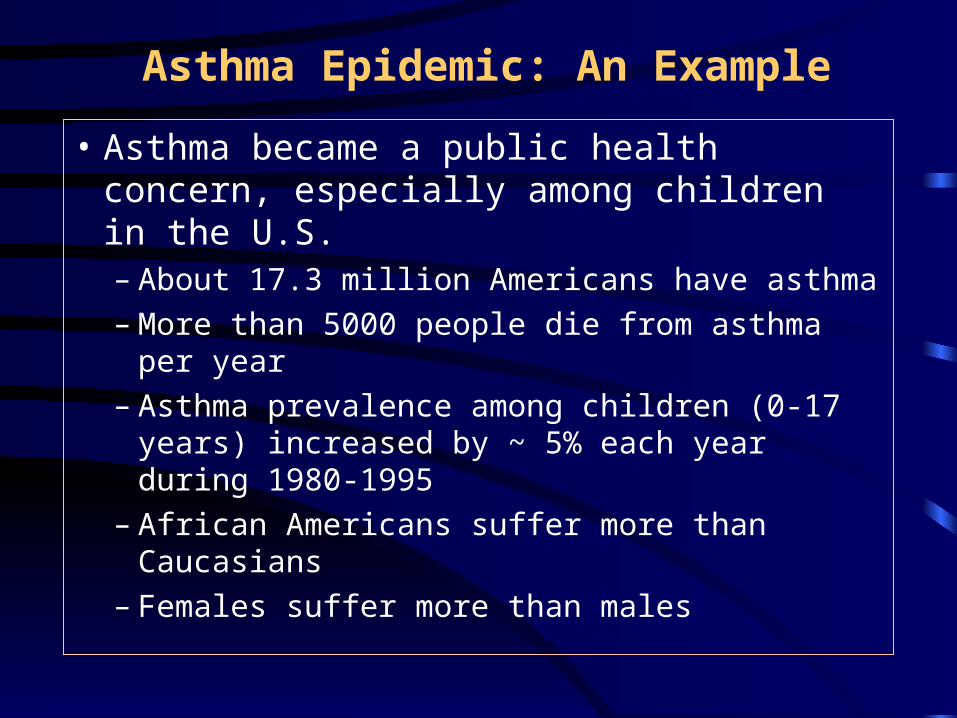
• Asthma became a public health concern, especially among children in the U.S.– About 17.3 million Americans have asthma– More than 5000 people die from asthma per year– Asthma prevalence among children (0-17 years)
increased by ~ 5% each year during 1980-1995– African Americans suffer more than Caucasians– Females suffer more than males
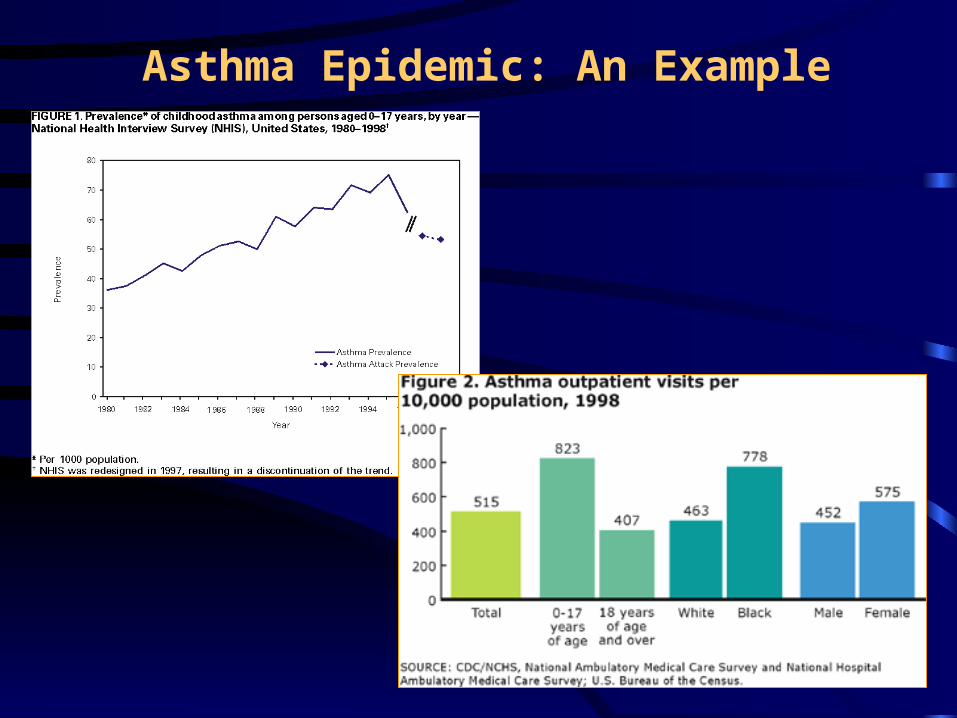
Asthma Epidemic: An Example
Applications of GIS: Spatial Distribution of Asthma
• Most of the asthma data come from hospitalization records or surveying a localized population
• These data do not contain any spatial or geographical coordinate, but use zip code
• However, they can be joined with a spatial dataset such as a zip code layer to create a asthma layer
• Zip code from the two datasets can be used as a join parameter
Asthma Study of New York City
• Asthma data came from a survey of middle- and high schools students in the NY City
• The students were in the age group of 15-18 years
• About 4300 datasets were collected in two years from various boroughs of the city
• Data were summarized by zip code, borough, gender, and race
• ArcView GIS software was used for maps
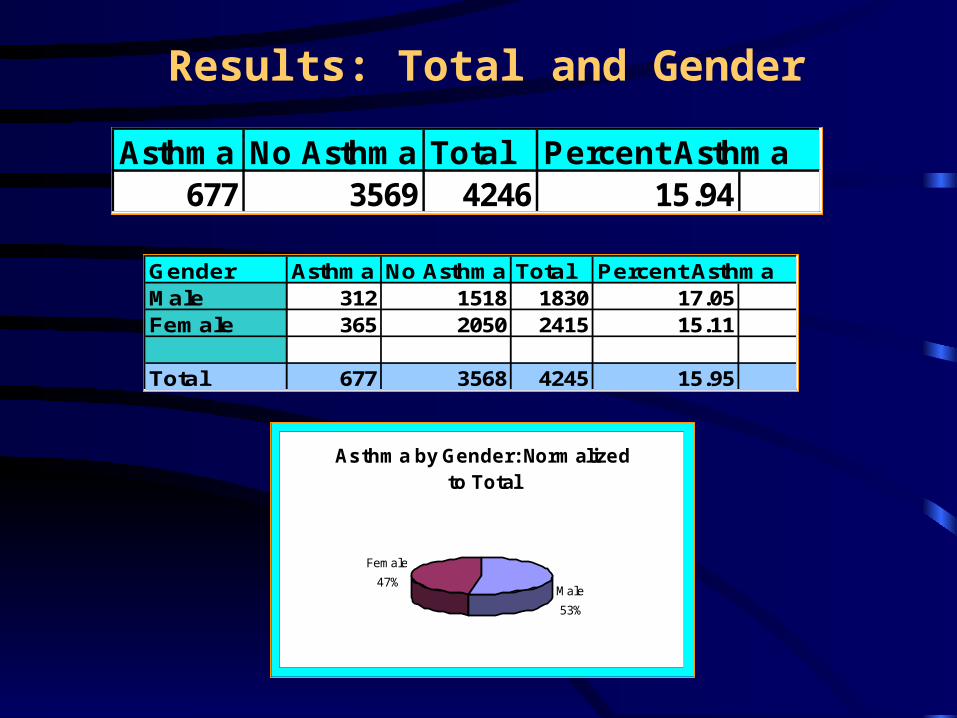
Results: Total and Gender
Asthma No Asthma Total Percent Asthma677 3569 4246 15.94
Gender Asthma No Asthma Total Percent AsthmaMale 312 1518 1830 17.05Female 365 2050 2415 15.11
Total 677 3568 4245 15.95
Asthma by Gender: Normalized to Total
Male
53%
Female
47%
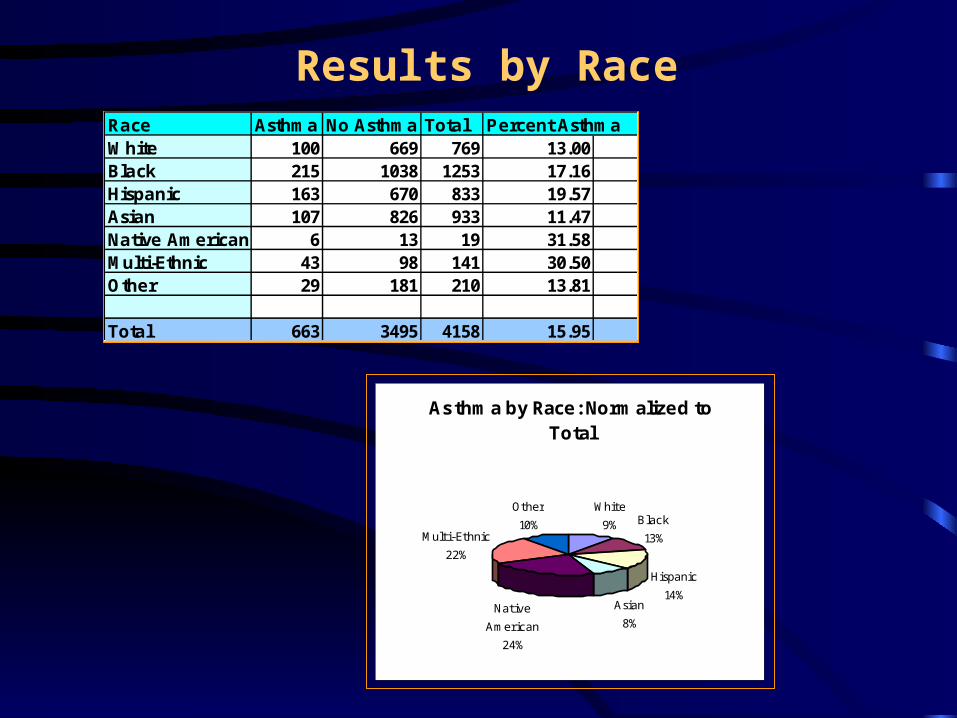
Results by RaceRace Asthma No Asthma Total Percent AsthmaWhite 100 669 769 13.00Black 215 1038 1253 17.16Hispanic 163 670 833 19.57Asian 107 826 933 11.47Native American 6 13 19 31.58Multi-Ethnic 43 98 141 30.50Other 29 181 210 13.81
Total 663 3495 4158 15.95
Asthma by Race: Normalized to Total
Asian
8%
White
9%
Other
10% Black
13%
Hispanic
14%Native
American
24%
Multi-Ethnic
22%
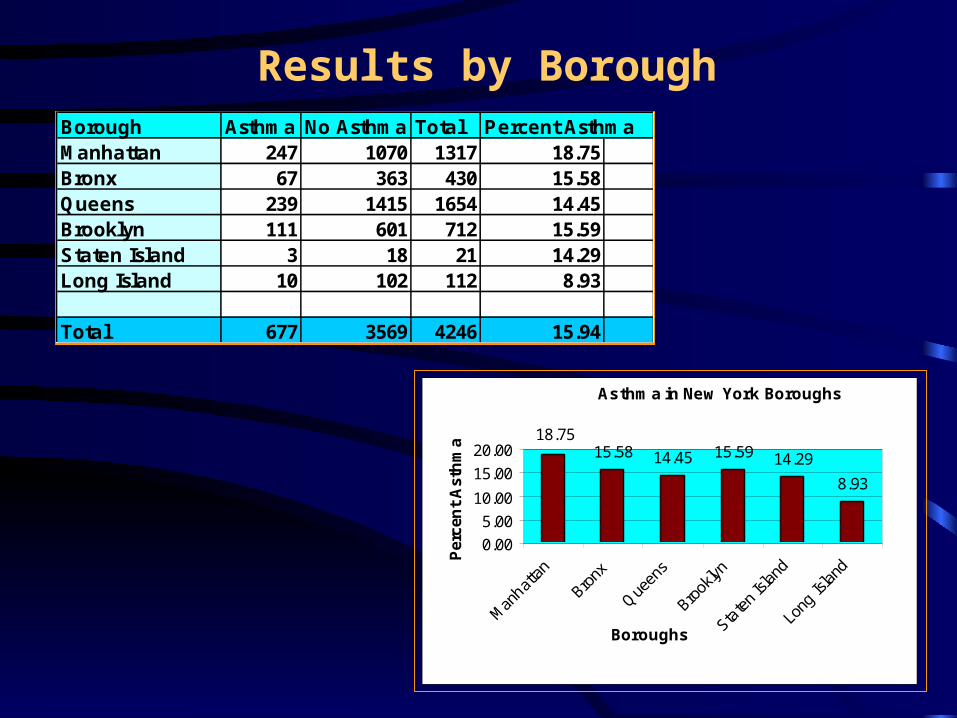
Results by BoroughBorough Asthma No Asthma Total Percent AsthmaManhattan 247 1070 1317 18.75Bronx 67 363 430 15.58Queens 239 1415 1654 14.45Brooklyn 111 601 712 15.59Staten Island 3 18 21 14.29Long Island 10 102 112 8.93
Total 677 3569 4246 15.94
Asthma in New York Boroughs
15.58 14.45 15.59 14.29
8.93
18.75
0.00
5.00
10.00
15.00
20.00
Man
hatta
n
Bronx
Que
ens
Brook
lyn
State
n Isl
and
Long
Isla
nd
Boroughs
Per
cen
t A
sth
ma
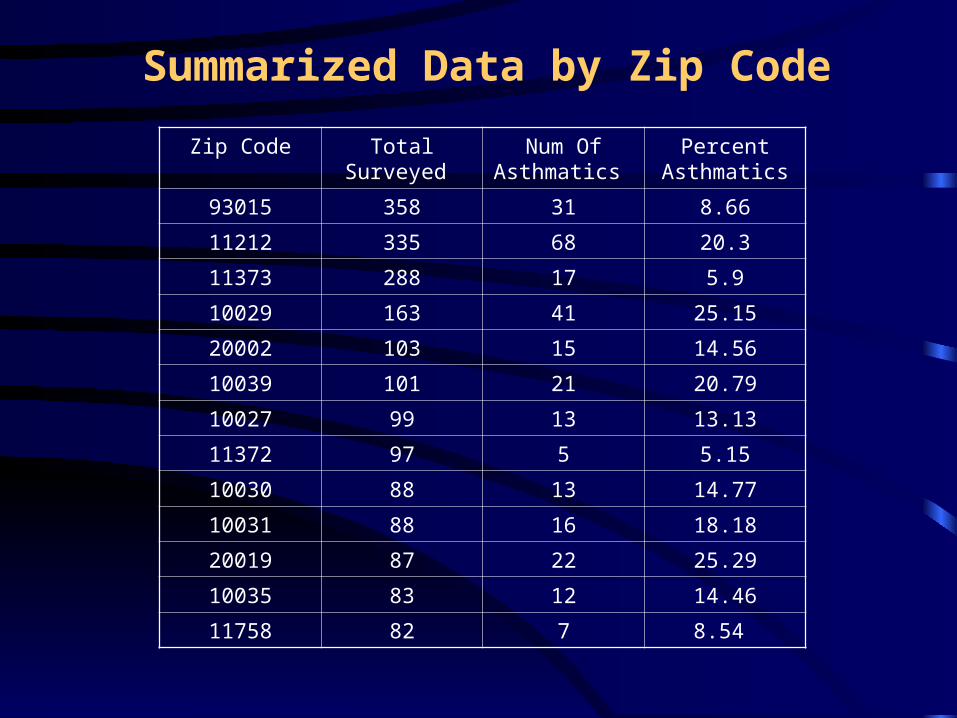
Summarized Data by Zip Code
Zip Code Total Surveyed
Num Of Asthmatics
Percent Asthmatics
93015 358 31 8.66
11212 335 68 20.3
11373 288 17 5.9
10029 163 41 25.15
20002 103 15 14.56
10039 101 21 20.79
10027 99 13 13.13
11372 97 5 5.15
10030 88 13 14.77
10031 88 16 18.18
20019 87 22 25.29
10035 83 12 14.46
11758 82 7 8.54
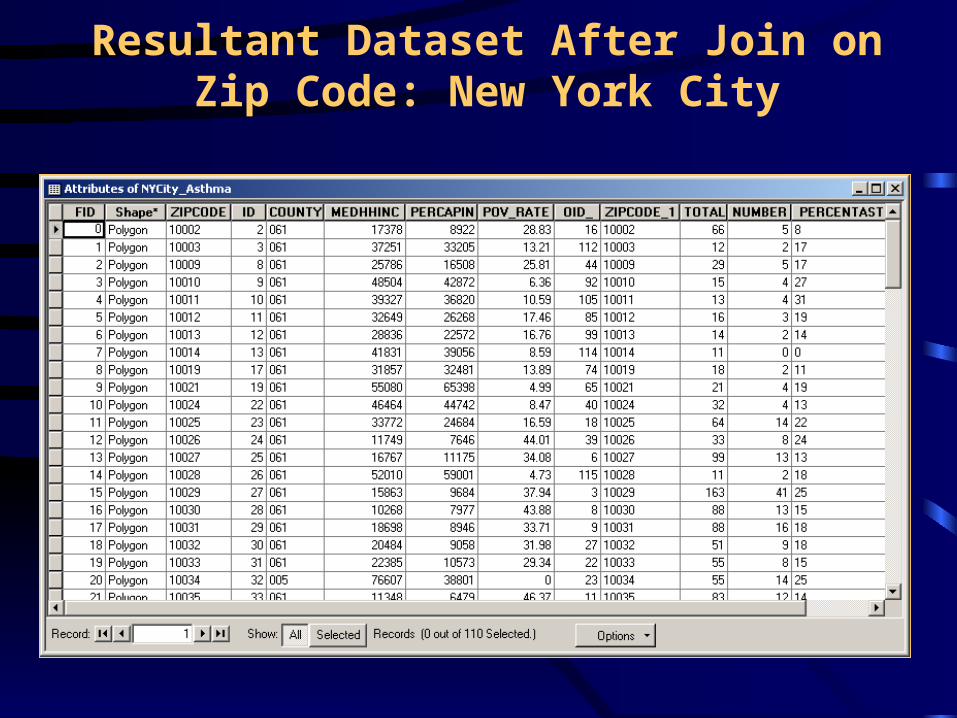
Resultant Dataset After Join on Zip Code: New York City
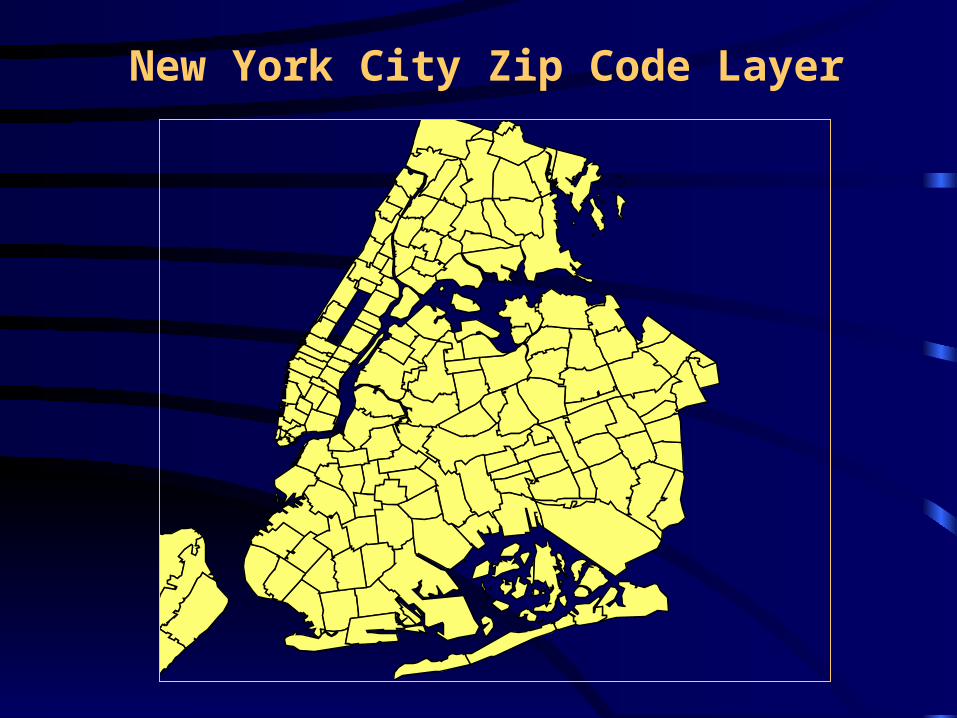
New York City Zip Code Layer
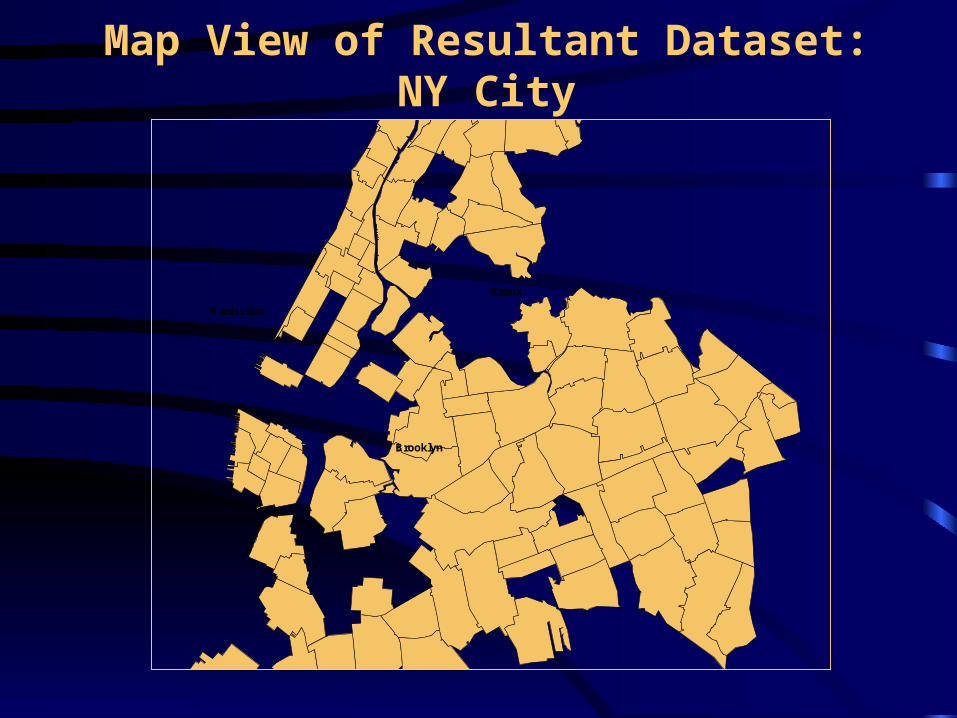
Map View of Resultant Dataset: NY City
Manhattan
Bronx
Brooklyn
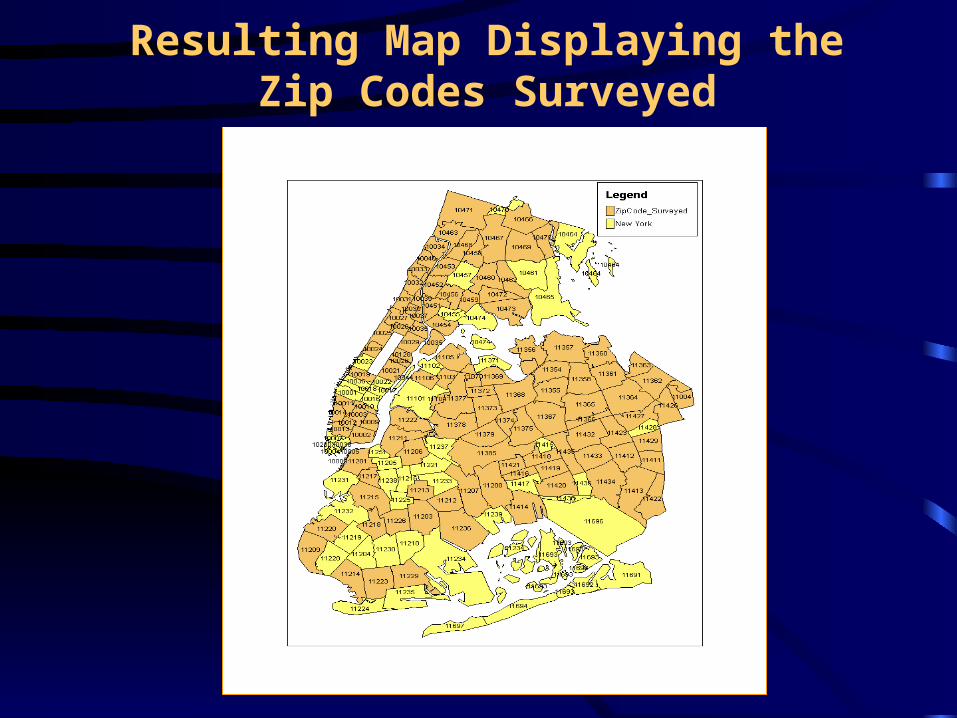
Resulting Map Displaying the Zip Codes Surveyed
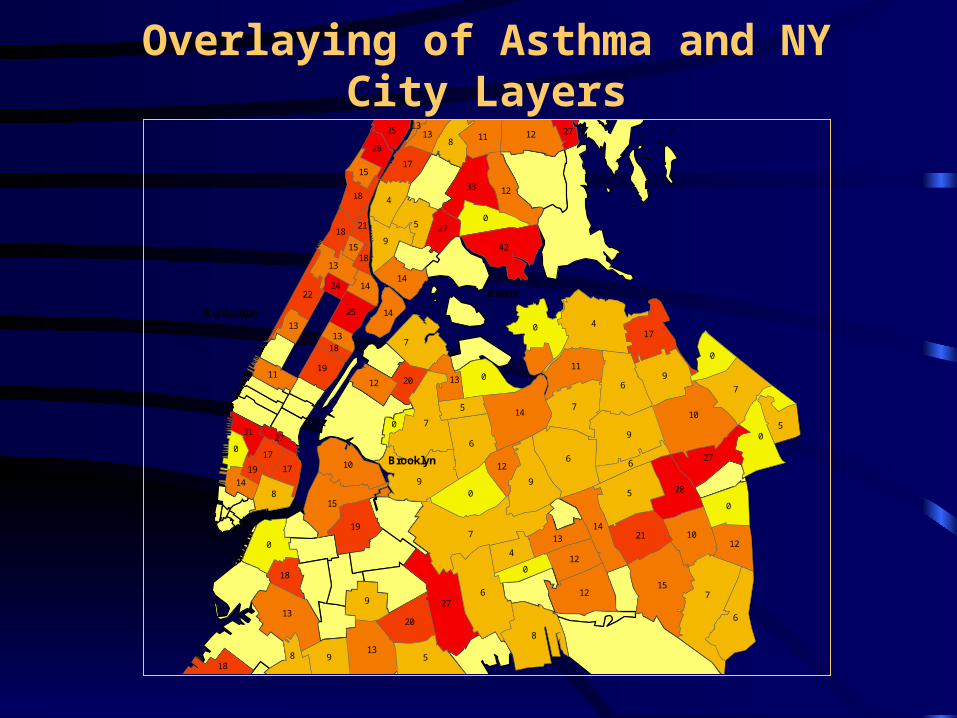
Overlaying of Asthma and NY City Layers
Manhattan
Bronx
Brooklyn
7
76
4
6
79
8
95
9
6
6
0
7
0
7
6
9
7
0
5
10
15
0
27
0
14
0
9
13
0
9
429
5
110
4
12
5
13
15
8
8
4
21
10
17
33
10
28
8
27
12
1419
6
20
12
5
0
12
12
13
0
11
22
14
19
17
13
12
18
25 14
12
18
27
18
0
132011
18
13
28
17
25
31
17
14
14
15
1313
27
24
27
21
19
18
1518
13
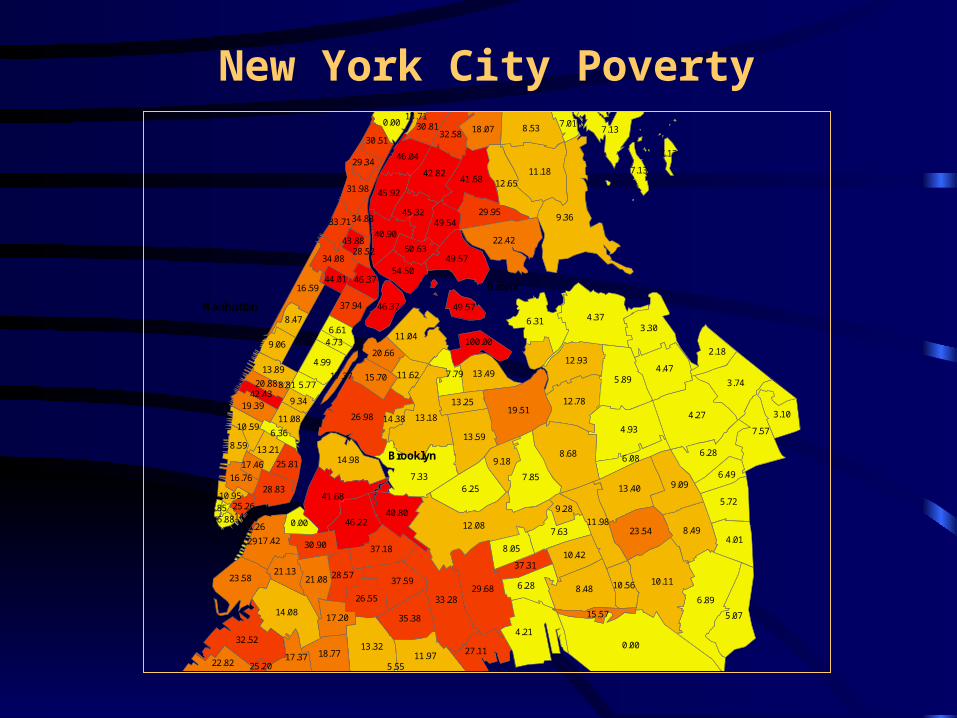
New York City Poverty
Manhattan
Bronx
Brooklyn
0.00
9.36
12.08
6.89
4.27
4.37
8.68
4.93
4.21
10.11
7.33
29.68
26.98
33.28
13.18
7.85
5.89
19.51
8.48
5.07
7.57
3.74
6.25
11.18
4.47
14.08
32.52
13.40
22.42
3.30
8.49
9.09
12.93
6.31
6.28
8.53
13.32
41.68
12.78
13.59
23.54
14.98
5.72
11.04
41.68
7.13
11.97
11.98
4.01
46.22
49.57
23.58
35.38
17.427.63
12.65
6.28
42.82
37.18
37.59
40.80
27.11
2.184.99
3.10
13.49
10.42
18.77
8.05
9.18
29.95
26.55
21.08
40.90
18.07
45.32
16.59
54.50
6.49
45.92
6.08
28.57
46.04
7.79
34.08
32.58
28.83
22.82
17.20
37.94 46.37
15.70
30.90
31.98
17.37
0.00
49.54
10.56
21.13
9.06 100.00
11.62
20.66
13.25
50.63
37.31
9.28
19.39
8.59
8.47
13.89
0.00
33.71
30.81
30.51
25.81
49.57
10.59
13.21
5.77
11.08
16.76
6.61
46.37
7.01
29.34
15.57
7.13
9.34
20.88
6.36
42.43
4.73
14.38
44.01
34.83
17.46
10.95
43.88
25.26
28.52
7.13
17.37
6.88
25.20
13.71
3.8514.29
8.81
25.26
5.55
14.29
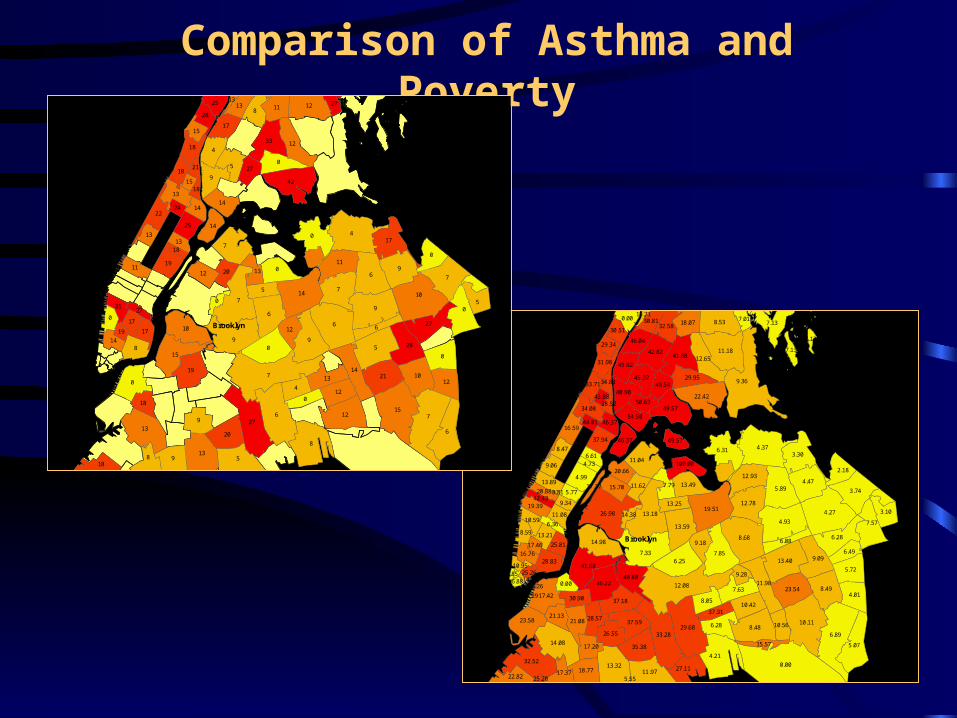
Comparison of Asthma and Poverty
Manhattan
Bronx
Brooklyn
0.00
9.36
12.08
6.89
4.27
4.37
8.68
4.93
4.21
10.11
7.33
29.68
26.98
33.28
13.18
7.85
5.89
19.51
8.48
5.07
7.57
3.74
6.25
11.18
4.47
14.08
32.52
13.40
22.42
3.30
8.49
9.09
12.93
6.31
6.28
8.53
13.32
41.68
12.78
13.59
23.54
14.98
5.72
11.04
41.68
7.13
11.97
11.98
4.01
46.22
49.57
23.58
35.38
17.427.63
12.65
6.28
42.82
37.18
37.59
40.80
27.11
2.184.99
3.10
13.49
10.42
18.77
8.05
9.18
29.95
26.55
21.08
40.90
18.07
45.32
16.59
54.50
6.49
45.92
6.08
28.57
46.04
7.79
34.08
32.58
28.83
22.82
17.20
37.94 46.37
15.70
30.90
31.98
17.37
0.00
49.54
10.56
21.13
9.06 100.00
11.62
20.66
13.25
50.63
37.31
9.28
19.39
8.59
8.47
13.89
0.00
33.71
30.81
30.51
25.81
49.57
10.59
13.21
5.77
11.08
16.76
6.61
46.37
7.01
29.34
15.57
7.13
9.34
20.88
6.36
42.43
4.73
14.38
44.01
34.83
17.46
10.95
43.88
25.26
28.52
7.13
17.37
6.88
25.20
13.71
3.8514.29
8.81
25.26
5.55
14.29
Manhattan
Bronx
Brooklyn
7
76
4
6
79
8
95
9
6
6
0
7
0
7
6
9
7
0
5
10
15
0
27
0
14
0
9
13
0
9
429
5
110
4
12
5
13
15
8
8
4
21
10
17
33
10
28
8
27
12
1419
6
20
12
5
0
12
12
13
0
11
22
14
19
17
13
12
18
25 14
12
18
27
18
0
132011
18
13
28
17
25
31
17
14
14
15
1313
27
24
27
21
19
18
1518
13
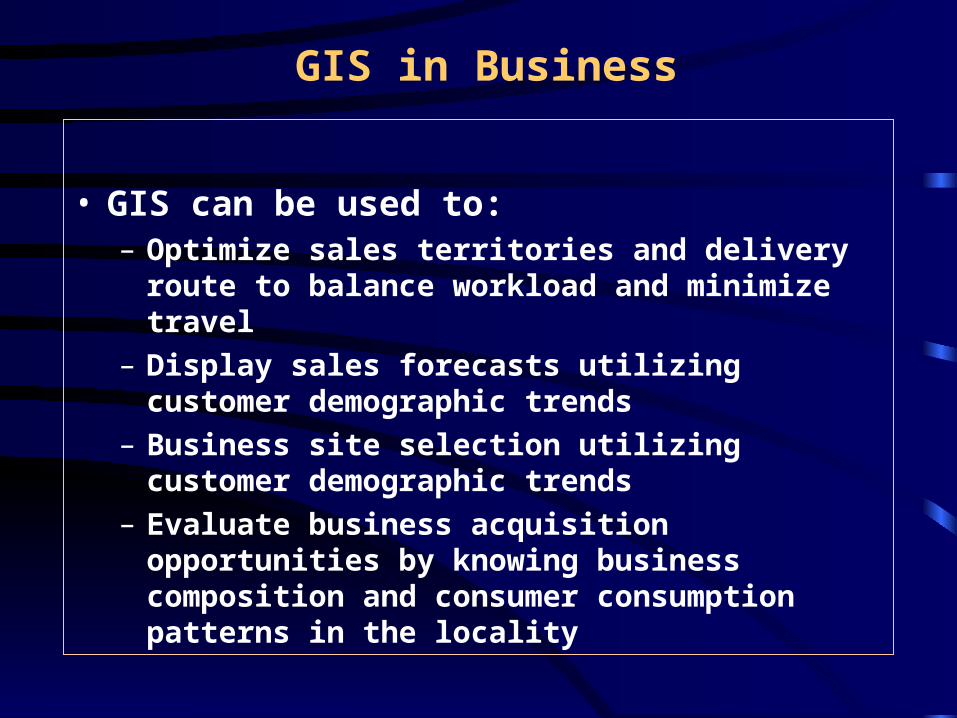
GIS in Business
• GIS can be used to: – Optimize sales territories and delivery route to
balance workload and minimize travel– Display sales forecasts utilizing customer
demographic trends– Business site selection utilizing customer
demographic trends – Evaluate business acquisition opportunities by
knowing business composition and consumer consumption patterns in the locality
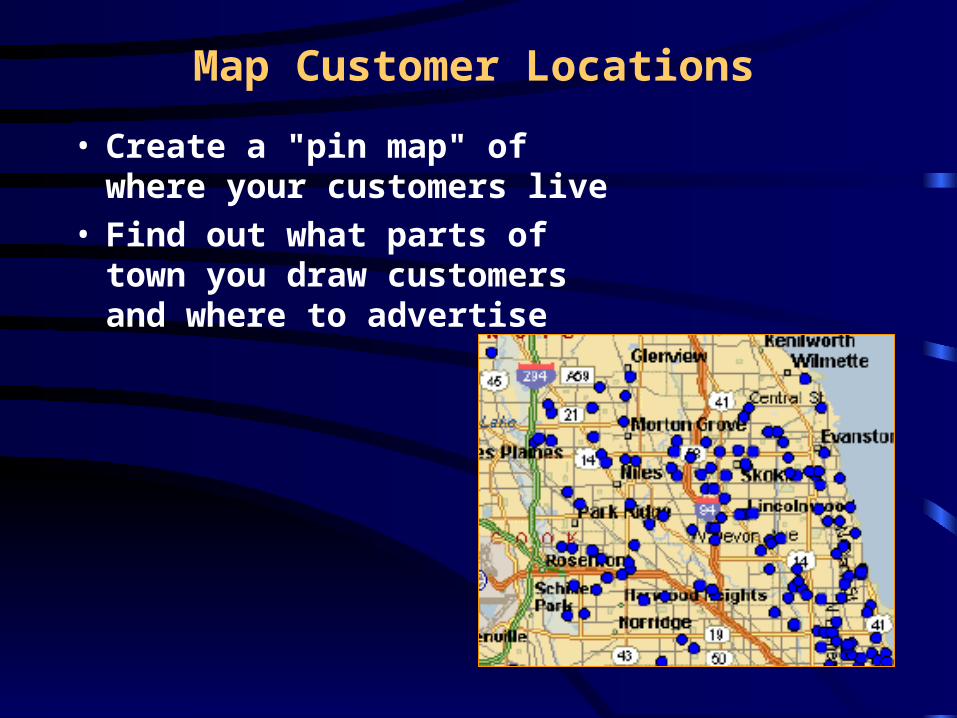
Map Customer Locations
• Create a "pin map" of where your customers live
• Find out what parts of town you draw customers and where to advertise
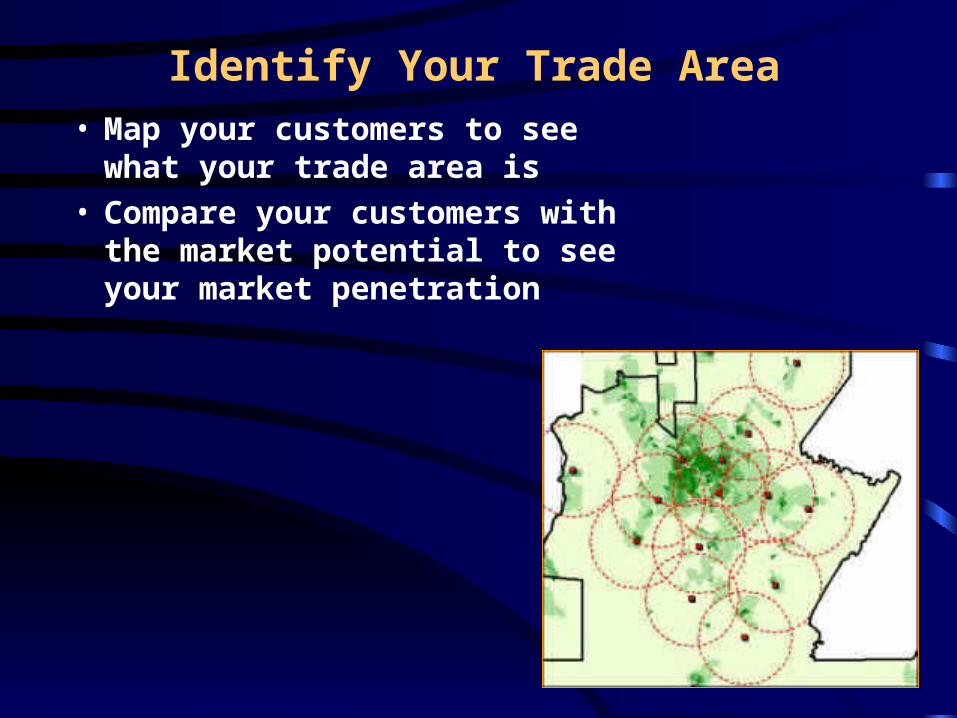
Identify Your Trade Area • Map your customers to see
what your trade area is • Compare your customers
with the market potential to see your market penetration
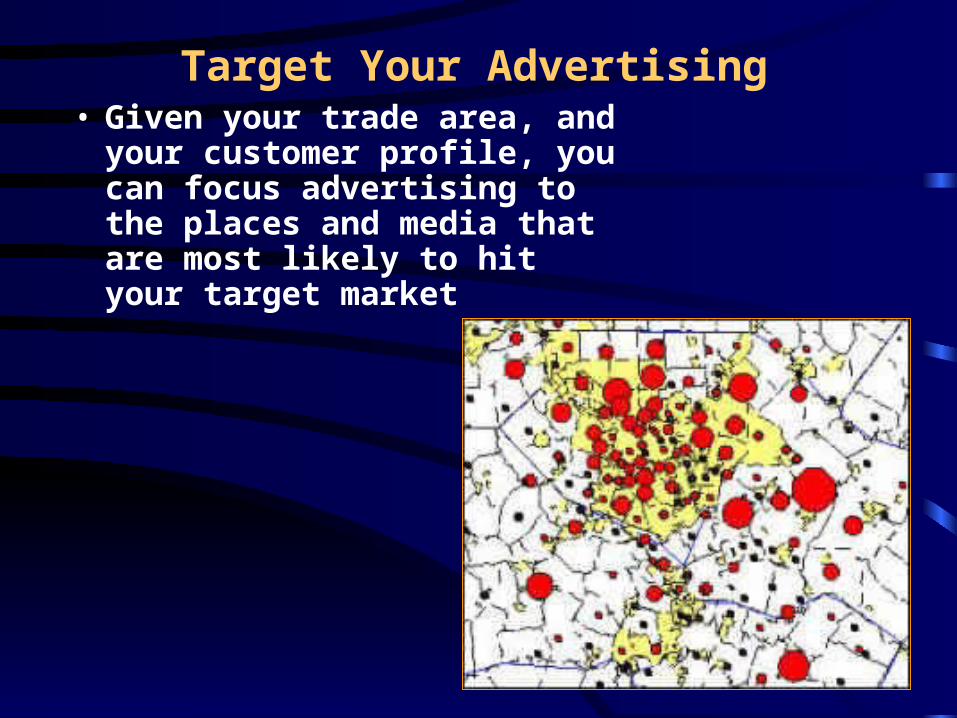
Target Your Advertising • Given your trade area,
and your customer profile, you can focus advertising to the places and media that are most likely to hit your target market
Business Geography: A New Discipline
• The combined use of computer-mapping, Internet, database technologies, and location-allocation modeling techniques will become a particularly important set of skills for many business students whose first jobs after graduation involve real estate, urban, demographic, retail, marketing, environmental, transportation, international trade or investment analyses.
• A new discipline called “Business Geography” is evolving in many business schools across the country
Conclusion
• We have provided a brief overview of a Geographical Information System
• GIS uses various layers to create a map and each layer has two views: a dataset and a map
• Most layers are available from local, state, and federal government agencies
• Asthma epidemiology is used as an example to illustrate how user data can be combined with GIS data and make further decisions for research or healthcare planning
• We have also highlighted on Business Geograhy, an evolving program in business schools