Embed Size (px)
Citation preview

Understanding The City’s
Budget

City of Long Beach Demographics
GOVERNMENT
The City of Long Beach, California covers approximately 52 square miles on the southern coast of Los Angeles County. With a current population of approximately 481,000, Long Beach is the second largest city in Los Angeles County and the fifth largest city in the state. It is a diverse and dynamic city that, based on the 2000 Census, has the following ethnic breakdown: 35.8% Hispanic, 33.1% White, 14.5% Black, 11.9% Asian, and 4.7% all other ethnicities.
Long Beach was originally incorporated in 1888. After a short period of disincorporation, the City was reincorporated on December 3, 1897. Since 1921, Long Beach has been governed as a charter city, and operates under a Council-Manager form of government.
City of Long Beach Ethnic Diversity
Black 14.5% Other
4.7%
White33.1%
Hispanic35.8%
Asian11.9%
The City Council is made up of nine members, elected by district. The Mayor is chosen in a citywide election to serve as the full-time chief legislative officer of the City. Although the Mayor does not vote, the Mayor presides over City Council meetings, presents the annual budget to the City Council and has veto power over Council actions. The Vice-Mayor is elected by the Council from among its members. The City has three other full-time elected officials: City Attorney, City Auditor and City Prosecutor. The City Council appoints the City Clerk and City Manager. The Mayor nominates and the City Council approves members to various boards and commissions. The Civil Service Commission, Board of Water Commissioners and Board of Harbor Commissioners oversee operations of their respective departments while all other City departments report directly to the City Manager. The City Manager serves at the discretion of the City Council. As head of the municipal government, the City Manager is responsible for the efficient administration of all departments, with the exception of the elective offices and the three semi-autonomous commissions. The City currently employs approximately 5,614 full-time equivalent positions within 22 departments. In addition to the usual municipal services of police, fire, public works, library, and parks and recreation, the City of Long Beach owns and operates a leading deep-water port, offshore and onshore oil production, a gas utility, a water utility, a convention and entertainment center, aquarium, museum, two historic ranchos, a commercial airport, marinas and golf courses. EDUCATION
The Long Beach Unified School District is the third largest public school system in California and serves over 95,000 kindergarten through twelfth grade students. The district’s 96 schools are located in Long Beach, Signal Hill, Lakewood, and on Catalina Island. Long Beach City College has an enrollment exceeding 32,000 students. The college offers 130 Associate of Arts/Science degree programs, and the opportunity to complete up to two years in any of 81 baccalaureate programs for transfer to a four-year college or university.

California State University, Long Beach (CSULB) is the State University system's second largest campus. With approximately 34,714 students, CSULB offers 80 baccalaureate programs, 66 master degree programs, and one joint doctoral degree. BUSINESS AND INDUSTRY The City of Long Beach is a center for aerospace, petroleum, shipping and tourism, along with a wide variety of office and retail opportunities. Downtown alone is home to 4.2 million square feet of commercial office space.
R
1
Currently, the largest employer, within the city is the Boeing Corporation which operates a 424-acre facility at the Long Beach Airport where they employ approximately 10,500 persons. The facility exceeds 6.7 million square feet of space and is currently utilized for the production of the Boeing 717 commercial jetliner, the C-17 military transport plane, and program support for production lines in other locations. In what will be one of the region’s largest land redevelopment efforts, Boeing is in the process of converting 260 acres of their facility from industrial to mixed commercial/residential use in an effort to provide quality industrial, research and development space. The City’s second largest employer, within the city is the Long Beach Unified School District, which operates 92 regular and four charter schools. The district’s workforce of 9,064 employees ensures the success of students by maintaining high standards, a commitment to excellence, and by offering a comprehensive scholastic program.
Other Long Medic
Oil prBeacInjectlife inincrea
ank
Employer
Employees As of May 2004
1 Boeing 10,5002 Long Beach Unified School District 9,0643 CSULB (includes part-time) 6,007 4 City of Long Beach (includes part-time) 5,8545 L.B. Memorial Medical Center 3,5006 Long Beach City College 2,0007 Verizon 2,0008 United States Postal Service 1,9009 Veterans Adminstration Medical Center 1,7000 St. Mary Medical Center 1,634
major employers in the city include California State University, Long Beach; the City of Beach; the Long Beach Memorial Medical Center; and the Veteran’s Administration al Center.
oduction, private and municipally- owned, continues to be an important business in Long h with both offshore and onshore facilities. The Long Beach Unit Optimized Water-Flood ion Process, authorized by State legislation, has improved oil recovery and lengthened field the Wilmington Oil Field. Continued application of new technology is expected to further se oil recovery.

The Port of Long Beach remains one of the busiest container ports in the world. During Fiscal Year 2003, throughput exceeded approximately 4.4 million twenty-foot equivalent units (TEU). International trading partners include the Pacific Rim nations of Japan, China, Taiwan, and Korea. In addition to containers, the Harbor facility handles crude and refined petroleum products, dry bulk such as coal, coke and cement; automobiles, lumber, paper and fruit; steel and scrap metal. As California’s largest urban Enterprise Zone, Long Beach offers businesses five categories of State tax incentives aimed at stimulating new private investment, business expansion and job creation. These incentives include: sales tax credits; hiring tax credits; business expense deductions; net operating loss carryover and a net interest deduction for lenders. Over 10,000 businesses of varying sizes are in the Enterprise Zone. The Enterprise Zone designation is in place until 2007. Tourism continues to be a growing industry in Long Beach, and the City attracts over 5.5 million visitors a year. A vital part of that industry is the Long Beach Convention and Entertainment Center. The Center’s facilities include a 224,000 square-foot exhibit hall, 83,000 square feet of meeting room space, a ballroom able to comfortably seat 1,600, a 13,600-seat arena, and two theaters in the elegant Long Beach Performing Arts Center. Additionally, over 2,500 hotel rooms are within walking distance of the Convention Center. The world-class Long Beach Aquarium of the Pacific, on Rainbow Harbor, is located across the water from the Convention Center, Shoreline Village and the historic Queen Mary. The Aquarium is home to 12,000 ocean animals from over 550 species indigenous to the Pacific Rim. It is a milestone in design, architecture and technology for the 21st century. MAJOR DEVELOPMENTS The Pike at Rainbow Harbor, a 350,000-square foot commercial complex consisting of restaurant, retail, and entertainment uses, continues to attract new tenants and customers on an ongoing basis. The Pike is becoming a major waterfront attraction located between the Convention Center, the Aquarium of the Pacific and Rainbow Harbor. In addition, the adjacent Park at Harbour View is a $250 million multi-phase, mixed-use development currently under construction and will include 538 apartments, 246 condominiums, a 500-room hotel, as well as office and retail space. Ocean Villas, a $100 million luxury high-rise residential development at 350 East Ocean Boulevard, which will consist of 17-story twin towers containing 556 condominium units, is nearly completed. CityPlace, a major component in the revitalization of the downtown area, has come online and continues to add retail and residential opportunities for the downtown community. This $75 million mixed-use development includes 370,000-square feet of urban scaled destination retail anchored by Wal-Mart; 85,000-square feet of neighborhood retail anchored by Albertson’s and Sav-On; Nordstrom Rack and Ross stores; and up to 350 units of market rate housing for rent and for sale.

Carnival Cruises opened up its western United States cruise ship terminal at the Queen Mary in April 2003. The terminal is home to two 855-foot cruise ships with approximately 330,000 annual passengers. This project also included renovation of a one-third of the former Spruce Goose Dome for a Carnival Cruise Line embarkation facility; a five-story, 1,300-space parking structure; and a new fire station with rescue boats for the surrounding area.
Passenger and aircraft traffic continue to be robust at the Long Beach Airport, as air carrier operations
approach the 41-flight level permitted under the City's Noise Ordinance. Airport capital projects for FY 05 are focused on safety, security, and major infrastructure rehabilitation. The rehabilitation of Runway 12-30, the Airport's main runway for air carriers, is the primary project that will be undertaken this year. Two key public safety projects were completed in FY 04 --the Emergency Communications and Operations Center and the North Division Police Station-- while the Public Safety Building Retrofit and refurbishment of Fire Station #1 are expected to be complete during FY 05. These projects will provide much needed facilities and will assist the Police and Fire Departments in continuing to deliver quality public safety services to both residents and visitors. Future projects already underway include master planning efforts and coordination with Boeing Realty Company, as mentioned above, for their 260-acre “PacifiCenter” project located adjacent to the Long Beach Airport, as well as Seaport Hotel development. The West Gateway project, another mixed-use development, incorporates all or portions of seven blocks north of Broadway adjacent to the I-710 freeway with ground level neighborhood retail with approximately 800-1,000 residential units. As the cornerstone of this redevelopment effort, construction is nearing completion on Cesar Chavez Elementary School, which is schedule to open during the fall of 2004.

The Budget Process
The Fiscal Year 2005 (FY 05) Budget covers the period October 1, 2004 through September 30, 2005. The following is a description of the Budget Process and the Annual Budget document.
THE BUDGET PROCESS
Jan
Mar - Ju
May
Jul
Aug 1*
Aug 15
Aug
Sept
Sept 30
*On or
The Budget is the most important policy document the City produces on an annual basis. The program and financial decisions it embodies must reflect the will of the community through the policy direction of the City Council. This can only be achieved through a development process that encourages communication and transparency, seeking input from a diverse cross-section of the community, while offering opportunities for review and revision. The following is the general budget preparation process, which for the first time utilizes the City’s Three-Year Financial Strategic Plan (Plan) as a guide for budget development. Beginning in January, the City Manager, through Financial Management, provides clear budget development instructions to departments, requesting they begin updating their department’s Plan strategies and making initial estimates for their proposed and capital operating budgets. From March through June, departments complete their proposed budgets based on updated revenue and expenditure recommendations contained in the Plan. In July the City Manager assembles department proposals into a coherent Proposed Budget that reflects the economic environment, fiscal condition and priority needs of the City. A series of community events designed to encourage active public dialogue regarding the Proposed Budget is initiated in mid-March, culminating in the Budget’s adoption by the City Council in September. Activities include City Council Budget Oversight Committee (BOC) meetings, a citywide Budget Summit, neighborhood board, committee & commission meetings, and City Council budget workshops and
As mandated by the City Charter, the City Manager submits tAugust 1 to the Mayor for review. The Mayor reviews the Propwith any recommendations, to the City Council on or before Asubmits their recommendations to the City Council for consideCity Budget for City funds and departments must be adopted the new fiscal year.
FY 05 BUDGET PREPARATION CALENDAR
City Manager issues budget preparation policies and instructions to departments
n Departments complete their Plan updates and operating budget proposals City Council and BOC budget workshops initiated
CIP subcommittee reviews projects
City Manager previews Proposed Updated Plan and Proposed Budget at citywide Budget Summit
City Manager submits Proposed Budget and CIP budget to Mayor
* Mayor submits Annual Budget with recommendations to City Council and Community BOC submits recommendations to the City Council
Community input continues through staff budget presentations at neighborhood board, committee and commission meetings as well as City Council and BOC workshops
Weekly budget workshops and hearings continue at City Council meetings until Budget is adopted
* Budget adopted
before
hearings.
he Proposed Budget, on or before osed Budget and submits it, along ugust 15. Concurrently, the BOC
ration. By City Charter, the annual prior to October 1, the beginning of
THE BUDGET DOCUMENT The Budget document is divided into seven sections: Understanding the Budget, Performance Management Initiatives, Three-Year Financial Strategic Plan, Budget Summaries, Budgets by Department, Fund Summaries and the Capital Improvement Program. Understanding The Budget This section provides demographic and other information on the city’s government, educational base, economy and other information to provide a context for the City’s service environment and priorities. The Budget Process, the Budget document and the fundamentals of the City’s financial management are also discussed. Lastly, background information about the City’s main revenue sources is also provided. Performance Management Initiatives This section describes the City’s various activities implemented to maximize the efficiency and effectiveness of government services and programs, align the City’s major business processes, and provide a framework for identifying needed resource reallocation. Three-Year Financial Strategic Plan The Plan was designed to be a living document that must be updated annually to capture and reflect the changing fiscal and service delivery environment and to ensure that the cost/service reductions and revenue enhancing ideas were appropriate and reflected the will of the community. The Plan represents the culmination of six months of deficit reduction proposals, discussions and deliberation amongst the City Council, the community, employees throughout the organization and all City Manager-department directors, and provides additional recommendations to address changes in structural deficit assumptions. Budget Summaries Several summaries of department and fund budgets are provided, with multi-year comparisons of expenditures and revenue. Also included is a three-year schedule of Full-Time Equivalent staffing for each department. Budgets by Department The mission and goals of each department serve as the basis of their annual budgets. In this section, key information on the departments’ structure, mission, goals and services can be found. Achievements toward fulfilling the goals of the 2010 Strategic Plan for FY 04 are highlighted. For FY 05, each department identified key challenges and opportunities for achieving the department’s goals, and if relevant to the department, proposed structural deficit reduction measures as recommended in the Plan.

Detail on each department’s proposed financial and staffing requirements to maintain the City’s various services is provided. Expenditures are categorized consistently throughout the budget to show operational costs, using the following “characters of expense”: Salary, Wages, & Benefits; Materials, Supplies & Services; Internal Support; Capital Purchases; Debt Service; Transfers from Other Funds; and, Prior Year Encumbrances.
Fund Summaries
The Budget includes spending from many different “funds” that are required by State or Federal law, the City Charter and/or proper accounting practice. A fund consists of a separate set of accounts used to monitor the accomplishment of specified purposes, or uses of restricted revenue. Depending on the type of service provided, department expenditures may be authorized from a number of funds. Most traditional City services are funded through the General Fund. The Capital Improvement Program
The Capital Improvement Program (CIP), which presents expenditures for major construction or repair of City facilities and buildings. A committee of department representatives meets during the year to select projects to be initiated, determine the timeframe for each project, funding sources and the operating impacts on the General Fund. The CIP is based on a five-year program for investment in the City's infrastructure, which is adopted annually by the City Council as part of the budget process. A companion document, the Fiscal Year 2005 Capital Improvement Program describes capital improvements in greater detail. FINANCIAL INFORMATION Adjustments to the Budget
During a fiscal year, special circumstances may result in changes to department spending priorities. Appropriations are made at the fund and department level. Budget adjustments that require a modification to the amounts authorized by the Appropriations Ordinance require the approval of the City Council. Transfers between programs or “characters of expense” require City Manager approval. Basis of Accounting*
Governmental funds and expendable trust funds are maintained on the modified accrual basis of accounting. Revenue is recognized in the accounting period in which it becomes measurable and available. Expenditures are recognized in the period in which the liability is incurred, if measurable, except for unmatured principal and interest on general obligation debt, which is recognized when due. *This information is taken from the Comprehensive Annual Financial Report (CAFR) of the City of Long Beach, California – September 30, 2002. For further information regarding the City’s accounting and debt management practices, please consult the CAFR.

Accounting Basis of Budgeting
The generally accepted accounting principles used as the basis to prepare this Budget are the same as those used to prepare the annual financial report with the following exceptions: (1) encumbrances are considered to be expenditures for budget purposes but are not included in financial reporting; and (2) land held for resale is recorded as an expenditure when purchased and a revenue when sold for budget purposes. For financial reporting purposes, land is held as an asset and a gain or loss is recognized at the time of sale. Investment Management
This function's primary goal is optimizing return on investment, while safeguarding principal and ensuring liquidity levels necessary to pay for budgeted expenses. The City maintains general bank accounts for daily business requirements, but the majority of the City's funds are held in an investment pool administered by the City Treasurer. As of September 30, 2003, the Treasurer's investment pool was approximately $1.131 billion divided into short-term and long-term portfolios. To measure performance, the City uses two benchmarks: the 91-Treasury Bill benchmark for the short-term component and the Merrill Lynch 1-3 year Treasury/Agency Index for long-term component.

General Fund Revenue
Property Taxes Approximately 17.3 percent or $61.5 million of the City’s General Fund revenue is derived from local property taxes. Property, primarily land and buildings, is valued by the County Assessor and taxed at 1 percent of assessed value. Cities and other local agencies, such as schools, special districts, and the County of Los Angeles, share in the countywide property tax pool. The City of Long Beach only receives approximately 21 percent of property taxes paid by City property owners. In addition, the City’s Redevelopment Agency receives 100 percent of certain specified property tax revenues generated within the redevelopment project areas. Due to the economy's growth and affect on property values, FY 05 property tax estimates assume revenue increases above FY 04 receipts. Property in the State of California is generally reassessed only upon change of
wnership.
49.2 50.3 53.3 55.161.5
010203040506070
FY 01 FY 02 FY 03 FY 04 FY 05
o The continuing inability of the State of California to provide funding for State programs through its ongoing revenues has required that the State turn to local government for help. As a result, the City’s property tax estimates reflect the cumulative loss of $4.8 million in FY 93, an additional $8.7 million in FY 94, another $0.9 million loss in FY 95 plus $0.9 million in FY 95/FY 96 as a retroactive assessment, and $0.3 million in FY 98. This $15.6 million cumulative loss of property tax revenue
ongoing. To date losses equal approximately $158 million. is Property tax is a major source of revenue for critical City services such as police, fire, public works, recreation, and library services. Prior to the passage of Proposition 13 in 1978, property tax revenues accounted for approximately 28 percent of all General Fund revenues as compared to 16 percent now. Other revenues have been used to augment the decrease in this revenue source. Sales Tax Sales tax receipts are expected to account for $32.3 million, or 9.1 percent of all General Fund revenues for FY 05. All taxable retail sales in Long Beach are charged an 8.25 percent tax. This amount includes 1.25 percent that goes to the County of Los Angeles, and 6.25 percent that is retained by the State. Only 0.75 percent is returned to the City by the State. Sales tax revenue varies from year-to-year due to fluctuations in the economy. The City must continue to promote economic development in order to bring sales tax revenues to a level comparable to other cities in Los Angeles County.
40.538.4
41.8 41.3
32.3
0
5
10
15
20
25
30
35
40
45
FY 01 FY 02 FY 03 FY 04 FY 05

57.2 55.851.8
44.540.5
0
10
20
30
40
50
60
70
FY 01 FY 02 FY 03 FY 04 FY 05
Utility Users Taxes The City applies a utility users tax to customer’s electricity, gas, telephone, and water bills. These four revenue sources account for $40.5 million or 11.4 percent of the City’s General Fund revenues. A voter-approved initiative is reducing the utility user tax rate from 10 percent to 5 percent over a five-year period. The rate for FY 05 will be 5 percent effective October 1, 2004. These taxes do not apply to low-income senior citizens who are over 62 years of age or disabled low-income individuals. Other Taxes The City receives revenue from the Transient Occupancy Tax assessed on guests of all City hotels and motels, and from the Business License Tax assessed on all those doing business in Long Beach. Both taxes have recovered from the recession and the war in Iraq.
Licenses and Permits This revenue comes to the City from a variety of licenses and permits. The largest revenue is generated by sale of building permits, building plan check fees, emergency ambulance fees and dog licenses. Fines, Forfeitures and Penalties Revenue is received by the City in this category primarily from vehicle code fines and parking citations.
Revenue from Use of Money and Property The City is able to generate income from its current assets. This includes interest earned on investments, land and facility rental, and parking meter revenue within the City. Interest earnings have been negatively affected by the decrease in interest rates.
Revenue from Other Agencies The General Fund receives revenue from other cities, the County of Los Angeles, and the State. Revenue is received for the maintenance of traffic signals and parking meters under contract with smaller cities neighboring Long Beach, as well as unincorporated parts of Los Angeles County. The State provides funding through the Motor Vehicle In Lieu Tax. Other miscellaneous State funds are provided for maintenance of State highways, fire and peace officer training, and police extradition reimbursements. The budget reflects legislative action enacted that shifted all Cigarette Tax revenues to the State's General Fund. Due to Proposition 57, the State has “flipped” 0.25 percent of Sales and Use Tax for an equal amount of ERAP Property Tax to help fund the State’s Economic Recovery Bonds. The replacement property tax will be titled “In Lieu Sale and Use Tax” and will be received on a semi-annual basis.
Other Charges and Revenues These miscellaneous charges include library fines and fees, police reports and sale of used equipment and vehicles.
Inter- and Intra-Fund Charges Programs within the City that are funded by sources other than the General Fund often receive services from General Fund supported departments. This category includes reimbursement for these services.
Transfers from Other Funds This category includes transfers, in lieu of property tax, to the General Fund from City enterprise and utility operations.
"Gann" Appropriations Limit In November 1979, the voters of the State of California approved Proposition 4, commonly known as the "Gann Initiative." The Proposition created Article XIIIB of the State Constitution, placing certain limits on the amount of revenue that can be appropriated each fiscal year. The limit is based on actual appropriations during FY 79. Only those revenues that are considered "proceeds of taxes" are subject to the limit. The limit is recalculated each fiscal year based on certain inflation and population factors. Proceeds of taxes are, however, allowed to be spent on several types of appropriations that do not count against the limit, including voter approved debt, the costs of complying with court orders and federal mandates, and expenditures for qualified capital outlays. The “Gann” Appropriations Limit for the City of Long Beach for FY 05 is $468,738,590. The total revenue, or proceeds of taxes, subject to the limit after removing allowable exclusions is $184,237,104, or 39.3 percent of the Gann Limit. In FY 04 the limit was $447,586,032.

FY 05 Adopted RevenuesAll Funds (in millions)
(Total = $1,681.9 million)
Internal Service Funds $267.6
Special Funds $137.4
Enterprise Funds $295.5
Tidelands Funds $169.3
General Fund $363.5Subsidiary Funds
$448.5
FY 05 Adopted ExpendituresAll Funds (in millions)
(Total = $1,849.8 million)
Subsidiary Funds $575.1
General Fund $375.0
Enterprise Funds $290.7
Special Funds $152.1
Tidelands Funds $169.1
Internal Service Funds $278.0

FY 05 Adopted Revenues General Fund (in millions)
(Total = $363.5 million)
Interfund Charges & Transfers $77.2
Utility Users Tax $40.4
Property Taxes $61.5
Sales Tax $32.3Other Agencies
$47.3
Other Taxes $38.0
Licenses & Permits $16.9
Other Chrgs/Rev $19.7
Use of Money & Prop $16.7
Fines & Forfeitures $13.5
FY 05 Adopted Expenditures by Function General Fund (in millions)(Total = $375.0 million)
Legislation & General Gov't. $38.8
Public Works & Development $50.4
Human Services $42.8
Public Safety & Pension $242.9
Debt Management
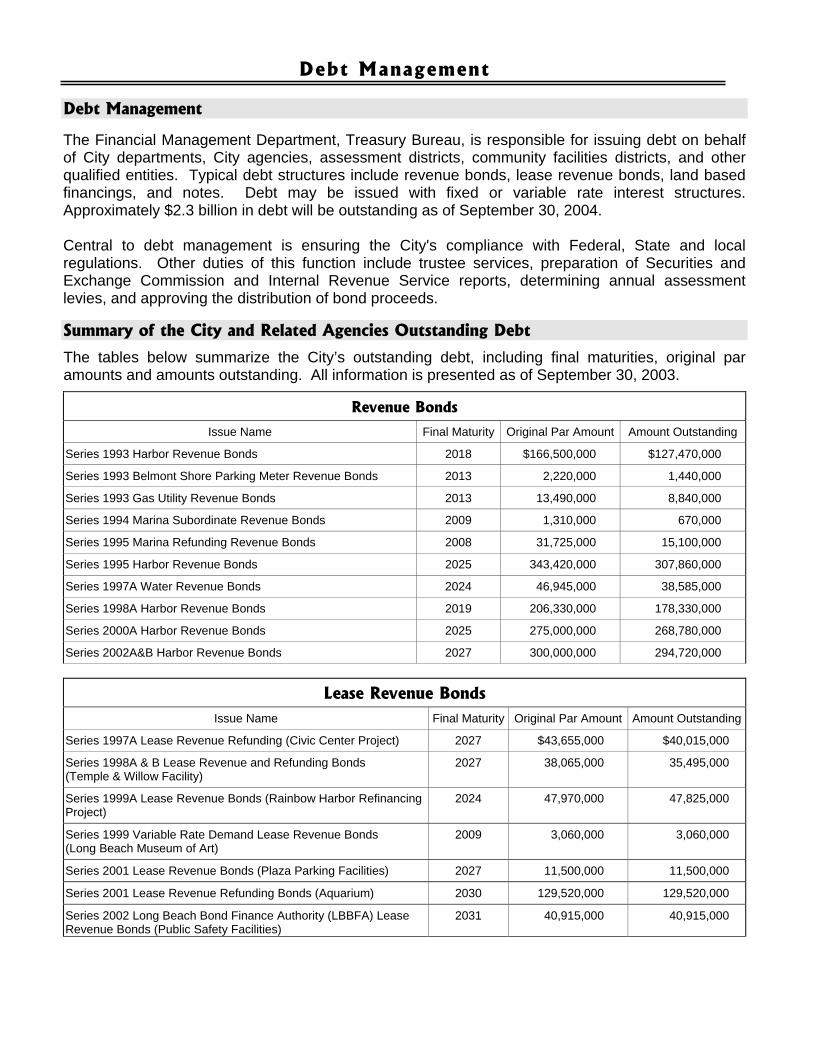
Debt Management The Financial Management Department, Treasury Bureau, is responsible for issuing debt on behalf of City departments, City agencies, assessment districts, community facilities districts, and other qualified entities. Typical debt structures include revenue bonds, lease revenue bonds, land based financings, and notes. Debt may be issued with fixed or variable rate interest structures. Approximately $2.3 billion in debt will be outstanding as of September 30, 2004. Central to debt management is ensuring the City's compliance with Federal, State and local regulations. Other duties of this function include trustee services, preparation of Securities and Exchange Commission and Internal Revenue Service reports, determining annual assessment levies, and approving the distribution of bond proceeds.
Summary of the City and Related Agencies Outstanding Debt The tables below summarize the City’s outstanding debt, including final maturities, original par amounts and amounts outstanding. All information is presented as of September 30, 2003.
Revenue Bonds
Issue Name Final Maturity Original Par Amount Amount Outstanding
Series 1993 Harbor Revenue Bonds 2018 $166,500,000 $127,470,000
Series 1993 Belmont Shore Parking Meter Revenue Bonds 2013 2,220,000 1,440,000
Series 1993 Gas Utility Revenue Bonds 2013 13,490,000 8,840,000
Series 1994 Marina Subordinate Revenue Bonds 2009 1,310,000 670,000
Series 1995 Marina Refunding Revenue Bonds 2008 31,725,000 15,100,000
Series 1995 Harbor Revenue Bonds 2025 343,420,000 307,860,000
Series 1997A Water Revenue Bonds 2024 46,945,000 38,585,000
Series 1998A Harbor Revenue Bonds 2019 206,330,000 178,330,000
Series 2000A Harbor Revenue Bonds 2025 275,000,000 268,780,000
Series 2002A&B Harbor Revenue Bonds 2027 300,000,000 294,720,000
Lease Revenue Bonds Issue Name Final Maturity Original Par Amount Amount Outstanding
Series 1997A Lease Revenue Refunding (Civic Center Project) 2027 $43,655,000 $40,015,000
Series 1998A & B Lease Revenue and Refunding Bonds (Temple & Willow Facility)
2027 38,065,000 35,495,000
Series 1999A Lease Revenue Bonds (Rainbow Harbor Refinancing Project)
2024 47,970,000 47,825,000
Series 1999 Variable Rate Demand Lease Revenue Bonds (Long Beach Museum of Art)
2009 3,060,000 3,060,000
Series 2001 Lease Revenue Bonds (Plaza Parking Facilities) 2027 11,500,000 11,500,000
Series 2001 Lease Revenue Refunding Bonds (Aquarium) 2030 129,520,000 129,520,000
Series 2002 Long Beach Bond Finance Authority (LBBFA) Lease Revenue Bonds (Public Safety Facilities)
2031 40,915,000 40,915,000
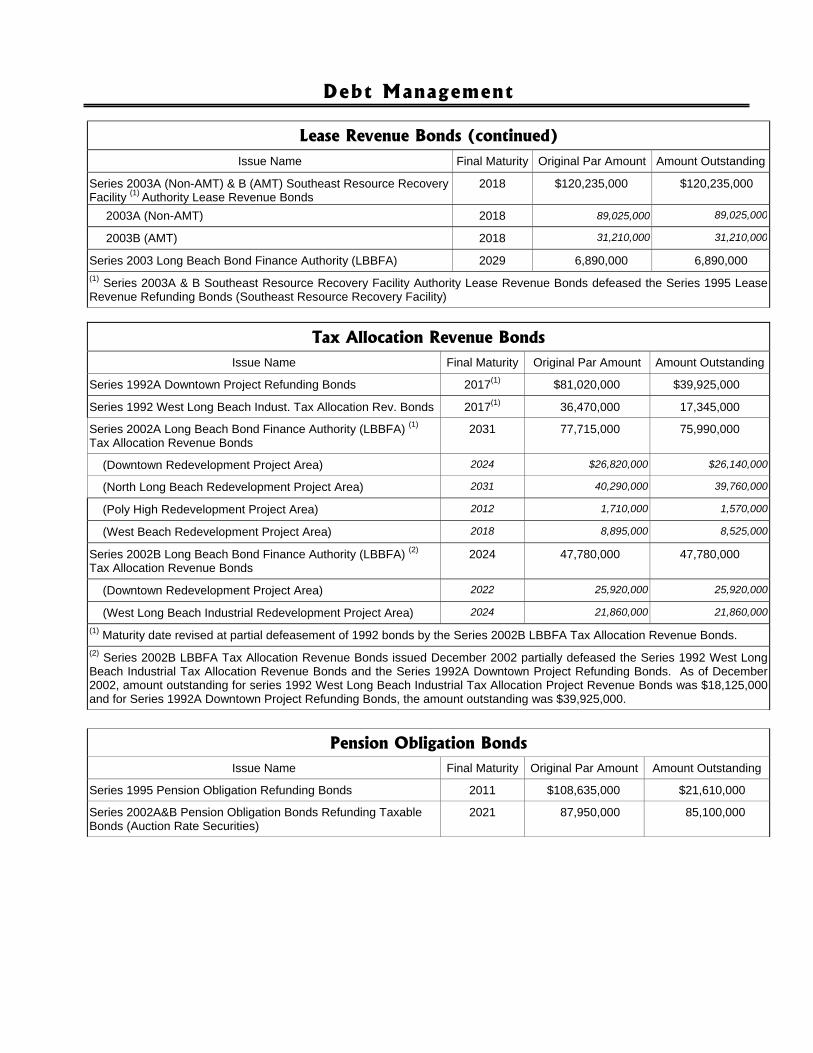
Debt Management
Lease Revenue Bonds (continued)
Issue Name Final Maturity Original Par Amount Amount Outstanding
Series 2003A (Non-AMT) & B (AMT) Southeast Resource Recovery Facility (1) Authority Lease Revenue Bonds
2018 $120,235,000 $120,235,000
2003A (Non-AMT) 2018 89,025,000 89,025,000
2003B (AMT) 2018 31,210,000 31,210,000
Series 2003 Long Beach Bond Finance Authority (LBBFA) 2029 6,890,000 6,890,000 (1) Series 2003A & B Southeast Resource Recovery Facility Authority Lease Revenue Bonds defeased the Series 1995 Lease Revenue Refunding Bonds (Southeast Resource Recovery Facility)
Tax Allocation Revenue Bonds Issue Name Final Maturity Original Par Amount Amount Outstanding
Series 1992A Downtown Project Refunding Bonds 2017(1) $81,020,000 $39,925,000
Series 1992 West Long Beach Indust. Tax Allocation Rev. Bonds 2017(1) 36,470,000 17,345,000
Series 2002A Long Beach Bond Finance Authority (LBBFA) (1) Tax Allocation Revenue Bonds
2031 77,715,000 75,990,000
(Downtown Redevelopment Project Area) 2024 $26,820,000 $26,140,000
(North Long Beach Redevelopment Project Area) 2031 40,290,000 39,760,000
(Poly High Redevelopment Project Area) 2012 1,710,000 1,570,000
(West Beach Redevelopment Project Area) 2018 8,895,000 8,525,000
Series 2002B Long Beach Bond Finance Authority (LBBFA) (2) Tax Allocation Revenue Bonds
2024 47,780,000 47,780,000
(Downtown Redevelopment Project Area) 2022 25,920,000 25,920,000
(West Long Beach Industrial Redevelopment Project Area) 2024 21,860,000 21,860,000 (1) Maturity date revised at partial defeasement of 1992 bonds by the Series 2002B LBBFA Tax Allocation Revenue Bonds. (2) Series 2002B LBBFA Tax Allocation Revenue Bonds issued December 2002 partially defeased the Series 1992 West Long Beach Industrial Tax Allocation Revenue Bonds and the Series 1992A Downtown Project Refunding Bonds. As of December 2002, amount outstanding for series 1992 West Long Beach Industrial Tax Allocation Project Revenue Bonds was $18,125,000 and for Series 1992A Downtown Project Refunding Bonds, the amount outstanding was $39,925,000.
Pension Obligation Bonds Issue Name Final Maturity Original Par Amount Amount Outstanding
Series 1995 Pension Obligation Refunding Bonds 2011 $108,635,000 $21,610,000
Series 2002A&B Pension Obligation Bonds Refunding Taxable Bonds (Auction Rate Securities)
2021 87,950,000 85,100,000
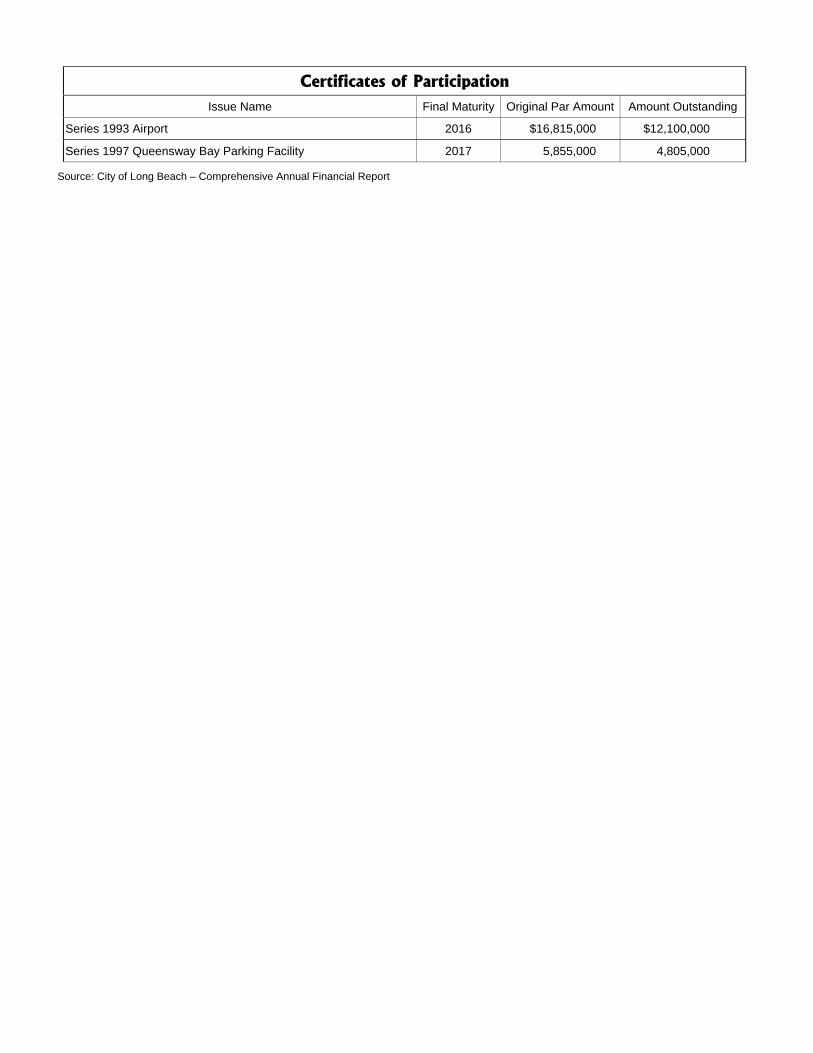
Certificates of Participation
Issue Name Final Maturity Original Par Amount Amount Outstanding
Series 1993 Airport 2016 $16,815,000 $12,100,000
Series 1997 Queensway Bay Parking Facility 2017 5,855,000 4,805,000
Source: City of Long Beach – Comprehensive Annual Financial Report
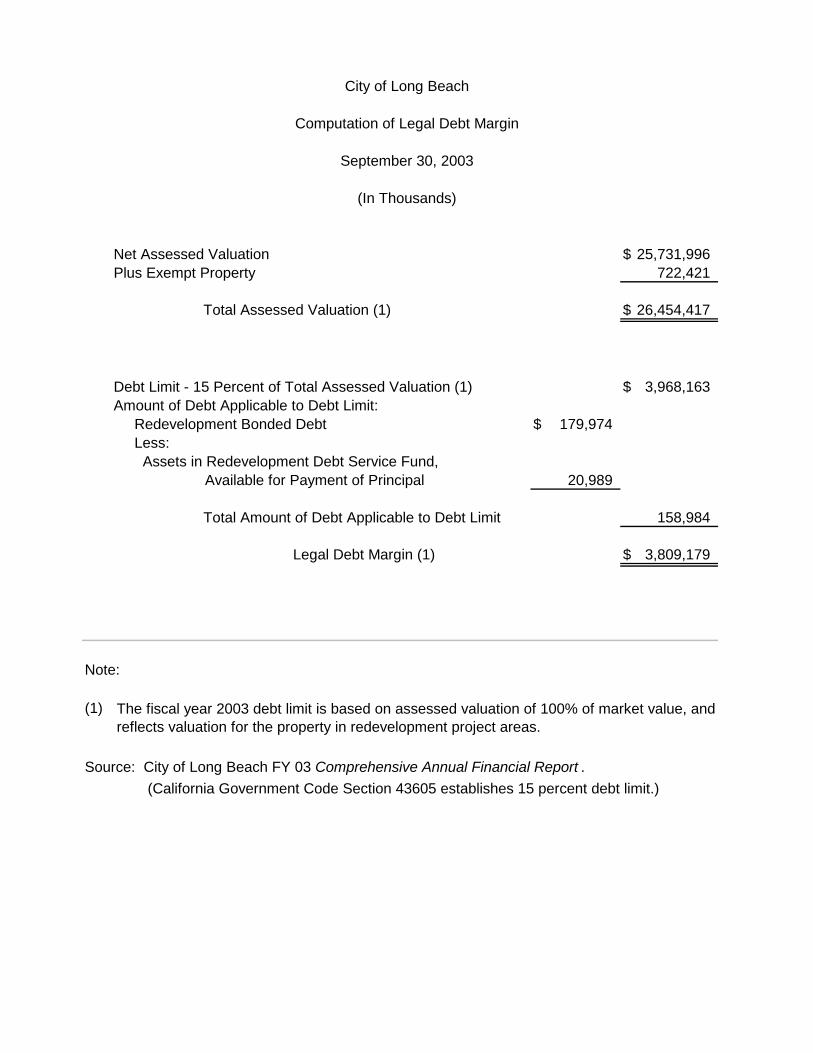
City of Long Beach
Computation of Legal Debt Margin
September 30, 2003
(In Thousands)
Net Assessed Valuation $ 25,731,996Plus Exempt Property 722,421
Total Assessed Valuation (1) $ 26,454,417
Debt Limit - 15 Percent of Total Assessed Valuation (1) $ 3,968,163Amount of Debt Applicable to Debt Limit: Redevelopment Bonded Debt $ 179,974 Less: Assets in Redevelopment Debt Service Fund, Available for Payment of Principal 20,989
Total Amount of Debt Applicable to Debt Limit 158,984
Legal Debt Margin (1) $ 3,809,179
Note:
(1)
Source: City of Long Beach FY 03 Comprehensive Annual Financial Report .
The fiscal year 2003 debt limit is based on assessed valuation of 100% of market value, and reflects valuation for the property in redevelopment project areas.
(California Government Code Section 43605 establishes 15 percent debt limit.)


![Understanding the Budget - Prince William County, … William County | FY 2010 Fiscal Plan [Understanding the Budget] 99 Facts about the Budget ... documents: the Proposed Fiscal Plan](https://img.pdfslide.net/doc/110x75/5aee05177f8b9a585f910fe1/understanding-the-budget-prince-william-county-william-county-fy-2010-fiscal.jpg)