Embed Size (px)
Citation preview
238 Biophysical Journal Volume 102 January 2012 238–247
Understanding the Cooperative Interaction between Myosin II and ActinCross-Linkers Mediated by Actin Filaments during Mechanosensation
Tianzhi Luo,†* Krithika Mohan,§ Vasudha Srivastava,†{ Yixin Ren,† Pablo A. Iglesias,§
and Douglas N. Robinson†‡{*†Department of Cell Biology, ‡Department of Pharmacology and Molecular Sciences, School of Medicine, §Department of Electrical andComputer Engineering, and {Department of Chemical and Biomolecular Engineering, Whiting School of Engineering, The Johns HopkinsUniversity, Baltimore, Maryland
ABSTRACT Myosin II is a central mechanoenzyme in a wide range of cellular morphogenic processes. Its cellular localizationis dependent not only on signal transduction pathways, but also on mechanical stress. We suggest that this stress-dependentdistribution is the result of both the force-dependent binding to actin filaments and cooperative interactions between boundmyosin heads. By assuming that the binding of myosin heads induces and/or stabilizes local conformational changes in the actinfilaments that enhances myosin II binding locally, we successfully simulate the cooperative binding of myosin to actin observedexperimentally. In addition, we can interpret the cooperative interactions between myosin and actin cross-linking proteinsobserved in cellular mechanosensation, provided that a similar mechanism operates among different proteins. Finally, wepresent a model that couples cooperative interactions to the assembly dynamics of myosin bipolar thick filaments and thataccounts for the transient behaviors of the myosin II accumulation during mechanosensation. This mechanism is likely to begeneral for a range of myosin II-dependent cellular mechanosensory processes.
INTRODUCTION
Nonmuscle myosin II is critical for many cellular events,such as motility, cell division, and tissue morphogenesis.In the past few decades, much effort has been invested tounderstand its roles in mechanosensation and mechano-transduction at the single molecule, cellular, and tissuelevels (1–4). Yet, the mechanisms of its cellular functionsand its interactions with other proteins remain to be clari-fied. One of the interesting findings is the cooperativebinding of myosin heads to actin filaments (5–7). Underspecific conditions in vitro, the level of actin-bound myosinsdisplayed a sigmoidal increase as a function of increasingmyosin concentration and clustering along the actin fila-ments. These observations suggest cooperative interactionsbetween myosins (homocooperativity). In Dictyostelium,myosin II and the actin cross-linker cortexillin I also code-pendently accumulate into the highly deformed regionsinduced by micropipette aspiration (MPA) (2). Furthermore,the extent of myosin II accumulation increases monotoni-cally with increasing applied force in a manner that isdependent on its lever-arm length (3). Although the lattercan be qualitatively interpreted by the force-dependentbinding affinity to actin filaments (8) and the lever-armtheory of myosin (9), the underlying mechanism of the het-erocooperativity between these two different proteinsremains elusive.
In the absence of regulatory proteins (such as troponinand tropomyosin), the mechanism for myosin homocooper-ativity was suggested to occur because binding of myosin
Submitted June 13, 2011, and accepted for publication December 13, 2011.
*Correspondence: [email protected] or [email protected]
Editor: Charles W. Wolgemuth.
� 2012 by the Biophysical Society
0006-3495/12/01/0238/10 $2.00
heads causes local conformational changes in actin sub-domain 2, facilitating myosin binding nearby (7). Otherproteins, such as cofilin, espin, and fascin, also displaycooperative binding to actin filaments due to the conforma-tional changes in actin upon binding (10–13). Importantly,actin filaments had increased torsion and bending flexibilitydue to cofilin binding and twisting due to espin and fascinbinding. Based on these observations, the conformationalchanges of actin due to protein binding may be essentialfor cooperative binding of proteins to actin filamentsalthough the details of the atomic level deformations are stillabsent.
Though myosin II biochemical and biophysical assayshave revealed the underlying mechanisms of cooperativity,there are several missing links between these in vitro obser-vations and the cellular behaviors: First, most mathematicaldescriptions of cooperativity were based on fitting the ex-perimental data to the general Michaelis-Menten equationor Hill equation (5,6), which by itself does not reflect themolecular scale mechanisms of the process. Second, moststudies only considered the cooperative interaction betweennearest neighbors, thereby ignoring the propagation of actinmonomer deformations over longer distances and signifi-cantly underestimating cooperativity (14). Third, becausethe basic functional unit of myosin II is the bipolar thickfilament (BTF), a mathematical model that links the force-dependent myosin-actin interactions, myosin cooperativityand the BTF assembly kinetics is required. Specifically,because actin filaments significantly enhance the BTFassembly rate and the myosin-actin binding is force-dependent, these features must be considered in the model(8,15). However, the current understanding of myosin
doi: 10.1016/j.bpj.2011.12.020
Myosin Cooperativity in Mechanosensing 239
cooperativity is based either on measurements of the myosinmotor (proteolytic subfragment 1, S1) or the dimerizedmotor (heavy meromyosin) to actin filaments in the absenceof applied force (5–7). The fourth issue is that in vivoprotein concentrations are more spatially heterogeneousthan those in the in vitro assays (16,17). Differences alsoexist in the mechanical studies of in vitro assembled actinnetworks where the imposed deformations are relativelyuniform. However, the deformations experienced by cells,such as through atomic force microscopy or MPA, are typi-cally much more localized, leading to deformation gradients(18), which are likely to be more physiologically relevantfor normal cell behaviors. Therefore, for a quantitativeinterpretation of the in vivo cell behaviors based on theunderstanding of in vitro assays, a multiscale model thatintegrates these factors is required.
In this article, we analyzed the heterocooperativitybetween myosin II and cortexillin I in Dictyostelium cells.We then reproduced the key features of the experimentalobservations of both homocooperativity and heterocoopera-tivity using simulations. These simulations were based onone essential assumption: myosin binding to actin causeslocal conformational changes in the actin that enhancemyosin binding in nearby regions. We performed two-dimensional coarse-grained kinetic Monte Carlo simula-tions of homocooperativity of myosin head binding. Thesimulations yielded the sigmoidal curve and the two-dimen-sional cluster formation observed in biochemical assays.Moreover, we simulated the mixed system containingmyosin and cortexillin, assuming that myosin binding alonepromotes further myosin and cortexillin binding. In thesesimulations, cortexillin binding always followed myosinbinding kinetically and the two-dimensional clusters con-tained mixtures of both proteins. Furthermore, we devel-oped a model for myosin bipolar thick filament (BTF)assembly by incorporating the effect of myosin headbinding through mean-field approximation into the BTFdimer addition model. This model accounts for the kineticsand three-dimensional pattern of the cooperative accumula-tion of myosin observed experimentally during MPA.
MATERIALS AND METHODS
Measurements of mechanosensory responseof proteins using MPA
Micropipette aspiration was performed as described previously (2). In
short, to apply aspiration pressure, the pressure difference was generated
by adjusting the height of a motor-driven water manometer. The Dictyoste-
lium myosin II null cells (cells deleted for the myosin II heavy chain gene,
mhcA) were transformed with GFP myosin II (GFP-mhcA) and mCherry
cortexillin I plasmids or GFP 3�Ala myosin II (a mutant myosin II heavy
chain where key threonines, which are phosphorylated by heavy chain
kinases, are mutated to alanine). WT cells were transformed with the
GFP myosin heavy chain kinase C (GFP-MHCK-C) plasmid (19).
Cells were loaded into the observation chamber filled with sterile filtered
MES buffer (50 mM MES at pH 6.5, 2 mM MgCl2, 0.2 mM CaCl2).
Latrunculin-A and jasplakinolide were used to change the F-actin level in
cells as compared to DMSO-carrier treated controls (see the Supporting
Material). The images were collected using an IX81 microscope (Olympus,
Melville, NY) and analyzed using ImageJ software (National Institutes of
Health, Bethesda, MD). After background correction, the fluorescence
intensity at the accumulation site inside the micropipette was normalized
against the opposite cortex in each frame to account for photobleaching.
The fluorescence signals were assumed to be linearly proportional to the
concentrations of the corresponding protein.
Two-dimensional coarse-grained kinetic MonteCarlo model
To study the kinetics of cooperative binding, a coarse-grained kinetic
Monte Carlo simulation model is introduced. A similar model has proven
to be powerful for predicting the kinetics of reaction-diffusion systems
(20). The simulation domain is a two-dimensional matrix of N � N square
lattices (see Fig. S1 in the Supporting Material). Actin monomers are
5.4 nm in diameter and F-actin filaments are composed of two intertwined
strands that are staggered by half a monomer, i.e., 2.7 nm. Because each
myosin head covers two actin monomers along a single strand, each lattice
point has a size of a¼ 5 nm, representing one myosin binding site along the
actin filament. Two actin filaments are orthogonally aligned at x ¼ N/2 and
y ¼ N/2 to mimic the actin network. The simulated mesh size of the actin
network is Na. Two-dimensional periodic conditions are applied to the
diffusion process but diffusion of bound myosins on F-actin is not allowed.
It is assumed that myosin heads have two energy states: unbound and
bound state (neglecting the details of the bound myosins with different
nucleotide states). The strain energy associated with myosin binding
is E0s and decays exponentially along the actin filament (shown in
Fig. S1 B), i.e.,
Ejs
�xij� ¼ E0
s exp
����xij��l
�;
where jxijj is the distance between binding sites i and j (21). The character-
istic decay length, l, was set to 2a because it was observed experimentally
that the deformation associated with the binding of a single myosin head
propagates ~3–4 actin monomers along a single strand (14). The binding
energy of a myosin head, which depends on the occupation states of its
neighboring binding sites, is
Ei ¼ E0i þ
Xj
Ejs
�xij�;
where E0i is the binding energy in the absence of strain. To speed up the
computation, a lookup table was used for jxijj% 3a, containing 30 different
cases in terms of occupation state of 2 � 3 neighboring binding sites. The
energy error at a cutoff of 3a is ~0.14 E0s . If jxijj % 4a is used, the corre-
sponding energy error decreases to 0.08 E0s but the lookup table includes
56 different cases complicating the computations.
Here, the rates of diffusion and binding are kept constant and only the
unbinding rate is allowed to be affected by the strain energy associated
with cooperative binding through the form of binding energy as defined
above. Namely, the energy level of the transition state is assumed to be
unaffected by the cooperative binding (see Fig. S1 C). The reasoning behind
this assumption is that the ADP-bound isometric state of myosin (where
a myosin head tightly binds actin) is the critical state for myosin coopera-
tive binding (22). The energy landscape is shifted from solid line to dotted
line upon the cooperative binding (see Fig. S1 C). The unbinding rate has
the form koff ¼ v exp(�E/kBT), where E is the associated energy barrier,
kB is the Boltzmann constant, Tis the temperature, and n is the vibration
frequency at the molecular level. This energy barrier, E ¼ Ea þ Ei, where
Ea is the activation energy barrier, is assumed not to change with
Biophysical Journal 102(2) 238–247
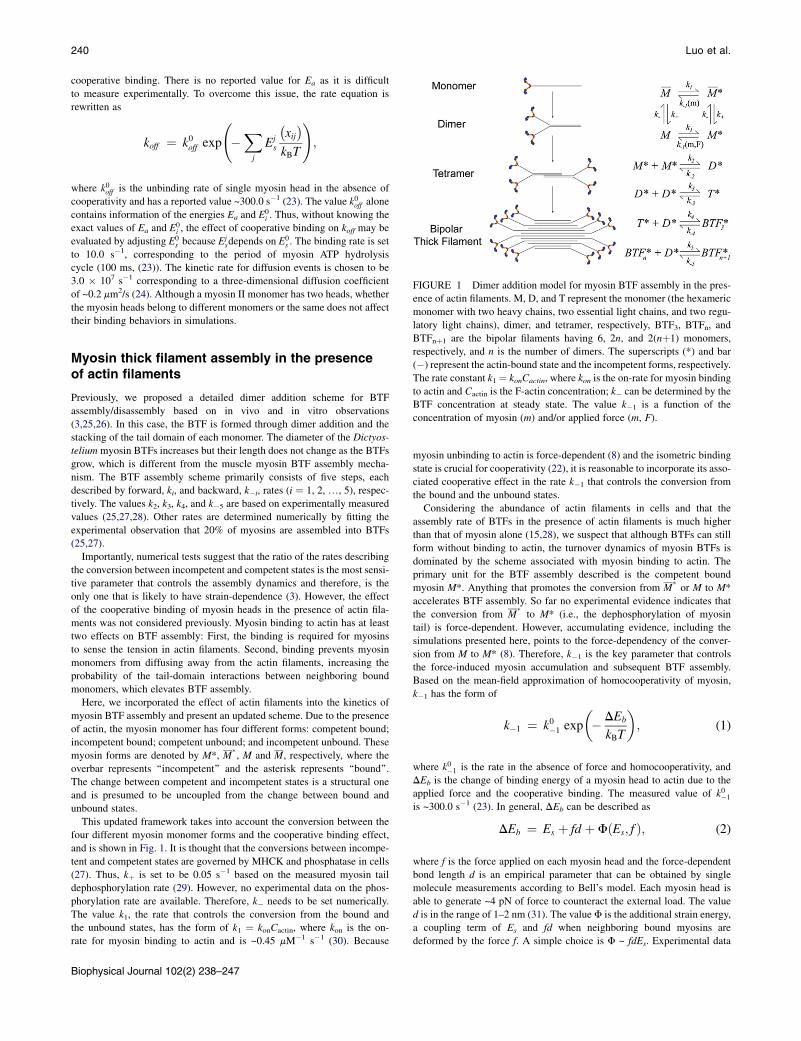
FIGURE 1 Dimer addition model for myosin BTF assembly in the pres-
ence of actin filaments. M, D, and T represent the monomer (the hexameric
monomer with two heavy chains, two essential light chains, and two regu-
latory light chains), dimer, and tetramer, respectively, BTF3, BTFn, and
240 Luo et al.
cooperative binding. There is no reported value for Ea as it is difficult
to measure experimentally. To overcome this issue, the rate equation is
rewritten as
koff ¼ k0off exp
�Xj
Ejs
�xij�
kBT
!;
where k0off is the unbinding rate of single myosin head in the absence of
cooperativity and has a reported value ~300.0 s�1 (23). The value k0off alone
contains information of the energies Ea and E0i . Thus, without knowing the
exact values of Ea and E0i , the effect of cooperative binding on koff may be
evaluated by adjusting E0s because E
jsdepends on E
0s . The binding rate is set
to 10.0 s�1, corresponding to the period of myosin ATP hydrolysis
cycle (100 ms, (23)). The kinetic rate for diffusion events is chosen to be
3.0 � 107 s�1 corresponding to a three-dimensional diffusion coefficient
of ~0.2 mm2/s (24). Although a myosin II monomer has two heads, whether
the myosin heads belong to different monomers or the same does not affect
their binding behaviors in simulations.
BTFnþ1 are the bipolar filaments having 6, 2n, and 2(nþ1) monomers,
respectively, and n is the number of dimers. The superscripts (*) and bar
(�) represent the actin-bound state and the incompetent forms, respectively.
The rate constant k1 ¼ konCactin, where kon is the on-rate for myosin binding
to actin and Cactin is the F-actin concentration; k� can be determined by the
BTF concentration at steady state. The value k�1 is a function of the
concentration of myosin (m) and/or applied force (m, F).
Myosin thick filament assembly in the presenceof actin filaments
Previously, we proposed a detailed dimer addition scheme for BTF
assembly/disassembly based on in vivo and in vitro observations
(3,25,26). In this case, the BTF is formed through dimer addition and the
stacking of the tail domain of each monomer. The diameter of the Dictyos-
telium myosin BTFs increases but their length does not change as the BTFs
grow, which is different from the muscle myosin BTF assembly mecha-
nism. The BTF assembly scheme primarily consists of five steps, each
described by forward, ki, and backward, k�i, rates (i ¼ 1, 2, ., 5), respec-
tively. The values k2, k3, k4, and k�5 are based on experimentally measured
values (25,27,28). Other rates are determined numerically by fitting the
experimental observation that 20% of myosins are assembled into BTFs
(25,27).
Importantly, numerical tests suggest that the ratio of the rates describing
the conversion between incompetent and competent states is the most sensi-
tive parameter that controls the assembly dynamics and therefore, is the
only one that is likely to have strain-dependence (3). However, the effect
of the cooperative binding of myosin heads in the presence of actin fila-
ments was not considered previously. Myosin binding to actin has at least
two effects on BTF assembly: First, the binding is required for myosins
to sense the tension in actin filaments. Second, binding prevents myosin
monomers from diffusing away from the actin filaments, increasing the
probability of the tail-domain interactions between neighboring bound
monomers, which elevates BTF assembly.
Here, we incorporated the effect of actin filaments into the kinetics of
myosin BTF assembly and present an updated scheme. Due to the presence
of actin, the myosin monomer has four different forms: competent bound;
incompetent bound; competent unbound; and incompetent unbound. These
myosin forms are denoted by M*, M�, M and M, respectively, where the
overbar represents ‘‘incompetent’’ and the asterisk represents ‘‘bound’’.
The change between competent and incompetent states is a structural one
and is presumed to be uncoupled from the change between bound and
unbound states.
This updated framework takes into account the conversion between the
four different myosin monomer forms and the cooperative binding effect,
and is shown in Fig. 1. It is thought that the conversions between incompe-
tent and competent states are governed by MHCK and phosphatase in cells
(27). Thus, kþ is set to be 0.05 s�1 based on the measured myosin tail
dephosphorylation rate (29). However, no experimental data on the phos-
phorylation rate are available. Therefore, k� needs to be set numerically.
The value k1, the rate that controls the conversion from the bound and
the unbound states, has the form of k1 ¼ konCactin, where kon is the on-
rate for myosin binding to actin and is ~0.45 mM�1 s�1 (30). Because
Biophysical Journal 102(2) 238–247
myosin unbinding to actin is force-dependent (8) and the isometric binding
state is crucial for cooperativity (22), it is reasonable to incorporate its asso-
ciated cooperative effect in the rate k�1 that controls the conversion from
the bound and the unbound states.
Considering the abundance of actin filaments in cells and that the
assembly rate of BTFs in the presence of actin filaments is much higher
than that of myosin alone (15,28), we suspect that although BTFs can still
form without binding to actin, the turnover dynamics of myosin BTFs is
dominated by the scheme associated with myosin binding to actin. The
primary unit for the BTF assembly described is the competent bound
myosin M*. Anything that promotes the conversion from M�or M to M*
accelerates BTF assembly. So far no experimental evidence indicates that
the conversion from M�to M* (i.e., the dephosphorylation of myosin
tail) is force-dependent. However, accumulating evidence, including the
simulations presented here, points to the force-dependency of the conver-
sion from M to M* (8). Therefore, k�1 is the key parameter that controls
the force-induced myosin accumulation and subsequent BTF assembly.
Based on the mean-field approximation of homocooperativity of myosin,
k�1 has the form of
k�1 ¼ k0�1 exp
�� DEb
kBT
�; (1)
where k0�1 is the rate in the absence of force and homocooperativity, and
DEb is the change of binding energy of a myosin head to actin due to the
applied force and the cooperative binding. The measured value of k0�1
is ~300.0 s�1 (23). In general, DEb can be described as
DEb ¼ Es þ fd þ FðEs; f Þ; (2)
where f is the force applied on each myosin head and the force-dependent
bond length d is an empirical parameter that can be obtained by single
molecule measurements according to Bell’s model. Each myosin head is
able to generate ~4 pN of force to counteract the external load. The value
d is in the range of 1–2 nm (31). The value F is the additional strain energy,
a coupling term of Es and fd when neighboring bound myosins are
deformed by the force f. A simple choice is F ~ fdEs. Experimental data
Myosin Cooperativity in Mechanosensing 241
suggest that the increase of binding energy due to tension may be related to
the prolonged transition state of the actin-bound myosin before phosphate
release (7,15,22). f ~ m�1 because the total force is shared by all bound
myosins, i.e., F ~ mf, where F is the total force and m is the total number
of bound myosins. As described in the results (below), Es is approximately
a piecewise linear function of the coverage of the actin filament by myosin,
implying Es ~ m. Based on the above scaling analysis, the coupling term F
is independent of m but proportional to the applied force F and the force-
independent strain energy E0s , i.e., F ~ FdE0
s . As a result, Eq. 1 can be
rewritten as
k�1 ¼ k0�1 exp
��DE0
b þ uFdE0s
�kBT
!; (3)
where DE0b contains the terms dependent on the amount of bound myosinm,
and u is a coefficient characterizing the energy coupling. The coupling term
is for the completeness of the formulation and it can be neglected
for convenience because it is a higher order term. Therefore, we used
k�1 ¼ k0�1 exp(�DE0b/KBT) in all simulations.
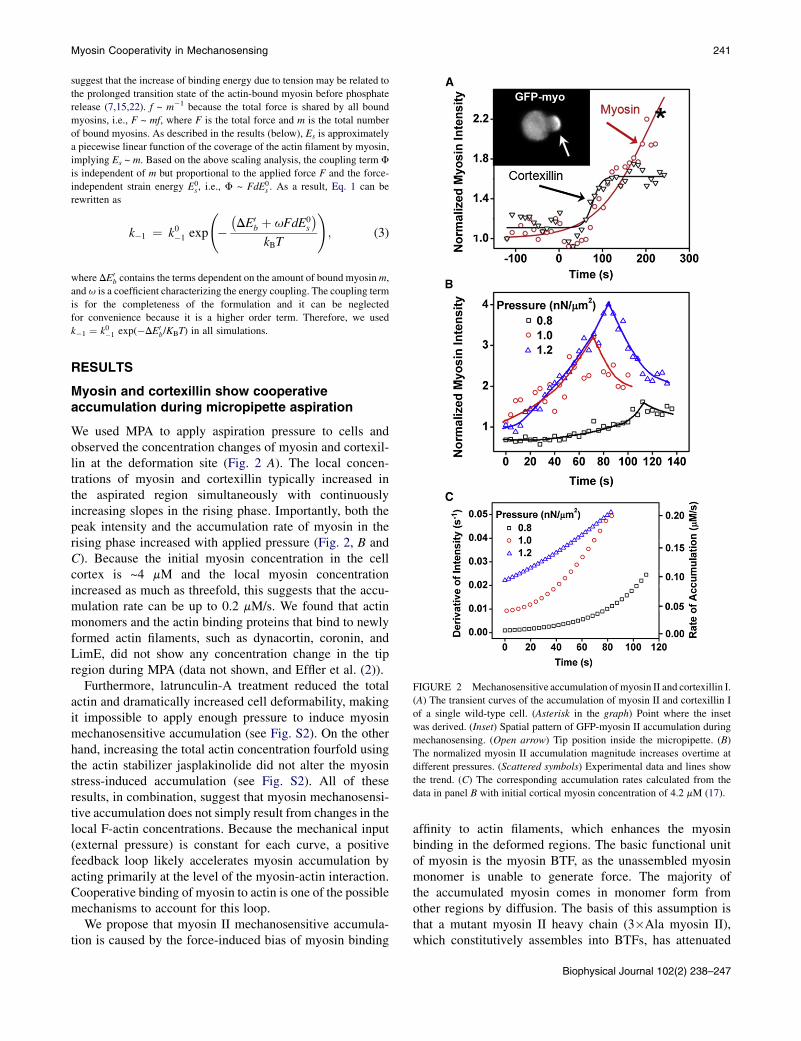
FIGURE 2 Mechanosensitive accumulation ofmyosin II and cortexillin I.
(A) The transient curves of the accumulation of myosin II and cortexillin I
of a single wild-type cell. (Asterisk in the graph) Point where the inset
was derived. (Inset) Spatial pattern of GFP-myosin II accumulation during
mechanosensing. (Open arrow) Tip position inside the micropipette. (B)
The normalized myosin II accumulation magnitude increases overtime at
different pressures. (Scattered symbols) Experimental data and lines show
the trend. (C) The corresponding accumulation rates calculated from the
data in panel B with initial cortical myosin concentration of 4.2 mM (17).
RESULTS
Myosin and cortexillin show cooperativeaccumulation during micropipette aspiration
We used MPA to apply aspiration pressure to cells andobserved the concentration changes of myosin and cortexil-lin at the deformation site (Fig. 2 A). The local concen-trations of myosin and cortexillin typically increased inthe aspirated region simultaneously with continuouslyincreasing slopes in the rising phase. Importantly, both thepeak intensity and the accumulation rate of myosin in therising phase increased with applied pressure (Fig. 2, B andC). Because the initial myosin concentration in the cellcortex is ~4 mM and the local myosin concentrationincreased as much as threefold, this suggests that the accu-mulation rate can be up to 0.2 mM/s. We found that actinmonomers and the actin binding proteins that bind to newlyformed actin filaments, such as dynacortin, coronin, andLimE, did not show any concentration change in the tipregion during MPA (data not shown, and Effler et al. (2)).
Furthermore, latrunculin-A treatment reduced the totalactin and dramatically increased cell deformability, makingit impossible to apply enough pressure to induce myosinmechanosensitive accumulation (see Fig. S2). On the otherhand, increasing the total actin concentration fourfold usingthe actin stabilizer jasplakinolide did not alter the myosinstress-induced accumulation (see Fig. S2). All of theseresults, in combination, suggest that myosin mechanosensi-tive accumulation does not simply result from changes in thelocal F-actin concentrations. Because the mechanical input(external pressure) is constant for each curve, a positivefeedback loop likely accelerates myosin accumulation byacting primarily at the level of the myosin-actin interaction.Cooperative binding of myosin to actin is one of the possiblemechanisms to account for this loop.
We propose that myosin II mechanosensitive accumula-tion is caused by the force-induced bias of myosin binding
affinity to actin filaments, which enhances the myosinbinding in the deformed regions. The basic functional unitof myosin is the myosin BTF, as the unassembled myosinmonomer is unable to generate force. The majority ofthe accumulated myosin comes in monomer form fromother regions by diffusion. The basis of this assumption isthat a mutant myosin II heavy chain (3�Ala myosin II),which constitutively assembles into BTFs, has attenuated
Biophysical Journal 102(2) 238–247
242 Luo et al.
mechanosensitive accumulation (3). To fully understand thekinetics of protein accumulation, it is necessary to considerboth myosin binding to actin and the turnover dynamics ofmyosin BTFs. We will discuss them sequentially below andpresent a model that is able to explain the in vitro coopera-tive binding and the enhanced myosin BTF assembly in thepresence of actin filaments (7,15,22), as well as the myosinaccumulation observed during cellular mechanosensation.
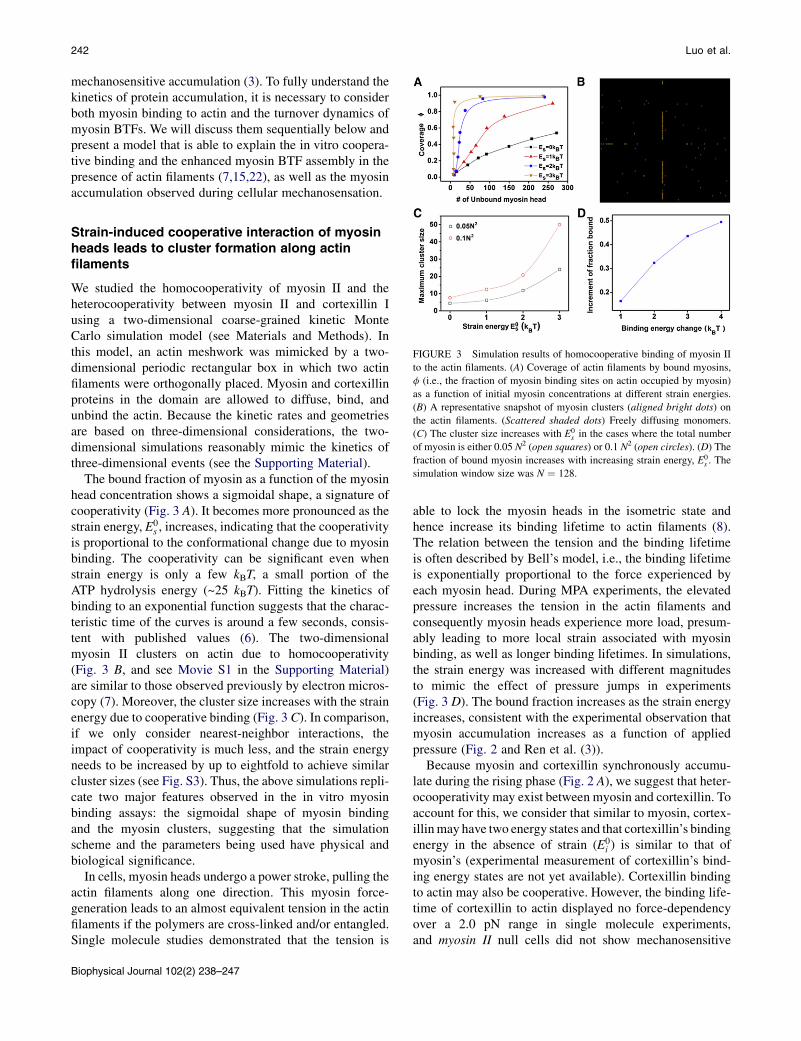
FIGURE 3 Simulation results of homocooperative binding of myosin II
to the actin filaments. (A) Coverage of actin filaments by bound myosins,
f (i.e., the fraction of myosin binding sites on actin occupied by myosin)
as a function of initial myosin concentrations at different strain energies.
(B) A representative snapshot of myosin clusters (aligned bright dots) on
the actin filaments. (Scattered shaded dots) Freely diffusing monomers.
(C) The cluster size increases with E0s in the cases where the total number
of myosin is either 0.05 N2 (open squares) or 0.1 N2 (open circles). (D) The
fraction of bound myosin increases with increasing strain energy, E0s . The
simulation window size was N ¼ 128.
Strain-induced cooperative interaction of myosinheads leads to cluster formation along actinfilaments
We studied the homocooperativity of myosin II and theheterocooperativity between myosin II and cortexillin Iusing a two-dimensional coarse-grained kinetic MonteCarlo simulation model (see Materials and Methods). Inthis model, an actin meshwork was mimicked by a two-dimensional periodic rectangular box in which two actinfilaments were orthogonally placed. Myosin and cortexillinproteins in the domain are allowed to diffuse, bind, andunbind the actin. Because the kinetic rates and geometriesare based on three-dimensional considerations, the two-dimensional simulations reasonably mimic the kinetics ofthree-dimensional events (see the Supporting Material).
The bound fraction of myosin as a function of the myosinhead concentration shows a sigmoidal shape, a signature ofcooperativity (Fig. 3 A). It becomes more pronounced as thestrain energy, E0
s , increases, indicating that the cooperativityis proportional to the conformational change due to myosinbinding. The cooperativity can be significant even whenstrain energy is only a few kBT, a small portion of theATP hydrolysis energy (~25 kBT). Fitting the kinetics ofbinding to an exponential function suggests that the charac-teristic time of the curves is around a few seconds, consis-tent with published values (6). The two-dimensionalmyosin II clusters on actin due to homocooperativity(Fig. 3 B, and see Movie S1 in the Supporting Material)are similar to those observed previously by electron micros-copy (7). Moreover, the cluster size increases with the strainenergy due to cooperative binding (Fig. 3 C). In comparison,if we only consider nearest-neighbor interactions, theimpact of cooperativity is much less, and the strain energyneeds to be increased by up to eightfold to achieve similarcluster sizes (see Fig. S3). Thus, the above simulations repli-cate two major features observed in the in vitro myosinbinding assays: the sigmoidal shape of myosin bindingand the myosin clusters, suggesting that the simulationscheme and the parameters being used have physical andbiological significance.
In cells, myosin heads undergo a power stroke, pulling theactin filaments along one direction. This myosin force-generation leads to an almost equivalent tension in the actinfilaments if the polymers are cross-linked and/or entangled.Single molecule studies demonstrated that the tension is
Biophysical Journal 102(2) 238–247
able to lock the myosin heads in the isometric state andhence increase its binding lifetime to actin filaments (8).The relation between the tension and the binding lifetimeis often described by Bell’s model, i.e., the binding lifetimeis exponentially proportional to the force experienced byeach myosin head. During MPA experiments, the elevatedpressure increases the tension in the actin filaments andconsequently myosin heads experience more load, presum-ably leading to more local strain associated with myosinbinding, as well as longer binding lifetimes. In simulations,the strain energy was increased with different magnitudesto mimic the effect of pressure jumps in experiments(Fig. 3 D). The bound fraction increases as the strain energyincreases, consistent with the experimental observation thatmyosin accumulation increases as a function of appliedpressure (Fig. 2 and Ren et al. (3)).
Because myosin and cortexillin synchronously accumu-late during the rising phase (Fig. 2 A), we suggest that heter-ocooperativity may exist between myosin and cortexillin. Toaccount for this, we consider that similar to myosin, cortex-illinmay have two energy states and that cortexillin’s bindingenergy in the absence of strain (E0
i ) is similar to that ofmyosin’s (experimental measurement of cortexillin’s bind-ing energy states are not yet available). Cortexillin bindingto actin may also be cooperative. However, the binding life-time of cortexillin to actin displayed no force-dependencyover a 2.0 pN range in single molecule experiments,and myosin II null cells did not show mechanosensitive
Myosin Cooperativity in Mechanosensing 243
GFP-cortexillin accumulation during MPA (3). These obser-vations suggest that the cooperativity from cortexillinbinding alone is not sufficient to mediate mechanosensitivecortexillin accumulation.
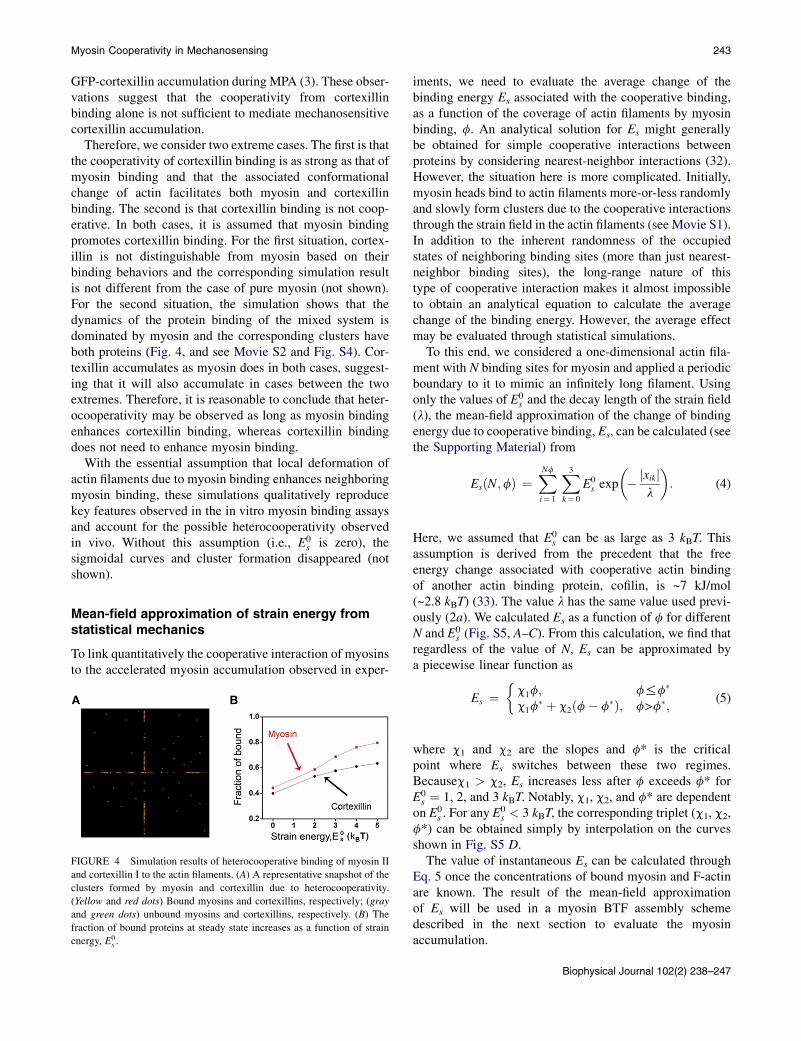
Therefore, we consider two extreme cases. The first is thatthe cooperativity of cortexillin binding is as strong as that ofmyosin binding and that the associated conformationalchange of actin facilitates both myosin and cortexillinbinding. The second is that cortexillin binding is not coop-erative. In both cases, it is assumed that myosin bindingpromotes cortexillin binding. For the first situation, cortex-illin is not distinguishable from myosin based on theirbinding behaviors and the corresponding simulation resultis not different from the case of pure myosin (not shown).For the second situation, the simulation shows that thedynamics of the protein binding of the mixed system isdominated by myosin and the corresponding clusters haveboth proteins (Fig. 4, and see Movie S2 and Fig. S4). Cor-texillin accumulates as myosin does in both cases, suggest-ing that it will also accumulate in cases between the twoextremes. Therefore, it is reasonable to conclude that heter-ocooperativity may be observed as long as myosin bindingenhances cortexillin binding, whereas cortexillin bindingdoes not need to enhance myosin binding.
With the essential assumption that local deformation ofactin filaments due to myosin binding enhances neighboringmyosin binding, these simulations qualitatively reproducekey features observed in the in vitro myosin binding assaysand account for the possible heterocooperativity observedin vivo. Without this assumption (i.e., E0
s is zero), thesigmoidal curves and cluster formation disappeared (notshown).
Mean-field approximation of strain energy fromstatistical mechanics
To link quantitatively the cooperative interaction of myosinsto the accelerated myosin accumulation observed in exper-
FIGURE 4 Simulation results of heterocooperative binding of myosin II
and cortexillin I to the actin filaments. (A) A representative snapshot of the
clusters formed by myosin and cortexillin due to heterocooperativity.
(Yellow and red dots) Bound myosins and cortexillins, respectively; (gray
and green dots) unbound myosins and cortexillins, respectively. (B) The
fraction of bound proteins at steady state increases as a function of strain
energy, E0s .
iments, we need to evaluate the average change of thebinding energy Es associated with the cooperative binding,as a function of the coverage of actin filaments by myosinbinding, f. An analytical solution for Es might generallybe obtained for simple cooperative interactions betweenproteins by considering nearest-neighbor interactions (32).However, the situation here is more complicated. Initially,myosin heads bind to actin filaments more-or-less randomlyand slowly form clusters due to the cooperative interactionsthrough the strain field in the actin filaments (see Movie S1).In addition to the inherent randomness of the occupiedstates of neighboring binding sites (more than just nearest-neighbor binding sites), the long-range nature of thistype of cooperative interaction makes it almost impossibleto obtain an analytical equation to calculate the averagechange of the binding energy. However, the average effectmay be evaluated through statistical simulations.
To this end, we considered a one-dimensional actin fila-ment with N binding sites for myosin and applied a periodicboundary to it to mimic an infinitely long filament. Usingonly the values of E0
s and the decay length of the strain field(l), the mean-field approximation of the change of bindingenergy due to cooperative binding, Es, can be calculated (seethe Supporting Material) from
EsðN;fÞ ¼XNfi¼ 1
X3k¼ 0
E0s exp
�� jxikj
l
�: (4)
Here, we assumed that E0s can be as large as 3 kBT. This
assumption is derived from the precedent that the freeenergy change associated with cooperative actin bindingof another actin binding protein, cofilin, is ~7 kJ/mol(~2.8 kBT) (33). The value l has the same value used previ-ously (2a). We calculated Es as a function of f for differentN and E0
s (Fig. S5, A–C). From this calculation, we find thatregardless of the value of N, Es can be approximated bya piecewise linear function as
Es ¼�c1f; f%f�
c1f� þ c2ðf� f�Þ; f>f�;
(5)
where c1 and c2 are the slopes and f* is the criticalpoint where Es switches between these two regimes.Becausec1 > c2, Es increases less after f exceeds f* forE0s ¼ 1, 2, and 3 kBT. Notably, c1, c2, and f* are dependent
on E0s . For any E
0s < 3 kBT, the corresponding triplet (c1, c2,
f*) can be obtained simply by interpolation on the curvesshown in Fig. S5 D.
The value of instantaneous Es can be calculated throughEq. 5 once the concentrations of bound myosin and F-actinare known. The result of the mean-field approximationof Es will be used in a myosin BTF assembly schemedescribed in the next section to evaluate the myosinaccumulation.
Biophysical Journal 102(2) 238–247
244 Luo et al.
A model of myosin BTF assembly demonstratesstrain-induced myosin accumulation
We developed a myosin BTF assembly model that takes intoaccount the cooperative interaction and force-dependency ofmyosin binding to actin filaments (Materials and Methods,Fig. 1). The effect of cooperative interaction and force-dependency is reflected in the rate, k�1, that controls theconversion from the bound to the unbound states throughEq. 3. Based on the scaling discussion, DE0
b in Eq. 3 hasthe form DE0
b ¼ dmþ Fd/am, where the first term representsthe strain energy and the second term is associated with theapplied force with the coefficients a and d. Specifically, amis the amount of the bound BTF (the functional unit able togenerate contractile force), and d ¼ 3c/Cactin, where c isthe slope derived in the mean-field approximation (seeprevious section) and Cactin is the F-actin concentration.The terms m and f are related by f ¼ 3m/Cactin where thefactor 3 comes from the assumption that each binding siteconsists of three neighboring actin monomers in a double-helical actin filament (15). The piecewise linear approxima-tion of Es from the mean-field approximation may now berewritten as
Es ¼�d1m; m%m�
d1m� þ d2ðm� m�Þ; m>m�;
(6)
where m* corresponds to f* in Eq. 5, d1 and d2 are the
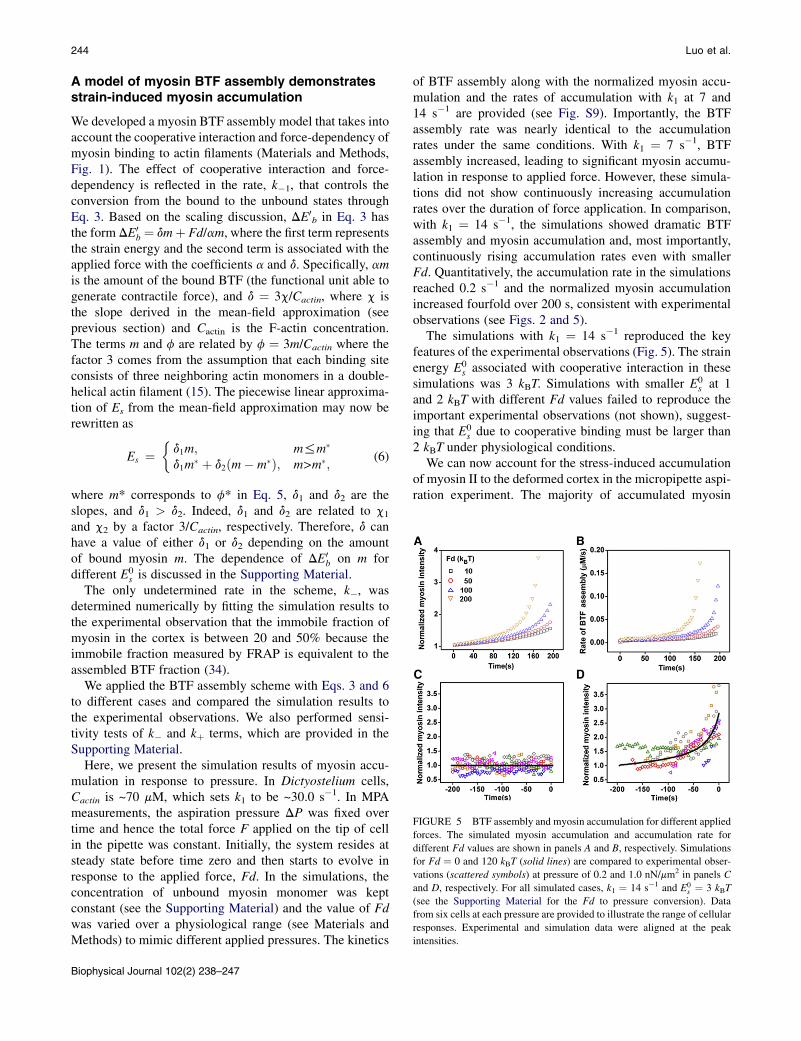
FIGURE 5 BTF assembly and myosin accumulation for different applied
forces. The simulated myosin accumulation and accumulation rate for
different Fd values are shown in panels A and B, respectively. Simulations
for Fd ¼ 0 and 120 kBT (solid lines) are compared to experimental obser-
vations (scattered symbols) at pressure of 0.2 and 1.0 nN/mm2 in panels C
and D, respectively. For all simulated cases, k1 ¼ 14 s�1 and E0s ¼ 3 kBT
(see the Supporting Material for the Fd to pressure conversion). Data
from six cells at each pressure are provided to illustrate the range of cellular
responses. Experimental and simulation data were aligned at the peak
intensities.
slopes, and d1 > d2. Indeed, d1 and d2 are related to c1and c2 by a factor 3/Cactin, respectively. Therefore, d canhave a value of either d1 or d2 depending on the amountof bound myosin m. The dependence of DE0
b on m fordifferent E0
s is discussed in the Supporting Material.The only undetermined rate in the scheme, k�, was
determined numerically by fitting the simulation results tothe experimental observation that the immobile fraction ofmyosin in the cortex is between 20 and 50% because theimmobile fraction measured by FRAP is equivalent to theassembled BTF fraction (34).
We applied the BTF assembly scheme with Eqs. 3 and 6to different cases and compared the simulation results tothe experimental observations. We also performed sensi-tivity tests of k� and kþ terms, which are provided in theSupporting Material.
Here, we present the simulation results of myosin accu-mulation in response to pressure. In Dictyostelium cells,Cactin is ~70 mM, which sets k1 to be ~30.0 s�1. In MPAmeasurements, the aspiration pressure DP was fixed overtime and hence the total force F applied on the tip of cellin the pipette was constant. Initially, the system resides atsteady state before time zero and then starts to evolve inresponse to the applied force, Fd. In the simulations, theconcentration of unbound myosin monomer was keptconstant (see the Supporting Material) and the value of Fdwas varied over a physiological range (see Materials andMethods) to mimic different applied pressures. The kinetics
Biophysical Journal 102(2) 238–247
of BTF assembly along with the normalized myosin accu-mulation and the rates of accumulation with k1 at 7 and14 s�1 are provided (see Fig. S9). Importantly, the BTFassembly rate was nearly identical to the accumulationrates under the same conditions. With k1 ¼ 7 s�1, BTFassembly increased, leading to significant myosin accumu-lation in response to applied force. However, these simula-tions did not show continuously increasing accumulationrates over the duration of force application. In comparison,with k1 ¼ 14 s�1, the simulations showed dramatic BTFassembly and myosin accumulation and, most importantly,continuously rising accumulation rates even with smallerFd. Quantitatively, the accumulation rate in the simulationsreached 0.2 s�1 and the normalized myosin accumulationincreased fourfold over 200 s, consistent with experimentalobservations (see Figs. 2 and 5).
The simulations with k1 ¼ 14 s�1 reproduced the keyfeatures of the experimental observations (Fig. 5). The strainenergy E0
s associated with cooperative interaction in thesesimulations was 3 kBT. Simulations with smaller E0
s at 1and 2 kBT with different Fd values failed to reproduce theimportant experimental observations (not shown), suggest-ing that E0
s due to cooperative binding must be larger than2 kBT under physiological conditions.
We can now account for the stress-induced accumulationof myosin II to the deformed cortex in the micropipette aspi-ration experiment. The majority of accumulated myosin
Myosin Cooperativity in Mechanosensing 245
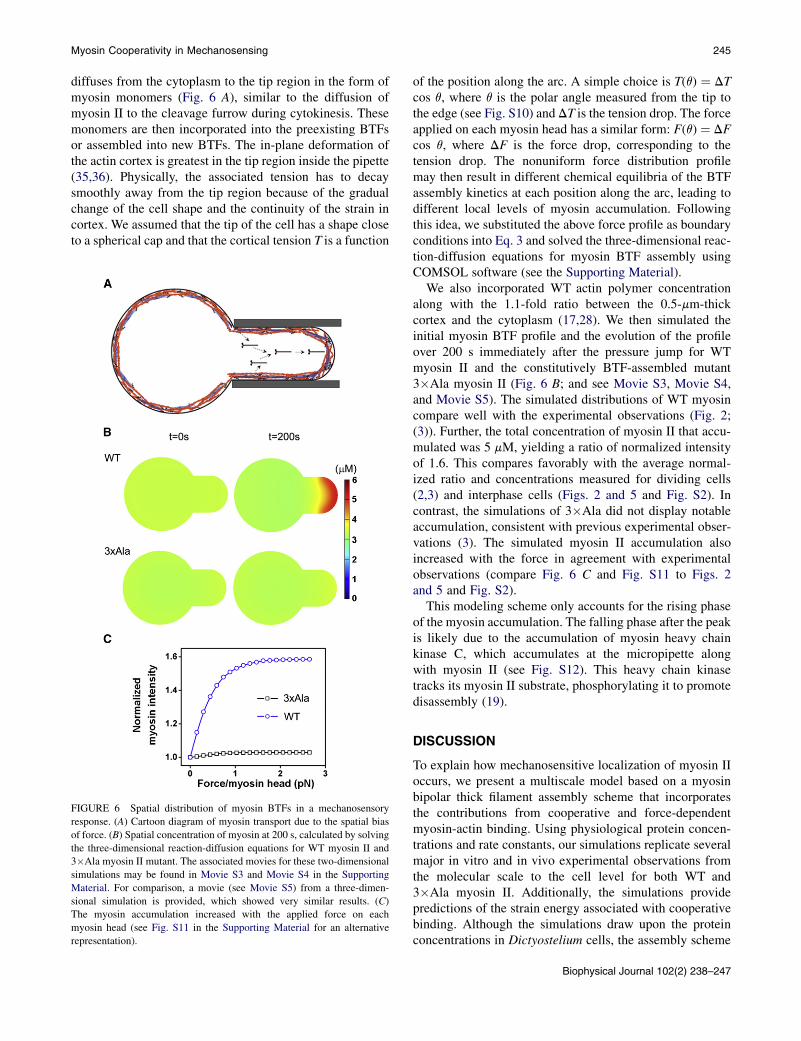
diffuses from the cytoplasm to the tip region in the form ofmyosin monomers (Fig. 6 A), similar to the diffusion ofmyosin II to the cleavage furrow during cytokinesis. Thesemonomers are then incorporated into the preexisting BTFsor assembled into new BTFs. The in-plane deformation ofthe actin cortex is greatest in the tip region inside the pipette(35,36). Physically, the associated tension has to decaysmoothly away from the tip region because of the gradualchange of the cell shape and the continuity of the strain incortex. We assumed that the tip of the cell has a shape closeto a spherical cap and that the cortical tension T is a function
FIGURE 6 Spatial distribution of myosin BTFs in a mechanosensory
response. (A) Cartoon diagram of myosin transport due to the spatial bias
of force. (B) Spatial concentration of myosin at 200 s, calculated by solving
the three-dimensional reaction-diffusion equations for WT myosin II and
3�Ala myosin II mutant. The associated movies for these two-dimensional
simulations may be found in Movie S3 and Movie S4 in the Supporting
Material. For comparison, a movie (see Movie S5) from a three-dimen-
sional simulation is provided, which showed very similar results. (C)
The myosin accumulation increased with the applied force on each
myosin head (see Fig. S11 in the Supporting Material for an alternative
representation).
of the position along the arc. A simple choice is T(q) ¼ DTcos q, where q is the polar angle measured from the tip tothe edge (see Fig. S10) and DT is the tension drop. The forceapplied on each myosin head has a similar form: F(q) ¼ DFcos q, where DF is the force drop, corresponding to thetension drop. The nonuniform force distribution profilemay then result in different chemical equilibria of the BTFassembly kinetics at each position along the arc, leading todifferent local levels of myosin accumulation. Followingthis idea, we substituted the above force profile as boundaryconditions into Eq. 3 and solved the three-dimensional reac-tion-diffusion equations for myosin BTF assembly usingCOMSOL software (see the Supporting Material).
We also incorporated WT actin polymer concentrationalong with the 1.1-fold ratio between the 0.5-mm-thickcortex and the cytoplasm (17,28). We then simulated theinitial myosin BTF profile and the evolution of the profileover 200 s immediately after the pressure jump for WTmyosin II and the constitutively BTF-assembled mutant3�Ala myosin II (Fig. 6 B; and see Movie S3, Movie S4,and Movie S5). The simulated distributions of WT myosincompare well with the experimental observations (Fig. 2;(3)). Further, the total concentration of myosin II that accu-mulated was 5 mM, yielding a ratio of normalized intensityof 1.6. This compares favorably with the average normal-ized ratio and concentrations measured for dividing cells(2,3) and interphase cells (Figs. 2 and 5 and Fig. S2). Incontrast, the simulations of 3�Ala did not display notableaccumulation, consistent with previous experimental obser-vations (3). The simulated myosin II accumulation alsoincreased with the force in agreement with experimentalobservations (compare Fig. 6 C and Fig. S11 to Figs. 2and 5 and Fig. S2).
This modeling scheme only accounts for the rising phaseof the myosin accumulation. The falling phase after the peakis likely due to the accumulation of myosin heavy chainkinase C, which accumulates at the micropipette alongwith myosin II (see Fig. S12). This heavy chain kinasetracks its myosin II substrate, phosphorylating it to promotedisassembly (19).
DISCUSSION
To explain how mechanosensitive localization of myosin IIoccurs, we present a multiscale model based on a myosinbipolar thick filament assembly scheme that incorporatesthe contributions from cooperative and force-dependentmyosin-actin binding. Using physiological protein concen-trations and rate constants, our simulations replicate severalmajor in vitro and in vivo experimental observations fromthe molecular scale to the cell level for both WT and3�Ala myosin II. Additionally, the simulations providepredictions of the strain energy associated with cooperativebinding. Although the simulations draw upon the proteinconcentrations in Dictyostelium cells, the assembly scheme
Biophysical Journal 102(2) 238–247
246 Luo et al.
can be easily adapted for the myosin assembly of otherspecies because the k1 and k�1 that dictate the reactionshave reported values in different systems (30), and theconcentrations of F-actin and myosin in the cortex are rela-tively straightforward to measure.
In Dictyostelium cells, myosin II and the actin cross-link-ing protein cortexillin I accumulate at the cleavage furrowduring cytokinesis, at the cell rear during motility, and inretracting pseudopods (37,38). The heterocooperativitybetween myosin and cortexillin proposed here might beonemechanism that contributes to these localized accumula-tions, and the myosin BTF assembly scheme may be used tounderstand the kinetics of these dynamic processes. Theproposed mechanism of cooperative localization involvesconformational changes in the actin filament due, in part,to tension and consistent with this idea, mutant Dictyoste-lium myosin motor domains (S1 fragments) with increasedactin affinity localize preferentially to actin filaments in me-chanically stressed regions of the cortex (39). Undoubtedly,the principles described here are general and may be appli-cable to other myosin-mediated, force-dependent accumula-tion of heterologous proteins, such as in focal adhesions (40).
Overall, we provide a multiscale model that accounts forthe in vivo cellular scale mechanosensitive accumulation ofmyosin II from the cooperative binding of the motor domaincoupled to the assembly of bipolar thick filaments.
SUPPORTING MATERIAL
Additional sections with supporting equations, three tables, 12 figures, and
five movies are available at http://www.biophysj.org/biophysj/supplemental/
S0006-3495(11)05422-1.
GFP-MHCKC plasmid is a gift from Tom Egelhoff.
This work is supported by the National Institutes of Health grants
GM066817 (to D.N.R.) and GM86704 (to D.N.R. and P.A.I.), and the
American Cancer Society grant RSG CCG-114122 (to D.N.R.).
REFERENCES
1. Spudich, J. A. 2001. The myosin swinging cross-bridge model. Nat.Rev. Mol. Cell Biol. 2:387–392.
2. Effler, J. C., Y.-S. Kee, ., D. N. Robinson. 2006. Mitosis-specificmechanosensing and contractile protein redistribution control cellshape. Curr. Biol. 16:1962–1967.
3. Ren, Y., J. C. Effler, ., D. N. Robinson. 2009. Mechanosensingthrough cooperative interactions between myosin II and the actin cross-linker cortexillin I. Curr. Biol. 19:1421–1428.
4. Wozniak, M. A., and C. S. Chen. 2009. Mechanotransduction in devel-opment: a growing role for contractility. Nat. Rev. Mol. Cell Biol.10:34–43.
5. Greene, L. E., and E. Eisenberg. 1980. Cooperative binding of myosinsubfragment-1 to the actin-troponin-tropomyosin complex. Proc. Natl.Acad. Sci. USA. 77:2616–2620.
6. Trybus, K. M., and E. W. Taylor. 1980. Kinetic studies of the cooper-ative binding of subfragment 1 to regulated actin. Proc. Natl. Acad. Sci.USA. 77:7209–7213.
Biophysical Journal 102(2) 238–247
7. Orlova, A., and E. H. Egelman. 1997. Cooperative rigor binding ofmyosin to actin is a function of F-actin structure. J. Mol. Biol.265:469–474.
8. Veigel, C., J. E. Molloy, ., J. Kendrick-Jones. 2003. Load-dependentkinetics of force production by smooth muscle myosin measured withoptical tweezers. Nat. Cell Biol. 5:980–986.
9. Uyeda, T. Q., P. D. Abramson, and J. A. Spudich. 1996. The neckregion of the myosin motor domain acts as a lever arm to generatemovement. Proc. Natl. Acad. Sci. USA. 93:4459–4464.
10. Bobkov, A. A., A. Muhlrad,., E. Reisler. 2006. Cooperative effects ofcofilin (ADF) on actin structure suggest allosteric mechanism of cofilinfunction. J. Mol. Biol. 356:325–334.
11. De La Cruz, E. M., and D. Sept. 2010. The kinetics of cooperativecofilin binding reveals two states of the cofilin-actin filament.Biophys. J. 98:1893–1901.
12. Shin, H., K. R. Purdy Drew,., G. M. Grason. 2009. Cooperativity andfrustration in protein-mediated parallel actin bundles. Phys. Rev. Lett.103:238102.
13. Galkin, V. E., A. Orlova, and E. H. Egelman. 2011. Actin filaments astension sensors. Curr. Biol. In press.
14. Siddique, M. S. P., G. Mogami, ., M. Suzuki. 2005. Cooperativestructural change of actin filaments interacting with activated myosinmotor domain, detected with copolymers of pyrene-labeled actinand acto-S1 chimera protein. Biochem. Biophys. Res. Commun.337:1185–1191.
15. Mahajan, R. K., K. T. Vaughan,., J. D. Pardee. 1989. Actin filamentsmediate Dictyosteliummyosin assembly in vitro. Proc. Natl. Acad. Sci.USA. 86:6161–6165.
16. MacKintosh, F. C. 2011. Active gels: motors keep dynamics steady.Nat. Mater. 10:414–415.
17. Surcel, A., Y.-S. Kee, ., D. N. Robinson. 2010. Cytokinesis throughbiochemical-mechanical feedback loops. Semin. Cell Dev. Biol.21:866–873.
18. Bao, G., and S. Suresh. 2003. Cell and molecular mechanics of biolog-ical materials. Nat. Mater. 2:715–725.
19. Yumura, S., M. Yoshida, ., T. T. Egelhoff. 2005. Multiple myosin IIheavy chain kinases: roles in filament assembly control and propercytokinesis in Dictyostelium. Mol. Biol. Cell. 16:4256–4266.
20. Schmit, J. D., E. Kamber, and J. Kondev. 2009. Lattice model of diffu-sion-limited bimolecular chemical reactions in confined environments.Phys. Rev. Lett. 102:218302.
21. Landau, L. D., and E. M. Lifshitz. 1986. Theory of Elasticity. Elsevier,Oxford, UK.
22. Tokuraku, K., R. Kurogi, ., T. Q. Uyeda. 2009. Novel mode of coop-erative binding between myosin and Mg2þ-actin filaments in the pres-ence of low concentrations of ATP. J. Mol. Biol. 386:149–162.
23. Murphy, C. T., and J. A. Spudich. 1998. Dictyostelium myosin 25–50Kloop substitutions specifically affect ADP release rates. Biochemistry.37:6738–6744.
24. Uehara, R., G. Goshima, ., E. R. Griffis. 2010. Determinants ofmyosin II cortical localization during cytokinesis. Curr. Biol.20:1080–1085.
25. Mahajan, R. K., and J. D. Pardee. 1996. Assembly mechanism ofDictyostelium myosin II: regulation by Kþ, Mg2þ, and actin filaments.Biochemistry. 35:15504–15514.
26. Sinard, J. H., W. F. Stafford, and T. D. Pollard. 1989. The mechanism ofassembly of Acanthamoeba myosin-II minifilaments: minifilamentsassemble by three successive dimerization steps. J. Cell Biol.109:1537–1547.
27. Moores, S. L., and J. A. Spudich. 1998. Conditional loss-of-myosin-II-function mutants reveal a position in the tail that is critical for filamentnucleation. Mol. Cell. 1:1043–1050.
28. Reichl, E. M., Y. Ren, ., D. N. Robinson. 2008. Interactions betweenmyosin and actin crosslinkers control cytokinesis contractilitydynamics and mechanics. Curr. Biol. 18:471–480.
Myosin Cooperativity in Mechanosensing 247
29. Berlot, C. H., P. N. Devreotes, and J. A. Spudich. 1987. Chemoattrac-tant-elicited increases in Dictyostelium myosin phosphorylation aredue to changes in myosin localization and increases in kinase activity.J. Biol. Chem. 262:3918–3926.
30. Takacs, B., E. O’Neall-Hennessey, ., M. Kovacs. 2011. Myosin cleftclosure determines the energetics of the actomyosin interaction.FASEB J. 25:111–121.
31. Kovacs, M., K. Thirumurugan,., J. R. Sellers. 2007. Load-dependentmechanism of nonmuscle myosin 2. Proc. Natl. Acad. Sci. USA.104:9994–9999.
32. Ben-Naim, A. 2001. Cooperativity and Regulation in BiochemicalProcesses. Kluwer Academic/Plenum Publishers, New York.
33. Cao, W., J. P. Goodarzi, and E. M. De La Cruz. 2006. Energetics andkinetics of cooperative cofilin-actin filament interactions. J. Mol.Biol. 361:257–267.
34. Zhou, Q., Y.-S. Kee, ., D. N. Robinson. 2010. 14–3-3 coordinatesmicrotubules, rac, and myosin II to control cell mechanics and cytoki-nesis. Curr. Biol. 20:1881–1889.
35. Discher, D. E., D. H. Boal, and S. K. Boey. 1998. Simulations of theerythrocyte cytoskeleton at large deformation. II. Micropipette aspira-tion. Biophys. J. 75:1584–1597.
36. Derenyi, I., F. Julicher, and J. Prost. 2002. Formation and interaction ofmembrane tubes. Phys. Rev. Lett. 88:238101.
37. Moores, S. L., J. H. Sabry, and J. A. Spudich. 1996. Myosin dynamicsin live Dictyostelium cells. Proc. Natl. Acad. Sci. USA. 93:443–446.
38. Xiong, Y., C. Kabacoff, ., P. Iglesias. 2010. Automated characteriza-tion of cell shape changes during amoeboid motility by skeletonization.BMC Syst. Biol. 4:33.
39. Uyeda, T. Q. P., Y. Iwadate,., S. Yumura. 2011. Stretching actin fila-ments within cells enhances their affinity for the myosin II motordomain. PLoS ONE. 6:e26200.
40. Kuo, J.-C., X. Han,., C. M. Waterman. 2011. Analysis of the myosin-II-responsive focal adhesion proteome reveals a role for b-Pix innegative regulation of focal adhesion maturation. Nat. Cell Biol.13:383–393.
Biophysical Journal 102(2) 238–247
1
Understanding the Cooperative Interaction between Myosin II and Actin Crosslinkers
Mediated by Actin Filaments during Mechanosensation
Tianzhi Luo, Krithika Mohan, Vasudha Srivastava, Yixin Ren, Pablo A. Iglesias, and Douglas N.
Robinson
Supplemental Materials
Supplemental Methods, Analysis, and Discussion
Pharmacological modulation of F-actin levels and the corresponding myosin
mechanosensory responses
We used latrunculin-A and jasplakinolide to adjust the F-actin level in myoII null cells
expressing GFP-myosin II and determined the amount of F-actin by rhodamine-phalloidin
staining. Cells were grown overnight in the presence of 0.2% DMSO on coverslips, and were
then treated with 5 μM latrunculin-A or 2 μM jasplakinolide for 20 min. The cells were fixed
with -20C acetone for 3 min. on ice and blocked in 1X PBT (1X PBS, 0.05% Triton X-100 and
0.5% BSA). Samples were stained with 160 nM rhodamine-phalloidin for 1 hour, then washed 4-
5 times with 1X PBT and mounted in 90% glycerol 1X PBS. For quantification of the actin
levels, images were acquired on an Olympus IX81 microscope under identical imaging
conditions. The fluorescence signals were measured for each cell and used as an indicator of the
relative F-actin amount. More than 300 cells were counted per condition and the signals were
normalized to the average of the 0.2% DMSO control. The cells were also imaged using a Zeiss
510 Meta confocal microscope to study the effects on the actin and myosin II distributions.
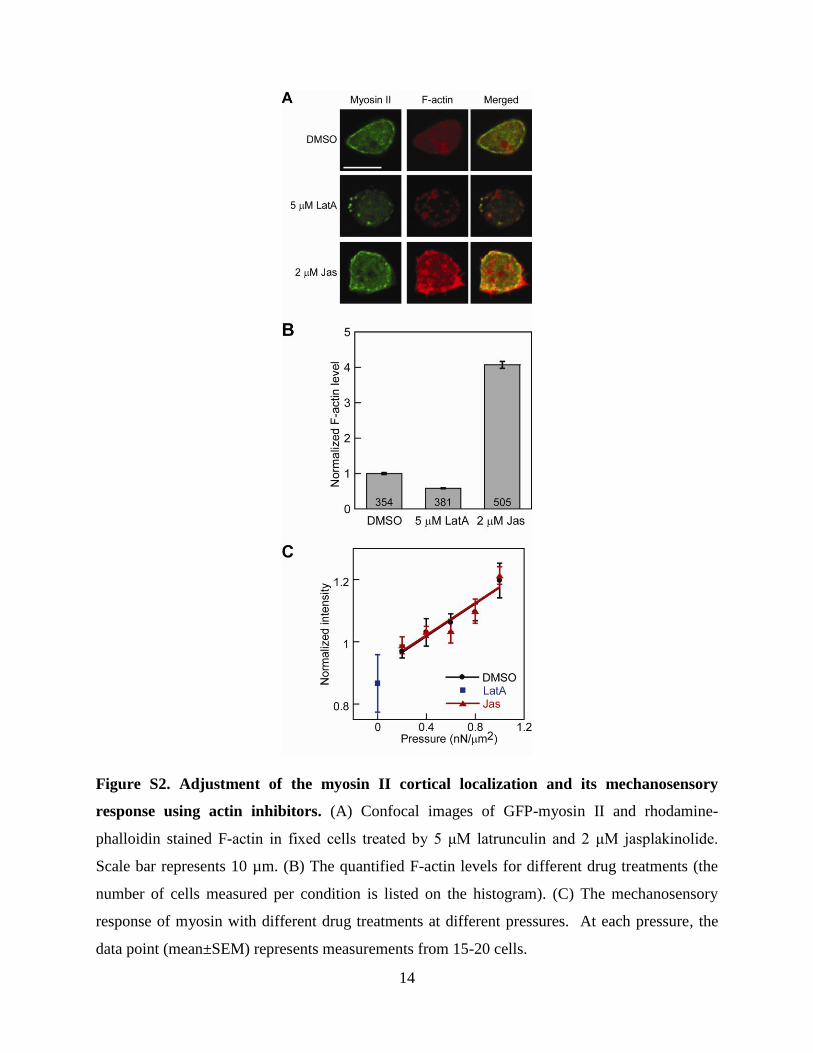
Latrunculin treatment reduced the F-actin levels to 40% of control while jasplakinolide
treatment increased F-actin levels four-fold (Fig. S2A,B). Both drug treatments induced
aggregations of F-actin and myosin II in the cortex, which lead to the structural non-uniformity
as compared to untreated cells. In the MPA assays, only very low pressures could be applied to
latrunculin-A-treated cells due to their extremely high deformability (higher pressures aspirated
the entire cell into the micropipette, making measurements at these pressures impossible). No
mechanosensitive accumulation was observed at these low pressures. In contrast, jasplakinolide
treatment did not alter the mechanoresponsiveness as compared to control over a range of
aspiration pressures (Fig. S2C).
2
The 2D kinetic Monte Carlo simulations reflect the 3D events
In the lattice kinetic Monte Carlo simulations, we used a 2D simulation box. However,
the simulations reasonably mimic 3D events because the length of mesh size, the length that
single myosin covers along actin filament, the binding and unbinding rates, and the diffusion
coefficients are based on 3D structures and 3D measurements (1). As far as the diffusion in
different dimensions is concerned, the mean square displacements of a random walk during time
period t are tDx 42
and tDx 62
for 2D and 3D cases, respectively, and hence the
mean square displacement differs only by a factor of 1.5 between the 2D and 3D cases.
However, differences between these 2D and 3D scenarios could slightly alter the cluster size.
The mean-field approximation of sE from statistical mechanics
We considered a one-dimensional actin filament with N binding sites for myosin and
used periodic boundary conditions to mimic an infinitely long filament. The partition function
Z of the system at each was calculated from 710 random samplings according to
j
Bjj TkHgZ exp , where jg is the corresponding degeneracy of the same energy level
and H is the energy of the system defined as bindingEUH . Here, U is the free energy of the
system in the absence of the binding of myosin to actin and bindingE is the binding energy of the
system. Mathematically, U has the form of myosite ENNEU , where N gives the number of
myosins in the system, and siteE and myoE are the energies for the single binding site and myosin,
respectively. The binding energy of the system is simply the sum of the binding energy of each
myosin-actin complex that has been defined in the KMC scheme, i.e., i
iibinding EEE 0
and k
ik
k
si xEE for Ni 1 . The system energy H then depends on the coverage .
The probability of the system at energy level jH is TkHgZ
HP Bjjjj exp1
and the mean
value of H is j
j
j HPH . It is noted that U and 0
iE are constants for each N and do not
depend on the permutation of the myosin positions. As a result, they cancel out eventually in the
3
exponential terms in both the numerator and the denominator of jP . By expanding both sides of
j
j
j HPH , one has
j
B
ji
ij
B
ji
i
jj i i
iij
i
i
i
i
TkEg
TkEEEUg
EEU
exp
exp0
0 . (S1)
Again, considering that U and 0
iE are constants, Eq. S1 reduces to
j
B
ji
ij
B
ji
i
jj i
ij
i
i
TkEg
TkEEg
E
exp
exp
. (S2)
i
iE is the average change in the binding energy of the system due to the cooperative
interactions. Since i k
iks
i
ik
i
s
i
i xExEE /exp0 , the mean-field approximation
of i
iE , sE , can be calculated exactly for each N using Eq. S2 and the values of 0
sE and λ.
The effect of the distribution of actin filament length on the cooperativity of myosin II
The mesh size of actin network is an average distance between the crosslinking points. In
2D lattice kinetic Monte Carlo simulations, the window size of simulation box is equal to the
mesh size assumed. When the mesh size is much larger than the characteristic decay length of
the strain field, λ, changing the mesh size only affects the effective actin concentration in the
simulation box and does not qualitatively change the cooperativity between bound myosins.
However, in cells, the actin filament length has a broad distribution, varying from a few
nanometers to submicron or even microns. If the length of certain actin filaments is close to the
decay length, λ ( 153 a nm), the cooperativity of myosins on these filaments will not be as
strong as predicted (or simulated) by this paper. To compare the simulation results in this paper
to the myosin behaviors in real cells, it is necessary to take the distribution of actin filament
length into account. For WT Dictyostelium cells, the mean and the median of the actin filament
length are 94 nm and 81 nm, respectively (2). Therefore, the effect of the randomness of actin
4
filament lengths is negligible when we compare the simulations to the experiments with
Dictyostelium cells.
The possibility of the force-dependency of the on-rate, k1
Here, the “off” rates k-1 is considered to be the primary force dependent term for two
reasons. The first is that the in vitro assay in Ref. (3) indicates the cooperativity of myosin II is
dependent on the isometric, actin-bound state of myosin II. The second is that the myosin actin-
binding lifetime is force-dependent (4). These two findings strongly suggest that the “off” rates
(or the binding lifetimes of myosin to actin) are force-dependent. However, it is possible that the
strain energy also affects the “on” rates by altering the actin filament structure, promoting
myosin binding. Numerically, we can simulate the cooperativity associated with the changes of
the "on" rates. However, with limited experimental evidence for changes in the "on" rate due to
forces and strains, the biological relevance of such simulations is unclear.
The dependence of bE on m
According to Eq. 3 (main text), 1k is an exponential function of bE , which is a
function of the amount of bound myosin ( m ) and is described by
mFdmEb . (S3)
The first term represents the strain energy and the second term is associated with the applied
force. can have a value of either 1 or 2 depending on the amount of bound myosin m
according to Eq. 3. 21 is always true since 21 . bE reaches its minimum when m is
at its critical value Fdmcr . cr may be defined as 2
crcr mFd . When cr , bE
increases with m and otherwise decreases with m . As a result, 1k decreases with m if cr
and increases with m if cr . We then considered the case where 21 cr . Two curves
(dotted lines) describing bE as a function of are shown in Fig. S6A with 1 and 2 ,
respectively. It is easier to discuss the dependence of bE on m instead of as m is related to
by actinCm3 . During myosin assembly, sE initially has a slope of 1 at and the slope
changes to 2 as the number of bound myosin exceeds * . The corresponding transient
5
behavior of bE is schematically indicated by the solid curve in Fig. 3A. bE as a function of
at different Fd for 0
sE at 1, 2, and 3kBT are shown in Figs S6B-D, respectively.
The concentration of unbound myosin monomer during myosin transport
In cells, the local myosin concentration changes but the concentration of certain myosin
forms might be constant. The mobile or diffusible unit of myosin in cell cortex is more likely to
be the unbound myosin monomer (UMM). The cytoplasm can be considered as a reservoir of
UMM and diffusion is able to quickly smooth the UMM gradient in the cytoplasm, which means
the concentration of UMM is constant during the BTF assembly induced by local force.
Therefore, to simulate the myosin accumulation and BTF assembly during mechanosensing
without using real 3D geometry (results shown in Fig. 5), the concentration of UMM ( M and
M ) is kept constant.
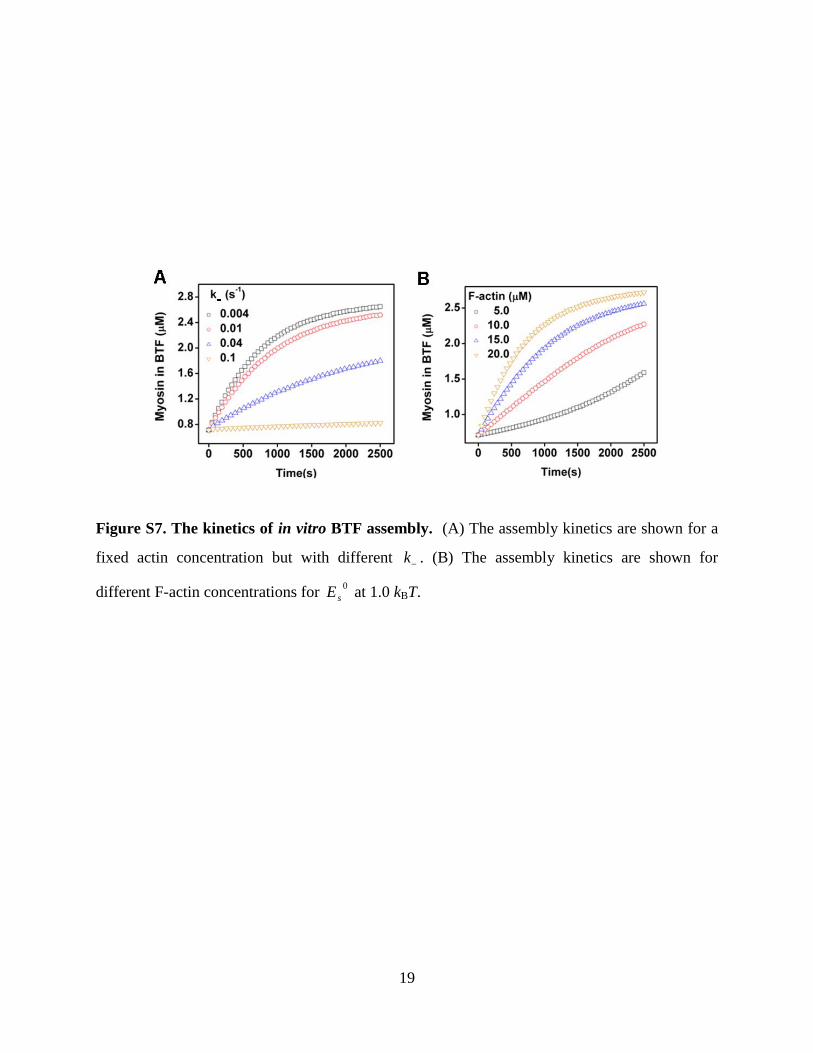
The sensitivity of k and k in the absence of force
The coefficient k may be evaluated numerically by fitting the simulation results to the
observation that the BTF fraction is ~20%-50%. Here, k varied in the range 0.004-0.1 s-1
assuming 4.3sin myoC μM, 0.20actinC μM, 0.10 sE kBT, and 0Fd (Fig. S7A). It can be
seen that high k leads to less assembled BTF. At 1.0k s-1
, the BTF concentration is
maintained at 0.7 μM, ~20% of the total myosin. For the case of 0.10 sE kBT, larger k is
needed to set steady-state BTF at 0.7 μM (not shown).
As a proof of principle, k is varied by adjusting actinC in the range of 5-20 μM,
assuming that 4.3sin myoC μM, 1.0k s-1
, 0.10 sE kBT, and 0Fd (Fig. S7B). It can be
seen that the high F-actin does promote BTF assembly and the saturation concentration of actin
is about six times the myosin concentration, which is consistent with the experimental
observations (5). For different 0
sE , it is true that higher k leads to more bound myosin, which
can be seen by comparing Fig. S8A to S8B. In these simulations, the force term is zero and the
myosin concentration is constant. Hence, the simulations reflect the conditions of in vitro BTF
assembly.
6
Estimation of the Fd term for Dictyostelium cells during MPA measurements
During MPA measurements, the applied pressure is transmitted through the membrane and the
membrane-cortex linkage to the actin cortex. Initially, myosin II concentration in the cortex,
sinmyoC , is 4 μM of which approximately half is in BTFs (6). Assuming the thickness of the
cortex is ~0.5 μm, ~2000 myosins per μm2
counteract the pressure applied externally on the
plasma membrane. Each myosin has two heads and a 4.0 pN stall force. As a result, the upper
bound of duty ratio, 0.06, gives a maximum stress of ~0.5 nN/μm2 if all engaged myosins are
stalled due to the applied force. This leads to a corresponding maximum value of Fd of ~280
kBT where Fd is based on the total force/area (nN/μm2).
The relation between Fd term and the applied pressure during MPA measurements
Besides myosin II, a number of other load bearing units exist in the actin cytoskeleton, including
actin crosslinking proteins whose concentrations are also on the order of 1 μM. Because these
proteins bear some of the load, only a fraction of the applied pressure is distributed on myosin.
Based on measurements of the cortical tension in interphase wild type and myoII null cells (2),
we estimate that myosin II contributes ~20% of the cortical tension. Thus, it is reasonable to
assume that myosin II only bears ~20% of the pressure applied on interphase wild type
Dictyostelium cells during MPA measurements. Further support for this idea comes from the
observation that reducing interphase cortical tension by 3-fold in racE mutants reduces the
mechanosensitive pressure-range of interphase cells by 3-5-fold (RacE controls the distribution
of cortical actin crosslinking proteins) (7). Therefore, the range of 0~280 kBT of Fd for myosin
II roughly corresponds to 0~2.5 nN/μm2
(i.e., the maximum is five times ~0.5 nN/μm2) of the
applied pressure on the intact wild type cytoskeleton when the cortical myosin II concentration is
4 μM.
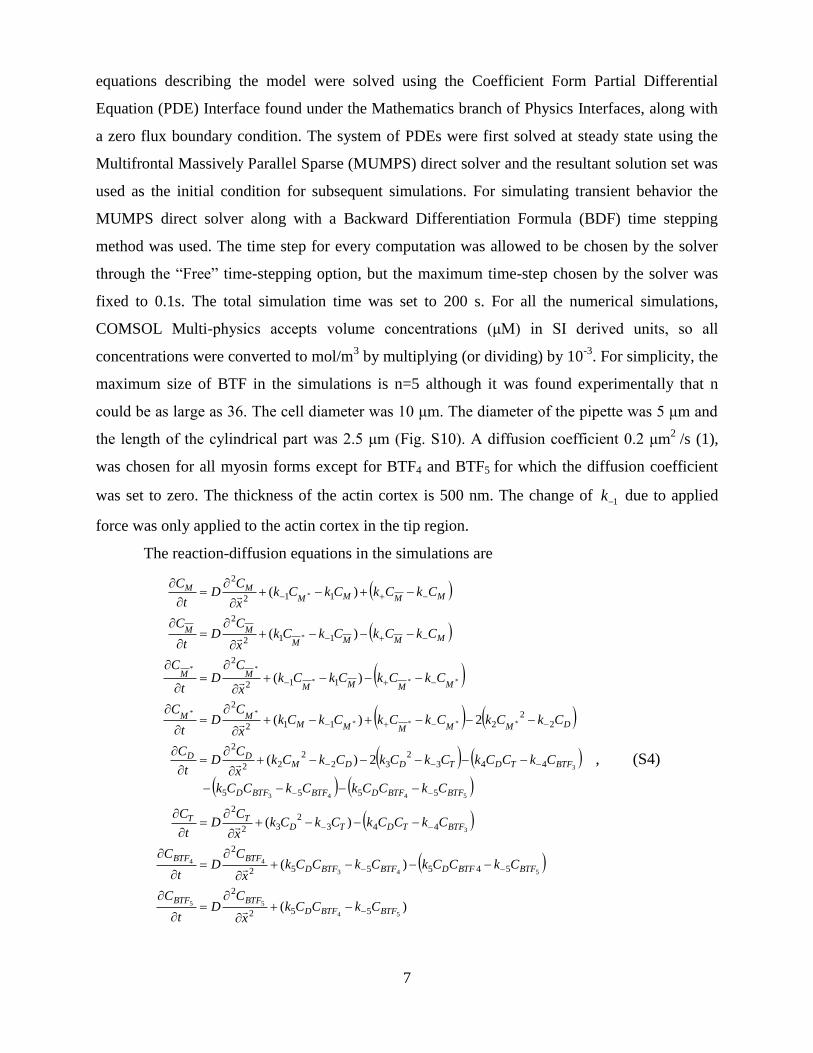
Solving the reaction-diffusion equations of myosin BTF assembly and myosin accumulation
in 3D geometry by COMSOL
The multi-scale model describing the BTF assembly formation and myosin accumulation
was implemented using COMSOL Multi-physics (COMSOL, Burlington, MA) version 4.2. The
model was configured using a geometry drawn in “2D and 2D” axially symmetric space, to take
advantage of symmetry. Subsequent results were displayed in full three dimensions. Each
simulation was meshed using a physics controlled “Normal mesh.” The reaction-diffusion
7
equations describing the model were solved using the Coefficient Form Partial Differential
Equation (PDE) Interface found under the Mathematics branch of Physics Interfaces, along with
a zero flux boundary condition. The system of PDEs were first solved at steady state using the
Multifrontal Massively Parallel Sparse (MUMPS) direct solver and the resultant solution set was
used as the initial condition for subsequent simulations. For simulating transient behavior the
MUMPS direct solver along with a Backward Differentiation Formula (BDF) time stepping
method was used. The time step for every computation was allowed to be chosen by the solver
through the “Free” time-stepping option, but the maximum time-step chosen by the solver was
fixed to 0.1s. The total simulation time was set to 200 s. For all the numerical simulations,
COMSOL Multi-physics accepts volume concentrations (μM) in SI derived units, so all
concentrations were converted to mol/m3 by multiplying (or dividing) by 10
-3. For simplicity, the
maximum size of BTF in the simulations is n=5 although it was found experimentally that n
could be as large as 36. The cell diameter was 10 μm. The diameter of the pipette was 5 μm and
the length of the cylindrical part was 2.5 μm (Fig. S10). A diffusion coefficient 0.2 μm2
/s (1),
was chosen for all myosin forms except for BTF4 and BTF5 for which the diffusion coefficient
was set to zero. The thickness of the actin cortex is 500 nm. The change of 1k due to applied
force was only applied to the actin cortex in the tip region.
The reaction-diffusion equations in the simulations are
)(
)(
)(
2)(
2)(
)(
)(
)(
54
55
543
44
3
5443
3
****
**
***
**
*
*
552
2
545552
2
4432
32
2
5555
4432
322
22
2
22
2112
2
112
2
112
2
112
2
BTFBTFD
BTFBTF
BTFBTFDBTFBTFD
BTFBTF
BTFTDTDTT
BTFBTFDBTFBTFD
BTFTDTDDMDD
DMMMMMMM
MMMM
MM
MMMM
MM
MMMM
MM
CkCCkx
CD
t
C
CkCCkCkCCkx
CD
t
C
CkCCkCkCkx
CD
t
C
CkCCkCkCCk
CkCCkCkCkCkCkx
CD
t
C
CkCkCkCkCkCkx
CD
t
C
CkCkCkCkx
CD
t
C
CkCkCkCkx
CD
t
C
CkCkCkCkx
CD
t
C
, (S4)

8
where C represents the concentration and the subscripts correspond to different components in
the assembly scheme. Parameters and algorithm are listed in Tables S1 to S3.
9
Supplemental References
1. Uehara, R., G. Goshima, I. Mabuchi, R. D. Vale, J. A. Spudich, and E. R. Griffis. 2010.
Determinants of myosin II cortical localization during cytokinesis. Curr. Biol. 20:1080-
1085.
2. Reichl, E. M., Y. Ren, M. K. Morphew, M. Delannoy, J. C. Effler, K. D. Girard, S. Divi,
P. A. Iglesias, S. C. Kuo, and D. N. Robinson. 2008. Interactions between myosin and
actin crosslinkers control cytokinesis contractility dynamics and mechanics. Curr. Biol.
18:471 - 480.
3. Tokuraku, K., R. Kurogi, R. Toya, and T. Q. Uyeda. 2009. Novel mode of cooperative
binding between myosin and Mg2+ -actin filaments in the presence of low concentrations
of ATP. J. Mol. Biol. 386:149-162.
4. Veigel, C., J. E. Molloy, S. Schmitz, and J. Kendrick-Jones. 2003. Load-dependent
kinetics of force production by smooth muscle myosin measured with optical tweezers.
Nat. Cell Biol. 5:980-986.
5. Mahajan, R. K., K. T. Vaughan, J. A. Johns, and J. D. Pardee. 1989. Actin filaments
mediate Dictyostelium myosin assembly in vitro. Proc. Natl. Acad. Sci. U.S.A. 86:6161-
6165.
6. Surcel, A., Y.-S. Kee, T. Luo, and D. N. Robinson. 2010. Cytokinesis through
biochemical-mechanical feedback loops. Semin. Cell Dev. Biol. 21:866-873.
7. Ren, Y., J. C. Effler, M. Norstrom, T. Luo, R. A. Firtel, P. A. Iglesias, R. S. Rock, and D.
N. Robinson. 2009. Mechanosensing through cooperative interactions between myosin II
and the actin crosslinker cortexillin I. Curr. Biol. 19:1421-1428.
8. Berlot, C. H., P. N. Devreotes, and J. A. Spudich. 1987. Chemoattractant-elicited
increases in Dictyostelium myosin phosphorylation are due to changes in myosin
localization and increases in kinase activity. J. Biol. Chem. 262:3918-3926.
9. Mahajan, R. K., and J. D. Pardee. 1996. Assembly mechanism of Dictyostelium myosin
II: Regulation by K+, Mg
2+, and actin filaments. Biochemistry 35:15504-15514.
10. Moores, S. L., and J. A. Spudich. 1998. Conditional loss-of-myosin-II-munction mutants
reveal a position in the tail that Is critical for filament nucleation. Mol. Cell 1:1043-1050.
11. Yumura, S., M. Yoshida, V. Betapudi, L. S. Licate, Y. Iwadate, A. Nagasaki, T. Q.
Uyeda, and T. T. Egelhoff. 2005. Multiple myosin II heavy chain kinases: roles in
filament assembly control and proper cytokinesis in Dictyostelium. Mol. Biol. Cell
16:4256-4266.
12. Takcás, B., E. O'Neall-Hennessey, C. Hetényi, J. Kardos, A. G. Szent-Györgyi, and M.
Kovács. 2011. Myosin cleft closure determines the energetics of the actomyosin
interaction. FASEB J. 25:111-121.
13. Zhou, Q., Y.-S. Kee, C. C. Poirier, C. Jelinek, J. Osborne, S. Divi, A. Surcel, M. E. Will,
U. S. Eggert, A. Müller-Taubenberger, P. A. Iglesias, R. J. Cotter, and D. N. Robinson.
2010. 14-3-3 coordinates microtubules, rac, and myosin II to control cell mechanics and
cytokinesis. Curr. Biol. 20:1881-1889.
10
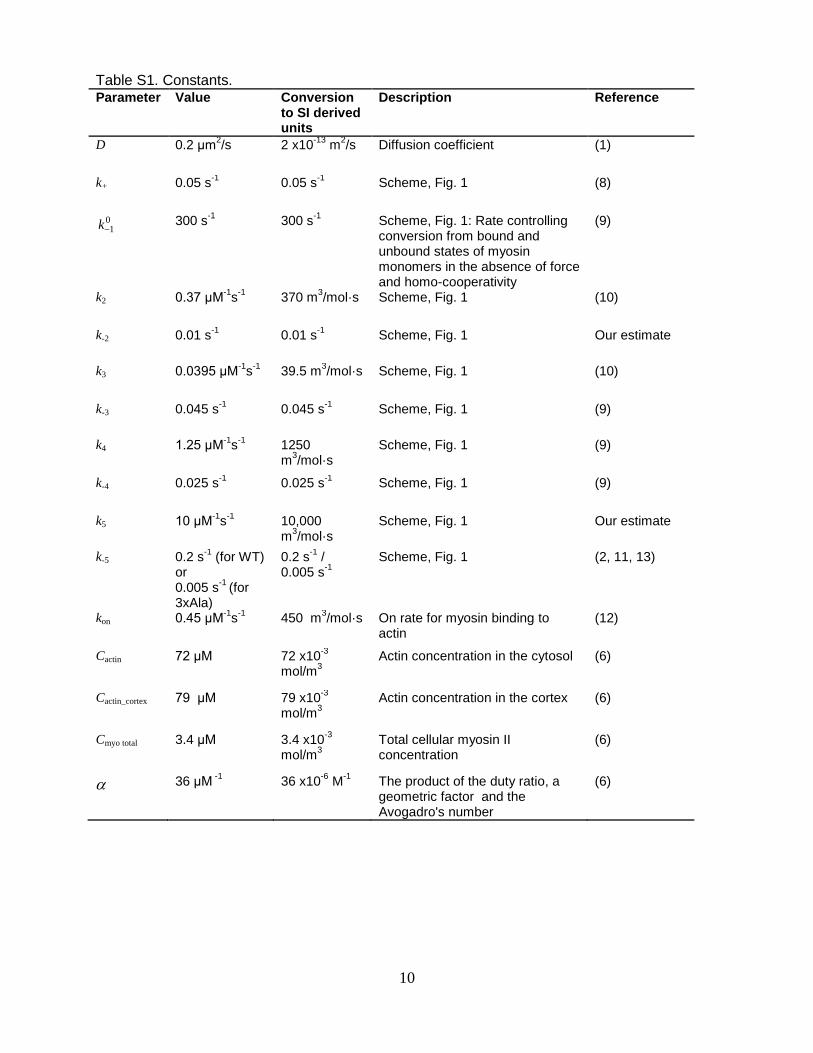
Table S1. Constants. Parameter Value Conversion
to SI derived units
Description Reference
D 0.2 μm2/s 2 x10
-13 m
2/s Diffusion coefficient (1)
k+ 0.05 s-1
0.05 s-1
Scheme, Fig. 1 (8)
01k 300 s
-1 300 s
-1 Scheme, Fig. 1: Rate controlling
conversion from bound and unbound states of myosin monomers in the absence of force and homo-cooperativity
(9)
k2 0.37 μM-1
s-1
370 m3/mol·s Scheme, Fig. 1 (10)
k-2 0.01 s-1
0.01 s-1
Scheme, Fig. 1 Our estimate
k3 0.0395 μM-1
s-1
39.5 m3/mol·s Scheme, Fig. 1 (10)
k-3 0.045 s-1
0.045 s-1
Scheme, Fig. 1 (9)
k4 1.25 μM-1
s-1
1250 m
3/mol·s
Scheme, Fig. 1 (9)
k-4 0.025 s-1
0.025 s-1
Scheme, Fig. 1 (9)
k5 10 μM-1
s-1
10,000 m
3/mol·s
Scheme, Fig. 1 Our estimate
k-5 0.2 s-1
(for WT) or 0.005 s
-1 (for
3xAla)
0.2 s-1
/ 0.005 s
-1
Scheme, Fig. 1 (2, 11, 13)
kon 0.45 μM-1
s-1
450 m3/mol·s On rate for myosin binding to
actin (12)
Cactin 72 μM 72 x10-3
mol/m
3
Actin concentration in the cytosol (6)
Cactin_cortex 79 μM 79 x10-3
mol/m
3
Actin concentration in the cortex (6)
Cmyo total 3.4 μM 3.4 x10⁻³
mol/m
3
Total cellular myosin II concentration
(6)
36 μM -1
36 x10-6
M-1
The product of the duty ratio, a geometric factor and the Avogadro's number
(6)
11
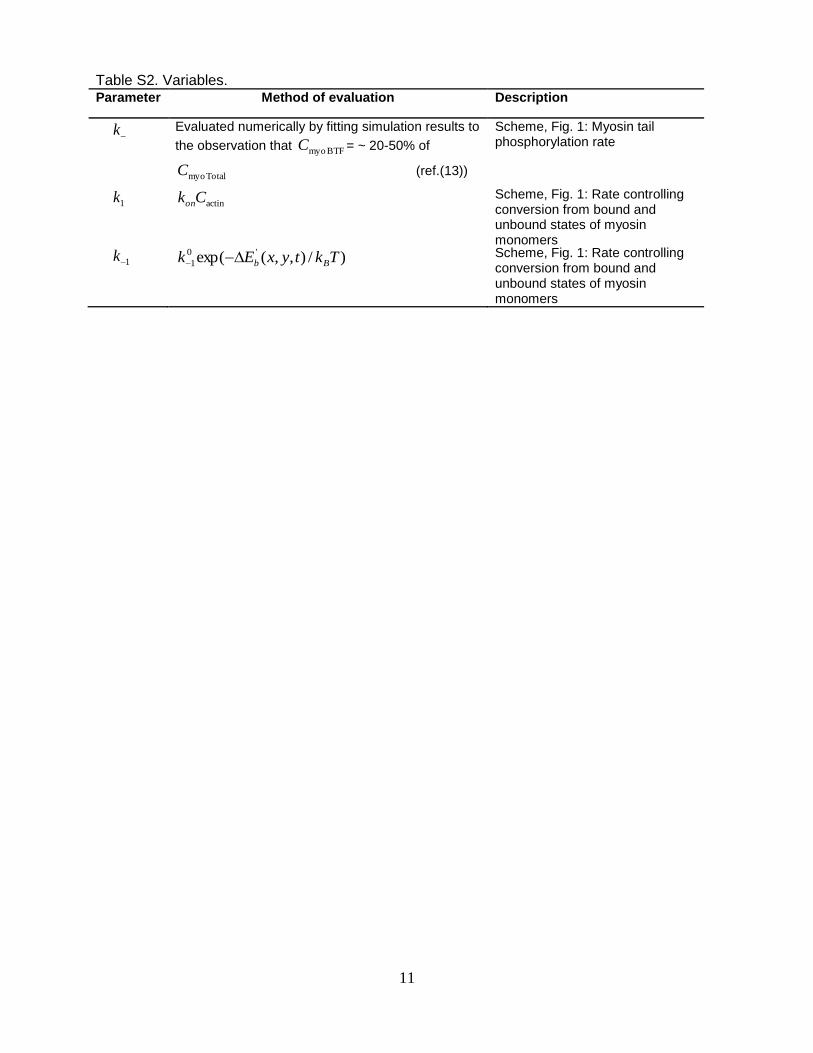
Table S2. Variables. Parameter Method of evaluation Description
k
Evaluated numerically by fitting simulation results to
the observation that BTF myoC = ~ 20-50% of
Total myoC (ref.(13))
Scheme, Fig. 1: Myosin tail phosphorylation rate
1k actinCkon Scheme, Fig. 1: Rate controlling conversion from bound and unbound states of myosin monomers 1k
)/),,(exp( '0
1 TktyxEk Bb Scheme, Fig. 1: Rate controlling conversion from bound and unbound states of myosin monomers
12
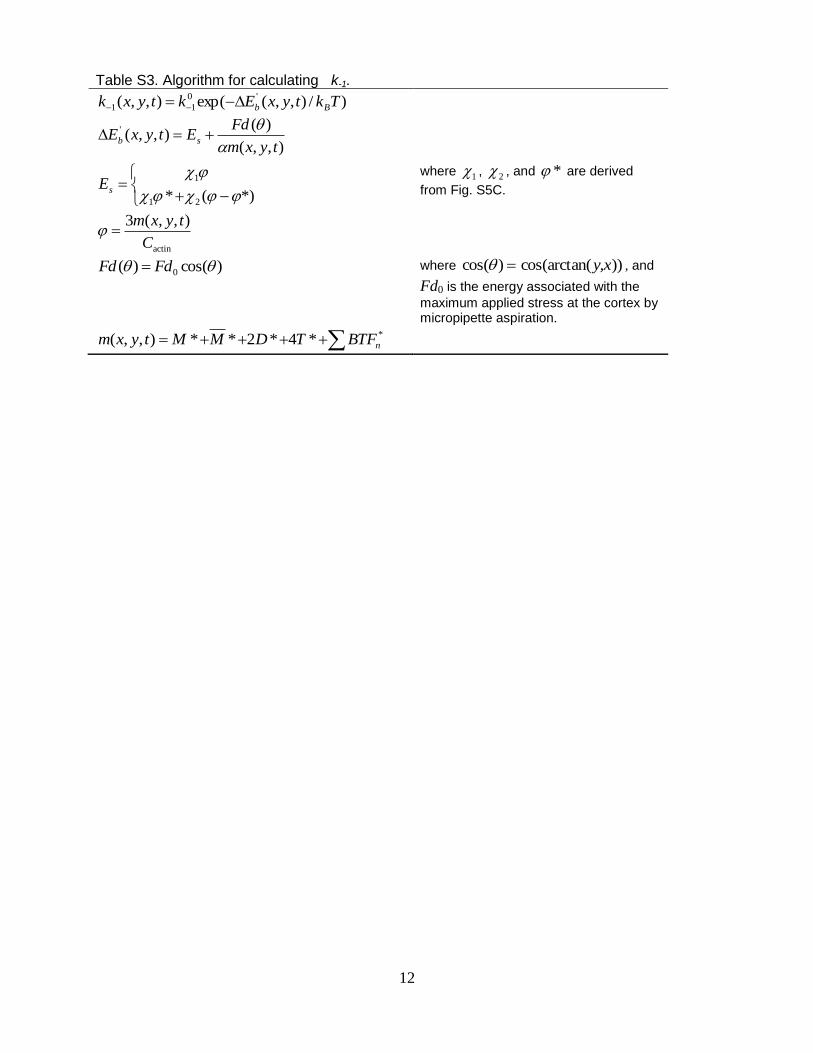
Table S3. Algorithm for calculating k-1.
)/),,(exp(),,( '0
11 TktyxEktyxk Bb
),,(
)(),,('
tyxm
FdEtyxE sb
*)(* 21
1
sE
where 1 , 2 , and * are derived
from Fig. S5C.
actin
),,(3
C
tyxm
)cos()( 0 FdFd where ))(cos(arctan)cos( y,x , and
Fd0 is the energy associated with the
maximum applied stress at the cortex by micropipette aspiration.
**4*2**),,( nBTFTDMMtyxm
13
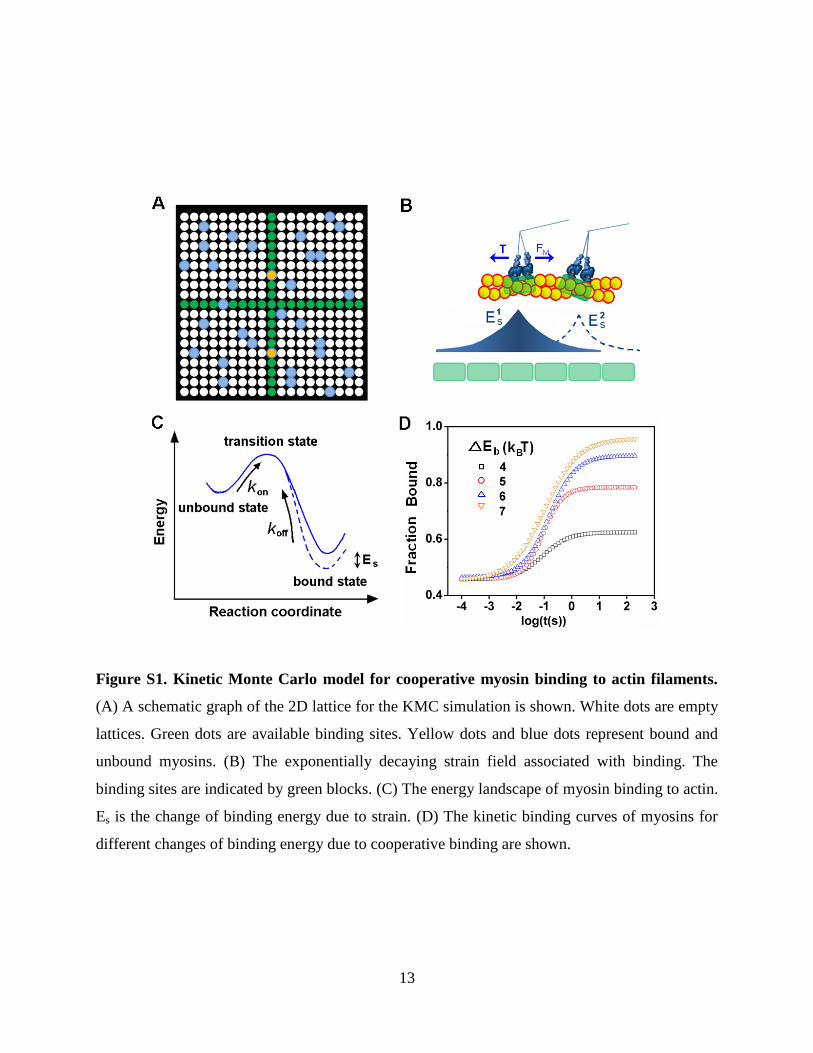
Figure S1. Kinetic Monte Carlo model for cooperative myosin binding to actin filaments.
(A) A schematic graph of the 2D lattice for the KMC simulation is shown. White dots are empty
lattices. Green dots are available binding sites. Yellow dots and blue dots represent bound and
unbound myosins. (B) The exponentially decaying strain field associated with binding. The
binding sites are indicated by green blocks. (C) The energy landscape of myosin binding to actin.
Es is the change of binding energy due to strain. (D) The kinetic binding curves of myosins for
different changes of binding energy due to cooperative binding are shown.
14
Figure S2. Adjustment of the myosin II cortical localization and its mechanosensory
response using actin inhibitors. (A) Confocal images of GFP-myosin II and rhodamine-
phalloidin stained F-actin in fixed cells treated by 5 μM latrunculin and 2 μM jasplakinolide.
Scale bar represents 10 µm. (B) The quantified F-actin levels for different drug treatments (the
number of cells measured per condition is listed on the histogram). (C) The mechanosensory
response of myosin with different drug treatments at different pressures. At each pressure, the
data point (mean±SEM) represents measurements from 15-20 cells.
15
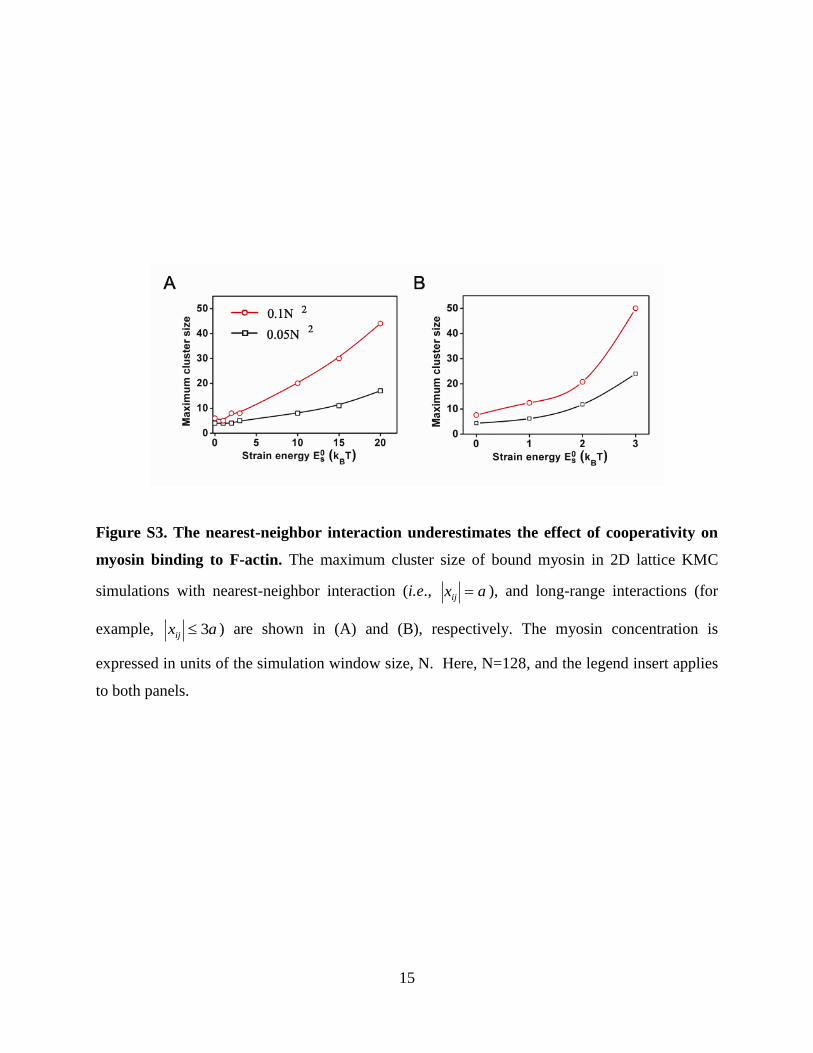
Figure S3. The nearest-neighbor interaction underestimates the effect of cooperativity on
myosin binding to F-actin. The maximum cluster size of bound myosin in 2D lattice KMC
simulations with nearest-neighbor interaction (i.e., axij ), and long-range interactions (for
example, axij 3 ) are shown in (A) and (B), respectively. The myosin concentration is
expressed in units of the simulation window size, N. Here, N=128, and the legend insert applies
to both panels.
16
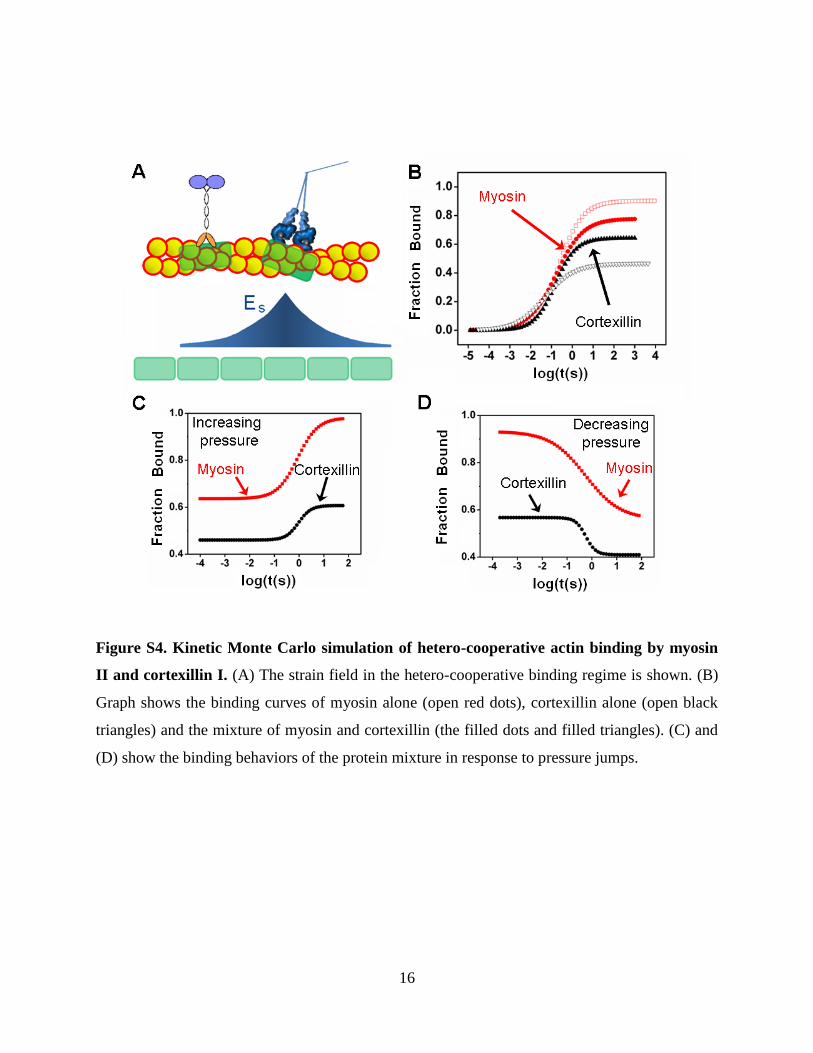
Figure S4. Kinetic Monte Carlo simulation of hetero-cooperative actin binding by myosin
II and cortexillin I. (A) The strain field in the hetero-cooperative binding regime is shown. (B)
Graph shows the binding curves of myosin alone (open red dots), cortexillin alone (open black
triangles) and the mixture of myosin and cortexillin (the filled dots and filled triangles). (C) and
(D) show the binding behaviors of the protein mixture in response to pressure jumps.
17
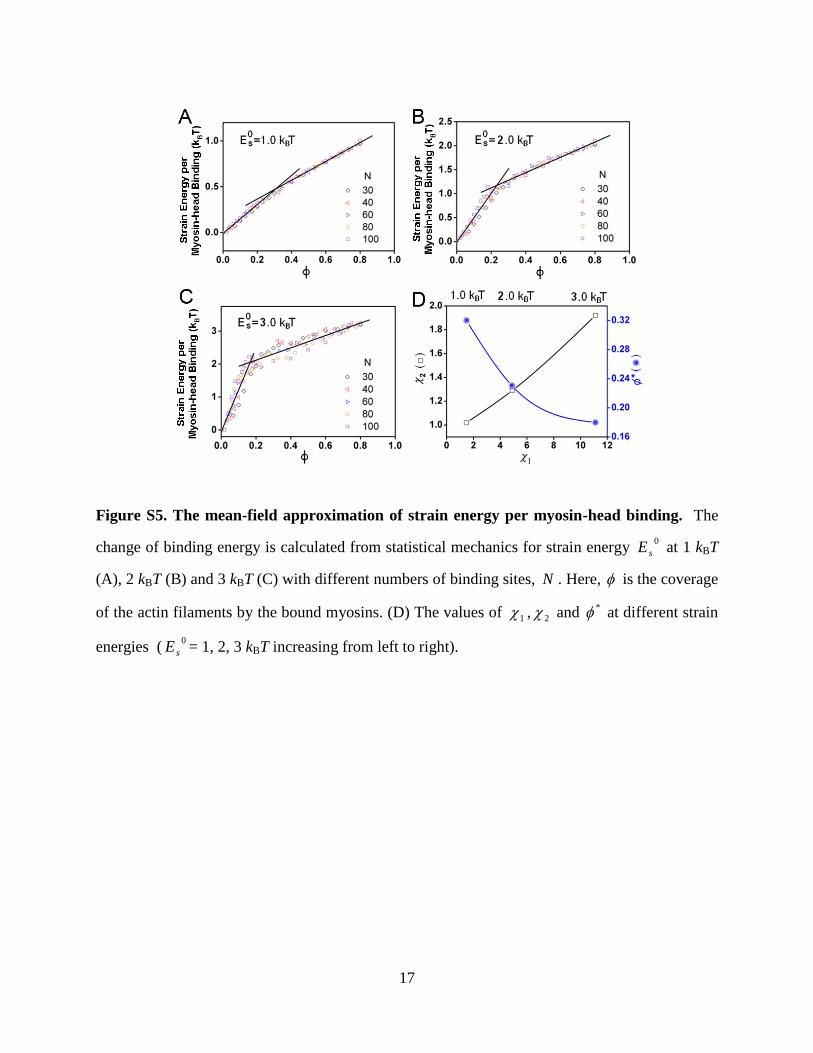
Figure S5. The mean-field approximation of strain energy per myosin-head binding. The
change of binding energy is calculated from statistical mechanics for strain energy 0
sE at 1 kBT
(A), 2 kBT (B) and 3 kBT (C) with different numbers of binding sites, N . Here, is the coverage
of the actin filaments by the bound myosins. (D) The values of 1 , 2 and * at different strain
energies (0
sE = 1, 2, 3 kBT increasing from left to right).
18
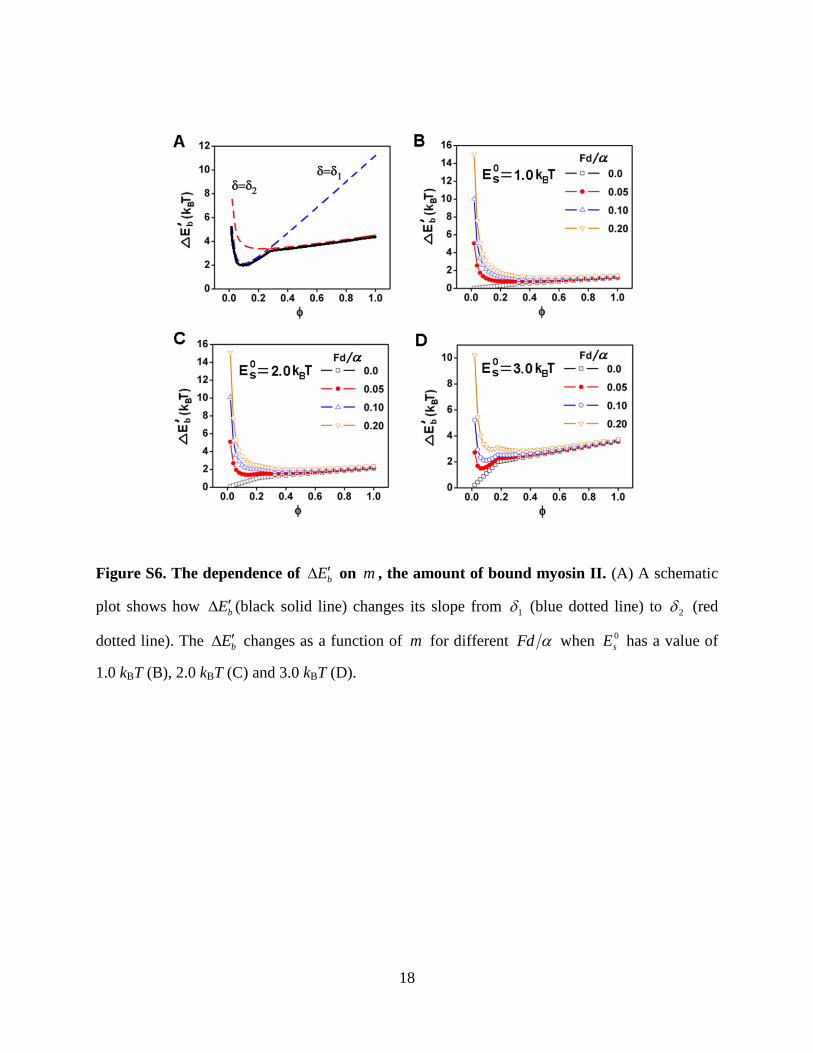
Figure S6. The dependence of bE on m , the amount of bound myosin II. (A) A schematic
plot shows how bE (black solid line) changes its slope from 1 (blue dotted line) to 2 (red
dotted line). The bE changes as a function of m for different Fd when 0
sE has a value of
1.0 kBT (B), 2.0 kBT (C) and 3.0 kBT (D).
19
Figure S7. The kinetics of in vitro BTF assembly. (A) The assembly kinetics are shown for a
fixed actin concentration but with different k . (B) The assembly kinetics are shown for
different F-actin concentrations for 0
sE at 1.0 kBT.
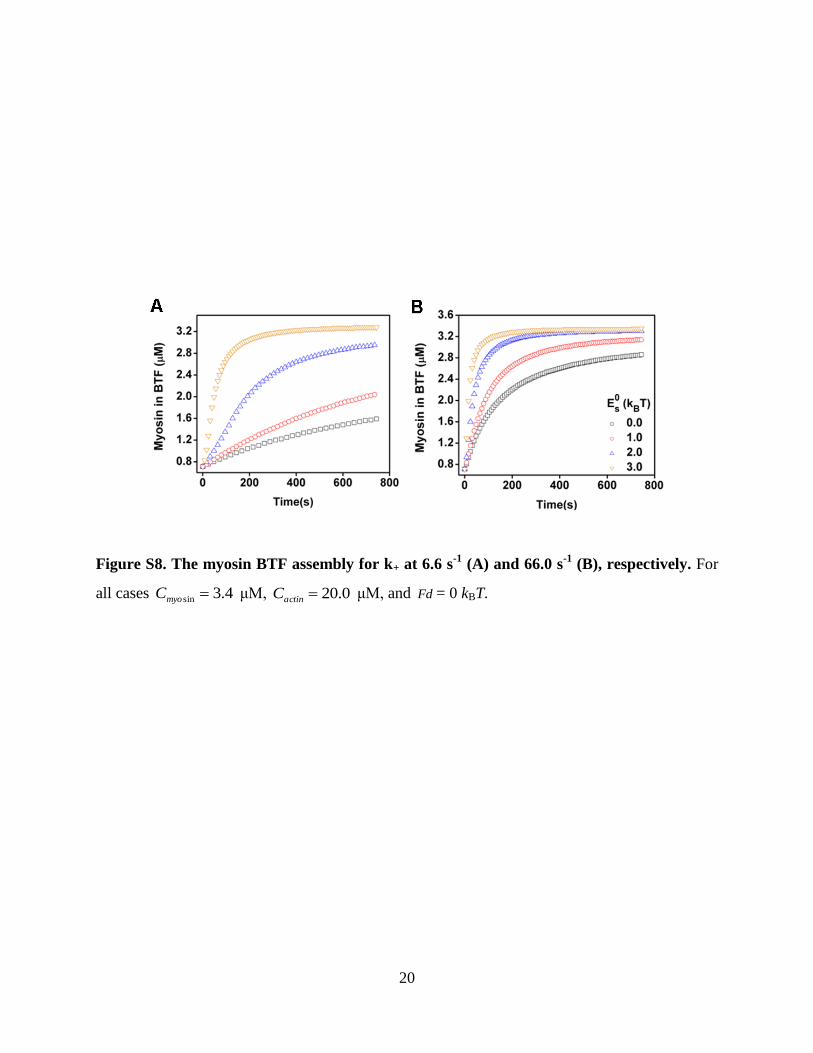
20
Figure S8. The myosin BTF assembly for k+ at 6.6 s-1
(A) and 66.0 s-1
(B), respectively. For
all cases 4.3sin myoC μM, 0.20actinC μM, and Fd = 0 kBT.
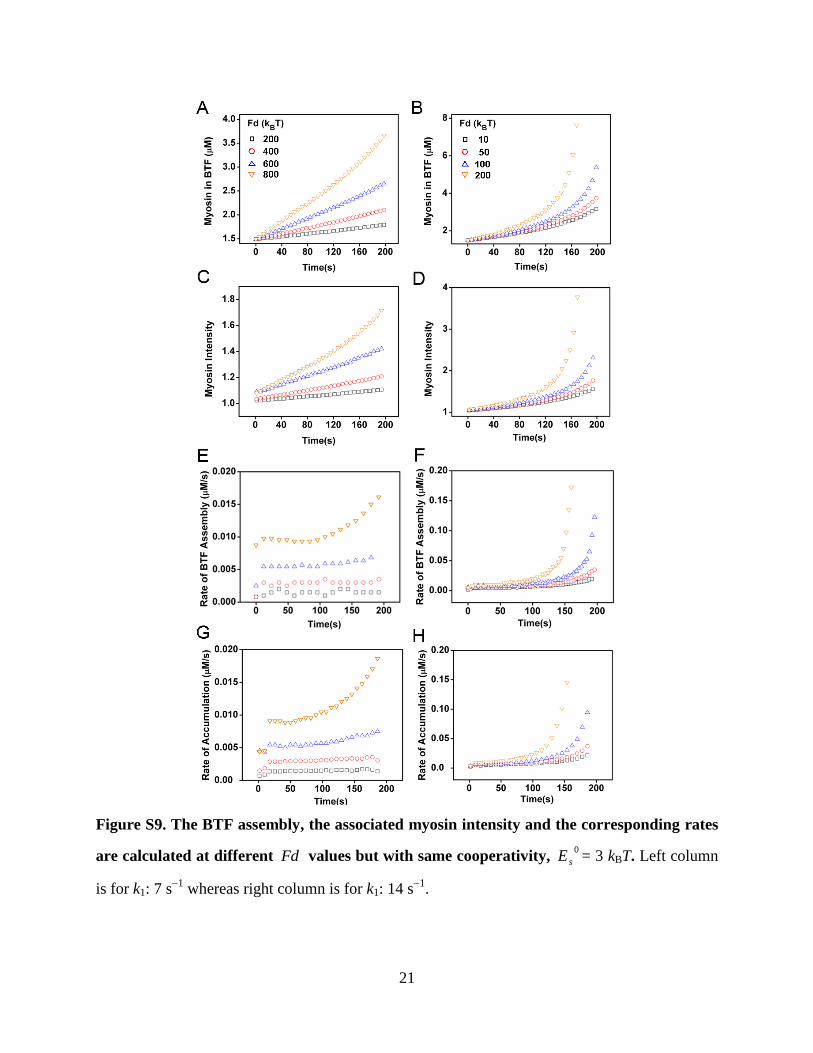
21
Figure S9. The BTF assembly, the associated myosin intensity and the corresponding rates
are calculated at different Fd values but with same cooperativity, 0
sE = 3 kBT. Left column
is for k1: 7 s1
whereas right column is for k1: 14 s1
.
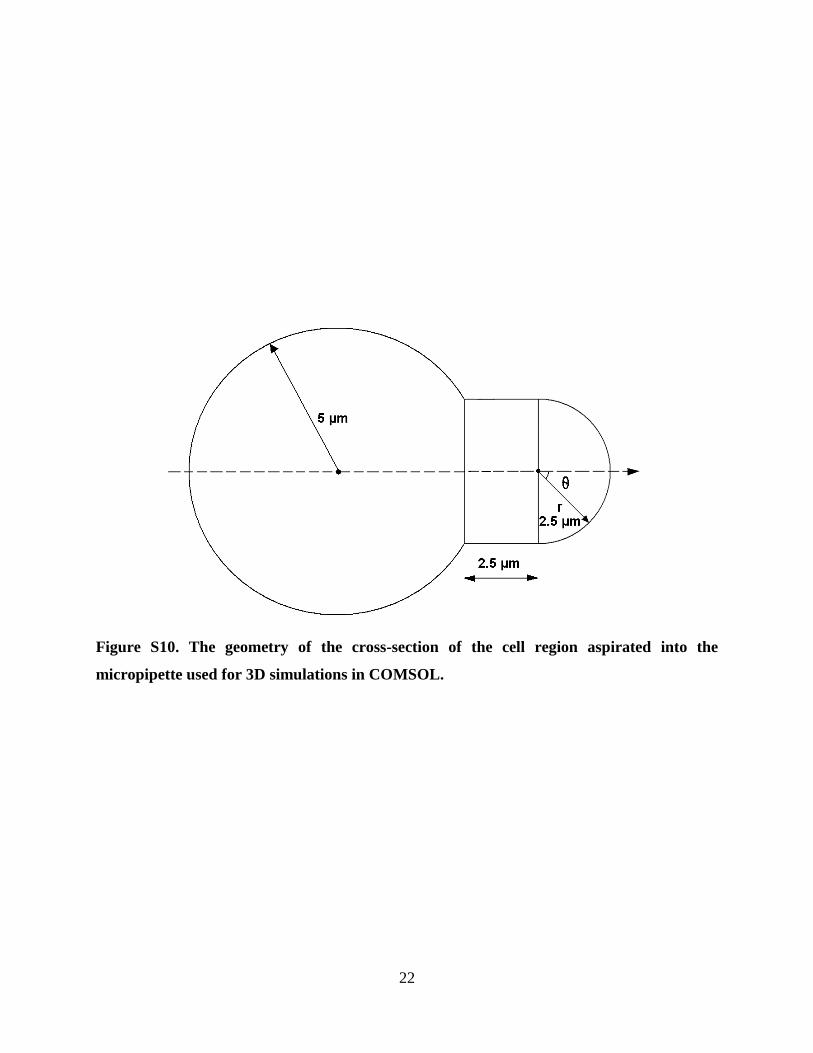
22
Figure S10. The geometry of the cross-section of the cell region aspirated into the
micropipette used for 3D simulations in COMSOL.
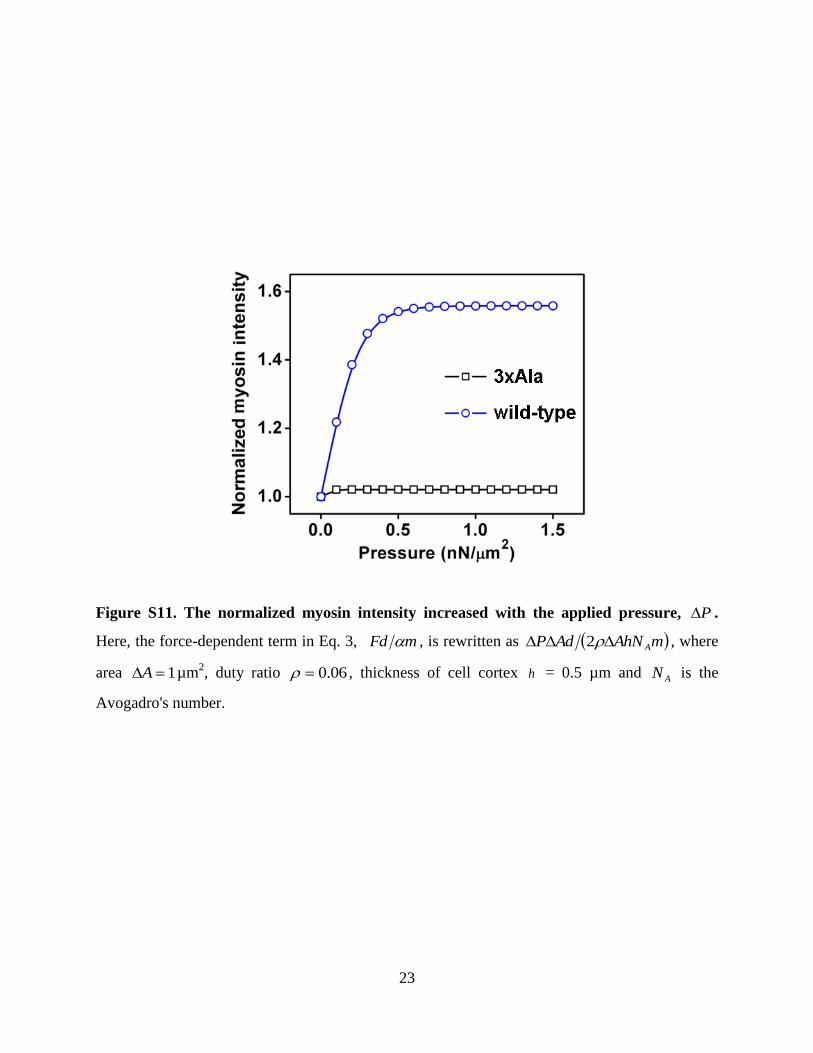
23
Figure S11. The normalized myosin intensity increased with the applied pressure, P .
Here, the force-dependent term in Eq. 3, mFd , is rewritten as mAhNAdP A 2 , where
area 1A µm2, duty ratio 06.0 , thickness of cell cortex h
= 0.5 µm and AN is the
Avogadro's number.
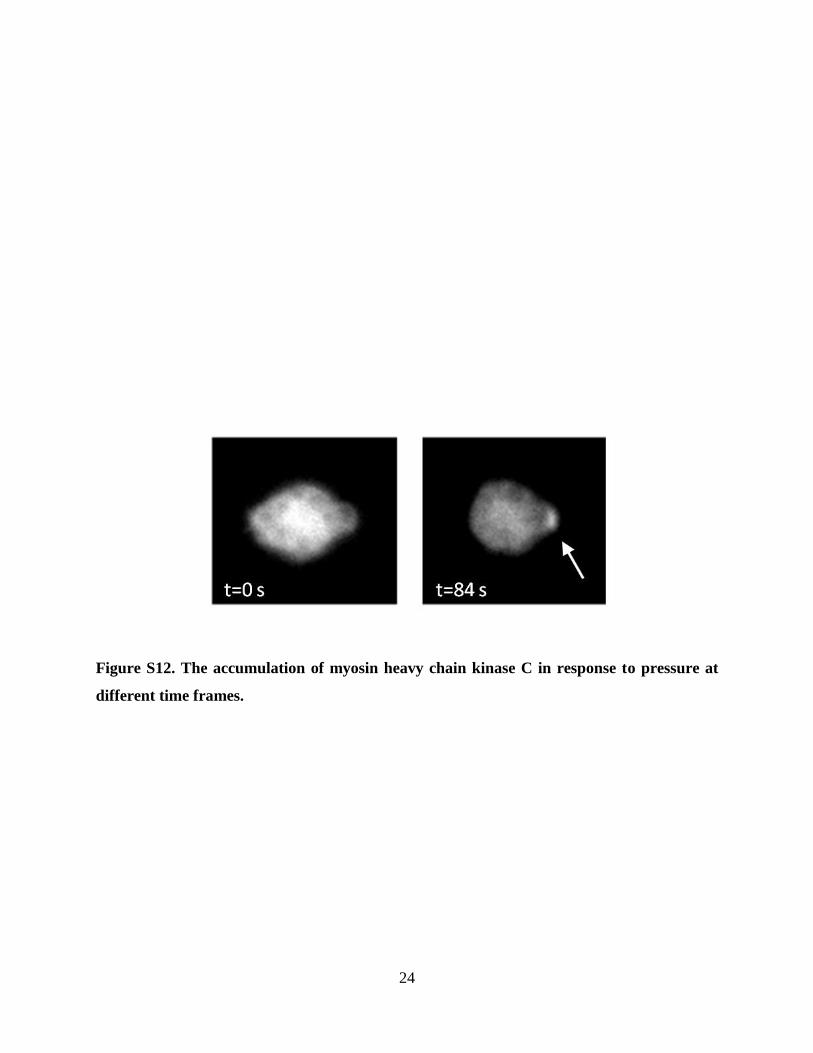
24
Figure S12. The accumulation of myosin heavy chain kinase C in response to pressure at
different time frames.
25
Supplemental Movie Legends
Supplemental Movie 1. Movie shows the simulation result for cooperative binding of myosin II
to actin filaments. The bound myosins (orange dots) form clusters on the actin filaments. The
grey dots are the freely diffusing monomers. The time delays between each frame increase
logarithmically.
Supplemental Movie 2. Movie shows the simulation result for cooperative binding of myosin II
and cortexillin I. Clusters containing both myosin II and cortexillin I are formed due to hetero-
cooperativity. The bound myosins and cortexillins are represented by yellow and red dots,
respectively. The unbound myosins and cortexillins are represented by grey and green dots,
respectively. The time delays between each frame increase logarithmically.
Supplemental Movie 3. Movie shows the accumulation of WT myosin II in response to applied
force.
Supplemental Movie 4. Movie shows the accumulation of 3xAla myosin II in response to
applied force.
Supplemental Movie 5. Movie shows a 3D view of WT myosin II accumulation in response to
applied stress. The movie has an 85 cutout so that the cell interior is visible.