Embed Size (px)
Citation preview

Understanding the Gender Gap in Financial Literacy: Evidence from
Australia
Professor Robert E. Wright Economic Consultant,
Glasgow, Scotland
Paper Presented to the Australian Conference of Economists Canberra, July 2108
Professor Alison Preston* Department of Economics
University of Western Australia
&
* Corresponding author: [email protected]

Motivation
• Financial literacy within Australia above OECD average … but, within the OECD, Australia has one of the largest gender gaps in financial literacy (Hasler and Lusardi, 2017).
• Such gaps are concerning given the evidence showing the importance of financial literacy (FL) for retirement planning, wealth accumulation, economic empowerment and even the stability of the financial system. • Low FL thought to have contributed to sub-prime mortgage crisis in US.• A UBS survey found that 1/3rd of Australian mortgage holders were not
aware that they had an interest only mortgage (Janda, 2017).• FL (or lack of) has also been linked to domestic violence (Postmus et al.
2013)
Hasler, A. and Lusardi, A. (2017), ‘The Gender Gap in Financial Literacy: A Global Perspective’, Global Financial Literacy Excellence Centre, George Washington Universit
Janda, M. (2017). ‘Interest-only home loans a ticking time-bomb, warns UBS’ 4 October 2017. ABC News. Available from: http://www.abc.net.au/news/2017-10-04/consumers-unaware-they-have-interest-only-home-loans/9014448
Postmus, J., Plummer, S., McMahon, S., and Zurlo, K. (2013), ‘Financial Literacy: Building Economic Empowerment with Survivors of Violence’, Journal of Family Economic Issues, 34, 275-284.

10
20
30
40
50
60
70
80
National FinLit FL - Women
Australia:
Women: 56%Persons: 64%
%
Source: data based on the S&P 2014 Fin.Lit. Survey as reported in Hasler and Lusardi (2017).
Basic Financial Literacy Rates, OECD, 2014

Outline of Presentation
1. What is financial literacy?
2. How is it measured?
3. Literature
4. Data and method
5. Estimates
6. Concluding comments

• The OECD define financial literacy as the “… knowledge andunderstanding of financial concepts and risks, and the skills,motivation and confidence to apply such knowledge andunderstanding in order to make effective decisions across a rangeof financial contexts, to improve the financial well-being ofindividuals and society, and to enable participation in economiclife.” (OECD, 2005, Principle I.1).
• Financial literacy is NOT numeracy. Numeracy is the ability to usemaths and arithmetic in a practical manner at a personal level …although clearly there is an overlap.
• Financial literacy is considered a form of human capital (a skill oneinvests in)
1. What is financial literacy?
OECD (2005), Recommendation on Principles and Good Practices for Financial Education and Awareness, OECD Publishing, July. Available from http://www.oecd.org/finance/financial-education/35108560.pdf

2. How is FL measured?
• Lusardi, Mitchell and others have developed a batteryof questions which are increasingly used to assessfinancial literacy knowledge.
(1) “Big-3”: set of three questions covering interestrate, inflation and diversification.(2) “Big-5”: Five question set [which contains (1)](3) Seventeen question set [which contains (2)]
• In Wave 16 of the Household, Income and LabourDynamics Australia (HILDA) the survey included, for thefirst time, a financial literacy module. The module contained a set of five basic financial
literacy questions.

HILDA Interest Rate Question
Q1: Suppose you put $100 into a no-fee savingsaccount with a guaranteed interest rate of 2% per year.You don’t make any further payments into this accountand you don’t withdraw any money. How much wouldbe in the account at the end of the first year, once theinterest payment is made?
Response options: record number; irrelevant answer; don’tknow or don’t understand the question; refused.
PERSONS(N=16886)
MALE(N=7973)
FEMALE(N=8913)
Gap(%-point)
% gap
85.2% 91.7% 79.4% 12.3*** 15.5%
% Adult Australians Answering Question Correctly
***t-test. Significant 1% level.

HILDA Inflation Question
Q2: Imagine now that the interest rate on your savingsaccount was 1% per year and inflation was 2% peryear. After one year, would you be able to buy morethan today, exactly the same as today, or less thantoday with the money in this account?
Response options: more than today; exactly the same astoday; less than today; don’t know / don’t understand thequestion; refused.
PERSONS(N=16886)
MALE(N=7973)
FEMALE(N=8913)
Gap(%-point)
% gap
70.9% 77.8% 64.8% 12.9*** 20.1%
% Adult Australians Answering Question Correctly
***t-test. Significant 1% level.

HILDA Diversification Question
Q3: Buying shares in a single company usuallyprovides a safer return than buying shares in a numberof different companies.
Response options: true; false; don’t know or don’tunderstand the question; refused.
PERSONS(N=16886)
MALE(N=7973)
FEMALE(N=8913)
Gap(%-point)
% gap
76.7% 79.3% 74.4% 4.9*** 6.6%
% Adult Australians Answering Question Correctly
***t-test. Significant 1% level.
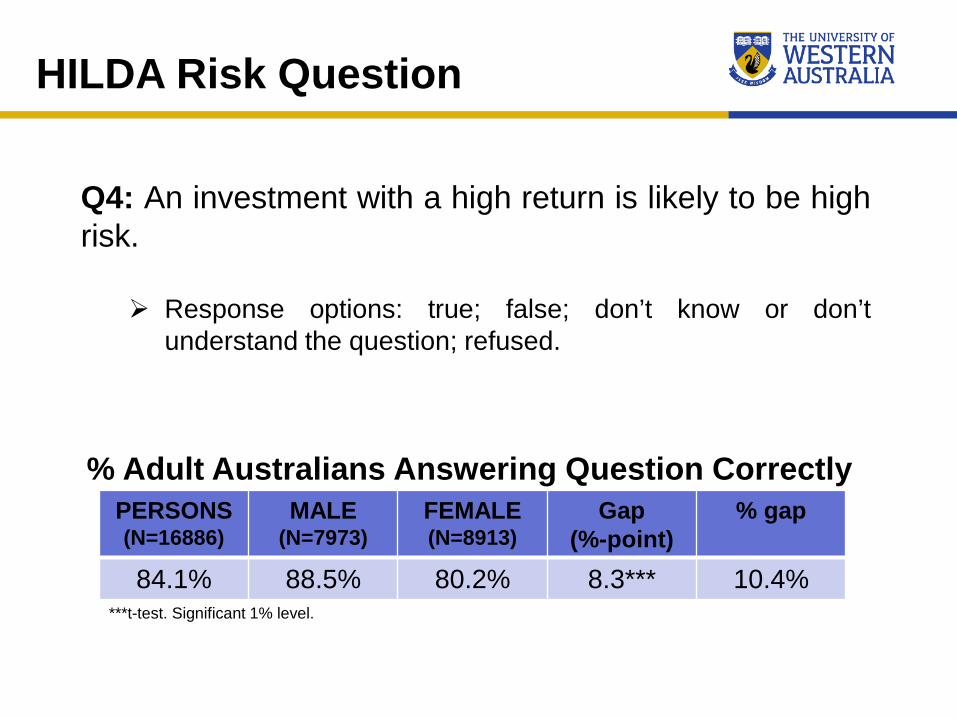
HILDA Risk Question
Q4: An investment with a high return is likely to be highrisk.
Response options: true; false; don’t know or don’tunderstand the question; refused.
PERSONS(N=16886)
MALE(N=7973)
FEMALE(N=8913)
Gap(%-point)
% gap
84.1% 88.5% 80.2% 8.3*** 10.4%
% Adult Australians Answering Question Correctly
***t-test. Significant 1% level.

HILDA Money Illusion Question
Q5: Suppose that by the year 2020 your income hasdoubled, but the prices of all of the things you buy havealso doubled. In 2020, will you be able to buy more thantoday, exactly the same as today, or less than todaywith your income?
Response options: more than today; exactly the same astoday; less than today; don’t know / don’t understand thequestion; refused.
PERSONS(N=16886)
MALE(N=7973)
FEMALE(N=8913)
Gap(%-point)
% gap
78.0% 79.7% 76.4% 3.3*** 4.3%
% Adult Australians Answering Question Correctly
***t-test. Significant 1% level.

The Adult Financial Literacy Gender Gap in Australia, 2016
PERSONS(N=16886)
MALE(N=7973)
FEMALE(N=8913)
Gap(%-point)
% gap
56.3% [0.004] 64.8% [0.005] 48.8% [0.005] 16.0*** 33.8%
FL Rate: % Answering ‘Big-3’ Correctly (Q1-Q3)
Standard errors in parenthesis; *** indicates significant at 1% level (t=21.196).
FL Rate: % Answering all 5 Correctly (Q1-Q5)
Standard errors in parenthesis; *** indicates significant at 1% level. (t=19.555).
PERSONS(N=16886)
MALE(N=7973)
FEMALE(N=8913)
Gap(%-point)
% gap
44.7% [0.004] 52.6% [0.006] 37.7% [0.005] 14.9*** 39.5%
FL Rate: Mean # of Correct Responses (0-5)PERSONS(N=16886)
MALE(N=7973)
FEMALE(N=8913)
Gap(%-point)
% gap
3.95 [0.010] 4.17 [0.013] 3.75 [0.014] 0.42*** 11.2%Standard errors in parenthesis; *** indicates significant at 1% level. (t=21.550).

Literature
• Typically FL is studied within a human capital framework; investment in FL analogous to investing in education. Unlike education, the incentive is not higher lifetime earnings but a desire to save for retirement (smooth consumption).
• Important determinants are: age, marital status, education and socialisation factors (eg. parent’s investment and saving habits).

Literature continued
• Even after controlling for gender differences in human capital women have lower FL rates. Some suggest that it reflects choice (eg. married women less likely
to be financial decision makers within households and thus less likely to invest in FL until approaching widowhood) (Hsu, 2016)
Endogeneity issues: eg. if public policy guarantees pension in retirement may have reduced incentive to invest in FL (Lusardi et al., 2017)
• Literature limited and faces challenge of:• Different dependent variables; different estimation approaches• Lack of representative data (eg. studies of university students)• Small sample sizes• Limited covariates
Hsu, J. (2016), ‘Aging and Strategic Learning: The Impact of Spousal Incentives on Financial Literacy’, Journal of Human Resources, 51, 1036-1067.Lusardi, A., Michaud, P. and Mitchell, O. (2017), ‘Optimal Financial Knowledge and Wealth Inequality’, Journal of Political Economy, 125, 431-477.

Data
• HILDA (Household, Income and Labour Dynamics Australia). Advantages are: Nationally representative Large sample size: Wave16 N=16,886 adults (aged 18+) Contains rich set of socioeconomic and labour market
variables Wave16 included five financial literacy measures
discussed above Panel (wave1 conducted in 2001) allowing construction
of measures which capture prior labour market activity

Method
• 1st estimated pooled wage equation with a dummy variable =1 if respondent is male
0ˆ ˆlog( ) ii iFL Xβ β ε= + + (1)
• Dependent variable: log of number of correct answers (0,1, 2, 3, 4 or 5) In log form the variable transformed as follows:
ln(count+1)
• Estimate using OLS. Advantage of OLS is easier interpretation and can
decompose using the Blinder-Oaxaca technique.

Method (continued)
Blinder-Oaxaca Decomposition• Estimate model separately for males and females and
decomposed using the Blinder-Oaxaca technique (basically subtract equation (3) from (2))
0ˆ ˆlog( ) mm mFL Xβ β ε= + +
0ˆ ˆlog( ) ff fFL Xβ β ε= + +
(2)
(3)
0 0ˆ ˆ ˆ ˆ ˆlog log ( ) ( ) ( )m f fm f m m f m fFL FL X X Xβ β β β β− = − + − + − (4)
Raw gender gap Gap due to means
Gap due to coefficients
Diff Constants
Unexplained componentExplained component

Method (continued)
• LHS = ln(count5+1) • RHS (Basic specification)
− Age (11 dummies in 5 year intervals)− Sibling status (whether has sibling and if younger or older)− Marital status (5 dummies)− Birthplace (2 dummies)− Presence dependent child (1 dummy)− Highest education attainment (6 dummies)− Field of highest post-high school qualification (14 dummies)− Geographic location (12 dummies
• RHS (extended specification): above plus− Labour market (emp ft, pt, unemp, tu mem etc: 7 dummies)− Sector (3 dummies)− Occupation (8 dummies); Industry (19 dummies)

Select Results [Y=ln(count5+1)]
Pooled Male FemaleBasic Extended Basic Extended Basic Extended
(i) (ii) (iii) (iv) (v) (vi)male 0.099*** 0.093***
[0.006] [0.006]
Oldest sib -0.015 -0.014 -0.038** -0.039*** 0.003 0.004[0.013] [0.012] [0.015] [0.015] [0.020] [0.019]
Younger sib -0.034*** -0.028** -0.047** -0.045*** -0.024 -0.018[0.013] [0.012] [0.015] [0.014] [0.019] [0.019]
Married 0.113*** 0.091*** 0.094*** 0.069*** 0.130*** 0.111***[0.009] [0.009] [0.012] [0.012] [0.013] [0.013]
Has dependent child
-0.041*** -0.031*** -0.019** -0.020** -0.054*** -0.037***[0.007] [0.007] [0.009] [0.009] [0.011] [0.012]
Born ESB 0.009 0.012 0.020** 0.023*** 0.000 0.001[0.008] [0.008] [0.009] [0.009] [0.013] [0.012]
Born NESB -0.179*** -0.148*** -0.123*** -0.100*** -0.226*** -0.189***[0.011] [0.011] [0.014] [0.014] [0.016] [0.016]
Degree 0.208*** 0.139*** 0.215*** 0.155*** 0.200*** 0.125***[0.011] [0.011] [0.014] [0.015] [0.016] [0.017]
Standard errors in parentheses; *** indicates significant at the 1% level.

Select Results: continued
Pooled Male FemaleBasic Extended Basic Extended Basic Extended
(i) (ii) (iii) (iv) (v) (vi)R2 0.153 0.196 0.127 0.175 0.152 0.195
% change in R2 moving from basic to extended model
28.10% 37.80% 28.30%
F-test 24.15*** 12.33*** 12.89****** indicates significant at the 1% level

Select Results: continued. FL & Age
Gender FL ratio:• At intercept = 78.8%• After 10 years = 82.6%
Note: derived from coefficients on age & age2 variables in an extended specificationIntercept based on the constant term from the separate male and female regressions
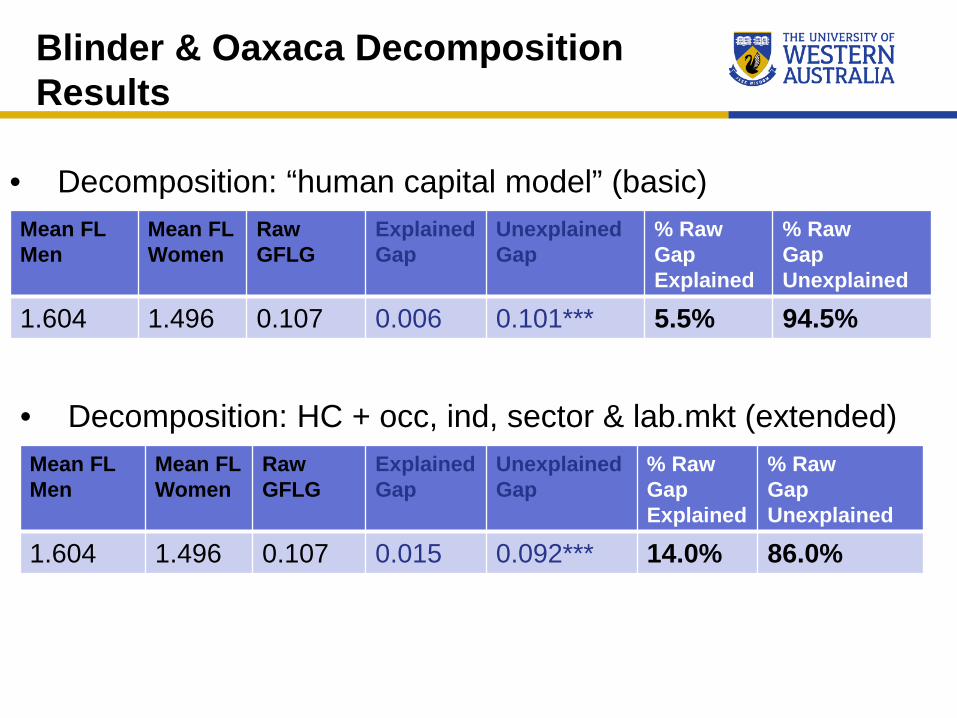
Blinder & Oaxaca Decomposition Results
• Decomposition: “human capital model” (basic)Mean FL Men
Mean FL Women
RawGFLG
Explained Gap
UnexplainedGap
% Raw GapExplained
% Raw GapUnexplained
1.604 1.496 0.107 0.006 0.101*** 5.5% 94.5%
• Decomposition: HC + occ, ind, sector & lab.mkt (extended)Mean FL Men
Mean FL Women
RawGFLG
Explained Gap
UnexplainedGap
% Raw GapExplained
% Raw GapUnexplained
1.604 1.496 0.107 0.015 0.092*** 14.0% 86.0%

Results using information on wrong answers, don’t know responses & refused responses as dep. var.
Dependent Variable Raw Gap Explained Share Unexplained
Shareln(count # wrong+1) -0.114*** 0.000 -0.114***
ln(count # don’t know +1) -0.155*** -0.003 -0.151***
ln(count # refused to answer +1)
0.011* 0.011 -0.000
Note: All dependent variables are based on a count of responses across all five HILDA FL questions; specification includes occupation and industry (i.e. extended); *, ** and *** indicate significance at 10%, 5% and 1% levels, respectively
Blinder-Oaxaca Decomposition using alternative dependent variables

Summary findings
• Basic FL in Australia is above the OECD average but there is a large gender gap
• Fewer than 50% of adults in Australia could correctly answer five basic FL questions in the 2016 HILDA survey.
• FL typically modelled within a human capital framework, however, human capital variables (eg. age, education, marital status) are only able to explain a small share (15%) of the variation in FL across individuals.
• Including labour market variables (employment status, union membership, sector, occupation and industry) increases the explanatory power of the model by btw 28-38%, but overall explanatory power still not particularly large at around 20%.

Summary findings (continued)
• When measuring financial literacy using a count measure (count of # of correct responses to a set of five questions) the:• Raw (unadjusted) gender financial literacy gap (GFLG) is 11%• The adjusted (after taking into account gender differences in
characteristics) GFLG is around 9%
• The Blinder-Oaxaca decomposition analysis shows that the GFLG is driven by gender differences in returns to characteristics (i.e. the coefficients) indicating that men and women produce (i.e. acquire) FL differently• Results not driven by gender differences in ‘refuse to answer’ rates
• Conclusion: GFLGs exist before entering the labour market … which suggests that FL affected by activities in schools and/or the home during the pre-labour market years.• Women have relatively steeper FL age profiles during early adult
years

Policy & future research
Policy• USA – more than 20 states have mandated financial
literacy as a requirement for graduation• Australia – since early 1990s dramatic fall in economic
Year12 high school enrolments, particularly amongst women maybe time to require course in economics for graduation &/or mandate FL requirement for high school graduation
• Future research:− Understand FL determinants amongst teenagers− Explore effects of socialisation (eg. parents)

Source: Dwyer, Jacqui (2018), What happened to the study of economics? Address to the Business Educators Australasia Annual Meeting. Research Bank of Australia, Speech. https://www.rba.gov.au/speeches/2018/sp-so-2018-05-26.html
Appendix: Economic Enrolments