Embed Size (px)
Citation preview
Understanding the Role of the Ottawa Ankle Rules in Physicians’ Radiography
Decisions: A Social Judgment Analysis Approach
Ania Syrowatka
Thesis submitted to the Faculty of Graduate and Postdoctoral Studies in partial
fulfillment of the requirements for the M.Sc. Degree in Epidemiology
Department of Epidemiology and Community Medicine
Faculty of Medicine
University of Ottawa
© Ania Syrowatka, Ottawa, Canada, 2012
ii
ABSTRACT
Clinical decision rules improve health care fidelity, benefit patients, physicians
and healthcare systems, without reducing patient safety or satisfaction, while promoting
cost-effective practice standards. It is critical to appropriately and consistently apply
clinical decision rules to realize these benefits. The objective of this thesis was to
understand how physicians use the Ottawa Ankle Rules to guide radiography decision-
making. The study employed a clinical judgment survey targeting members of the
Canadian Association of Emergency Physicians. Statistical analyses were informed by
the Brunswik Lens Model and Social Judgment Analysis. Physicians’ overall agreement
with the ankle rule was high, but can be improved. Physicians placed greatest value on
rule-based cues, while considering non-rule-based cues as moderately important. There
is room to improve physician agreement with the ankle rule and use of rule-based cues
through knowledge translation interventions. Further development of this Lens
Modeling technique could lend itself to a valuable cognitive behavioral intervention.
iii
ACKNOWLEDGMENTS
I would like to express my sincere gratitude to my primary supervisor, Dr. Jamie
Brehaut, for his mentorship, support and scientific guidance throughout this thesis
project. I would like to thank my co-supervisor, Dr. Tim Ramsay, for sharing his
statistical expertise to guide analyses of this thesis. I would like to thank Dr. Ian Stiell,
Dr. Christian Vaillancourt, and Dr. Jeffrey Perry for their contributions to the
development and implementation of the clinical judgment survey, and the larger project
from which this thesis was drawn. I would like to thank the members of the Canadian
Association of Emergency Physicians who completed the survey. I would like to thank
Dr. Robert Wigton and Dr. Thomas Tape for providing Social Judgment Analysis
expertise. I would like to thank all of my lab members from the Ottawa Hospital
Research Institute and classmates from the Department of Epidemiology and
Community Medicine for making this a very enjoyable experience. Lastly, I would like
to thank my parents for their support, understanding and patience as I completed my
Master’s degree.
iv
PREFACE
Dr. Brehaut developed a series of written hypothetical patient vignettes to elicit
clinical decisions from a sample of emergency department physicians; the survey was
already completed prior to beginning this thesis. The thesis involved statistical analysis
of survey data using Social Judgment Analysis to assess whether rule-based and/or non-
rule-based cues informed physician radiography decision-making. The study targeted
three hypotheses designed to understand the role of the Ottawa Ankle Rules in these
hypothetical decisions.
v
TABLE OF CONTENTS Abstract................................................................................................................................ ii Acknowledgements............................................................................................................ iii Preface................................................................................................................................ iv List of tables...................................................................................................................... vii List of figures................................................................................................................... viii Introduction
The strengths and weaknesses of evidence-based medicine........................................... 1 Health care fidelity: Are patients receiving optimal care?........................................... ...4 The role of knowledge translation for improving health care fidelity............................ 6 Clinical decision rules: Example of an actionable knowledge translation product........ 9 Case study: Ottawa Ankle Rules................................................................................... 11 Motivation for further research..................................................................................... 15 Social Judgment Analysis approach to evaluate medical decision-making.................. 16 Survey vignettes: A common method for conducting Social Judgment Analysis........ 23 Summary....................................................................................................................... 24
Research questions............................................................................................................. 25 Methods
Work previously completed; Survey design and administration Study participants................................................................................................... 27 Study administration.............................................................................................. 27 Survey design......................................................................................................... 28 Reliability check.....................................................................................................31 Interpreting decisions via Brunswik’s Lens Model............................................... 32 Response rates and mail-out process......................................................................33
Work completed for thesis; Statistical analysis Exploratory and non-responder analyses............................................................... 36 Research Question 1:
What is the rate of physician agreement with the ankle rule?.........................38 Research Question 2:
A) Do cues based on the ankle rule have a greater impact on physician judgment than non-rule-based cues? B) With regard to non-rule-based cues, do related cues have a greater impact on physician judgment than unrelated cues?....................................... 41
Research Question 3: Do judgment policies differ among identifiable subgroups of physicians (i.e. self-reported consistency in using the rule, and different levels of expertise)?
Value of self-reported use of the rule in radiography decision-making.... 44 Role of physician expertise in radiography decision-making.................... 44
vi
Results Exploratory and non-responder analyses...................................................................... 45 Early versus late responder analysis............................................................................. 48 Fit of the Lens Model.................................................................................................... 49 Three types of judgment policies.................................................................................. 51 Representativeness of the survey task........................................................................... 55 Research Question 1:
What is the rate of physician agreement with the ankle rule?................................57 Research Question 2:
A) Do cues based on the ankle rule have a greater impact on physician judgment than non-rule-based cues? B) With regard to non-rule-based cues, do related cues have a greater impact on physician judgment than unrelated cues?.......................................................... 61
Research Question 3: Do judgment policies differ among identifiable subgroups of physicians (i.e. self reported consistency in using the rule, and different levels of expertise)?
Value of self-reported use of the rule in radiography decision-making..... 64 Role of physician expertise in radiography decision-making.................... 67
Discussion
Basic agreement with the ankle rule............................................................................. 71 Fit of the Lens Model.................................................................................................... 74 Social Judgment Analysis............................................................................................. 74 Factors influencing physician agreement...................................................................... 77 Value of self-reported use of the rule in radiography decision-making........................ 78 Role of physician expertise in radiography decision-making....................................... 80 Generalizability of research findings............................................................................ 80 Limitations.................................................................................................................... 82 Significance and future directions................................................................................. 86 Conclusion………………………................................................................................. 91
References.......................................................................................................................... 92 Appendix A: Physician judgment survey.......................................................................... 97
vii
LIST OF TABLES 1 Factors systematically varied in survey vignettes.............................................. 30 2 Demographic and professional information for responders and non-responders................................................................................................... 45 3 Ottawa Ankle Rules practice information for responders.................................. 47 4 Demographic and practice characteristics of early and late responders............ 49 5 Fit of the Lens Model......................................................................................... 50 6 Responder representativeness ratings and comments about the survey task..... 56 7 Mean agreements with the ankle rule overall and by vignette type................... 57 8 Mean agreements with the ankle rule by cue distribution................................. 58 9 Mean agreements with the ankle rule for key univariate comparisons.............. 59 10 Mean relative weights for all cues with bootstrapped 95% confidence intervals........................................................................................... 61 11 Mean relative weights for all cues with bootstrapped 95% confidence intervals
based on role of the Ottawa Ankle Rules in radiography decision-making....... 64 12 Summary of mean relative weights by cue type with bootstrapped 95%
confidence intervals based on role of the Ottawa Ankle Rules in radiography decision-making................................................................................................. 65
13 Mean relative weights for all cues with bootstrapped 95% confidence intervals
based on time of graduation from medical school in years................................ 68 14 Summary of mean relative weights by cue type with bootstrapped 95%
confidence intervals based on time of graduation from medical school in years................................................................................................................... 69
viii
LIST OF FIGURES 1 Graham’s Knowledge-to-Action framework......................................................7 2 Ottawa Ankle Rules......................................................................................... 12 3 Brunswik’s Lens Model................................................................................... 19 4 Mail-out survey response rate.......................................................................... 34 5 Three examples of real physician judgment policies....................................... 52 6 Mean relative weights for all cues with bootstrapped 95% confidence intervals......................................................................................... 62 7 Cumulative relative weights for combined groups with bootstrapped 95%
confidence intervals; (A) rule-based compared to non-rule-based cues, and (B) rule-based compared to related and unrelated cues................................... 62
8 Mean relative weights for all cues with bootstrapped 95% confidence intervals based on role of the Ottawa Ankle Rules in radiography decision-
making..............................................................................................................65 9 Summary of mean relative weights by cue type with bootstrapped 95%
confidence intervals based on role of the Ottawa Ankle Rules in radiography decision-making........................................................................... 66
10 Mean relative weights for all cues with bootstrapped 95% confidence intervals based on time of graduation from medical school in years............... 68 11 Summary of mean relative weights by cue type with bootstrapped 95%
confidence intervals based on time of graduation from medical school in years................................................................................................................. 69
1
INTRODUCTION
The strengths and weaknesses of evidence-based medicine
Evidence-based medicine is a cornerstone of modern medicine. David Sackett, a
pioneer in this area, has defined evidence-based medicine as “the conscientious,
explicit, and judicious use of current best evidence in making decisions about the care
of individual patients”.1 Evidence-based medicine involves asking the right clinical
questions and appraising relevant evidence to apply the acquired knowledge to patient
care.2 In the practice of evidence-based medicine, the term ‘evidence’ refers to
clinically relevant scientific literature, which includes research ranging from the basic
medical sciences to qualitative studies to patient-centered clinical trials.1;3 Current best
evidence plays an integral role in the practice of medicine; without integration of new
evidence, the medical practice can quickly become out-of-date, and fail to provide
optimal patient care.4
Scientific evidence on its own is not sufficiently comprehensive to be the sole
source of information guiding medical practice, and some experts consider evidence-
informed medicine to be a more appropriate concept.5 Evidence is not meant as the
basis for all clinical decisions as the evidence-based medicine name might suggest, but
serves to inform and supplement (rather than to substitute for) clinical expertise.6
Clinical expertise is experience in medical decision-making and diagnosis that a
physician acquires over time through clinical practice.1 Clinical expertise is a necessary
component of evidence-based medicine; evidence must be assessed to determine
whether it is applicable and appropriate for specific patient cases. A valuable part of

2
expertise is acknowledging the limitations of evidence-based medicine; there are
shortages of adequate scientific literature in many areas, and in such cases physicians
must rely on clinical expertise to interpret and apply limited or inconsistent knowledge,
or make decisions where no evidence exists.7 Thus, appropriate practice of evidence-
based medicine involves integration of the best available evidence with physicians’
clinical expertise.6
The benefits of evidence-based medicine span all levels of healthcare.2
Individual physicians rely on evidence-based medicine to update personal medical
knowledge and as a result improve their confidence in medical decision-making and
ensure that their patients get the best possible care. Healthcare systems benefit from
evidence-based medicine because it helps to provide consistent, standardized care for all
patients, while guiding better use of medical resources. Patients receive improved
quality of care and evidence-based medicine helps to facilitate patient-physician
communications about screening and treatment decisions.
Although evidence-based medicine has clear advantages, maintaining a current
evidence base for all aspects of care is difficult, regardless of medical discipline. This
thesis focused on emergency medicine, as its characteristics make it especially
susceptible to overwhelming scientific literature; emergency medicine is a first-contact,
comprehensive practice, which requires physicians to know about many aspects of
care.8 Over the past 20 years, there have been significant increases in the volume and
diversity of scientific literature aimed to inform emergency medicine practice.6 Sklar et
al (2010) report that less than two decades ago, the number of National Institutes of

3
Health-funded emergency medicine investigators was minimal,9 but the funding
allocated to emergency medicine research had more than tripled by 2007. Increased
interest in emergency medicine research activities by physicians and healthcare
organizations indicates that this rise is likely to continue into the future.
Even physicians who are able to make time for assessing relevant scientific
literature face another barrier; they may lack the training and skills necessary to
evaluate the quality of evidence being presented. Generally, physicians do not have
appropriate training in evidence-based medicine to find, assess, interpret and apply
scientific evidence to practice.6 The practice of evidence-based medicine requires a
large time commitment from the physician to learn and to effectively apply knowledge
in clinical practice.2 As a result, it is becoming increasingly difficult, and may be
impossible, for physicians to keep abreast of current best evidence without external
help.
Many tools have been introduced in order to work around physician time
constraints and critical appraisal barriers associated with evidence-based medicine.
Evidence-based services have been created to make accessing current best evidence
feasible and easy in clinical settings.6 For example, physicians can now rely on
electronic databases (e.g. through PubMed10), systematic reviews (e.g. The Cochrane
Collaboration11), or journals that conduct quality reviews and summarize high-quality
evidence (e.g. Evidence-Based Medicine by the British Medical Journal12), thereby
providing multiple levels at which a physician can access the same evidence to use in
clinical practice. In addition, physicians have access to many tools (examples listed at
4
the KT Clearinghouse13), such as websites summarizing evidence (e.g. BestBETs14 and
Centre for Evidence Based Medicine15) clinical guidelines (e.g. National Guideline
Clearinghouse16), applications for handheld devices,17 and continuing medical education
courses18 to support integration of evidence-based medicine into practice. Physicians
should be encouraged to learn about and make better use of such resources to stay up-
to-date with scientific evidence.
Health care fidelity: Are patients receiving optimal care?
The fidelity of health care is a concept that describes how well evidence-based
medicine is integrated into medical practice. This includes, but is not limited to, proper
delivery of necessary care, timely delivery of necessary care, and exclusion of
unnecessary care.19 Scientific literature has established a large and consistent gap
between current best evidence and delivery of care.20 Research has shown that a large
number of patients, approximately 45%, are not receiving appropriate care as
recommended by current best evidence.21 For example, it is recommended that all adults
over the age of 65 receive the annual influenza vaccine,22 as people aged 65+ are at
higher risk of serious complications (including death) resulting from an influenza
infection.23 However, over 30% of this susceptible population did not receive the
potentially life-saving vaccine in 2009.22
Receiving appropriate care involves timely delivery of care. Lowering health
care wait times for diagnostic testing and medical treatments in Canada has been a
priority for years.24 Despite efforts to reduce patient wait times in target areas such as
cancer,24 many wait times are still much higher than desired.25 A recent study found that
5
approximately 28% of a Canadian sample of pediatric patients did not receive necessary
cancer surgery within the maximum acceptable waiting time for their specific
conditions.25
Fidelity of health care also encompasses the exclusion of unnecessary care.19
Research has shown that approximately 20-25% of patients receive unnecessary care,
including potentially harmful care.26 For example, a set of guidelines exist to help
physicians determine which patients with blunt ankle or foot trauma should be sent for
x-rays; they are called the Ottawa Ankle Rules.27 These guidelines aim to standardize
efficient use of radiography for ankle injuries by excluding patients who are at low risk
of fracture and thereby reducing unnecessary x-rays. Prior to the development and
implementation of these rules, it was estimated that only 15% of ankle radiographies
performed were positive for fracture.28 These guidelines have the potential to
significantly reduce radiography use.29 However, it is clear that this evidence is not
being applied to its full potential, as studies have shown that the rules are not being
applied as intended in clinical practice.30
It is valuable to maximize the uptake of evidence-based medicine into medical
practice to provide patients with the best possible care. Providing services that are not
up-to-date or not evidence-based introduces unnecessary risks to patient health and
safety. Successful implementation of evidence-based medicine research is critical to
improve health care fidelity; if fidelity is low, there is greater potential for improvement
that can be achieved through a process known as knowledge translation.
6
The role of knowledge translation for improving health care fidelity
Knowledge translation aims to improve the fidelity of health care through “the
exchange, synthesis, and ethically-sound application of knowledge - within a complex
set of interactions among researchers and users - to accelerate the capture of the benefits
of research for Canadians through improved health, more effective services and
products, and a strengthened health care system”.31 In a clinical context, knowledge
translation involves identifying clinical areas where health care fidelity is low, and
subsequently determining viable methods to facilitate adoption of new or updated
medical knowledge into clinical practice. Knowledge translation is an important active
dissemination strategy, as research has shown that passive diffusion of evidence (such
as scientific presentations and publications) was not very effective in promoting
behavioural changes in physician clinical care.32 Active dissemination and
implementation activities that target barriers and maximize facilitators have proven to
be much more effective at driving clinical behaviour change.33
Graham’s Knowledge-to-Action framework is one influential model of how
actionable knowledge is generated and how such knowledge can be effectively
implemented into clinical practice. The framework was developed by Graham et al
(2006) guided by the work of Haynes (2001)34 and a review of more than sixty relevant
planned-action theories and frameworks.4 Planned-action theories provide conceptual
frameworks that aim to describe how behaviour change occurs, while taking into
consideration potential barriers and facilitators to such behaviours.35
7
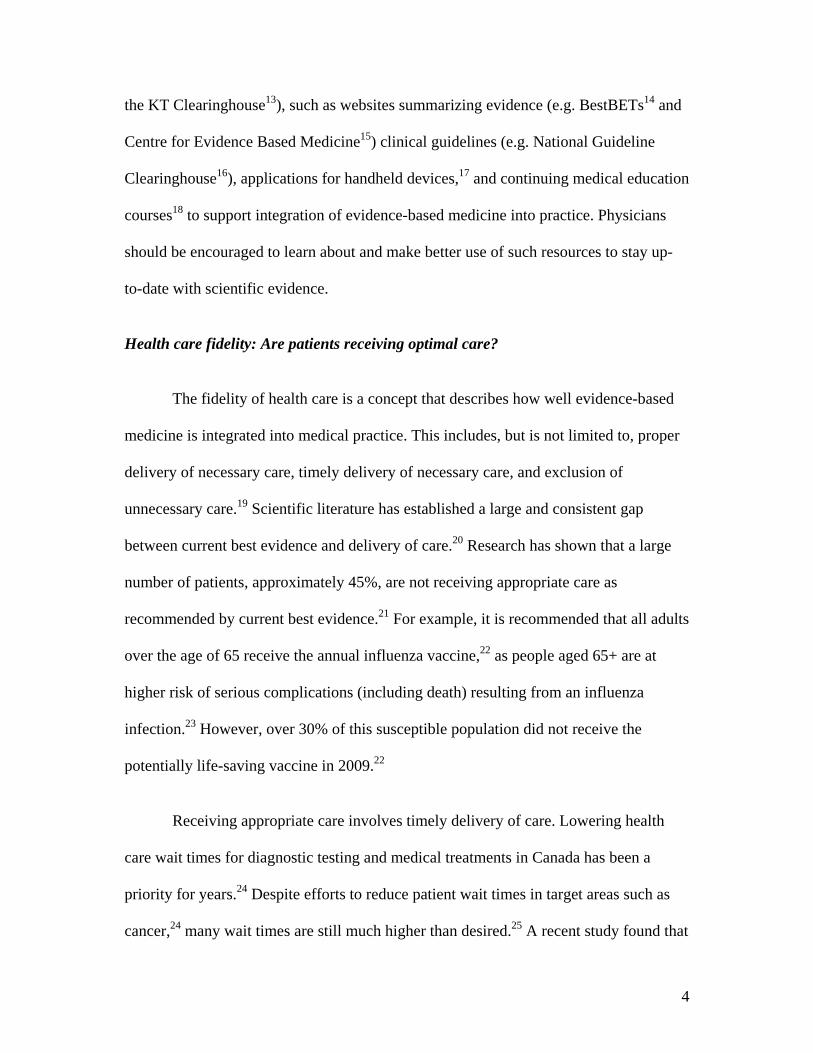
Figure 1. Graham’s Knowledge-to-Action framework4
The Knowledge-to-Action framework has two components: a process of
knowledge creation, and a process of knowledge implementation (Figure 1).4 In the
knowledge creation phase, evidence-based research can be thought of as ‘distilled’,
where information from many individual scientific studies (at the top of the triangle) is
distilled through a variety of methods (e.g. systematic reviews) to produce concise,
actionable messages for healthcare professionals. Essentially, the creation phase
progresses from inquiry (i.e. “asking the right questions”), through to knowledge
synthesis (i.e. “pulling together research and information from other sources”), and
finally to products (i.e. “delivering the right information in the right format”).
8
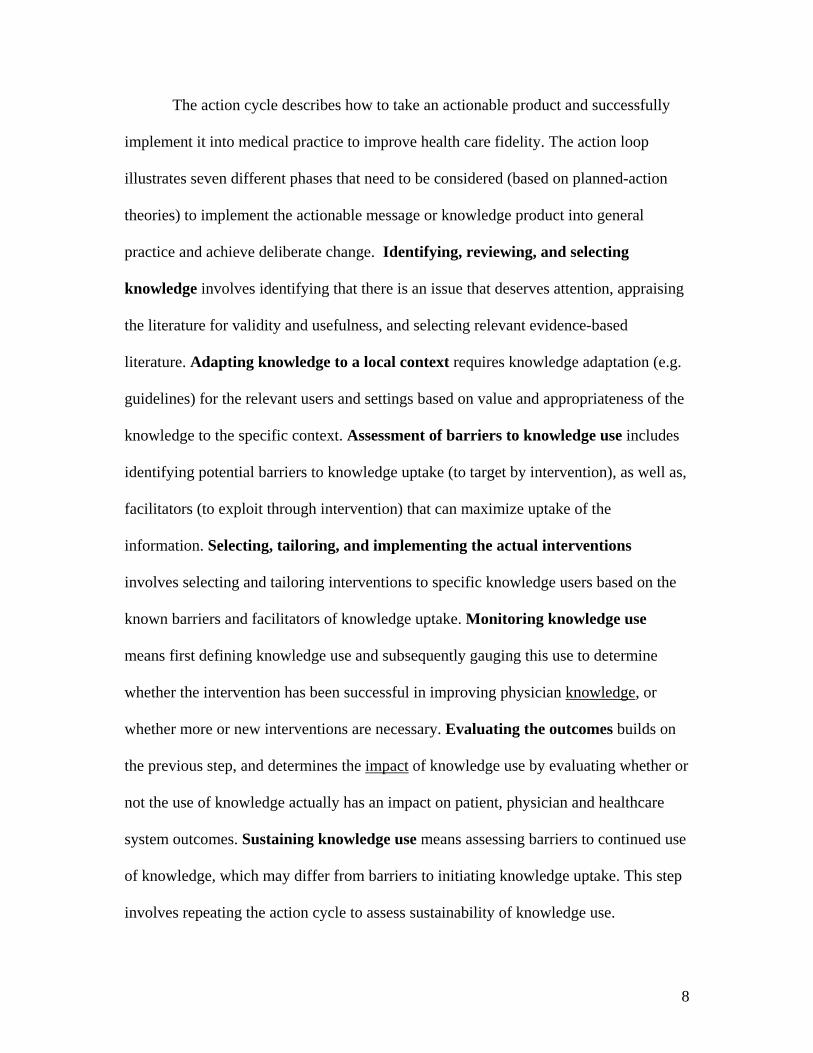
The action cycle describes how to take an actionable product and successfully
implement it into medical practice to improve health care fidelity. The action loop
illustrates seven different phases that need to be considered (based on planned-action
theories) to implement the actionable message or knowledge product into general
practice and achieve deliberate change. Identifying, reviewing, and selecting
knowledge involves identifying that there is an issue that deserves attention, appraising
the literature for validity and usefulness, and selecting relevant evidence-based
literature. Adapting knowledge to a local context requires knowledge adaptation (e.g.
guidelines) for the relevant users and settings based on value and appropriateness of the
knowledge to the specific context. Assessment of barriers to knowledge use includes
identifying potential barriers to knowledge uptake (to target by intervention), as well as,
facilitators (to exploit through intervention) that can maximize uptake of the
information. Selecting, tailoring, and implementing the actual interventions
involves selecting and tailoring interventions to specific knowledge users based on the
known barriers and facilitators of knowledge uptake. Monitoring knowledge use
means first defining knowledge use and subsequently gauging this use to determine
whether the intervention has been successful in improving physician knowledge, or
whether more or new interventions are necessary. Evaluating the outcomes builds on
the previous step, and determines the impact of knowledge use by evaluating whether or
not the use of knowledge actually has an impact on patient, physician and healthcare
system outcomes. Sustaining knowledge use means assessing barriers to continued use
of knowledge, which may differ from barriers to initiating knowledge uptake. This step
involves repeating the action cycle to assess sustainability of knowledge use.

9
Clinical decision rules: Example of an actionable knowledge translation product
Clinical decision rules are an example of a knowledge translation product at the
bottom of the Knowledge-to-Action triangle; i.e. an actionable message intended to be
useful to healthcare professionals to improve clinical practice. Clinical decision rules
are decision-making tools (commonly applied in the emergency department) that are
derived from original research and quantify contributions of variables (called cues)
from patient history, physical examination, or simple tests to help healthcare
professionals make specific diagnostic or therapeutic decisions.36-38
Clinical decision rules are a good example of a knowledge translation
intervention that can benefit from the components outlined in the Knowledge-to-Action
cycle. Active methods for the dissemination and implementation of these types of
knowledge products are essential to improve health care fidelity.
Clinical decision rules can improve all three aspects of health care fidelity, by
improving not only proper and timely delivery of necessary care, but also exclusion of
unnecessary care.19 Clinical decision rules are a way of implementing evidence-based
medicine and as a result encompass similar (but more specific) benefits compared to
evidence-based medicine at the physician, patient, and healthcare system levels.
Clinical decision rules strengthen clinical practice for physicians by reducing clinical
uncertainty, facilitating translation of evidence-based medicine into practice, and
improving patient flow.39 For patients, clinical decision rules can improve quality and
consistency of care and decrease exposure to unnecessary, even potentially harmful
clinical procedures.36 For healthcare systems, clinical decision rules can reduce costs by
10
limiting unnecessary use of resources.40 These principles improve health care fidelity,
benefit patients, physicians and healthcare systems, without reducing patient safety or
satisfaction, while promoting cost-effective practice standards.41
Despite these end-point benefits, the knowledge creation phase of the
Knowledge to-Action framework for clinical decision rules is costly and requires a large
time commitment. Stiell & Wells (1999)36 suggest six major stages for the development
and testing of a new clinical decision rule. First, one should determine need, which
involves identifying the problem and making a case for potential benefit from clinical
decision rule creation. Second, a rule must be derived; this step involves employing
rigorous methodological standards to create the decision rule. For example, the rule
should be derived using appropriate definitions of predictors/ outcomes, sufficient
sample sizes, and multivariate statistical approaches (e.g. logistic regression or
recursive partitioning). Third, the rule should be prospectively validated and refined;
this step involves testing the clinical decision rule using a new patient population for
several factors, such as reproducibility, sensitivity, and acceptance by physicians.
Fourth, the rule needs to be implemented, which involves determining whether or not
clinical decision rule use has the ability to change physician behavior. Implementing
entails providing physicians with the necessary knowledge to change behaviors and
gauging whether or not it influences clinical practice. Fifth, a cost-effectiveness analysis
should be conducted to demonstrate potential healthcare spending reductions as a result
of implementing the clinical decision rule into general practice. Sixth, dissemination
and implementation strategies must be developed; this step involves creating easily
accessible and useable forms of the knowledge (e.g. Continuing Medical Education
11
seminars, pocket cards, posters, etc) in order to best reach the target audience (in this
case, physicians).
Given that each of the steps outlined above requires time and resources to
complete, it is only practical to develop clinical decision rules in cases where the
investment will yield substantial healthcare benefits, whether in terms of cost efficiency
or improved practice, or, ideally, both. For this reason, methodological standards
suggest that clinical decision rules are valuable in cases where there is an established
inefficiency or variation in physician practice, and potential for improvement exists.36
Case study: Ottawa Ankle Rules
Blunt ankle trauma is one of the most common injuries seen in the emergency
department27 and accounts for 3-12% of all emergency patient visits.42 Prior to the
development and implementation of clinical decision rules to guide radiography,
approximately 95% of patients who presented at the emergency department with an
acute ankle injury were referred for at least one radiographic series.28 Literature has
shown that less than 15% of these patient cases had clinically significant fractures
(defined as any bone fragment > 3mm in breadth, because such injuries require plaster
immobilization to heal43), which indicates that more than 85% of ankle radiographies
were negative and a large proportion of these resulted in wasted healthcare
resources.27;44
The Ottawa Ankle Rules were designed to reduce radiography in patient
management of blunt ankle trauma without affecting the quality of care.45 Designed to
12
the methodological standards discussed previously, use of the Ottawa Ankle Rules have
been shown to significantly decrease ankle radiography, patient wait times, and
healthcare costs, with no reductions in self-reported patient satisfaction and no more
repeat visits or missed fractures than in previous practice.27-29;43;45 The Ottawa Ankle
Rules are widely accepted clinical decision rules.46 Approximately 90% of National
samples of Canadian emergency physicians self-reported frequently using the Ottawa
Ankle Rules in everyday practice.30;46
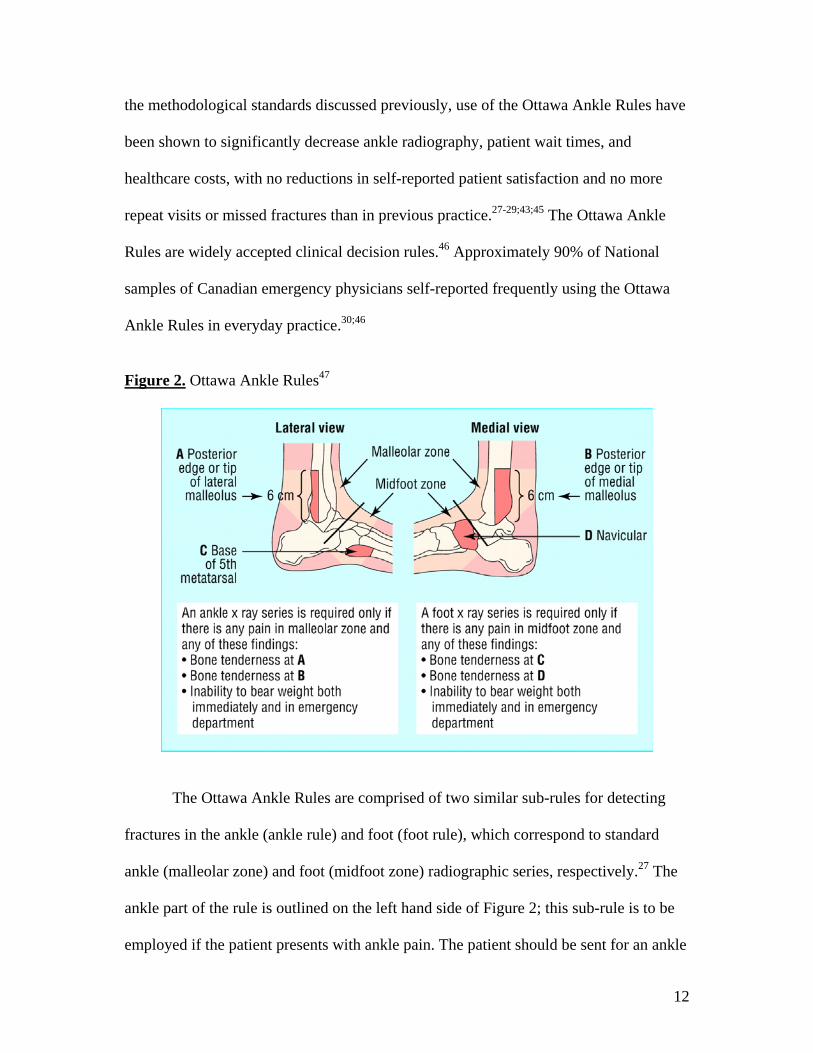
Figure 2. Ottawa Ankle Rules47
The Ottawa Ankle Rules are comprised of two similar sub-rules for detecting
fractures in the ankle (ankle rule) and foot (foot rule), which correspond to standard
ankle (malleolar zone) and foot (midfoot zone) radiographic series, respectively.27 The
ankle part of the rule is outlined on the left hand side of Figure 2; this sub-rule is to be
employed if the patient presents with ankle pain. The patient should be sent for an ankle
13
radiographic series if there is any pain in the malleolar zone AND any of the following
three findings: (1) bone tenderness at the posterior edge or tip of the lateral malleolus,
(2) bone tenderness at the posterior edge or tip of the medial malleolus, and/or (3)
inability to bear weight both immediately and in the emergency department. Inability to
bear weight is defined as the inability to take four steps without assistance (i.e. two
steps on each foot).27 This thesis focused on the ankle rule of the Ottawa Ankle Rules.
The foot part of the rule is quite similar and is outlined on the right hand side of Figure
2. The Ottawa Ankle Rules should not be applied if patient assessment is unreliable, for
example, if the patient: (1) is under the age of 18, (2) is intoxicated or uncooperative,
(3) has other distracting painful injuries, (4) has diminished sensation in the legs, or (5)
has gross swelling which prevents palpation of malleolar bone tenderness.27
In order to achieve the demonstrated sensitivity and specificity of these rules,
they need to be applied as intended by the developers.45 Evidence suggests that there is
a lot of variability in how the Ottawa Ankle Rules are applied.30 One element possibly
contributing to variability is physicians’ tendencies to apply the rules inappropriately,
which includes combining rule cues inappropriately, or considering the rules along with
other external factors.30 In order to evaluate physician variability in cue use, this thesis
employed a hypothetical decision task where physician decisions were made based on
different combinations of cues.
For the purposes of this study, three different cue types that physicians may
consider when making ankle radiography decisions were identified based on cues
examined for the development of the Ottawa Ankle Rules.29 Rule-based cues have been
14
shown to be correlated with the presence of a fracture and aggregated to create the ankle
rule (i.e. bear weight, bone tenderness) through evidence-based research.27-29;43;45 Non-
rule-based cues can be separated into two different categories; related cues and
unrelated cues. Related cues are those shown to be correlated with the presence of
fracture, but were not included in the ankle rule because they do not contribute any
additional information above and beyond rule-based cues.29 An example of a related cue
is age, which was found to be significantly related to presence of fracture, but did not
add predictive value over and above the rule-based cues.29;30 Unrelated cues are not
correlated with the presence of fracture, however, have been mistakenly perceived to
provide diagnostic value by some physicians. An example of an unrelated cue is
previous fracture within 12 months, which was not found to be associated with fracture
in univariate analyses.29;30
A survey-based study conducted by Brehaut et al (2005)30 found that
approximately 90% of physicians reported using the Ottawa Ankle Rules either always
or most of the time in appropriate circumstances. When asked to identify how they
apply components of the rules, most (84%) reported basing their decisions primarily on
Ottawa Ankle Rules (i.e. rule-based cues), or primarily on rule-based cues while
considering a few other key factors. Such self-reports gave the impression that
physicians were appropriately applying the Ottawa Ankle Rules in practice.
Subsequent questions, however, revealed a different story. The study found that
non-rule-based cues were considered by physicians when making radiography
decisions; for example, age (a related cue) and previous fracture within 12 months (an
15
unrelated cue) were considered by 55% and 41% of physicians, respectively.
Furthermore, only 33% of the physicians were able to correctly identify all rule-based
cues and exclude all non-rule based cues from a list. It appears that the majority of
physicians who self-reported basing their decisions primarily on Ottawa Ankle Rules
may not have even had the knowledge to apply the rules as intended.
In essence, this study demonstrated a potential disconnect between physician
self-reports, and their actual practice. While most physicians reported using the rules,
the study showed that ‘using’ the rules might mean a range of different things, including
not consulting the rules, or using them inaccurately or unreliably30 This study suggested
that the rules may not be applied as intended in real medical practice, despite the fact
that most physicians believe that they are using the rules appropriately.30
Motivation for further research
The objective of this thesis was to understand the role of different cues (i.e. rule-
based, related and unrelated) in ankle radiography decision-making, and the variability
with which these cues contribute to radiography decision-making. In order to
understand this variability, we looked at how individual physicians use specific
components of the ankle sub-rule to make radiography decisions using Social Judgment
Analysis. This physician-specific type of analysis provided a better understanding of
how individual physicians make decisions, as opposed to how they report making
decisions, and helped to describe how the ankle rule fits into individual and group level
decision-making processes.
16
A secondary objective of this thesis was to determine whether specific factors
(such as self-reported consistency in using the rule, and different levels of expertise)
contributed to variability in rule use between physicians. The thesis sought to
understand the relationship between physicians’ self-reported use of the rule and actual
clinical application. Given that clinical expertise (acquired over time through clinical
practice) is an integral part of evidence-based medicine,1 the thesis investigated whether
years of clinical experience played a significant role in physician ankle radiography
decision-making. Our findings could be used to inform future interventions to promote
appropriate use of the ankle rule.
Social Judgment Analysis approach to evaluate medical decision-making
Social Judgment Analysis is a theoretical approach to conceptualizing
judgments, which originates from the work of Austrian psychologist Egon Brunswik.48
Brunswik opposed the popular trends and methodologies of experimental psychological
research during the time of his career, which were focused on looking at how one
independent variable affects one dependent variable, while keeping everything else
constant. Brunswik’s chief concern was the lack of generalizability of research to other
contexts. Brunswik proposed a contrary viewpoint, which he named Probabilistic
Functionalism.48 His approach was designed to show that variables are ambiguous, can
stand in for each other, and that judges use cues in different ways to extract similar
information from complex environments. Brunswik argued that if you keep everything
else constant, you are not studying how judgments are made in real life.

17
Brunswik rationalized his views using an analogy of visual perception.48 He
recognized that objects in the environment can be interpreted by relying on visual cues;
however, these cues were often ambiguous. For example, an object that presents a small
image on the retina can be small in size, or large in size and far away. Objects must
therefore be interpreted using other pieces of information, or ‘cues’, to distinguish
between the above two cases. Each of these cues may provide incomplete information,
so it is important to consider all relevant cues at once (rather than one at a time) to get a
better understanding of the true environment.
Kenneth Hammond and colleagues49 expanded the work on Social Judgment
Analysis into the realm of healthcare, specifically into medical decision-making.
Hammond argued that clinical judgments were dependent on the physician perceiving
and interpreting multiple ambiguous cues (e.g. patient history, symptoms, test scores,
etc) to make diagnostic or treatment decisions. For example, Hammond provided the
analogy of how patient behaviors, expressions and test scores all provide ambiguous
cues to the patient’s medical diagnosis.49
Brunswik’s Lens Model provides a better understanding of medical decision-
making by encompassing three core concepts: representative design, idiographic-
statistical methodology, and vicarious functioning.50
a) Representative design
Representative design aims to encompass the true environment for the judgment
being studied; this involves identifying all relevant cues. This framework was
18
developed to allow for cue values to be varied, creating many different combinations of
cues for a judge to interpret. In effect, the combination of cues is sampled from a
population, similar to how subjects would be sampled from a population. The extent to
which the study design reflects real-world decisions is an important component of Lens
Model studies (i.e. ideally, the proportion of certain cases in the task should mimic the
proportion of cases in the real world).
b) Idiographic-statistical methodology
Idiographical-statistical methodology strives to represent one judge in the
context of many diverse environments, as compared to standard scientific practice
where many individuals are studied in one specific environment. The latter is called the
nomothetic approach. The idiographic-statistical methodology of the Lens Model
focuses on interpersonal differences in judgments as a measure of interest, as compared
to the nomothetic approach, which treats judgment differences between individuals as
random errors. The practical implication of this framework is that each subject is
analyzed separately, rather than only determining an average of the group.
c) Vicarious functioning
Vicarious functioning describes the characteristic of redundancy within a typical
judgment environment. Each cue has a certain correlation to the environment, which
contributes to the predictability of the environment. This environmental predictability is
not calculated simply as a sum of the individual correlations of all cues; in reality,
overlaps occur between individual cues, meaning that different cues can provide much

19
of the same information. Therefore, different judges may use different cues to elicit the
same information, and make the same judgment, based on the environment. In addition,
in cases where a perfectly predictive cue is not available, a judge can rely on a different
cue, which has less predictive value but offers similar environmental information to
guide judgment.48 Vicarious functioning is very useful in uncertain environments, as it
implies that the judge can arrive at the same correct decision in various ways.
Figure 3. Brunswik’s Lens Model48
Figure 3 outlines the Social Judgment Analysis model, referred to as the Lens
Model, because the judgment is made through a lens of fallible indicators, which
divides the framework into two parts by a central column of cues.48 The idiographical-
statistical methodology is inherent in the framework, as the model is meant to be
applied to determine individual judgment policies. This framework models judgments
20
as a series of bivariate relationships between the environment and cues, as well as, the
cues and judgments. In terms of the ankle rule, the central column represents the
available clinical cues that a physician may consider when making the decision of
whether or not a patient requires ankle radiography. All cues included in the model
were identified from the Ottawa Ankle Rules derivation study as potentially having an
effect on physician behavior.29;30 These cues are correlated with both the environment
(i.e. presence of fracture, denoted by Ye; value of yes or no) and the physicians’
judgments (i.e. estimated likelihood of fracture, denoted by Ys; value between 1 and
100%), and create the ‘lens’ that gives the model its name. The cues provide the basis
for the representative design of this framework, because they can be varied to create
multiple combinations of cues to assess how the judge responds in diverse
environments. For example in the ankle rule, the age cue can be varied to determine the
impact of patient age on physician judgments to x-ray.
The environment (i.e. the true state of the world, or the actual presence or
absence of fracture) is depicted on the left-hand side of the model. The environment
encompasses the environmental weights (i.e. re1re5; values between 0 and 1) and the
objective value representing the true state of being (i.e. whether there is truly a fracture
or not, denoted by Ye; value of yes or no). The environmental predictability (Re; value
between 0 and 1) is the strength of association between the environment and all
available cues. This association is a summary of all correlations between the
environment and each individual cue. The environmental predictability is rarely
perfectly correlated with the environment, as there may be cues that cannot be measured
and/or errors that cannot be avoided that will ensure that the predictability is not perfect.
21
In the case of the ankle rule, the environmental predictability is based on the overall
correlations between presence of fracture and available cues. For example, the two
ankle rule rule-based cues (i.e. bone tenderness and inability to bear weight) are highly
correlated with the presence of a fracture; however, do not perfectly predict the
presence of a fracture.
The correlations between the environment and the eight cues (i.e. re1re5; values
between 0 and 1) account for part of the vicarious functioning that occurs in the model.
In the framework, overlaps can occur between individual cues, meaning that different
cues can provide much of the same predictability information. For example, age is a
related cue that has been shown to be correlated with the presence of a fracture, but was
not included in the ankle rule because it does not contribute any additional information
above and beyond the rule-based cues.29
The cognitive process is represented by the right-hand side of the model and
outlines the relationship between the eight available cues and the physician judgment
(i.e. estimated likelihood of radiography). The judgment estimate (Ys; value between 0
and 100%) is the physician’s assessment of whether or not the patient requires ankle
radiography based on the eight available cues. The consistency (Rs; value between 0
and 1) is the strength of association between the judgment and all available cues. This
association is a summary of all correlations between the judgment and each individual
cue.
The correlations between the cues and the physician judgments (i.e. rs1rs5;
values between 0 and 1) account for part of the vicarious functioning that occurs in the
22
model. Essentially, the physicians make decisions and statistical methods are used to
calculate the weight of each cue in the decision-making process to form a ‘judgment
policy’. A judgment policy is a model of the physician’s behavior when interpreting the
environment to make a judgment. Individual differences always exist in the attribution
of weights for each cue. In terms of the ankle rule, the physicians’ simultaneously
consider available cues, and make radiography decisions based on cues that they
perceive as valid predictors of significant ankle fracture. The physician judgment
policies outline which cues are valuable to each specific physician for ankle
radiography decision-making, and which cues are perceived as inadequate to inform
decision-making. The judgment policies are useful to compare cue utilization between
judges, and predict physician judgments based on the policies.
However, varying judgment policies do not necessarily yield different
judgments. Vicarious functioning also occurs as a result of cue intercorrelations (rij;
values between 0 and 1). Given that most cues are intercorrelated to some degree,
judges are able to use two or more different cues to elicit the same information from the
environment, and as a result arrive at the same decision. In the context of the ankle
rules, many cues are associated with the presence of significant fracture, but are not a
part of the rule because they are intercorrelated with the rule-based cues, and as a result
do not contribute any additional information to improve decision-making.29 This
redundancy of information allows physicians to arrive at the same judgment of whether
or not to order radiography via different judgment policies. However, to improve health
care fidelity and provide consistent, standardized care for all patients, it is important for
physicians to behave as though they are using rule-based cues.

23
Survey vignettes: A common method for conducting Social Judgment Analysis
Social Judgment Analysis can be conducted using vignette-based survey
methodology. The use of written clinical vignettes as a valid method for assessing
clinical decisions has been validated through the work of Peabody et al (2000).51
Clinical vignettes were evaluated against standardized patients (which are the gold
standard for measuring quality of clinical practice) and shown to be effective measures
of physician competence and quality of administered care. In addition, clinical vignettes
are relatively inexpensive, easily administered, and can effectively control for case-mix
variations in any type of medical practice.51
However, there are drawbacks to administration of hypothetical patient
vignettes. First, the task requires the physician to complete a highly repetitive time-
consuming task, which may cause physician fatigue or loss of interest, and as a result
yield unreliable data, in addition to low response rates. In an effort to minimize such
problems, Bachmann et al (2008) suggest a maximum burden of 20 vignettes with no
more than 6-8 variables per physician.52 Also, given the fabricated nature of this task,
the usefulness of collected data considerably depends on the extent to which vignettes
mimic real-world cases; thus, it is critical to ensure that hypothetical patient vignettes
are representative of the true environment (i.e. vignettes include all relevant cues, and
combinations of cues are clinically sensible). Also, it has been argued that clinical
vignettes measure competence rather than true clinical performance.53 Peabody et al
(2004) support the notion that true clinical behavior can be measured when clinical
vignettes are (1) open-ended, (2) completed within appropriate time limit, (3) based on
24
scientific evidence, (4) encompass the complexity of clinical practice, (5) provide real-
time information (if necessary), and (6) measure necessary, as well as unnecessary
patient care.54
Summary
Clinical decision rules are a valuable way to improve health care fidelity.41 The
ankle rule is a widely accepted decision rule,46 with the potential to significantly reduce
unnecessary radiographies in patient management of blunt ankle trauma.28 However,
evidence suggests that there is variability in how this rule is applied in practice, and that
self-report may not be a reliable measure of use.30 In order to understand this variability,
it was necessary to decompose the decision-making process to the level of individual
cues to address whether physicians were primarily relying on rule-based cues, or other
types of cues (i.e. related and unrelated). Social Judgment Analysis provided the ability
to look at physician decisions with this level of detail, and provided a theoretical
framework to understand how these judgments were made by individual physicians.48
Understanding the role of different types of cues (i.e. rule-based, related, and unrelated)
can inform knowledge translation interventions to improve adherence to the ankle rule.
The thesis also aimed to determine whether specific factors (such as self-reported
consistency in using the rule, and different levels of expertise) contributed to variability
in rule use between physicians. If either of these factors plays a significant role in
variability, then interventions could be developed to target specific physician
populations to improve adherence to the rule.
25
RESEARCH QUESTIONS
1) What is the rate of physician agreement with the ankle rule?
The Ottawa Ankle Rules are widely accepted clinical decision rules, with
approximately 90% of National samples of Canadian emergency physicians self-
reporting frequent use of the rules in everyday practice.30;46 Based on previous research,
we would expect agreement to be high with the ankle rule. If physicians are using the
rule to the extent that self-reported data suggest,30;46 then we should find close to perfect
agreement with the rule. We would expect agreement to be higher in cases where
radiography is indicated by the rule, and relatively lower in cases where radiography is
not recommended. Understanding what types of cases lead to lower physician
agreement can guide future knowledge translation interventions to improve agreement
with the rule.
2) A) Do cues based on the ankle rule have a greater impact on physician judgment
than non-rule-based cues?
B) With regard to non-rule-based cues, do related cues have a greater impact on
physician judgment than unrelated cues?
If physicians are using the Ottawa Ankle Rules as self-reported data suggest,30;46
then we should find that physicians place greatest value on rule-based cues. Although
self-reported use of the ankle rule is high, some data suggests that the rule, and thus the
rule-based cues, may be used in a variety of different ways.30 The Social Judgment
Analysis approach allowed us to also assess whether other types of cues (i.e. related and
26
unrelated) were involved in the decision-making process, and if so, how often. If non-
rule-based (especially unrelated) cues are found to be significant predictors of
radiography in decision-making, then it may suggest that real error is entering into the
decision process. Understanding the role of related and unrelated cues in decision-
making can inform interventions to improve adherence to the rule.
3) Do judgment policies differ among identifiable subgroups of physicians (i.e. self-
reported consistency in using the rule, and different levels of expertise)?
If physicians are using the ankle rule as they self-reported for our study, then we
should find that physicians reporting primarily making decisions on the basis of the
ankle should place greater value on rule-based cues, as compared to those who
considered other factors in the decision-making process. We would expect rule-based
cues to be weighted more heavily by physicians who have less clinical experience or
expertise. Expertise is an integral part of evidence based medicine,1 and greater years of
clinical experience may instill more confidence in personal decision-making, with less
focus on strictly following clinical guidelines or decision rules. Understanding the value
of self-reported rule use and role of expertise in decision-making could guide future
knowledge translation interventions to improve adherence to the rule.
27
METHODS: Work previously completed; Survey design and administration Study participants
Two-hundred and eighty-one study participants were randomly selected from
registered members of the Canadian Association of Emergency Physicians (CAEP;
approximately 1,370 members). The random selection of physicians was achieved using
the RAND function in Microsoft Excel. Non-Medical Doctors, retired physicians, and
physicians not currently practicing in Canada were excluded prior to randomization.
Study administration
The survey was piloted by the investigators and two additional physicians, who
completed the survey and provided feedback regarding format, clarity, and clinical
realism (i.e. representativeness) of the vignettes. The study protocol and mail-outs were
based on Dillman’s Tailored Design Method.55 The pre-notification letter described the
study, assured confidentiality, and requested that physicians complete the forthcoming
survey. All communications were signed by the investigators (Dr. Jamie C Brehaut and
Dr. Ian G Stiell) and personally addressed to each physician. No incentives were
provided for completing the survey. One week after the pre-notification letter, the
survey, and a postage-paid addressed reply envelope were mailed to all physicians in
the sample. One week later, a reminder card was sent to all non-responders, followed
two weeks later by a second complete survey package. A reminder postcard was sent
one week after the second package. A third survey package and reminder postcard
followed at corresponding time intervals.
28
Survey design
The survey consisted of seven pages, including a cover page with instructions, a
series of twenty written clinical judgment vignettes over five pages, and a final page
inquiring about physician demographic, professional and practice information. The
survey took approximately 30-40 minutes to complete. A copy of the survey is attached
as Appendix A.
Demographic and professional information collected from study participants
included gender (male or female), year of birth (open-ended response), year of
graduation from medical school (open-ended response), emergency medicine
employment status (full-time, part-time, or resident), number of years practicing
emergency medicine (open-ended response), number of hours devoted to direct patient
care in emergency medicine each week (open-ended response) and emergency medicine
credentials (CCFP(EM), CCFP, FRCPC, Dip ABEM, or other, please specify (as open-
ended response)).
The following Ottawa Ankle Rules practice information was collected from
study participants; physicians’ became aware of Ottawa Ankle Rules from (Medical
School, course, participation in a research study, colleague recommendation, journal
article, not familiar with the rule, or other, please specify (as open-ended response)),
frequency of Ottawa Ankle Rules use (always, most of the time, sometimes, or never),
number of years using Ottawa Ankle Rules in practice (open-ended response), role of
Ottawa Ankle Rules in decision-making (primarily on basis of rule, rule plus other key
factors, rule is one of many factors, do not consider the rule, or other, please specify (as

29
open-ended response)), confident that Ottawa Ankle Rules use will not miss fractures
(yes or no), last referral to printed version of the Ottawa Ankle Rules (days, weeks,
months, or years) and presence of Ottawa Ankle Rules posters in the clinical setting
(yes or no).
Prior to completing the vignette portion of the survey, the participants were
informed that each vignette represents a hypothetical patient presenting at the
emergency department with blunt ankle trauma. The instructions requested that
participants treat all vignettes as suffering from a five-step fall off of a ladder. In
addition, participants were informed that all vignettes showed no midfoot pain or
tenderness indicative of a midfoot fracture, and that there were no other injuries to
consider.
Eight cues were varied between clinical vignettes. All cues included in the
vignettes were identified from the Ottawa Ankle Rules derivation study as potentially
having an effect on physician behavior.29 The resulting task consisted of twenty
vignettes focused on eight dichotomous clinical factors. These cues are outlined in
Table 1.
30
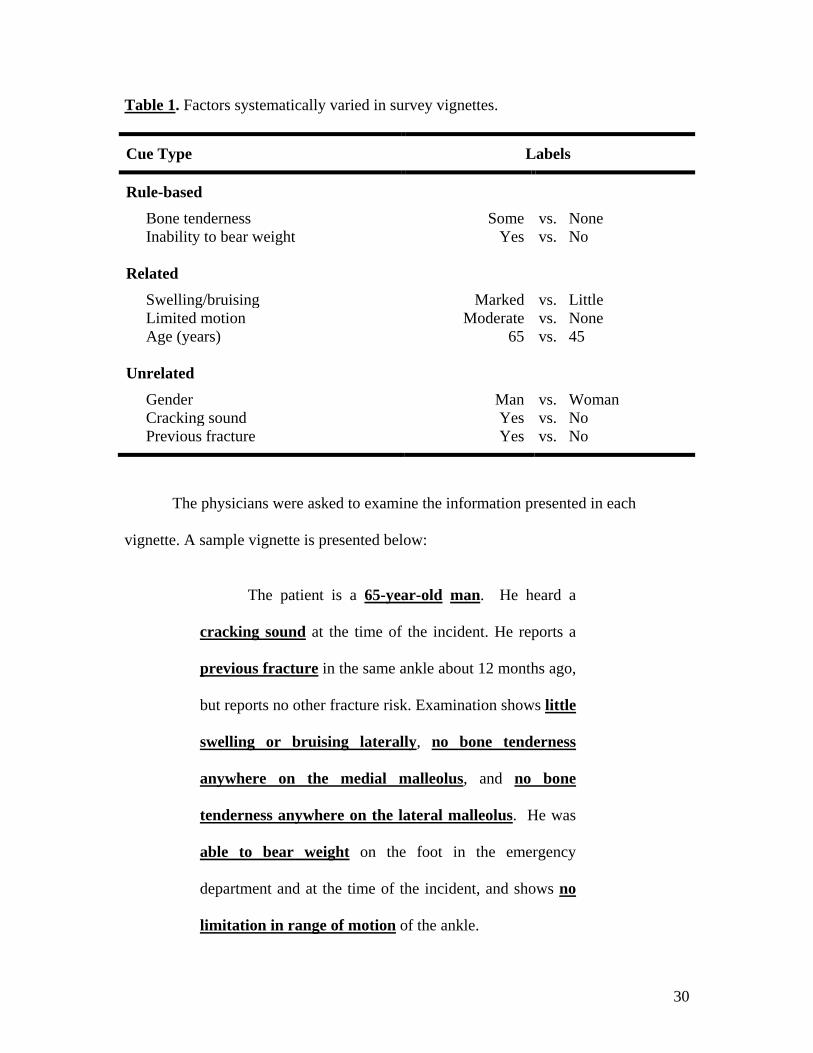
Table 1. Factors systematically varied in survey vignettes.
Cue Type Labels
Rule-based
Bone tenderness Some vs. None Inability to bear weight
Yes vs. No
Related
Swelling/bruising Marked vs. Little Limited motion Moderate vs. None Age (years)
65 vs. 45
Unrelated
Gender Man vs. Woman Cracking sound Yes vs. No Previous fracture Yes vs. No
The physicians were asked to examine the information presented in each
vignette. A sample vignette is presented below:
The patient is a 65-year-old man. He heard a
cracking sound at the time of the incident. He reports a
previous fracture in the same ankle about 12 months ago,
but reports no other fracture risk. Examination shows little
swelling or bruising laterally, no bone tenderness
anywhere on the medial malleolus, and no bone
tenderness anywhere on the lateral malleolus. He was
able to bear weight on the foot in the emergency
department and at the time of the incident, and shows no
limitation in range of motion of the ankle.
31
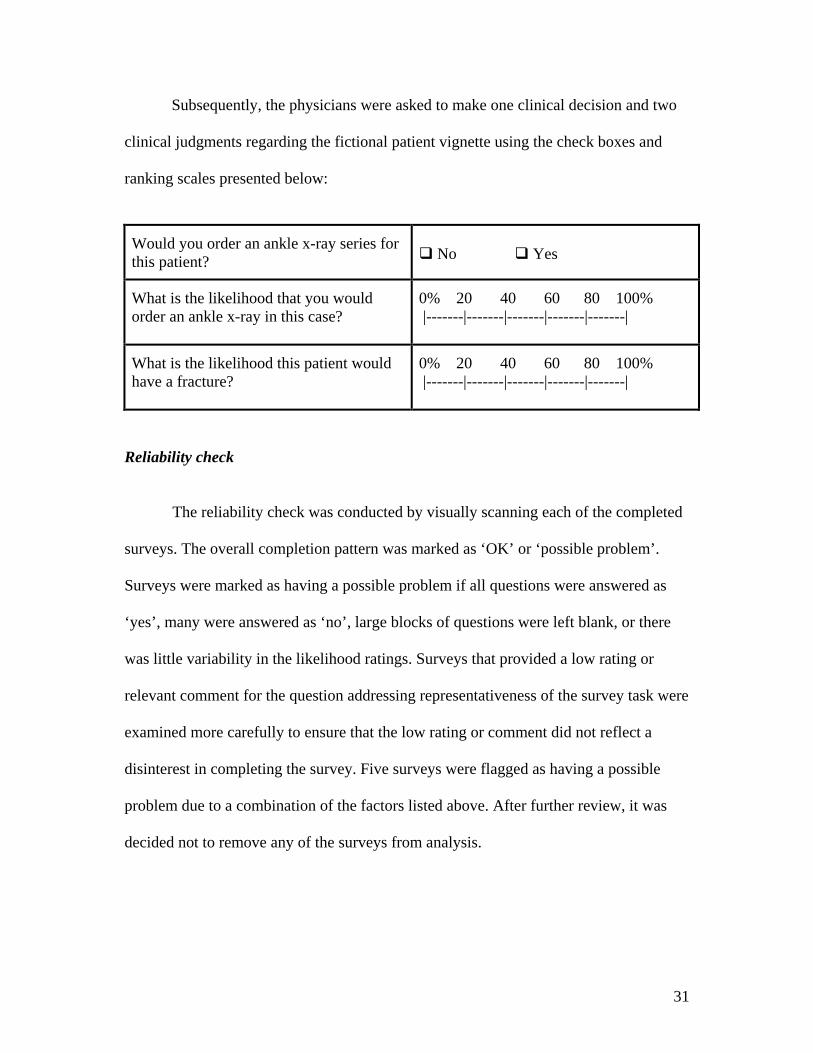
Subsequently, the physicians were asked to make one clinical decision and two
clinical judgments regarding the fictional patient vignette using the check boxes and
ranking scales presented below:
Would you order an ankle x-ray series for this patient?
No Yes
What is the likelihood that you would order an ankle x-ray in this case?
0% 20 40 60 80 100% |-------|-------|-------|-------|-------|
What is the likelihood this patient would have a fracture?
0% 20 40 60 80 100% |-------|-------|-------|-------|-------|
Reliability check
The reliability check was conducted by visually scanning each of the completed
surveys. The overall completion pattern was marked as ‘OK’ or ‘possible problem’.
Surveys were marked as having a possible problem if all questions were answered as
‘yes’, many were answered as ‘no’, large blocks of questions were left blank, or there
was little variability in the likelihood ratings. Surveys that provided a low rating or
relevant comment for the question addressing representativeness of the survey task were
examined more carefully to ensure that the low rating or comment did not reflect a
disinterest in completing the survey. Five surveys were flagged as having a possible
problem due to a combination of the factors listed above. After further review, it was
decided not to remove any of the surveys from analysis.
32
Interpreting decisions via Brunswik’s Lens Model
The amalgamation of the environment and cognitive process sides creates the
two-sided Lens Model (refer to Figure 3 on page 18). The model shows that the
physician does not have direct access to the true state of whether or not a fracture is
present. The physician must infer the likelihood of fracture based on the eight available
cues to decide whether or not the patient requires ankle radiography. The accuracy of
the judge’s estimate to the true state of whether or not the patient has an ankle fracture
is called achievement (ra; value between 0 and 1). It is very rare that any subset of cue
weights would be perfectly correlated with the presence of a fracture; this means that
even by making optimal use of each cue, generally, the judge cannot perfectly predict
the criterion or realize perfect judgment achievement.48 Thus, the physician’s
interpretation is based on imperfect correlations between the true state and each cue,
guided by the physician’s judgment policy.
This thesis was not able to measure achievement, as the data relied solely on
hypothetical patient vignettes to elicit physician judgment policies. In order to create a
full lens model to measure achievement in our survey task, we could have used past
Ottawa Ankle Rules validation study datasets to determine the real-world correlations
between the cues studied in our vignettes, and the presence of fracture as determined by
radiographies; however, we did not have access to such data. Therefore, data collected
for the question: “What is the likelihood this patient would have a fracture?” was not
used for analysis. Physician agreement with the Ottawa Ankle Rules was measured by
33
the question “Would you order an ankle x-ray series for this patient?” and used as a
proxy for achievement.
Response rates and mail-out process
There are two important response rates for this type of Social Judgment
Analysis. The power of the idiographic-statistical methodology increases with the
number of completed vignettes, not with the number of responders; thus, each survey
can have a low response rate as a result of partially completed vignettes. The reliability
check ensured that no large blocks of questions were left blank in each survey.
The second (or standard) type of response rate encompasses the number of
responders, which affects the power of between group comparisons (e.g. self-reported
consistency in using the rule, and different levels of expertise). Although this does not
affect the power of the idiographic-statistical approach, a greater number of participants
provides a more comprehensive look at different types of judgment policies and
frequency of such policies in the physician population.
Figure 4 describes the mail-out process and standard response rate. A random
sample of 694 physicians was obtained from the Canadian Association of Emergency
Physicians (approximately 1, 370 members) to contact for invitation to complete Ottawa
Ankle Rule surveys. Another survey was administered (prior to the survey described in
this thesis) and was sent to a random sample of 400 physicians from the original sample
of 694 physicians. The results were published by Brehaut et al (2005).30 Before
administration of the survey described here, the Canadian Association of Emergency
34
Physicians amended its survey policy to limit re-sampling of physicians contacted
through the first mail-out survey. Of the 294 remaining physicians, 13 were eliminated
from participation on the basis of missing address information, not currently practicing
in Canada, or affiliation with the Ottawa Hospital Civic Campus Emergency
Department.
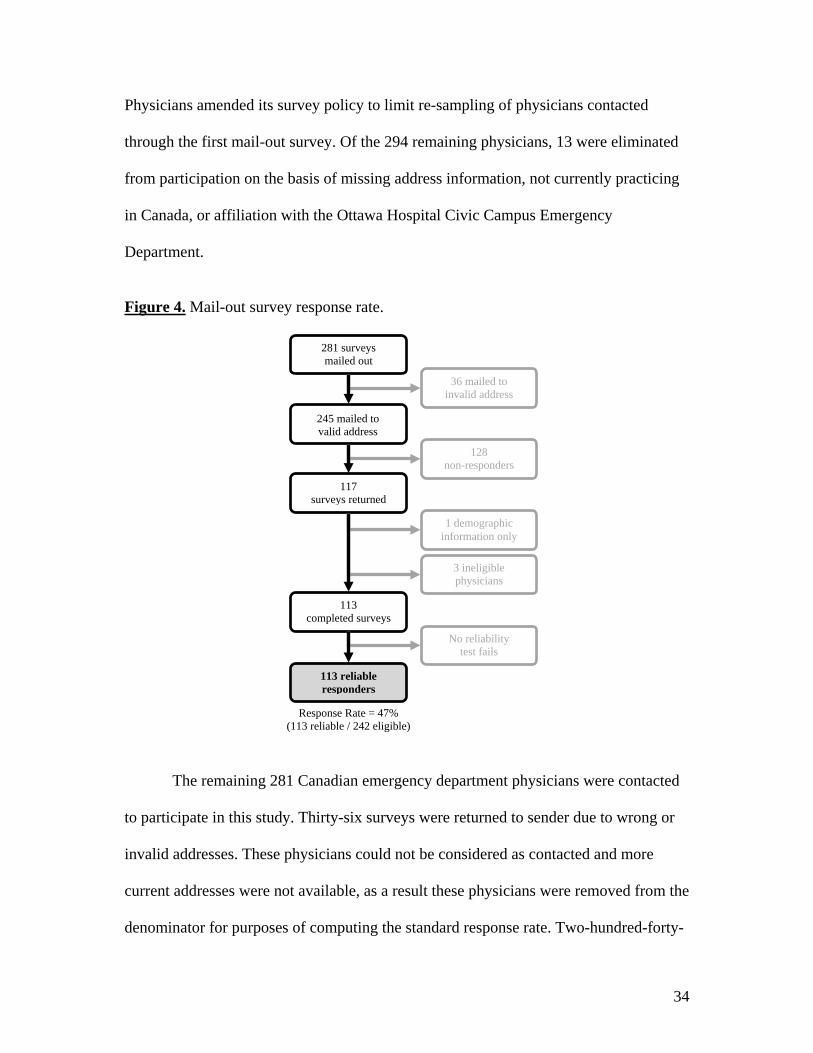
Figure 4. Mail-out survey response rate.
The remaining 281 Canadian emergency department physicians were contacted
to participate in this study. Thirty-six surveys were returned to sender due to wrong or
invalid addresses. These physicians could not be considered as contacted and more
current addresses were not available, as a result these physicians were removed from the
denominator for purposes of computing the standard response rate. Two-hundred-forty-
245 mailed to valid address
36 mailed to invalid address
117 surveys returned
128 non-responders
113 completed surveys
3 ineligible physicians
113 reliable responders
No reliability test fails
281 surveys mailed out
Response Rate = 47% (113 reliable / 242 eligible)
1 demographic information only
35
five surveys were received at the intended addresses. Of these mail-outs, 128 physicians
did not return the survey and one physician provided only demographic information, for
a total of 129 non-responders. Three pediatricians returned blank surveys with
comments that they were not eligible to participate in this study; the Ottawa Ankle
Rules have not been validated in pediatric populations and therefore these physicians do
not use the rule in clinical practice. These physicians were excluded from our study, and
were removed from the denominator for purposes of computing the standard response
rate. The remaining 113 responders completed the survey and passed the reliability
check. One survey was completed by a medical student, who was not a part of the target
population; however, the survey was included in study analyses. This mail-out yielded a
moderate standard response rate of 47% (113 reliable completions / 242 eligible
responders).
36
METHODS: Work completed for thesis; Statistical analysis All analyses were performed using SAS Statistical Software version 9.1. All
graphs were prepared using Microsoft Excel. Outcomes focused on the first two
questions of each vignette only, as presented in Appendix A; (1) Order ankle x-ray?
(Yes/No), and (2) What is the likelihood that you would order an ankle x-ray in this
case? (0-100%). All statistical tests were performed at a 0.05 alpha significance level.
Tukey pairwise comparisons were used for analyses requiring multiple comparisons of
means to correct for inflation of alpha error.
Exploratory and non-responder analyses Descriptive statistics were carried out for demographic and practice information.
Continuous variables were reported by mean, standard deviation (SD), range and
missing values (absolute and percentage). The year of birth and year of graduation data
were re-coded into age and time since graduation variables (in years).
Categorical variables were reported as percentage frequencies, and percentage
missing values. Geographic location was dichotomized into Ontario and other
provinces, given that the Ottawa Ankle Rules was developed in the province of Ontario,
which may result in increased interest in the rule and influence survey standard
response rates. Emergency medicine employment status was dichotomized into full-
time and part-time (part-time included residents and one medical student), since
employment status is expected to affect level of expertise, where physicians who spend
37
more time in the emergency department would be expected to see more cases, and as a
result have a higher level of expertise.
Non-responder bias was assessed by comparing gender and geographic location
variables for responders versus non-responders using Chi-square tests of independence.
Early versus late responders were also compared based on gender, geographic location,
self-reported role of the Ottawa Ankle Rules in decision-making, last referral to printed
version of the rule, employment status, and time since graduation from medical school
using Chi-square tests of independence. Late responders are the best proxy for non-
responders, since without the follow-up reminder cards administered as part of the
Dillman’s Tailored Design Method,55 late responders may have become non-
responders.56;57
The overall fit of the Brunswik Lens Model was described using individual
associations between the cues and the judgment (i.e. rs1rs8; Figure 3, page 18), and the
overall consistency (Rs; Figure 3, page 18) of the model, which is the strength of
association between the judgment and all available cues. In this case, since the cues in
the vignettes are not correlated, the strength of association is simply calculated as the
sum of the individual correlations of all cues; in reality, the association would be
smaller than the sum of its parts, since overlaps occur between individual cues, which
are providing the same information.58 The fit was measured to determine how much of
the overall variation in decision-making was attributable to the eight cues. Means and
ranges were reported.
38
Important physician policy types were described, using real judgment policies
selected from our study as examples. The number of physicians employing each of the
three policy types was reported.
Analysis: Research Question 1. What is the rate of physician agreement with the ankle
rule?
The ankle rule guides physician radiography decision-making based on the
distribution of rule-based cues in each vignette; if either the bone tenderness or inability
to bear weight cues (or both) are positive, then the ankle rule indicates that radiography
is necessary; otherwise, radiography is not indicated. Physician responses to the
vignettes were evaluated to examine what percentage of physician decisions were
consistent with the ankle rule.
Several variables were re-categorized for analysis. ‘Role of the Ottawa Ankle
Rules in decision’ was collapsed into two levels. ‘Primarily on basis of rule’ remained
as one level, and the other categories (rule plus other key factors, rule is one of many
factors, do not consider the rule, or other, please specify) were collapsed to create the
second level named ‘consider other factors’. This categorization was chosen to create
adequate sample sizes within each category. This dichotomous variable was named
‘role in decision’.
‘Last referral to printed version of the Ottawa Ankle Rules’ was collapsed into
three levels. ‘Days’ and ‘weeks’ was combined to create one level, ‘months’ remained
unchanged to form the second level, and ‘years’ remained unchanged to form the third
39
level. This categorization was chosen to create adequate sample sizes within each
category. This variable was named ‘last referral’.
The continuous ‘time since graduation’ was categorized into three levels.
Physicians who graduated from medical school less than 10 years ago (<10) formed the
first level. Physicians who graduated between 10 to 20 years ago (10-20, inclusive)
formed the second group, and physicians who completed medical school over 20 years
ago (20+) constituted the third level. This categorization was chosen to create adequate
sample sizes within each category. This categorical variable was named ‘time of
graduation’.
Physician decisions were assessed by computing the N, mean percentage
agreement, SD and range based on physician responses to the clinical decision of
whether or not to order radiography (yes or no) in each vignette. Percentage agreements
with the Ottawa Ankle Rules were computed by comparing physician responses with
Ottawa Ankle Rules recommendations. Missing values were counted as a disagreement.
Mean percentage agreements across physicians overall and based on vignette
type (i.e. ankle rule indicates radiography versus does not indicate radiography) were
compared to perfect agreement with ankle rule recommendations. Differences among
three groups based on cue distribution within vignettes (i.e. both rule-based cues
positive, only bone tenderness positive, or only ability to bear weight positive) were
assessed by repeated measures ANOVA, with Tukey pairwise comparisons if the
overall ANOVA was significant. Mean percentage agreements were transformed using
the arcsine-root transformation ( ( )1sin p− ) prior to ANOVA in an effort to stabilize
40
the variance of proportions.59 If the variance had not been stabilized, it could have lead
to unreliable p-values if the proportions were considerably varied.
Key variables were selected for additional post hoc analyses based on literature
that a large proportion of physicians do not remember all components of the Ottawa
Ankle Rules; in particular, recall errors were higher in physicians who did not use the
rule consistently, practiced emergency medicine on a part-time basis, and were more
experienced.30 In addition, previous research has shown that the majority of physicians
cannot remember all components of the Ottawa Ankle Rules, which may be attributable
to the majority of physicians not having viewed the rule in months, or even years. To
test whether this was true of our sample, we compared agreements between groups for
each of the key variables.
Differences among two subgroups based on ‘role in decision’ (primarily on
basis of rule or consider other factors) and ‘employment status’ (full-time or part-time)
were assessed by t-test. Differences among three levels of ‘last referral’ (days/weeks,
months, or years) and ‘time of graduation’ (<10, 10-20, or 20+) were assessed using a
1-way ANOVA, with Tukey pairwise comparisons if the overall ANOVA was
significant. The variance was stabilized using the arcsine-root transformation prior to
ANOVA.
41
Analysis: Research Question 2. (A) Do cues based on the ankle rule have a greater
impact on physician judgment than non-rule-based cues? (B) With regard to non-rule-
based cues, do related cues have a greater impact on physician judgment than
unrelated cues?
The statistical approach used for Research Question 2 was informed by the
Brunswik Lens Model and Social Judgment Analysis.
The initial dataset contained physician identification numbers and all survey
responses (the clinical decisions and judgments for each vignette, as well as physician
demographic, professional, practice information) at the level of individual physicians.
The dataset was reduced to identification number and a clinical judgment (likelihood of
ordering radiography; response options: 0 – 100%) for each vignette. The dataset was
transposed to create a new dataset at the level of the vignette (i.e. twenty lines per
physician), with each line corresponding to likelihood of ordering radiography in one of
the twenty vignettes. New data was merged to the transposed dataset to include
dichotomous values (0, 1) for all eight cues (as outlined in Methods Table 1, page 28)
corresponding to the cue distribution in each of the twenty vignettes.
Consistent with the Social Judgment Analysis idiographic-statistical approach, a
multiple linear regression was conducted for each physician, with the probability
assessment (likelihood of ordering radiography; response options: 0 – 100%) as the
response variable, and the dichotomous cue values (0, 1) as the independent variables.
The Social Judgment Analysis approach seeks to understand the judgment policies of
individual physicians, and thus the beta regression coefficients are derived from
42
individual physician responses on the twenty vignettes. Each person-specific regression
yielded a set of beta coefficients for each of the eight cues. These beta weights were
imported to a new dataset, with one line per physician. Each line of the working dataset
contained the physician identification number, coefficients of determination (r2) and
beta regression coefficients for each of the eight cues.
The beta regression coefficients were standardized in order to make physician
beta weights comparable between judges. The beta regression coefficients were
transformed into relative weights using the formula: rwβi = [|βi|/(Σki=1 |βi|)]*100.48 This
method produces a new set of weights that effectively partitions 100% of the
predictable variation, where each weight becomes a proportion of this total;60 a bone
tenderness cue that accounts for 50% of the total predictable variation means that it
accounts for half of the predictability based on the available eight cues. The above
formula is standard for Social Judgment Analysis, but can only be applied in cases
where all cues are independent of each other; that is to say that none of the cues are
intercorrelated. Alternative methods of standardization are available for vignettes
employing intercorrelated cues. This type of standardization may be misinterpreted as
the eight cues presented in the vignettes perfectly predict physician judgments; in fact,
the cue weights need to be considered in the context of how much of the overall
variability is predictable.
The mean relative weights across physicians were reported for each of the cues,
and by combined groups of cues for rule-based (bone tenderness, ability to bear weight)
and non-rule-based (related: marked swelling/bruising, age, limited range of motion,
43
unrelated: previous fracture, cracking sound, gender). The data was visually represented
by histogram; this method of presentation highlights where physicians place greatest
weight and emphasizes variation in cue use. Combined cue group analyses compared
cumulative relative weights using associated 95% confidence intervals.
Bootstrapping methods were used to obtain robust non-parametric 95%
confidence intervals. Bootstrapping relies on repeated random samples with
replacement from the original data to estimate standard errors.58 Standard binomial
confidence intervals were not appropriate for relative weights, as the sampling
distribution was unknown. Bootstrapping does not appear to be the standard in Social
Judgment Analysis literature; however, it is a recommended approach.
Research question 2A compared the cumulative relative weights across
physicians of the rule-based group to the non-rule-based groups (related and unrelated),
whereas research question 2B comparing the cumulative relative weights across
physicians of the related group to the unrelated group. Both analyses were conducted
using the 95% bootstrapped confidence intervals.
Analysis: Research Question 3. Do judgment policies differ among identifiable
subgroups of physicians (i.e. self-reported consistency in using the rule, and different
levels of expertise)?
The statistical approach used for Research Question 3 was informed by the
Brunswik Lens Model and Social Judgment Analysis.
44
Value of self-reported use of the rule in radiography decision-making
‘Role in decision’ was imported to the dataset as an additional covariate to allow
for comparison of judgment policies based on this variable.
The mean relative weights were reported for each cue, and by combined groups
of cues (rule-based, related, and unrelated) by level of the ‘role in decision’ variable
with bootstrapped 95% confidence intervals. The data was visually represented by
histogram. Combined cue group analyses compared cumulative relative weights by
level of the ‘role in decision’ variable using bootstrapped 95% confidence intervals.
Role of physician expertise in radiography decision-making
‘Time of graduation’ was imported to the dataset as an additional covariate to
allow for comparison of judgment policies based on this variable.
The mean relative weights were reported for each cue, and by combined groups
of cues (rule-based, related, and unrelated) by level of the ‘time of graduation’ variable
with bootstrapped 95% confidence intervals. The data was visually represented by
histogram. Combined cue group analyses compared cumulative relative weights by
level of the ‘time of graduation’ variable using bootstrapped 95% confidence intervals.
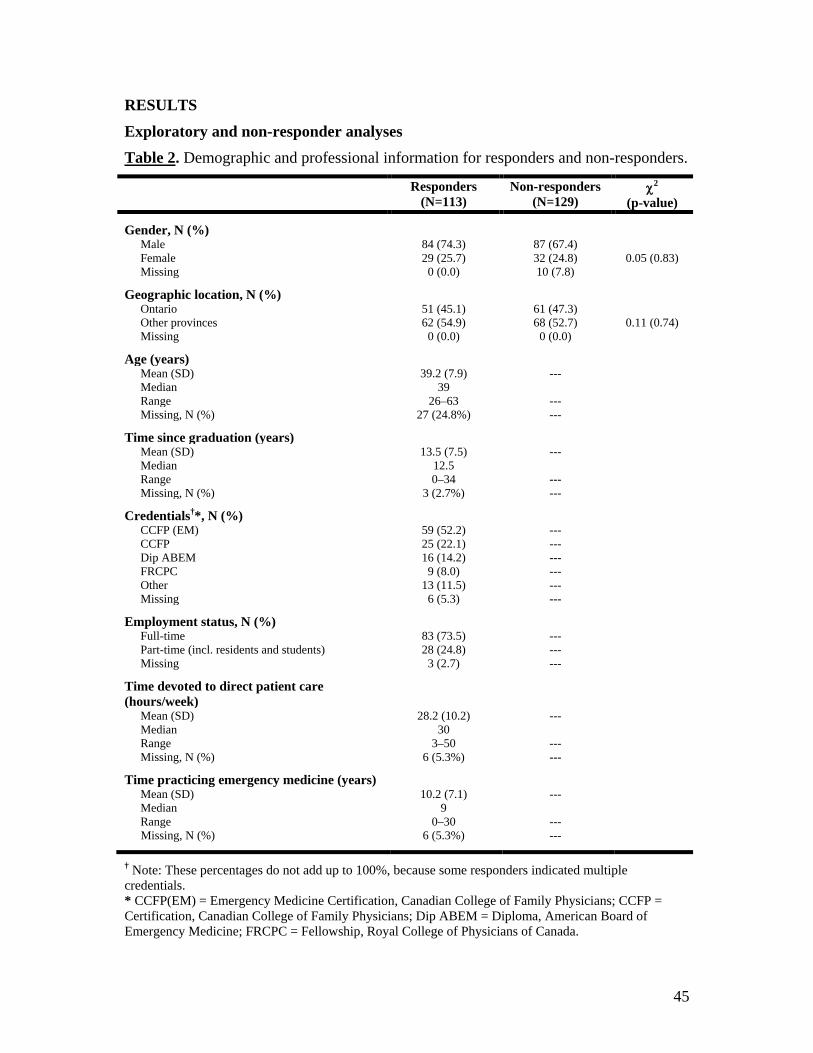
45
RESULTS Exploratory and non-responder analyses Table 2. Demographic and professional information for responders and non-responders.
Responders (N=113)
Non-responders (N=129)
χ2 (p-value)
Gender, N (%) Male 84 (74.3) 87 (67.4) Female 29 (25.7) 32 (24.8) 0.05 (0.83) Missing 0 (0.0) 10 (7.8)
Geographic location, N (%)
Ontario 51 (45.1) 61 (47.3) Other provinces 62 (54.9) 68 (52.7) 0.11 (0.74) Missing 0 (0.0) 0 (0.0)
Age (years)
Mean (SD) 39.2 (7.9) --- Median 39 Range 26–63 --- Missing, N (%) 27 (24.8%) ---
Time since graduation (years) Mean (SD) 13.5 (7.5) --- Median 12.5 Range 0–34 --- Missing, N (%) 3 (2.7%) ---
Credentials†*, N (%)
CCFP (EM) 59 (52.2) --- CCFP 25 (22.1) --- Dip ABEM 16 (14.2) --- FRCPC 9 (8.0) --- Other 13 (11.5) --- Missing 6 (5.3) ---
Employment status, N (%) Full-time 83 (73.5) --- Part-time (incl. residents and students) 28 (24.8) --- Missing 3 (2.7) ---
Time devoted to direct patient care (hours/week)
Mean (SD) 28.2 (10.2) --- Median 30 Range 3–50 --- Missing, N (%) 6 (5.3%) ---
Time practicing emergency medicine (years)
Mean (SD) 10.2 (7.1) --- Median 9 Range 0–30 --- Missing, N (%) 6 (5.3%) ---
† Note: These percentages do not add up to 100%, because some responders indicated multiple credentials. * CCFP(EM) = Emergency Medicine Certification, Canadian College of Family Physicians; CCFP = Certification, Canadian College of Family Physicians; Dip ABEM = Diploma, American Board of Emergency Medicine; FRCPC = Fellowship, Royal College of Physicians of Canada.
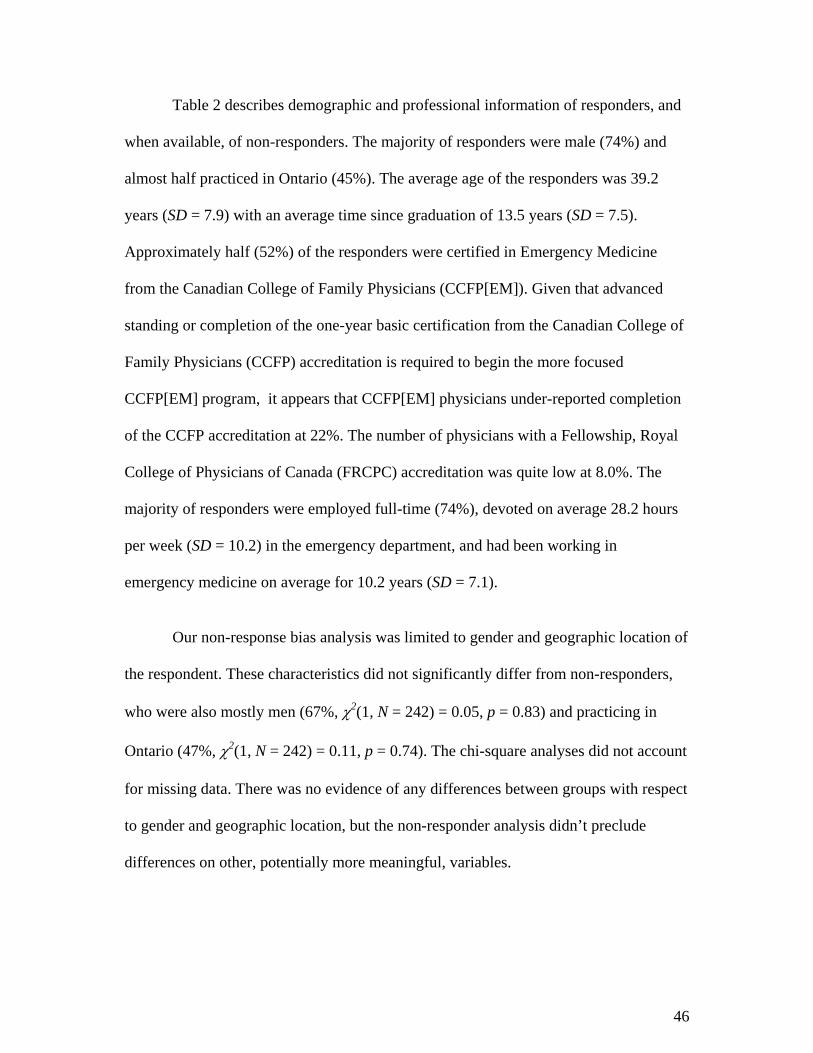
46
Table 2 describes demographic and professional information of responders, and
when available, of non-responders. The majority of responders were male (74%) and
almost half practiced in Ontario (45%). The average age of the responders was 39.2
years (SD = 7.9) with an average time since graduation of 13.5 years (SD = 7.5).
Approximately half (52%) of the responders were certified in Emergency Medicine
from the Canadian College of Family Physicians (CCFP[EM]). Given that advanced
standing or completion of the one-year basic certification from the Canadian College of
Family Physicians (CCFP) accreditation is required to begin the more focused
CCFP[EM] program, it appears that CCFP[EM] physicians under-reported completion
of the CCFP accreditation at 22%. The number of physicians with a Fellowship, Royal
College of Physicians of Canada (FRCPC) accreditation was quite low at 8.0%. The
majority of responders were employed full-time (74%), devoted on average 28.2 hours
per week (SD = 10.2) in the emergency department, and had been working in
emergency medicine on average for 10.2 years (SD = 7.1).
Our non-response bias analysis was limited to gender and geographic location of
the respondent. These characteristics did not significantly differ from non-responders,
who were also mostly men (67%, χ2(1, N = 242) = 0.05, p = 0.83) and practicing in
Ontario (47%, χ2(1, N = 242) = 0.11, p = 0.74). The chi-square analyses did not account
for missing data. There was no evidence of any differences between groups with respect
to gender and geographic location, but the non-responder analysis didn’t preclude
differences on other, potentially more meaningful, variables.
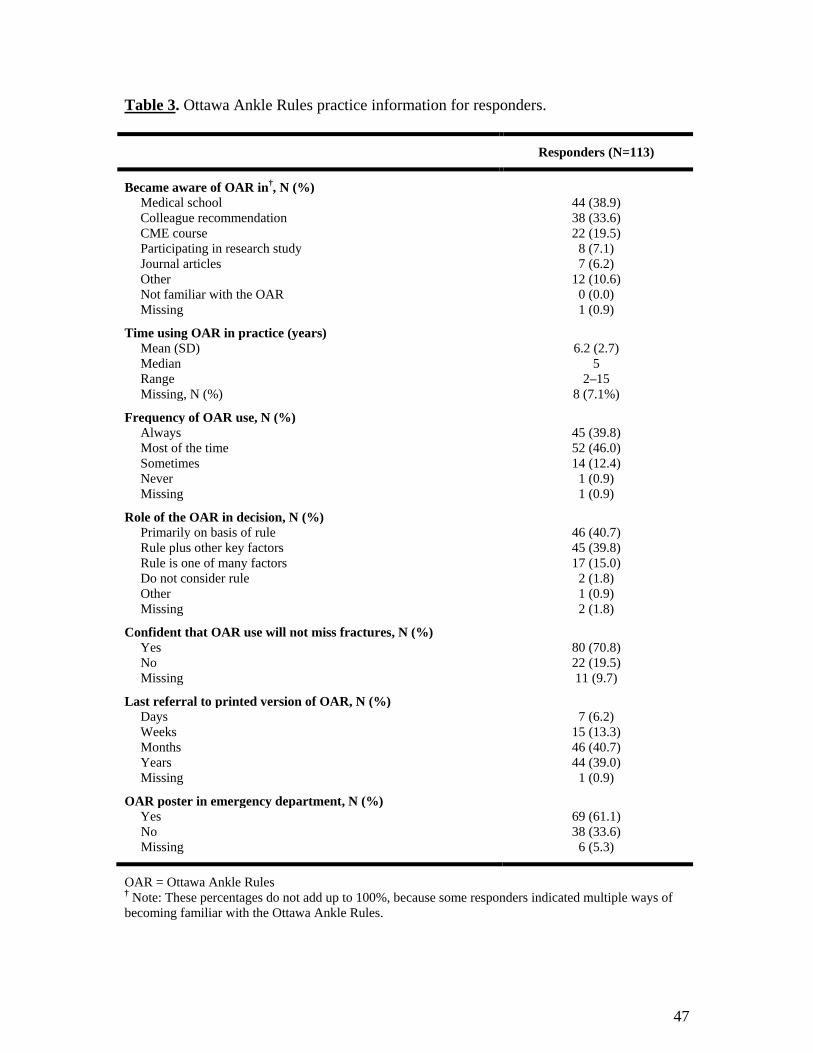
47
Table 3. Ottawa Ankle Rules practice information for responders. Responders (N=113)
Became aware of OAR in†, N (%)
Medical school 44 (38.9) Colleague recommendation 38 (33.6) CME course 22 (19.5) Participating in research study 8 (7.1) Journal articles 7 (6.2) Other 12 (10.6) Not familiar with the OAR 0 (0.0) Missing 1 (0.9)
Time using OAR in practice (years)
Mean (SD) 6.2 (2.7) Median 5 Range 2–15 Missing, N (%) 8 (7.1%)
Frequency of OAR use, N (%)
Always 45 (39.8) Most of the time 52 (46.0) Sometimes 14 (12.4) Never 1 (0.9) Missing 1 (0.9)
Role of the OAR in decision, N (%)
Primarily on basis of rule 46 (40.7) Rule plus other key factors 45 (39.8) Rule is one of many factors 17 (15.0) Do not consider rule 2 (1.8) Other 1 (0.9) Missing 2 (1.8)
Confident that OAR use will not miss fractures, N (%)
Yes 80 (70.8) No 22 (19.5) Missing 11 (9.7)
Last referral to printed version of OAR, N (%)
Days 7 (6.2) Weeks 15 (13.3) Months 46 (40.7) Years 44 (39.0) Missing 1 (0.9)
OAR poster in emergency department, N (%)
Yes 69 (61.1) No 38 (33.6) Missing 6 (5.3)
OAR = Ottawa Ankle Rules † Note: These percentages do not add up to 100%, because some responders indicated multiple ways of becoming familiar with the Ottawa Ankle Rules.
48
Table 3 describes Ottawa Ankle Rules practice information for responders. The
most commonly reported methods for being exposed to the Ottawa Ankle Rules were in
medical school (39%), from a colleague recommendation (34%), or through a
Continuing Medical Education (CME) course (20%). No physician reported being
unfamiliar with the Ottawa Ankle Rules. Responders had been using the Ottawa Ankle
Rules in practice on average for 6.2 years (SD = 2.7). Most (86%) responders reported
using the Ottawa Ankle Rules always or most of the time. Similarly, most (81%)
reported basing decisions primarily on the Ottawa Ankle Rules, or primarily on the rule
with few other key factors. The majority (71%) of physicians did not believe that they
were more likely to miss a fracture if appropriately applying the Ottawa Ankle Rules.
Most physicians had not referred to a printed version of the Ottawa Ankle Rules in
months (41%) or years (39%), and many (34%) reported not having an Ottawa Ankle
Rules poster for reference in their emergency departments.
Early versus late responder analysis
Given that scientific literature suggests that late responders are the best available
proxy for non-responders,56 our study compared various characteristics of early (< 31
days) and late responders (> 31 days) to determine whether there were any significant
differences.
The early versus late responder analysis in Table 4 assessed gender and
geographic location, as well as more meaningful variables such as role of Ottawa Ankle
Rules in decision-making, last referral to printed version of the rules, emergency

49
medicine employment status, and time of graduation from medical school. There was no
evidence of any significant differences between early and late responders.
Table 4. Demographic and practice characteristics of early and late responders.
Early responders (%, N=58)
Late responders (%, N=55)
χ2 (p-value)
Gender
Male 77.6 70.9 0.66 (0.42) Female 22.4 29.1 Missing, N 0 0
Geographic location
Ontario 50.0 40.0 1.14 (0.29) Other provinces 50.0 60.0 Missing, N 0 0
Role in decision
Primarily on basis of rule 42.1 40.7 0.02 (0.89) Consider other factors 57.9 59.3 Missing, N 1 1
Last referral
Days/weeks 43.1 38.9 0.48 (0.79) Months 17.2 22.2 Years 39.7 38.9 Missing, N 0 1
Employment status
Full-time 79.3 69.8 1.32 (0.25) Part-time (incl. residents and students)
20.7 30.2
Missing, N 0 2
Time of graduation (years)
< 10 47.4 32.1 3.08 (0.21) 10 - 20 24.6 26.4 20 + 28.1 41.5 Missing, N 1 2
Fit of the Lens Model
The fit of the Lens Model is shown in Table 5. The fit was assessed using
coefficients of determination (r2) based on individual associations between the cues and
the judgment, and the overall model, which is the association between the judgment and

50
all available cues. In essence, the overall r2 measured how much of the overall variation
in decision-making was attributable to physician judgment policies.
Both rule-based cues (i.e. inability to bear weight and bone tenderness)
individually were moderately associated with the judgment, but together accounted for
over half (0.284 + 0.270 = 0.554) of the overall variation. All other cues were given low
value, with associations less than 0.05, and together only accounted for 0.179 of the
overall variation.
The mean overall r2 was 0.728 (SD=0.099; range=0.427-0.917), which indicated
that, on average across all physicians, 73% of the overall variation in decision-making
was attributable to physician judgment policies. The mean overall r2 represented a high
degree of fit for the Lens Model.
Table 5. Fit of the Lens Model. N=113.
Cue Mean r2 (SD) Range
Inability to bear weight 0.284 (0.129) 0.013 – 0.754
Bone tenderness 0.270 (0.134) 0.013 – 0.777
Marked swelling/bruising 0.043 (0.051) 0.000 – 0.339
Age 0.044 (0.055) 0.000 – 0.267
Limited range of motion 0.028 (0.032) 0.000 – 0.140
Previous fracture 0.032 (0.045) 0.000 – 0.249
Cracking sound 0.019 (0.031) 0.000 – 0.185
Gender 0.013 (0.016) 0.000 – 0.074
All cues Mean overall r2 = 0.728 (0.099) 0.427 – 0.917
51
Three types of judgment policies
Figure 5, on the next pages, illustrates three real judgment policies selected from
our study. Responders in (a) and (b) had perfect agreement with the ankle rule, despite
relying on different cues to guide decision-making, which supports the vicarious
functioning concept of the Lens Model. The responder in (c) had a low agreement of
75% with the rule. The figure also presents the number of responders employing each of
the three judgment policy types.

52
Figure 5. Three examples of real physician judgment policies.
(A) This responder demonstrated perfect agreement with the ankle rule, and used the
rule as intended. The associated rs values and overall consistency (Rs) are depicted
below. The responder placed greatest weight on rule-based cues (inability to bear
weight, bone tenderness), negligible weight on related cues (marked
swelling/bruising, age, limited range of motion) and no weight on unrelated cues
(previous fracture, cracking sound, gender). The implications of such a policy are a
reduction in unnecessary radiographies for patients at low risk of fracture, and no
missed opportunities to provide radiographies for patients with potential significant
fractures. The majority (88 of 113; 78%) of our responders demonstrated a similar
judgment policy, where the two greatest weights were placed on the two rule-based
cues.
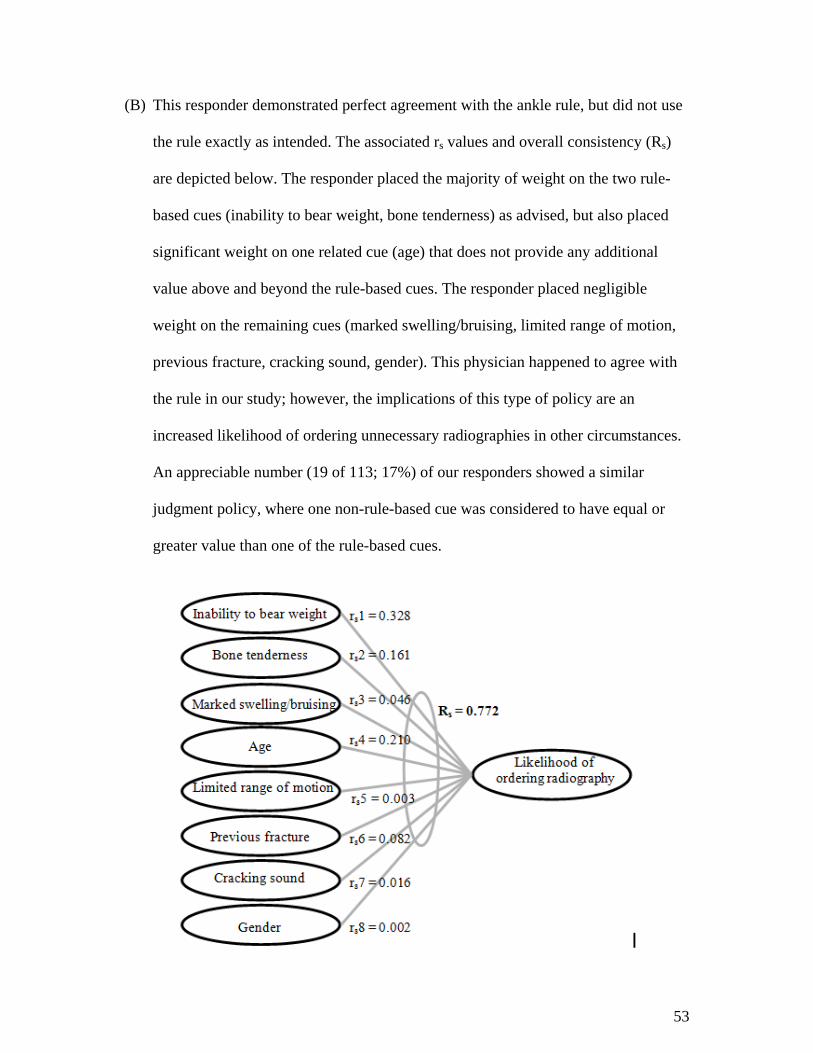
53
(B) This responder demonstrated perfect agreement with the ankle rule, but did not use
the rule exactly as intended. The associated rs values and overall consistency (Rs)
are depicted below. The responder placed the majority of weight on the two rule-
based cues (inability to bear weight, bone tenderness) as advised, but also placed
significant weight on one related cue (age) that does not provide any additional
value above and beyond the rule-based cues. The responder placed negligible
weight on the remaining cues (marked swelling/bruising, limited range of motion,
previous fracture, cracking sound, gender). This physician happened to agree with
the rule in our study; however, the implications of this type of policy are an
increased likelihood of ordering unnecessary radiographies in other circumstances.
An appreciable number (19 of 113; 17%) of our responders showed a similar
judgment policy, where one non-rule-based cue was considered to have equal or
greater value than one of the rule-based cues.
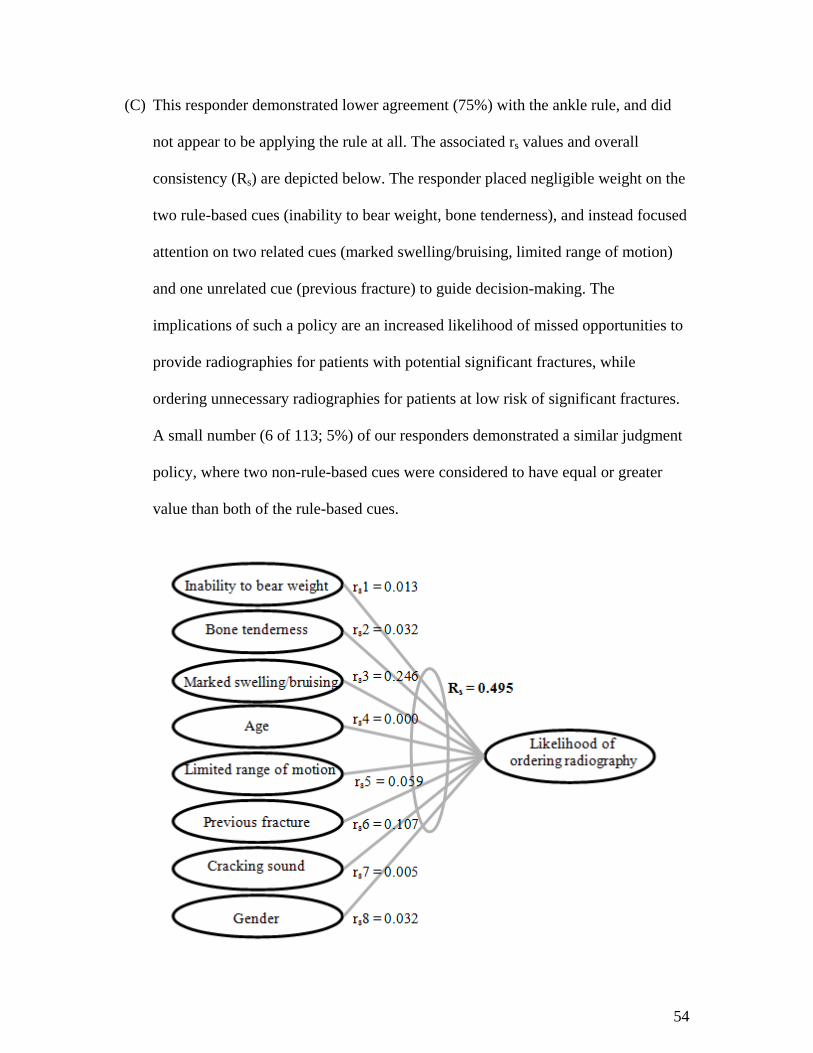
54
(C) This responder demonstrated lower agreement (75%) with the ankle rule, and did
not appear to be applying the rule at all. The associated rs values and overall
consistency (Rs) are depicted below. The responder placed negligible weight on the
two rule-based cues (inability to bear weight, bone tenderness), and instead focused
attention on two related cues (marked swelling/bruising, limited range of motion)
and one unrelated cue (previous fracture) to guide decision-making. The
implications of such a policy are an increased likelihood of missed opportunities to
provide radiographies for patients with potential significant fractures, while
ordering unnecessary radiographies for patients at low risk of significant fractures.
A small number (6 of 113; 5%) of our responders demonstrated a similar judgment
policy, where two non-rule-based cues were considered to have equal or greater
value than both of the rule-based cues.
55
Representativeness of the survey task
In an effort to understand the representativeness of the survey task, each
physician was asked to rate on a scale of 1-10 (with 1 indicating that the survey was
completely irrelevant to the clinical decision, and 10 representing a perfect model of the
clinical decision) how well the vignettes modeled real-world clinical decisions of
whether or not to order radiography in cases of blunt ankle trauma.
The survey vignettes were found to be moderately representative of real-world
clinical scenarios, with a mean representativeness score of 6.1 (SD = 2.14, range = 1-
10). All cues included in the study were chosen based on research that such clinical
indicators have or are perceived to have diagnostic value by physicians,29;30 and pilot
testing supported that the cues were clinically relevant.
A survey question asked the responders to explain their vignette
representativeness ratings. Many responders agreed that the survey captured all
necessary factors and was quite representative of real-world clinical decisions.
Responder feedback also indicated reasons for lower ratings on representativeness of
the survey task. Examples are provided in Table 6 on the next page.
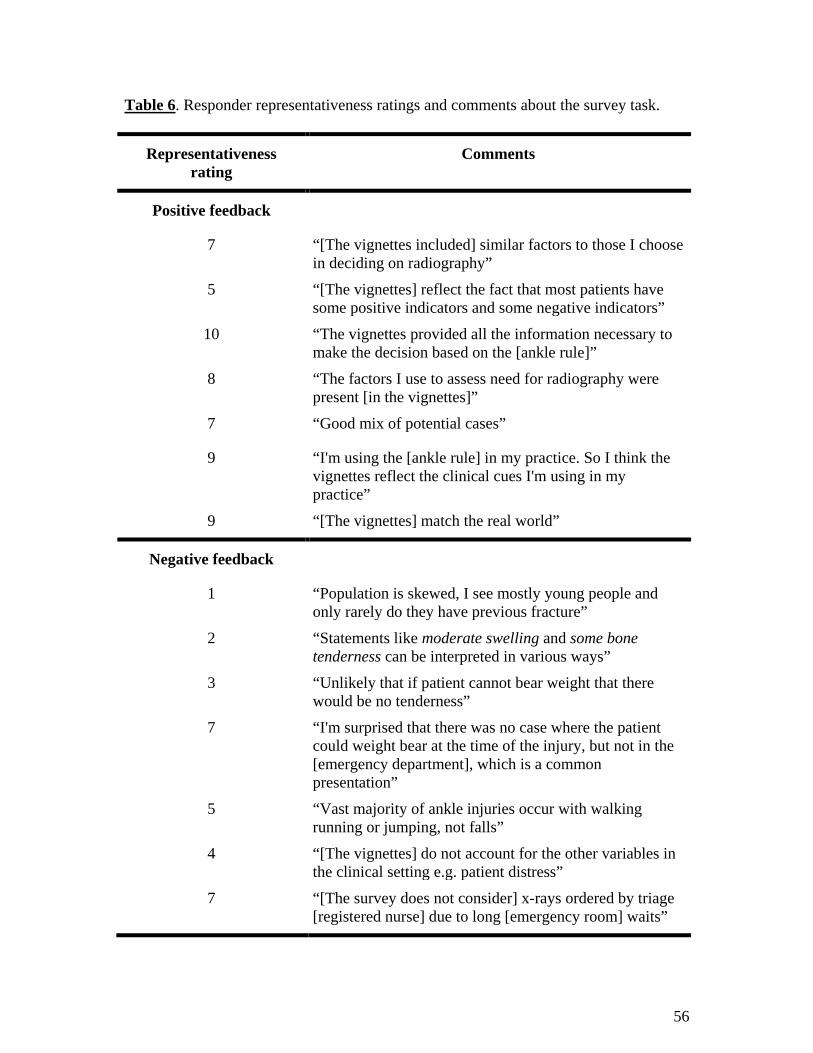
56
Table 6. Responder representativeness ratings and comments about the survey task.
Representativeness rating
Comments
Positive feedback
7 “[The vignettes included] similar factors to those I choose in deciding on radiography”
5 “[The vignettes] reflect the fact that most patients have some positive indicators and some negative indicators”
10 “The vignettes provided all the information necessary to make the decision based on the [ankle rule]”
8 “The factors I use to assess need for radiography were present [in the vignettes]”
7 “Good mix of potential cases”
9 “I'm using the [ankle rule] in my practice. So I think the vignettes reflect the clinical cues I'm using in my practice”
9 “[The vignettes] match the real world”
Negative feedback
1 “Population is skewed, I see mostly young people and only rarely do they have previous fracture”
2 “Statements like moderate swelling and some bone tenderness can be interpreted in various ways”
3 “Unlikely that if patient cannot bear weight that there would be no tenderness”
7 “I'm surprised that there was no case where the patient could weight bear at the time of the injury, but not in the [emergency department], which is a common presentation”
5 “Vast majority of ankle injuries occur with walking running or jumping, not falls”
4 “[The vignettes] do not account for the other variables in the clinical setting e.g. patient distress”
7 “[The survey does not consider] x-rays ordered by triage [registered nurse] due to long [emergency room] waits”

57
Results: Research Question 1. What is the rate of physician agreement with the ankle
rule?
Mean percentage agreement of physician responses with the ankle rule was
calculated to determine physician adherence to the rule. Missing values were counted as
disagreements to provide conservative estimates. Missing agreement values accounted
for 0.8% (18 missing/113 responders*20 vignettes) of data entries.
Table 7. Mean agreements with the ankle rule overall and by vignette type.
Vignette types N Mean percentage agreement (SD) Range
All vignettes (20 vignettes) 113 88.8 (11.5) 55.0-100.0
Rule indicates radiography (15 vignettes) 113 93.5 (13.0) 40.0-100.0
Rule indicates no radiography (5 vignettes) 113 74.7 (30.4) 0.0-100.0
Table 7 shows that the mean percentage agreement was quite high, but not
perfect, at 89% (SD = 11.5%). When the ankle rule indicated radiography, agreement
was 94% (SD = 13.0). When the ankle rule indicated no radiography, agreement was
lower at 75% (SD = 30.4) of vignettes.
In Table 8, on the next page, we examined four important cue distributions
varied in the vignettes, based on the presence (or absence) of rule-based cues, in order
to further explore the variation in agreement with the ankle rule; only inability to bear
weight rule-based cue positive, only bone tenderness rule-based cue positive, both rule-
based cues positive, or no rule-based cues positive. Given that the vignettes were varied
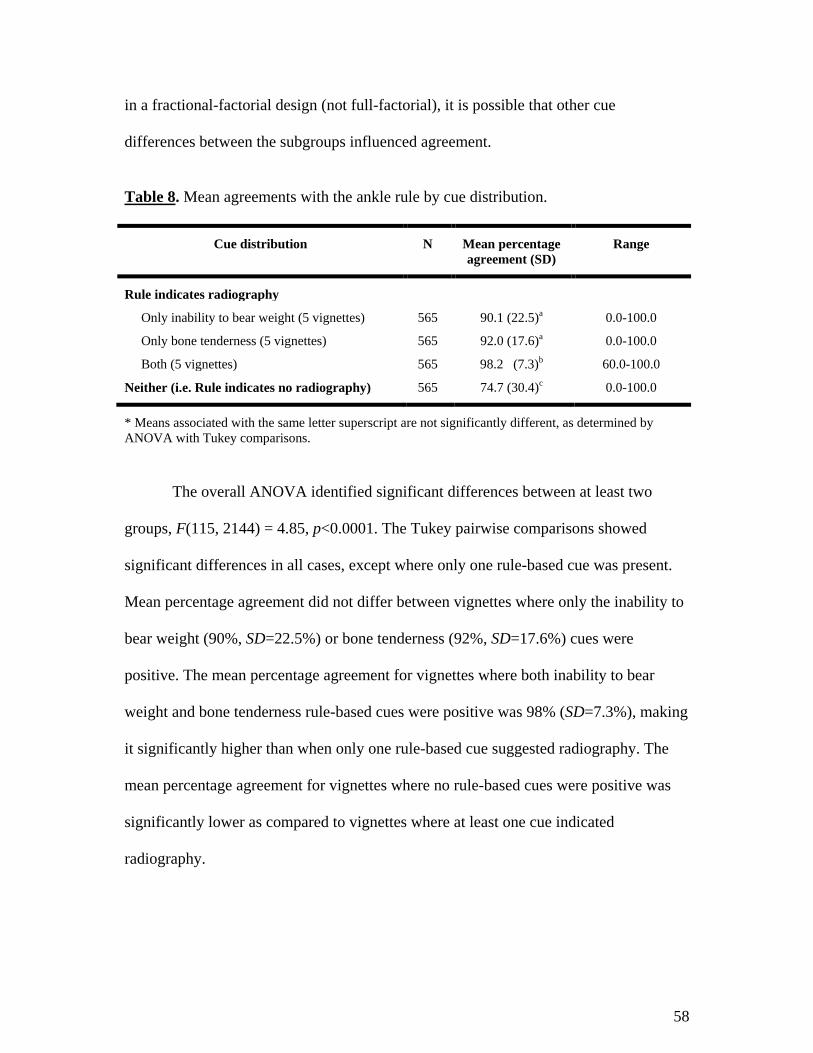
58
in a fractional-factorial design (not full-factorial), it is possible that other cue
differences between the subgroups influenced agreement.
Table 8. Mean agreements with the ankle rule by cue distribution.
Cue distribution N Mean percentage agreement (SD)
Range
Rule indicates radiography
Only inability to bear weight (5 vignettes) 565 90.1 (22.5)a 0.0-100.0
Only bone tenderness (5 vignettes) 565 92.0 (17.6)a 0.0-100.0
Both (5 vignettes) 565 98.2 (7.3)b 60.0-100.0
Neither (i.e. Rule indicates no radiography) 565 74.7 (30.4)c 0.0-100.0
* Means associated with the same letter superscript are not significantly different, as determined by ANOVA with Tukey comparisons.
The overall ANOVA identified significant differences between at least two
groups, F(115, 2144) = 4.85, p<0.0001. The Tukey pairwise comparisons showed
significant differences in all cases, except where only one rule-based cue was present.
Mean percentage agreement did not differ between vignettes where only the inability to
bear weight (90%, SD=22.5%) or bone tenderness (92%, SD=17.6%) cues were
positive. The mean percentage agreement for vignettes where both inability to bear
weight and bone tenderness rule-based cues were positive was 98% (SD=7.3%), making
it significantly higher than when only one rule-based cue suggested radiography. The
mean percentage agreement for vignettes where no rule-based cues were positive was
significantly lower as compared to vignettes where at least one cue indicated
radiography.
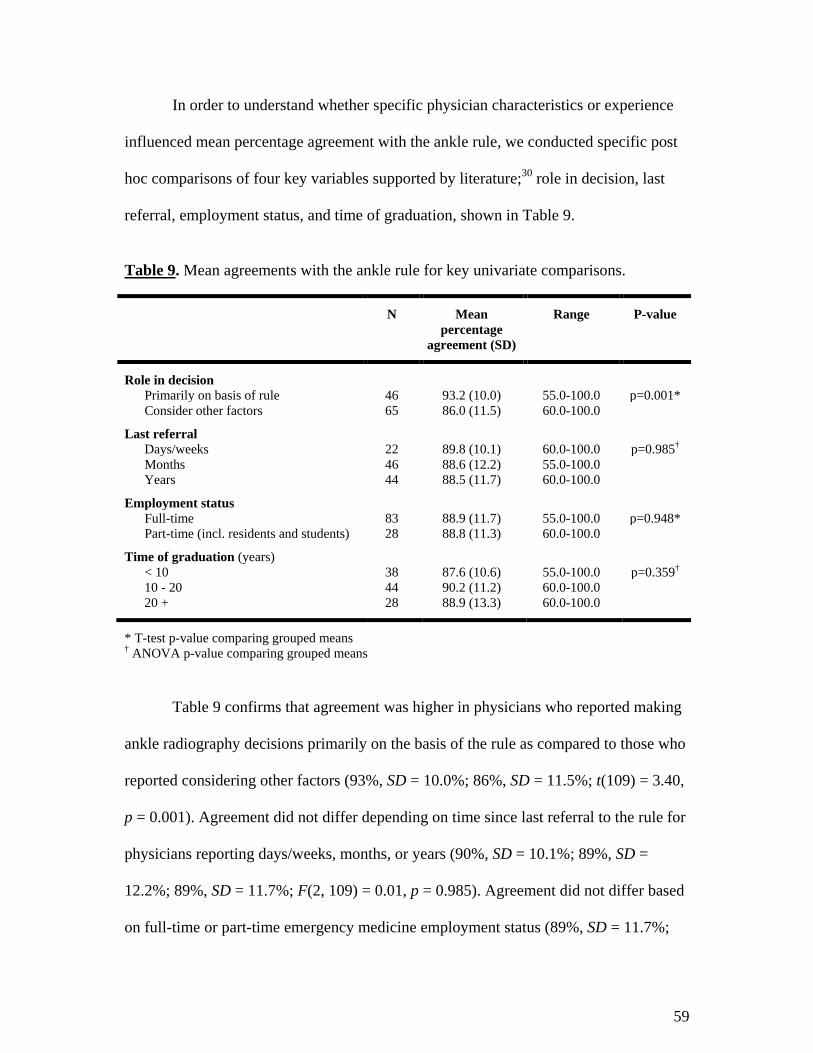
59
In order to understand whether specific physician characteristics or experience
influenced mean percentage agreement with the ankle rule, we conducted specific post
hoc comparisons of four key variables supported by literature;30 role in decision, last
referral, employment status, and time of graduation, shown in Table 9.
Table 9. Mean agreements with the ankle rule for key univariate comparisons.
N Mean percentage
agreement (SD)
Range P-value
Role in decision
Primarily on basis of rule 46 93.2 (10.0) 55.0-100.0 p=0.001* Consider other factors 65 86.0 (11.5) 60.0-100.0
Last referral
Days/weeks 22 89.8 (10.1) 60.0-100.0 p=0.985† Months 46 88.6 (12.2) 55.0-100.0 Years 44 88.5 (11.7) 60.0-100.0
Employment status
Full-time 83 88.9 (11.7) 55.0-100.0 p=0.948* Part-time (incl. residents and students) 28 88.8 (11.3) 60.0-100.0
Time of graduation (years)
< 10 38 87.6 (10.6) 55.0-100.0 p=0.359† 10 - 20 44 90.2 (11.2) 60.0-100.0 20 + 28 88.9 (13.3) 60.0-100.0
* T-test p-value comparing grouped means † ANOVA p-value comparing grouped means
Table 9 confirms that agreement was higher in physicians who reported making
ankle radiography decisions primarily on the basis of the rule as compared to those who
reported considering other factors (93%, SD = 10.0%; 86%, SD = 11.5%; t(109) = 3.40,
p = 0.001). Agreement did not differ depending on time since last referral to the rule for
physicians reporting days/weeks, months, or years (90%, SD = 10.1%; 89%, SD =
12.2%; 89%, SD = 11.7%; F(2, 109) = 0.01, p = 0.985). Agreement did not differ based
on full-time or part-time emergency medicine employment status (89%, SD = 11.7%;
60
89%, SD = 11.3%; t(109) = 0.07, p = 0.948). Agreement did not differ as a result of
time of graduation from medical school for those who graduated <10, 10-20, or 20+
years ago (88%, SD = 10.6%; 90%, SD = 11.2%; 89%, SD = 13.3%; F(2, 107) = 1.03, p
= 0.359).
Interpretation
Overall, the findings show that the rate of agreement was quite high, but not
perfect, at 89%; this indicates that physicians, on average, were not in line with the
ankle rule in 11% of vignettes. In 94% of vignettes that indicated radiography, the
emergency physicians would have ordered radiography; however, this means that 6% of
hypothetical patients requiring radiography would not have received an x-ray, and could
have potentially left the emergency department with an undiagnosed fracture. In 75% of
vignettes that did not indicate radiography, the emergency physicians would not have
ordered radiography; however, this means that 25% of hypothetical patients not
requiring x-rays would have been exposed to unnecessary, and potentially harmful
diagnostic testing.
It appears that physician radiography decisions were guided by rule-based cues,
but perhaps not exactly as intended by the ankle rule. Physicians were more likely to
order radiography when both rule-based cues were present, and ordered fewer
radiographies when only one rule-based cue was positive in the vignettes. The ankle
rule indicates radiography whether one or two of the rule-based cues are positive; this
means that either cue on its own is sufficient. Based on the data, it appears that

61
physicians may have interpreted the presence of both cues as cumulative evidence, and
as a result attributed a higher risk of fracture and ordered radiography more frequently.
Based on the post hoc analyses, imperfect agreement can be most attributed to
physicians’ self-reported role of the Ottawa Ankle Rules in radiography decision-
making, which was the only comparison that had an associated p-value of < 0.05. The
significant difference between the two self-report groups is valuable for establishing
target groups for Ottawa Ankle Rules training.
Results: Research Question 2. (A) Do cues based on the ankle rule have a greater
impact on physician judgment than non-rule-based cues? (B) With regard to non-rule-
based cues, do related cues have a greater impact on physician judgment than
unrelated cues?
Table 10. Mean relative weights for all cues with bootstrapped 95% confidence intervals. N=113. Mean relative weights were adjusted to add to 100.
Cue Mean relative weights* Bootstrapped 95% confidence intervals
Rule-based 55.4 53.1 – 57.7 Inability to bear weight 27.9 26.4 – 29.5 Bone tenderness 27.5 26.0 – 29.0
Non-rule-based 44.6 42.3 – 46.9
Related 26.0 24.5 – 27.6 Marked swelling / bruising 9.4 8.5 – 10.5 Age 8.9 7.8 – 10.0 Limited range of motion 7.7 6.8 – 8.6
Unrelated 18.5 17.1 – 20.0 Previous fracture 7.6 6.6 – 8.6 Cracking sound 5.7 5.0 – 6.5 Gender 5.2 4.6 – 5.8
Bold text indicates cumulative mean relative weights by combined cue type. * Relative weight was calculated by rwβi = [|βi|/(Σk
i=1 |βi|)]*100.
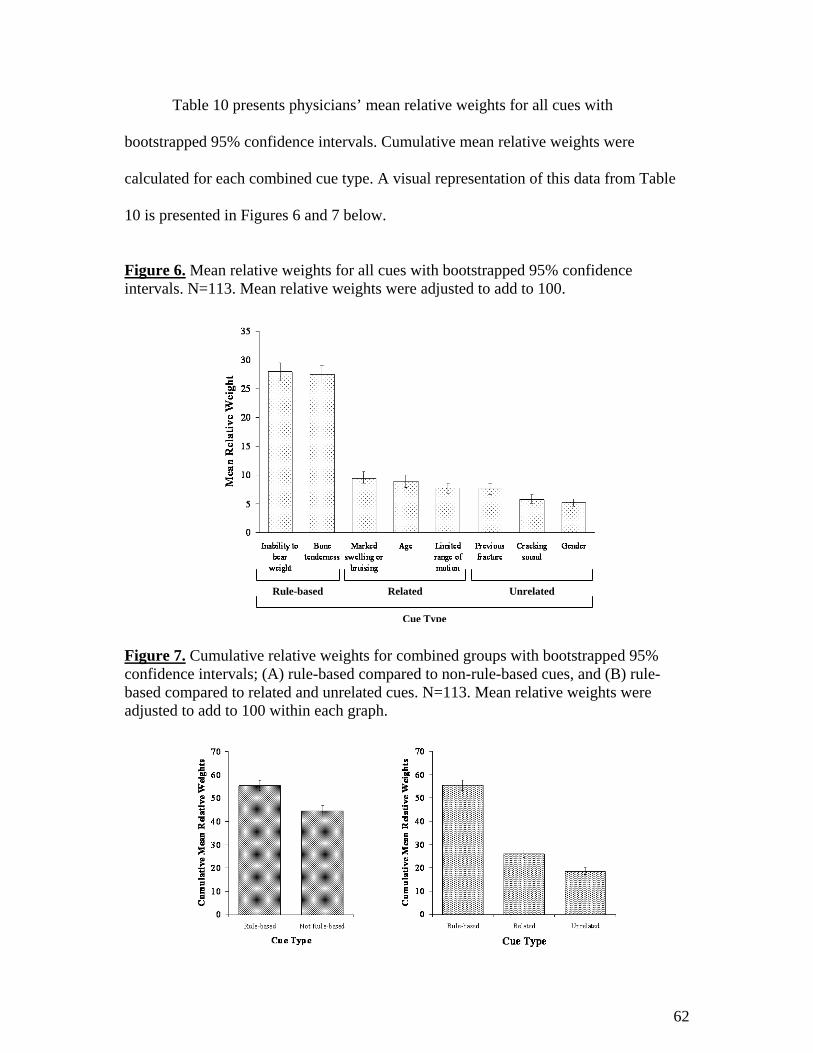
62
Table 10 presents physicians’ mean relative weights for all cues with
bootstrapped 95% confidence intervals. Cumulative mean relative weights were
calculated for each combined cue type. A visual representation of this data from Table
10 is presented in Figures 6 and 7 below.
Figure 6. Mean relative weights for all cues with bootstrapped 95% confidence intervals. N=113. Mean relative weights were adjusted to add to 100.
Figure 7. Cumulative relative weights for combined groups with bootstrapped 95% confidence intervals; (A) rule-based compared to non-rule-based cues, and (B) rule-based compared to related and unrelated cues. N=113. Mean relative weights were adjusted to add to 100 within each graph.
Rule-based Unrelated Related
Cue Type
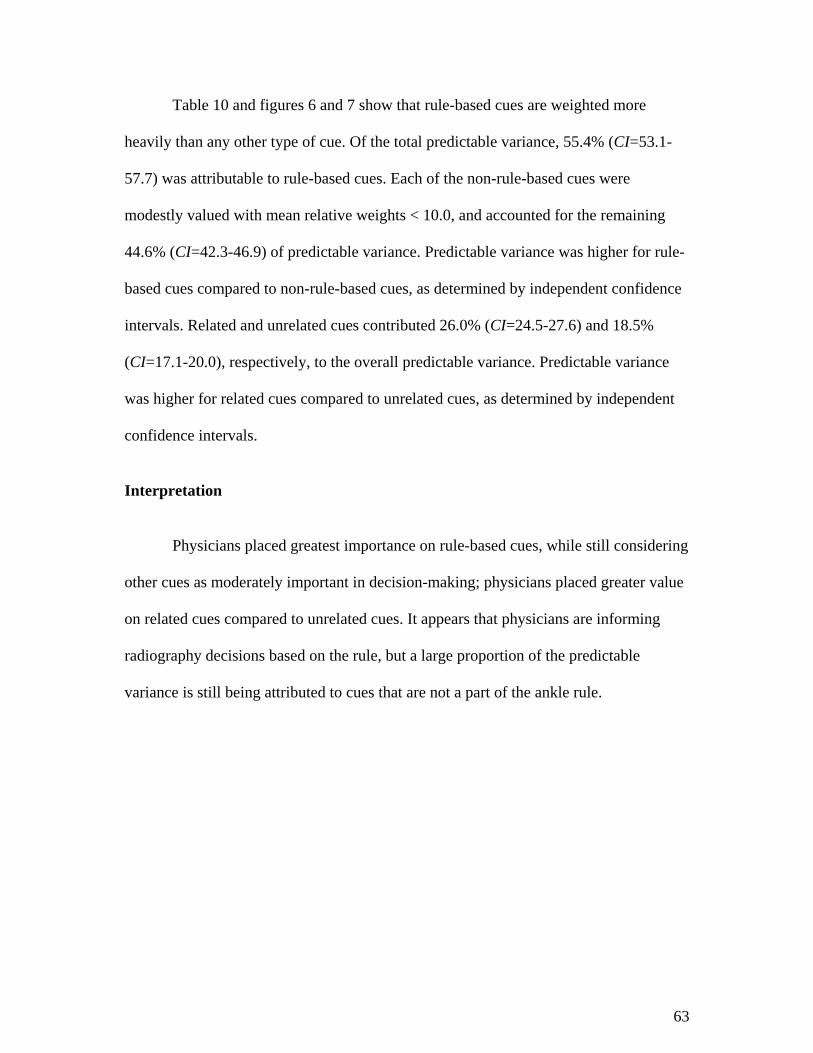
63
Table 10 and figures 6 and 7 show that rule-based cues are weighted more
heavily than any other type of cue. Of the total predictable variance, 55.4% (CI=53.1-
57.7) was attributable to rule-based cues. Each of the non-rule-based cues were
modestly valued with mean relative weights < 10.0, and accounted for the remaining
44.6% (CI=42.3-46.9) of predictable variance. Predictable variance was higher for rule-
based cues compared to non-rule-based cues, as determined by independent confidence
intervals. Related and unrelated cues contributed 26.0% (CI=24.5-27.6) and 18.5%
(CI=17.1-20.0), respectively, to the overall predictable variance. Predictable variance
was higher for related cues compared to unrelated cues, as determined by independent
confidence intervals.
Interpretation
Physicians placed greatest importance on rule-based cues, while still considering
other cues as moderately important in decision-making; physicians placed greater value
on related cues compared to unrelated cues. It appears that physicians are informing
radiography decisions based on the rule, but a large proportion of the predictable
variance is still being attributed to cues that are not a part of the ankle rule.
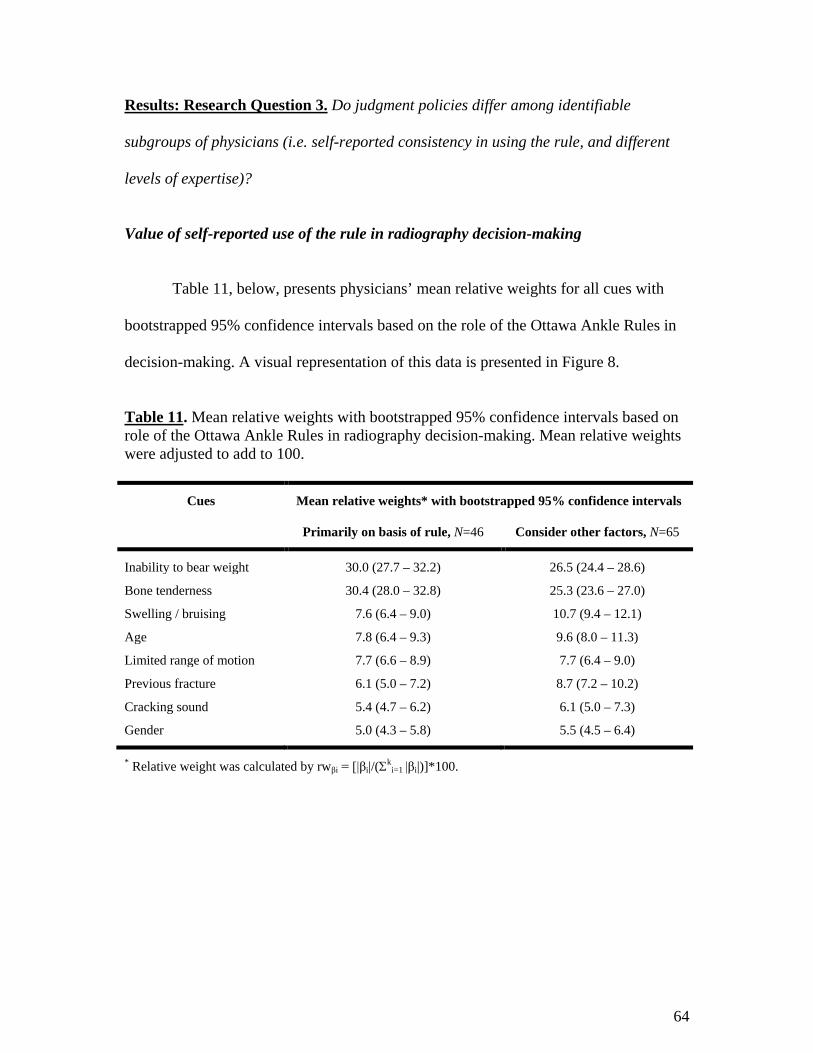
64
Results: Research Question 3. Do judgment policies differ among identifiable
subgroups of physicians (i.e. self-reported consistency in using the rule, and different
levels of expertise)?
Value of self-reported use of the rule in radiography decision-making
Table 11, below, presents physicians’ mean relative weights for all cues with
bootstrapped 95% confidence intervals based on the role of the Ottawa Ankle Rules in
decision-making. A visual representation of this data is presented in Figure 8.
Table 11. Mean relative weights with bootstrapped 95% confidence intervals based on role of the Ottawa Ankle Rules in radiography decision-making. Mean relative weights were adjusted to add to 100.
Cues Mean relative weights* with bootstrapped 95% confidence intervals
Primarily on basis of rule, N=46 Consider other factors, N=65
Inability to bear weight 30.0 (27.7 – 32.2) 26.5 (24.4 – 28.6)
Bone tenderness 30.4 (28.0 – 32.8) 25.3 (23.6 – 27.0)
Swelling / bruising 7.6 (6.4 – 9.0) 10.7 (9.4 – 12.1)
Age 7.8 (6.4 – 9.3) 9.6 (8.0 – 11.3)
Limited range of motion 7.7 (6.6 – 8.9) 7.7 (6.4 – 9.0)
Previous fracture 6.1 (5.0 – 7.2) 8.7 (7.2 – 10.2)
Cracking sound 5.4 (4.7 – 6.2) 6.1 (5.0 – 7.3)
Gender 5.0 (4.3 – 5.8) 5.5 (4.5 – 6.4)
* Relative weight was calculated by rwβi = [|βi|/(Σki=1 |βi|)]*100.

65
Figure 8. Mean relative weights for all cues with bootstrapped 95% confidence intervals based on role of the Ottawa Ankle Rules in radiography decision-making. Mean relative weights were adjusted to add to 100.
Table 12, below, and its visual representation (Figure 9) summarize the above
table and figure to concisely address the research question.
Table 12. Summary of mean relative weights by cue type with bootstrapped 95% confidence intervals based on role of the Ottawa Ankle Rules in radiography decision-making. Mean relative weights were adjusted to add to 100.
Cue type Mean relative weights* with bootstrapped 95% confidence intervals
Primarily on basis of rule, N=46
Consider other factors, N=65
Rule-based 60.3 (57.7 – 62.8) 51.8 (48.6 – 54.9)
Non-rule-based
Related 23.1 (21.2 – 25.0) 28.0 (26.0 – 30.1)
Unrelated 16.5 (14.8 – 18.2) 20.2 (18.1 – 22.3)
* Relative weight was calculated by rwβi = [|βi|/(Σki=1 |βi|)]*100.
Rule-based Unrelated Related
Cue Type

66
Figure 9. Summary of mean relative weights by cue type with bootstrapped 95% confidence intervals based on role of the Ottawa Ankle Rules in radiography decision-making. Mean relative weights were adjusted to add to 100.
Figure 9 shows that rule-based cues were weighted more heavily by physicians
who reported making decisions primarily on the basis of the Ottawa Ankle Rules
compared to those who reported considering other factors (60.3, CI=57.7-62.8; 51.8,
CI=48.6-54.9; determined by independent confidence intervals). Conversely, related
cues were more valued by physicians who reported considering other factors compared
to those who primarily based decisions on the rules (28.0, CI=26.0-30.1; 23.1, CI=21.2-
25.0; determined by independent confidence intervals). There was no evidence of a
significant difference between the two groups for unrelated cue use (20.2, CI=18.1-22.3
vs. 16.5, CI=14.8-18.2; determined by overlapping confidence intervals).
67
Interpretation
Overall, there was a clear judgment policy difference between physicians who
self-reported primarily making decisions on the basis of the Ottawa Ankle Rules and
those who considered other factors in the decision-making process. Physicians who self-
reported primarily using the Ottawa Ankle Rules were, in fact, making better use of
rule-based cues and placing less value on related cues, as compared to physicians who
self-reported considering other factors. The significant difference between the two self-
report groups is valuable for establishing target groups for Ottawa Ankle Rules training.
Role of physician expertise in radiography decision-making
Table 13, on the next page, presents physicians’ mean relative weights for all
cues with associated 95% confidence intervals and ranges based on time of graduation
from medical school in years. A visual representation of this data is presented in Figure
10.
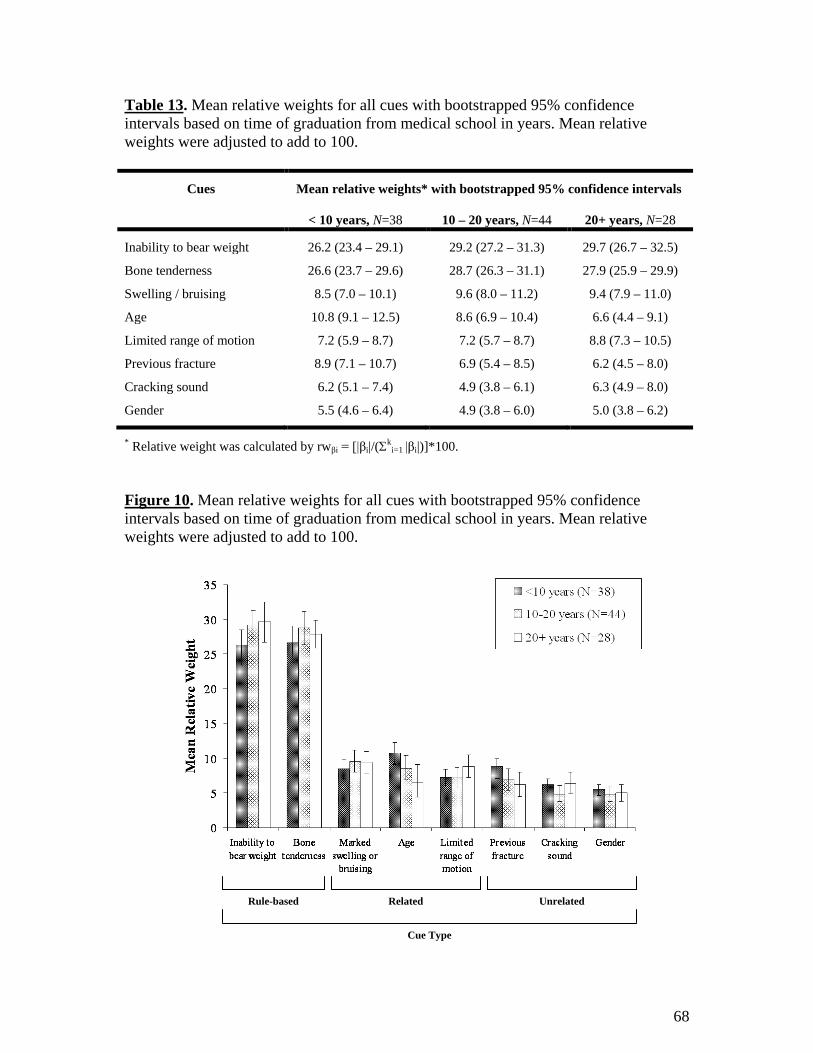
68
Table 13. Mean relative weights for all cues with bootstrapped 95% confidence intervals based on time of graduation from medical school in years. Mean relative weights were adjusted to add to 100.
Cues Mean relative weights* with bootstrapped 95% confidence intervals
< 10 years, N=38 10 – 20 years, N=44 20+ years, N=28
Inability to bear weight 26.2 (23.4 – 29.1) 29.2 (27.2 – 31.3) 29.7 (26.7 – 32.5)
Bone tenderness 26.6 (23.7 – 29.6) 28.7 (26.3 – 31.1) 27.9 (25.9 – 29.9)
Swelling / bruising 8.5 (7.0 – 10.1) 9.6 (8.0 – 11.2) 9.4 (7.9 – 11.0)
Age 10.8 (9.1 – 12.5) 8.6 (6.9 – 10.4) 6.6 (4.4 – 9.1)
Limited range of motion 7.2 (5.9 – 8.7) 7.2 (5.7 – 8.7) 8.8 (7.3 – 10.5)
Previous fracture 8.9 (7.1 – 10.7) 6.9 (5.4 – 8.5) 6.2 (4.5 – 8.0)
Cracking sound 6.2 (5.1 – 7.4) 4.9 (3.8 – 6.1) 6.3 (4.9 – 8.0)
Gender 5.5 (4.6 – 6.4) 4.9 (3.8 – 6.0) 5.0 (3.8 – 6.2)
* Relative weight was calculated by rwβi = [|βi|/(Σki=1 |βi|)]*100.
Figure 10. Mean relative weights for all cues with bootstrapped 95% confidence intervals based on time of graduation from medical school in years. Mean relative weights were adjusted to add to 100.
Rule-based Unrelated Related
Cue Type
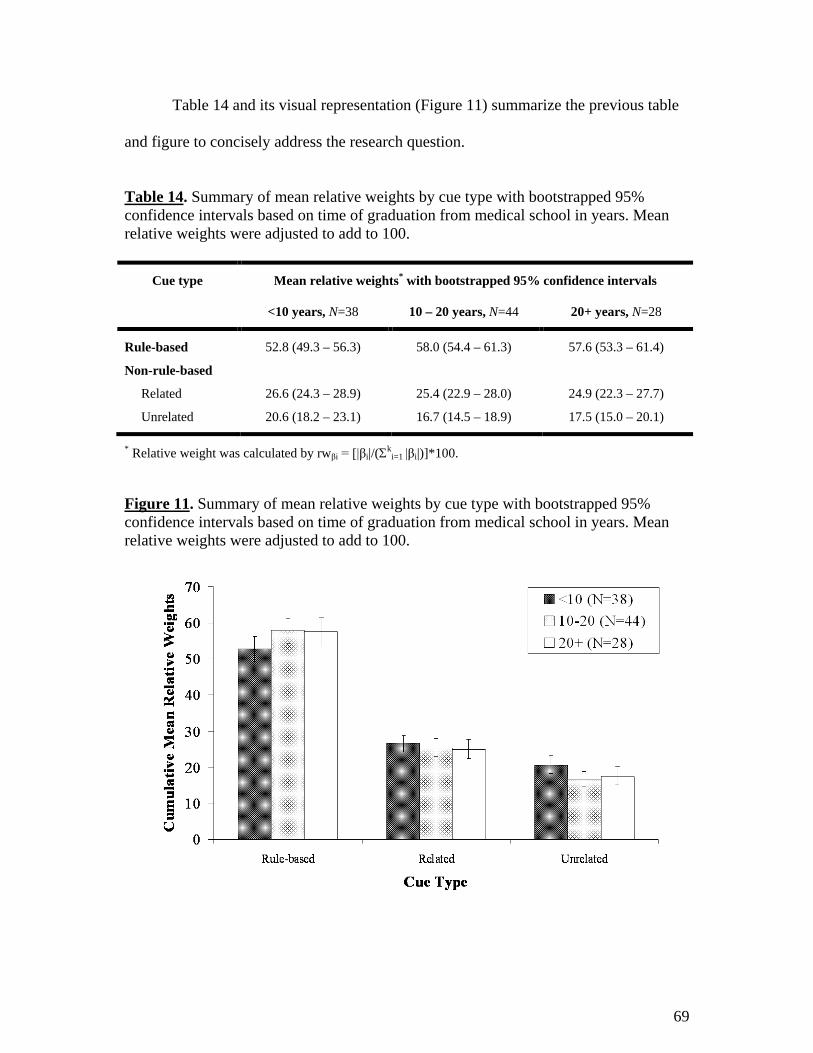
69
Table 14 and its visual representation (Figure 11) summarize the previous table
and figure to concisely address the research question.
Table 14. Summary of mean relative weights by cue type with bootstrapped 95% confidence intervals based on time of graduation from medical school in years. Mean relative weights were adjusted to add to 100.
Cue type Mean relative weights* with bootstrapped 95% confidence intervals
<10 years, N=38 10 – 20 years, N=44 20+ years, N=28
Rule-based 52.8 (49.3 – 56.3) 58.0 (54.4 – 61.3) 57.6 (53.3 – 61.4)
Non-rule-based
Related 26.6 (24.3 – 28.9) 25.4 (22.9 – 28.0) 24.9 (22.3 – 27.7)
Unrelated 20.6 (18.2 – 23.1) 16.7 (14.5 – 18.9) 17.5 (15.0 – 20.1)
* Relative weight was calculated by rwβi = [|βi|/(Σki=1 |βi|)]*100.
Figure 11. Summary of mean relative weights by cue type with bootstrapped 95% confidence intervals based on time of graduation from medical school in years. Mean relative weights were adjusted to add to 100.
70
Figure 11 shows that there was no evidence of any significant differences
between time of graduation groups and any of the three cue types. Rule-based cues were
equally valued by physicians who graduated <10, 10-20, and 20+ years ago (58.2,
CI=49.3-56.3; 58.0, CI=54.4-61.3; 57.6, CI=53.3-61.4; determined by overlapping
confidence intervals). This was also the case for related cues based on graduation
groups of <10, 10-20, and 20+ years (26.6, CI=24.3-28.9); 25.4, CI=22.9-28.0; 24.9,
CI=22.3-27.7; determined by overlapping confidence intervals). Unrelated cues were,
again, not significantly different in physicians who graduated <10, 10-20, and 20+ years
ago (20.6, CI=18.2-23.1; 16.7, CI=14.5-18.9; 17.5, CI=15.0-20.1; determined by
overlapping confidence intervals).
Interpretation
Overall, there was no indication of any significant differences in physician
judgment policies based on time of graduation from medical school. All three groups
appeared to equally inform decisions using rule-based, related, and unrelated cues. Our
results indicate that physician time of graduation should not be used to identify target
groups for Ottawa Ankle Rules training.
71
DISCUSSION
The global objective of this thesis was to better understand how Canadian
emergency department physicians use the ankle rule to inform ankle radiography
decision-making. Despite previous survey work showing that physicians report using
the rule, tests of memory indicated that many physicians seem unable to recall
important cues comprising the rule.30 The Social Judgment Analysis approach allowed
us to examine exactly which cues seemed to be guiding radiography decisions, both for
each individual respondent, and on a group level. Before discussing the more complex
Lens Model analyses, much can be learned from examining simple agreement with the
rule.
Basic agreement with the ankle rule
Simple agreement with the rule allowed us to gauge health care fidelity of the
ankle rule by evaluating delivery of necessary care and exclusion of unnecessary care.19
It is critical to ensure that emergency physicians are appropriately applying the ankle
rule to avoid missing potential fractures, while minimizing resources wasted on
unnecessary radiographies. Consequences may arise in cases where the rule is not
applied as intended for various reasons, not limited to misremembering, misinterpreting,
or unreliably applying the rule.30 Large quantities of relatively inexpensive, but
unnecessary radiographies can add up to countless wasted healthcare dollars.28 On the
other hand, missed fractures may cause decreased patient satisfaction, increased patient
risk or discomfort due to potential medical complications, and as a result, rises in
72
medical treatment and medico-legal costs.45 The ankle rule only maintains almost
perfect sensitivity when applied as intended by its developers.
Given that agreement in cases not requiring radiography was 75%, an additional
25% of hypothetical patients not requiring radiography would have received
radiography, and been exposed to unnecessary and potentially harmful diagnostic
testing. By ordering unnecessary radiographies, these physicians are undermining the
key goals of the ankle rule implementation. The rule was created and implemented to
reduce the number of unnecessary radiographies, while limiting associated medical
costs, without sacrificing patient safety or satisfaction.29 Limiting resources wasted on
unnecessary radiographies has great implications for long-term sustainability of the
healthcare system and ordering unnecessary radiographies results in lost opportunity
costs that would have been better spent on beneficial diagnostic testing and/or medical
treatments.
Despite an overall tendency to order too many radiographies, there were still
cases where physicians may have missed important fractures by not ordering
radiographies when indicated by the ankle rules. Given that agreement in cases where
radiography was necessary was 94%, 6% of hypothetical patients requiring radiography
would not have received it, and potentially left the emergency department with an
undiagnosed fracture.
Literature has shown that approximately 11.5-14.5% of patient cases have
clinically significant fractures,44 and if the ankle rule is applied appropriately, then
approximately 40% of blunt ankle trauma patients should be sent for a radiographic

73
series.29 These numbers indicate that physicians in this study could have missed 0.3% of
significant fractures [40%*0.06*0.13] by not ordering radiographies when indicated; in
more relatable terms, 3 out of 1000 patients entering the emergency department with
blunt ankle trauma could have left the emergency department with an undiagnosed
fracture. Missed opportunities such as this undermine the value of the ankle rule and
highlight the risks of implementing clinical decision rules.
The physicians’ overall rate of agreement with the ankle rule was quite high, but
not perfect. Although achieving perfect agreement with the ankle rule is not a feasible
goal,19 it appears that there is ample opportunity to improve physician adherence to the
rule. The overall agreement was 89% (SD=11.5%), which indicates that physicians did
not agree with the rule in 11% of cases. Agreement was significantly higher when the
ankle rule indicated radiography at 94%, as compared to cases where the rule did not
indicate radiography at 75%, which can be attributed to a physician general tendency to
over-order radiographies. Literature suggests that not only is physician over-ordering a
persistent problem, but it is also increasing over time. A study conducted by Dowdall et
al (2011) found that physicians’ radiography rates have been increasing by
approximately 3% per year from 2001 to 2007 (after adjustment for total proportion of
significant fractures). 44
Summary
Simple agreement can be used as a yard stick to measure health care fidelity of
the ankle rule and can highlight situations where physicians order unnecessary
radiographies, or do not order radiographies when they are indicated by the ankle rule.

74
Simple agreement, however, cannot explain the reasons for agreement or disagreement
with the rule underlying radiography decisions.
Fit of the Lens Model
Social Judgment Analysis was chosen because it provided a way to deconstruct
physician decisions into component parts, or cues. This provided a better understanding
of how physicians made decisions, as opposed to how they reported making decisions,
and described how the ankle rule fits into individual decision-making processes. Social
Judgment Analysis is a novel way of addressing fidelity issues in health care, by
evaluating use of individual cues (i.e. rule-based and non-rule-based) in the decision-
making process.
The fit of the Lens Model was assessed to determine the value of using Social
Judgment Analysis for this thesis. The overall consistency (Rs) of the model was high,
accounting for 73% of the total variance of the model. In other words, 73% of the
variance was attributable to the eight cues chosen for the judgment task. Despite limited
numbers and types of cues, the close fit of the Lens Model confirmed that the
appropriate cues were chosen for inclusion in the vignettes, and that the resulting Lens
Model can support robust analyses for this thesis.
Social Judgment Analysis
Social Judgment Analysis required the transformation of each crude cue weight
to produce a new set of relative weights that partitioned 100% of the predictable
75
variation, where each weight became a proportion of this total.60 It is evident that rule-
based cues were weighted far more heavily than any non-rule-based cues.
Physicians placed greatest importance on the two rule-based cues (with a mean
relative weights of around 28 for both bone tenderness and inability to bear weight),
which accounted for approximately 55% of predictable variance. More specifically,
eighty-eight physician judgment policies (78%; Figure 5, page 48) valued the two rule-
based cues as most important in decision-making. Each of the six non-rule-based cues
were modestly valued with mean relative weights < 10.0, and accounted for the
remaining 45% of predictable variance. Overall, physicians were informing radiography
decisions based on the rule, but a large proportion of the predictable variation could still
be attributed to cues that were not a part of the ankle rule. Specifically, twenty-five
physician judgment policies (22%; 19+6 of 113 in Figure 5, pages 49-50) valued at least
one non-rule-based cue as equally or more important in decision-making than one of the
rule-based cues. Our finding were consistent with Brehaut et al (2005), which found
that non-rule-based cues were considered by physicians when making radiography
decisions.30
Despite placing considerable value on non-rule-based cues, it is important that
physicians were more likely to guide radiography decision-making based on related
cues (with a mean relative weight of 26.0), as compared to unrelated cues (with a mean
relative weight of 18.5). If the Ottawa Ankle Rules was applied as intended in this
vignette exercise then both related and unrelated cues would not contribute to
predictable variation based on the study design.
76
However in real-world practice, related cues are correlated with the rule-based
cues, as both types of cues are associated with the risk of fracture.29 As a result, it is
possible that physicians’ policies reflect the fact that they pay attention to other related
cues because they are correlated with the presence of fracture outside of our vignettes.
In this way, physicians can have high agreement and arrive at the same radiography
decision using different cues. In Social Judgment Analysis literature, this phenomenon
is known as vicarious functioning, which is the redundant characteristic of the
environment. Each cue has a certain correlation to the environment, which contributes
to the environmental predictability. The environmental predictability is not calculated
simply as a sum of the individual correlations of all cues; in reality, overlaps occur
between individual cues, which are providing the same information.
Relying on related cues may be a valid and useful way to supplement
assessments of blunt ankle trauma in cases where assessment of rule-based cues is
inconclusive; given that bone tenderness and inability to bear weight can be somewhat
subjective measurements, it may be appropriate to consider related cues to inform
radiography decision-making in special cases. However, when appropriate, the rule
should be applied as intended, to minimize wasted resources while maintaining almost
perfect sensitivity for identifying ankle fractures.
Physicians’ misconceptions about unrelated cues guided radiography decision-
making. Our results showed that unrelated cues accounted for 18.5% of predictable
variance. If the Ottawa Ankle Rules was applied as intended, then unrelated cues would
not contribute to predictable variance. Unrelated cues are neither correlated with rule-
77
based cues nor risk of fracture.29 It can be dangerous for physicians to guide
radiography decision-making based on unrelated cues, whilst overlooking rule-based
cues.
Despite the fact that over the whole sample rule-based cues appeared to drive
decision-making, there was a substantial minority for whom decisions appeared to be
guided by non-rule-based factors (22%; 19+6 of 113 in Figure 5, pages 49-50). For
example, one responder did not value rule-based cues, which only accounted for 18% of
their predictable variance, but highly valued non-rule-based cues, with related cues
contributing 46% and unrelated cues contributing 36% of the predictable variance. As a
result, the responder missed five opportunities to provide hypothetical patients with
radiography when the ankle rule indicated doing so, and the hypothetical patients may
have left the emergency department with an undiagnosed fracture. It is critical for
physicians to be aware of which cues are, in fact, associated with the risk of fracture;
this is why the ankle rule was created to inform ankle radiography decision-making. It
is important to ensure that emergency physicians are appropriately using the ankle rule
to avoid missing fractures.
Factors influencing physician agreement
The ankle rule indicates whether or not to order ankle radiography based on two
rule-based cues; a patient should be sent for an ankle radiographic series if there is any
bone tenderness, and/or inability to bear weight. The ankle rule indicates radiography
whether one or two of the rule-based cues are positive; in effect, either cue on its own is
sufficient to suspect a fracture. If the rule is applied as intended by the developers,

78
radiography rates should not be dependent on whether one or two rule-based cues are
positive.
However, physician agreement was, in fact, influenced by the number of
positive rule-based cues presented in the vignettes; agreement was higher in vignettes
where both of the rule-based cues were positive at 98%, as compared to when only one
of the rule-based cues was positive (90% for inability to bear weight, and 92% for bone
tenderness). Based on the differences in agreement, it appears that physicians may have
interpreted the presence of both cues as cumulative evidence, attributed a higher risk of
fracture, and as a result ordered radiography more frequently. This notion of cumulative
evidence may be consistent with an implicit rule that more positive cues indicates a
greater need for radiography and may extend to non-rule-based cues, which would
explain the general tendency to over-order radiographies.
Value of self-reported use of the rule in radiography decision-making
Of four univariate comparisons, only one physician practice characteristic was
found to influence agreement; agreements were higher in physicians who reported that
the Ottawa Ankle Rules had a more central role in decision-making (93%), as compared
to physicians who considered other factors in their decision-making process (86%).
Physician judgment policies also differed based on whether physicians self-
reported making decisions primarily on the basis of the rule or considering other factors.
Physicians who reported that the Ottawa Ankle Rules had a more central role in their
decision-making were, in fact, more likely to use rule-based cues and place less value

79
on non-rule-based cues, as compared to those who considered other factors in decision-
making.
Physicians who self-reported primarily basing decisions on the rule still
considered non-rule-based cues as moderately important in decision-making; for this
sub-set of physicians, each rule-based cue only contributed a mean relative weight of
30. Physician self-reports appeared to over-emphasize use of the Ottawa Ankle Rules;
mean relative weights of 30 (or 60 total) may be considered consistent with primarily
applying the rule-based cues, but not necessarily with primarily applying the rule, as
these weights do not demonstrate appropriate use of the rule as intended, since much
weight is still attributable to non-rule-based cues. These findings are consistent with
past studies, which presented a disconnect between the behaviors physicians self-
reported, and what actually occurred in clinical practice.61 Such discrepancies are
generally anticipated based on social desirability effects (i.e. providing responses that
will be viewed favorably) and/or errors in recall (e.g. forgetting an event, or
misremembering it as occurring more recently or more frequently than it actually did).61
Brehaut et al (2005) found that only 31% of emergency department physicians
were able to remember all components of the Ottawa Ankle Rules.30 Given that our
sample is from the same Canadian Association of Emergency Physicians population,
and the survey question asked was the same, it is likely that the same proportion of
physicians in the current sample would be able to remember all components of the rule.
This suggests that not even all responders in our study who reported a central role of the
Ottawa Ankle Rules in decision-making would be able to accurately describe the ankle

80
rule. This lack of knowledge may explain the disconnect between physician self-
reported and actual behaviors. Although physician self-reports should not be used to
gauge true adherence to the rule, it appears that self-reports can be useful in gauging
relative adherence between physicians. It appears that when physicians self-report using
the rule, they may actually be reporting use or value of rule-based cues in decision-
making.
Role of physician expertise in radiography decision-making
Physician judgment policies did not differ based on when they attended and
graduated from medical school. We hypothesized that physicians with more expertise
(acquired over time through clinical practice) may have increased confidence in
personal decision-making, and as result focus less on strictly following clinical decision
rules. There was no indication of any significant differences in cue use. Our findings did
not support literature that showed that older, more experienced physicians are less likely
to uptake guidelines, such as clinical decision rules.62 Successful implementation of the
ankle rule through various strategies may explain why this study did not find any
differences. The rule is straightforward and easy to use, and it was developed and
validated using strict methodological standards. Such factors may be responsible for the
high uptake of the rule, and can be used to inform future interventions.
Generalizability of research findings
The Dillman Tailored Design Method was employed for mail-outs of the postal
surveys55 in an effort to increase standard response rates and subsequently reduce the
81
impact of potential non-responder bias. Non-responder bias occurs when the responders
are inherently different from non-responders based on one or more variables (such as
gender or socioeconomic status), which may influence the way in which they answer
survey questions. Our survey standard response rate was 46%, which fell short of the
Dillman projected response rate of 80% or greater,55 and possibly introduced non-
responder bias into the data.
Our findings were consistent with literature, which found no significant
differences with regard to demographic variables between first round responders and
late responders in physician populations.56 Research has shown that non-responder bias
may not be as important of a factor with physician surveys, as physicians are a very
small, unique subset of the general population, who have similar knowledge, training,
attitudes, beliefs, and as a result, similar behaviors.56 Though variations are present,
these differences do not impact survey response rates or non-responder biases to the
same degree as seen with the general population. Effectively, interpretation of physician
surveys with low response rates may be more generalizable compared to the general
population,56 which is positive, considering that physician survey response rates (mean
54%) tend to be significantly lower than general public survey response rates (mean
68%).56
To extrapolate these findings, it is plausible that non-response bias would be
even smaller amongst our sample in the current study, as all physicians were trained in
emergency medicine. Emergency medicine is a further subset of the medical profession,
and thus these individuals would have more in common with their emergency medicine

82
colleagues. To test this, we compared physician demographic, professional, and Ottawa
Ankle Rules practice information from our study to a previous study conducted by
Brehaut et al (2005), which sampled from the same population of members of the
Canadian Association of Emergency Physicians.30 Both surveys used independent
samples, as the Canadian Association of Emergency Physicians limited re-sampling of
the physicians contacted through the first mail-out survey. There was no evidence of
any significant differences between the two survey populations based on demographic,
professional, or practice characteristics. Taking this information into consideration, our
survey standard response rate of 46%, which accounts for approximately 8% of overall
Canadian Association of Emergency Physicians membership at the time of
administration, may be generalizable to all members.
In the event that our survey sample was not representative of the Canadian
Association of Emergency Physicians members, then we would be more likely to miss
physicians who are not interested in the Ottawa Ankle Rules, or those who actively
disagree with the rule. If this were the case, then our mean percentage agreement results
may have been inflated and our cue weights may have been skewed in favor of rule-
based cues.
Limitations
The interpretation of results is dependent on the extent to which the most
relevant variables to the decision were presented in the vignettes. This is true of all
studies, but particularly important in Lens Model studies, given the relative weight
approach to analyzing the data. Social Judgment Analysis limits judgment policies to

83
include only a particular set of cues, and research has suggested a maximum burden of
eight variables within each vignette.52 If not all appropriate cues are presented, then the
analyses will generate judgment cue weights that are not accurate compared to real-life
practice. All cues included in this study were chosen based on clear empirical evidence
from the Ottawa Ankle Rule derivation study that such clinical cues have or are
perceived to have diagnostic value by emergency department physicians.29;30 It appears
that the cues were chosen appropriately, as the non-rule-based cues explained 45% of
the predictable variance, which reinforced that the vignettes were capturing and
evaluating use of relevant non-rule-based cues. In addition, pilot testing supported that
the cues were clinically relevant, and responders rated the survey task as moderately
representative of real-world clinical scenarios with an average score of 6.1 (SD = 2.14)
on a scale of 1 to 10. Although responders suggested the inclusion of many external
factors (such as patient distress, medico-legal considerations, Workplace Safety and
Insurance Board claims, and degree of pain), the physicians did not suggest inclusion of
any additional clinical or patient history cues.
A number of limitations of this work related to the implementation of a
fractional-factorial survey design warrant consideration. The fractional-factorial design
is not consistent with the principle of representativeness. The proportion of vignettes
requiring radiography by Ottawa Ankle Rules standards in our survey was not
representative of real-world practice, and as a result overall agreement is likely an
overestimation of real-world agreement. Research has shown that if the Ottawa Ankle
Rules is applied appropriately, then approximately 40% of blunt ankle trauma patients
should be sent for a radiographic series.29 However, in our Social Judgment Analysis
84
survey, 75% of vignettes required radiography according to Ottawa Ankle Rules
standards. Adjusting for the difference in proportions, a crude estimate of the real-world
agreement would be 83% ([94%*0.4]+[75%*0.6]). This adjustment for proportions
assumes that the paper cases were highly representative of real-world scenarios, and can
be used as markers of real-world practice. The use of written clinical vignettes, similar
to the ones employed in this study, has been validated through the work of Peabody et
al (2000).51 Clinical vignettes have been shown to be effective measures of physician
competence and quality of administered care.
This study aimed to create vignettes that were as representative as possible, but
they are still simplifications of real-world decisions. Clinical practice is full of
complicating factors, each one of which might increase physician uncertainty enough to
prompt ordering radiography; the fact that physicians did not have perfect agreement in
these simplified cases means that the problem may be much greater in the real-world
practice.
This is not a limitation of Social Judgment Analysis itself, but of the fractional-
factorial design. Social Judgment Analysis can rely on more representative real-world
case mixes in vignettes; however, there are trade-offs to such an approach. For example,
such a design would have required more vignettes for each physician to complete,
resulting in a greater time commitment and potential decrease in both types of response
rates. In addition, real-world case mixes would make it difficult, if not impossible, to
measure variability of clinical cues that present rarely.56
85
The fractional-factorial design also lacked representativeness in that it did not
allow for all possible combinations of cues to be presented in the survey. A complete
factorial design of manipulated cues was not feasible due to exponential increases in the
number of vignettes required, resulting in a higher time commitment and potential
decrease in both types of response rates from physicians.56 Also, in such a design,
particular combinations of cues would not realistically occur in practice and inclusion of
such vignettes would undermine the representativeness of the survey task. Another
implication of our study design was that interactions between cues could not be
measured. Cues that are intercorrelated in the real world were not correlated in this
study, which undermined the representativeness of the survey judgment task. Cue
intercorrelations were omitted to allow for straightforward statistical analyses, where all
cues provided virtually independent contributions. For the purposes of the hypotheses
tested here, we were more interested in the internal validity of our results than external
validity, thus we implemented the fractional-factorial approach. Future work can
examine whether these findings generalize to more real-world case mixes.
Social Judgment Analysis is limited because this Lens Modeling technique relies
on multiple linear regression and assumes linearity, despite the possibility that judgment
policies may incorporate non-linear relationships.63 For example, research has shown
that physicians have a threshold, where low and medium levels of cues did not
influence decision-making, but high levels had an impact on decision-making.64 Our
study accommodated for the threshold effect by using standard decision-making cutoffs
to set dichotomous values for each variable, ensuring that one value was below and one
was above each threshold.
86
Given that our study employed the maximum suggested burden of twenty
vignettes per physician survey,52 we were unable to assess the clinical decision of
“would you order an ankle x-ray series for this patient?” using Social Judgment
Analysis methodology. Although this clinical decision is most relevant to real-world
practice, the dichotomous nature of the question did not provide sufficient power for
analyses.
Our study applied simple summary measures, rather than more comprehensive
clustering methodologies, to account for correlation among repeated responses to the
twenty vignettes from each physician. Given the small number of missing values (0.8%
of data entries), it is unlikely that applying cluster analyses would have influenced the
results in an important way.
Significance and future directions
Our results have shown that physician adherence to the ankle rule, even in
relatively simple vignettes, is not perfect and can be improved. Knowledge translation
interventions, informed by Graham’s Knowledge-to-Action Framework,4 can increase
emergency physician agreement with the ankle rule and use of rule-based cues.
Our study identified one practice characteristic that can be used to identify target
populations for ankle rule training. It would be most valuable to identify and target
physicians who consider external non-rule-based cues, especially unrelated cues, in
cases where direct application of the ankle rule is appropriate. No special instruments

87
are necessary to identify this subgroup; a simple self-report question can be used to
detect who would benefit most from further training.
Our study identified a variety of physician performance characteristics that can
be used to identify target populations at greater need of ankle rule training. These target
groups can be identified through formal testing using a vignette task, such as the one
employed in this study.
Physicians who demonstrate low agreement with the ankle rule, especially those
who demonstrate low agreement in cases where the rule indicates radiography, are
likely misremembering the rule. In such cases, targeting knowledge issues is valuable to
ensure that the physicians are able to identify (and subsequently use) rule-based cues as
primary information to guide decision-making. On the other hand, physicians who
demonstrate low agreement with the rule when radiography is not indicated may have
learned the rule, but oppose its application. For example, some physicians may believe
that radiography should always be used to rule out fracture, and may not understand or
fully appreciate the negative aspects of ordering unnecessary radiographies.
Interventions should target such uninformed beliefs.
Physicians who show higher agreement when both rule-based cues are present,
as compared to only one rule-based cue would benefit from additional training through
a simple refresher of how the rule should be applied. The intervention should
discourage the use of both cues as cumulative evidence, and emphasize that one positive
rule-based cue is sufficient to warrant radiography in blunt ankle trauma cases.
88
Interventions that target physicians who attribute a high percentage of
predictable variation (i.e. place significant weight) on cues that are not a part of the
ankle rule should focus on knowledge issues. This group should be educated about the
redundancy of relying on related cues and the lack of utility of using unrelated cues to
guide radiography decision-making.
In addition, further development of the Lens Modeling technique could lend
itself to a cognitive behavioral intervention. Physicians could complete a series of
clinical vignettes, similar to the ones employed in this study, and receive feedback
about what factors are driving their decisions after the completion of each vignette. The
feedback would present a graphical display of personal cue weights compared to
optimal cue weights, so that physicians could learn to adjust behaviors accordingly.
Such efforts have been successful in the past.65-67 Research has shown that cognitive
feedback is more effective at influencing physician behavior than outcome (i.e.
agreement) feedback.50
A study conducted by Poses et al (1992) assessed the value of a computerized
cognitive feedback intervention to improve adherence to a clinical decision rule that
predicts the probability of streptococcal pharyngitis.66 The cognitive feedback part of
the study employed a vignette fractional-factorial design similar to this thesis; however,
after each set of twelve cases the physicians received feedback in the form of a bar
graph comparing personal cue weights with optimal cue weights, so that they could
modifying their decision-making process to more closely match the optimal cue
weights.65 The intervention was successful at improving physician judgments and the
89
improvement was maintained for at least one year post-intervention.66 Given the similar
outcomes (teaching a clinical decision rule), populations (physicians) and methods
(fractional-factorial vignettes with 7 or 8 cues, each with two levels), suggests that this
type of cognitive feedback intervention might be effective for improving physician
adherence to the Ottawa Ankle Rules. However, the Poses (1992) study66 did not target
or evaluate behavior change, and as shown in the Knowledge-to-Action framework,4
increased knowledge and changing judgments may be only one part of the puzzle in
changing actual clinical behavior.
Clinical decision rules are meant to inform clinical decisions, and not to act as
hard-and-fast rules. Knowledge translation interventions aimed to decrease the number
of radiographies in cases where the rule does not indicate it should be approached with
care. The interventions should serve to educate and inform physicians about the ankle
rule, but also emphasize the role of clinical expertise in the decision-making process.
Clinical expertise is an integral part of evidence-based medicine,1 and necessary
for physicians to evaluate whether or not the Ottawa Ankle Rules can be applied in a
given case. Clinical expertise is invaluable in assessing blunt ankle injuries in cases
where exclusion criteria apply. Real-world cases are more complex than the vignettes
presented in our study, and there are likely various situations where it is appropriate to
order radiographies when the ankle rule does not indicate it. Further work, perhaps
based on real-world chart reviews, could examine when over-ordering as compared to
ankle rule standards is advisable. However, when appropriate, the rule should be
90
applied as intended, in an effort to minimize wasted resources while maintaining almost
perfect sensitivity for identifying ankle fractures.
Our findings can be expanded to the future design and assessment of clinical
decision rules in general. Our study supported literature30 that although physicians self-
report using a clinical decision rule, there is variability in what ‘using’ a rule really
means. Misuse of a clinical decision rule undermines its value and missed diagnoses (or
treatments) highlight the risks associated with implementing such rules. Future designs
of clinical decision rules should strongly consider potential misuse and consequences,
and how to effectively create and implement rules to ensure appropriate use. This thesis
has shown that Social Judgment Analysis is a viable method to evaluate cues
influencing physician decision-making. This methodology can be applied in the future
to assess physicians’ current use of other clinical decision rules, or to assess
implementation of new rules.
91
Conclusion
Physicians’ overall agreement with the ankle rule was high, but not perfect.
Physicians placed greatest importance on rule-based cues, while considering non-rule-
based cues as moderately important. It appears that physician radiography decisions
were guided by rule-based cues, but perhaps not exactly as intended by the ankle rule.
There is room to improve emergency physician agreement with the ankle rule and use
of rule-based cues through knowledge translation interventions aimed to increase
adherence to the rule. Given that real-world cases can be complex, interventions must
emphasize the role of expertise in decision-making.
92
REFERENCES
(1) Sackett D, Rosenberg W, Gray J, Haynes R, Richardson W. Evidence based medicine: what it is and what it isn't. BMJ 1996; 312(7023):71.
(2) Rosenberg W, Donald A. Evidence based medicine: an approach to clinical problem-solving. BMJ 1995; 310(6987):1122-1126.
(3) Green J, Britten N. Qualitative research and evidence based medicine. BMJ 1998; 316(7139):1230-1232.
(4) Graham ID, Logan J, Harrison MB, Straus SE, Tetroe J, Caswell W et al. Lost in Knowledge Translation: Time for a Map? The Journal of Continuing Education in the Health Professions 2006; 26(1):13-24.
(5) Miles A, Loughlin M. Models in the balance: evidence-based medicine versus evidence-informed individualized care. J Eval Clin Pract 2011; 17(4):531-536.
(6) Haynes B, Haines A. Barriers and bridges to evidence based clinical practice. BMJ 1998; 317(7153):273-276.
(7) Straus SE, McAlister FA. Evidence-based medicine: a commentary on common criticisms. CMAJ 2000; 163(7):837-841.
(8) Fontanarosa PB. Scientific publication in emergency medicine: imprint on the future. Ann Emerg Med 1997; 30(6):782-784.
(9) Sklar DP, Handel DA, Hoekstra J, Baren JM, Zink B, Hedges JR. The future of emergency medicine: an evolutionary perspective. Acad Med 2010; 85(3):490-495.
(10) National Institutes of Health. PubMed. URL: http://www.ncbi.nlm.nih.gov/pubmed/ [accessed 01-06-2011].
(11) The Cochrane Collaboration. URL: http://www.cochrane.org/ [accessed 01-
06-2011]. (12) British Medical Journal. Evidence-Based Medicine for Primary Care and
Internal Medicine. URL: http://ebm.bmj.com/ [accessed 01-06-2011]. (13) KT Clearinghouse. URL: http://ktclearinghouse.ca/cebm/resources/web
[accessed 01-06-2011]. (14) BestBETs. URL: http://www.bestbets.org/ [accessed 01-07-2011]. (15) Centre for Evidence Based Medicine. URL: http://www.cebm.net/ [accessed
01-06-2011].
93
(16) Agency for Healthcare Research and Quality. National Guideline
Clearinghouse. URL: http://www.guideline.gov/index.aspx [accessed 01-06-2011].
(17) Lewis M. Evidence-Based-Medicine Tools for Your Palm-Top Computer. Family Practice Managment 2003; 10(5):73-74.
(18) MDcme. URL: https://www.mdcme.ca/ [accessed 01-06-2011]. (19) Woolf SH, Johnson RE. The break-even point: when medical advances are
less important than improving the fidelity with which they are delivered. Ann Fam Med 2005; 3(6):545-552.
(20) Grimshaw JM, Shirran L, Thomas R, Mowatt G, Fraser C, Bero L et al. Changing provider behavior: an overview of systematic reviews of interventions. Med Care 2001; 39(8(Suppl 2)):II2-II45.
(21) McGlynn EA, Asch SM, Adams J, Keesey J, Hicks J, DeCristofaro A et al. The quality of health care delivered to adults in the United States. N Engl J Med 2003; 348(26):2635-2645.
(22) Centers for Disease Control and Prevention. Influenza vaccination coverage levels. URL: http://www.cdc.gov/flu/professionals/acip/coveragelevels.htm [accessed 01-06-2011].
(23) Centers for Disease Control and Prevention. What you should know and do
this flu season if you are 65 and over. URL: http://www.cdc.gov/flu/about/disease/65over.htm [accessed 01-06-2011].
(24) Health Canada. A 10-Year Plan to Strengthen Health Care. URL:
http://www.hc-sc.gc.ca/hcs-sss/delivery-prestation/fptcollab/2004-fmm-rpm/index-eng.php [accessed 01-06-2011].
(25) Wright JG, Menaker RJ. Waiting for children's surgery in Canada: the
Canadian Paediatric Surgical Wait Times project. CMAJ 2011; 183(9):E559-E564.
(26) Schuster M, McGlynn E, Brook RH. How good is the quality of health care in the United States? Milbank Q 1998; 76:517-563.
(27) Stiell IG, McKnight RD, Greenberg GH, McDowell I, Nair RC, Wells GA et al. Implementation of the Ottawa Ankle Rules. JAMA 1994; 271(11):827-832.
(28) Stiell I. Ottawa ankle rules. Can Fam Physician 1996; 42:478-480.
(29) Stiell IG, Greenberg GH, McKnight RD, Nair RC, McDowell I, Worthington JR. A study to develop clinical decision rules for the use of radiography in acute ankle injuries. Ann Emerg Med 1992; 21(4):384-390.

94
(30) Brehaut JC, Stiell I, Graham I, Visentin L. Clinical decision rules 'in real world': How a widely disseminated rule is used in everyday practice. Acad Emerg Med 2005; 12(10):948-956.
(31) Canadian Institutes of Health Research. Knowledge Translation Strategy 2004-2009. URL: http://www.cihr-irsc.gc.ca/e/26574.html [accessed 01-06-2011].
(32) Lomas J. Diffusion, dissemination, and implementation: who should do what?
Ann N Y Acad Sci 1993; 703:226-235.
(33) Logan J, Graham ID. Toward a comprehensive interdisciplinary model of health care research use. Sci Commun 1998; 20(2):227-246.
(34) Haynes RB. Of studies, summaries, synopses, and systems: the "4S" evolution of services for finding current best evidence. Evid Based Ment Health 2001; 4(2):37-39.
(35) Canadian Institutes of Health Research. Section 4.1: Planned action theories. URL: http://www.cihr-irsc.gc.ca/e/41948.html [accessed 01-06-2011].
(36) Stiell IG, Wells GA. Methodologic standards for the development of clinical
decision rules in emergency medicine. Ann Emerg Med 1999; 33(4):437-447.
(37) Stiell IG, Bennett C. Implementation of clinical decision rules in the emergency department. Acad Emerg Med 2007; 14(11):955-959.
(38) McGinn TG, Guyatt GH, Wyer PC, Naylor CD, Stiell IG, Richardson WS. Users' guides to the medical literature. XXII: How to use articles about clinical decision rules. JAMA 2000; 284:79-84.
(39) Eagles D, Stiell IG, Clement CM, Brehaut J, Kelly AM, Mason S et al. International survey of emergency physicians' priorities for clinical decision rules. Acad Emerg Med 2008; 15(2):177-182.
(40) Anis AH, Stiell IG, Stewart DG, Laupacis A. Cost-effectiveness analysis of the Ottawa Ankle Rules. Ann Emerg Med 1995; 26(4):422-428.
(41) Shapiro SE. Guidelines for developing and testing clinical decision rules. West J Nurs Res 2006; 28(2):244-253.
(42) Lloyd S. Acute ankle injuries: clinical/radiologic assessment in diagnosis. Can Fam Physician 1988; 34:2261-2265.
(43) Stiell IG, Greenberg GH, McKnight RD, Nair RC, McDowell I, Reardon M et al. Decision rules for the use of radiography in acute ankle injuries. JAMA 1993; 269(9):1127-1132.
95
(44) Dowdall H, Gee M, Brison RJ, Pickett W. Utilization of radiographs for the diagnosis of ankle fractures in Kingston, Ontario, Canada. Acad Emerg Med 2011; 18(5):555-558.
(45) Stiell IG, Wells G, Laupacis A, Brison R, Verbeek R, Vandemheen KL et al. Multicentre trial to introduce the Ottawa Ankle Rules for use of radiography in acute ankle injuries. Br Med J 1995; 311:594-597.
(46) Graham ID, Stiell IG, Laupacis A, McAuley L, Howell M, Clancy M et al. Awareness and use of the Ottawa Ankle and Knee Rules in 5 countries: Can publication alone be enough to change practice? Ann Emerg Med 2001; 37(3):259-266.
(47) Sullivan F, Wyatt J. ABC of health informatics: how computers help make efficient use of consultations. BMJ 2005; 331:1010-1012.
(48) Cooksey R. Judgment analysis: theory, methods and applications. Academic Press Inc., 1996.
(49) Hammond K. Probabilistic functioning and the clinical method. Psychol Rev 1955; 62:255-262.
(50) Wigton RS. Use of linear models to analyze physicians' decisions. Med Decis Making 1988; 8(4):241-252.
(51) Peabody JW, Luck J, Glassman P, Dresselhaus TR, Lee M. Comparison of vignettes, standardized patients and chart abstraction. A prospective validation study of 3 methods for measuring quality. JAMA 2000; 283(13):1715-1722.
(52) Bachmann LM, Muhleisen A, Bock A, ter Riet G, Held U, Kessels AG. Vignette studies of medical choice and judgement to study caregivers' medical decision behaviour: systematic review. BMC Med Res Methodol 2008; 8:50.
(53) Rethans JJ, Sturmans F, Drop R, van d, V, Hobus P. Does competence of general practitioners predict their performance? Comparison between examination setting and actual practice. BMJ 1991; 303(6814):1377-1380.
(54) Peabody JW, Luck J, Glassman P, Jain S, Hansen J, Spell M et al. Measuring the Quality of Physician Practice by Using Clinical Vignettes: A Prospective Validation Study. Ann Intern Med 2004; 141:771-780.
(55) Dillman D. Mail and internet surveys: the tailored design. New York: John Wiley & Sons Inc.; 2000.
(56) Kellerman SE, Herold J. Physician response to surveys. A review of the literature. Am J Prev Med 2001; 20(1):61-67.

96
(57) Van Otterloo J, Richards JL, Seib K, Weiss P, Omer SB. Gift card incentives and non-response bias in a survey of vaccine providers: the role of geographic and demographic factors. PLoS One 2011; 6(11):e28108.
(58) Johnson J. Factors Affecting Relative Weights: The Influence of Sampling and Measurement Error. Organizational Research Methods 2004; 7(3):283-299.
(59) Zar J. Biostatistical Analysis. Fourth Edition. Englewood Cliffs, New Jersey, USA: Prentice Hall, 1998.
(60) Hoffman P. The paramorphic representation of clinical judgment. Psychol Bull 1960; 57:116-131.
(61) Adams AS, Soumerai SB, Lomas J, Ross-Degnan D. Evidence of self-report bias in assessing adherence to guidelines. Int J Qual Health Care 1999; 11(3):187-192.
(62) Choudhry N, Fletcher R, Soumerai S. Systematic review: The relationship between clinical experience and quality of health care. Ann Intern Med 2005; 142:260-273.
(63) Jorgensen M, Kirkeboen G, Sjoberg DIK, Anda B, Bratthall L. Human judgment in effort estimation of software projects, in Beg, Borrow, or Steal Workshop, International Conference on Software Engineering; Limerick, Ireland, 2001.
(64) Wigton RS, Hoellerich VL, Patil KD. How Physicians use clinical information in diagnosing pulmonary embolism: An application of conjoint analysis. Med Decis Making 1986; 6:2-11.
(65) Wigton RS, Poses RM, Collins M, Cebul RD. Teaching old dogs new tricks: using cognitive feedback to improve physicians' diagnostic judgments on simulated cases. Acad Med 1990; 65(9 Suppl):S5-S6.
(66) Poses RM, Cebul RD, Wigton RS, Centor RM, Collins M, Fleischli G. Controlled trial using computerized feedback to improve physicians' diagnostic judgments. Acad Med 1992; 67(5):345-347.
(67) Jacklin R, Sevdalis N, Darzi A, Vincent CA. Efficacy of cognitive feedback in improving operative risk estimation. Am J Surg 2009; 197(1):76-81.
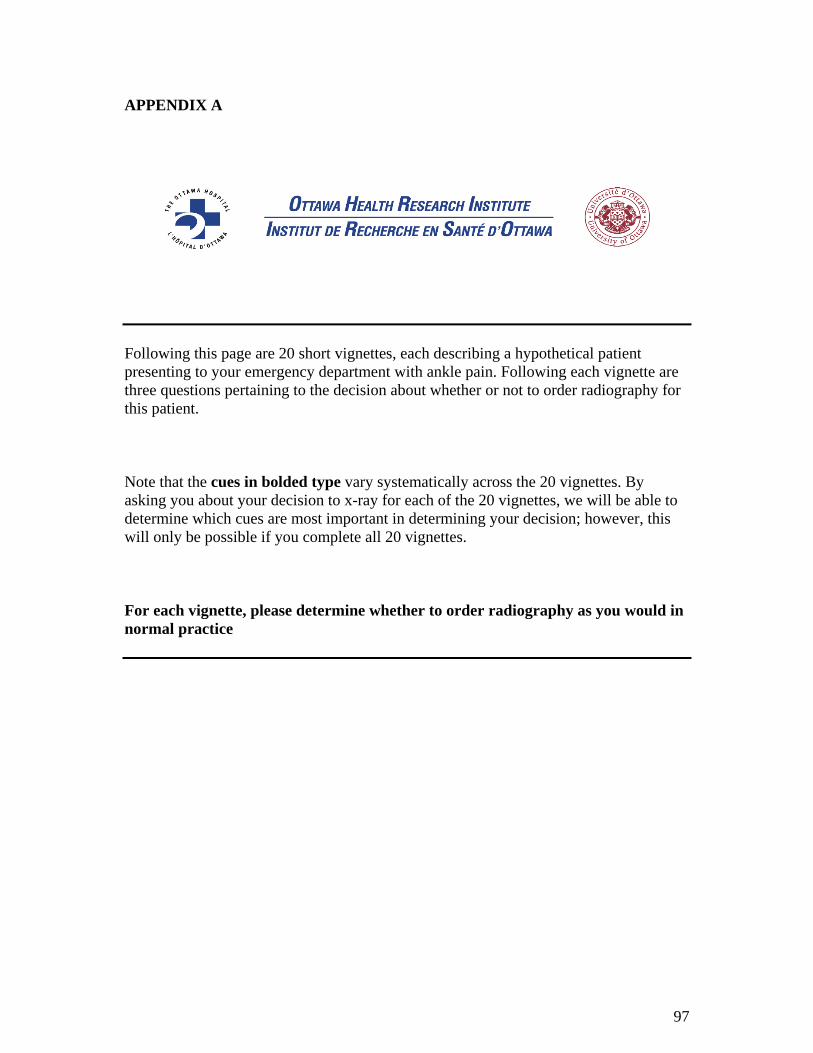
97
APPENDIX A
Following this page are 20 short vignettes, each describing a hypothetical patient presenting to your emergency department with ankle pain. Following each vignette are three questions pertaining to the decision about whether or not to order radiography for this patient. Note that the cues in bolded type vary systematically across the 20 vignettes. By asking you about your decision to x-ray for each of the 20 vignettes, we will be able to determine which cues are most important in determining your decision; however, this will only be possible if you complete all 20 vignettes. For each vignette, please determine whether to order radiography as you would in normal practice

98
For all 20 vignettes, assume that the patient presents to the emergency department with ankle pain after falling five feet off a step ladder. Examination shows no midfoot pain or tenderness, and there are no other injuries. Case #1: The patient is a 65-year-old man. He heard a cracking sound at the time of the incident. He reports a previous fracture in the same ankle about 12 months ago, but reports no other fracture risk. Examination shows little swelling or bruising laterally, no bone tenderness anywhere on the medial malleolus, and no bone tenderness anywhere on the lateral malleolus. He was able to bear weight on the foot in the emergency department and at the time of the incident, and shows no limitation in range of motion of the ankle. Would you order an ankle x-ray series for this patient?
No Yes
What is the likelihood that you would order an ankle x-ray in this case?
0% 20 40 60 80 100% |------|------|------|------|------|------|------|------|------|------|
What is the likelihood this patient would have a fracture?
0% 20 40 60 80 100% |------|------|------|------|------|------|------|------|------|------|
Case #2: The patient is a 65-year-old woman. She heard no cracking sound at the time of the incident. She reports a previous fracture in the same ankle about 12 months ago, but reports no other fracture risk. Examination shows marked swelling and bruising laterally, no bone tenderness anywhere on the medial malleolus, and no bone tenderness anywhere on the lateral malleolus. She was able to bear weight on the foot in the emergency department and at the time of the incident, and shows no limitation in range of motion of the ankle. Order ankle x-ray? No Yes What is the likelihood that you would order an ankle x-ray in this case?
0% 20 40 60 80 100% |------|------|------|------|------|------|------|------|------|------|
What is the likelihood this patient would have a fracture?
0% 20 40 60 80 100% |------|------|------|------|------|------|------|------|------|------|
Case #3: This patient is a 45-year-old woman. She heard a cracking sound at the time of the incident. She reports no previous fractures, and reports no other fracture risk. Examination shows marked swelling and bruising laterally, no bone tenderness anywhere on the medial malleolus, but some bone tenderness on the posterior edge of the lateral malleolus. She was able to bear weight on the foot in the emergency department and at the time of the incident, and shows no limitation in range of motion of the ankle. Order ankle x-ray? No Yes What is the likelihood that you would order an ankle x-ray in this case?
0% 20 40 60 80 100% |------|------|------|------|------|------|------|------|------|------|
What is the likelihood this patient would have a fracture?
0% 20 40 60 80 100% |------|------|------|------|------|------|------|------|------|------|
Case #4: This patient is a 45-year-old man. He heard a cracking sound at the time of the incident. He reports a previous fracture in the same ankle about 12 months ago, but reports no other fracture risk. Examination shows little swelling or bruising laterally, no bone tenderness anywhere on the medial malleolus, but some bone tenderness on the posterior edge of the lateral malleolus. He was unable to bear weight on the foot in the emergency department or at the time of the incident, but shows no limitation in range of motion of the ankle. Order ankle x-ray? No Yes What is the likelihood that you would order an ankle x-ray in this case?
0% 20 40 60 80 100% |------|------|------|------|------|------|------|------|------|------|
What is the likelihood this patient would have a fracture?
0% 20 40 60 80 100% |------|------|------|------|------|------|------|------|------|------|

99
Case #5: The patient is a 65-year-old man. He heard no cracking sound at the time of the incident. He reports a previous fracture in the same ankle about 12 months ago, but reports no other fracture risk. Examination shows marked swelling and bruising laterally, no bone tenderness anywhere on the medial malleolus, and no bone tenderness anywhere on the lateral malleolus. He was unable to bear weight on the foot in the emergency department or at the time of the incident, and shows moderate limitation in range of motion of the ankle. Order ankle x-ray?
No Yes What is the likelihood that you would order an ankle x-ray in this case?
0% 20 40 60 80 100% |------|------|------|------|------|------|------|------|------|------|
What is the likelihood this patient would have a fracture?
0% 20 40 60 80 100% |------|------|------|------|------|------|------|------|------|------|
Case #6: The patient is a 65-year-old woman. She heard no cracking sound at the time of the incident. She reports no previous fractures, and reports no other fracture risk. Examination shows marked swelling and bruising laterally, no bone tenderness anywhere on the medial malleolus, but some bone tenderness on the posterior edge of the lateral malleolus. She was able to bear weight on the foot in the emergency department and at the time of the incident, but shows moderate limitation in range of motion of the ankle. Order ankle x-ray?
No Yes What is the likelihood that you would order an ankle x-ray in this case?
0% 20 40 60 80 100% |------|------|------|------|------|------|------|------|------|------|
What is the likelihood this patient would have a fracture?
0% 20 40 60 80 100% |------|------|------|------|------|------|------|------|------|------|
Case #7: The patient is a 65-year-old woman. She heard a cracking sound at the time of the incident. She reports no previous fractures, and reports no other fracture risk. Examination shows little swelling or bruising laterally, no bone tenderness anywhere on the medial malleolus, but some bone tenderness on the posterior edge of the lateral malleolus. She was unable to bear weight on the foot in the emergency department or at the time of the incident, but shows no limitation in range of motion of the ankle. Order ankle x-ray?
No Yes What is the likelihood that you would order an ankle x-ray in this case?
0% 20 40 60 80 100% |------|------|------|------|------|------|------|------|------|------|
What is the likelihood this patient would have a fracture?
0% 20 40 60 80 100% |------|------|------|------|------|------|------|------|------|------|
Case #8: The patient is a 65-year-old woman. She heard a cracking sound at the time of the incident. She reports a previous fracture in the same ankle about 12 months ago, but reports no other fracture risk. Examination shows little swelling or bruising laterally, no bone tenderness anywhere on the medial malleolus, and no bone tenderness anywhere on the lateral malleolus. She was unable to bear weight on the foot in the emergency department or at the time of the incident, and shows moderate limitation in range of motion of the ankle. Order ankle x-ray?
No Yes What is the likelihood that you would order an ankle x-ray in this case?
0% 20 40 60 80 100% |------|------|------|------|------|------|------|------|------|------|
What is the likelihood this patient would have a fracture?
0% 20 40 60 80 100% |------|------|------|------|------|------|------|------|------|------|

100
Case #9: This patient is a 45-year-old woman. She heard a cracking sound at the time of the incident. She reports a previous fracture in the same ankle about 12 months ago, but reports no other fracture risk. Examination shows marked swelling and bruising laterally, no bone tenderness anywhere on the medial malleolus, and no bone tenderness anywhere on the lateral malleolus. She was able to bear weight on the foot in the emergency department and at the time of the incident, but shows moderate limitation in range of motion of the ankle. Order ankle x-ray?
No Yes What is the likelihood that you would order an ankle x-ray in this case?
0% 20 40 60 80 100% |------|------|------|------|------|------|------|------|------|------|
What is the likelihood this patient would have a fracture?
0% 20 40 60 80 100% |------|------|------|------|------|------|------|------|------|------|
Case #10: The patient is a 65-year-old man. He heard a cracking sound at the time of the incident. He reports a previous fracture in the same ankle about 12 months ago, but reports no other fracture risk. Examination shows marked swelling and bruising laterally, no bone tenderness anywhere on the medial malleolus, but some bone tenderness on the posterior edge of the lateral malleolus. He was able to bear weight on the foot in the emergency department and at the time of the incident, and shows no limitation in range of motion of the ankle. Order ankle x-ray?
No Yes What is the likelihood that you would order an ankle x-ray in this case?
0% 20 40 60 80 100% |------|------|------|------|------|------|------|------|------|------|
What is the likelihood this patient would have a fracture?
0% 20 40 60 80 100% |------|------|------|------|------|------|------|------|------|------|
Case #11: This patient is a 45-year-old woman. She heard no cracking sound at the time of the incident. She reports a previous fracture in the same ankle about 12 months ago, but reports no other fracture risk. Examination shows marked swelling and bruising laterally, no bone tenderness anywhere on the medial malleolus, but some bone tenderness on the posterior edge of the lateral malleolus. She was unable to bear weight on the foot in the emergency department or at the time of the incident, but shows no limitation in range of motion of the ankle. Order ankle x-ray?
No Yes What is the likelihood that you would order an ankle x-ray in this case?
0% 20 40 60 80 100% |------|------|------|------|------|------|------|------|------|------|
What is the likelihood this patient would have a fracture?
0% 20 40 60 80 100% |------|------|------|------|------|------|------|------|------|------|
Case #12: The patient is a 65-year-old man. He heard a cracking sound at the time of the incident. He reports no previous fractures, and reports no other fracture risk. Examination shows marked swelling and bruising laterally, no bone tenderness anywhere on the medial malleolus, but some bone tenderness on the posterior edge of the lateral malleolus. He was unable to bear weight on the foot in the emergency department or at the time of the incident, and shows moderate limitation in range of motion of the ankle. Order ankle x-ray?
No Yes What is the likelihood that you would order an ankle x-ray in this case?
0% 20 40 60 80 100% |------|------|------|------|------|------|------|------|------|------|
What is the likelihood this patient would have a fracture?
0% 20 40 60 80 100% |------|------|------|------|------|------|------|------|------|------|
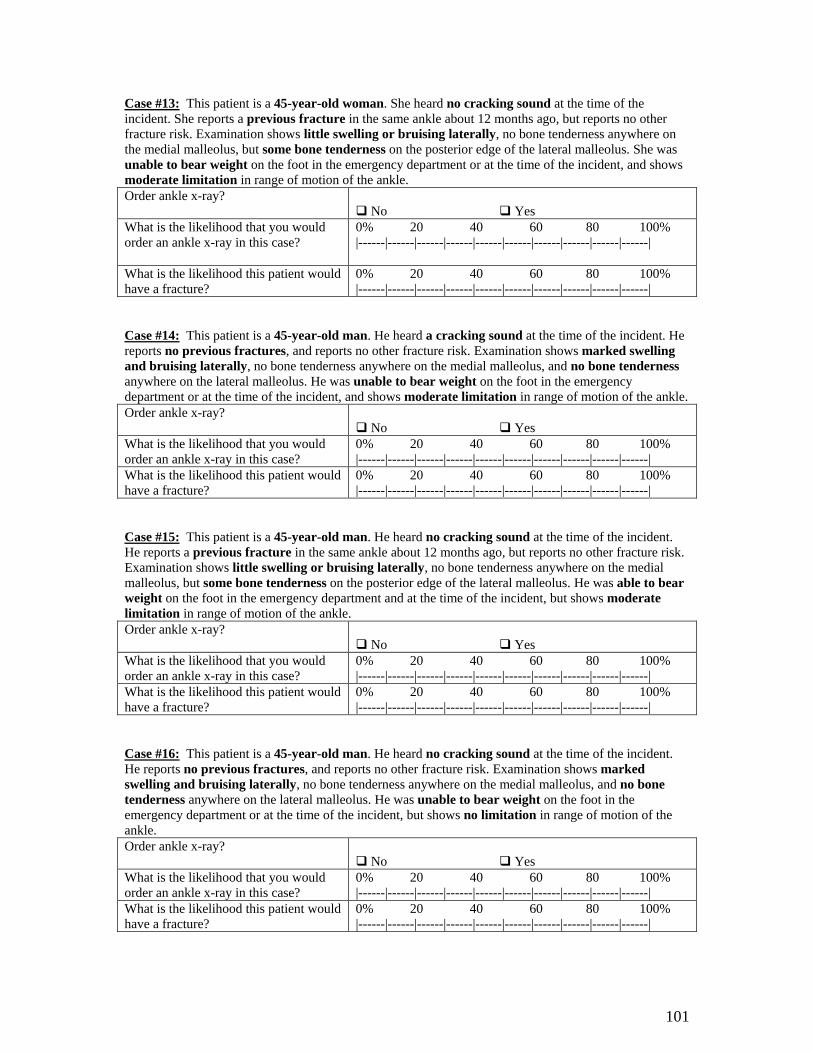
101
Case #13: This patient is a 45-year-old woman. She heard no cracking sound at the time of the incident. She reports a previous fracture in the same ankle about 12 months ago, but reports no other fracture risk. Examination shows little swelling or bruising laterally, no bone tenderness anywhere on the medial malleolus, but some bone tenderness on the posterior edge of the lateral malleolus. She was unable to bear weight on the foot in the emergency department or at the time of the incident, and shows moderate limitation in range of motion of the ankle. Order ankle x-ray?
No Yes What is the likelihood that you would order an ankle x-ray in this case?
0% 20 40 60 80 100% |------|------|------|------|------|------|------|------|------|------|
What is the likelihood this patient would have a fracture?
0% 20 40 60 80 100% |------|------|------|------|------|------|------|------|------|------|
Case #14: This patient is a 45-year-old man. He heard a cracking sound at the time of the incident. He reports no previous fractures, and reports no other fracture risk. Examination shows marked swelling and bruising laterally, no bone tenderness anywhere on the medial malleolus, and no bone tenderness anywhere on the lateral malleolus. He was unable to bear weight on the foot in the emergency department or at the time of the incident, and shows moderate limitation in range of motion of the ankle. Order ankle x-ray?
No Yes What is the likelihood that you would order an ankle x-ray in this case?
0% 20 40 60 80 100% |------|------|------|------|------|------|------|------|------|------|
What is the likelihood this patient would have a fracture?
0% 20 40 60 80 100% |------|------|------|------|------|------|------|------|------|------|
Case #15: This patient is a 45-year-old man. He heard no cracking sound at the time of the incident. He reports a previous fracture in the same ankle about 12 months ago, but reports no other fracture risk. Examination shows little swelling or bruising laterally, no bone tenderness anywhere on the medial malleolus, but some bone tenderness on the posterior edge of the lateral malleolus. He was able to bear weight on the foot in the emergency department and at the time of the incident, but shows moderate limitation in range of motion of the ankle. Order ankle x-ray?
No Yes What is the likelihood that you would order an ankle x-ray in this case?
0% 20 40 60 80 100% |------|------|------|------|------|------|------|------|------|------|
What is the likelihood this patient would have a fracture?
0% 20 40 60 80 100% |------|------|------|------|------|------|------|------|------|------|
Case #16: This patient is a 45-year-old man. He heard no cracking sound at the time of the incident. He reports no previous fractures, and reports no other fracture risk. Examination shows marked swelling and bruising laterally, no bone tenderness anywhere on the medial malleolus, and no bone tenderness anywhere on the lateral malleolus. He was unable to bear weight on the foot in the emergency department or at the time of the incident, but shows no limitation in range of motion of the ankle. Order ankle x-ray?
No Yes What is the likelihood that you would order an ankle x-ray in this case?
0% 20 40 60 80 100% |------|------|------|------|------|------|------|------|------|------|
What is the likelihood this patient would have a fracture?
0% 20 40 60 80 100% |------|------|------|------|------|------|------|------|------|------|

102
Case #17: The patient is a 65-year-old man. He heard no cracking sound at the time of the incident. He reports no previous fractures, and reports no other fracture risk. Examination shows little swelling or bruising laterally, no bone tenderness anywhere on the medial malleolus, but some bone tenderness on the posterior edge of the lateral malleolus. He was able to bear weight on the foot in the emergency department and at the time of the incident, but shows moderate limitation in range of motion of the ankle. Order ankle x-ray?
No Yes What is the likelihood that you would order an ankle x-ray in this case?
0% 20 40 60 80 100% |------|------|------|------|------|------|------|------|------|------|
What is the likelihood this patient would have a fracture?
0% 20 40 60 80 100% |------|------|------|------|------|------|------|------|------|------|
Case #18: The patient is a 65-year-old woman. She heard no cracking sound at the time of the incident. She reports no previous fractures, and reports no other fracture risk. Examination shows little swelling or bruising laterally, no bone tenderness anywhere on the medial malleolus, and no bone tenderness anywhere on the lateral malleolus. She was unable to bear weight on the foot in the emergency department or at the time of the incident, but shows no limitation in range of motion of the ankle. Order ankle x-ray?
No Yes What is the likelihood that you would order an ankle x-ray in this case?
0% 20 40 60 80 100% |------|------|------|------|------|------|------|------|------|------|
What is the likelihood this patient would have a fracture?
0% 20 40 60 80 100% |------|------|------|------|------|------|------|------|------|------|
Case #19: This patient is a 45-year-old woman. She heard a cracking sound at the time of the incident. She reports no previous fractures, and reports no other fracture risk. Examination shows little swelling or bruising laterally, no bone tenderness anywhere on the medial malleolus, and no bone tenderness anywhere on the lateral malleolus. She was able to bear weight on the foot in the emergency department and at the time of the incident, but shows moderate limitation in range of motion of the ankle. Order ankle x-ray?
No Yes What is the likelihood that you would order an ankle x-ray in this case?
0% 20 40 60 80 100% |------|------|------|------|------|------|------|------|------|------|
What is the likelihood this patient would have a fracture?
0% 20 40 60 80 100% |------|------|------|------|------|------|------|------|------|------|
Case #20: This patient is a 45-year-old man. He heard no cracking sound at the time of the incident. He reports no previous fractures, and reports no other fracture risk. Examination shows little swelling or bruising laterally, no bone tenderness anywhere on the medial malleolus, and no bone tenderness anywhere on the lateral malleolus. He was able to bear weight on the foot in the emergency department and at the time of the incident, and shows no limitation in range of motion of the ankle. Order ankle x-ray?
No Yes What is the likelihood that you would order an ankle x-ray in this case?
0% 20 40 60 80 100% |------|------|------|------|------|------|------|------|------|------|
What is the likelihood this patient would have a fracture?
0% 20 40 60 80 100% |------|------|------|------|------|------|------|------|------|------|
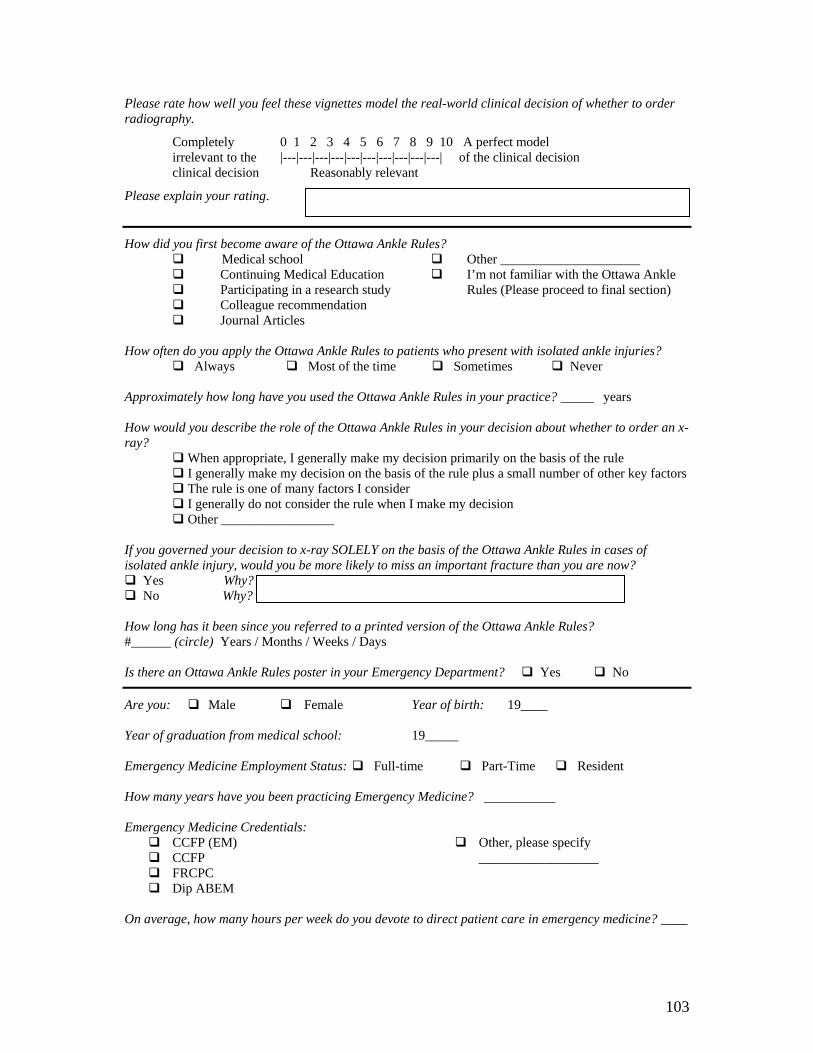
103
Please rate how well you feel these vignettes model the real-world clinical decision of whether to order radiography.
Completely 0 1 2 3 4 5 6 7 8 9 10 A perfect model irrelevant to the |---|---|---|---|---|---|---|---|---|---| of the clinical decision clinical decision Reasonably relevant
Please explain your rating.
How did you first become aware of the Ottawa Ankle Rules? Medical school Continuing Medical Education Participating in a research study Colleague recommendation
Other _____________________ I’m not familiar with the Ottawa Ankle
Rules (Please proceed to final section)
Journal Articles
How often do you apply the Ottawa Ankle Rules to patients who present with isolated ankle injuries? Always Most of the time Sometimes Never Approximately how long have you used the Ottawa Ankle Rules in your practice? _____ years How would you describe the role of the Ottawa Ankle Rules in your decision about whether to order an x-ray? When appropriate, I generally make my decision primarily on the basis of the rule I generally make my decision on the basis of the rule plus a small number of other key factors The rule is one of many factors I consider
I generally do not consider the rule when I make my decision Other _________________
If you governed your decision to x-ray SOLELY on the basis of the Ottawa Ankle Rules in cases of isolated ankle injury, would you be more likely to miss an important fracture than you are now? Yes Why? No Why? How long has it been since you referred to a printed version of the Ottawa Ankle Rules? #______ (circle) Years / Months / Weeks / Days Is there an Ottawa Ankle Rules poster in your Emergency Department? Yes No
Are you: Male Female Year of birth: 19____ Year of graduation from medical school: 19_____ Emergency Medicine Employment Status: Full-time Part-Time Resident How many years have you been practicing Emergency Medicine? Emergency Medicine Credentials:
CCFP (EM) CCFP FRCPC Dip ABEM
Other, please specify __________________
On average, how many hours per week do you devote to direct patient care in emergency medicine? ____