Embed Size (px)
Citation preview

UNDERSTANDING THE SENSORY CHARACTERISTICS OF FRESH AND PROCESSED
TOMATOES USING DESCRIPTIVE SENSORY ANALYSIS
by
PAIRIN HONGSOONGNERN
B.S., Khon Kaen University, Thailand, 1999 M.S., University of Minnesota, 2003
AN ABSTRACT OF A DISSERTATION
submitted in partial fulfillment of the requirements for the degree
DOCTOR OF PHILOSOPHY
Food Science Institute College of Agriculture
KANSAS STATE UNIVERSITY Manhattan, Kansas
2007
Abstract
Three studies, using descriptive sensory analysis with highly trained panelists, were
conducted to better understand the sensory characteristics of fresh and processed tomatoes.
A “green” note often has been described as part of tomato flavor and is noted in many
fruits, vegetables, grains and processed products. Thus, the first study developed a sensory
lexicon for green characteristics in foods. The lexicon, consisting of 17 sensory attributes, was
used to characterize sensory properties of 22 chemicals potentially associated with green odor.
Green characteristics can be differentiated as green-unripe, green-peapod, green-grassy/leafy,
green-viney and green-fruity. Additional attributes that are important in various green
characteristics included musty/earthy, pungent, bitter, sweet and floral. Various chemicals were
described as green at different concentrations. Green-grassy/leafy was the most common
characterizing green attribute of many of the chemicals studied. Changing the concentrations of
the chemicals resulted not only in changing the intensity of the attributes, but it also altered the
sensory profile of many of the chemicals.
A sensory lexicon for describing tomatoes also was developed. A variety of fresh
tomatoes, processed tomatoes, and tomato-based products such as ketchup and pasta sauce were
used to create the lexicon. The characteristics of tomatoes can be described using 33 aroma,
flavor and texture attributes. Some characteristics were common across all or most fresh and
processed tomatoes. However, reducing the number of attributes may be possible for certain
studies because some attributes were appropriate only for fresh or processed tomatoes, not both.
A third study determined the sensory characteristics of five tomato types, including
newer and older cultivars that varied in their physical traits and primary use. The impacts of
processing on the sensory quality of tomato products were investigated, with juice (minimal
processing) and paste (higher level of processing) being made from the cultivars. Fresh tomatoes
differed significantly because of cultivar and ripening stage differences. Fresh tomatoes differed
considerably from processed tomatoes. A low processing level intensified some key aroma and
flavor attributes, but differences in flavor attributed to cultivar became minimal after a higher

degree of processing. Textural differences among cultivars after processing were more
pronounced than flavor differences.

UNDERSTANDING THE SENSORY CHARACTERISTICS OF FRESH AND PROCESSED
TOMATOES USING DESCRIPTIVE SENSORY ANALYSIS
by
PAIRIN HONGSOONGNERN
B.S., Khon Kaen University, Thailand, 1999 M.S., University of Minnesota, 2003
A DISSERTATION
submitted in partial fulfillment of the requirements for the degree
DOCTOR OF PHILOSOPHY
Food Science Institute College of Agriculture
KANSAS STATE UNIVERSITY Manhattan, Kansas
2007
Approved by:
_________________________ Major Professor
Edgar Chambers IV

Abstract
Three studies, using descriptive sensory analysis with highly trained panelists, were
conducted to better understand the sensory characteristics of fresh and processed tomatoes.
A “green” note often has been described as part of tomato flavor and is noted in many
fruits, vegetables, grains and processed products. Thus, the first study developed a sensory
lexicon for green characteristics in foods. The lexicon, consisting of 17 sensory attributes, was
used to characterize sensory properties of 22 chemicals potentially associated with green odor.
Green characteristics can be differentiated as green-unripe, green-peapod, green-grassy/leafy,
green-viney and green-fruity. Additional attributes that are important in various green
characteristics included musty/earthy, pungent, bitter, sweet and floral. Various chemicals were
described as green at different concentrations. Green-grassy/leafy was the most common
characterizing green attribute of many of the chemicals studied. Changing the concentrations of
the chemicals resulted not only in changing the intensity of the attributes, but it also altered the
sensory profile of many of the chemicals.
A sensory lexicon for describing tomatoes also was developed. A variety of fresh
tomatoes, processed tomatoes, and tomato-based products such as ketchup and pasta sauce were
used to create the lexicon. The characteristics of tomatoes can be described using 33 aroma,
flavor and texture attributes. Some characteristics were common across all or most fresh and
processed tomatoes. However, reducing the number of attributes may be possible for certain
studies because some attributes were appropriate only for fresh or processed tomatoes, not both.
A third study determined the sensory characteristics of five tomato types, including
newer and older cultivars that varied in their physical traits and primary use. The impacts of
processing on the sensory quality of tomato products were investigated, with juice (minimal
processing) and paste (higher level of processing) being made from the cultivars. Fresh tomatoes
differed significantly because of cultivar and ripening stage differences. Fresh tomatoes differed
considerably from processed tomatoes. A low processing level intensified some key aroma and
flavor attributes, but differences in flavor attributed to cultivar became minimal after a higher

degree of processing. Textural differences among cultivars after processing were more
pronounced than flavor differences.
vii
Table of Contents
List of Figures ................................................................................................................... xii
List of Tables ................................................................................................................... xiii
Acknowledgements........................................................................................................... xv
Dedication ........................................................................................................................ xvi
CHAPTER 1 - Review of Literature................................................................................... 1
Part 1 – The Sensory Characteristic “Green” ................................................................. 2
Volatiles Contributing to Green Notes........................................................................ 2
Sensory Descriptions of Green Chemicals Used in Literature ................................... 3
Part 2 – The Sensory Characteristic of Tomatoes........................................................... 4
Consumption Trends for Tomato................................................................................ 5
Factors Influencing the Increase of Tomato Consumption......................................... 6
1. Increasing awareness of health and nutritional needs..................................... 6
2. Increase in number of tomato varieties........................................................... 7
3. Income, age, and gender ................................................................................. 7
Flavor of Tomatoes ..................................................................................................... 7
Compounds Contributing to Tomato Flavor............................................................... 8
Volatile Compounds and Flavor of Tomatoes ........................................................ 8
Non-Volatile Compounds and Flavor of Tomatoes.............................................. 11
Instrumental vs. Descriptive Sensory Studies on Flavor of Tomatoes ..................... 12
Instrumental Measurements and Tomato Flavor .................................................. 13
Descriptive Sensory Analysis of Tomato Flavor .................................................. 17
Relating Sensory Analysis and Instrumental Measurement of Tomato Flavor ........ 22
Conclusions................................................................................................................... 25
References..................................................................................................................... 26
CHAPTER 2 - Detailed Materials and Methods to a Lexicon for Green Odor and
Characteristics of Chemicals Associated with Green Odor in Foods ............................... 38
Panelists ........................................................................................................................ 39

viii
Samples and Sample Preparation.................................................................................. 39
Food Products ........................................................................................................... 39
Chemicals.................................................................................................................. 39
Evaluation Procedure.................................................................................................... 43
Phase 1: Determining the Sensory Characteristics of “Green”................................. 43
Phase 2: Evaluation of Various Chemicals Associated with “Green” ...................... 43
References..................................................................................................................... 44
CHAPTER 3 - A Lexicon for Green Odor and Characteristics of Chemicals
Associated with Green Odor in Foods .............................................................................. 45
Abstract......................................................................................................................... 46
Introduction................................................................................................................... 47
Materials and Methods.................................................................................................. 49
Panelists .................................................................................................................... 49
Phase 1: Determining the Sensory Characteristics of “Green”................................. 49
Phase 2: Evaluation of Various Chemicals Associated with “Green” ...................... 50
Chemicals.............................................................................................................. 50
Sample Preparation ............................................................................................... 50
Evaluation Procedure ............................................................................................ 51
Results and Discussion ................................................................................................. 51
Phase 1: Determining the Sensory Characteristics of “Green”................................. 51
Phase 2. Evaluation of Various Chemicals Associated with “Green” ...................... 55
Conclusions................................................................................................................... 61
References..................................................................................................................... 62
CHAPTER 4 - Detailed Materials and Methods to Determining a Lexicon
Describing the Sensory Flavor and Texture Characteristics of Tomatoes........................ 65
Panelists ........................................................................................................................ 66
Samples and Sample Preparation.................................................................................. 66
Evaluation Procedure.................................................................................................... 67
Lexicon Development ............................................................................................... 67
Product Evaluation.................................................................................................... 68
Data Analysis ............................................................................................................ 71

ix
References..................................................................................................................... 72
CHAPTER 5 - A Lexicon for Texture and Flavor Characteristics of Fresh and
Processed Tomatoes.......................................................................................................... 73
Abstract......................................................................................................................... 74
Practical Applications ................................................................................................... 75
Introduction................................................................................................................... 75
Materials and Methods.................................................................................................. 78
Samples ..................................................................................................................... 78
Sample Preparation ................................................................................................... 78
Panelists .................................................................................................................... 79
Development and Description of the Terminology................................................... 79
Evaluation Procedure during Lexicon Validation..................................................... 80
Data Analysis ............................................................................................................ 81
Results and Discussion ................................................................................................. 81
Lexicon Development ............................................................................................... 81
Comparison of the Sensory Characteristics Established in Current Study and
Previous Literature.................................................................................................... 86
Evaluating the Characteristics of Fresh and Processed Tomatoes............................ 88
Conclusions................................................................................................................... 92
References..................................................................................................................... 93
CHAPTER 6 - Detailed Materials and Methods to Sensory Characteristics of
Fresh Tomatoes and the Impact of Processing on the Sensory Characteristics of
Tomatoes........................................................................................................................... 97
Plant Materials .............................................................................................................. 98
Analytical Method ...................................................................................................... 100
Sample Preparation ................................................................................................. 100
pH, Total Soluble Solids (ºBrix), Titratable Acidity (TA) and Dry Matter
content..................................................................................................................... 100
Processing of Tomato – Tomato Juice and Tomato Paste .......................................... 101
Panelists ...................................................................................................................... 102
Descriptive Sensory Analysis ..................................................................................... 102

x
Sample Preparation ................................................................................................. 102
Evaluation Procedure .............................................................................................. 102
Data Analysis.............................................................................................................. 103
References................................................................................................................... 104
CHAPTER 7 - Sensory Characteristics of Fresh Tomatoes and the Impact of
Processing on the Sensory Characteristics of Tomatoes................................................. 105
Abstract....................................................................................................................... 106
Introduction................................................................................................................. 107
Materials and Methods................................................................................................ 108
Tomatoes................................................................................................................. 108
Postharvest Treatments ........................................................................................... 108
Preparation of Tomato Juice and Paste ................................................................... 109
Compositional Analyses ......................................................................................... 109
Descriptive Sensory Analysis ................................................................................. 110
Statistical Analysis.................................................................................................. 111
Results and Discussions.............................................................................................. 111
Compositional Analyses ......................................................................................... 111
Sensory Characteristics of Fresh Tomatoes ............................................................ 115
Sensory Characteristics of Tomato Juice and Paste................................................ 124
Comparing Sensory Characteristics of Fresh and Processed Tomatoes ................. 127
Conclusions................................................................................................................. 130
References................................................................................................................... 131
Appendix A - Descriptive Sensory Analysis for Green Odor in Foods and
Chemicals........................................................................................................................ 134
Appendix B - Descriptive Sensory Analysis for Tomato Lexicon ................................. 137
Appendix C - Tomato Planting and Planning for Evaluation ......................................... 146
Appendix D - Tomato Juice Processing Instruction ....................................................... 150
Appendix E - Tomato Paste Processing Instruction ....................................................... 152
Appendix F - SAS Code for ANOVA for pH, TSS (ºBrix) and TA Data ...................... 154
Appendix G - SAS Code for ANOVA for Dry Matter Data........................................... 156
Appendix H - SAS Code for ANOVA for Fresh Tomatoes ........................................... 158

xi
Appendix I - SAS Code for ANOVA for Tomato Juice and Paste................................. 163
Appendix J - Additional Tomato Juice and Paste Data .................................................. 170
Appendix K - Code of Federal Regulations for Tomato Juice ....................................... 173
Appendix L - Code of Federal Regulations for Tomato Paste........................................ 176

xii
List of Figures
Figure 5.1 Sensory map of the first two principal components for describing the aroma/flavor
characteristics of tomato products ........................................................................................ 89
Figure 5.2 Sensory map of the first two principal components for describing the texture
characteristics of tomato products ........................................................................................ 91
Figure 7.1 pH of fresh tomatoes by harvesting times ................................................................. 113
Figure 7.2 Titratable acidity of fresh tomatoes by harvesting times........................................... 113
Figure 7.3 Total soluble solids of fresh tomatoes by harvesting times....................................... 114
Figure 7.4 Principal Component Analysis (PCA) results for flavor and aroma attributes ......... 128
Figure 7.5 Principal Component Analysis (PCA) for texture attributes..................................... 129
Figure A.1 Serial Dilution Technique Used for Chemical Solution Preparation ....................... 135
Figure B.1 Cluster Tree Diagram for Aroma and Flavor Attributes........................................... 144
Figure B.2 Cluster Tree Diagram for Texture Attributes ........................................................... 145
Figure C.1 Plotting Design for Tomato Planting in High Tunnel Greenhouse .......................... 147
Figure C.2 Tomato Yield ............................................................................................................ 148
Figure J.1 Total Soluble Solid Plot for Tomato Juice................................................................. 171
Figure J.2 Total Soluble Solid Plot for Tomato Paste ................................................................ 172

xiii
List of Tables
Table 1.1 Composition of dry matter content of fresh tomatoes (Davies and Hobson, 1981) ..... 12
Table 1.2 USDA ripening categories for tomatoes (USDA, 1976) .............................................. 15
Table 2.1 List of food products evaluated in phase 1: the lexicon development.......................... 41
Table 2.2 Chemical and physical properties of chemicals used ................................................... 42
Table 3.1 Sensory attributes imparting green characteristics: definitions, references, and
intensities on 15-point scale.................................................................................................. 53
Table 3.2 Odor attributes of chemicals exhibiting green characteristics at different concentrations
............................................................................................................................................... 56
Table 3.3 Odor profiles of chemicals illustrating green character with descriptions and intensities
............................................................................................................................................... 59
Table 3.4 Odor profiles of hexyl esters illustrating green character with descriptions and
intensities .............................................................................................................................. 60
Table 4.1 List of tomato products evaluated................................................................................. 70
Table 5.1 Tomato sensory attributes, definitions, references and intensities on a 15-point scale 83
Table 5.2 Comparison of descriptive attributes used in previous literature ................................. 87
Table 6.1 Description of Tomato Varieties Selected for the Study .............................................. 99
Table 7.1 Tomato characteristics and compositional properties................................................. 112
Table 7.2 Total soluble solids measured in tomato juice and paste............................................ 115
Table 7.3 Significant differences in the sensory characteristics of fresh tomatoes .................... 116
Table 7.4 Significant differences in the sensory characteristics of fresh tomatoes by cultivars 117
Table 7.5 cv. Brandywine - Sensory characteristics by ripening stages..................................... 119
Table 7.6 cv. Florida 91 - Sensory characteristics by ripening stages........................................ 120
Table 7.7 cv. Jet Star - Sensory characteristics by ripening stages............................................. 121
Table 7.8 cv. Juliet - Sensory characteristics by ripening stages................................................ 122
Table 7.9 cv. Red Agate – Sensory characteristics by ripening stages....................................... 123
Table 7.10 Significant differences in the sensory characteristics of tomato juice by cultivars .. 125
Table 7.11 Significant differences in the sensory characteristics of tomato paste by cultivars.. 126
xiv
Table A.1 Orientation Schedule for Chemical Evaluation ......................................................... 135
Table A.2 Testing Schedule for Chemical Evaluation................................................................ 136
Table B.1 Aroma and Texture Intensity Scores for Tomato Products Based on 15-Point Scale 138
Table B.2 Flavor Intensity Scores for Tomato Products Based on 15-Point Scale .................... 140
Table B.3 Pearson Correlation for All Sensory Attributes ......................................................... 142
Table C.1 Compositional Worksheet for pH, Total Soluble Solids and Titratable Acidity ....... 149

xv
Acknowledgements
A number of people deserve my deepest appreciation for their role in this achievement.
This has been a challenging journey, but with the support of family, friends and colleagues, it has
been exciting and rewarding.
First, a tremendous thank you to my adviser, Dr. Edgar Chambers. You have taught me
what it takes to be a successful sensory scientist. Your guidance and patience was greatly
appreciated.
I want to thank my committee members, Dr. Delores Chambers, Dr. Fadi Aramouni and
Dr. George Milliken, for helping me work through my projects. I also would like to give special
thanks to Dr. Ted Carey, whose advice and assistance was invaluable.
My thanks to everyone at the Sensory Analysis Center at Kansas State University. At
times it was messy working with those tomatoes this past summer, but it passed by smoothly
because of your help.
I would not be here without the support of my family and friends. Thank you very much
for your love and understanding, which keeps me going every day. Thank you dad, Jeaw, Joy
and Chai for giving me strength, even though you are half way around the world. Andy, thanks
for your love and companionship, and for introducing me to Lazarus (the cutest and most
demanding cat in the world). Thank you to all my Thai friends, who are always there for me
when I needed. And last but not least, to my friends from JU 133: thank you so much for the
conversations, the laughter, and the memories.

xvi
Dedication
I would like to dedicate this dissertation to the love and memory of my mother, Sunun
Hongsoongnern. Her love and strength helped me become the person I am today. She was a true
example of one who loved learning and was never afraid to try. She always encouraged me to
learn and explore life, and to take full advantage of opportunities she never had. She said to me,
“I don’t have lots of money to offer, but I can give you education, which will stay with you
forever.” Though she faced death too early, she lived a full live and fought bravely until the last
minutes. She was the strongest woman I have ever known.
“This is for you, mom.”
I love you and miss you very much.

1
CHAPTER 1 - Review of Literature

2
This review of literature consists of 2 parts. Part 1 gathered information on studies
related to identifying the sensory characteristic term “green”. Part 2 included literature related to
the flavor characteristics of tomatoes and various factors that have significant impact on their
flavor characteristics.
Part 1 – The Sensory Characteristic “Green” The sensory characteristic “green” is a commonly used term for describing the
characteristic of a variety of fresh vegetables, unripe fruits, and some processed food products.
A “green” note has been found to be among the important attributes necessary for consumer
perception of many green plant-based products and food derivatives of those products, for
example, olive oil (Aparcio and Morales, 1998). The term green and similar terms such as
grassy have been referenced recently in many descriptive sensory analyses of various foods
including tomatoes (Baldwin et al., 2004), bean products (Vara-Ubol et al, 2004), honey (Galán-
Soldevilla et al., 2005) and wine (Vilanova and Soto, 2006). Various chemicals have been used
to represent the green note in those descriptive sensory studies, including aldehydes, alcohols,
ketones or their corresponding ester derivatives that contain six carbon atoms (C6) in the
molecule.
Volatiles Contributing to Green Notes
Salas et al. (2005) reported that the degradation of polyunsaturated fatty acids through the
lypoxygenase pathway produced the volatile compounds contributing to the green notes in many
fruits, vegetables and other derivative food products (e.g. olive oil and juices). Various volatile
aldehydes and alcohols containing six carbon atoms, e.g. hexanal, E-2-hexanal, and hexanol,
were reported to illustrate green odor (Salas et al., 2005). Hatanaka (1996) suggested that eight
volatile compounds of C6-aldehydes and C6-alcohols including (2E)-hexenal (leaf aldehyde) and
(3Z)-hexenol (leaf alcohol) contributed chiefly to the green odor characteristics of green leaves.
Dravnieks (1985) also described a number of C6 aldehydes (e.g. 1-hexanal) as having green-
related characteristics such as cut-grass. Research by Guth and Grosch (1991, 1993) and
Morales et al. (1996) showed that C6 aliphatic compounds and the corresponding hexyl acetates
contributed primarily to an “unripe” green characteristic of fruit flavor in olive oils. King et al.
(2006) reported that damage to the cell structure of fruits and vegetables increased the release of
six-carbon aldehydes, alcohols, and esters and resulted in intensified green notes.
3
Hexanal and closely related compounds, in particular, have been most commonly
associated with green characteristics such as cut-grass (Krumbein and Auerswald, 1998; Reiners
and Grosch, 1998; Baldwin et al., 2004; Azodanlou et al., 2003; and Buettner and Mestres,
2005). Wilkens and Lin (1970) and Takahashi et al. (1979) showed that hexanal was the key
component for the green and bean-like characteristics of soy beans and their products. Jakobsen
et al. (1998) described hexanal as a green-strong note in blanched green peas. Hexanal and
hexanol were described as the key compounds producing the green and beany flavor in a variety
of soy products (e.g. Wang et al., 1998). Komthong et al. (2006) found trans-2-hexenal to be
responsible for a green, apple–like odor in apples. Jiang (2005) found that high level of (E)-2-
hexenal and (Z)-3-hexen-1-ol in the laksa plant to be positively correlated with green notes.
Aparicio and Morales (1998) described 2-, 3-hexenal, and 2-, and 3-hexen-1-ol as green, with
sensory attributes such as fruity, flower, cut grass, and banana depending on the structure of the
compounds. Citronellal was described as an important compound contributing to, and
intensifying the green note in green fruits (Jiang and Kubota, 2005). Arais et al. (1967) reported
that alcohols including isopentanol, hexanol and heptanol were responsible for the characteristic
green aroma of soy beans. (Z)-3-Hexen-1-yl esters have been found to be green and fruity. For
example, (Z)-3-hexen-1-yl acetate was described as green and banana by Pino et al. (2001), and
powerful green and floral by Furia and Bellanca (1975).
Sensory Descriptions of Green Chemicals Used in Literature
Descriptions of volatile compounds used to reference green notes vary in the literature.
Baldwin et al. (2004); Azodanlou et al. (2003); Krumbein and Auerswald (1998); Reiners and
Grosch (1998) and Buettner and Mestres (2005) described hexanal as green, (cut) grass. Other
descriptors used to describe the characteristics of hexanal included minty (Baldwin et al., 2004),
apple (Salas et al., 2005; Paçi Kora et al., 2003; and Morales and Aparicio, 1999), unripe green
(Wright, 2004), herbal (Jordán et al., 2003), fatty (Pino et al., 2001), and hedge (Bult et al.,
2002). Salas et al. (2005), Furia and Bellanca (1975) and Krumbein and Auerswald (1998)
described (E)-2-hexenal as green-leafy; Azodanlou et al. (2003) described it as green and fatty;
Baldwin et al. (2004) characterized (E)-2-hexenal as green, grassy, vine, and stale; Wright
(2004) and Reiners and Grosch (1998) described it as green apple like; and Morales and Aparicio
(1999) described it as almond. It is possible that some of these chemicals may illustrate a certain

4
green characteristic at specific range of concentrations. For example, Vara-Ubol et al. (2004)
showed that some chemicals associated with beany aroma were found to be beany only at
concentrations between 1-10 ppm, and the characteristics changed completely at higher
concentrations. Caporale et al. (2004) reported that different concentrations of cis-3-hexen-1-ol
differed significantly in the green-cut grass intensity.
Many studies described odors of volatile chemicals by having human subjects sniff the
headspace from gas chromatographs. Some studies used a human sensory panel with minimal
training. No studies were found that used highly trained descriptive sensory panelists to describe
the chemicals potentially associated with green notes. The sensory characteristic “green” has
been very commonly used; however, a well defined lexicon that includes definitions and
references to determine the green character has not been developed.
Part 2 – The Sensory Characteristic of Tomatoes Tomatoes, both fresh and processed forms, are one of the most consumed and produced
vegetables worldwide. Tomatoes, which originated in South America, belong to the family of
Solanaceae and genus of Lycopersicon. Tomato is considered a berry fruit, but usually
cultivated and consumed as a vegetable (Petro-Turza, 1978). Tomatoes have been a popular item
since the early sixteenth century and the number of tomato varieties available in the marketplace
has increased dramatically during the past century.
In the past two decades, the consumption of both fresh and processed tomatoes has
increased steadily. Various factors influencing the increase in tomato consumption include the
popularity of ethnic foods such as Italian and Mexican and the increased awareness of the
potential health benefits from tomatoes in reducing the incidence of chronic diseases such as
cancer. Despite the increase in consumption, many studies in the past several years have
reported that fresh tomatoes commercially available in retail marketplace exhibit poor flavor
(Watada and Aulenbach, 1979; Hobson, 1988; Bruhn et al., 1991; Maul et al., 2000; Yilmaz,
2001; Batu, 2004; Krumbein et al., 2004; and Serrano-Megías and López-Nicolás, 2006), which
can have an impact on consumption. Recent development has focused primarily on creating
tomato varieties that provide high yields, increased shelf-life, and resistance to diseases, which
may have contributed to compromised flavor characteristics in fresh market tomatoes. The lack
of flavor of these retail tomatoes is also due partly to harvesting at a mature-green stage, which is

5
done to ensure that the fruits would maintain their integrity during transportation and additional
postharvest treatments (Kader et al., 1977).
Consumption Trends for Tomato
The consumption of tomatoes has increased continuously over the last 15 - 20 years. In
1993, world production of tomatoes exceeded 70 million tons (Thakur et al., 1996). During the
past two decades, the annual use of fresh market tomatoes in the United States has increased
18% per person per year based on a report (Lucier, 2006) from the US. Department of
Agriculture’s Economic Research Service (ERS). Lucier et al. (2000) stated that the annual use
of tomatoes and tomato products in the US “has increased nearly 30 percent over the past 20
years…” The increase in consumption of tomatoes is the result of a number of reasons including
an increase in health awareness of consumers, an increase in the consumption trend toward
restaurant-food or away-from-home food, an increase in the number of tomato varieties available
in the marketplace, and an increase in ethnic populations in the U.S. such as Mexican (Lucier et
al., 2000).
During the 1960’s to 1970’s, the consumption of fresh tomatoes flattened at
approximately 12 lb per capita (Lucier et al., 2000). The consumption began to rise during the
1980’s and 90’s to at least 17 lb per capita. Lucier et al. (2000) reported that the increasing trend
of fresh tomato consumption is partly due to the increasing popularity of salads, sandwiches, the
introduction of improved varieties of tomatoes and the more national health awareness.
Because of their perishable nature, tomatoes are consumed as much processed as they are
fresh. In the 1990s, the U.S. has been the largest consumer and producer of tomatoes for
processing, accounting for almost 50% of tomatoes used in world tomato processing (Gould,
1993). A variety of types of canned tomatoes are available in the marketplace including whole
peeled, diced, and crushed. Other processed tomatoes are consumed primarily as tomato juice,
sauce, puree and paste. The consumption of diced tomatoes increased considerably during the
1980-1990s because of the considerable demand for high value salsa, pizza, and spaghetti sauces
(Garcia and Barrett, 2006). Tomato puree and paste have been marketed both directly to
consumers and as ingredient to manufacture other products such as ketchup, soup and pasta
sauces (Hayes et al., 1998). The consumption of pizza has increased more than 300% since the
1970’s, which potentially drove the consumption of tomato sauce, especially in fast food
6
restaurant chains. Lucier et al. (2000) reported that approximately one-third of tomato sauces
and canned whole tomatoes were purchased more often from grocery stores and the rest was
consumed in a restaurant setting. The expanding of number of Mexican and Italian restaurants
largely drove the use of canned whole tomato products.
Factors Influencing the Increase of Tomato Consumption
1. Increasing awareness of health and nutritional needs
More societal emphasis on nutrition and health matters could account for a large increase
in demand for tomatoes. Perceived health benefits derived from tomatoes have been among the
main forces driving the increase in tomato consumption (Cuellar, 2002). The possibility in
preventing certain chronic diseases, such as cancer, encourages consumers to purchase and
consume more tomatoes. Several studies indicated that consumption of tomatoes may reduce the
risk of oesophagus, gastric, prostate and other epithelial cancers (Cook-Mozaffari et al., 1979;
Tsugane et al., 1992; Liu et al., 2001; Lugasi et al., 2003). Others have suggested that a
lycopene rich diet such as provided by eating more tomato-based products may help prevent
cardiovascular diseases (Kohlmeier et al. 1997; Clinton, 1998). Lycopene, the most prevalent
carotenoid pigment, about 83%, in tomatoes, has been studied and its role in reducing the risk of
cancer in men has been proven, which further encourages tomato consumption. Lycopene shows
significant antioxidant activity both in vivo and in vitro (Clinton, 1998 and Agarwal and
Venketeshwer, 1998). Lee and coworkers (Lee et al., 2000) reported that eating tomatoes
cooked in olive oil improved the antioxidant activity of lycopene and reduced the risk of cancer
in men. The risk of prostate cancer can be reduced up to 40% when at least three to five servings
of tomatoes are eaten each week for at least a decade (Lee et al., 2000). These research results
showed the beneficial effects of tomato consumption. Studies also reported a relatively high
stability of lycopene after undergoing multiple processing steps such as those for making tomato
juice and paste (Agarwal et al., 2001; Xianquan et al., 2005). Those studies suggested that
lycopene content in the processed tomato products were stable for up to 12 months at room
temperature storage with minimal exposure to light.

7
2. Increase in number of tomato varieties
Cuellar (2002) reported that consumption of tomatoes has increased because of the
introduction of new tomato varieties that are claimed to taste better, and to be more consistent in
quality. Availability of fresh, field-grown, and greenhouse tomatoes all year round also
promotes increasing demand.
3. Income, age, and gender
Consumption of fresh tomatoes is, to some extent, a function of income level. An
individual or family tends to consume more fresh tomatoes as their income rises. Pollack (2001)
stated that “fruit and vegetable consumption is positively correlated with income level…”.
Approximately 39% of the segment of the US population whose income exceeds the poverty
level by at least 350% accounts for approximately 44% of fresh tomato consumption (Lucier et
al., 2000). Adults, both men and women, aged 39 years and older consumed more fresh
tomatoes than younger individuals (Lucier et al., 2000). This demographic group has, in general,
more health awareness than other segments of the population. This group accounts for about
50% of the fresh tomato consumption in the US (Lucier et al., 2000). Children tend to consume
more fresh tomatoes as they enter their teenaged years.
Flavor of Tomatoes
Consumers prefer fresh tomatoes that have full flavor and characteristic taste. The flavor
characteristics of tomatoes have become an important purchasing criterion in recent years
(Krumbein et al., 2004) in addition to physical factors such as color and firmness and price
(Brumfield et al., 1993). Commercial tomatoes, however, have been criticized as lacking
desirable flavor in the past two decades (Watada and Aulenbach, 1979; Hobson, 1988; Bruhn et
al., 1991; Maul et al., 2000; Yilmaz, 2001; Batu, 2004; Krumbein et al., 2004; and Serrano-
Megías and López-Nicolás, 2006). One reason for a declining flavor is that tomatoes are
harvested at the mature-green stage (Kader et al., 1977) in order to prolong the shelf-life of the
fruits through multiple handling and transporting periods. Other researchers have reported that
lack of flavor of tomato is associated with various storage treatments, e.g. modified atmosphere
(Kader et al., 1978; Hobson, 1988; Ho, 1996; and Maul et al., 2000). Several studies (e.g. Kader

8
et al., 1978) recommended that tomatoes should be harvested at the red-ripe stage to ensure the
flavor desirability. However, because of the duration of transportation and handling processes,
the shelf-life of those vine-ripened tomatoes is significantly shortened. Therefore, many
researchers focused on developing tomato cultivars that provide increased yields, firmness, size,
disease resistance, and prolonged shelf-life, instead of flavor aspects of tomatoes.
Compounds Contributing to Tomato Flavor
The characteristic flavor of tomatoes is formed from both volatile and non-volatile
compounds (Stevens et al., 1977; Stevens et al., 1979; Petro-Turza, 1987; Bucheli et al., 1999;
and Krumbein et al., 2004). Flavor of tomato not only results from the sum of volatile or non-
volatile compounds, but also depends largely on their interactions as well (Petro-Turza, 1987).
Volatile compound aspects have received much attention from many researchers (e.g. Buttery et
al., 1987; McGlasson et al., 1987; Langlois et al., 1996; Baldwin et al., 1998; Brauss et al.,
1998; and Krumbein and Auerswald, 1998). Other researchers have studied the impact non-
volatile compounds have on the characteristic taste of tomatoes (e.g. Stevens et al., 1979; and
Malundo et al., 1995).
Volatile Compounds and Flavor of Tomatoes
Volatile compounds that contribute to the characteristic flavor and aroma of tomatoes are
generated from lipids, carotenoids, amino acids, terpenoids, and lignins (Buttery and Ling,
1993). Presently, over 400 volatile compounds have been identified in fresh tomatoes (Petro-
Turza, 1987). However, it is likely that only a portion of those actually contribute to the
characteristic flavor of fresh tomatoes. Commonly, gas chromatographic analysis has been used
to determine volatile compounds in fresh tomatoes. Buttery (1993) indicated that a combination
of some volatiles at appropriate concentrations may contribute to the characteristic tomato flavor.
Those included cis-3-hexenal, cis-3-hexenol, hexanal, 1-penten-3-one, 3-methylbutanal, trans-2-
hexenal, 6-methyl-5-hepten-2-one, methyl salicylate, 2-isobutylthiazole, and β-ionone. Buttery
and Ling (1993) suggested a similar set of volatiles contributing to the flavor of tomatoes, which
included cis-3-hexanal, hexanal, trans-2-hexanal, hexanol, cis-3-hexanol, 2-isobutylthiazole, 6-
methyl-hepten-2-one, geranylacetone, 2-phenylethanol, β-ionone, 1-penten-3-one, 3-
methylbutanol, and 3-methylbutanal. Krumbein and Auerswald (1998) used gas
chromatography-olfactometry and aroma extract analyses to determine that (Z)-3 hexanal,
9
hexanal, 1-octen-3-one, methional, 1-penten-3-one and 3-methylbutanal were the most odor-
active aroma volatiles in fresh tomatoes. Similar results were obtained by Tandon et al. (2000).
Some other aroma compounds that may contribute the characteristic tomato flavor included
furaneol and norfuraneol. Yilmaz (2001) stated that furaneol is an important compound
contributing to tomato aroma. Other compounds identified in fresh tomato, and not other foods,
which may potentially contribute to tomato aroma, include 1-nitro-2-phenylethane, 1-nitro-2-
methylpropane, and 1-nitro-3-methylbutane (Buttery, 1993). Dalal et al. (1967) reported that in
tomatoes harvested at the mature green stage and ripened artificially, the amount of 2-butanol, 2-
phenylethanol, 6-methyl-5-hepten-2-one, geranylacetone, farnesylacetone and 2-isobutylthiazole
were increased substantially. trans-3-Hexenal, and 2E, 4E-decadienal were found to contribute
to the desirable blending or mouthfeel properties of tomatoes (Petro-Turza, 1987). Petro-Turza
(1987) reported that hexanal may contribute to the fresh green aroma of tomato, but at
concentrations above 0.5 ppm it can also produce a flavor similar to rancid vegetable fat. At low
concentrations, 2-isobutylthiazole was found to minimize the harsh and unpleasant character in
tomato flavor, but, at higher concentrations it could generate “objectionable rancid and
medicinal, metallic off-odors” (Petro-Turza, 1987). Despite the availability of some previous
information, Azodanlou et al. (2003) stated that the contribution of volatiles to the perception of
quality in tomatoes has not received much attention.
The amount of volatile compounds in fresh tomatoes develops and changes over the
ripening stages of the fruits. Buttery (1993) reported that many volatile compounds increased
significantly as the fruits ripen. For example, (Z)-3-hexenal was found at levels 20 times higher
in vine-ripened fruits than in mature green tomatoes. Factors that account for differences in
volatile compound content include tomato variety, growing conditions, and stage of ripeness.
Thus, as a result of this large variability, it is a great challenge for a researcher to investigate the
contribution of aroma compounds or determine which compounds primarily contribute to the
flavor characteristics of fresh tomatoes. Johnson et al. (1968) suggested that the amount of
volatile compounds were different when tomatoes were harvested at different times. Johnson et
al. (1968) also reported that many differences in flavor characteristics could occur within the
same variety due to factors such as harvesting time and ripening techniques. For instance,
tomatoes grown in greenhouses and in open-fields have different flavors and aromas as a result
of differences in the amount of volatile compounds produced in the fruits. Fruits that have not

10
fully ripened when harvested not only will under-develop overall tomato flavor, but may also
produce some off-flavors or aromas. Dirinck et al. (1976), Dalal et al. (1967) and Dalal et al.
(1968) reported that field-grown tomatoes had significantly higher volatile compounds than
those grown in hot-house or greenhouse conditions. In tomatoes harvested at the mature green
stage, short chain (C4 – C6) volatile compounds were found instead of the long chain (C9 – C12)
volatiles that would be found when the fruits were harvested at the red-ripe stage (Chung et al.,
1979). Tomatoes harvested at the mature green or breaker stages have been reported to be less
sweet, salty, and have less fruity-floral flavor compared to those harvested at the table-ripe stage
(Hayase et al., 1984; and Krumbein et al., 2004), largely due to the fact that much fewer volatile
and non-volatile compounds fully developed at these stages. The chemical compositions such as
soluble solids and titratable acids in fresh tomatoes also were fewer in tomato fruits harvested at
the mature green stages (Lin and Block, 1998). Hayase et al. (1984) also reported that tomatoes
harvested at green stage can have a presence of some off flavors.
In processed tomatoes, a number of volatile compounds have been demonstrated to have
an impact of the product’s flavor character. Petro-Turza (1987) suggested that two volatile
compounds, dimethyl sulphide and acetaldehyde, may primarily contribute to flavor
characteristics of some processed tomatoes. Kazeniac and Hall (1970) suggested that the
increased cooked notes in processed tomatoes resulted from the decrease in green aroma
components. Dimethyl sulphide, not present in raw tomato, was formed during the initial
heating process and found to be associated with “cooked” aroma of tomato products (Miers,
1966). The concentration of dimethyl sulphide was reported to increase significantly in canned
tomato juice (Petro-Turza, 1987). The concentration of acetaldehyde, one of the first volatile
compounds identified in tomatoes, had been found much higher in processed tomatoes.
Acetaldehyde also was found to be associated with the cooked aroma of tomato products
(Kazeniac and Hall, 1970). Other compounds also have been determined to have a strong
association with the flavor of processed tomatoes. Geranylactone was found to be associated
with the hay-like aroma in tomato juice (Kazeniac and Hall, 1970). Furfural, 2, 4-heptadienal
and phenylacetaldehyde have been reported to contribute to the cooked characteristics of
processed tomatoes (Petro-Turza, 1987).

11
Non-Volatile Compounds and Flavor of Tomatoes
A number of non-volatile compounds present in the fruits have an impact on the flavor
characteristics of fresh tomatoes. Those include sugars, minerals, organic acids, and free amino
acids. Sugar and organic acid content have been reported to be most responsible for the pleasant
sweet and sour taste of tomatoes. Salts and probably some free amino acids have a large impact
on the character and intensity of the taste of tomatoes. Sugars, primarily glucose and fructose,
contribute to about 50% of the dry matter content in tomatoes (Table 1.1). Of the sugars
identified in tomato, fructose probably is the most important compound that produces the
characteristic sweetness. Other sugars including saccharose, raffinose, arabinose, galactose, and
sugar alcohol myoninositol have also been identified in tomatoes (Yilmaz, 2001), however, the
quantities of these sugars probably are too small to have a significant impact on the flavor
characteristics of tomatoes. Sugar content substantially increases during the ripening period of
the fruits. For example, in the initial development of tomato fruit, glucose was dominant with
the ratio of glucose/fructose approximately 1.8; as the fruit developed, the ratio of sugars
increased to about 1.0. Petro-Turza (1987) reported that, in ripened tomato fruit, the sum of
sugar content ranges approximately between 1.7 to 4.7%. Light was found to have a great
impact on the sugar content in tomatoes, i.e. tomatoes receiving more sunlight generally would
have more sugar content (Petro-Turza, 1987).
Organic acids, especially citric and malic acids, which are the major organic acids found
in tomato, contribute to more than 10% of the dry content of tomatoes. Citric acid was reported
to contribute to approximately 40 – 90% of the total acidity in ripe tomatoes depending on the
varieties. Petro-Turza (1987) suggested that the sensation of sourness might be dependent upon
the content of organic acids in the fruits. However, no definite relationship between the two has
been established. A study by Kader et al. (1977) suggested that pH and the interaction between
titratable acidity and pH contribute to the perceived sourness of tomatoes. A number of studies
have shown a close relationship between the taste and overall flavor intensity of tomatoes and
the amount of sugar and soluble solids including fructose and citric acid in the fruits. Although
unable to demonstrate a significant influence of acid concentration on descriptive ratings of
tomatoes, Malundo et al. (1995) suggested that there was a strong possibility that an optimal acid
concentration exists in tomato fruit. At this optimal concentration, the quality of the tomato

12
would be more favored by consumers. Those authors also made an assumption that
improvements in breeding could help identify this concentration.
Table 1.1 Composition of dry matter content of fresh tomatoes (Davies and Hobson, 1981)
Constituent Percentage (%)
Fructose 25.0
Glucose 22.0
Saccharose 1.0
Citric Acid 9.0
Malic Acid 4.0
Protein 8.0
Dicarboxylic Amino Acids 2.0
Pectic Substances 7.0
Cellulose 6.0
Hemicellulose 4.0
Minerals 8.0
Lipids 2.0
Ascorbic Acid 0.5
Pigments 0.4
Other Amino Acids, Vitamins, and Polyphenols 1.0
Volatiles 0.1
Instrumental vs. Descriptive Sensory Studies on Flavor of Tomatoes
One focus of tomato research is to determine instrumental quality of tomatoes, which
includes compositional and physical properties. Attempts to correlate those quality properties to
sensory data and consumer acceptance often have been performed in previous literature. The
main goal of these research projects was to facilitate the development or improvement of tomato
cultivars that would provide high yields, disease and handling resistant that would be favored by
consumers.

13
Instrumental Measurements and Tomato Flavor
The initial step to instrumental analysis of tomato flavor generally is to separate the
volatile from non-volatile components (Yilmaz, 2001). This can be accomplished by vacuum-
steam distillation (Buttery et al., 1971) or distillation with low temperature (Etievant et al.,
1996), vacuum condensation (Buttery et al., 1998), and dynamic or regular headspace techniques
(e.g. Baldwin et al., 1991 and 1996). Various techniques then have been used commonly in the
literature to identify and quantify tomato components, especially volatile compounds. These
techniques include gas chromatography with mass spectrometry (GC-MS) (Baldwin et al., 1991
and 1998; Hakim et al., 2000; Maneerat et al., 2002; and Krumbein et al., 2004), atmospheric
pressure chemical ionization-mass spectrometry (API-MS) (Taylor, 1996; Taylor et al., 2000;
Boukobza et al., 2001, 2002), HPLC (Tandon et al., 2003), and GC-Olfactometry (Langlois et
al., 1996). The electronic nose has been introduced to facilitate the determination of flavor
changes due to various postharvest factors (e.g. Mual et al., 2000).
A review by Petro-Turza (1987) indicated that the average tomato dry matter content
ranges between 5.0 – 7.5%. Of the total dry matter content, almost 50% is sugars, 15% organic
acids, 2-2.5% free amino acids, and 8% minerals (Yilmaz, 2001). The pH value of fresh
tomatoes ranges from 4.2 to 4.6, due primarily to the content of organic acids (Hayes et al.,
1998). Sugar and organic acids contribute to the total soluble solids as well as the flavor of
tomato (Stevens et al., 1977; Jones and Scott, 1983; Malundo et al., 1995; Petersen et al., 1998).
Differences in compositional components were found to be closely associated to other factors
including tomato cultivars, growing environment, and other agricultural practices (Bucheli et al.,
1999). Maul et al. (2000) reported that various fresh tomatoes stored at different temperatures
did not differ in pH and titratable acidity. Wu and Abbott (2002) and Lana et al. (2005)
indicated that the firmness of tomatoes decreased minimally during storage period, especially at
lower temperature (e.g. 2°C). In a study by Lin and Block (1998) in determining differences
between tomatoes harvested at mature green stage and red-ripe stage, results indicated no
significant differences in chemical compositions. Auerswald et al. (1999a) showed that reduced
sugar content of various tomatoes was not different at 7 days after harvested, and that titratable
acid content increased with the duration of storage. In addition, Auerswald et al. (1999b)
indicated that treating tomatoes with increased concentration of nutrient solution increased
reducing sugars and titratable acids in the fruit, which resulted in higher perceived sweetness and

14
tomato-like attributes. Increased sugar contents may result in improved flavor quality of fresh
tomatoes (Malundo et al., 1995).
Extensive reviews have been reported on the impact of various factors including genetic
variability, harvest stages, growing conditions and environment on the flavor quality of fresh
tomatoes (Davies and Hobson, 1981; Dorais et al., 2001; and Causse et al., 2003). Different
cultivars generally produce the fruits that vary in sugar contents (Stevens, 1972). Secondary
metabolites have also been shown to vary genetically (Davies and Hobson, 1981; and Grolier
and Rock, 1998). Garcia and Barrett (2006) stated that cultivar is likely the most important
factor that influences the quality of processed tomatoes. Tomatoes harvested at different stages
have been shown to differ in the flavor characteristics (Paull, 1999). USDA defined ripening
categories for tomatoes (Grierson and Kader, 1986; USDA, 1976), as illustrated in Table 1.2.
Fresh tomatoes harvested at the red-ripe stage are considered the best-taste tomatoes. However,
fruits at this stage are very fragile and can become damaged easily during postharvest handling
and treatments. It is more common that fresh market tomatoes are harvested at mature green
stage to extend shelf-life and prevent damage during handling and transportation. Cook et al.
(1958) indicated that tomatoes harvested at red-ripe stage are more tolerant to chilling injury than
those at mature green. Other studies also reported the negative effect low temperature storage
has on the flavor of tomatoes included Kader et al. (1978), Stern et al. (1994) and McDonal et al.
(1996). Ketelaere et al. (2004) found that different tomato cultivars and harvesting time
exhibited differences in firmness of the fruits. Kader et al. (1977) showed that fresh tomato
harvested during mature green stage exhibited some off-flavor.

15
Table 1.2 USDA ripening categories for tomatoes (USDA, 1976)
Category (Ripening Stage) Description
Mature Green Entirely light-to dark-green, but mature
Breaker First appearance of external pink, red or greenish-
yellow color; not more than 10%
Turning Over 10%, but not more than 30% red, pink or
orange-yellow
Pink Over 30%, but not more than 60% pinkish or red
Light Red Over 60%, but not more than 90% red
Red Over 90% red, desirable table ripeness
Aroma volatile compounds are key factors to the flavor characteristics of tomatoes. Over
400 volatile compounds have been identified in fresh tomatoes (Petro-Turza, 1987). Krumbein
and Auerswald (1998) and Tandon et al. (2000) determined that approximately 34 volatile
compounds are the most odor-active in fresh tomatoes and more likely to contribute their flavor
characteristics. Many researchers agreed that only a few compounds seem to contribute
significantly to the flavor characteristics of tomatoes. Those included hexanal, (E)-2-hexenal,
(Z)-3-hexenal, (Z)-3-hexenol, (E)-2-(E)-4-decadienal, 2-isobutylthiazole, 6-methyl-5-hepten-2-
one, 1-penten-3-one and β-ionone (Buttery et al., 1971; Petro-Turza 1987; Buttery et al., 1988;
and Ulrich et al., 1997). Although the impact of genetic differences and growing environments
on tomato flavor have not been fully understood due to difficulty in developing consistent
measuring techniques (Bucheli et al., 1999), various factors have been reported to influence the
amount of volatile compounds in tomatoes including postharvest treatments. Langlois et al.
(1996) suggested that volatile compounds can be used to determine differences among tomato
cultivars. Krumbein and Auerswald (2000) determined that the important aroma compounds
were much higher in cherry tomatoes than others.
Volatile compounds have been shown to decrease significantly when tomatoes are stored
at temperature lower than 12.5ºC (Maul et al., 2000; and Boukobza and Taylor, 2002). Maul et
al. (2000) indicated that hexanal, cis-3-hexenal, 1-penten-3-one, trans-2-hexenal, trans-2-
heptenal, and cis-3-hexenol were reduced significantly when storing tomato at 12.5ºC or lower
for 2 days. Boukobza and Taylor (2002) used nine volatile compounds to study the effect

16
storage temperature; those compounds included hexanal, methylbutanal, hexenal, hexenol, 6-
methyl-5-hepten-2-one, 2-isobutylthiazole, ethanol, acetaldehyde, methylbutanol and methyl
butanal. Boukobza and Taylor (2002) reported that tomato samples stored at 6°C showed a
significant decrease in all the nine volatile compounds. They found a considerable increase in
ethanol and acetaldehyde in these tomatoes. At lower temperature, the lipid metabolism was
interrupted and thus blocked the production of those volatiles (Boukobza and Taylor, 2002).
Boukobza and Taylor (2002) also indicated that the increase of ethanol and acetaldehyde
primarily contributed to the off flavor in tomato fruits. Tomatoes stored with modified
atmosphere conditions have been shown to have reduced amount of volatile compounds (Kader
et al., 1978; Stern et al., 1994; Boukobza and Taylor, 2002; Krumbein et al., 2004). Stern et al.
(1994) determined that (Z)-3-hexenal was among the most odor-active volatiles and contributed
the most to the flavor of red-ripe harvested tomatoes stored at 20ºC. Boukobza and Taylor
(2002) reported a significant decrease in hexanal, hexenal, hexenol, methylbutanal, 6-methyl-5-
hepten-2-one and 2-isobutylthiazole due to the enriched nitrogen and carbon dioxide gas.
Decreased amount of volatile compounds, especially, hexanal, was also reported in tomatoes
stored with enriched carbon dioxide gas. Krumbein et al. (2004) found differences in volatile
compound contents varied among various tomato cultivars during short-term storage. Eight of
the volatiles that were found increased during the storage included hexanal, (E)-2-heptenal, (E,
E)-2,4 decadienal, 6-methyl-5-hepten-2-one, geranylacetone, 2-isobutylthiazole, 1-nitro-2-
phenylethane, and geranial, and one compound decreased was methyl salicylate.
Tomatoes stored in refrigerators have been shown to have much less concentration of
volatiles (Buttery, 1993). Significant loss of many volatile compounds resulted from the
processing technique such as paste making. For example, the concentration for (Z)-3-hexenal
decreased from 12,000 ppb in fresh tomato to 0.7 ppb in tomato paste (Buttery, 1993). On the
other hand, some other compounds increased significantly in processed tomato products.
Examples of these compounds include dimethyl sulfide, which none was detected in fresh tomato
and 2,000 ppb detected in paste; β-damascenone, which 1 ppb found in fresh and 14 ppb in
tomato paste; and 3-methylbutyric acid, which 200 ppb found in fresh and 2,000 ppb in tomato
paste (Buttery, 1993).

17
Descriptive Sensory Analysis of Tomato Flavor
Numerous studies have used descriptive sensory analysis techniques and consumer tests
to examine flavor quality of tomatoes. Many studies examined the impact of postharvest
treatments on the flavor characteristics of tomatoes while others determined relationships
between sensory analysis and compositional components of the fruits.
Stevens et al. (1977) compared four flavor characteristics of six varieties of fresh market
tomatoes. Tomatoes were harvested at the red-ripe stage one day prior to the sensory
evaluations. Tomatoes were diced and placed in ceramic cups. Panelist evaluated flavor
attributes of each sample on an unstructured 10-cm line scale, anchored “weak” on the left and
“strong” on the right. Those included sweetness, sourness, tomato-like, and overall intensity.
Some reference standards were provided to assist panelists with their evaluation. The authors
reported that tomatoes differed significantly in sweetness and sourness, but not tomato-like
flavor. They indicated differences among the samples resulted from variation in sugar and acid
contents that differed genetically. They suggested that sugar and acid content contribute not only
to the sweetness and sourness, but the overall flavor intensity of tomatoes.
Watada and Aulenbach (1979) determined the impact of harvesting one variety of fresh
market tomato at different stages on nine sensory characteristics. Fruits were harvested at
mature green, breaker and red-ripe stages. Sensory attributes evaluated in this study included
sweetness, acidity, saltiness, grassiness, stemminess, fruity-floral flavor, mustiness, bitterness
and astringency. Results indicated that harvesting stages had a significant impact on some
sensory characteristics of fresh tomatoes. Sweetness and fruity-floral notes increased
significantly when fruits were harvested at red-ripe stage. Saltiness was also higher in red-ripe
tomatoes. However, other sensory attributes (i.e. grassiness, stemminess, bitterness, and
mustiness) were not found to be different. However, attributes such as green/stemmy, bitter and
musty were not found different among tomatoes picked at various ripening stages.
Resurreccion and Shewfelt (1985) used factor and cluster analyses to determine a
relationship between sensory information and instrumental measurements of tomato flavor. A
variety of fresh tomatoes harvested in winter and spring season, both vine-ripened and ethylene-
treated were used. Sensory evaluation was performed using six panelists, who had prior
experience in sensory evaluation and discriminative abilities. Panelists rated flavor attributes on
150-mm line scales. The flavor attributes used included sweetness, acidity, tomato-like, off-
18
flavor, overall flavor intensity, juiciness, firmness, color, and preference. The authors did not
mention whether the panelists had been trained to be familiar with the sensory attributes used,
but the measurement of preference suggests that the panelists were less like trained panelists and
more like consumers. Color and firmness were the only attributes that were found to be
correlated among the sensory terms and the instrumental measurements reported. Resurreccion
and Shewfelt (1985) reported that temperature for storage of tomatoes and ripening techniques
were important factors of the flavor quality of fresh tomatoes. They found that tomatoes stored
at 21ºC had increased color, sweetness and juiciness. However, tomatoes treated with ethylene
gas were not significantly different from those vine-ripened tomatoes.
Bedford (1989) studied the effect of nutrient media varying in electrical conductivities on
the sensory characteristics of cherry tomatoes. Two tomato varieties harvested at different
ripening stages were used in the study. Sensory evaluation was done with trained panelists. A
nine-point numerical scale was used to determine the intensity of each sensory attribute. Texture
and flavor characteristics evaluated were firmness of flesh, toughness of skin, dry/pulpy,
juiciness, strength of flavor, acid, sweet, savory, salty, green/stemmy, and hay/musty.
Definitions of each attribute were provided to facilitate the evaluation. Bedford (1989) showed
that tomato fruits became softer and juicier as the electrical conductivity increased. With
increased conductivity of the nutrient media, the overall flavor and sweetness of tomatoes were
also found more intense. However, no significant differences in the sensory characteristics were
identified due to variety.
Malundo et al. (1995) attempted to understand the effect of adding sugar and acid to fresh
cut tomatoes on their sensory characteristics. Descriptive sensory analysis was conducted to
determine the difference between control (i.e. no sugar or acid added) and fresh cut tomatoes
soaked with sugar and acid solutions. Malundo et al. (1995) only used one variety of tomato and
three sensory characteristics, which included sour, sweet and tomato impact. Results from the
study showed that adding sugar and acid changed the sweetness and sourness of tomatoes
significantly. Malundo et al. (1995) reported that although increasing levels of sugar and acid
did not affect the so-called “overall tomato impact” of fresh tomatoes, but it did result in higher
consumer acceptability.
Ratanachinakorn et al. (1997) used quantitative descriptive analysis to evaluate fresh
tomatoes harvested at three ripening stages. The scale used for the evaluation was a 15-cm

19
unstructured line scale. Attributes evaluated included tomato aroma, green aroma, off flavor,
sweet to sour balance, and blandness. Results showed that only green aroma was significantly
different among tomatoes harvested at different stages. The authors indicated treating fresh
harvested tomatoes with modified gas such as oxygen, nitrogen and carbon dioxide did not
improve or worsen the flavor or aroma characteristics of the tomatoes. Applying modified
atmosphere gas to fresh tomatoes delayed the ripening process of tomato fruits differently
depending on factors such as application methods, tomato cultivars, and maturity
(Ratanachinakorn et al., 1997).
Johannson et al. (1999) conducted sensory descriptive study to understand the
characteristics of various fresh market tomatoes grown cost-effectively and conventionally.
Thirteen tomato varieties were used for this study. Seven panelists were trained for the
evaluation using an unstructured line scale. The sensory attributes used were red-color, firmness,
juiciness, taste intensity, sweetness, bitterness and acidulous. Reference standards were provided
only for the basic tastes (i.e. sweet, acid, and bitter) for calibration purposes. The results showed
that tomatoes grown ecologically were firmer and juicier than those conventionally grown.
However, no flavor differences were found. Johannson et al. (1999) indicated that no
differences in sensory characteristics were found due to the tomato varieties.
Mual et al. (2000) studied the effect of postharvest storage temperatures on the flavor
characteristics of fresh tomatoes harvested at red-ripe. The samples were divided and stored at 4
temperatures: 5°C, 10°C, 12.5°C and 20°C for 2 to 12 days. The samples were removed from
storage and kept at 20°C for 6 hr before the sensory evaluation began. Descriptive sensory
analysis was conducted along with chemical composition and volatile content analysis. For
sensory analysis, tomatoes were chopped into coarse puree for the evaluation. Five flavor
attributes including typical tomato, sweetness, sourness, green/grassy, and off-flavor, and two
aroma attributes, ripe-tomato and off-odor, were used to describe the sensory characteristics of
the samples. In general, descriptive results showed that, regardless of the storage duration,
tomatoes stored between 5 – 12.5°C were significantly lower in ripe aroma, typical tomato flavor
and sweetness, and higher in off-flavor compared to those stored at 20°C. Additionally, the
authors reported that mature green tomatoes are more likely to suffer chilling injury when stored
at temperature lower than 13ºC.

20
A study by Rodríguez and coworkers (Rodríguez et al., 2001) on canned diced tomatoes
used sensory characteristics including integrity of pieces, firmness, fibrosity, juiciness, flavor
intensity, freshness, sweetness, acidity, bitterness, saltiness, maturity, tomato concentrate,
astringency, and pungency to describe and discriminate canned tomatoes produced from different
varieties and locations. Five varieties of tomato were selected for the study and planted in two
different locations. In addition to a sensory evaluation technique, physical and chemical
analyses of the tomato samples also were performed. These measurements included pH, °Brix,
and firmness. The authors suggested that, with the sensory analysis technique used, canned
diced tomato samples can be differentiated from one another based on their specific sensory
characteristics.
Azodanlou et al. (2003) evaluated sensory attributes of fresh tomatoes harvested at the
red-ripe stage to determine the appropriateness of the sensory attributes. The sensory panel
evaluated intensity of various attributes on a 9-point scale, where 1 represented “very weak
intensity” and 9 represented “very strong intensity.” Attributes rated included odor, aroma,
sweetness, acidity, skin hardness, flesh firmness, juiciness, and mealiness. Twenty eight tomato
varieties were used for the evaluation. Significant differences were reported among the set of
fresh tomatoes. The authors suggested that of the attributes measured, aroma, sweetness, skin
hardness, flesh firmness and juiciness appeared to be important for describing the sensory
characteristics of fresh tomatoes. However, the data had low reproducibility, possibly due to the
amount of training. Azodanlou et al. (2003) did not specify if the panelist received any training
prior to performing the evaluation.
Causse et al. (2003) examined eight sensory characteristics including sweetness, acidity,
tomato aroma, strange aroma, firmness, juiciness, mealiness and skin of fresh tomatoes that
varied in genetic variety and environment conditions. Thirteen varieties, ten of which were large
round and three were cherry tomatoes, were used in the study. Significant differences in sensory
characteristics were found among genotype and growing conditions. Tomato varieties recently
developed were found less sweet, more sour and firmer with lower soluble solids and ascorbic
acid content than the older tomato varieties. The authors also reported that cherry tomatoes were
more flavorful than larger-fruit tomatoes. Hybrid cultivars with old parent lines have been found
sweeter, juicier, less firm and mealier than hybrid tomatoes of modern line parents (Causse et al.,
2003). The authors suggested that even though some instrumental measurements are related to
21
the sensory attributes of tomatoes, they cannot replace the information one would obtain from a
descriptive study to understand the characteristics of fresh tomatoes.
Tandon et al. (2003) developed prediction models for sensory descriptors to differentiate
between different tomatoes based on sensory data and instrumental data. Twelve cultivars of
fresh tomatoes grown in greenhouse conditions were selected for the evaluation. Tomato fruits
were harvested at red-ripe stage. They were shipped the same day to the evaluation site. The
sensory analysis occurred within 2 days after harvested. A modified Spectrum™ technique for
descriptive analysis was used to evaluate the flavor attributes of the samples. Panelists were
trained to become familiar with the characteristics of tomatoes for eight 1-hr sessions. A 150-
mm line scale was used. Tomatoes were cut in halves for the evaluation. Individual panelist
evaluated the samples in temperature-controlled separated booths. The attributes used for the
evaluation included sweet, salty, sour, bitter, grassy, fruity, tomato-like, green tomato, bite,
astringent and metallic. Tandon et al. (2003) was among a very few studies that provided
definitions and reference standards of sensory attributes to assist the panelists with their
evaluation. The authors reported that significant differences were determined in sweetness,
sourness, fruity, tomato-like, and bite attributes among the twelve samples. The differences
likely were due to intrinsic genetic characteristics of each tomato cultivar. Those tomato
samples also showed significant differences in volatile compounds, which suggested that the
amount of volatile compounds could contribute to the difference found in the flavor properties.
Abegaz et al. (2004) attempted to determine if partitioning taste from flavor components
would help to better determine the sensory descriptors for fresh tomatoes. Tomato samples were
grown conventionally and harvested at breaker and red-ripe stages. Panelists were trained to
evaluate tomato samples using Spectrum™ technique. Definitions and reference standards for
the sensory attributes were provided to the panelists. The attributes evaluated include sweet,
sour, salty, bitter, tomato-like, over-ripe, green/grassy, fruity, astringency and bite. Results
showed that partitioning taste and flavor by blocking the nasal cavity created significant
correlation between sensory attributes and some instrumental measurements. Abegaz et al.
(2004) suggested that the evaluation of tomatoes would be more sensitive when taste and flavor
are partitioned.
Krumbein et al. (2004) studied the impact of tomato storage condition similar to those of
retail/household environment. Three fresh market tomato cultivars were used. All tomatoes

22
were grown hydroponically in a steel-glass greenhouse with climate controlled condition.
Tomatoes were harvested at the red-ripe stage and were separated into 3 groups depending on
color variation. Storage condition was set to mimic the conditions generally found at retail and
household environments. Aroma compounds, sugar and acid analyses as well as a sensory
analysis were conducted at harvest and after 4, 7, 10 and 21 days in storage. Qualitative
Descriptive Analysis (QDA) was conducted using 10 panelists who completed 40 hours of
training. Panelists received whole fruits in random order for the evaluation. An unstructured
line scale with 0 – not perceptible and 100 – strongly perceptible was used. The study used a set
of sensory attributes including odor (8 attributes), flavor (11 attributes) and aftertaste (8
attributes). Those attributes included intensive, tomato-like, sour, sweet, fruity, moldy, raw
potato, fresh-cut grass, bitter, and burning. The tomato-like and moldy attributes were found
significantly increased at 4 days after storage, suggesting a relatively short shelf-life of these
tomatoes. Other attributes changed over the course of storage but no specific pattern was
observed. The impact of variety was not significant. The results, however, showed the increase
in amount of volatile compounds in various vine-ripened tomatoes with short-term storage
conditions that mimicked those of retail outlets.
Thybo et al. (2005) evaluated the sensory characteristics of tomatoes varying in harvest
time, maturity, electrical conductivities and nutrient growth media. Ten panelists were trained to
participate in the study. The attributes evaluated were redness of surface skin, firmness,
crispness, sourness, sweetness, tomato aroma and overall tomato impression after chewing. The
authors mentioned that these attributes were used because they can be evaluated with high
reproducibility. The evaluation was done using a 15-cm unstructured line scale. Results showed
that some sensory attributes including firmness, crispness, sweetness and sourness of tomatoes
were significantly different primarily due to the difference in harvesting time. Thybo et al.
(2005) suggested that the impact of variety and harvesting time was much greater than that of
electrical conductivities or growth media.
Relating Sensory Analysis and Instrumental Measurement of Tomato Flavor
Numerous studies attempted to determine the relationship between compositional
information and descriptive sensory data of fresh tomatoes. Interest also has increased in studies
on relating sensory evaluation information with consumer preference or physico-chemical data
23
(Sinesio et al., 2000; Thybo et al., 2005; Serrano-Megias and Lopez-Nicolas, 2006; Lê and
Ledauphin, 2006; and Plaehn and Lundahl, 2006). Watada and Aulenbach (1979) suggested that
sensory attributes may be quantified using objective measurements. Various research has been
conducted to determine the relationship between instrumental and sensory data in order to
predict consumer preference of tomatoes, but Causse et al. (2003) indicated that although
instrumental data were correlated strongly with external quality aspects of tomatoes such as color
and firmness, sensory evaluation is necessary for determining flavor quality.
The sugar and acid composition of tomatoes has been related to sensory measures of
sweetness and sourness. Reducing sugars, total soluble solids and titratable acid contents have
been found to be related, respectively, to the sweetness and sourness of tomatoes (Bisogni et al.,
1976; Stevens et al., 1977; Stevens et al., 1979; Malundo et al., 1995; Bucheli et al., 1999;
Tandon et al., 2003). Glucose and fructose are the primary sugar compounds contributing to the
sweetness; and citric and malic acid are the primary contributor to the acidity of tomatoes
(Stevens et al., 1977; Petro-Turza, 1987; and Abegaz et al., 2004). In other studies by Kader et
al. (1977) and Stevens et al. (1977), sourness was found to be correlated with pH, sweetness with
reducing sugar contents, and off-flavor with the amount of volatile compounds. Bisogni et al.
(1976) determined that the soluble solids content was correlated with sweetness, overall quality
and overall flavor of tomatoes. The flavor characteristics of processed tomato products are
influenced by the balance of sugar and acid contents (Garcia and Barrett, 2006). Stevens and
colleagues (Stevens et al., 1977) reported the relationship between the “sensation of sweetness”
and “the glucose-acid interaction” that the presence of glucose and fructose, the interaction
between glucose and citric acid, and the interaction between glucose and fructose are responsible
for about 80% of the sweetness character of tomatoes. Stevens et al. (1977) also indicated that
citric acid resulted in lower sweetness of tomatoes when the concentration of sugar was low and
in higher sweetness perception when sugar concentration was high. Bisogni et al. (1976)
reported a strong correlation between titratable acid content and acidity of tomato fruit and
determined that total soluble solids was positively correlated with sweetness, overall quantity
and flavor of tomatoes. Tandon et al. (2003) reported that the sucrose equivalent was correlated
with the characteristics of sour, fruitiness, tomato-like, green-tomato, and bite attribute of fresh
tomatoes. Additionally, total acidity can be used to describe the sweet, grassy, tomato-like, and
astringency characters, whereas sucrose equivalent can describe sour, fruitiness, tomato-like,

24
green-tomato, and bite characters (Tandon et al., 2003). Most sugars are, however, destroyed
during the processing through heat treatments.
A large body of literature exists attempting to determine the relationship between volatile
compounds and sweetness and sourness of tomatoes. Mual et al. (2000) found that ripe aroma
was primarily influenced by hexanal, β-ionone, methanol, 2+3-methylbutanol, cis-2-hexanal and
total soluble solids. Off-odor was impacted by acetaldehyde, acetone, methanol, and pH.
Sweetness was influenced by trans-2-heptanal, 1-penten-3-one, and β-ionone and sourness by
titratable acidity, β-ionone, hexanal, and 1-nitro-2-phenylethane. Sourness score was negatively
correlated with hexanal, trans-2-heptenal, geranylacetone, and β-ionone and positively correlated
with methanol. Tandon et al. (2003) reported a positive influence of cis-3-hexanal on fruitiness
characteristic and a negative influence on astringency. Sweet, sour, grassy, tomato-like, bite and
astringency were found influenced by the presence of ethanol. Krumbein et al. (2004) associated
the volatile compounds with sensory attributes of fresh market tomatoes and found that (E)-2-
hexenal was associated with fresh-cut grass, intensive, fruity and sweet attributes. (Z)-hexanal
and 1-penten-3-one were associated with sweet flavor. Hexanal, 2-isobutythiazole, 6-methyl-5-
hepten-2-one and (E)-2-heptenal were associated with the moldy attribute. Sinesio et al. (2000)
compared data from electronic noses and sensory attributes and reported that the electric nose
provided better discrimination of fresh tomatoes.
Various studies have attempted to determine the relationship between descriptive sensory
analysis information with consumer data. The primary goal for these attempts was to determine
a means to improve the quality of tomatoes that meet consumer expectation while providing high
yield, disease resistant, and long shelf-life. Azodanlou et al. (2003) reported that aroma and
sweetness were the most important quality attributes for tomatoes and the sweetness may be used
to determine consumer acceptability of tomatoes, but those authors did not measure many
specific sensory qualities of flavor or aroma. Thybo et al. (2005) reported high correlation
between sensory and physical data on firmness of tomatoes and Serrano-Megias and Lopez-
Nicolas (2006) reported that tomato odor, flavor, sweetness, acidity and hardness were positively
correlated with consumer preference. In studies with more detailed sensory descriptions,
Lengard and Kermit (2006), Lê and Ledauphin (2006), and Plaehn and Lundahl (2006)
attempted to determine positive and negative drivers of liking of tomatoes, and reported similar
results in that some sensory attributes including tomato odor and flavor, sweetness, juiciness,

25
skin color and firmness illustrated positive impact on consumer liking whereas mealiness and
skin thickness illustrated negative impact.
Conclusions Numerous published studies have been done to examine the sensory characteristics and
compositional properties of fresh tomatoes as influenced by factors such as genotypes, growing
conditions, and postharvest treatments. That research has received much attention because of
continued criticism on the lack of flavor characteristics in fresh market tomatoes in the past two
decades. Many studies focused on using instrumental measurements to understand these
impacts, while others attempted to use sensory evaluation to determine the flavor and texture
quality of tomatoes. Attempts to correlate instrumental and sensory data have been done.
Although sensory evaluation has been considered, many studies only included a small number of
flavor/texture attributes. In order to better understand the sensory components of fresh tomatoes,
more extensive descriptive sensory analysis should be pursued. In addition, minimal work has
been done to determine the sensory characteristics appropriate for describing both fresh and
processed tomatoes. Moreover, no research has been conducted to compare and contrast
similarities or differences between fresh and processed tomatoes of the same cultivars, to better
understand the impact of heat processing on the sensory properties of the products.

26
References ABEGAZ, E.G., TANDON, K.S., SCOTT, J.W., BALDWIN, E.A. and SHEWFELT, R.L. 2004.
Partitioning taste from aromatic flavor notes of fresh tomato (Lycopersicon esculentum, Mill) to develop predictive models as a function of volatile and nonvolatile components. Postharvest Biol. Technol. 34, 227-235.
AGARWAL, S. and VENKETESHWER, R. 1998. Tomato lycopene and low-density lipoprotein
oxidation: a human dietary intervention study. Lipids. 33, 981-984. AGARWAL, S., SHEN, H. and AGARWAL, S. 2001. Lycopene content of tomato products: its
stability, bioavailability and in vivo antioxidant properties. J. Med. Food. 4, 9-15. APARICIO, R. and MORALES, M.T. 1998. Characterization of olive ripeness by green aroma
compounds of virgin olive oil. J. Agric. Food Chem. 46, 1116-1122. ARAIS, S., KOYANAGI, O. and FUJIMAKI, M. 1967. Studies on flavor components in
soybean part IV: Volatile neutral compounds. Agric. Biol. Chem. 7, 868-873. AUERSWALD, H., PETERS, P., BRUCKNER, B. KRUMBEIN, A. and KUCHENBUCH, R.
1999a. Sensory analysis and instrumental measurements of short-term stored tomatoes (Lycopersicon esculentum Mill.) Postharvest Biol. Technol. 15, 323-334.
AUERSWALD, H., SCHWARZ, D., KORNELSON, C., KRUMBEIN, A. and BRUCKNER, B.
1999b. Sensory analysis, sugar and acid content of tomato at different EC values of the nutrient solution. Sci. Hort. 82, 227-242.
AZODANLOU, R., DARBELLAY, C., LUISIER, J.L., VILLETTAZ, J.C. and AMADÒ, R.
2003. Quality assessment of strawberries (Fragaria species). J. Agric. Food Chem. 51, 715-721.
BALDWIN, E.A., NISPEROS-CARRIEDO, M.O. BAKER, R. and SCOTT, J.W. 1991.
Quantitative analysis of flavor parameters in six Florida tomato cultivars (Lycopersican esculentum, Mill). J. Agric. Food Chem. 39, 1135-1140.
BALDWIN, E.A., MCDONALD, R.E. and MCCOLLUM, T.G. 1996. Prestorage heat treatment
influence free sterols and flavor volatiles of tomatoes stored at chilling temperature. J. Am. Soc. Hort. Sci. 121, 531-536.
BALDWIN, E.A., SCOTT, J.W., EINSTEIN, M.A., MALUNDO, T.M.M., CARR, B.T.,
SHEWFELT, R.L. and TANDON, K.S. 1998. Relationship between sensory and instrumental analysis for tomato flavor. J Am Soc Hort Sci. 125, 906–915.

27
BALDWIN, E.A., GOODNER, K., PLOTTO, A., PRITCHETT, K. and EINSTEIN, M. 2004. Effect of volatiles and their concentration on perception of tomato descriptors. J. Food Sci. 69, S310-S318.
BATU, A. 2004. Determination of acceptable firmness and colour values of tomatoes. J. Food
Eng. 61, 471-475. BEDFORD, L.V. 1989. Sensory quality of fresh tomatoes: comparison of tomatoes grown in
nutrient media of different conductivities. Camden Food and Drink Research Association/Technical Memorandum No. 531.
BISOGNI, C.A. and AMBREESTER, G. 1976. Quality comparisons of room ripened and field
ripened tomato fruits. J. Food Sci. 41, 333-338. BOTT, L. and CHAMBERS, E. IV. 2006. Sensory characteristics of combinations of chemicals
potentially associated with beany aroma in foods. J. Sens. Stud. 21, 308-321. BOUKOBZA, F., DUNPHY, P.J. and TAYLOR, A.J. 2001. Measurement of lipid oxidation-
derived volatiles in fresh tomatoes. Postharvest Biol. Technol. 23, 117-131. BOUKOBZA, F. and TAYLOR, A.J. 2002. Effect of postharvest treatment on flavour volatiles
of tomatoes. Postharvest Biol. Technol. 25, 321-331. BRAUSS, M.S., LINFORTH, R.S. and TAYLOR, A.J. 1998. Effect of variety, time of eating
and fruit-to-fruit variation on volatile release during eating of tomato fruits (Lycopersicon esculentum). J. Agric. Food Chem. 46, 2287–2292.
BRUHN, C.M., FELDMANN, N., GARTITZ, C., HARWOOD, J., IVANS, E., MASHALL, M.,
RILEY, A., THURBER, D. and WILLAMSON, E. 1991. Consumer perceptions of quality: apricots, cantaloupes, peaches, pears, strawberries, and tomatoes. J. Food Qual. 14, 187–195.
BRUMFIELD, R.G., ADELAJA, A.O. and LININGER, K. 1993. Consumer tastes, preferences,
and behavior in purchasing fresh tomatoes. J. Am. Soc. Hort. Sci. 118, 433-438. BUCHELI, P., VOIROL, E., DELATORRE, R., LOPEZ, J., RYTZ, A., TANKSLEY, S.D. and
PETIARD, V. 1999. Definition of nonvolatile markers for flavor of tomato (Lycopersicon esculentum Mill.) as tools in selection and breeding. J. Agric. Food Chem. 47, 659–664.
BUESCHER, R.W. 1979. Influence of carbon dioxide on postharvest ripening and deterioration
of tomatoes. J. Am. Soc. Hort. Sci. 104, 545–547. BUETTNER, A. and MESTRES, M. 2005. Investigation of the retronasal perception of
strawberry aroma aftersmell depending on matrix composition. J. Agric. Food Chem. 53, 1661-1669.

28
BULT, J. H. F., SCHIFFERSTEIN, H. N. J., ROOZEN, J. P., BORONAT, E. D., VORAGEN, A. G. J. and KROEZE, J. H. A. 2002. Sensory evaluation of character impact components in an apple model mixture. Chem. Senses. 27, 485-494.
BUTTERY, R.G., SEIFERT, R.M., GUADAGNI, D.G. and LING, L.C. 1971. Characterization
of additional volatile components of tomato. J. Agric. Food Chem. 19, 524-529. BUTTERY, R.G., TERANISHI, R. and LING, L.C. 1987. Fresh tomato aroma volatiles: A
quantitative study. J. Agric. Food Chem. 35, 540–544. BUTTERY, R. G., TERANISHI, R., LING, L. C. and FLATH, R. A. 1988. Quantitative studies
on origins of fresh tomato aroma volatiles. J. Agric. Food Chem. 36, 1247–1250. BUTTERY, R.G. 1993. Quantitative and sensory aspects of flavour of tomato and other
vegetables and fruits. Flavor Science. Acree, T.E., Teranishi, R., American Chemical Society, Washington DC, 259–285.
BUTTERY, R.G. and LING, L.C. 1993. Volatile components of tomato fruit and plant parts:
Relationship and biogenesis. In: Teranishi, R., Buttery, R.G., Sugisawa, H. (Eds.), Bioactive Volatile Compounds from Plants: ACS Symposium Series No. 525. American Chemical Society, Washington, DC, pp. 23–34.
BUTTERY, R.G., TERANISHI, R., FLATH, R.A. and LING, L.C. 1998. Fresh tomato volatiles:
Composition and sensory studies. In: Teranishi, R., Buttery, R.G., Shahidi, F. (Eds.), Flavor Chemistry: Trends and Developments: ACS Symposium Series No. 388. American Chemical Society, Washington, DC, pp. 213–222.
CAPORALE, G., POLICASTRO, S. and MONTELEONE, E. 2004. Bitterness enhancement
induced by cut grass odorant (cis-3-hexen-1-ol) in a model olive oil. Food Qual. Pref. 15, 219–227.
CAUSSE, M., BURET, M., ROBINI, K. and VERSCHAVE, P. 2003. Inheritance of nutritional
and sensory quality traits in fresh market tomato and relation to consumer preferences. J. Food Sci. 68, 2342-2350.
CHAMBERS D.H, ALLISON, A.A. and CHAMBERS E. IV. 2004. Effects of Training on
Performance of Descriptive Sensory Panelists. J. Sens. Stud. 19: 486-499. CHAMBERS, E. IV, JENKINS, A. and MCGUIRE, B. 2006. Flavor properties of plain soymilk.
J. Sens. Stud. 21: 165-179. CHUNG, T.Y., KURATA, T., KATO, H. and FUJIMAKI, M. 1979. Change of flavor
components of tomato fruits during artificial ripening. J. Agric. Chem. Soc. Japan (Nippon Nogei Kogaku Kaishi). 53, 391-341.

29
CLINTON, S.K. 1998. Lycopene: Chemistry, biology and implications for human health and disease. Nutr. Rev. 56, 35–51.
COOK, C.C., PARSONS, C.S. and MCCOLLOCH, L.P. 1958. Methods to extend storage of
fresh vegetables aboard ships of the U.S. Navy. Food Tech. 12, 548. COOK-MOZAFFARI, P.J., AZORDEGAN, F., DAY, N.E., RESSICAUD, A., SABAI, C. and
ARAMESH, B. 1979. Oesophageal cancer studies in the Caspian Littoral of Iran: results of a case-control study. Br. J. Cancer. 39, 293–309.
CROUZET, J., SIGNORET, A., COULIBALY, J. and ROUDSARI, M.H. 1986. Influence of
controlled atmosphere storage on tomato volatile components. Dev Food Sci. 12, 355–367.
CUELLAR, S. R. 2002. Marketing fresh fruit and vegetable imports in the U.S.: Status,
Challenge and Opportunity. Research Bulletin (R. B. 2002-2004). pp. 20. Food Industry Management, Cornell University, Ithaca, New York.
DALAL, K.B., OLSON, L.E., YU, M.H. and SALUNKHE, K.B. 1967. Gas chromatography of
the field-, glass-greenhouse-grown, and artificially ripening tomatoes. Phytochemistry. 6, 155-157.
DALAL, K.B., SALUNKHE, D.K., OLSON, L.E., DO, S.Y. and YU, M.H. 1968. Volatile
components of developing tomato fruit grown under field and greenhouse conditions. Plant Cell Physiol. 9, 389-400.
DAVIES, J.N. and HOBSON, G.E. 1981. The constituents of tomato fruit – the influence of
environment, nutrition and genotype. Crit. Rev. Food Sci. Nutr. 15, 205-280. DIRINCK, P., SCHREYEN, L., van WASSENHOVE, F.V. and SCHAMP, N. 1976. Flavor
quality of tomatoes. J. Sci. Food Agric. 27, 499-508. DORAIS, M., PAPADOPOULOS, A.P. and GOSSELIN, A. 2001. Greenhouse tomato fruit
quality. Hortic. Rev. 26, 239-319. DRAVNIEKS, A. 1985. Atlas of odor character profiles. ASTM Data series DS61. American
Society for Testing and Materials, Philadelphia, PA. ETIEVANT, P.X., LANGLOIS, D., PIERRON, P. and JERROT, A. 1996. Sensory and
instrumental characterization of commercial tomato varieties. Z Lebens Unters Forsch. 203, 534-540.
FURIA, T.E., and BELLANCA, N. eds. 1975. Fenaroli’s handbook of flavor ingredients, 2nd ed.
Vol. 2, pp. 248, 253. CRC Press, Cleveland, Ohio.
30
GALÁN-SOLDEVILLA, H., RUIZ-PÉREZ-CACHO, M. P., SERRANO JIMÉNEZ, S., JODRAL VILLAREJO, M. and BENTABOL MANZANARES, A. 2005. Development of a preliminary sensory lexicon for floral honey. Food Qual. Pref. 16, 71-77
GARCIA, E. and BARRETT, D.M. 2006. Evaluation of processing tomatoes from two
consecutive growing seasons: quality attributes, peelability and yield. J. Food Process. Preserv. 30, 20-36.
GEESON, J.D., BROWNE, K.M., MADDISON, K., SHEPHERD, J., and GUARALDI, F. 1985.
Modified atmosphere packaging to extend the shelf-life of tomatoes. J. Food Technol. 20, 339–349.
GOULD, W.A. 1983. Tomato production, processing and quality evaluation. Avi. Pub. Co.,
Westport, Colorado. pp. 445. GREEN-PETERSEN, D.M.B., NIELSEN, J. and HYLDIG, G. 2006. Sensory Profiles of the
most common salmon products on the Danish market. J. Sens. Stud. 21, 415-427. GRIERSON, A. and KADER, A.A. 1986. Fruit ripening and quality. In J. G. Atherton, & J.
Rudich (Eds.), Tomato crop (pp. 241–280). USA: Chapman and Hall Ltd. GROLIER, P. and ROCK, E. 1998. Composition of tomato in antioxidants: variations and
methodology. In Proceedings of the tomato and health seminar, 1998, May 25-28, Pamplona, Spain, Avignon, France: Amitom. pp 23-25.
GUTH, H. and GROSCH, W. 1991. A comparative study of the potent odorants of different
virgin olive oils. Fat. Sci. Technol. 93, 335-339. GUTH, H. and GROSCH, W. 1993. Quantitation of potent odorants of virgin olive oil by stable-
isotope dilution assays. J. Am. Oil Chem. Soc. 70, 513-518. HAKIM, A., BATAL, K.M., AUSTIN, M.E., GULLO, S. and KHATOON, M. 2000. Quality of
packaged fresh-cut tomatoes. Adv. Hort. Sci. 14, 59-64. HATANAKA, A. 1996. The fresh green odor emitted by plants. Food Rev. Int. 12, 303-350. HAYASE, F., CHUNG, T.Y. and KATO, H. 1984. Changes of volatile components of tomato
fruits during ripening. Food Chem. 14, 113-124. HAYES, W.A., SMITH, P.G. and MORRIS, A.E.J. 1998. The production and quality of tomato
concentrates. Crit. Rev. Food Sci. Nutr. 38, 537-564. HO, L. 1996. The mechanism of assimilates partitioning and carbohydrate compartmentation in
fruit in relation to the quality and yield of tomato. J. Exp. Bot. 47, 1239–1243. HOBSON, G. 1988. How the tomato lost its taste. New Scientist. 1632, 46–50.

31
HOBSON, G.E. 1981. The short-term storage of tomato fruit. J. Hortic. Sci. 56, 363–368. ITO, Y., SUGIMOTO, A., KAKUDA, T. and KUBOTA, K. 2002. Identification of potent
odorants in Chinese Jasmine Tea scented with flower of Jasminum sambac. J. Agric. Food Chem. 50, 4878-4884.
JAKOBSEN, H.B., HANSEN, M., CHRISTENSEN, M.R. BROCKHOFF, P.B. and OLSEN,
C.E. 1998. Aroma volatiles of blanched green peas (Pisum sativum L.). J. Agric. Food Chem. 46, 3727-3734.
JIANG, L. and KUBOTA, K. 2004. Differences in the volatile components and their odor
characteristics of green and ripe fruits and dried pericarp of Japanese pepper (Xanthoxylum piperitum DC.). J. Agric. Food Chem. 52, 4197-4203.
JIANG, L. 2005. Volatile composition of the laksa plant (Polygonum hydropiper L.), a potential
source of green note aroma compounds. Flavour Fragr. J. 20, 455-459. JOHANSSON, L., HAGLUND, A., BERGLUND, L., LEA, P. and RISVIK, E. 1999. Preference
for tomatoes, affected by sensory attributes and information about growth conditions. Food Qual. Pref. 10, 289-298.
JOHNSON, J.H., GOULD, W.A., BADENSHOP, A.F. and JOHNSON, R.M. JR. 1968.
Quantitative comparison of isoamylol, pentanol, and 3-hexen-1-ol in tomato juice. Varietal and harvest differences and processing effects. J. Agric. Food Chem. 16, 255-258.
JONES, R.A. and SCOTT, S.J. 1983. Improvement of tomato flavor by genetically increasing
sugar and acid content. Euphytica. 32, 845-855. JORDÁN, M.J., MARGARÍA, C.A., SHAW, P.E. and GOODNER, K.L. 2003. Volatile
components and aroma active compounds in aqueous essence and fresh pink guava fruit puree (Psidium guajaVa L.) by GC-MS and multidimensional GC/GC-O. J. Agric. Food Chem. 51, 1421-1426.
KADER, A.A., STEVENS, M.A., ALBRIGHT-HOLTON, M., MORRIS, L.L. and ALGIZI, M.
1977. Effect of fruit ripeness when picked on flavor and composition in fresh market tomatoes. J. Am. Soc. Hortic. Sci. 102, 724–731.
KADER, A.A., MORRIS, L.L., STEVENS, M.A. and ALLBRIGHT-HOLTON, M. 1978.
Composition and flavor quality of fresh market tomatoes as influenced by some postharvest handling procedures. J. Am. Soc. Hort. Sci. 103, 6–13.
KADER, A.A., ZAGORY, D. and KERBEL, E.L. 1989. Modified atmosphere packaging of
fruits and vegetables. Crit. Rev. Food Sci. Nutr. 28, 1–30.

32
KAZENIAC, S.J. and HALL, R.M. 1970. Flavor chemistry of tomato volatiles. J. Food Sci. 35, 519-530.
KETELAERE, B.D., LAMMERTYN, J., MOLENBERGHS, G., DESMET, M., NICOLAΪ, B.
and BAERDEMAEKER., J.D. 2004. Tomato cultivar grouping based on firmness change, shelf life and variance during postharvest storage. Postharvest Biol. Technol. 34, 187-201.
KING, B.M., ARENTS, P., DUINEVELD, C.A.A., MEYNERS, M., SCHROFF, S.I. and
SOEKHAI, S.T. 2006. Orthonasal and retronasal perception of some green leaf volatiles used in beverage flavors. J. Agric. Food Chem. 54, 2664 - 2670.
KLIEBER, A., RATANACHINAKORN, B. and SIMONS, D.H. 1996. Effects of low oxygen
and high carbon dioxide on tomato cultivar ‘Bermuda’ fruit physiology and composition. Sci. Hortic. 65, 251–261.
KOHLMEIER, L., KARK, J.D., GOMEZ-GRACIA, E., MARTIN, B.C., STECK, S.E.,
KARDINAAL, A.F., RINSTAD, J., THAMM, M., MASAEV, V., RIEMERSMA, R., MARTIN-MORENO, J.M., HUTTUNEN, J.K. and KOK, F.J. 1997. Lycopene and myocardial infarction risk in the EURAMIC Study. Am. J. Epidemiol. 146, 618 –626.
KOMTHONG, P., KATOH, T., IGURA, N. and SHIMODA, M. 2006. Changes in the odours of
apple juice during enzymatic browning. Food Qual. Pref. 17, 497–504 KRUMBEIN, A. and AUERSWALD, H. 1998. Characterization of aroma volatiles in tomatoes
by sensory analysis. Nahrung. 42, 395–399. KRUMBEIN, A., PETERS, P. and BRÜCKNER, B. 2004. Flavor compounds and a quantitative
descriptive analysis of tomatoes (Lycopersicon esculentum Mill.) of different cultivars in short-term storage. Postharvest Biol. Technol. 32, 15-28.
LANA, M.M., TIJSKENS, L.M.M., and KOONER, O. 2005. Effect of storage temperature and
fruit ripening on firmness of fresh cut tomatoes. Postharvest Biol. Technol. 35, 87-95. LANGLOIS, D., ETIEVANT, P.X., PIERRON, P. and JORROT, A. 1996. Sensory and
instrumental characterisation of commercial tomato varieties. Z. Lebensm. Unters. Forsch. 203, 534–540.
LÊ, S. and LEDAUPHIN, S. 2006. You like tomato, I like tomato: segmentation of consumers
with missing values. Food Qual. Pref. 17, 228-233. LEE, S.Y., LUNA-GUZMÁN, I., CHANG, S., BARRETT, D.M., and GUINARD, J.X. 1999.
Relating descriptive analysis and instrumental texture data of processed diced tomatoes. Food Qual. Pref. 10, 447-455.

33
LEE, A., THURNHAM, D.I. and CHOPRA, M. 2000. Consumption of tomato products with olive oil but not sunflower oil increases the antioxidant activity of plasma. Free Rad. Biol. Med. 29, 1051-1055.
LENGARD, V. and KERMIT, M. 2006. 3-Way and 3-block PLS regressions in consumer
preference analysis. Food Qual. Pref. 17, 234-242. LIN, S. and BREWER, M.S. 2005. Effects of blanching method on the quality characteristics of
frozen peas. J. Food Quality. 28, 350-360. LIN, W.C. and BLOCK, G.S. 1998. The effect of culture practice and storage temperature on
quality and flavor volatiles of greenhouse tomatoes. Acta Hortic. 464, 213 – 218. LIU, Q.Y., HUNG, J.C., HEBER, D., GO, V.L., REUTER, V.E., CORDON-CARDO, C.,
SCHER, H.I., MARSHALL, J.R. and ZHANG, Z.F. 2001. Inverse associations between plasma lycopene and other carotenoids and prostate cancer. Cancer Epidemiol. Biomarkers Prev. 10, 749 –756.
LUCIER, G., LIN, B., ALLSHOUSE, J. and KANTOR, L. 2000. Factors affecting tomato
consumption in the United States. Economic Research Service; Vegetables and Specialties. 282, 26-32.
LUCIER, G. 2006. Tomatoes. Economic Research Services Briefing Room. www.ers.usda.gov. LUGASI, A., BÍRÓ, L., HÓVÁRIE, J., SÁGI, K.V., BRANDT, S. and BARNA, É. 2003.
Lycopene content of foods and lycopene intake in two groups of Hungarian population. Nutr. Res. 23, 1035-1044.
MALUNDO, T.M.M., SHEWFELT, R.L. and SCOTT, J.W. 1995. Flavor quality of fresh tomato
(Lycopersicon esculentum Mill.) as affected by sugar and acid levels. Postharvest Biol. Technol. 6, 103–110.
MANEERAT, C., HAYATA, Y., KOZUKA, H., SAKAMOTO, K. and OSAJIMA, Y. 2002.
Application of the Porapak Q column extraction method for tomato flavor volatile analysis. J. Agric. Food Chem. 50, 3401-3404.
MAUL, F., SARGENT, S.A., SIMS, C.A., BALDWIN, E.A., BALABAN, M.O. and HUBER,
D.J. 2000. Tomato flavor and aroma quality as affected by storage temperature. J. Food Sci. 65, 1228–1237.
MCDONALD, R.E., MCCOLLUM, T.G. and BALDWIN, E.A. 1996. Prestorage heat treatments
influence free sterols and flavor volatiles of tomatoes stored at chilling temperature. J. Am. Soc. Hort. Sci. 121, 531-536.
MCGLASSON, W.B., LAST, J.H., SHAW, K.J. and MELDRUM, S.K. 1987. Influence of non-
ripening mutants rin and nor on the aroma of tomato fruit. Hort. Sci. 22, 632–634.

34
MIERS, J.C. 1966. Formation of Volatile Sulfur Compounds in Processed Tomato Products. J.
Agric. Food Chem. 14, 419-423. MORALES, M.T., CALVENTE, J.J. and APARICIO, R. 1996. Influence of olive ripeness on
the concentration of green aroma compounds in virgin olive oil. Flavour Fragr. J. 11, 171-178.
MORALES, M.T. and APARICIO, R. 1999. Effect of extraction conditions on sensory quality of
virgin olive oil. J. Am. Oil Chem. Soc. 76, 295-300. PAÇI KORA, E., LATRILLE, E., SOUCHON, I. and MARTIN, N. 2003. Texture-flavor
interactions in low fat stirred yogurt: how mechanical treatment, thickener concentration and aroma concentration affect perceived texture and flavor. J. Sens. Stud. 18, 367-390.
PAULL, R.E., 1999. Effect of temperature and relative humidity on fresh commodity quality.
Postharvest Biol Technol. 15, 263–277. PETERSEN, K.K., WILLUMSEN, J. and KAACK, K. 1998. Composition and taste of tomatoes
as affected by increased salinity and different salinity sources. J. Hortic. Sci. Biotechnol. 73, 205-215.
PETRO-TURZA, M. 1987. Flavor of tomato and tomato products. Food Rev. Int. 2, 309-351. PINO, J.A., MARBOT, R. and VAZQUEZ, C. 2001. Characterization of volatiles in strawberry
guava (Psidium cattleianum Sabine) fruit. J. Agric. Food Chem. 49, 5883-5887. PLAEHN, D. and LUNDAHL, D.S. 2006. An L-PLS preference cluster analysis on French
consumer hedonics to fresh tomatoes. Food Qual. Pref. 17, 243-256. POLLACK, S. L. 2001. Consumer demand for fruit and vegetables: the U.S. Example. Changing
structure of global food consumption and trade. pp. 49-54. Economic Research Services/USDA.
RATANACHINAKORN, B., KLIEBER, A. and SIMONS, D.H. 1997. Effect of short-term
controlled atmospheres and maturity on ripening and eating quality of tomatoes. Postharvest Biol. Technol. 11, 149-154.
REINERS, J. and GROSCH, W. 1998. Odorants of virgin olive oils with different flavor profiles.
J. Agric. Food Chem. 46, 2754-2763. RESURRECCION, A.V.A. and SHEWFELT, R.L. 1985. Relationship between sensory
attributes and objective measurements of postharvest quality of tomatoes. J. Food Sci. 50, 1242-1245.

35
RODRÍGUEZ, A., LOPEZ, J., GONZALEZ, C., DE LA TORRE, R. and MANGUT, V. 2001. Sensory Evaluation of canned diced tomato varieties. Proc. 7th Int. Symp. On Processing Tomato. Acta Hort 542, ISHS 2001. pp. 269-275.
SALAS, J.J., SANCHEZ, C., GARCIA-GONZALEZ, D.L. and APARICIO, R. 2005. Impact of
the suppression of lipoxygenase and hydroperoxide lyase on the quality of the green odor in green leaves. J. Agric. Food Chem. 53, 1648-1655.
SANO, K., TSUDA, Y., SUGANO, H., AOU, S. and HATANAKA, A. 2002. Concentration
effects of green odor on event-related potential (P300) and pleasantness. Chem. Senses. 27, 225-230.
SERRANO-MEGÍAS, M. and LÓPEZ-NICOLÁS J.M. 2006. Application of agglomerative
hierarchical clustering to identify consumer tomato preferences: influence of physicochemical and sensory characteristics on consumer response. J. Sci. Food Agri. 86, 493-499.
SINESIO, F., DI NATALE, C., QUAGLIA, G.B., BUCARELLI, F.M., MONETA, E.,
MACAGNANO, A., PAOLESSE, R. and D’AMICO, A. 2000. Use of electronic nose and trained sensory panel in the evaluation of tomato quality. J. Sci. Food Agric. 80, 63-71.
STERN, D.J., BUTTERY, R.G., TERANISHI, R., LING, L., SCOTT, K. and CANTWELL, M.
1994. Effect of storage and ripening on fresh tomato quality, Part I. Food Chem. 49, 225-231.
STEVENS, M.A. 1972. Citrate and malate concentrations in tomato fruits: genetic control and
maturational effects. J. Am. Soc. Hort. Sci. 97, 655-658. STEVENS, M.A., KADER, A.A., ALBRIGHT-HOLTON, M. and ALGAZI, M. 1977.
Genotypic variation for flavor and composition in fresh market tomatoes. J. Am. Soc. Hortic. Sci. 102, 680-689.
STEVENS, M.A., KADER, A.A. and ALBRIGHT, M. 1979. Potential for increasing tomato
flavor via increased sugar and acid content. J. Am. Soc. Hort. Sci. 104, 40–42. TAKAHASHI, N. SASAKI, R. and CHIBA, H. 1979. Enzymatic improvement of food flavor
IV: Oxidation of aldehydes in soybean extracts by aldehyde oxidase. Agric. Biol. Chem. 43, 2557-2562.
TANDON, K.S., BALDWIN, E.A. and SHEWFELT, R.L. 2000. Aroma perception of individual
volatile compounds in fresh tomatoes (Lycopersicon esculentum, Mill.) as affected by the medium of evaluation. Postharvest Biol. Technol. 20, 261-268.

36
TANDON, K.S., BALDWIN, E.A., SCOTT, J.W. and SHEWFELT, R.L. 2003. Linking sensory descriptors to volatile and nonvolatile components of fresh tomato flavor. J. Food Sci. 68, 2366-2371.
TAYLOR, A.J. 1996. Volatile flavor release from foods during eating. Crit. Rev. Food Sci. Nutr.
36, 765–784. TAYLOR, A.J., LINFORTH, R.S.T., HARVEY, B.A. and BLAKE, A. 2000. Atmospheric
pressure chemical ionisation mass spectrometry for in vivo analysis of volatile flavour release. Food Chem. 71, 327–338.
THAKUR, B. R., SINGH, R. K., and NELSON, P. E. 1996. Quality attributes of processed
tomato products: a review. Food Rev. Int. 12, 375–401. THYBO, A.K., BECHMANN, I. and BRANDT, K. 2005. Integration of sensory and objective
measurements of tomato quality: quantitative assessment of the effect of harvest date as compared with growth medium (soil versus rockwool), electrical conductivity, variety and maturity. J. Sci. Food Agric. 85, 2289–2296.
TSUGANE, S., TSUDA, N., GEY, F. and WATANABE, S. 1992. Cross-sectional study with
multiple measurements of biological markers for assessing stomach cancer risks at the population level. Environ. Health Perspect. 98, 207–210.
ULRICH, D., KRUMBEIN, A. and RAPP, A. 1997. Analysis of aroma compounds in
strawberry, sour cherry and tomato by gas chromatography after solid phase micro-extraction. Deutsche Lebensmittel Rundschau. 93, 311–316.
USDA. 1976. United States standards for grade of fresh tomatoes. US Dept. Agric., Mktg., Serv.,
Washington DC. pp. 10. VARA-UBOL, S., CHAMBERS, E. IV. and CHAMBERS, D.H. 2004. Sensory characteristics
of chemical compounds potentially associated with beany aroma. J. Sens. Stud. 19, 15-26.
VILANOVA, M. and SOTO, B. 2005. The impact of geographic origin on sensory properties of
Vitis vinifera cv. Mencia. J. Sens. Stud. 20, 503-511. WANG, Z.H., DOU, J., MACURA, D. DURANCE, T.D. and NAKAI, S. 1998. Solid phase
extraction for GC analysis of beany flavours in soymilk. Food Res. Intern. 30, 503-511. WATADA, A.E. and AULENBACH, B.B. 1979. Chemical and sensory qualities of fresh market
tomatoes. J. Food Sci. 44, 1013–1016. WILKENS, W.F. and LIN, F.M. 1970. Gas chromatographic and mass spectral analyses of
soybean milk volatiles. J. Agric. Food Chem. 18, 333-336.
37
WRIGHT, J. 2004. Flavor Creation. Allured Publishing, Carol Stream, Illinois. pp. 200. WU, T. and ABBOTT, J.A. 2002. Firmness and force relaxation characteristics of tomatoes
stored intact or as slices. Postharvest Biol. Technol. 24, 59–68. XIANQUAN, S., SHI, J., KAKUDA, Y. and YUEMING, J. 2005. Review stability of lycopene
during food processing and storage. J. Med. Food. 8, 413-422. YILMAZ, E. 2001. The chemistry of fresh tomato flavour. Turk. J. Agric. Forest. 25, 149-155.

38
CHAPTER 2 - Detailed Materials and Methods to a Lexicon for
Green Odor and Characteristics of Chemicals Associated with
Green Odor in Foods

39
This study consisted of two phases: Phase 1 - Determining the Sensory Characteristics of
“Green” and Phase 2 - Evaluation of Various Chemicals Associated with “Green”. The
objectives of this study were (1) to identify and define the sensory attributes contributing to
green aroma/flavor, and (2) to describe the sensory characteristics, using clearly defined terms
established by a highly trained descriptive sensory panel, of various chemicals that had been
associated with green notes in previous literature.
Panelists A six-member highly trained panelists from the Sensory Analysis Center, Kansas State
University (Manhattan, KS) participated in the study. Each panelist had completed 120 hours of
training on general sensory techniques and analysis. They have more than 1000 hours of
experience in testing a wide variety of food products including products where a descriptor such
as “green” has been used (e.g. beans). Each panelist had a broad background of experience in
odor description and evaluation.
Samples and Sample Preparation
Food Products
A total of 32 products were evaluated in Phase 1. Food products used included fresh and
processed vegetables, ripe and unripe fruits, herbs, soy products, green tea, potatoes, and raw
nuts (Table 2.1). Products were purchased from local grocery stores approximately 3-5 days
prior to testing. Most samples were evaluated at room temperature (~ 20°C). In general, all
fruits and vegetables were rinsed and cut into small pieces, before placing in odor-free 3.25 oz.
(~96 mL) plastic cups covered with lids. The green tea sample was steeped for 1 min at 70°C
and served warm. Soy milks were kept refrigerated and evaluated cold (~ 5-7°C). The
preparation for each food evaluated was also provided in Table 2.1.
Chemicals
Twenty-two compounds were used in the study. Thirteen chemicals selected have been
referred to in previous literature to exhibit green characteristics in various foods, either in flavor
or the odor headspace of packaged foods. Nine chemicals selected were the corresponding ester
derivatives of hexyl (C6 aliphatic) compounds. All chemicals were available commercially and

40
were not considered toxic when used at low levels or in limited exposure as for sensory reference
materials. The chemicals used and their properties are illustrated in Table 2.2. Most chemicals
were purchased from Aldrich Chemical Co. (Milwaukee, WI). Hexanal and trans-2-hexenal
were purchased from Sigma Chemical Co. (St. Louis, MO). Citronellal and 2-isobutylthiazole
were obtained from Givaudan Flavor Corp. (Cincinnati, OH).
Propylene glycol (Fisher Scientific Co., Fair Lawn, NJ) was used as a solvent for all the
chemicals studied. A serial dilution technique was used to prepare a series of 7 concentrations
starting from a 100,000 ppm stock solution. The seven concentrations were 1 ppm, 10 ppm, 100
ppm, 1,000 ppm, 5,000 ppm, 10,000 ppm, and 100,000 ppm. Chemical samples were prepared
by dipping a fragrance strip to a 1.25-cm depth into the specified chemical solution. The strip
was then placed into a 20-mL capped, coded glass tube. Chemical solutions and the fragrance
strip preparation were made approximately 24 hr prior to testing.

41
Table 2.1 List of food products evaluated in phase 1: the lexicon development
Products Preparation CodeFresh Broccoli Rinse, cut the floret parts into small pieces 502
Fresh Cucumber Peel, rinse, and slice into ½ inch thick pieces 631
Fresh Spinach Rinse, place 4-5 leaves in plastic cups 661
Cooked Spinach Weigh 45 g of spinach, rinse, chop coarsely, add 300 mL water,
microwave on high for 3 minutes
784
Fresh Strawberries Rinse, cut in fours lengthwise 807
Vine-ripe Fresh Tomatoes
(greenhouse produced)
Rinse, cut tomatoes into wedges (lengthwise). 106
Fresh Green Onion Rinse, cut to ½ inch long to serve 950
Fresh Pear Peel, rinse, cut into ½ inch cubes to serve 799
Fresh Green Beans Rinse, cut into ½ inch long to serve 112
Raw Peanuts Fill raw peanuts in cup 456
Fresh Cilantro Rinse and chop in ½ inch long 291
Fresh Cabbage Rinse, cut the cabbage into ½ in2 pieces 675
Fresh Lettuce Rinse, cut the cabbage into ½ in2 pieces 396
Fresh Asparagus Rinse, cut into ½ inch pieces 484
Green Tea (Korean) Steep a tea bag in 6 oz. 70 °C water for 1 min, serve warm 741
Green Tea (Lipton) Steep a tea bag in 2 cups of boiling water for 3 min, serve warm 677
Cauliflower Rinse, cut the floret parts into small pieces 507
Green Pepper Rinse, cut the cabbage into ½ in2 pieces 278
Frozen Lima Beans Let thawed overnight, and place in cups 897
Fresh Basil Leaves Rinse, only use the leaves 147
White Onion Peel, rinse and chop into ½ inch pieces 233
Fresh Red Pepper Rinse, cut the cabbage into ½ in2 pieces 249
Fresh Mint Rinse, only use the leaves 923
6-Grain Cereal Mix Combine ¼ c cereal and ¾ c water, cover and microwave for 3 min 862
Canned Diced Tomatoes Empty the content of 2 tomato cans, mix and serve 117
Fresh Parsley Rinse, cut into small pieces 314
Vine-Ripe Tomatoes Rinse, cut tomatoes into wedges (lengthwise). 980
Artichoke Remove outside skin and center hairs, and cut flesh into ½ inch cubes 270
Tomato Leaves Rinse before serving 540
Soymilk Keep refrigerated until serve 101
Wheat Germs Keep refrigerated until serve 791
Apple Juice Keep refrigerated until serve 282
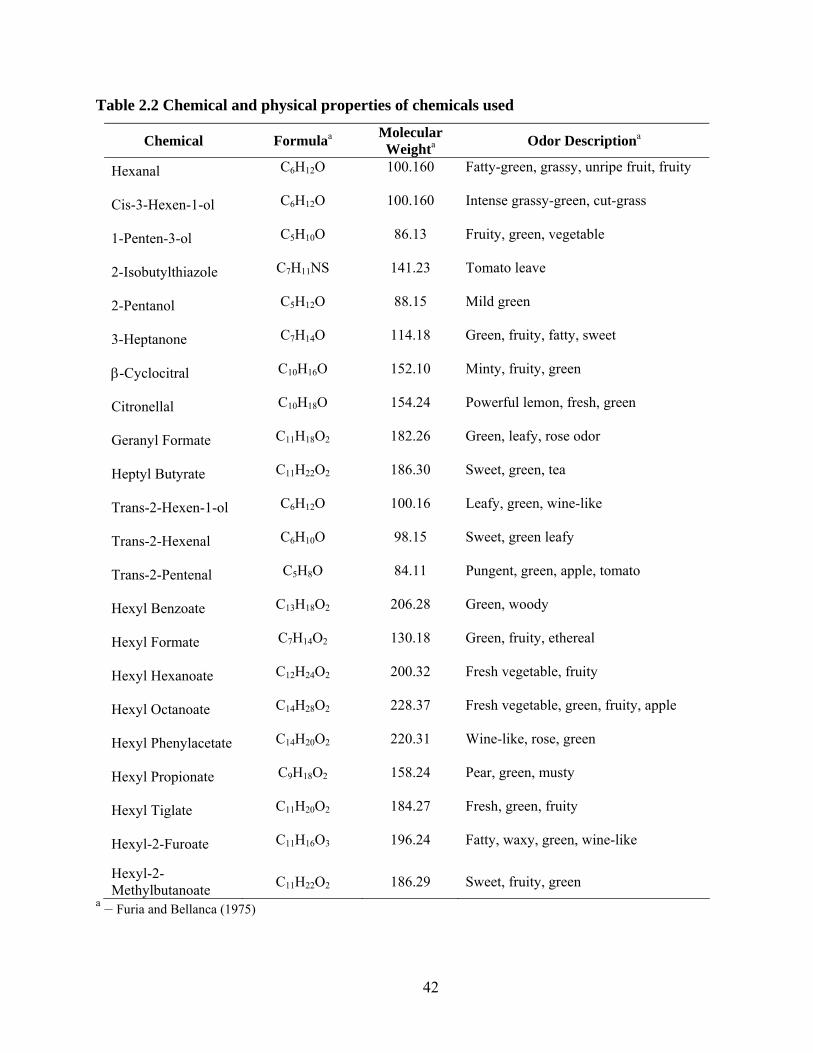
42
Table 2.2 Chemical and physical properties of chemicals used
Chemical Formulaa Molecular Weighta Odor Descriptiona
Hexanal C6H12O 100.160 Fatty-green, grassy, unripe fruit, fruity
Cis-3-Hexen-1-ol C6H12O 100.160 Intense grassy-green, cut-grass
1-Penten-3-ol C5H10O 86.13 Fruity, green, vegetable
2-Isobutylthiazole C7H11NS 141.23 Tomato leave
2-Pentanol C5H12O 88.15 Mild green
3-Heptanone C7H14O 114.18 Green, fruity, fatty, sweet
β-Cyclocitral C10H16O 152.10 Minty, fruity, green
Citronellal C10H18O 154.24 Powerful lemon, fresh, green
Geranyl Formate C11H18O2 182.26 Green, leafy, rose odor
Heptyl Butyrate C11H22O2 186.30 Sweet, green, tea
Trans-2-Hexen-1-ol C6H12O 100.16 Leafy, green, wine-like
Trans-2-Hexenal C6H10O 98.15 Sweet, green leafy
Trans-2-Pentenal C5H8O 84.11 Pungent, green, apple, tomato
Hexyl Benzoate C13H18O2 206.28 Green, woody
Hexyl Formate C7H14O2 130.18 Green, fruity, ethereal
Hexyl Hexanoate C12H24O2 200.32 Fresh vegetable, fruity
Hexyl Octanoate C14H28O2 228.37 Fresh vegetable, green, fruity, apple
Hexyl Phenylacetate C14H20O2 220.31 Wine-like, rose, green
Hexyl Propionate C9H18O2 158.24 Pear, green, musty
Hexyl Tiglate C11H20O2 184.27 Fresh, green, fruity
Hexyl-2-Furoate C11H16O3 196.24 Fatty, waxy, green, wine-like
Hexyl-2-Methylbutanoate C11H22O2 186.29 Sweet, fruity, green
a – Furia and Bellanca (1975)

43
Evaluation Procedure
Phase 1: Determining the Sensory Characteristics of “Green”
Three 1.5-hr orientation sessions were held to familiarize the panelists with the range of
products they would evaluate and to facilitate the vocabulary development process. During this
period, seven to ten food products were provided per session. The panelists described the
sensory characteristics of “green” and defined the terms using the food products provided. Two
additional discussion sessions were held to clarify each sensory attribute established and to
determine the appropriateness of the attributes. Two more sessions were held to identify
reference standards to be used for each of the sensory attributes of “green”. The panelists were
asked to use vocabulary that exhibited to the extent possible a one-dimensional meaning and to
select products to the extent possible that generally were easily reproducible as reference
standards. For each attribute, panelists identified at least 2 reference standards that cover a
portion of the range of the scale. After discussions, panelists determined and eliminated any
redundant vocabulary or terms that may have been included initially, but were determined
unrelated to green or redundant with other terms after further discussion. Similar evaluation
procedures have been used by several researchers. For example, Vara-Ubol et al. (2004) and
Bott and Chambers (2006) established vocabularies for beany aroma of chemicals; Chambers et
al. (2006) evaluated soymilk; and Green-Peterson et al. (2006) studied salmon products.
Reference standards were prepared approximately 24 hours before an evaluation session.
Many references were refrigerated overnight and removed 30 minutes prior to the session.
Reference standards and their preparations are illustrated in Table 3.1 (see Chapter 3).
Phase 2: Evaluation of Various Chemicals Associated with “Green”
A 1.5-hr orientation session was held before to familiarize the panelists with the
evaluation technique of this part of the study. In this session, panelists received two chemicals
(i.e. hexanal and cis-3-hexen-1-ol) with three concentrations each. The list of chemicals
presented in this session is shown in Table A.1.
The order in which a chemical was evaluated was randomized. All seven dilutions (1-
100,000 ppm) of a chemical were presented simultaneously and the panel evaluated them in the
order from lowest to highest concentrations. One or two chemicals were evaluated in each 1.5 hr
session. All chemicals were coded with 3-digit numbers and evaluated in a sequential monadic

44
fashion. A total of 12 1.5-hr sessions were used to evaluate the 22 chemicals. A modified flavor
profile method as described by Vara-Ubol et al. (2004) was used for the evaluation of the
chemicals. Panelists evaluated each chemical concentration by removing the impregnated
fragrance strip from the bottle and taking quick sniffs of the fragrance testing strips. Each
panelist first examined samples individually and then as a group they determined if the chemical
had a green character. If the chemical was agreed not to have a green note for any concentration,
the panelists described the characteristics, but not the intensities, of that chemical. Then a
second chemical set was presented.
For the chemicals that were found to be green, the panel described the odor
characteristics at each concentration level using the attributes established from Phase 1 of the
study. They then determined the the odor characteristics (i.e. attributes and intensities) of the
chemical at the concentration that the panelists considered to have the highest level of “green”
character. For profiling, a 15-point intensity scale was used, where 1 represents “just
recognizable” and 15 represents “extremely intense”. Carryover effects were minimized by
allowing 10 min intervals between evaluating chemical samples and approximately 5 to 10 min
between different concentrations of chemicals. Panelists also were asked to take multiple short
sniffs of fresh air to help cleanse their nasal passages between chemical samples.
References APARICIO, R. and MORALES, M.T. 1998. Characterization of olive ripeness by green aroma
compounds of virgin olive oil. J. Agric. Food Chem. 46, 1116-1122. BOTT, L. and CHAMBERS, E. IV. 2006. Sensory characteristics of combinations of chemicals
potentially associated with beany aroma in foods. J. Sens. Stud. 21, 308-321. CHAMBERS, E. IV, JENKINS, A., and MCGUIRE, B. 2006. Flavor properties of plain
soymilk. J. Sens. Stud. 21: 165-179. FURIA, T.E. and BELLANCA, N. eds. 1975. Fenaroli’s handbook of flavor ingredients, 2nd ed.
Vol. 2. CRC Press, Cleveland, OH. GREEN-PETERSEN, D.M.B., NIELSEN, J and HYLDIG, G. 2006. Sensory Profiles of the
most common salmon products on the Danish market. J. Sens. Stud. 21, 415-427. VARA-UBOL, S., CHAMBERS, E. IV and CHAMBERS, D.H. 2004. Sensory characteristics of
chemical compounds potentially associated with beany aroma. J. Sens. Stud. 19, 15-26

45
CHAPTER 3 - A Lexicon for Green Odor and Characteristics of
Chemicals Associated with Green Odor in Foods
46
Abstract The sensory characteristic “green” has been used frequently in descriptive sensory
analyses of various foods. This research examined the odor characteristics of 22 chemicals in
concentrations from 1-100,000 ppm. Thirteen chemicals including aldehydes, alcohols, ketones,
azoles and ester derivatives had been reported to have green aroma. Nine additional ester
derivatives, containing a six carbon core similar to hexanal, were included. A six-member
highly trained descriptive panel determined that “green” is not a single characteristic, but can
have several different manifestations. Generally, green can be characterized as either unripe,
peapod, grassy/leafy, viney, or fruity or combinations of those. Additional attributes that were
important to the green character included musty/earthy, pungent, bitter, overall sweet and floral.
Most chemicals tested were found to be green at concentrations of 1,000 ppm and higher.
Green-grassy/leafy was the most common green note and musty/earthy and pungent were
frequent green adjunct aromas.

47
Introduction The sensory characteristic “green” commonly is used in describing the characteristics of a
variety of fresh vegetables, unripe fruits, and some processed food products. A “green” note is
among the important attributes necessary for consumer perception of many green plant-based
products and food derivatives of those products, for example olive oil (Aparcio and Morales,
1998). The term green and similar terms such as grassy have been referenced recently in many
descriptive sensory analyses of various foods including tomatoes (Baldwin et al., 2004), bean
products (Vara-Ubol et al, 2004), honey (Galán-Soldevilla et al., 2005) and wine (Vilanova and
Soto, 2005). Various chemicals have been used to represent the green note in descriptive studies
of products. Those chemicals generally include aldehydes, alcohols, ketones or their
corresponding ester derivatives that contain six carbon atoms (C6) in the molecules.
Salas et al. (2005) stated that the degradation of polyunsaturated fatty acids through the
lypoxygenase pathway produced the volatile compounds contributing to the green notes in many
fruits, vegetables and other derivative food products (e.g. olive oil and juices). Various volatile
aldehydes and alcohols with six carbon atoms and corresponding hexyl ester derivatives were
reported to illustrate or primarily contribute to perceived green odor (Dravnieks, 1985; Guth and
Grosch, 1991, 1993; Hatanaka, 1996; Morales et al., 1996; Salas et al., 2005; King et al., 2006).
Hexanal and closely related compounds, in particular, have been most commonly
associated with green characteristics such as cut-grass (Baldwin et al., 2004; Azodanlou et al.,
2003; Krumbein and Auerswald, 1998; Reiners and Grosch, 1998; Buettner and Mestres, 2005).
Wilkens and Lin (1970) and Takahashi et al. (1979) determined hexanal was the key component
for the green and bean-like characteristics of soy beans and their products. Jakobsen et al.
(1998) described hexanal as a green-strong note in blanched green peas. Komthong et al. (2006)
found trans-2-hexenal to be responsible for a green, apple–like odor in apples. Jiang (2005)
found the high level of (E)-2-hexenal and (Z)-3-hexen-1-ol in laksa plant to be positively
correlated with green notes. Aparicio and Morales (1998) described 2-, 3-hexenal, and 2-, and 3-
hexen-1-ol as green with attributes such as fruity, flower, cut grass, and banana depending on the
structure of the compounds. Citronellal was described as an important compound contributing to
and intensifying the green note in green fruits (Jiang and Kubota, 2004).

48
Descriptions of volatile compounds used to reference green notes vary in the literature.
Baldwin et al. (2004); Azodanlou et al. (2003); Krumbein and Auerswald (1998); Reiners and
Grosch (1998); Buettner and Mestres (2005) described hexanal as green, (cut) grass. Other
descriptors used to describe the characteristics of hexanal included minty (Baldwin et al., 2004),
apple (Salas et al., 2005; Paçi Kora et al., 2003; and Morales and Aparicio, 1999), unripe green
(Wright, 2004), herbal (Jordán et al., 2003), fatty (Pino et al., 2001), and hedge (Bult et al.,
2002). Salas et al. (2005), Furia and Bellanca (1975) and Krumbein and Auerswald (1998)
described (E)-2-hexenal as green-leafy, Azodanlou et al. (2003) described it as green, fatty,
Baldwin et al. (2004) characterized that compound as green, grassy, vine, stale, Wright (2004)
and Reiners and Grosch (1998) described it as green apple like, and Morales and Aparicio (1999)
described it as almond. It is possible that some of these chemicals may illustrate a certain green
characteristic at a specific range of concentrations. For example, Vara-Ubol et al. (2004)
showed that some chemicals associated with beany aroma were found to be beany only at
concentrations between 1-10 ppm, and the characteristics changed completely at higher
concentrations. In addition, Caporale et al. (2004) reported that different concentrations of cis-3-
hexen-1-ol differed significantly in the green-cut grass intensity.
Many studies described odors of volatile chemicals by having human subjects sniffing the
headspace from gas chromatographs. Those studies either did not indicate whether or not
subjects were trained, or spent only several hours training subjects. No studies were found that
used highly experienced descriptive sensory panelists to describe the chemicals potentially
associated with green notes. The sensory characteristic “green” has been very commonly used;
however, a well defined lexicon that includes definitions and references to determine the green
character has not been developed. Data in previous research showing that green notes can be
described using several descriptive attributes suggested that the green note is a complex
character comprising multiple sensory attributes.
The objectives of this research were (1) to identify and define the sensory attributes
contributing to green aroma/flavor, and (2) to describe the sensory characteristics, using clearly
defined terms established by a highly trained descriptive sensory panel, of various chemicals that
had been associated with green notes in previous literature.

49
Materials and Methods The study was conducted in two parts. In phase 1, the lexicon for “green” was developed
by evaluating a variety of food products that had been associated with green flavor or aroma in
previous literature or work in our laboratory. In phase 2, the sensory characteristics of 22
chemicals, many of which have been referred to as green or associated with green odor in
previous literature, were examined.
Panelists
Six highly trained panelists from the Sensory Analysis Center, Kansas State University
(Manhattan, KS) took part in this research. The panelists had completed 120 hours of sensory
descriptive training and each had more than 1000 hours of testing experience, including products
where a descriptor such as “green” has been used. Each panelist had a broad background of
experience in odor description and evaluation.
Phase 1: Determining the Sensory Characteristics of “Green”
To define the “green” character, panelists examined a variety of food products that have
been associated with green flavor and aroma. Approximately, 30 products were evaluated in this
phase. Food products used in this phase included fresh and processed vegetables, ripe and unripe
fruits, herbs, soy products, green tea, raw potatoes, and raw peanuts. Vegetables and herbs
included green onion, spinach, green pepper, fresh parsley, green beans, lima beans, artichoke,
cilantro, asparagus, fresh and canned tomatoes, cauliflower, cabbage, cucumber, basil leaves,
lettuce, broccoli, and mints. Fruit samples included strawberry, green apple, banana, pear, and
grapes. Other products included soy milk, multigrain cereal, and apple juice. In the initial three
orientation sessions (4.5 hrs), seven to 10 products were provided in each 1.5-hr session to
familiarize the panelists with the range of products they would evaluate and to facilitate the
vocabulary development process. The panelists described the sensory characteristics of “green”
and developed appropriate definitions for each term. Discussion was held at the end of each
session to determine if there was any redundancy in the terms established. Two additional
discussion sessions (3 hrs) were held to determine the clarity and appropriateness of the terms
and more sessions (3 hrs) were held to identify reference standards to be used for each of the
sensory properties of “green”. After discussion, panelists eliminated redundant terminology or
terms that may have initially been included, but were not deemed related to green after further

50
study and discussion. Once the attributes, definitions and reference standards were determined,
the panel spent approximately 1 hour evaluating several products to ensure consistency of the
evaluation technique. Similar procedures have been used by Vara-Ubol et al. (2004) and Bott
and Chambers (2006) for establishing vocabularies for beany aroma of chemicals, by Chambers
et al. (2006) for studying soymilk, and by Green-Peterson et al. (2006) for salmon products.
Phase 2: Evaluation of Various Chemicals Associated with “Green”
Chemicals
Twenty-two compounds were used in this study. Of those, 13 chemicals were selected
because they have been referred to in previous literature to be potentially associated with green
characteristics in various foods, either in flavor or the odor headspace of packaged foods. Nine
chemicals selected were the corresponding ester derivatives of hexyl (C6 aliphatic) compounds.
All chemicals were available commercially and were not considered toxic when used at low
levels or in limited exposure as for sensory reference materials. The chemicals used were
hexanal; cis-3-hexen-1-ol; 1-penten-3-ol; 2-isobutylthiazole; 2-pentanol; 3-heptanone; β-
cyclocitral; citronellal; geranyl formate; heptyl butyrate; trans-2-hexen-1-ol; trans-2-hexenal;
trans-2-pentenal; and a series of hexyl esters including hexyl benzoate, hexyl hexaonate, hexyl
formate, hexyl octanoate, hexyl phenylacetate, hexyl proprionate, hexyl tiglate, hexyl-2-furoate,
and hexyl-2-methylbutanoate. Most chemicals were purchased from Aldrich Chemical Co.
(Milwaukee, WI). Hexanal and trans-2-hexenal were purchased from Sigma Chemical Co. (St.
Louis, MO). Citronellal and 2-isobutylthiazole were obtained from Givaudan Flavor Corp.
(Cincinnati, OH).
Sample Preparation
All chemicals were diluted in propylene glycol (Fisher Scientific Co., Fair Lawn, NJ).
Seven concentrations were prepared by a serial dilution technique starting from a 100,000 ppm
stock solution. The seven concentrations included 1 ppm, 10 ppm, 100 ppm, 1,000 ppm, 5,000
ppm, 10,000 ppm, and 100,000 ppm. To deliver the chemicals, a fragrance strip was dipped to a
1.25-cm depth into the specified chemical solution and placed into a 20-mL capped, coded glass
51
tube. Chemical solutions and the fragrance strip preparation were completed approximately 24
hrs prior to testing.
Evaluation Procedure
The order in which chemicals were evaluated was randomized. All seven dilutions (1-
100,000 ppm) of a chemical were presented simultaneously and the panel evaluated them in
order from lowest to highest concentration.
A total of 12 sessions (18 hrs) were used to evaluate the 22 chemicals. One or two
chemicals were evaluated in each 1.5-hr session. All chemicals were coded with 3-digit numbers
and evaluated in a sequential monadic fashion.The panel first determined if any level of the
chemical had a green character. If not, the characteristics, but not the intensities, were described.
Then a second chemical set was presented.
An evaluation method described by Vara-Ubol et al. (2004) was used for the evaluation
of the chemicals. Panelists evaluated each chemical concentration by taking quick sniffs from
the fragrance testing strips. Each panelist examined samples individually and then as a group
they determined if the chemical had a green character.
For the chemicals that were found to be green, the panel described the odor
characteristics at each level using the attributes established from Phase 1 of the study. They then
determined the odor characteristics of the chemical at the concentration the panelists considered
to have the highest level of “green” character. For profiling, a 15-point intensity scale was used,
where 1 represents “just recognizable” and 15 represents “extremely intense”. Carryover effects
were minimized by allowing 10 min intervals between evaluating chemical samples and
approximately 5 to 10 min between different concentrations of chemicals. Panelists also were
asked to take multiple short sniffs of fresh air to help cleanse their nasal passages between
chemical samples.
Results and Discussion
Phase 1: Determining the Sensory Characteristics of “Green”
The green characteristic was described as comprised of multiple sensory attributes often
associated with plant-base materials. The green character can include one or more of five
specific green attributes — green-unripe, green-peapod, green-grassy/leafy, green-viney, and

52
green-fruity. Hatanaka (1996) described a similar set of attributes associated with green
character including leafy green, grassy green, insect-like green, vegetable-like green and fruity.
However, definitions of each term used were not specified in that study. Our definitions of the
terms we used are given in Table 3.1.
The green-viney attribute was the primary green characteristic identified in fresh and
processed tomatoes as well as cucumbers and green beans. The green-unripe attribute was the
main characteristic green flavor/aroma found in many unripe fruits. Green-peapod described the
green character generally found in beans, nuts, some vegetables and soy products including lima
beans, green beans, raw peanuts, broccoli, asparagus and soy milk. The green character found in
many herbs, green-leafy vegetables (e.g. cilantro, basil leaves, spinach and fresh parsley) and
green tea products was described by a green-grassy/leafy attribute. The green note found in
fruits and fruit-derivative products (e.g. pear and apple juice) was described primarily by the
green-fruity attribute.
In addition to the characterizing green attributes, other sensory characteristics were
identified that accompanied the green attributes: musty/earthy, pungent, astringent, bitter, sweet,
sour, floral, beany, minty, and piney. One or more of those attributes were identified whenever
green attributes were found. Those accompanying attributes did not impart the green character,
but were intrinsically associated with various products that had the green note. Those particular
attributes appeared “tied” to the green characteristic, i.e. depending on the product the
accompanying attribute appeared simultaneously with or immediately preceding or following
green. Musty/earthy, pungent, astringent and bitter were most often identified as accompanying
attributes. Beany was normally found with the green-peapod attribute. Table 3.1 provides the
definitions and references for the accompanying attributes. Because definitions and references
for basic tastes can be found in various references including Chambers et al. (2006), they are not
listed in the table.

53
Table 3.1 Sensory attributes imparting green characteristics: definitions, references, and
intensities on 15-point scale
Attribute Definition Reference and Intensitya Overall Green Aromatic characteristics of plant-based
materials. A measurement of the total green characteristics and the degree to which they fit together. Green attributes include one or more of the following: green-unripe, green-peapod, green-grassy/leafy, green-viney and green-fruity. These may be accompanied by musty/earthy, pungent, astringent, bitter, sweet, sour, floral, beany, minty and piney.
1:1 Diluted Fresh Parsley Water = 5.0 (f), 7.0 (a) Fresh Parsley Water = 7.0 (fb), 9.0 (ac) (Preparation: 25 g chopped fresh parsley soaked in 300 ml water for 15 min, filtered)
Green-Unripe An aromatic associated with unripe or not-fully-developed plant-based materials; characterized by increased sour, astringent and bitter.
Green Banana = 8.0 (f) Watermelon Rind = 10.0 (f)
Green-Peapod An aromatic associated with green peapods and raw green beans; characterized by increased musty/earthy character.
Kroger Frozen Baby Lima Beansd = 6.0 (f, a) Kroger Frozen Lima Beansd = 8.0 (f, a) Kroger Raw Peanuts = 12.0 (f)
Green-Grassy/Leafy An aromatic associated with newly cut-grass and leafy plants; characterized by sweet and pungent character.
Kroger Fresh Spinach = 4.5 (f) (Preparation: place 3 Fresh Parsley Water = 7.0 (f), 9.0 (a)
Green-Viney An aromatic associated with green vegetables and newly cut vines and stems; characterized by increased bitter and musty/earthy character.
Kroger Raw ½-in Diced Potatoes = 2.0 (f) ½-in Sliced Fresh Cucumber = 5.0 (f, a) Fresh Sliced Tomatoes = 10.0 (f), 9.0 (a)
Green-Fruity A green aromatic associated with some fruits and vegetables; characterized by increased sweet, sour and floral character.
Welch’s White Grape Juice, diluted 1:1 = 2.0 (f, a) Granny Smith Apple = 4.0 (f), 6.0 (a) Fresh Lime Peel = 12.0 (a)
Musty/Earthy Humus-like aromatics that may or may not include damp soil, decaying vegetation, or cellar-like characteristics.
Kroger Frozen Baby Lima Beans = 3.0 (f), 5.0 (a) ½-in Sliced Fresh Cucumber = 6.0 (f)
Floral Sweet, light, slightly perfumey impression associated with flowers.
Welch’s White Grape Juice, diluted 1:1 = 5.0 (f), 6.0 (a)

54
Attribute Definition Reference and Intensitya Beany Aromatics characteristic of beans and bean
products; includes musty/earthy, musty/dusty, sour aromatics, starchy, powdery feel and one or more of the following characteristics: green/pea pod, nutty, or browned.
Kroger Frozen Baby Lima Beans = 4.5 (f), 6.0 (a)
Piney Aromatics reminiscent of resinous pine tree; can be medicinal or disinfectant in character.
Diamond Raw Pine Nuts = 4.0 (f, a)
Minty Sweet, green, earthy, pungent, sharp, mentholic aromatics associated with mint oils; commonly associated with wintergreen, spearmint, or peppermint.
Mint Mixture (equal parts of - Wintergreen, Spearmint, and -Peppermint oils) = 10.0 (a)
Overall Sweet The overall aromatics associated with sweet substances.
Granny Smith Apple = 2.0 (a) Wheaties = 3.0 (a)
Pungent The sharp physically penetrating aromatic sensation in the nasal cavity.
Lime Peel = 13.0 (a) Fresh Green Pepper = 5.0 (a)
Astringent The dry, puckering mouthfeel associated with placing an alum solution in the mouth.
0.03% Alum Solution = 1.5 0.05% Alum Solution = 2.5
a Intensity based on a 15-point numerical scale with 0.5 increments, where 0 represents “just recognizable” and 15 represents “extremely intense”; b Flavor; c Aroma; d Frozen beans were thawed overnight in a refrigerator before serving

55
Phase 2. Evaluation of Various Chemicals Associated with “Green”
No green characteristics were found in 2-pentanol and β-cyclocitral. 2-Pentanol,
although described as green in some literature (e.g. Ito et al., 2002), was associated with rubbing
alcohol and nail polish in our study. β-Cyclocitral, described as green, cut-grass by Dravnieks
(1985) was described as fertilizer-like at concentrations of 1,000 ppm and lower, and as
musty/earthy and cellar-like at the higher concentrations. Because many studies examined
effluent from gas chromatographs, differences in chemical purity or the ability to sniff for longer
periods in this study may explain some differences from other literature. In addition, some
compounds may contribute to green odor/flavor only when combined with other compounds.
Similarly, Bott and Chambers (2006) found that hexanal, which was not beany by itself, became
beany when combined with some other compounds.
Most of the chemicals cited in previous literature as “green” were found to be green,
depending on their concentration. The odor characteristics of all chemicals illustrating the green
character are shown in Table 3.2. Most chemicals illustrated the green character at the
concentration of 1,000 ppm and higher. None of the chemicals was found to be green at 1 ppm.
2-Isbutylthiazole was the only chemical the panel described as green at a concentration as low as
100 ppm.
In general, as the chemical concentration increased, the chemical odor characteristics
became more intense. For example, the green-grassy/leafy attribute of hexanal increased from a
score of 2 at 1,000 ppm to 5.5 at 10,000 ppm. Additional odor attributes were found in many
chemicals as the concentration increased. For instance, green-viney, musty/earthy and pungent
were perceived in addition to green-grassy/leafy when the hexanal concentration reached 5,000
ppm and higher.

56
Table 3.2 Odor attributes of chemicals exhibiting green characteristics at different
concentrations
Chemicals Odor characteristics of green chemicals at different concentrations
(ppm)a
10 100 1,000 5,000 10,000 100,000
Hexanal Musty/Earthy Green-Grassy/Leafy
Green-Grassy/Leafy, Green-Viney, Musty/Earthy, Pungent
cis-3-Hexen-1-ol -b
Green-Grassy/Leafy, Green-Viney, Musty/Earthy
Green-Grassy/Leafy,
Fruity, Pungent, Floral
Green-Grassy/Leafy, Green-Viney,
Pungent Musty/Earthy
Green-Grassy/Leafy,
Pungent, Musty/Earthy
trans-2-Hexen-1-ol - Green-Peapod,
Green-Viney Green-Peapod, Green-Viney, Sweet, Pungent,
Musty/Earthy
trans-2-Hexenal - Green-
Grassy/Leafy, Sweet, Almond
Green-Grassy/Leafy, Green-Fruity, Floral, Sweet, Pungent
trans-2-Pentenal - Chocolate Green-
Grassy/Leafy, Sweet
Green-Grassy/Leafy, Sweet, Floral, Pungent
1-Penten-3-ol - Green-
Grassy/Leafy, Musty/Earthy
Green-Grassy/Leafy, Pungent, Musty/Earthy
2-isobutylthiazole - Green-Viney Green-Viney, Pungent, Musty/Earthy
Green-Grassy/Leafy, Green-Viney,
Piney, Pungent, Musty/Earthy
3-Heptanone - Minty Artificial banana
Green-Unripe, Pungent,
Musty/Earthy, Sweet, Floral
Citronellal - Lemon Pledge Fruity, Pungent, Floral
Geranyl formate - Musty/Earthy
Green-Grassy/Leafy, Musty/Earthy,
Pungent
Green-Grassy/Leafy, Green-Fruity, Piney, Pungent, Musty/Earthy,
Floral
Heptyl butyrate - Green-Viney, Green-Peapod, Musty/Earthy, Pungent

57
Odor characteristics of C-6 aliphatic ester derivatives
10 100 1,000 5,000 10,000 100,000
Hexyl benzoate Musty/Earthy Green-
Grassy/Leafy, Musty/Earthy
Green-Grassy/Leafy, Pungent, Musty/Earthy
Hexyl formate - Caramelized Green-Peapod, Green-Fruity, Musty/Earthy
Green-Fruity, Green-Peapod,
Pungent, Musty/Earthy,
Floral
Hexyl hexanoate - Musty/Earthy Green-Viney, Musty/Earthy
Green-Viney, Green-Fruity,
Floral, Musty/Earthy
Hexyl octanoate - Green-Grassy/Leafy, Floral
Hexyl phenylacetate - Green-Grassy/Leafy, Musty/Earthy,
Floral, Sweet
Green-Viney, Green-
Grassy/Leafy, Musty/Earthy, Floral, Sweet
Hexyl propionate - Green-
Grassy/Leafy, Minty, Sweet
Green-Grassy/Leafy, Minty, Green-Viney, Pungent, Sweet, floral
Hexyl tiglate Musty/Earthy Green-
Grassy/Leafy, Musty/Earthy
Green-Grassy/Leafy, Minty, Pungent, Musty/Earthy
Green-Grassy/Leafy, Minty, Floral,
Sweet, Pungent, Musty/Earthy
Hexyl-2-furoate -
Green-Grassy/Leafy,
Minty, Musty/Earthy
Green-Grassy/Leafy, Minty, Sweet, Musty/Earthy
Green-Grassy/Leafy, Minty, Sweet,
Pungent, Musty/Earthy
Hexyl-2-methylbutanoate - Green-
Grassy/Leafy
Green-Grassy/Leafy, Viney, Minty,
Pungent
Green-Grassy/Leafy, Minty, Sweet,
Pungent
Green-Grassy/Leafy,
Sweet, Pungent
a The odor characteristics of each chemical are shown under specific concentrations b “-” indicates that the odor characteristics are unidentified

58
The odor character of some compounds changed at different concentrations. For
example, 3 heptanone was minty at 1,000 ppm, artificial banana between 5,000 – 10,000 ppm,
and green-unripe at 100,000 ppm. The finding that a change in concentration can result not only
in differences in attribute intensities, but also dramatic changes in character have been found by
other researchers. This points to the importance of specifying the concentration of a chemical
used as a sensory reference. It shows the pitfalls of identifying a chemical as having a certain
odor, without also specifying the concentration that resulted in that odor character.
All the hexyl (C6) ester derivatives tested were found to be green at some level. Hexyl
tiglate was the only chemical exhibiting an identifiable odor (i.e. musty/earthy) between 10 – 100
ppm. Increasing concentration of the hexyl esters increased attribute intensities in many cases,
or changed the odor characteristics in some others. For example, hexyl formate had green-
peapod as a primary character at 5,000 -10,000 ppm, but green-fruity became its primary odor
character at 100,000 ppm. Many of the hexyl esters exhibited green-grassy/leafy as a primary
characteristic (e.g. hexyl benzoate, hexyl phenylacetate, hexyl proprionate and hexyl tiglate).
Hexyl hexanoate was characterized as green-viney at 5,000 ppm and higher. Hexyl proprionate
and hexyl tiglate exhibited a minty note as a characterizing attribute. These findings that C6
aliphatic ester derivatives exhibit green characteristics show that the C6 aliphatic group of
chemicals may act as a key contributor to the green odor characteristics of chemicals that contain
a similar core structure. Hatanaka (1996) specifically reported that eight C6-aliphatic alcohols
and aldehydes were responsible for the green odor of green leaves.
Odor profiles of chemicals cited as green in previous literature at the concentration best
illustrating the green character are shown in Table 3.3. Of these, 2-isobutylthiazole (at 5,000
ppm) was the most green with green-viney, musty/earthy and pungent as the characterizing
attributes. The odor character of 2-isobutylthiazole has been often associated with tomatoes or
tomato leaves (e.g. Dravnieks, 1985). Hexanal exhibited a moderate green character with green-
grassy/leafy as the characterizing attribute. Citronellal, trans-2-pentenal, and 1-penten-3-ol were
the least green with an overall green intensity of 2.0 on a 15-point scale. Many chemicals
exhibited multiple characterizing green attributes (e.g., cis-3-hexen-1-ol had a combination of
green-grassy/leafy, green-viney and green-fruity). Additional odor attributes found in these
green chemicals included overall sweet and floral, which were found in trans-2-hexenal, trans-2-
hexen-1-ol and trans-2-pentenal.
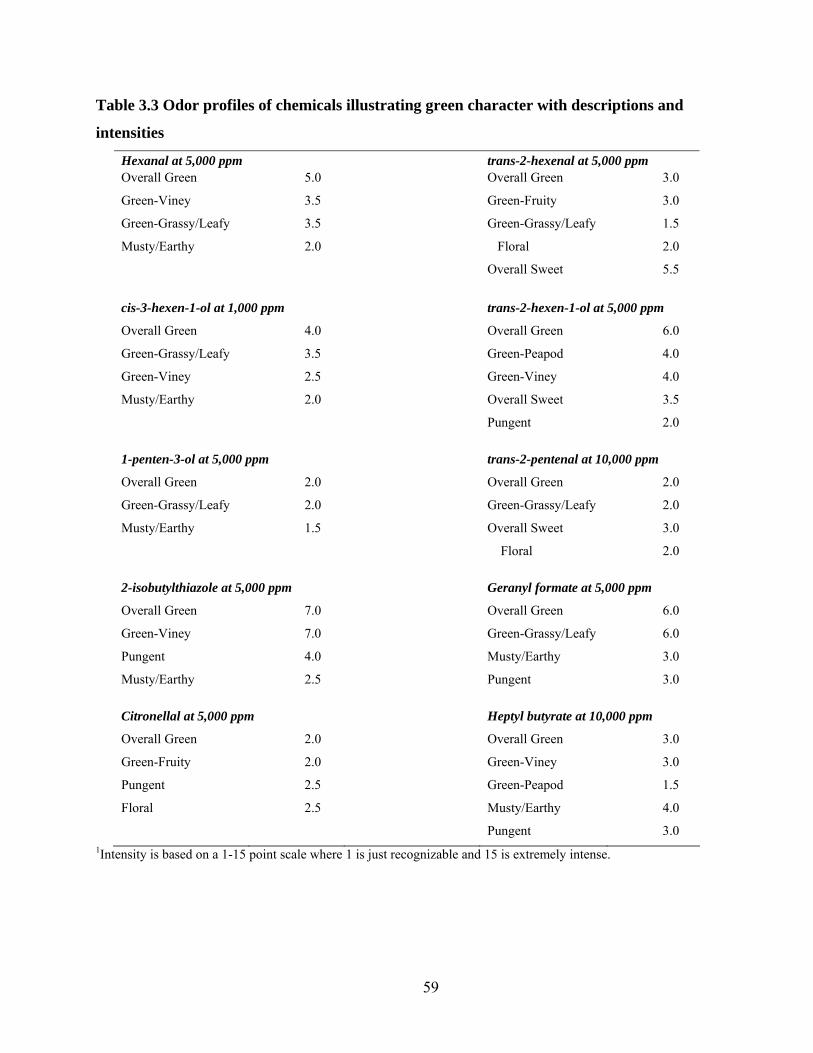
59
Table 3.3 Odor profiles of chemicals illustrating green character with descriptions and
intensities
Hexanal at 5,000 ppm trans-2-hexenal at 5,000 ppm Overall Green 5.0 Overall Green 3.0
Green-Viney 3.5 Green-Fruity 3.0
Green-Grassy/Leafy 3.5 Green-Grassy/Leafy 1.5
Musty/Earthy 2.0 Floral 2.0
Overall Sweet 5.5
cis-3-hexen-1-ol at 1,000 ppm trans-2-hexen-1-ol at 5,000 ppm Overall Green 4.0 Overall Green 6.0
Green-Grassy/Leafy 3.5 Green-Peapod 4.0
Green-Viney 2.5 Green-Viney 4.0
Musty/Earthy 2.0 Overall Sweet 3.5
Pungent 2.0
1-penten-3-ol at 5,000 ppm trans-2-pentenal at 10,000 ppm Overall Green 2.0 Overall Green 2.0
Green-Grassy/Leafy 2.0 Green-Grassy/Leafy 2.0
Musty/Earthy 1.5 Overall Sweet 3.0
Floral 2.0
2-isobutylthiazole at 5,000 ppm Geranyl formate at 5,000 ppm Overall Green 7.0 Overall Green 6.0
Green-Viney 7.0 Green-Grassy/Leafy 6.0
Pungent 4.0 Musty/Earthy 3.0
Musty/Earthy 2.5 Pungent 3.0
Citronellal at 5,000 ppm Heptyl butyrate at 10,000 ppm Overall Green 2.0 Overall Green 3.0
Green-Fruity 2.0 Green-Viney 3.0
Pungent 2.5 Green-Peapod 1.5
Floral 2.5 Musty/Earthy 4.0
Pungent 3.0 1Intensity is based on a 1-15 point scale where 1 is just recognizable and 15 is extremely intense.
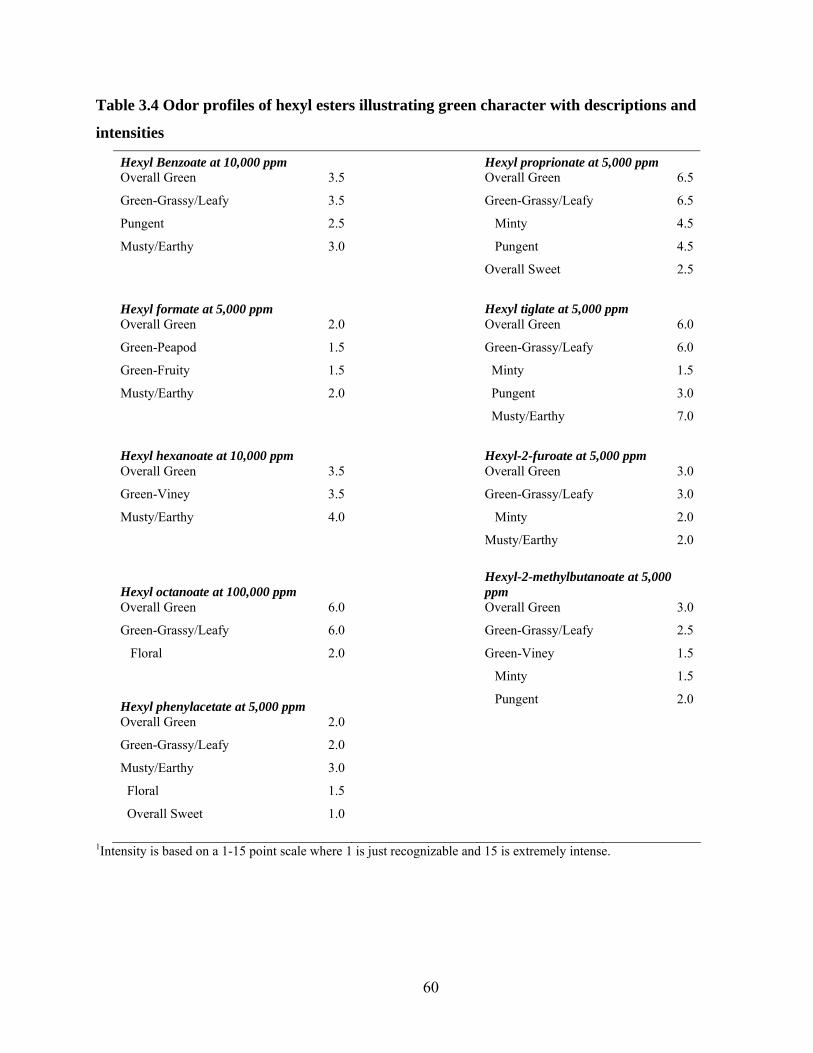
60
Table 3.4 Odor profiles of hexyl esters illustrating green character with descriptions and
intensities
Hexyl Benzoate at 10,000 ppm Hexyl proprionate at 5,000 ppm Overall Green 3.5 Overall Green 6.5
Green-Grassy/Leafy 3.5 Green-Grassy/Leafy 6.5
Pungent 2.5 Minty 4.5
Musty/Earthy 3.0 Pungent 4.5
Overall Sweet 2.5
Hexyl formate at 5,000 ppm Hexyl tiglate at 5,000 ppm Overall Green 2.0 Overall Green 6.0
Green-Peapod 1.5 Green-Grassy/Leafy 6.0
Green-Fruity 1.5 Minty 1.5
Musty/Earthy 2.0 Pungent 3.0
Musty/Earthy 7.0
Hexyl hexanoate at 10,000 ppm Hexyl-2-furoate at 5,000 ppm Overall Green 3.5 Overall Green 3.0
Green-Viney 3.5 Green-Grassy/Leafy 3.0
Musty/Earthy 4.0 Minty 2.0
Musty/Earthy 2.0
Hexyl octanoate at 100,000 ppm Hexyl-2-methylbutanoate at 5,000
ppm Overall Green 6.0 Overall Green 3.0
Green-Grassy/Leafy 6.0 Green-Grassy/Leafy 2.5
Floral 2.0 Green-Viney 1.5
Minty 1.5
Hexyl phenylacetate at 5,000 ppm Pungent 2.0
Overall Green 2.0 Green-Grassy/Leafy 2.0 Musty/Earthy 3.0 Floral 1.5 Overall Sweet 1.0
1Intensity is based on a 1-15 point scale where 1 is just recognizable and 15 is extremely intense.

61
Table 3.4 illustrates odor profiles for the nine hexyl esters at the concentration best
exhibiting the green character. Most of these chemicals only exhibited weak to moderate green
characteristics. Hexyl proprionate and hexyl tiglate were the most green at a relatively low
concentration (5,000 ppm). Most chemicals had green-grassy/leafy as the characterizing
attribute. Other odor characteristics found in these hexyl esters were minty (in hexyl proprionate
and hexyl tiglate), and overall sweet and floral (in hexyl phenylacetate).
Some attributes used to describe hexanal in previous literature [e.g. minty (Baldwin et al.,
2004), and apple (Salas et al., 2005; Paçi Kora et al., 2003; and Morales and Aparicio, 1999)],
were not specifically found in this study. Differences could be related to differences in
techniques or to differences in training and the concomitant ability to dissociate attributes from
specific products (i.e. a person may associate green with apples and use the term green apple or
apple when the odor actually is not apple). The panelists in this study had a high level of training
and Chambers et al. (2004) found that with higher levels of training, panelists were better able to
differentiate difficult or closely related attributes.
The sensory attributes that are intrinsically associated with green in products were not
found in the evaluation of all of the chemicals, probably because the chemicals are single
compounds and, thus, far less complex systems than food products. In addition, because the
astringent, bitter, sweet and sour attributes are found associated with the green character only
when tasted, these attributes generally were not expected in the chemical evaluation portion of
this research because the chemicals were evaluated only by smell.
Conclusions A lexicon for the sensory term “green” was established. The green note was described as
being comprised of multiple sensory attributes. Green characteristics can be primarily described
using green-unripe, green-peapod, green-grassy/leafy, green-viney and green-fruity attributes
and this study provides definitions and references for those characteristics. Chemicals that have
been cited in previous literature were described as green at various concentrations. Most of the
hexyl (C6-aliphatic) ester compounds also were described as green, but at relatively weaker
intensities. Green-grassy/leafy was found as a characterizing attribute for many of the chemicals
studied, while no chemical was found to be a good representation of green/unripe. Musty/earthy

62
and pungent attributes were found in the odor characteristics of most chemicals exhibiting green
characteristics.
References APARICIO, R. and MORALES, M.T. 1998. Characterization of olive ripeness by green aroma
compounds of virgin olive oil. J. Agric. Food Chem. 46, 1116-1122. ARAI, S., KOYANAGI, O. and FUJIMAKI, M. 1967. Studies on flavor components in soybean
part IV: Volatile neutral compounds. Agric. Biol. Chem. 7, 868-873. AZODANLOU, R., DARBELLAY, C., LUISIER, J.L., VILLETTAZ, J.C. and AMADÒ, R.
2003. Quality assessment of strawberries (Fragaria species). J. Agric. Food Chem. 51, 715-721.
BALDWIN, E.A., GOODNER, K., PLOTTO, A., PRITCHETT, K. and EINSTEIN, M. 2004.
Effect of volatiles and their concentration on perception of tomato descriptors. J. Food Sci. 69, S310-S318.
BOTT, L. and CHAMBERS, E. IV. 2006. Sensory characteristics of combinations of chemicals
potentially associated with beany aroma in foods. J. Sens. Stud. 21, 308-321. BUETTNER, A. and MESTRES, M. 2005. Investigation of the retronasal perception of
strawberry aroma aftersmell depending on matrix composition. J. Agric. Food Chem. 53, 1661-1669.
BULT, J.H.F., SCHIFFERSTEIN, H.N.J., ROOZEN, J.P., BORONAT, E.D., VORAGEN,
A.G.J. and KROEZE, J.H.A. 2002. Sensory evaluation of character impact components in an apple model mixture. Chem. Senses. 27, 485-494.
CAPORALE, G., POLICASTRO, S. and MONTELEONE, E. 2004. Bitterness enhancement
induced by cut grass odorant (cis-3-hexen-1-ol) in a model olive oil. Food Qual. Pref. 15, 219–227
CHAMBERS D.H., ALLISON, A.A. and CHAMBERS, E.IV. 2004. Effects of training on
performance of descriptive sensory panelists. J. Sens. Stud. 19, 486-499. CHAMBERS, E. IV, JENKINS, A. and MCGUIRE, B. 2006. Flavor properties of plain soymilk.
J. Sens. Stud. 21, 165-179. DRAVNIEKS, A. 1985. Atlas of odor character profiles. ASTM Data series DS61. American
Society for Testing and Materials, Philadelphia, PA

63
FURIA, T.E. and BELLANCA, N. eds. 1975. Fenaroli’s handbook of flavor ingredients, 2nd ed. Vol. 2, pp. 248, 253. CRC Press, Cleveland, OH.
GALÁN-SOLDEVILLA, H., RUIZ-PÉREZ-CACHO, M. P., SERRANO JIMÉNEZ, S.,
JODRAL VILLAREJO, M. and BENTABOL MANZANARES, A. 2005. Development of a preliminary sensory lexicon for floral honey. Food Qual. Pref. 16, 71-77
GREEN-PETERSEN, D.M.B., NIELSEN, J. and HYLDIG, G. 2006. Sensory profiles of the
most common salmon products on the Danish market. J. Sens. Stud. 21, 415-427. GUTH, H. and GROSCH, W. 1991. A comparative study of the potent odorants of different
virgin olive oils. Fat. Sci. Technol. 93, 335-339. GUTH, H. and GROSCH, W. 1993. Quantitation of potent odorants of virgin olive oil by stable-
isotope dilution assays. J. Am. Oil Chem. Soc. 70, 513-518. HATANAKA, A. 1996. The fresh green odor emitted by plants. Food Rev. Int. 12, 303-350. ITO, Y., SUGIMOTO, A., KAKUDA, T. and KUBOTA, K. 2002. Identification of potent
odorants in Chinese Jasmine Tea scented with flower of Jasminum sambac. J. Agric. Food Chem. 50, 4878-4884.
JAKOBSEN, H.B., HANSEN, M., CHRISTENSEN, M.R., BROCKHOFF, P.B. and OLSEN,
C.E. 1998. Aroma volatiles of blanched green peas (Pisum sativum L.). J. Agric. Food Chem. 46, 3727-3734.
JIANG, L. and KUBOTA, K. 2004. Differences in the volatile components and their odor
characteristics of green and ripe fruits and dried pericarp of Japanese pepper (Xanthoxylum piperitum DC.). J. Agric. Food Chem. 52, 4197-4203.
JIANG, L. 2005. Volatile composition of the laksa plant (Polygonum hydropiper L.), a potential
source of green note aroma compounds. Flavour Fragr. J. 20, 455-459. JORDÁN, M.J., MARGARÍA, C.A., SHAW, P.E. and GOODNER, K.L. 2003. Volatile
components and aroma active compounds in aqueous essence and fresh pink guava fruit puree (Psidium guajaVa L.) by GC-MS and multidimensional GC/GC-O. J. Agric. Food Chem. 51, 1421-1426.
KING, B.M., ARENTS, P., DUINEVELD, C.A.A., MEYNERS, M., SCHROFF, S.I. and
SOEKHAI, S.T. 2006. Orthonasal and retronasal perception of some green leaf volatiles used in beverage flavors. J. Agric. Food Chem. 54, 2664 - 2670.
KOMTHONG, P., KATOH, T., IGURA, N. and SHIMODA, M. 2006. Changes in the odours of
apple juice during enzymatic browning. Food Qual. Prefer. 17, 497–504

64
KRUMBEIN, A. and AUERSWALD, H. 1998. Characterization of aroma volatiles in tomatoes by sensory analyses. Nahrung. 42, 395-399.
MORALES, M.T., CALVENTE, J.J.and APARICIO, R. 1996. Influence of olive ripeness on the
concentration of green aroma compounds in virgin olive oil. Flavour Fragr. J. 11, 171-178.
MORALES, M.T. and APARICIO, R. 1999. Effect of extraction conditions on sensory quality of
virgin olive oil. J. Am. Oil Chem. Soc. 76, 295-300. PAÇI KORA, E., LATRILLE, E., SOUCHON, I. and MARTIN, N. 2003. Texture-flavor
interactions in low fat stirred yogurt: how mechanical treatment, thickener concentration and aroma concentration affect perceived texture and flavor. J. Sens. Stud. 18, 367-390.
PINO, J.A., MARBOT, R. and VAZQUEZ, C. 2001. Characterization of volatiles in strawberry
guava (Psidium cattleianum Sabine) fruit. J. Agric. Food Chem. 49, 5883-5887. REINERS, J. and GROSCH, W. 1998. Odorants of virgin olive oils with different flavor profiles.
J. Agric. Food Chem. 46, 2754-2763. SALAS, J.J., SANCHEZ, C., GARCIA-GONZALEZ, D.L. and APARICIO, R. 2005. Impact of
the suppression of lipoxygenase and hydroperoxide lyase on the quality of the green odor in green leaves. J. Agric. Food Chem. 53, 1648-1655.
TAKAHASHI, N. SASAKI, R. and CHIBA, H. 1979. Enzymatic improvement of food flavor
IV: Oxidation of aldehydes in soybean extracts by aldehyde oxidase. Agric. Biol. Chem. 43, 2557-2562.
VARA-UBOL, S., CHAMBERS, E. IV and CHAMBERS, D.H. 2004. Sensory characteristics of
chemical compounds potentially associated with beany aroma. J. Sens. Stud. 19, 15-26. VILANOVA, M. and SOTO, B. 2005. The impact of geographic origin on sensory properties of
Vitis vinifera cv. Mencia. J. Sens. Stud. 20, 503-511. WILKENS, W.F. and LIN, F.M. 1970. Gas chromatographic and mass spectral analyses of
soybean milk volatiles. J. Agric. Food Chem. 18, 333-336. WRIGHT, J. 2004. Flavor Creation. Allured Publishing, Carol Stream, IL. pp. 200.

65
CHAPTER 4 - Detailed Materials and Methods to Determining a
Lexicon Describing the Sensory Flavor and Texture Characteristics
of Tomatoes

66
The objectives of this study were to (1) develop a sensory lexicon that includes attributes,
definitions and references to fully describe the sensory characteristics of a wide variety of fresh
and processed tomatoes, and (2) determine the characteristics of a broad range of fresh and
processed tomatoes as well as tomato-based products using the lexicon initially established.
Panelists The six-member highly trained panelists from the Sensory Analysis Center, Kansas State
University (Manhattan, KS) participated in this study. Each panelist had completed 120 hrs of
training on general sensory analysis techniques. They all have a minimum of 1000 hours of
experience in testing a wide variety of food products including fresh tomatoes and tomato-based
products. The panel received six 1.5-hr sessions of orientation during which they were
familiarized with the range of products that would be evaluated, and established the sensory
attributes that describe these products. During the orientation sessions, various types of fresh
and processed tomatoes were provided to help facilitate the panelists with terminology
development.
Samples and Sample Preparation Various fresh and processed tomatoes were used in the study. During the lexicon
development, 30 fresh and processed tomatoes were used to facilitate the vocabulary
development. During the product evaluation, all the 30 products with 10 additional products
were used. These fresh and processed tomatoes were selected to represent a broad range of
tomato sensory characteristics. The products consisted of nine fresh tomatoes; 25 processed
tomato products, representing varying degrees of processing, including canned whole, diced and
crushed tomatoes, tomato paste, tomato juice, and dried tomato; and six tomato-based products
including ketchup and simple traditional pasta sauce. For the tomato-based products, those with
minimal additional ingredients were used.
Various types of fresh tomatoes were selected because, presently, fresh vegetable markets
not only display standard field-grown round tomatoes, many have included plum tomatoes, grape
and cherry tomatoes as well as a number of greenhouse and hydroponic tomatoes. The
greenhouse/hothouse hydroponic tomatoes, which tended to have higher prices, have dominated
the fresh market tomatoes in the recent years (Economic Research Service, USDA). Thus, fresh

67
tomatoes were selected to include round, plum, cherry and greenhouse/hothouse tomatoes that
were commercially available in the markets. All samples were purchased from local large chain
grocery stores and local fresh vegetable market. Fresh tomatoes were purchased approximately
3-5 days prior to testing. Processed tomato products were selected to represent a broad range of
processed tomatoes at various processing levels. Tomato-based products used in the study
included traditional pasta sauces and ketchup. Processed products were purchased 3-10 days
before testing began. Multiple brands of each product, both national and generic brands, were
selected to represent the variations in those products.
All tomato samples were stored at room temperature (~25ºC) and were prepared
approximately 30 min to 1 hour prior to testing sessions. Fresh tomatoes were thoroughly rinsed
using reverse osmosis, deionized, carbon-filtered water before cutting and serving. Fresh
tomatoes were cut based on their size: large tomatoes were cut into approximately ½-in thick
wedges, and small-size and cherry tomatoes were cut in half lengthwise. All processed products
were well stirred before serving. Samples were served in odor-free, disposable 3.25 oz. (~ 96
mL) plastics cups with lids. Each panelist received approximately 4 pieces or 3 oz. (88 mL) of
products for evaluation. To prevent potential bias, panelists were not provided with any
information about the samples evaluated. Panelists cleansed the palate between samples using
unsalted-top crackers (unsalted tops premium saltine crackers, Nabisco, East Hanover, NJ,
USA), and reverse osmosis, deionized, carbon-filtered water. All samples were labeled with 3-
digit random numbers.
Evaluation Procedure
Lexicon Development
The attribute determination and description procedure was modified from other similar
studies (e.g. Heisserer and Chambers, 1993; Lotong et al., 2000; and Rétiveau et al., 2005). To
generate the terminology for describing the sensory characteristics of tomatoes, the panel
evaluated a variety of fresh tomatoes and tomato-based products. Six 1.5-hr sessions were held
for establishing the sensory terminology of tomatoes. Approximately 30 fresh and processed
tomato products commercially available in the local markets were used during this process. The
panelists received a set of 5-6 products per session to assist them with terminology development.
The panelists were additionally given, in the first session, a list of vocabulary, previously
68
established for evaluating tomato products at the Sensory Analysis Center, Kansas State
University as well as those found in previous literature (Stevens et al., 1977; Watada and
Aulenbach, 1979; Resurreccion and Shewfelt, 1985; Rodríguez et al., 2001; Azodanlou et al.,
2003) to help them determine appropriate terminology. The panel discussed the appropriateness
of terms found in previous literature to determine if those terms should be included. The
panelists were asked to be as specific as possible in establishing attributes that illustrated to the
extent possible a one-dimensional perspective, rather than a multidimensional concept.
Additionally, panelists were told not to be concerned if the attributes established might
potentially indicate positive or negative connotations to consumers. A discussion was held after
each terminology development session to determine if any attributes were redundant as well as to
clarify the vocabulary used for the attribute definitions and appropriate reference standards for
each attribute used in that session. Attributes determined to be redundant were eliminated.
Additionally, the panelists discussed the evaluation technique appropriate for each sensory
attribute. All panelists then came to an agreement on the sensory attributes, their definitions,
reference standards, and appropriate evaluation techniques for each attribute.
Product Evaluation
To provide validation to the established lexicon, 40 tomato samples including fresh
tomatoes and tomato-based products were evaluated during 10 1.5-hr sessions, in which 5-6
samples were presented per session. All samples were coded with 3-digit random numbers. The
order in which products were evaluated was randomized, as illustrated in Table 4.1. The samples
were evaluated in a sequential monadic fashion. All panelists were present at all testing sessions.
Panelists initially evaluated the intensity of each appropriate sensory attributes individually using
a 15-point numerical scale, with increments of 0.5, where 0 represents none and 15 represents
extremely strong. Then the panel leader led a discussion, after all panelists provided intensity
scores for all the attributes, to determine consensus scores for each product. Reverse osmosis,
deionized, carbon-filtered water and unsalted cracker (unsalted tops premium saltine crackers,
Nabisco, East Hanover, NJ, USA) were provided to cleanse palate between samples during
testing.
A consensus approach (e.g. Rétiveau et al., 2005) was used over individual balloting to
allow further discussion following each sample, and a refinement to the lexicon, if necessary.

69
During the evaluation sessions, panelists could add an attribute to the lexicon established
initially. The panel leader led a discussion on any attributes added to determine the
appropriateness of the terms, definitions, reference standards as well as an evaluation technique.
Once it was agreed the term should be included, the panel evaluated later samples for the
intensity of the added attribute. One attribute, umami, was added to the tomato lexicon. Five
minutes were allowed between each sample evaluation to minimize the carry-over effect.
Panelists cleansed the palate between samples as previously described.
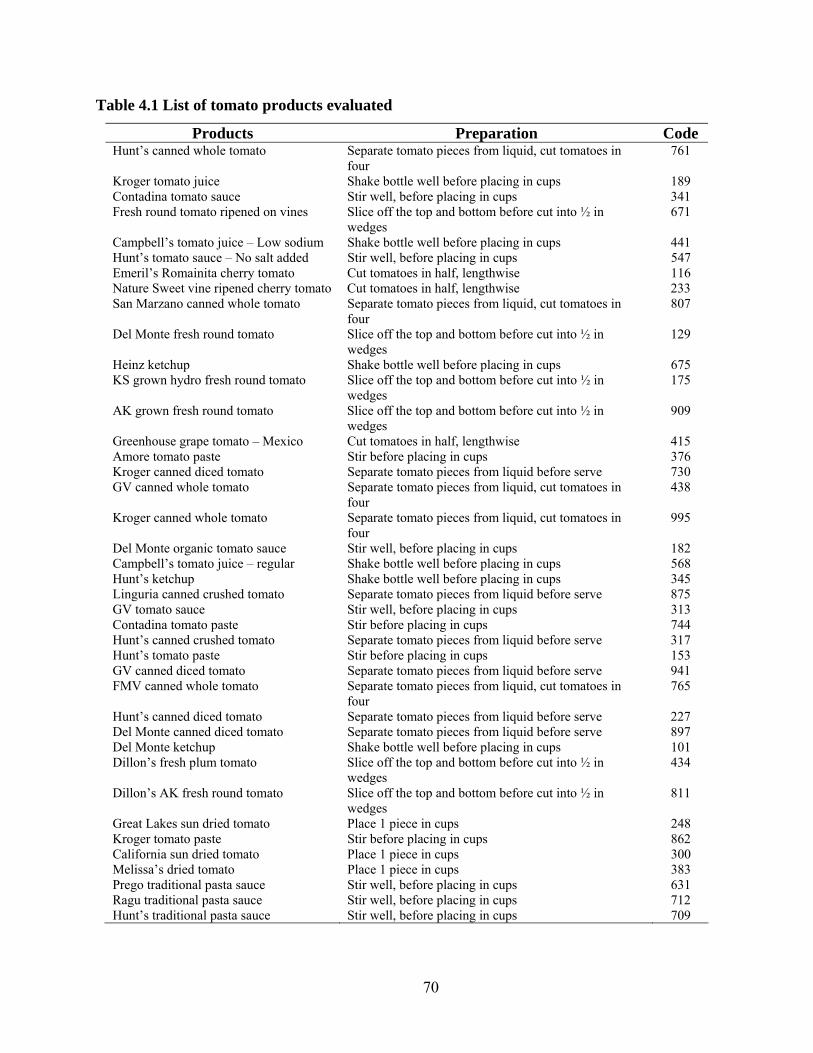
70
Table 4.1 List of tomato products evaluated
Products Preparation Code Hunt’s canned whole tomato Separate tomato pieces from liquid, cut tomatoes in
four 761
Kroger tomato juice Shake bottle well before placing in cups 189 Contadina tomato sauce Stir well, before placing in cups 341 Fresh round tomato ripened on vines Slice off the top and bottom before cut into ½ in
wedges 671
Campbell’s tomato juice – Low sodium Shake bottle well before placing in cups 441 Hunt’s tomato sauce – No salt added Stir well, before placing in cups 547 Emeril’s Romainita cherry tomato Cut tomatoes in half, lengthwise 116 Nature Sweet vine ripened cherry tomato Cut tomatoes in half, lengthwise 233 San Marzano canned whole tomato Separate tomato pieces from liquid, cut tomatoes in
four 807
Del Monte fresh round tomato Slice off the top and bottom before cut into ½ in wedges
129
Heinz ketchup Shake bottle well before placing in cups 675 KS grown hydro fresh round tomato Slice off the top and bottom before cut into ½ in
wedges 175
AK grown fresh round tomato Slice off the top and bottom before cut into ½ in wedges
909
Greenhouse grape tomato – Mexico Cut tomatoes in half, lengthwise 415 Amore tomato paste Stir before placing in cups 376 Kroger canned diced tomato Separate tomato pieces from liquid before serve 730 GV canned whole tomato Separate tomato pieces from liquid, cut tomatoes in
four 438
Kroger canned whole tomato Separate tomato pieces from liquid, cut tomatoes in four
995
Del Monte organic tomato sauce Stir well, before placing in cups 182 Campbell’s tomato juice – regular Shake bottle well before placing in cups 568 Hunt’s ketchup Shake bottle well before placing in cups 345 Linguria canned crushed tomato Separate tomato pieces from liquid before serve 875 GV tomato sauce Stir well, before placing in cups 313 Contadina tomato paste Stir before placing in cups 744 Hunt’s canned crushed tomato Separate tomato pieces from liquid before serve 317 Hunt’s tomato paste Stir before placing in cups 153 GV canned diced tomato Separate tomato pieces from liquid before serve 941 FMV canned whole tomato Separate tomato pieces from liquid, cut tomatoes in
four 765
Hunt’s canned diced tomato Separate tomato pieces from liquid before serve 227 Del Monte canned diced tomato Separate tomato pieces from liquid before serve 897 Del Monte ketchup Shake bottle well before placing in cups 101 Dillon’s fresh plum tomato Slice off the top and bottom before cut into ½ in
wedges 434
Dillon’s AK fresh round tomato Slice off the top and bottom before cut into ½ in wedges
811
Great Lakes sun dried tomato Place 1 piece in cups 248 Kroger tomato paste Stir before placing in cups 862 California sun dried tomato Place 1 piece in cups 300 Melissa’s dried tomato Place 1 piece in cups 383 Prego traditional pasta sauce Stir well, before placing in cups 631 Ragu traditional pasta sauce Stir well, before placing in cups 712 Hunt’s traditional pasta sauce Stir well, before placing in cups 709

71
Data Analysis
Multivariate statistical analyses were used to explore the relationships among the sensory
terms established. Principal components analysis (PCA) was constructed using the covariance
matrix (SYSTAT® Version 10.2, 2006, Systat Software, Inc., San Jose, CA). PCA categorized
attributes into a number of new uncorrelated variables (principal components) that were made up
of the original sensory attributes. This analysis may help to determine attribute synonyms,
covariate attributes, or any attribute redundancy that may exist in the established lexicon.
Additionally, differences and similarities among the products evaluated can be shown using PCA
maps.

72
References AZODANLOU, R., DARBELLAY, C., LUISIER, J.L., VILLETTAZ, J.C. and AMADÒ, R.
2003. Quality assessment of strawberries (Fragaria species). J. Agric. Food Chem. 51, 715-721.
ECONOMIC RESEARCH SERVICE. USDA. www.ers.usda.gov/ers. HEISSERER, D.M. and CHAMBERS, E. IV. 1993. Determination of the sensory flavor
attributes of aged natural cheese. J Sens. Stud. 8, 121-132. LOTONG, V., CHAMBERS IV, E. and CHAMBERS, D.H. 2000. Determination of the sensory
attributes of wheat sourdough bread. J. Sens. Stud. 15, 309-326. RESURRECCION, A.V.A. and SHEWFELT, R.L. 1985. Relationship between sensory
attributes and objective measurements of postharvest quality of tomatoes. J. Food Sci. 50, 1242-1245.
RÉTIVEAU, A., CHAMBERS, D.H. and ESTEVE, E. 2005. Developing a lexicon for the flavor
description of French cheeses. Food Qual. Pref. 16, 517-527. RODRÍGUEZ, A., LOPEZ, J., GONZALEZ, C., DE LA TORRE, R. and MANGUT, V. 2001.
Sensory Evaluation of canned diced tomato varieties. Proc. 7th Int. Symp. On Processing Tomato. Acta Hort 542, ISHS 2001. pp. 269-275.
STEVENS, M.A., KADER, A.A., ALBRIGHT-HOLTON, M. and ALGAZI, M. 1977.
Genotypic variation for flavor and composition in fresh market tomatoes. J. Am. Soc. Hortic. Sci. 102, 680-689.
WATADA, A.E. and AULENBACH, B.B., 1979. Chemical and sensory qualities of fresh
market tomatoes. J. Food Sci. 44, 1013–1016.

73
CHAPTER 5 - A Lexicon for Texture and Flavor Characteristics of
Fresh and Processed Tomatoes

74
Abstract A lexicon for describing the sensory flavor and texture characteristics of fresh and
processed tomatoes was developed. A six-member highly trained, descriptive sensory panel
identified, defined, and referenced 33 sensory attributes for fresh and processed tomatoes. Forty
products including a variety of raw, canned, concentrated, and dried tomatoes as well as tomato-
based products including ketchup and simple pasta sauce were evaluated in the study. These
products represented a wide range of sensory characteristics in raw and processed tomatoes. The
lexicon established included five aroma attributes, 10 texture attributes, and 18 flavor attributes,
including six taste and mouthfeel attributes. The lexicon provides attribute descriptors,
definitions, and references that often are lacking in previous literature. Reducing the number of
attributes may be appropriate when testing specific tomato products.

75
Practical Applications Increased consumption of tomato products has expanded interest in improving the
sensory characteristics of tomatoes and subsequent products. This research provides a list of
sensory flavor and texture terms that can be used to describe the sensory characteristics of both
fresh and processed tomatoes. This information will help researchers, breeders, and processors
better understand the flavor and texture properties of fresh and processed tomatoes and the
tomato characteristics of tomato products. Taste attributes, often used in previous literature, are
important, but are not enough to describe the characteristics of tomatoes. In addition to flavor
attributes, aroma and texture properties are important for describing tomato characteristics, but
have not been thoroughly established in previous research.
Introduction Tomatoes are one of the most valuable and most commonly used crops worldwide. In the
United States, according to the U.S. Economic Research Service, fresh tomatoes are the second
most popular item in the fresh-vegetable market. Factors influencing this considerable increase
in tomato consumption include the rise of consumer awareness of potential benefits such as
preventing cancer (Lee et al. 2000), an increasing trend toward restaurant-food or away-from-
home food consumption (Lucier, 2003), the increase in the popularity of Mexican and Italian
foods that frequently use tomatoes (Lucier, 2003), and an increase in the number of tomato
varieties available in the marketplace (Cuellar, 2002).
Consumers prefer fresh tomatoes that have full flavor and characteristic taste. Flavor
characteristics have become an important purchasing criterion in recent years (Krumbein et al.,
2004). Commercial tomatoes, however, have been criticized as lacking desirable flavor (Watada
and Aulenbach, 1979; Hobson, 1988; Bruhn et al., 1991; Maul et al., 2000; Yilmaz, 2001; Batu,
2004; Krumbein et al., 2004; and Serrano-Megías and López-Nicolás, 2006). One reason for this
flavor problem is that tomatoes are harvested at the mature-green stage (Kader et al., 1977) in
order to prolong the shelf-life of the tomatoes through multiple handling and transporting
periods. Other researchers have reported that lack of flavor of tomato is associated with various
storage treatments, e.g. modified atmosphere (Hobson, 1988; Ho, 1996; and Maul et al., 2000).

76
Several studies (e.g. Kader et al., 1978) recommended that tomatoes should be harvested at the
red-ripe stage to ensure the flavor desirability. However, because of the duration of
transportation and handling processes, the shelf-life of those vine-ripened tomatoes is shortened.
Most research appears to have focused on developing tomato cultivars that provide increased
yields, are firmer, larger, and have greater disease resistance and a longer shelf-life, rather than
improving the flavor aspect of tomatoes.
The overall flavor characteristics of tomatoes results from various components including
the ratio of reducing sugars to organic acids and the level of volatile compounds present (Stevens
et al., 1977; Stevens et al., 1979; Petro-Turza, 1987; Bucheli et al., 1999; Krumbein et al., 2004).
Those substances develop and change throughout the ripening process of the fruits. Reducing
sugar or total soluble solids and titratable acid contents have been found to be related,
respectively, to the sweetness and sourness of tomatoes (Stevens et al., 1977; Malundo et al.,
1995; Bucheli et al., 1999; and Tandon et al., 2003). A large body of research has been done to
identify the volatile compounds that contribute to the characteristic flavor and aroma of fresh
tomatoes using headspace analysis and gas chromatography (e.g. Petro-Turza, 1987; and Abegaz
et al., 2004). Of the several hundred volatile compounds identified in fresh tomatoes, a small
number of volatiles have been reported to be positively associated with the tomato-like flavor.
The stage of harvest has tremendous impact on tomato flavor; tomatoes harvested at the table-
ripe stage had been shown to have higher sweetness, saltiness and floral flavor as compared to
those harvested at the mature-green stage (Watada and Aulenbach, 1979). The flavor
characteristics of processed tomatoes are influenced by the quality of the fresh tomatoes used.
Thus, those factors impacting the qualities of fresh tomatoes would consequently affect the
qualities of processed products. Garcia and Barrett (2006) stated that the flavor of processed
tomatoes is impacted by the balance of sugar and acid content. The soluble and insoluble solids
are among the key components to obtaining most favorable processed tomato products.
Many studies have concentrated on examining the changes in quality of tomatoes (e.g.
sugars, acid contents, and volatile compounds) as affected by various postharvest treatments (e.g.
Watada and Aulenbach, 1979; Bedford, 1989; Malundo et al., 1995; Ratanachinakorn et al.,
1997; Ketelaere et al., 2004; Krumbein et al., 2004; and Lana et al., 2005) or relating some
sensory evaluation information with consumer preference or physico-chemical data (e.g. Thybo
et al., 2005; Serrano-Megias and Lopez-Nicolas, 2006; Lê and Ledauphin, 2006; and Plaehn and

77
Lundahl, 2006). Ratanachinakorn et al. (1997) showed that treating tomatoes harvested at
different ripening stages with varying level of O2, N2, and CO2 did not affect their aroma or
flavor characteristics. Ketelaere et al. (2004) found that different tomato cultivars and harvesting
time exhibited differences in firmness of the fruits. During storage, the amount of volatile
compounds in vine-ripened tomatoes increased (Krumbein et al., 2004) and tomato firmness
decreases (Lana et al., 2005). Thybo et al. (2005) reported a high correlation between sensory
and physical data on firmness of tomatoes. Serrano-Megias and Lopez-Nicolas (2006) reported
that tomato odor, flavor, sweetness, acidity and hardness were positively correlated with
consumer preference, but Malundo et al. (1995) found that increasing the level of sugar and acid
affected consumer acceptance not “overall tomato impact”. Lengard and Kermit (2006), Lê and
Ledauphin (2006) and Plaehn and Lundahl (2006) attempted to determine positive and negative
drivers of liking of tomatoes, and reported similar results in that some sensory attributes
including tomato odor and flavor, sweetness, juiciness, skin color and firmness illustrated
positive impact on consumer liking whereas mealiness and skin thickness illustrated negative
impact.
Although previous studies have considered the sensory characteristics of tomatoes, none
have reported complete information for describing the sensory characteristics of tomatoes. Most
researchers have reported a modest number of sensory attributes for specific products. For
example, Causse et al. (2003) reported scores for sweetness, acidity, tomato aroma, strange
aroma, firmness, juiciness, mealiness and skin of various tomato samples. Some studies
provided information such as definitions of sensory attributes evaluated, but the information
provided was usually minimal. One such study (Bedford, 1989) gave four texture (i.e. firmness,
toughness, pulpy and juiciness) and seven flavor (i.e. strength of flavor, acid, savory, salty,
green/stemmy, and hay/musty) attributes along with their definitions and evaluation techniques.
Many sensory attributes used in previous studies not only were not defined, but some of the
descriptors were non-discriminative and/or more appropriate for consumer language, for
example “strange aroma” (Causse et al., 2003) and “off-flavor” (Resurreccion and Shewfelt,
1985). Moreover, little has been done to fully understand the sensory characteristics of various
processed tomatoes and tomato-based products. These issues indicate the potential need to
establish a general lexicon that would be appropriate for describing the sensory characteristics of
both fresh and processed tomatoes and could be used by a wide range of researchers. Such

78
lexicons have been published previously for other food products. For example, in the past
several years lexicons have been published or expanded for cheese (Rétiveau et al., 2005), floral
honey (Galán-Soldevilla et al., 2005), specific fruits (Vara-Ubol et al., 2006), soymilk
(Chambers et al., 2006 and Day N’Kouka et al., 2004), and beany chemical compounds (Bott
and Chambers, 2006; Vara-ubol et al., 2004).
The objectives of this study were to (1) develop a sensory lexicon that includes attributes,
definitions and references to describe the flavor and texture characteristics of a wide variety of
fresh and processed tomatoes, and (2) validate the established lexicon by determining the
characteristics of a broad range of fresh and processed tomatoes and tomato-based products as
well as determine if any sensory attributes can be reduced.
Materials and Methods
Samples
Thirty fresh and processed tomatoes were used for the lexicon development process. The
same set of samples plus 10 additional tomato products were evaluated for the validation of the
lexicon. Fresh tomatoes (n=9) included round, plum, and cherry tomatoes. Processed tomato
products (n=25), representing varying degrees of processing, included canned whole, diced and
crushed tomatoes, tomato paste, tomato juice, and dried tomato. Tomato-based products (n=6)
included ketchup and simple traditional pasta sauce. Ketchup and simple pasta sauce were
selected because of their minimal additional ingredients. All products were available
commercially at local grocery stores. Multiple brands of each product were used to represent the
variation of these products. Products were purchased about 3-10 days prior to testing and were
stored at room temperature (~70ºF).
Sample Preparation
All samples were served at room temperature. For fresh tomatoes, the fruits were washed
and cut into ½-in thick wedges and placed in odor-free, disposable 3.25 oz. plastic cups
(Sweetheart Cup Company INC., Owing Mills, MD. USA) for the evaluation. Small tomatoes,
e.g. cherry tomatoes, were cut in half for the evaluation. All canned and jarred products were
stirred before placing a sample into the plastic cups with lids for the evaluation. Samples were

79
prepared approximately 30 min to 1 hr prior to testing. Each panelist received approximately
four pieces of solid tomatoes or 3 oz. of liquid tomato product for evaluation.
Panelists
Six highly trained panelists from the Sensory Analysis Center, Kansas State University
(Manhattan, KS) participated in this study. These panelists had completed 120 hours of general
sensory descriptive analysis panel training with a wide variety of food products. That training
included techniques and practice in attribute identification, terminology development, and
intensity scoring. For this study the panelists also received a further orientation and training on
tomato products. Each of the panelists had more than 1,000 hours of testing experience with a
variety of food products including fresh tomatoes and tomato-based products.
Development and Description of the Terminology
The attribute determination and description procedure was modified from other similar
studies (e.g. Heisserer and Chambers, 1993; Lotong et al., 2000; and Rétiveau et al., 2005). To
generate the terminology for describing the sensory characteristics of tomatoes, the panel
evaluated a variety of fresh tomatoes and tomato-based products. Initially, a list of potential
lexicon terms, including those used previously for evaluating tomato products in our laboratories
as well as those found in published literature (e.g. Stevens et al., 1977; Bedford, 1989;
Azodanlou et al., 2003), were provided to the panelists. Six 1.5-hr sessions were held for
establishing the sensory terminology of tomatoes. Thirty fresh and processed tomato products
commercially available in the local markets were used during this process. The panelists
received a set of 5-6 products per session to assist them with terminology development. The
panel discussed the appropriateness of terms found in previously used terms to determine if those
terms should be included. The panelists were asked to be as specific as possible in establishing
attributes that illustrated a one-dimensional perspective, rather than a multidimensional concept.
Additionally, panelists were told not to be considering whether a particular attribute might
potentially indicate positive or negative connotations to consumers. A discussion was held at the
end of each terminology development session to determine if any attributes appeared redundant,
to clarify the attribute definitions if necessary, and to discuss potential attribute references that
would be provided in the next session. Attributes determined to be redundant by the panel were
not included. The panelists also discussed the evaluation technique appropriate for each sensory

80
attribute. When all panelists had come to agreement on the sensory attributes, their definitions,
reference standards, and appropriate evaluation techniques for each attribute lexicon
development sessions were ended.
A necessary process during lexicon development was to determine reference standards
for sensory attributes. For each attribute, panelists carefully determined simple, reproducible
reference materials that would provide a broad range of intensities, which could be easily
prepared without changing the character. Panelists tried to select references from a broad range
of materials that would best represent the characteristics of a corresponding attribute evaluated.
In addition, an attempt was made to select widely available branded products. In many cases,
panelists determined more than one reference that potentially covered the intensity range of an
attribute that could be found in both fresh and processed tomatoes. All the fundamental taste
references were prepared by diluting appropriate chemicals at specific concentrations to
represent various intensities of each basic taste attribute. For example, citric acid solution was
used to represent sour attributes, where a 0.05% solution best represented the sour intensity of
3.5 and a 0.08% solution represented the sour intensity of 5.0.
Evaluation Procedure during Lexicon Validation
To assist in validating the established lexicon, 40 tomato samples including fresh and
processed tomatoes and tomato-based products were evaluated during 10 1.5-hr sessions. Five to
six samples, coded with 3-digit random numbers, were presented in each session. The order in
which products were evaluated was randomized.
The panelists used a modified flavor profile (Caul, 1957, Keane, 1992) method similar to
that used by Rétiveau et al. (2005), Galán-Soldevilla et al. (2005), Vara-Ubol et al. (2006), and
Chambers et al. (2006). Panelists initially evaluated the intensity of each appropriate sensory
attribute individually using a 15-point numerical scale, with increments of 0.5, where 0
represents none and 15 represents extremely strong. Then the panel leader led a discussion, to
determine consensus scores for each product. Reverse osmosis, deionized, carbon-filtered water
and unsalted cracker (unsalted tops premium saltine crackers, Nabisco, East Hanover, NJ, USA)
were provided to cleanse palate between samples during testing.
A consensus approach was used over individual balloting to allow further discussion
following each sample, and to refine the lexicon, if necessary. During the evaluation sessions,

81
panelists could add an attribute to the lexicon established initially. The panel leader led a
discussion on any attributes added to determine the appropriateness of the terms, definitions,
reference standards as well as an evaluation technique. Once the term was agreed to be included,
the panel evaluated the later samples for the intensity of those added attributes. One attribute,
umami, was added to the tomato lexicon during this testing.
Data Analysis
Multivariate statistical analyses were used to explore the relationships among the sensory
terms established. Principal components analysis (PCA) was constructed using the covariance
matrix (SYSTAT®, Version 10.2, 2006, Systat Software, Inc., San Jose, CA). PCA categorized
attributes into a number of new uncorrelated variables (principal components) that were made up
of the original sensory attributes. This analysis may help to determine attribute synonyms,
covariate attributes, or any attribute redundancy that may exist in the established lexicon.
Additionally, differences and similarities among the products evaluated can be shown using plots
of the PCA results.
Results and Discussion
Lexicon Development
The final lexicon developed in this research is given in Table 5.1. A total of 33 sensory
attributes was established to describe the sensory characteristics of fresh and processed tomatoes.
The lexicon is comprised of aroma, texture, flavor, basic taste and mouthfeel attributes.
During the lexicon development process, some terms, such as “fresh tomato” and “tomato
ID”, were discussed extensively. The panel believed it was important to have an overall identity
note, thus “tomato ID” was retained in the lexicon. However, much of the definition for “fresh
tomato” was included in the tomato ID characteristic and that, coupled with the fact that “fresh
tomato” can include slightly different flavor combinations that can better be described by
individual notes, resulted in “fresh tomato” not being included in the final lexicon.
Some attributes that were initially included or found in previous literature were
eliminated. For example, the terms amount of juice and amount of tomatoes, initially listed,
were discussed among panelists. The panelists agreed that the evaluation of these terms would
not provide any additional information about the sensory characteristics of tomatoes, and thus

82
they were eliminated. Those terms appeared to be related to specific information on canned
tomatoes and are not so much a characteristic of the tomatoes as of the amount the
manufacturer’s pack. Thus, although the terms may be necessary and appropriate to describe the
amount of specific product in a container (e.g. a can), they are not included in this lexicon
because they were not an integral part of “tomato” flavor or texture.
Some terms used to describe the characteristics of tomatoes in previous studies either
were too general or non-descriptive, thus some were eliminated from the lexicon. For example,
the terms off flavor and off aroma (Mual et al., 2000), strange aroma (Causse et al., 2003), and
herbaceous (Azodanlou et al., 2003) were not included.
Some of the texture and flavor attributes determined in the current research for describing
fresh tomatoes were similar to those in previous literature (e.g. Bedford, 1989; Mual et al., 2000;
Causse et al., 2003; Krumbein et al., 2004; and Berna et al., 2005). For example, the term
“tomato ID” established in our lexicon was similar to tomato-like or tomato aroma used in
previous research. Previous literature, however, mainly evaluated a subset of texture and flavor
attributes, whereas the present research attempted to fully described aroma, flavor and texture
aspects of tomatoes.
Evaluation technique was included as part of the definitions for many attributes to ensure
the consistency of the evaluation throughout the study period as well as the repeatability of such
evaluation. For example, for viscosity evaluation, panelists rated the rate of flow of tomato
products using 1 teaspoon of a sample. Consistent evaluation technique can ensure that an
unnecessary source of variation is minimized and is given as part of the definition in classic
articles on sensory texture evaluation (Szczesniak et al., 1963; Munoz, 1986).

83
Table 5.1 Tomato sensory attributes, definitions, references and intensities on a 15-point
scale
Attribute Definition Referencea and Intensityb Aroma Tomato ID The aromatics commonly associated with
tomato, which may be described as sweet, fruity, earthy, viney, ripe, and sour (citric).
Campbell’s Tomato Juice = 8.0
Browned Dark impression often associated with toasted and caramelized.
Great Lakes Sun Dried Tomato = 10.5 Contadina Tomato Paste = 7.5
Cardboard Aromatics associated with cardboard and paper packaging. The aromatic may be associated with stale.
Kroger Raw Diced Potatoes = 2.0 (f) Fresh Cucumber = 5.0 (f, a) Fresh Sliced Tomatoes = 10.0 (f), 9.0 (a)
Decaying Vegetation
Aromatics associated with rotting plants (moldy/mildew).
Green Corn Shucks stored in a plastic bag for 1 week.
Green-Viney A green aromatic associated with green vegetables and newly cut vines and stems; characterized by increased bitter and musty/earthy character.
½ in Wedged Fresh Tomatoes = 6.0 Crushed Tomato Leaves = 10.0
Texture
Fiber- Awareness The degree to which fiber are present. Evaluated during mastication after 5-8 chews. Evaluated only on those products with distinguishable pieces using ½ tsp sample.
Dole Canned Tidbits Pineapple = 10.0
Juiciness The amount of liquid expressed from the sample during first and second chew. Evaluated only on those products with distinguishable pieces.
Hormel Cure 81 Extra Lean Ham, ½" cubed = 5.0 Dole Canned Tidbits Pineapple = 10.0
Mealy A geometric attribute within the product. The perception of fine, soft, somewhat round and smooth particles evenly distributed within the product.
Fresh Pear, peeled, ½" cubed = 8.0
Pulp Amount A measure of the amount of perceivable pulp in the liquid portion of and the pureed products, evaluated by manipulating the product to the roof of the mouth with the tongue.
Hunt's Tomato Sauce = 8.0 Contadina Tomato Paste = 14.0

84
Attribute Definition Referencea and Intensityb Pulp Size A measure of the size of the perceivable
pulp in the product, evaluated by manipulating the product to the roof of the mouth with the tongue.
Hunt's Tomato Sauce = 6.0 Contadina Tomato Paste = 8.5 Musselman's Applesauce = 13.0
Skin- Awareness The degree to which the outside skin of the product is perceived as intact pieces during mastication.
Fresh Seedless Red Grapes = 10.0
Seed- Awareness The degree to which seeds are present. Evaluated during mastication after 3-5 chews from 1 tsp sample.
½ c Hunt's Tomato Sauce + ¼ tsp Sesame Seeds = 7.5
Thickness A measure of resistance of the pureed product when stirred with a spoon.
Campbell's Tomato Juice = 4.0 Hunt's Tomato Sauce = 7.0 Musselman's Applesauce = 13.0
Viscosity Degree of resistance to flow. Evaluated by the rate of flow of liquid when sample is poured from a spoon, using 1 tsp sample.
Campbell's Tomato Juice = 4.0 Hunt's Tomato Sauce = 7.5 Musselman's Applesauce = 13.0
Flavor
Tomato ID The aromatics commonly associated with tomato, which may be described as sweet, fruity, earthy, viney, ripe, and sour (citric acid).
Campbell's Tomato Juice = 10.0
Browned Dark impression often associated with toasted and caramelized.
Hunt's Tomato Sauce = 8.0 Contadina Tomato Paste = 10.0
Cardboard Aromatics associated with cardboard and paper packaging. The aromatic may be associated with stale.
Cardboard soaked in water = 11.0 (preparation: 2x2" cardboard in ½ c water)
Fermented Aromatics associated with ripe/ overripe fruit; can be somewhat sweet, sour, browned and fruity.
Great Lakes Sun Dried Tomato = 9.0 Pompein Burgundy Cooking Wine = 10.0
Fruity A sweet, slightly floral and sour aromatic associated with a variety of fruits.
Welch's White Grape Pear Juice, diluted 1:1 in water = 4.5
Green-Viney A green aromatic associated with green vegetables and newly cut vines and stems; characterized by increased bitter and musty/earthy character.
1 g Crushed Tomato Leaves in medium snifter = 10.0 (a)
Musty/Earthy Humus-like aromatics that may or may not include damp soil, decaying vegetation, or cellar-like characteristics.
Raw White Potato, ½" sliced in medium snifter = 8.5 (a)
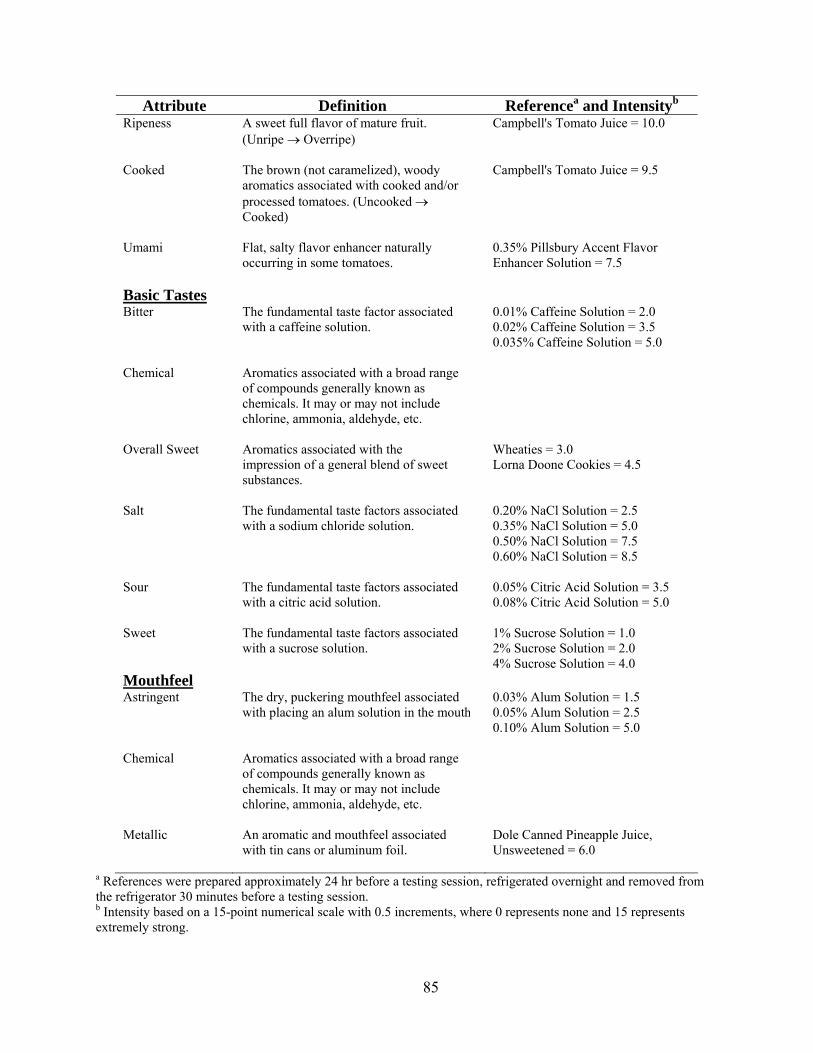
85
Attribute Definition Referencea and Intensityb Ripeness A sweet full flavor of mature fruit.
(Unripe → Overripe)
Campbell's Tomato Juice = 10.0
Cooked The brown (not caramelized), woody aromatics associated with cooked and/or processed tomatoes. (Uncooked → Cooked)
Campbell's Tomato Juice = 9.5
Umami Flat, salty flavor enhancer naturally occurring in some tomatoes.
0.35% Pillsbury Accent Flavor Enhancer Solution = 7.5
Basic Tastes Bitter The fundamental taste factor associated
with a caffeine solution.
0.01% Caffeine Solution = 2.0 0.02% Caffeine Solution = 3.5 0.035% Caffeine Solution = 5.0
Chemical Aromatics associated with a broad range of compounds generally known as chemicals. It may or may not include chlorine, ammonia, aldehyde, etc.
Overall Sweet Aromatics associated with the impression of a general blend of sweet substances.
Wheaties = 3.0 Lorna Doone Cookies = 4.5
Salt The fundamental taste factors associated with a sodium chloride solution.
0.20% NaCl Solution = 2.5 0.35% NaCl Solution = 5.0 0.50% NaCl Solution = 7.5 0.60% NaCl Solution = 8.5
Sour The fundamental taste factors associated with a citric acid solution.
0.05% Citric Acid Solution = 3.5 0.08% Citric Acid Solution = 5.0
Sweet The fundamental taste factors associated with a sucrose solution.
1% Sucrose Solution = 1.0 2% Sucrose Solution = 2.0 4% Sucrose Solution = 4.0
Mouthfeel Astringent The dry, puckering mouthfeel associated
with placing an alum solution in the mouth
0.03% Alum Solution = 1.5 0.05% Alum Solution = 2.5 0.10% Alum Solution = 5.0
Chemical Aromatics associated with a broad range of compounds generally known as chemicals. It may or may not include chlorine, ammonia, aldehyde, etc.
Metallic An aromatic and mouthfeel associated with tin cans or aluminum foil.
Dole Canned Pineapple Juice, Unsweetened = 6.0
a References were prepared approximately 24 hr before a testing session, refrigerated overnight and removed from the refrigerator 30 minutes before a testing session. b Intensity based on a 15-point numerical scale with 0.5 increments, where 0 represents none and 15 represents extremely strong.

86
Comparison of the Sensory Characteristics Established in Current Study and
Previous Literature
Table 5.2 shows similarities and differences in attributes used to evaluate tomato sensory
characteristics in previous literature as compared with the lexicon developed in this research.
Although considerable research that included some sensory testing has been done on tomatoes,
many studies have used only a few flavor (especially sweet and sour) and texture attributes to
study the sensory characteristics of tomatoes. Ten previously published articles are included in
Table 5.2 to help illustrate that more flavor and texture attributes would be necessary to fully
describe the sensory properties of tomatoes. Additionally, most of the previous work focused
primarily on studying the sensory characteristics of fresh tomatoes only. A study by Rodríguez
et al. (2001) was among a small number of publications that examined the sensory characteristics
of processed tomatoes. None of previous literature has determined sensory attributes that can
describe the characteristics of both fresh and processed tomatoes.
Similarities and differences between our lexicon and those established in previous studies
were noted. Stevens et al. (1977) described fresh tomatoes using three sensory attributes
including overall tomato-like, sweet and sour, all of which we also included in this lexicon as
tomato ID, sweet and sour. Aroma characteristics, which have recently been included as
terminology describing the sensory properties of tomatoes (e.g. Lengard and Kermit, 2006; and
Plaehn and Lundahl, 2006) were specifically described in our lexicon. In previous literature,
aroma has only been described in general term as “aroma” (Azodanlou et al., 2003) or “tomato
aroma” (Causse et al., 2003; Lengard and Kermit, 2006; and Plaehn and Lundahl, 2006). Our
lexicon specified five specific aroma attributes including tomato ID, browned, green-viney,
cardboard and decaying vegetation, which will help researchers further differentiate aroma
character present in various tomato products.

87
Table 5.2 Comparison of descriptive attributes used in previous literature
Stev
ens e
t al.
(197
7)1
Wat
ada
and
Aul
enba
ch
(197
9)
Res
urre
ccio
n an
d Sh
ewfe
lt (1
985)
2
Bed
ford
(198
9)
Rod
rígue
z et
al.
(200
1)3
Azo
danl
ou e
t al.
(200
3)4
Tand
on e
t al.
(200
3)5
Abe
gaz
et a
l. (2
004)
Leng
ard
and
Ker
mit
(200
6)6
Plae
hn a
nd
Lund
ahl (
2006
)6
AROMA Tomato ID X X Browned Cardboard Green-Viney Decaying Vegetation
TEXTURE Fiber-Awareness Fibrosity
Firmness X X X X X X Juiciness X X X X X Mealy X X X Pulp Size
Pulp Amount Dry /Pulp
Skin-Awareness Skin
Toughness Skin width
Skin width
Seed-Awareness
Thickness Viscosity FLAVOR
Tomato ID Tomato like Tomato
like Strength of flavor Tomato
like X X X
Browned Cardboard Chemical Fermented Fruity X X
Green-Viney Grassy/ Stemmy Green/
Stemmy Green/ Grassy
Green/ Grassy
Musty/Earthy X Hay/ Musty
Overall Sweet Ripeness Freshness Overripe Tomato- Cooked
Umami Savoury BASIC TASTES AND MOUTHFEELS
Astringent X X X X Bitter X X X X Metallic X Salty X X X X X X Sour X X Acidic Acidic Acidic Acidic X X X X Sweet X X X X X X X X X X
1 – Also listed overall intensity; 2 – Also listed off-flavor, overall flavor intensity; 3 – Also listed flavor intensity, maturity, tomato concentrate, freshness; 4 – Also listed odor, herbaceous, aroma; 5 – Also listed bite; 6 – Also listed melty

88
Some sensory attributes used in some previous studies were too broad; hence they were
not included in the present lexicon. Several studies evaluated terms such as “overall intensity”
(Stevens et al., 1977), “overall flavor intensity” (Watada and Aulenbach, 1979; Resurreccion and
Shewfelt, 1985), “herbaceous” and “aroma” (Azodanlou et al., 2003), whereas in our study,
specific terms possibly imparting these integral terms were described. For example, the terms
ripeness, green-viney, fruity, and musty/earthy characteristics, which potentially impart the
overall tomato ID character, were individually described in our lexicon. Other terms found in
previous literature such as “off-flavor” (Watada and Aulenbach, 1979), “maturity”, “melty”
(Lengard and Kermit, 2006 and Plaehn and Lundahl, 2006) and “freshness” (Rodríguez et al.,
2001) were not included in our lexicon because these general terms can be interpreted
differently, particularly when attribute definitions were not specified.
Evaluating the Characteristics of Fresh and Processed Tomatoes
As expected, products produced with different degrees of processing (e.g. fresh vs. dried
vs. canned) exhibited greater differences as compared to those products at the same or similar
level of processing. Fresh tomato samples illustrated similar sensory characteristics to other
fresh tomatoes, and were different from some processed tomatoes (e.g. tomato paste samples),
which had a much higher degree of processing. The sensory profiles generated for each product
were unique from one another in both qualitative (i.e. the identified attributes) and quantitative
(i.e. intensity) aspects. All sensory attributes were found in many of the products tested,
although some attributes were appropriate only for a small number of products. For example,
browned and cooked characters were found only in processed, and not in fresh tomatoes.
The first two principal components explained 82% of the total variability of the aroma
and flavor attributes of the samples evaluated (Fig. 5.1). For texture attributes, the first two
principal components accounted for approximately 80% of the total variance (Fig. 5.2). Ten
texture attributes including viscosity, thickness, juiciness, firmness, mealy, skin awareness, seed
awareness, fiber awareness, pulp size and pulp amount, and 19 aroma/flavor attributes including
tomato ID, green-viney, decaying vagetation, ripeness, browned, cooked, fruity, cardboard,
fermented, musty/earthy, salty, sweet, sour, bitter, metallic, astringent could be used to describe
the variations in tomato products. It should be noted that because of the considerable
fundamental differences in the texture properties of the tomato samples (e.g. fresh vs. tomato

89
sauce), only some texture attributes would be appropriate for describing the characteristics of a
specific type of tomato products.
Figure 5.1 Sensory map of the first two principal components for describing the
aroma/flavor characteristics of tomato products
The sensory map shown in Fig. 5.1 and 5.2 demonstrates differences in aroma/flavor and
texture characteristics of tomato samples. For aroma/flavor, principal component 1
differentiated between raw and cooked notes in the products. It is clear that fresh tomatoes were
located where tomato ID and green-viney characters are high, and those attributes associated
with cooked notes are low. Principal component 2 categorized products based on their saltiness,
90
fermented and decaying vegetation. It is interesting to also note that ripeness was found to be
higher in some processed tomato products, including canned diced, whole, and crushed tomatoes
than in fresh tomatoes. Heat treatment may result in increased concentration of the ripeness
character in those tomato products. Based on aroma/flavor, tomatoes can be categorized into 3
groups. These groups included no processing (i.e. fresh tomatoes), with processing (i.e. canned-
whole, -diced, -crushed, tomato juice, sauce, paste, ketchup and pasta sauce) and dried tomatoes.
Dried tomatoes are located where attributes such as fermented and decaying vegetation are high.
This distinct difference is likely due to the impact of drying/dehydrating processes, which were
not used in other products selected. Fig. 5.2 shows clear differences in texture characteristics of
tomato products impacted by the processing level. Texture map (Fig. 5.2) differentiated the
products according to their level of processing. Fresh tomatoes are located where the firmness
and skin awareness are high. Canned whole and diced tomatoes, which have minimal
processing, retain the integrity of the flesh with high juiciness, mealiness, seed awareness and
fiber awareness. Those products with higher processing level/heat treatment illustrate attributes
such as pulp, viscosity and thickness.
The sensory characteristics of products in the same group tended to be more similar than
those in different groups. However, products within the same group could show a few large
differences in some attributes. For example, among the fresh tomatoes, those purchased from
large chain grocery stores (e.g. Dillon’s) were considerably lower in tomato ID flavor as
compared to those purchased from a fresh vegetable market (e.g. KS and AK-local grown).
Among the processed tomato products, the cooked and browned attributes varied considerably.
For example, cooked flavor in canned tomatoes ranged from 7.0 to 9.0; juice, sauce, pasta and
ketchup from 9.5 to 12.0; and paste and dried from 12.0 to 15.0. Although most processed
tomatoes (i.e. canned, juice, sauce, paste, dried, and tomato-based products) exhibited similar
sensory attributes, they differed considerably in their intensities probably because of processing
level. For example, tomato ketchup and pasta sauce exhibited the characteristic green-viney
aroma only at a detectable level, while those products processed to a lesser degree (i.e. canned)
had higher levels of green-viney. These results indicate the impact that processing level has on
the sensory characteristics of tomato products and the necessity to retain these attributes in the
lexicon.
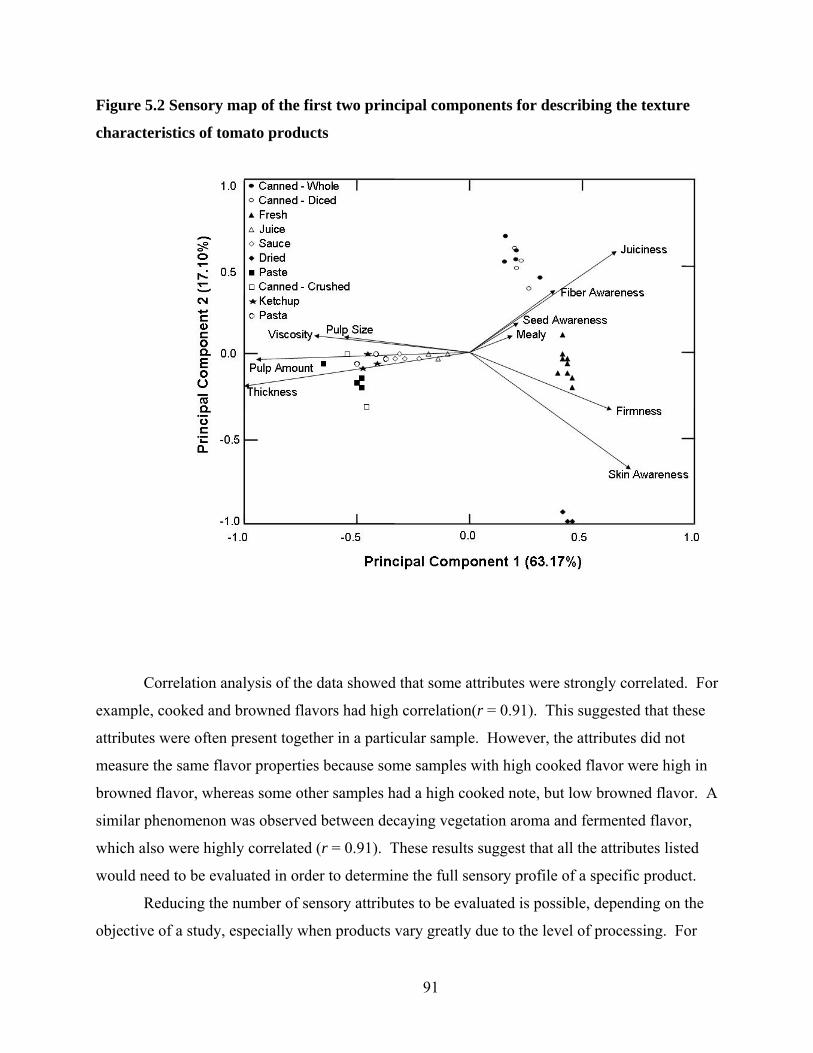
91
Figure 5.2 Sensory map of the first two principal components for describing the texture
characteristics of tomato products
Correlation analysis of the data showed that some attributes were strongly correlated. For
example, cooked and browned flavors had high correlation(r = 0.91). This suggested that these
attributes were often present together in a particular sample. However, the attributes did not
measure the same flavor properties because some samples with high cooked flavor were high in
browned flavor, whereas some other samples had a high cooked note, but low browned flavor. A
similar phenomenon was observed between decaying vegetation aroma and fermented flavor,
which also were highly correlated (r = 0.91). These results suggest that all the attributes listed
would need to be evaluated in order to determine the full sensory profile of a specific product.
Reducing the number of sensory attributes to be evaluated is possible, depending on the
objective of a study, especially when products vary greatly due to the level of processing. For
92
example, fewer flavor and texture attributes may be needed when products were raw, because
attributes such as cooked, browned, fermented, metallic, chemical, and viscosity were only
present in processed tomato products in this study. Therefore, it may be reasonable to remove
those attributes when a researcher is examining only raw (fresh) tomatoes, but that finding would
need to be confirmed with a study with a larger number of tomato varieties in various stages of
ripeness under various storage conditions. It may be necessary to have all the established
attributes to assure that a large pool of necessary attributes was available to researchers when
studying a specific type of tomato product, and to maintain the overall integrity of the lexicon.
Conclusions A lexicon containing 33 aroma, flavor and texture attributes for describing the sensory
characteristics of fresh and processed tomato products was established. All attributes were
defined and referenced. These objectively determined attributes can help researchers to
adequately describe the sensory characteristics of fresh, processed tomatoes and tomato-based
products. These sensory attributes also could be related to other information such as physical
and chemical data to help researchers better understand the characteristics of various tomato
products. Because of the wide range of the product characteristics caused, in part, by degree of
processing, some attributes may only be appropriate for evaluating a specific set of tomato
products. Thus the number of attributes may vary accordingly and may be reduced in specific
studies.

93
References ABEGAZ, E.G., TANDON, K.S., SCOTT, J.W., BALDWIN, E.A. and SHEWFELT, R.L. 2004.
Partitioning taste from aromatic flavor notes of fresh tomato (Lycopersicon esculentum, Mill) to develop predictive models as a function of volatile and nonvolatile components. Postharvest Biol. Technol. 34, 227-235.
AZODANLOU, R., DARBELLAY, C., LUISIER, J.L., VILLETTAZ, J.C. and AMADÒ, R.
2003. Quality assessment of strawberries (Fragaria species). J. Agric. Food Chem. 51, 715-721.
BATU, A. 2004. Determination of acceptable firmness and colour values of tomatoes. J. Food
Eng. 61, 471-475. BEDFORD, L.V. 1989. Sensory quality of fresh tomatoes: comparison of tomatoes grown in
nutrient media of different conductivities. Camden Food and Drink Research Association/Technical Memorandum No. 531.
BERNA, A.Z., BUYSENS, S., DI NATALE, C., GRÜN, I.U., LAMMERTYN, J. and
NICOLAÏ, B.M. 2005. Relating sensory analysis with electronic nose and headspace fingerprint MS for tomato aroma profiling. Postharvest Biol. Technol. 36, 143-155.
BOTT, L. and CHAMBERS, E. IV. 2006. Sensory characteristics of combinations of chemicals
potentially associated with beany aroma in foods. J. Sens. Stud. 21, 308-321. BRUHN, C.M., FELDMANN, N., GARTITZ, C., HARWOOD, J., IVANS, E., MASHALL, M.,
RILEY, A., THURBER, D. and WILLAMSON, E. 1991. Consumer perceptions of quality: apricots, cantaloupes, peaches, pears, strawberries, and tomatoes. J. Food Qual. 14, 187–195.
BUCHELI, P., VOIROL, E., DELATORRE, R., LOPEZ, J., RYTZ, A., TANKSLEY, S.D. and
PETIARD, V. 1999. Definition of nonvolatile markers for flavor of tomato (Lycopersicon esculentum Mill.) as tools in selection and breeding. J. Agric. Food Chem. 47, 659–664.
CAUSSE, M., BURET, M., ROBINI, K. and VERSCHAVE, P. 2003. Inheritance of nutritional
and sensory quality traits in fresh market tomato and relation to consumer preferences. J. Food Sci. 68, 2342-2350.
CUELLAR, S. R. 2002. Marketing fresh fruit and vegetable imports in the U.S.: Status,
Challenge and Opportunity. Research Bulletin (R. B. 2002-2004). pp. 20. Food Industry Management, Cornell University, Ithaca, New York.
DAY N’KOUKA, K., KLEIN, B.P. and LEE, S.Y. 2004. Developing a lexicon for descriptive
analysis of soymilks. J. Food Sci. 69, 259-263.

94
GALÁN-SOLDEVILLA, H., RUIZ-PÉREZ-CACHO, M.P., SERRANO JIMÉNEZ, S., JODRAL VILLAREJO, M. and BENTABOL MANZANARES, A. 2005. Development of a preliminary sensory lexicon for floral honey. Food Qual. Pref. 16, 71-77.
GARCIA, E. and BARRETT, D.M. 2006. Evaluation of processing tomatoes from two
consecutive growing seasons: quality attributes, peelability and yield. J. Food Process. Preserv. 30, 20-36.
HO, L. 1996. The mechanism of assimilates partitioning and carbohydrate compartmentation in
fruit in relation to the quality and yield of tomato. J. Exp. Bot. 47, 1239–1243. HOBSON, G. 1988. How the tomato lost its taste. New Scientist. 1632, 46–50. KADER, A.A., STEVENS, M.A., ALBRIGHT-HOLTON, M., MORRIS, L.L. and ALGIZI, M.
1977. Effect of fruit ripeness when picked on flavor and composition in fresh market tomatoes. J. Am. Soc. Hortic. Sci. 102, 724–731.
KADER, A.A., MORRIS, L.L., STEVENS, M.A. and ALBRIGHT-HOLTON, M. 1978.
Composition and flavor quality of fresh market tomatoes as influenced by some postharvest handling procedures. J. Am. Soc. Hortic. Sci. 103, 6-13.
KETELAERE, B.D., LAMMERTYN, J., MOLENBERGHS, G., DESMET, M., NICOLAΪ, B.
and BAERDEMAEKER., J.D. 2004. Tomato cultivar grouping based on firmness change, shelf life and variance during postharvest storage. Postharvest Biol. Technol. 34, 187-201.
KRUMBEIN, A., PETERS, P. and BRÜCKNER, B. 2004. Flavor compounds and a quantitative
descriptive analysis of tomatoes (Lycopersicon esculentum Mill.) of different cultivars in short-term storage. Postharvest Biol. Technol. 32, 15-28.
LANA, M.M., TIJSKENS, L.M.M. and KOONER, O. 2005. Effect of storage temperature and
fruit ripening on firmness of fresh cut tomatoes. Postharvest Biol. Technol. 35, 87-95. LÊ, S. and LEDAUPHIN, S. 2006. You like tomato, I like tomato: segmentation of consumers
with missing values. Food Qual. Pref. 17, 228-233. LEE, A., THURNHAM, D.I. and CHOPRA, M. 2000. Consumption of tomato products with
olive oil but not sunflower oil increases the antioxidant activity of plasma. Free Rad. Biol. Med. 29: 1051-1055.
LENGARD, V. and KERMIT, M. 2006. 3-Way and 3-block PLS regressions in consumer
preference analysis. Food Qual. Pref. 17, 234-242. LUCIER, G. 2003. Vegetable consumption away from home on the rise. Amber Waves Vol. 1.

95
MALUNDO, T.M.M., SHEWFELT, R.L. and SCOTT, J.R. 1995. Flavor quality of fresh tomato (Lycopersicon esculentum Mill.) as affected by sugar and acid levels. Postharvest Biol. Technol. 6, 103-110.
MAUL, F., SARGENT, S.A., SIMS, C.A., BALDWIN, E.A., BALABAN, M.O. and HUBER,
D.J. 2000. Tomato flavor and aroma quality as affected by storage temperature. J. Food Sci. 65, 1228-1237.
PETRO-TURZA, M. 1987. Flavor of tomato and tomato products. Food Rev. Int. 2, 311-353. PLAEHN, D. and LUNDAHL, D.S. 2006. An L-PLS preference cluster analysis on French
consumer hedonics to fresh tomatoes. Food Qual. Pref. 17, 243-256. RATANACHINAKORN, B., KLIEBER, A. and SIMONS, D.H. 1997. Effect of short-term
controlled atmospheres and maturity on ripening and eating quality of tomatoes. Postharvest Biol. Technol. 11, 149-154.
RESURRECCION, A.V.A. and SHEWFELT, R.L. 1985. Relationship between sensory
attributes and objective measurements of postharvest quality of tomatoes. J. Food Sci. 50, 1242-1245.
RÉTIVEAU, A., CHAMBERS, D.H. and ESTEVE, E. 2005. Developing a lexicon for the flavor
description of French cheeses. Food Qual. Pref. 16, 517-527. RODRÍGUEZ, A., LOPEZ, J., GONZALEZ, C., DE LA TORRE, R. and MANGUT, V. 2001.
Sensory Evaluation of canned diced tomato varieties. Proc. 7th Int. Symp. On Processing Tomato. Acta Hort 542, ISHS 2001. pp. 269-275.
SERRANO-MEGÍAS, M. and LÓPEZ-NICOLÁS, J.M. 2006. Application of agglomerative
hierarchical clustering to identify consumer tomato preferences: influence of physicochemical and sensory characteristics on consumer response. J. Sci. Food Agri. 86, 493-499.
SINESIO, F., DI NATALE, C., QUAGLIA, G.B., BUCARELLI, F.M., MONETA, E.,
MACAGNANO, A., PAOLESSE, R. and D’AMICO, A. 2000. Use of electronic nose and trained sensory panel in the evaluation of tomato quality. J. Sci. Food Agric. 80, 63-71.
STEVENS, M.A., KADER, A.A., ALBRIGHT-HOLTON, M. and ALGAZI, M. 1977.
Genotypic variation for flavor and composition in fresh market tomatoes. J. Am. Soc. Hortic. Sci. 102, 680-689.
STEVENS, M.A., KADER, A.A. and ALBRIGHT-HOLTON, M. 1979. Potential for increasing
tomato flavor via increased sugar and acid content. J. Am. Soc. Hortic. Sci. 104, 40–42.

96
TANDON, K.S., BALDWIN, E.A., SCOTT, J.W. and SHEWFELT, R.L. 2003. Linking sensory descriptors to volatile and nonvolatile components of fresh tomato flavor. J. Food Sci. 68, 2366-2371.
THYBO, A.K., BECHMANN, I. and BRANDT, K. 2005. Integration of sensory and objective
measurements of tomato quality: quantitative assessment of the effect of harvest date as compared with growth medium (soil versus rockwool), electrical conductivity, variety and maturity. J. Sci. Food Agric. 85, 2289–2296.
VARA-UBOL, S., CHAMBERS, E. IV. and CHAMBERS, D.H. 2004. Sensory characteristics
of chemical compounds potentially associated with beany aroma in foods. J. Sens. Stud. 19, 15-26
VARA-UBOL, S., CHAMBERS, E. IV., KONGPENSOOK, V., OUPADISSAKOON, C.,
YENKET, R. and RÉTIVEAU, A. 2006. Determination of the sensory characteristics of rose apples cultivated in Thailand. J. Food Sci. 71, 547-552.
WATADA, A.E. and AULENBACH, B.B., 1979. Chemical and sensory qualities of fresh
market tomatoes. J. Food Sci. 44, 1013–1016. YILMAZ, E. 2001. The chemistry of fresh tomato flavour. Turk. J. Agric. Forest. 25, 149-155.

97
CHAPTER 6 - Detailed Materials and Methods to Sensory
Characteristics of Fresh Tomatoes and the Impact of Processing on
the Sensory Characteristics of Tomatoes

98
The objectives of this study were (1) to determine differences in the flavor characteristics
of five varieties of fresh tomatoes representing home-style, commercial, and heirloom tomatoes
and (2) to determine the effects of processing on flavor of those tomato varieties.
Plant Materials Five tomato varieties were selected for the study. These included Florida 91, Jet Star,
Brandywine, Red Agate, and Juliet. These varieties were used to represent round and plum type
fresh market tomatoes as well as processing tomatoes. Florida 91 and Jet Star were selected
because they are round large-fruited fresh tomatoes that can be found more commonly in grocery
stores. Brandywine, an heirloom cultivar, was selected to represent fresh market tomato that has
been known as one of the good-tasting tomatoes. Red Agate was selected to represent a plum-
shape processing tomato, and Juliet was selected to represent a plum-type fresh market tomato.
Juliet is commonly sold and used as a salad tomato.
Tomato seeds were purchased from commercial seed providers. The seed providers are
listed in Table 6.1. The seeds were planted using standard potting media in the greenhouse
facility at the department of Horticulture, Kansas State University (Manhattan, KS). The tomato
transplants that were dark green with sturdy stems were selected for field planting. The
transplanting occurred 25 days after planting the seeds. Tomatoes were grown on a Kennebec
silt loam soil in a high-tunnel at the Kansas State University Horticulture Research and
Extension Center, Olathe, KS. On April 21, 2006 transplants were planted in the high tunnel in
4-plant plots on 0.5 m-wide beds covered with black plastic mulch underlain with buried drip
tape for irrigation. Plants were spaced 0.6 m apart within the row, and the entire trial was
planted on two rows 1.2 m apart. The trial was laid out as randomized complete block trial with
four replications, two of the blocks being assigned to each row. The plotting design is illustrated
in Figure C.1.
Preplant soil analysis indicated a pH of 6.3, phosphorous (Mehlich 3-P) of 109 ppm,
potassium 258 ppm, and nitrate-nitrogen of 21.9 ppm. There was no preplant application of
fertilizer. Starting 4 weeks after transplanting, the trial was fertigated weekly with calcium
nitrate at a rate of 3.4 kg N/ha. Fruit worms were controlled through applications of spinosad.

99
Table 6.1 Description of Tomato Varieties Selected for the Study
Variety Fruit Shape Use Days to Maturity
Source
Brandywine Round “heirloom” line, Fresh market
80 days Park Seed (Greenwood, SC., www.parkseed.com)
Florida 91 Round Newer line, Fresh market
80 days Morgan County Seeds (Barnett, MO., www.morgancountyseeds.com)
Jet Star Round Newer line, Fresh market
72 days Park Seed (Greenwood, SC., www.parkseed.com)
Juliet Plum - small Fresh market (Salad)
60 days Johnny’s Selected Seeds (Winslow, ME., www.johnnyseeds.com)
Red Agate Plum - large Processing (Paste) 78 days Johnny’s Selected Seeds (Winslow, ME., www.johnnyseeds.com)
Plants were supported during growth with cages made from concrete reinforcing wire
with large spaces into a cylinder of about 18-20 inches in diameter. Two cages, 2.5 feet in
height, were stacked for caging each tomato plant. Weeding was done every 2 weeks.
Harvesting began in the second week of July. Tomatoes were harvested 3 times: July 17, July 21
and July 28. At each time, light-red, red-ripe and red-soft tomatoes, based on visual
classification and description provided by USDA (1976), were harvested. The same variety of
tomatoes harvested from each plot was thoroughly mixed to create homogeneous samples.
Harvested fruits were transported from the field to the Sensory Analysis Center at Kansas State
University (Manhattan, KS) for storage. All fruits were stored on flat trays at room temperature
(~25°C).

100
Analytical Method
Sample Preparation
Tomato samples were stored at room temperature for approximately five days before any
analytical evaluations were conducted. Three to four red ripened fruits were randomly selected
for each of the varieties. The fruits were rinsed, and then chopped into small pieces. The
chopped tomatoes were then placed either on an aluminum foil tray for the dry matter testing or
into an electronic blender (Hamilton Beach® 14-speed, model 54250, Washington, NC 27889) to
extract tomato juice for other evaluations. Juice from each tomato sample was filtered through
cheese cloth to remove large particles and seeds. Twenty ml of juice was placed into a 250-mL
Erlenmeyer flask. Total soluble solids were measured directly from the juice. Fifty ml of
reverse osmosis, deionized, carbon-filtered water was added to each flask of sample for the
evaluation of pH, and titratable acidity (TA).
pH, Total Soluble Solids (ºBrix), Titratable Acidity (TA) and Dry Matter
content
Total soluble solid (TSS) of each sample was measured using a portable refractometer
(Fisher Scientific®, Catalog#13-946-24). The hand held refractometer is designed to measure the
refractive index of a sample solution. Calibration of the refractometer must be done prior to
measuring total soluble solid concentration in ºBrix value at room temperature (~ 25ºC). One
ºBrix is equivalent to approximately 1 gram of soluble solids per 100 grams of a sample solution.
ºBrix was measured immediately after extracting the juice from fresh tomato samples and prior
to packaging the juice and paste samples.
pH value of the samples was measured using a digital pH meter (Fisher Scientific®,
Accument Portable AP 63). Concentration of acids and some associated salts was determined
from pH value (Gould 1983). Tomatoes are considered a high acid food (Gould 1983) and citric
acid is the primary organic acid in tomato fruits (Yilmaz 2001). Before measuring the pH of
each sample, the pH probe was calibrated using buffers with pH of 4.0 and 7.0. The probe was
then rinsed thoroughly using double distilled water before submerging its tip into each tomato
sample. The probe was similarly rinsed between testing tomato samples. After placing the
probe in a sample, the meter is allowed to equilibrate before reading of pH of the sample.

101
Titratable acidity (TA) of tomato samples were done by titration of the tomato juice until
pH reached 8.2±0.1 using 1.0 N NaOH. 1% Phenolphthalein solution was also prepared as an
indicator. Three drops of phenolphathalein solution was placed into a sample flask. A pH meter
was used to determine the end point at approximately pH 8.1 – 8.3. The volume of 1.0 N NaOH
solution used for each titration was recorded. The percentage of citric acid was computed using
the following formula.
100×××
=Y
mEqwtNVZ (Gould, 1983)
where: Z = % of acid in sample
V = volume in ml of NaOH titrated
N = normality of NaOH (1.0 N)
nEqwt = milliequivalents of acid (0.064 for citric acid)
Y = volume in ml of sample
To determine dry matter content of tomato, four tomato fruits were randomly selected
from red-ripe fruits. Samples were chopped coarsely, and 200 g was placed into aluminum foil
dish. The weight of the dish and the samples were recorded. The samples were then placed into
a 105 ºC temperature-controlled oven (Fisher Scientific®, Isotemp Oven) for 48 hours. Samples
were removed from the oven and the final weights were recorded. The percentage of dry matter
was calculated. Dry matter analysis was done only on fresh tomatoes.
Processing of Tomato – Tomato Juice and Tomato Paste The impact of processing levels – lower processing for tomato juice and higher
processing for tomato paste, on the tomato sensory characteristics was investigated. Tomato
juice and paste identities and characteristics have been defined in the Code of Federal
Regulations (CFR), title 21, volume 2 – 21CFR156.145 for tomato juice and 21CFR155.191 for
tomato paste (FDA).

102
Approximately 2,000 grams of each variety of tomato were used to make tomato juice.
Pickling salt and lemon juice were added as minimal ingredients for juice seasoning. The
instructions for making tomato juice can be found in Appendix D. For tomato paste,
approximately 4,000 to 4,500 grams of tomato were used for the processing. Pickling salt was
added for minimal seasoning. The instructions for tomato paste making can be found in
Appendix E. Tomato juice and paste processing and canning techniques were modified from
Canning Tomatoes and Tomato Products (National Center for Home Food Preservation,
University of Georgia, www.uga.edu/nchfp). Pint-sized (~ 473 ml) mason glass jars (Golden
Harvest, Dyerburg, TN) were used for product containers. Tomato juice and paste were stored at
room temperature prior to any evaluations.
Panelists The six-member highly trained panelists from the Sensory Analysis Center, Kansas State
University (Manhattan, KS) participated in this study. The panelists had completed 120 hours of
training on general sensory analysis techniques. All panelists have a minimum of 1000 hours of
experience in testing a wide variety of food products including fresh tomatoes and tomato-based
products.
Descriptive Sensory Analysis
Sample Preparation
All tomato samples were served at room temperature. For fresh tomatoes, the fruits were
rinsed and cut into ½-in thick wedges and placed in odor-free, disposable 3.25 oz (~ 96 mL).
plastic cups (Sweetheart Cup Company INC., Owing Mills, MD) for the evaluation. Tomato
juice and paste were thoroughly stirred before placing into 3.25 oz. plastic cups with lids for the
evaluation. Samples were prepared approximately 30 min prior to the testing session. Each
panelist received approximately five pieces or 3 oz. (~ 88 mL). of samples for the evaluation.
Evaluation Procedure
Descriptive analysis was conducted using the same group of panel participating in the
previous study that developed the tomato lexicon (see Chapter 4). Prior to the evaluation, the
panel was allowed additional five orientation sessions, equivalent to 7.5 hours to further

103
familiarize themselves with the range of products they would be evaluated. An individual
balloting approach was used for the evaluation. Each fresh tomato sample was evaluated with
three times. Each time corresponded to the harvesting time (i.e. week 1, 2, 3). Factors included
in the study were tomato varieties (i.e. five for fresh tomato and tomato juice, and four for
tomato paste) and ripening stages (i.e. light-red, red-ripe, and red-soft). Fresh tomato samples
were evaluated approximately five days after harvesting. Tomato juice and paste were produced
three times according to the harvesting times for the processed tomato product evaluation.
Samples were evaluated during 15 1.5-hr sessions, in which 5-6 samples were presented per
session. All samples were coded with 3-digit random numbers. The order of product evaluation
was randomized within each harvesting time and each product category (i.e. fresh, tomato juice
and tomato paste). Sensory attributes used for the evaluation were obtained from the tomato
lexicon established in Chapter 5. Panelists evaluated the intensity of each sensory attributes
individually using a 15-point numerical scale, with increments of 0.5, where 0 represents none
and 15 represents extremely strong. Reverse osmosis, deionized, carbon-filtered water and
unsalted cracker (Nabisco Premium Saltine Unsalted Top Crackers, 8 oz, East Hanover, NJ)
were provided to cleanse palate between samples during testing.
Data Analysis All data were entered into Microsoft Excel spreadsheet. All data were analyzed using
SAS® System for Windows V. 9, 2006, (SAS Institute, Cary, NC). Significant differences were
determined at p-value ≤ 0.05. Analysis of variance (MIXED procedure, Appendix H for fresh
tomatoes and Appendix I for juice and paste) was constructed for determining the differences in
the samples. The analysis of variance for fresh tomato data were done separately from those for
tomato juice and paste samples. Factors included in the study were tomato varieties (i.e. five for
fresh tomato and tomato juice, and four for tomato paste), ripening stages (i.e. light-red, red-ripe,
and red-soft), and harvesting times (i.e. week 1, 2, 3).
Principal components analysis (PCA) was also constructed using the covariance matrix
(SYSTAT®, Version 10.2, 2006, Systat Software, Inc., San Jose, CA). PCA categorized
attributes into a number of new uncorrelated variables (principal components) that were made up
of the original sensory attributes. Cluster analysis (Ward’s method) was performed to allow
grouping the samples based on their similarities.

104
References NATIONAL CENTER FOR HOME FOOD PRESERVATION. Canning Tomatoes and Tomato
Products. University of Georgia. www.uga.edu/nchfp. GOULD, W.A. 1983. Total Acidity and pH. In Tomato Production, Processing and Quality
Evaluation. AVI Publishing Company, INC, Westport, CT. pp. 269. UNITED STATES DEPARTMENT OF AGRICULTURE. 1976. United States standards for
grade of fresh tomatoes. US Dept. Agric., Mktg., Serv., Washington DC. pp. 10. FOOD AND DRUG ADMINISTRATION. www.fda.gov YILMAZ, E. 2001. The chemistry of fresh tomato flavour. Turk. J. Agric. Forest. 25, 149-155.

105
CHAPTER 7 - Sensory Characteristics of Fresh Tomatoes and the
Impact of Processing on the Sensory Characteristics of Tomatoes

106
Abstract Vine-ripened fresh tomatoes are believed to have better flavor than those harvested at the
mature green stage and ripened artificially. However, tomato cultivars and various growing
conditions impact the flavor characteristics of fresh market tomatoes considerably. When
creating new tomato cultivars, breeders often have focused more on providing higher yields and
more resistance to diseases and postharvest conditions than on the sensory quality of the fruit.
The current research examined the sensory characteristics of various fresh tomatoes and the
effect that processing of those tomatoes has on sensory properties. The research included newer
and older cultivars to better understand their sensory properties. The effect of various ripening
stages also was investigated. Fresh tomatoes and processed tomatoes (juice and paste) were
produced and examined by descriptive sensory evaluation. The sensory properties of the tomato
varieties and properties of fresh versus processed tomatoes were compared. Results showed
significant differences in many sensory characteristics among the fresh tomatoes as a result of
cultivar and ripening stages. The sensory characteristics of fresh and processed products were
considerably different, but with lower heat processing such as that for making tomato juice,
several key sensory attributes were intensified. In general, flavor differences among cultivars
tended to disappear after processing, especially high levels of processing such as those found in
tomato paste, but texture differences were prominent among cultivars when processed into
tomato juice and paste.

107
Introduction In the past 30 years, fresh tomatoes available commercially have been criticized as
lacking flavorful characteristics (Watada and Aulenbach 1979, Hobson 1988, Bruhn and others
1991, Maul and others 2000, Yilmaz 2001, Batu 2004, Krumbein and others 2004, Serrano-
Megías and López-Nicolás 2006). Kader and others (1977) reported that the lack of desirable
flavor in tomatoes is partly caused by harvesting tomatoes at the mature green stage. In addition,
various studies indicated that postharvest storage treatments can negatively affect the flavor
properties of fresh market tomatoes (Kader and others 1978, Hobson 1988, Ho 1996, Maul and
others 2000). It has been recommended (e.g. Kader and others 1978) that fresh market tomatoes
should be harvested at the vine-ripened stage to maintain the flavor integrity. However, the
shelf-life of those vine-ripened tomatoes is shortened significantly.
Tomato researchers often focus on development of tomato cultivars that provide higher
yield, longer shelf-life, and more resistance to diseases, and may overlook flavor quality aspects.
An economic issue of harvesting fresh tomatoes at a riper maturity is the susceptibility of the
tomatoes to degradation during transportation and a shorter shelf-life. However, advantages of
harvesting vine-ripened fresh tomatoes include the demand of higher flavor quality (Auerswald
and others 1999).
Descriptive sensory analysis can be used to evaluate the quality of tomatoes and has been
used successfully to describe the sensory properties of various food products. Many previous
studies on tomatoes concentrated on examining changes in compositional quality (e.g. sugars,
acid contents, and volatile compounds) as affected by various postharvest treatments (e.g.
Ratanachinakorn and others 1997, Boukobza and Taylor 2002, Ketelaere and others 2004,
Krumbein and others 2004, Lana and others 2005). Research also has been conducted to
determine the relationship between instrumental and sensory data or consumer acceptance
information (Lee and others 1999, Berna and others 2005).
Although published data reported some sensory characteristics of fresh tomatoes,
minimal work has been done to understand differences in sensory characteristics of fresh tomato
cultivars (e.g. Causse and others 2003) and we found no work that tracked sensory properties
from the fresh tomato to processed tomato products. Thus, the objectives of this study were to

108
(1) determine the sensory characteristics of five varieties of fresh tomatoes, and (2) determine the
impact processing level has on the sensory quality of tomatoes.
Materials and Methods
Tomatoes
Five tomato cultivars (Lycopersicon esculentum Mill.) – Florida 1 (large, globe-shape
fruit), Red Agate (large, plum-shape fruit; processing tomato), Brandywine (large globe-shape
fruit; heirloom with a reputation for good taste), Juliet (small, plum-shape fruit), and Jet Star
(large, globe-shape fruit) were used in this study. Tomatoes were grown on a Kennebec silt loam
soil in a high-tunnel at the Kansas State University Horticulture Research and Extension Center,
Olathe, KS. Seedlings were grown from seeds in standard potting media in the greenhouse at
Manhattan, Kansas, and were transplanted to the high tunnel 25 days after seeding. On April 21,
2007, transplants were planted in the high tunnel in 4-plant plots on 0.5 m-wide beds covered
with black plastic mulch underlain with buried drip tape for irrigation. Plants were spaced 0.6 m
apart within the row, and the entire trial was planted on two rows 1.2 m apart. The trial was laid
out as randomized complete block trial with four replications, two of the blocks being assigned
to each row. Plants were supported during growth with cages made from concrete reinforcing
wire.
Preplant soil analysis indicated a pH of 6.3, phosphorous (Mehlich 3-P) of 109 ppm,
potassium 258 ppm, and nitrate-nitrogen of 21.9 ppm. There was no preplant application of
fertilizer. Starting 4 weeks after transplanting, the trial was fertigated weekly with calcium
nitrate at a rate of 3.4 kg N/ha. Fruit worms were controlled through applications of spinosad.
Postharvest Treatments
Fruit were harvested 3 times, July 17, July 21, and July 28. At each harvesting time,
light-red, red-ripe, and red-soft tomatoes were harvested based on visual classification and
description (USDA 1976). The fruits of each cultivar harvested from each plot were thoroughly
mixed to create a homogeneous sample for each of the ripening stages. All fruit were stored on
flat trays at room temperature approximately five days prior to any evaluations.
109
Preparation of Tomato Juice and Paste
To determine the impact of processing level on the sensory characteristics of tomatoes,
tomato juice was selected to represent a low processing level and tomato paste was selected to
represent a high processing level. Tomato juice was produced from all five tomato cultivars;
however, tomato paste samples were produced using only four cultivars. Brandywine was not
made into paste because sample quantity was too low; this cultivar often gives low yields.
Tomato juice and paste processing and canning techniques were modified from Canning
Tomatoes and Tomato Products (National Center for Home Food Preservation, University of
Georgia, www.uga.edu/nchfp). Products were canned in pint-sized mason glass jars (Golden
Harvest, Dyerburg, TN) and stored at room temperature prior to any evaluations. The product
identities were in compliance with the Code of Federal Regulations (CFR), title 21, volume 2,
21CFR156.145 for tomato juice, and 21CFR155.191 for tomato paste (www.fda.gov). Pickling
salt and lemon juice were added to tomato juice samples; only salt was added to tomato paste.
Compositional Analyses
Tomato fruit from each cultivar were subject to compositional analyses including
titratable acidity (TA), pH, total soluble solids (TSS), and dry matter. Only red-ripened fruit
were randomly selected for each of the cultivars. The fruit were rinsed, and then chopped into
small pieces. The chopped tomatoes were divided and placed either on an aluminum foil tray for
dry matter evaluation or into an electronic blender (Hamilton Beach® 14-speed, model 54250,
Washington, NC) to extract tomato juice for other evaluations. Juice from each tomato sample
was filtered through cheese cloth to remove large particles and seeds. TA of the fruit was
determined by potentiometric titration with 1.0 N NaOH; pH measured by a digital pH meter
(Fisher Scientific®, Accument Portable AP 63); TSS measured by a portable refractometer
(Fisher Scientific®, Catalog#13-946-24); and dry matter by placing 200 g of fresh chopped
tomato into a 105 ºC temperature-controlled oven (Fisher Scientific®, Isotemp Oven) for 48
hours and obtaining weight after drying. Only the TSS content was measured in tomato juice
and paste to ensure that they meet the CFR specifications. All tomato paste samples were
measured to have at least 24% soluble solid content.

110
Descriptive Sensory Analysis
The descriptive sensory analysis for all fresh and processed tomatoes (i.e. juice and paste)
was conducted at the Sensory Analysis Center at Kansas State University. The evaluation
facility has controlled temperature, lighting, and humidity and is quiet.
Six highly trained panelists participated in the complete study. The panelists had
completed 120 hours of general sensory descriptive analysis training with a wide variety of food
products. They all have more than 1,000 hours of testing experience with a variety of food
products including tomatoes and tomato-based products. Prior to the evaluation, five additional
orientation sessions of 1.5 hr were conducted over five days. During the orientation sessions,
sensory attributes and appropriate reference standards established previously by the same panel
were provided to the panel to help further familiarize them with all attributes. The panel was
given a variety of fresh tomatoes and tomato products during the orientation with which they
practiced the evaluation procedure for each sensory attribute. Five aroma attributes, ten texture
attributes, and 18 flavor attributes, including six taste and mouthfeeling attributes were
evaluated.
All tomato samples were served and evaluated at room temperature. For fresh tomatoes,
the fruits were rinsed and cut into ½-in (1.27 cm) thick wedges and placed in odor-free,
disposable 3.25 oz. (~ 96 mL) plastic cups (Sweetheart Cup Company Inc., Owing Mills, MD).
Tomato juice and paste were thoroughly stirred before placing into 3.25 oz. (~ 96 mL) plastic
cups with lids. Samples were prepared approximately 30 min to 1 hr prior to the testing sessions.
All samples were coded with 3-digit random numbers.
The evaluation was done using a 15-point numerical scale with 0.5 increments. An
individual balloting approach was used for the evaluation. Samples were evaluated during 15
1.5-hr sessions, in which 5-6 samples were evaluated per session. Each panelist received
approximately 5 pieces of fresh tomatoes or 3 oz. (88 mL) of processed tomatoes for the
evaluation. Each tomato sample was evaluated at three harvesting times and the order of product
evaluation was randomized within each harvesting time and product category (i.e. fresh, juice
and paste). Reverse osmosis, deionized, carbon-filtered water and unsalted crackers (Nabisco
Premium Saltine Unsalted Top Crackers, 8 oz, East Hanover, NJ) were provided to cleanse
palate between samples during testing.

111
Statistical Analysis
Analysis of variance (PROC MIXED procedure) was conducted to determine differences
in the samples using the SAS® System for Windows (Version 9, 2006, The SAS Institute, Cary,
NC). Significant differences were determined at p-value ≤ 0.05. The analysis of variance for
fresh tomato data were done separately from that of tomato juice and paste samples. Factors
included the study were tomato varieties (i.e. five for fresh tomato and tomato juice, and four for
tomato paste), three ripening stages, three harvesting times, and appropriate interactions.
Principal components analysis (PCA) was also conducted using the covariance matrix
(SYSTAT®, Version 10.2, 2006, Systat Software, Inc., San Jose, CA). PCA categorized
attributes into a number of new uncorrelated variables (principal components) that were made up
of the original sensory attributes. The mean values for each sensory attribute for each fresh
tomato (i.e. 5 cultivars x 3 ripening stages) were used to calculate and obtain PCA maps. A
hierarchical cluster analysis with Ward’s method (SYSTAT®, Version 10.2) was additionally
conducted on all sensory attributes to allow grouping of those tomato samples based on their
similarities.
Results and Discussions
Compositional Analyses
In fresh tomatoes harvested at the red ripe stage, pH, % TA, TSS (°Brix), and % dry
matter components were significantly (P<0.05) different (Table 7.1). Red Agate had the lowest
content of TA, TSS and dry matter, but the highest pH compared to other cultivars studied. pH
appeared to have an inverse correlation with TA and TSS results. These results were similar to
results found in Garcia and Barrett (2006), who indicated that in many cases pH and TA have a
negative relationship. Malundo and others (1995), however, showed that pH and TA had a
positive correlation. Because TA was calculated based only on the major acid in the fruit, it is
possible to find a positive relationship between pH and TA. Malic acid, other major acid in
tomato, was not accounted for in the calculation of TA. This may explain the results for Jet Star
tomatoes in week three, where pH and TA seemed to have a positive relationship.
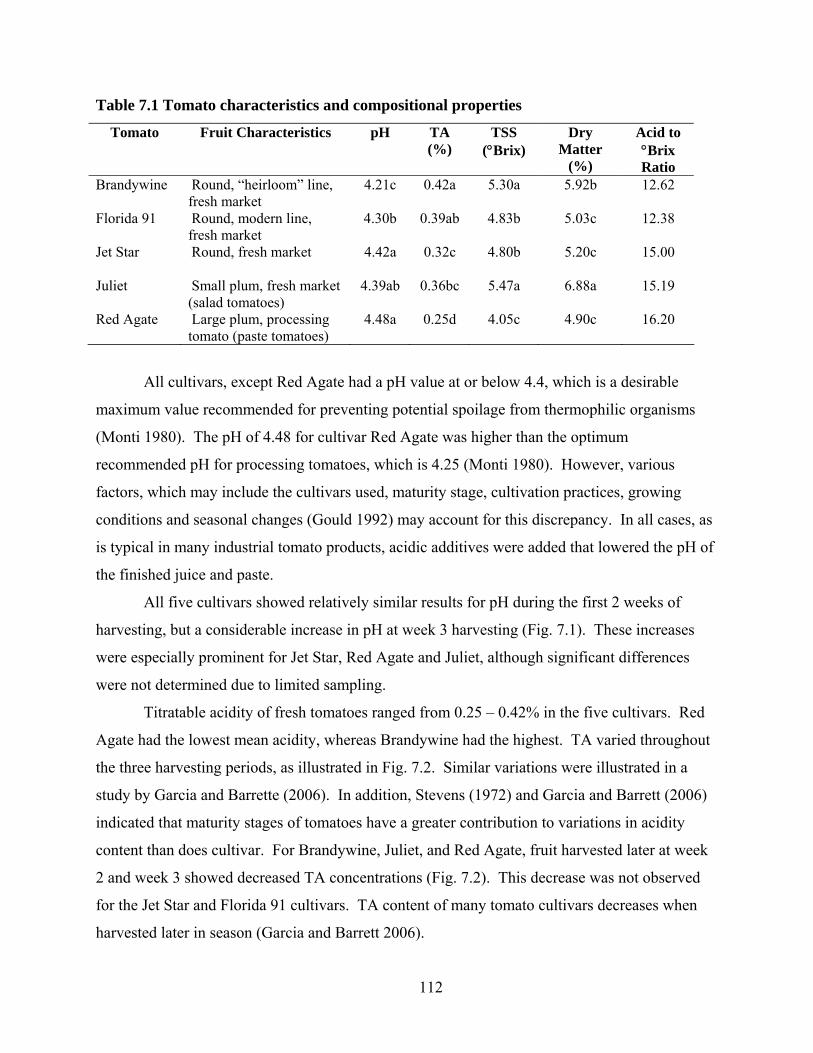
112
Table 7.1 Tomato characteristics and compositional properties
Tomato Fruit Characteristics pH TA (%)
TSS (°Brix)
Dry Matter
(%)
Acid to °Brix Ratio
Brandywine Round, “heirloom” line, fresh market
4.21c 0.42a 5.30a 5.92b 12.62
Florida 91 Round, modern line, fresh market
4.30b 0.39ab 4.83b 5.03c 12.38
Jet Star
Round, fresh market 4.42a 0.32c 4.80b 5.20c 15.00
Juliet Small plum, fresh market (salad tomatoes)
4.39ab 0.36bc 5.47a 6.88a 15.19
Red Agate Large plum, processing tomato (paste tomatoes)
4.48a 0.25d 4.05c 4.90c 16.20
All cultivars, except Red Agate had a pH value at or below 4.4, which is a desirable
maximum value recommended for preventing potential spoilage from thermophilic organisms
(Monti 1980). The pH of 4.48 for cultivar Red Agate was higher than the optimum
recommended pH for processing tomatoes, which is 4.25 (Monti 1980). However, various
factors, which may include the cultivars used, maturity stage, cultivation practices, growing
conditions and seasonal changes (Gould 1992) may account for this discrepancy. In all cases, as
is typical in many industrial tomato products, acidic additives were added that lowered the pH of
the finished juice and paste.
All five cultivars showed relatively similar results for pH during the first 2 weeks of
harvesting, but a considerable increase in pH at week 3 harvesting (Fig. 7.1). These increases
were especially prominent for Jet Star, Red Agate and Juliet, although significant differences
were not determined due to limited sampling.
Titratable acidity of fresh tomatoes ranged from 0.25 – 0.42% in the five cultivars. Red
Agate had the lowest mean acidity, whereas Brandywine had the highest. TA varied throughout
the three harvesting periods, as illustrated in Fig. 7.2. Similar variations were illustrated in a
study by Garcia and Barrette (2006). In addition, Stevens (1972) and Garcia and Barrett (2006)
indicated that maturity stages of tomatoes have a greater contribution to variations in acidity
content than does cultivar. For Brandywine, Juliet, and Red Agate, fruit harvested later at week
2 and week 3 showed decreased TA concentrations (Fig. 7.2). This decrease was not observed
for the Jet Star and Florida 91 cultivars. TA content of many tomato cultivars decreases when
harvested later in season (Garcia and Barrett 2006).

113
Figure 7.1 pH of fresh tomatoes by harvesting times
3.8
4.0
4.2
4.4
4.6
4.8
Brandywine Florida 91 Jet Star Juliet Red Agate
pH
week 1 week 2 week 3
Figure 7.2 Titratable acidity of fresh tomatoes by harvesting times
0.0
0.1
0.2
0.3
0.4
0.5
0.6
Brandywine Florida 91 Jet Star Juliet Red Agate
Titr
atab
le A
cidi
ty (%
)
week 1 week 2 week 3

114
Figure 7.3 Total soluble solids of fresh tomatoes by harvesting times
3.0
4.0
5.0
6.0
7.0
Brandywine Florida 91 Jet Star Juliet Red Agate
Tota
l Sol
uble
Sol
ids
(oB
rix)
week 1 week 2 week 3
TSS (ºBrix) content for fresh tomatoes was highest in Juliet and Brandywine. The Red
Agate cultivar had the lowest ºBrix value of 4.05%. For common processing tomatoes, TSS
content ranges approximately from 4.50 to 6.25% (Garcia and Barrett 2006). Picha (1986)
indicated that vine-ripened cherry tomatoes have higher soluble solid content, which may explain
why Juliet, a small fruited tomato cultivar exhibited the highest mean soluble solids. This also
may suggest that small fruited cultivars have higher soluble solid content, but definite conclusion
cannot be drawn because only one small fruited cultivar was included in the current study. TSS
content of all cultivars decreased with harvesting period (Fig. 7.3). For all cultivars, except Red
Agate, soluble solid concentrations decreased up to 22% at week three harvesting.
Significant differences in genetic variation also were found for dry matter analysis. Juliet
had the highest dry matter content, followed by Brandywine; the cultivars Florida 91, Jet Star
and Red Agate showed the lowest dry matter content.
Acid to ºBrix ratio was calculated for each tomato cultivar, but significant differences
were not determined. The acid to ºBrix ratio is used commonly to help determine the maturity
and quality of fruits. The range of acid to ºBrix ratio from approximately 12-15, suggesting
minimal differences in the maturity of the cultivars. Fruit that have high acid and soluble solid

115
content would have better flavor, whereas those with low acid and high soluble solids would be
bland, and high acid and low soluble solids would be tart (Saltveit 2005).
TSS content of the final processed tomato products is illustrated in Table 7.2. The results
showed that there were no significant differences in the soluble solids among the juice and paste
samples produced. Other compositional data were not collected for the processed tomato
products.
Table 7.2 Total soluble solids measured in tomato juice and paste
Cultivar Juice Paste
Brandywine 6.63 -
Florida 91 7.00 25.90
Jet Star 6.90 28.67
Juliet 7.50 28.27
Red Agate 5.90 26.17
Sensory Characteristics of Fresh Tomatoes
The main factors investigated including tomato cultivar, ripening stages and harvesting
times produced significant effects (P<0.05) for many sensory attributes (Table 7.3), although
harvesting time appeared less significant. Auerswald and others (1999) and Johansson and
others (1999) reported that variety was more influential on the sensory characteristics than other
growing condition factors. The differences among fresh tomato characteristics are illustrated in
Table 7.4. On average, tomato ID, green-viney, ripeness, fruity, sweet and umami attributes
were higher in fresh market tomatoes Brandywine and Florida 91. Brandywine is an older
‘heirloom’ cultivar known for its good flavor and Florida 91 is a newer cultivar developed
specifically for the fresh market. Red Agate, a processing tomato, showed the lowest intensity of
those characterizing tomato attributes. For texture, as expected, all four fresh market tomatoes
were less firm, less mealy and more juicy than the processing tomato cultivar.

116
Table 7.3 Significant differences in the sensory characteristics of fresh tomatoes
Attributes Tomato
Cultivars (C) Stages (S)
Harvesting Times/
Replication (T) C × S
Aroma
Tomato ID < 0.001 < 0.001 ns ns
Green-Viney 0.011 < 0.001 < 0.001 < 0.001
Decaying Vegetation 0.001 0.018 ns 0.001
Cardboard 0.034 0.002 ns < 0.001
Texture
Firmness < 0.001 < 0.001 < 0.001 < 0.001
Juiciness < 0.001 < 0.001 0.001 < 0.001
Mealy < 0.001 < 0.001 ns ns
Skin Awareness < 0.001 < 0.001 < 0.001 < 0.001
Seed Awareness ns 0.010 0.030 ns
Fiber Awareness 0.016 < 0.001 ns 0.015
Flavor
Tomato ID < 0.001 < 0.001 0.008 < 0.001
Ripeness < 0.001 < 0.001 0.006 < 0.001
Green-Viney < 0.001 < 0.001 ns < 0.001
Umami < 0.001 < 0.001 ns ns
Fruity < 0.001 < 0.001 < 0.001 ns
Cardboard < 0.001 < 0.001 ns < 0.001
Fermented < 0.001 0.006 ns 0.006
Musty/Earthy ns ns 0.003 0.006
Sweet < 0.001 < 0.001 0.018 ns
Sour 0.021 0.006 ns ns
Salty ns ns 0.040 < 0.001
Bitter < 0.001 < 0.001 < 0.001 < 0.001
Metallic ns ns ns ns
Astringent ns ns ns 0.040

117
Table 7.4 Significant differences in the sensory characteristics of fresh tomatoes by cultivars
Brandywine Florida 91 Jet Star Juliet Red Agate
Aroma
Tomato ID 7.95 a 7.86 a 7.60 b 7.56 b 7.40 b
Green-Viney 4.54 ab 4.67 a 4.20 b 4.42 b 4.27 b
Decaying Vegetation 0.21 ab 0.02 b 0.25 a 0.10 b 0.00 b
Cardboard 0.83 b 0.97 ab 1.13 a 1.09 a 1.03 a
Texture
Firmness 3.63 c 4.69 b 3.62 c 5.32 a 5.14 a
Juiciness 9.83 a 9.62 a 9.43 b 8.52 c 8.17 c
Mealy 1.40 b 1.61 b 1.38 bc 1.22 c 2.11 a
Skin Awareness 10.42 b 10.04 c 9.11 d 10.84 a 10.55 b
Seed Awareness 1.94 2.06 2.01 2.10 2.05
Fiber Awareness 1.78 1.83 1.74 1.85 2.13
Flavor
Tomato ID 9.31 a 8.88 b 9.50 a 8.65 b 7.86 c
Ripeness 9.76 a 8.74 c 9.47 b 8.67 c 7.88 d
Green-Viney 3.78 c 4.46 a 3.42 d 4.07 bc 4.29 ab
Umami 1.19 ab 1.13 b 1.76 a 0.87 b 0.59 c
Fruity 2.70 ab 2.50 b 2.88 a 2.41 b 1.93 c
Cardboard 0.82 b 1.21 a 0.63 b 1.25 a 1.47 a
Fermented 0.29 a 0.04 b 0.27 a 0.09 b 0.00 b
Musty/Earthy 1.72 1.70 1.79 1.68 1.61
Sweet 2.49 ab 2.42 b 2.63 a 2.42 b 2.09 c
Sour 0.94 ab 0.89 b 1.11 a 0.95 ab 0.74 b
Salty 3.29 3.15 3.05 3.10 3.07
Bitter 1.16 b 1.09 bc 1.53 a 1.08 bc 1.01 c
Metallic 2.25 2.31 2.19 2.33 2.39
Astringent 0.13 0.11 0.13 0.10 0.12
a, b, c, d – Means with the same letter within a row are not significantly different at the 95% confidence level

118
Harvesting fresh tomatoes at different ripening stages (light-red, red-ripe, and red-soft)
resulted in significant changes for all attributes evaluated, except musty/earthy, salty, metallic,
and astringency (Table 7.3). Tomatoes harvested at different stages have been shown previously
to differ significantly in flavor characteristics (Watada and Aulenbach 1979, Paull 1999, Causse
and others 2003). Watada and Aulenbach (1979) found a significant impact of harvesting stage
on several attributes including sweet, salty, and fruity-floral attributes. We also found that
green-viney and bitter attributes were significantly different between different ripening stages.
Because there was an interaction of variety and stage of ripeness for many tomato
sensory attributes, Tables 7.5 to 7.9 illustrate the trend of each attribute evaluation due to
ripening stages for each tomato cultivar. It is important to note that the interaction effect often is
the result of the degree of change noted in varieties for various ripeness levels and not a
difference in the direction of change in a sensory attribute. The data showed that some attributes
increased as fruit was allowed to ripen longer on vines, while some other attributes decreased
significantly. For all five tomato cultivars, tomato ID (both aroma and flavor), ripeness,
sweetness and juiciness increased when the fruit were allowed to ripen longer on vines. The
increase of those characteristics was minimal for Red Agate compared to others. On the other
hand, green-viney (both aroma and flavor) and firmness decreased with increased maturity, as
expected. The firmness of Red Agate, the processing tomato in this study, seemed to decrease
only slightly at riper stage, whereas a considerable decrease was observed in both Jet Star and
Florida 91. The decrease in firmness is one of the critical issues related to limited shelf-life of
vine-ripened fresh tomatoes (Auerswald and others 1999). Juiciness increased with maturity for
all tomato cultivars, except Jet Star, which increased up to the red-ripe stage and then decreased
significantly. Although cultivar differences certainly can be expected, some variation in data
may be from the visual selection process used to determine stage of ripeness. One pattern that
was noted is that textural changes were slight for Red Agate, a processing tomato, and were
larger for fresh market tomatoes. Other attributes exhibited low intensity, but no specific pattern
of change could be determined.
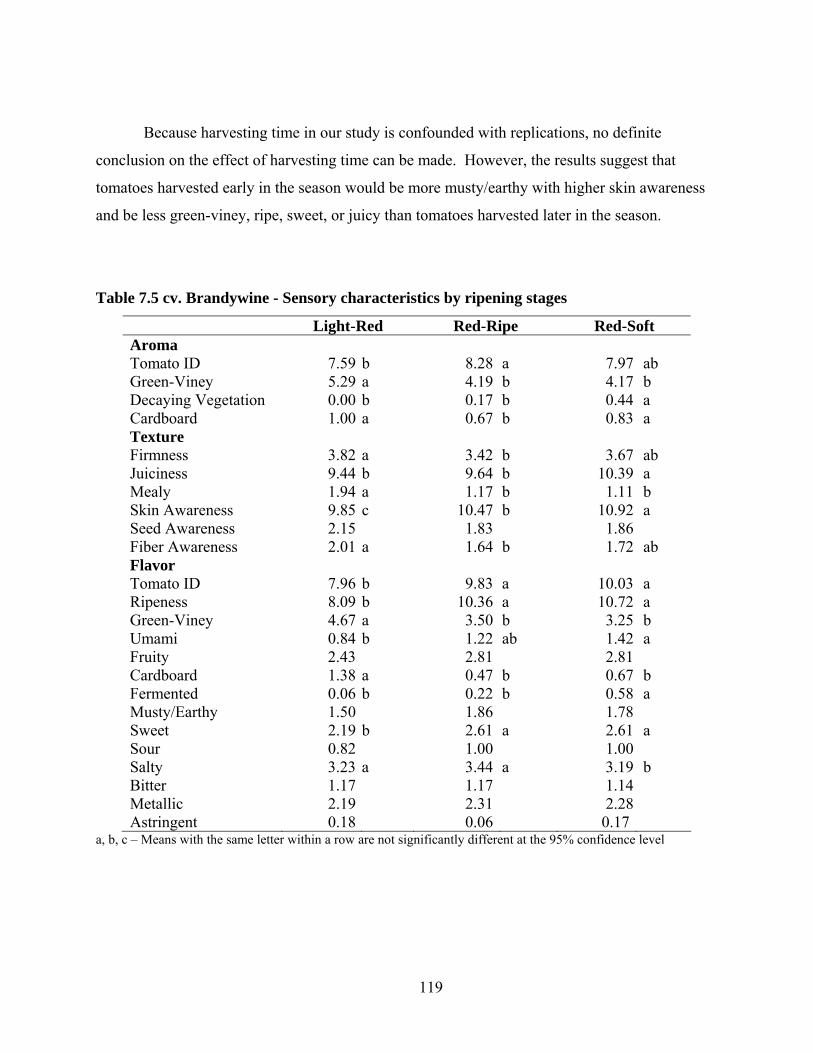
119
Because harvesting time in our study is confounded with replications, no definite
conclusion on the effect of harvesting time can be made. However, the results suggest that
tomatoes harvested early in the season would be more musty/earthy with higher skin awareness
and be less green-viney, ripe, sweet, or juicy than tomatoes harvested later in the season.
Table 7.5 cv. Brandywine - Sensory characteristics by ripening stages
Light-Red Red-Ripe Red-Soft Aroma Tomato ID 7.59 b 8.28 a 7.97 ab Green-Viney 5.29 a 4.19 b 4.17 b Decaying Vegetation 0.00 b 0.17 b 0.44 a Cardboard 1.00 a 0.67 b 0.83 a Texture Firmness 3.82 a 3.42 b 3.67 ab Juiciness 9.44 b 9.64 b 10.39 a Mealy 1.94 a 1.17 b 1.11 b Skin Awareness 9.85 c 10.47 b 10.92 a Seed Awareness 2.15 1.83 1.86 Fiber Awareness 2.01 a 1.64 b 1.72 ab Flavor Tomato ID 7.96 b 9.83 a 10.03 a Ripeness 8.09 b 10.36 a 10.72 a Green-Viney 4.67 a 3.50 b 3.25 b Umami 0.84 b 1.22 ab 1.42 a Fruity 2.43 2.81 2.81 Cardboard 1.38 a 0.47 b 0.67 b Fermented 0.06 b 0.22 b 0.58 a Musty/Earthy 1.50 1.86 1.78 Sweet 2.19 b 2.61 a 2.61 a Sour 0.82 1.00 1.00 Salty 3.23 a 3.44 a 3.19 b Bitter 1.17 1.17 1.14 Metallic 2.19 2.31 2.28 Astringent 0.18 0.06 0.17
a, b, c – Means with the same letter within a row are not significantly different at the 95% confidence level

120
Table 7.6 cv. Florida 91 - Sensory characteristics by ripening stages
Light-Red Red-Ripe Red-Soft
Aroma
Tomato ID 7.71 7.86 8.00
Green-Viney 5.26 a 4.42 b 4.35 b
Decaying Vegetation 0.00 0.06 0.00
Cardboard 1.18 a 0.97 ab 0.76 b
Texture
Firmness 5.62 a 4.58 b 3.88 c
Juiciness 8.74 b 9.89 a 10.21 a
Mealy 1.97 a 1.61 ab 1.24 b
Skin Awareness 9.13 c 10.64 a 10.22 b
Seed Awareness 2.03 2.25 1.88
Fiber Awareness 2.11 a 1.75 b 1.62 b
Flavor
Tomato ID 7.59 b 9.50 a 9.50 a
Ripeness 7.03 b 9.56 a 9.62 a
Green-Viney 5.47 a 4.17 b 3.74 c
Umami 0.56 c 1.17 b 1.62 a
Fruity 1.87 b 2.72 a 2.85 a
Cardboard 1.80 a 0.86 b 0.92 b
Fermented 0.00 0.06 0.06
Musty/Earthy 1.62 1.75 1.74
Sweet 1.88 b 2.67 a 2.66 a
Sour 0.65 b 1.03 a 1.03 a
Salty 3.17 3.19 3.03
Bitter 1.00 1.11 1.14
Metallic 2.43 2.36 2.17
Astringent 0.26 0.06 0.00 a, b, c – Means with the same letter within a row are not significantly different at the 95% confidence level

121
Table 7.7 cv. Jet Star - Sensory characteristics by ripening stages
Light-Red Red-Ripe Red-Soft
Aroma
Tomato ID 7.05 b 7.97a 7.75 a
Green-Viney 4.91 a 4.36b 3.28 c
Decaying Vegetation 0.09 b 0.12b 0.53 a
Cardboard 1.14 a 0.83b 1.33 a
Texture
Firmness 4.91 a 3.67b 2.56 c
Juiciness 9.59 b 10.72a 7.91 c
Mealy 1.36 ab 1.42a 1.11 b
Skin Awareness 9.58 b 10.72a 7.06 c
Seed Awareness 2.09 2.19 1.47
Fiber Awareness 2.37 a 1.67b 1.28 c
Flavor
Tomato ID 8.33 b 9.94a 10.11 a
Ripeness 8.08 b 10.00a 10.19 a
Green-Viney 3.84 a 3.44a 2.97 b
Umami 1.36 1.58b 2.17 a
Fruity 2.43 b 3.03a 3.11 a
Cardboard 1.11 a 0.39b 0.44 b
Fermented 0.00 b 0.22b 0.56 a
Musty/Earthy 1.91 1.75 1.72
Sweet 2.18 b 2.78a 2.89 a
Sour 0.98 1.11 1.22
Salty 2.84 b 3.08a 3.17 a
Bitter 1.14 b 1.22b 2.17 a
Metallic 2.08 2.17 2.33
Astringent 0.23 0.00 0.22 a, b, c – Means with the same letter within a row are not significantly different at the 95% confidence level

122
Table 7.8 cv. Juliet - Sensory characteristics by ripening stages
Light-Red Red-Ripe Red-Soft
Aroma
Tomato ID 7.18 b 7.69 a 7.78 a
Green-Viney 5.38 a 3.81 b 4.11 b
Decaying Vegetation 0.06 0.22 0.00
Cardboard 1.38 a 1.14 a 0.78 b
Texture
Firmness 5.56 a 5.47 a 4.94 b
Juiciness 8.06 b 8.78 a 8.69 a
Mealy 1.29 1.19 1.17
Skin Awareness 10.50 b 11.25 a 10.75 b
Seed Awareness 2.32 2.11 1.89
Fiber Awareness 2.03 a 1.81 ab 1.72 b
Flavor
Tomato ID 7.94 b 8.97 a 9.06 a
Ripeness 7.56 b 9.14 a 9.31 a
Green-Viney 5.26 a 3.61 b 3.33 b
Umami 0.62 b 0.92 ab 1.06 a
Fruity 1.98 b 2.61 a 2.58 a
Cardboard 1.52 a 1.28 ab 0.97 c
Fermented 0.06 0.11 0.11
Musty/Earthy 1.50 1.89 1.64
Sweet 2.05 b 2.47 a 2.69 a
Sour 0.81 b 1.11 a 0.94 ab
Salty 3.39 a 2.97 b 2.94 b
Bitter 0.97 b 1.11 ab 1.17 a
Metallic 2.52 a 2.22 b 2.28 ab
Astringent 0.26 0.06 0.00 a, b, c – Means with the same letter within a row are not significantly different at the 95% confidence level

123
Table 7.9 cv. Red Agate – Sensory characteristics by ripening stages
Light-Red Red-Ripe Red-Soft
Aroma
Tomato ID 7.54 7.28 7.62
Green-Viney 4.79 a 4.17 b 4.00 b
Decaying Vegetation 0.00 0.00 0.00
Cardboard 1.13 ab 1.17 a 0.85 b
Texture
Firmness 5.46 a 5.25 a 4.68 b
Juiciness 7.79 b 8.42 a 8.65 a
Mealy 2.51 a 2.06 b 1.82 b
Skin Awareness 10.08 b 10.83 a 10.64 a
Seed Awareness 1.83 2.08 2.03
Fiber Awareness 2.51 a 2.03 b 1.94 b
Flavor
Tomato ID 7.33 c 7.86 b 8.30 a
Ripeness 7.01 c 7.89 b 8.68 a
Green-Viney 4.79 a 4.14 b 3.91 b
Umami 0.38 b 0.28 b 1.02 a
Fruity 1.78 1.83 2.15
Cardboard 1.40 1.67 1.35
Fermented 0.00 0.00 0.00
Musty/Earthy 1.63 1.44 1.68
Sweet 1.85 b 2.08 ab 2.30 a
Sour 0.72 0.67 0.84
Salty 3.05 2.94 3.15
Bitter 0.92 1.08 1.02
Metallic 2.51 2.44 2.27
Astringent 0.08 0.22 0.06 a, b, c – Means with the same letter within a row are not significantly different at the 95% confidence level

124
Sensory Characteristics of Tomato Juice and Paste
In tomato juice, cultivar resulted in only two significant differences, browned and fruity
flavor (Table 7.10). Juice made from cv. Florida 91 had the highest browned and fruity notes.
All texture attributes for tomato juice samples, except skin awareness, changed significantly with
different cultivars. These results indicated the importance of determining and differentiating the
texture properties of various processed tomato products using descriptive sensory analysis, and
possibly correlating this information with instrumental data, if available. Barrett and others
(1998) indicated that understanding the textural properties of processed tomatoes is important to
guarantee the product quality that meets consumer expectation. On average, tomato juice
produced with Red Agate showed the highest intensity of those texture attributes evaluated.
Tomato juice from Jet Star resulted generally in lowest intensity of the texture properties.
Viscosity has been described as a key measure for processing yields and quality of processed
tomato products (Claybon and Barringer 2002). Products with higher viscosity and thickness
would mean lesser amounts of fresh tomatoes would be needed to fill the containers, thus
reducing production costs (Thakur and others 1996). Seed awareness was significantly higher in
Juliet than other cultivars because the seeds of Juliet are much smaller than those of the other
cultivars and could not be completely filtered using the sieve we used in this research.
Table 7.11 illustrates texture differences among the cultivars of tomato pastes. Paste
made from Florida 91 showed significantly higher browned and fruity notes, but lower tomato
ID aroma compared to paste made from other cultivars. Paste made with Juliet had the highest
green-viney character and lowest browned note. Pulp size, pulp amount and seed awareness
attributes were different among the paste samples with Red Agate showing the most, but smaller
size pulp and Florida 91 exhibiting less, but larger pulp. As for juice, seed awareness in tomato
paste was higher for Juliet. Garcia and Barett (2006) indicated that cultivar, maturity stage,
growing conditions and processing treatments principally influence the quality of processed
tomatoes. In our study, only the effect of cultivars can be drawn, because other factors such as
maturity of the tomatoes were similarly controlled. Although Thakur and others (1996) indicated
that tomato cultivars may have the most impact of the quality of processed tomatoes; our results
did not indicate such large differences. This may be due to the use of 4 fresh market tomato
cultivars and only one processing tomatoes.

125
Table 7.10 Significant differences in the sensory characteristics of tomato juice by cultivars
Brandywine Florida 91 Jet Star Juliet Red Agate Aroma Tomato ID 7.69 7.44 7.61 7.50 7.78 Green-Viney 2.44 2.47 2.28 2.47 2.42 Browned 1.22 1.28 1.17 1.17 1.17
Decaying Vegetation 0.39 0.44 0.47 0.53 0.50
Cardboard 0.92 1.08 1.14 1.14 1.25 Texture Viscosity 3.75 b 3.72b 3.22c 3.39 c 4.33a Thickness 3.75 b 3.75b 3.14c 3.50 b 4.67a Mealy 0.97 ab 0.97ab 0.67c 0.92 b 1.28a Skin Awareness 0.11 0.06 0.00 0.14 0.11 Seed Awareness 0.83 b 0.50b 0.53b 1.97 a 0.64b Fiber Awareness 1.50 b 1.42b 0.92c 1.39 b 2.00a Pulp Size 5.14 c 5.17c 4.31d 5.61 b 7.97a Pulp Amount 5.03 b 4.83b 3.97c 4.86 b 6.03a Flavor Tomato ID 10.11 10.22 10.08 10.00 10.22 Ripeness 10.00 10.22 10.11 10.17 10.14 Cooked 7.89 7.56 7.56 7.86 7.67 Browned 4.92 a 5.03a 4.42b 4.64 ab 4.47ab Green-Viney 2.81 2.39 2.58 2.78 2.86 Umami 1.61 1.89 1.78 1.97 1.72 Fruity 3.08 b 3.47a 3.22b 3.25 ab 3.11b Cardboard 0.50 0.61 0.42 0.61 0.64 Fermented 1.03 1.06 0.81 0.64 0.58 Musty/Earthy 1.83 1.72 1.89 1.83 1.78 Overall Sweet 3.08 3.19 3.19 3.31 3.03 Sweet 1.39 1.47 1.39 1.44 1.39 Sour 3.56 3.33 3.42 3.17 3.42 Salt 4.39 4.67 4.58 4.44 4.50 Bitter 2.44 2.28 2.47 2.14 2.31 Metallic 1.11 1.17 1.14 1.08 1.08 Chemical 0.06 0.11 0.06 0.17 0.17 Astringent 1.69 1.56 1.67 1.56 1.61
a, b, c – Means with the same letter within a row are not significantly different at the 95% confidence level

126
Table 7.11 Significant differences in the sensory characteristics of tomato paste by cultivars
Florida 91 Jet Star Juliet Red Agate Aroma
Tomato ID 7.14 7.22 7.22 7.28 Green-Viney 2.31 ab 2.11 b 2.47 a 2.17 b Browned 9.19 a 8.64 bc 8.36 c 8.97 b Decaying Vegetation 2.83 3.06 2.81 3.31 Cardboard
1.28
1.11
1.17
1.08
Texture Thickness 13.86 14.00 13.67 13.88 Mealy 1.97 1.69 1.89 1.89 Skin Awareness 0.00 0.00 0.06 0.00 Seed Awareness 0.47 c 0.86 b 3.81 a 0.36 c Fiber Awareness 1.47 1.33 1.47 1.25 Pulp Size 9.72 a 9.22 b 9.08 b 9.31 b Pulp Amount
13.19 b
13.42 a
13.39 ab
13.56
a
Flavor Tomato ID 9.56 b 10.06 a 10.00 a 9.89 b Ripeness 10.94 11.00 11.19 11.11 Cooked 12.17 12.83 12.33 12.50 Browned 10.92 11.36 11.03 10.92 Green-Viney 2.69 a 2.25 b 2.28 b 2.08 b Umami 0.83 0.64 0.75 0.47 Fruity 3.00 a 2.81 b 2.89 b 2.64 b Cardboard 1.08 1.03 1.08 1.00 Fermented 2.89 3.06 2.78 2.58 Musty/Earthy 2.17 2.31 2.33 2.36 Overall Sweet 3.25 3.36 3.39 3.19 Sweet 1.56 1.53 1.72 1.72 Sour 4.31 4.28 4.31 4.14 Salt 4.33 4.31 4.36 4.28 Bitter 3.44 3.75 3.53 3.58 Metallic 3.08 3.44 3.42 3.17 Chemical 0.19 0.17 0.33 0.17 Astringent 2.03 2.17 2.31 2.06
a, b, c – Means with the same letter within a row are not significantly different at the 95% confidence level

127
Comparing Sensory Characteristics of Fresh and Processed Tomatoes
To help understand the differences and similarities of fresh tomatoes and their derivative
juice and paste, principal component analysis (PCA) was performed. Because the data showed
different effects for flavor and texture, the PCA was done separately for aroma/flavor and texture
attributes. Figure 7.4 illustrates the PCA map for aroma and flavor characteristics of tomatoes
and Figure 7.5 exhibits the texture map. For aroma and flavor, the first two principal
components explained 96.31% of the variance. For texture attributes, the first two components
accounted for 98.32% of the variance.
Three groups of tomatoes were identified using the cluster analysis. In general, products
in each cluster had similar character, but differed in the intensity of several attributes. Cluster 1
included all fresh tomatoes, however, two sub-groups were observed, one that included tomatoes
harvested at the red-ripe and red-soft stages and the other including those harvested at the light-
red stage. Cluster 2 included all tomato juice samples and cluster 3 represented all the tomato
paste. This indicates that degree of processing affected sensory properties much more than did
variety. Cluster 1 exhibited higher green-viney, especially in those harvested at the red-pink
stage. On the other hand, these red-pink tomatoes were lowest in tomato ID and ripeness
characteristics. Those red-ripe and red-soft fresh tomatoes had higher tomato ID flavor, umami,
and sweetness. Only a slight astringency was observed in fresh tomatoes. Firmness, juiciness,
and skin awareness were apparent in all these fresh tomatoes. Cluster 2, tomato juice, exhibited
the highest tomato ID, and higher ripeness, sourness, and fruity character than tomatoes in other
clusters and had cooked, browned, and slight fermented notes. As anticipated, tomato paste,
cluster 3, exhibited high levels of cooked and brown notes. Interestingly, fermented, decaying
vegetation and astringent attributes also were more prominent in the tomato paste products.
Notably, tomato ID, ripeness and fruitiness were higher in tomato juice than in fresh
tomatoes or tomato paste. This may suggest that the heat processing used to produce tomato
juice is enough to preserve and intensify those characters of the product, without increasing
cooked flavor notes that overwhelm those flavors with more intense processing. On the other
hand, some attributes present in fresh tomatoes such as tomato ID, green-viney, and sweet were
considerably decreased or essentially disappeared with high heat processes.
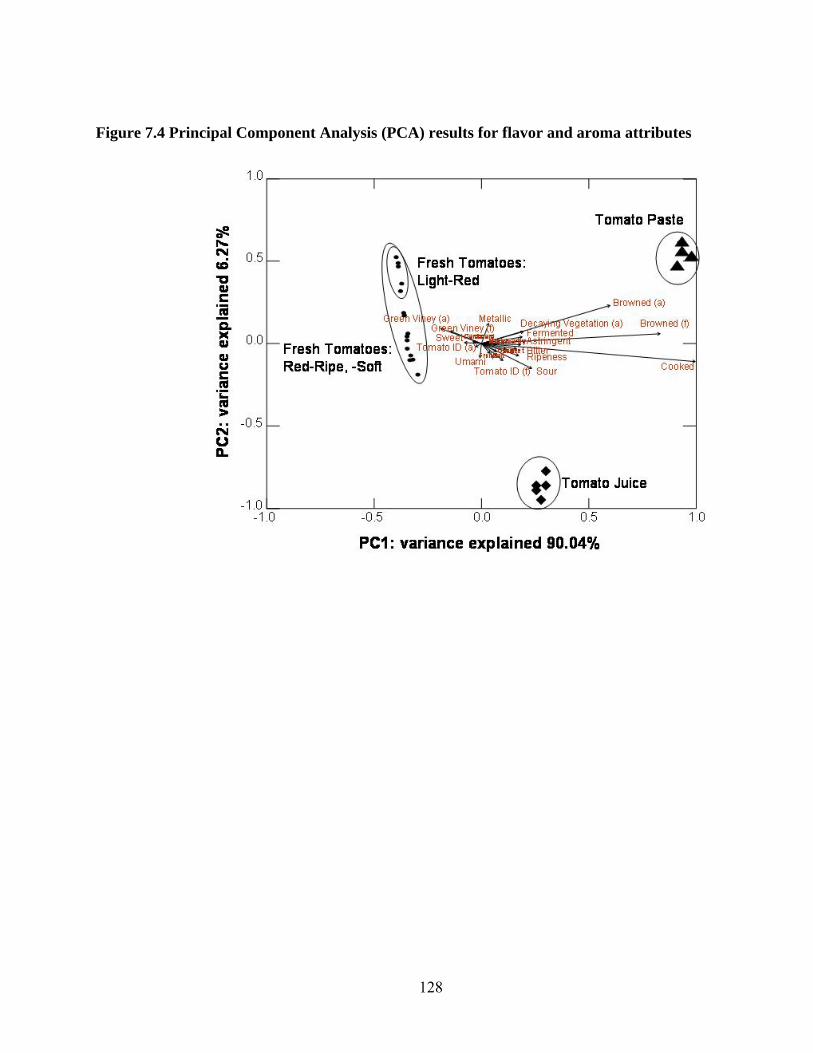
128
Figure 7.4 Principal Component Analysis (PCA) results for flavor and aroma attributes

129
Figure 7.5 Principal Component Analysis (PCA) for texture attributes

130
Conclusions The sensory characteristics and compositional data of five fresh tomatoes differed
significantly due to cultivar and ripening stage differences, with fresh-market tomatoes showing
higher levels of tomato ID, green-viney, ripeness, fruity, sweet and umami than a tomato
developed for processing. Not surprisingly, sensory characteristics of processed tomatoes
differed substantially from those of fresh tomatoes and differences in flavor caused by variety
became smaller or disappeared at high levels of processing. At a low level of processing, i.e.
tomato juice, some characterizing tomato attributes were intensified, but processing to a higher
degree, i.e. tomato paste, significantly decreased those attributes. Differences in texture
attributes based on variety did carry through or intensify as tomatoes were processed, with the
texture of the tomato bred for processing maintaining mealiness, pulp and fiber awareness, and
thickness of the products.

131
References Auerswald H, Peters P, Bruckner B, Krumbein A, Kuchenbuch R. 1999. Sensory analysis and
instrumental measurements of short-term stored tomatoes (Lycopersicon esculentum Mill.) Postharvest Biol. Technol. 15: 323–34.
Barrett DM, Garcia E, Wayne JE. 1998. Textural modification of processing tomatoes. Crit. Rev.
Food Sci. Nutr. 38: 173–258. Batu A. 2004. Determination of acceptable firmness and colour values of tomatoes. J. Food Eng.
61: 471-475. Bedford LV. 1989. Sensory quality of fresh tomatoes: comparison of tomatoes grown in nutrient
media of different conductivities. Camden Food and Drink Research Association/Technical Memorandum No. 531.
Bruhn CM, Feldmann N, Gartitz C, Harwood J, Ivans E, Mashall M, Riley A, Thurber D,
Willamson E. 1991. Consumer perceptions of quality: apricots, cantaloupes, peaches, pears, strawberries, and tomatoes. J. Food Qual. 14: 187–195.
Boukobza F, Taylor A. 2002. Effect of postharvest treatment on flavour volatiles of tomatoes.
Postharvest Biol. Technol. 25: 321–331. Claybon KT, Barringer SA. 2002. Consumer acceptability of viscosity in processed tomato
products by African-American, Latino, and prototypical consumer groups. J. Food Sci. 67: 2380-2384.
Causse M, Buret M, Robini K, Verschave P. 2003. Inheritance of nutritional and sensory quality
traits in fresh market tomato and relation to consumer preferences. J. Food Sci. 68: 2342-2350.
Garcia E, Barrett DM. 2006. Evaluation of processing tomatoes from two consecutive growing
seasons: Quality attributes, peelability and yield. J. Food Process. Preserv. 30: 20-36. Gould WA. 1992. Tomato Production, Processing and Technology, 3rd Ed., CTI Publishers,
Baltimore, MD. Ho L. 1996. The mechanism of assimilates partitioning and carbohydrate compartmentation in
fruit in relation to the quality and yield of tomato. J. Exp. Bot. 47: 1239–1243. Hobson G. 1988. How the tomato lost its taste. New Scientist. 1632: 46–50.

132
Johansson L, Haglund A, Berglund L, Lea P, Risvik E. 1999. Preference for tomatoes, affected by sensory attributes and information about growth conditions. Food Qual. Pref. 10: 289-298.
Kader AA, Stevens MA, Albright-Holton M, Morris LL, Algizi M. 1977. Effect of fruit ripeness
when picked on flavor and composition in fresh market tomatoes. J. Am. Soc. Hortic. Sci. 102: 724–731.
Kader AA, Morris LL, Stevens MA, Allbright-Holton M. 1978. Composition and flavor quality
of fresh market tomatoes as influenced by some postharvest handling procedures. J. Am. Soc. Hort. Sci. 103: 6–13.
Ketelaere BD, Lammertyn J, Molenberghs G, Desmet M, Nicolaï B, Baerdemaeker JD. 2004.
Tomato cultivar grouping based on firmness change, shelf life and variance during postharvest storage. Postharvest Biol. Technol. 34: 187-201.
Krumbein A, Peters P, Brückner B. 2004. Flavor compounds and a quantitative descriptive
analysis of tomatoes (Lycopersicon esculentum Mill.) of different cultivars in short-term storage. Postharvest Biol. Technol. 32: 15-28.
Lana MM, Tijskens LMM, Kooner O. 2005. Effect of storage temperature and fruit ripening on
firmness of fresh cut tomatoes. Postharvest Biol. Technol. 35: 87-95. Lee SY, Luna-Guzmán I, Chang S, Barrett DM, Guinard JX. 1999. Relating descriptive analysis
and instrumental texture data of processed diced tomatoes. Food Qual. Pref. 10: 447-455. Malundo TMM, Shewfelt RL, Scott JW. 1995. Flavor quality of fresh tomato (Lycopersicon
esculentum Mill.) as affected by sugar and acid levels. Postharvest Biol. Technol. 6: 103–110.
Maul F, Sargent SA, Sims CA, Baldwin EA, Balaban MO, Huber DJ. 2000. Tomato flavor and
aroma quality as affected by storage temperature. J. Food Sci. 65: 1228-1237. Meilgaard MC, Civille GV, Carr BT. 1991. Sensory Evaluation Techniques. CRC Press, Boca
Raton, Florida. Monti LM. 1980. The breeding of tomatoes for peeling. Acta Hortic. 100: 341–349. Paull RE. 1999. Effect of temperature and relative humidity on fresh commodity quality.
Postharvest Biol. Technol. 15: 263–277. Picha D. 1986. Effect of harvest maturity on the final fruit composition of cherry and large-
fruited tomato cultivars. J. Am. Soc. Hort. Sci. 111: 723-727.
133
Ratanachinakorn B, Klieber A, Simons DH. 1997. Effect of short-term controlled atmospheres and maturity on ripening and eating quality of tomatoes. Postharvest Biol. Technol. 11: 149-154.
Saltveit ME. 2005. Fruit ripening and fruit quality. In: Heuvelink E, editor. Tomatoes.
Massasusett: CABI Publishing. p 145-170. Serrano-Megías M, López-Nicolás JM. 2006. Application of agglomerative hierarchical
clustering to identify consumer tomato preferences: influence of physicochemical and sensory characteristics on consumer response. J. Sci. Food Agri. 86: 493-499.
Stevens MA. 1972. Citrate and malate concentrations in tomato fruits: Genetic control and
maturational effects. J. Am. Soc. Hortic. Sci. 97: 655–658. Thakur BR, Singh RK, Nelson P. 1996. Quality attributes of processed tomato products: A
review. Food Rev. Int. 12: 375–401. United States Department of Agriculture. 1976. United States standards for grade of fresh
tomatoes. US Dept. Agric., Mktg., Serv., Washington DC. pp. 10. Watada AE, Aulenbach BB. 1979. Chemical and sensory qualities of fresh market tomatoes. J.
Food Sci. 44: 1013–1016. Yilmaz E. 2002. The chemistry of fresh tomato flavour. Turk J. Agric. Forest. 25: 149-155.

134
Appendix A - Descriptive Sensory Analysis for Green Odor in Foods
and Chemicals

135
Table A.1 Orientation Schedule for Chemical Evaluation
Day Chemical Concentration (ppm) Code Serve Time
Cis-3-Hexen-1-Ol 1,000 853 9:05 am Cis-3-Hexen-1-Ol 100 178 9:05 am Cis-3-Hexen-1-Ol 10 206 9:05 am
Hexanal 1,000 593 9:05 am Hexanal 100 421 9:05 am
April 18, 2006
Hexanal 10 974 9:05 am
Figure A.1 Serial Dilution Technique Used for Chemical Solution Preparation

136
Table A.2 Testing Schedule for Chemical Evaluation
Chemicals SAFC Catalog Number
Concentration (ppm)
Date Evaluated
Hexanal (Hexyl aldehyde) w25571-8 1-100,000 ppm 19-Apr
cis-3-Hexen-1-ol w25630-7 1-100,000 ppm 20-Apr
1-Penten-3-ol w35840-1 1-100,000 ppm 21-Apr
2-isobutylthiazole w31340-8 1-100,000 ppm 21-Apr
2-Pentanol w33160-0 1-100,000 ppm 24-Apr
3-Heptanone w25450-9 1-100,000 ppm 24-Apr
b-Cyclocitral w36392-8 1-100,000 ppm 24-Apr
Citronellal w23070-7 1-100,000 ppm 25-Apr
Geranyl formate w25140-2 1-100,000 ppm 25-Apr
Heptyl butyrate w25490-8 1-100,000 ppm 26-Apr
Hexyl benzoate w36910-1 1-100,000 ppm 26-Apr
Hexyl formate w25700-1 1-100,000 ppm 26-Apr
Hexyl hexanoate w25720-6 1-100,000 ppm 27-Apr
Hexyl octanoate w25750-8 1-100,000 ppm 27-Apr
Hexyl phenylacetate w34570-9 1-100,000 ppm 28-Apr
Hexyl propionate w25760-5 1-100,000 ppm 28-Apr
Hexyl tiglate w50090-9 1-100,000 ppm 2-May
Hexyl-2-furoate w25710-9 1-100,000 ppm 2-May
Hexyl-2-methylbutanoate w34990-9 1-100,000 ppm 3-May
trans-2-Hexen-1-ol w25621-8 1-100,000 ppm 3-May
trans-2-Hexenal w25600-5 1-100,000 ppm 4-May
trans-2-Pentenal w32181-8 1-100,000 ppm 4-May

137
Appendix B - Descriptive Sensory Analysis for Tomato Lexicon
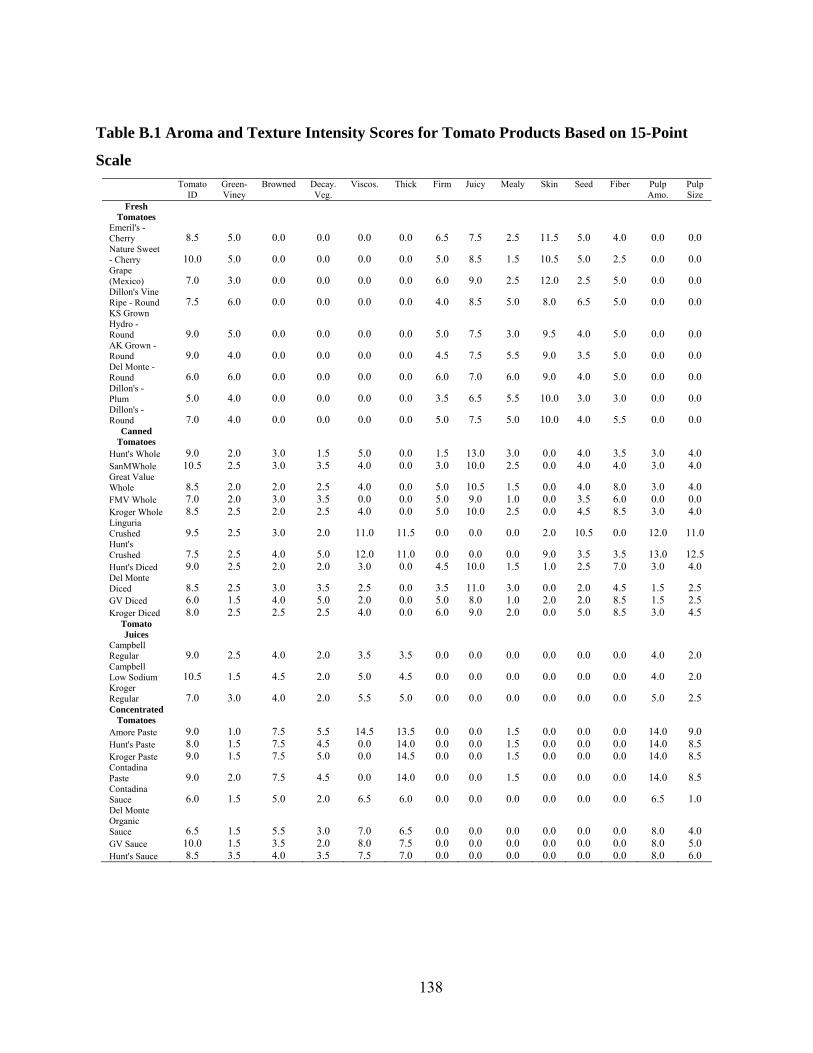
138
Table B.1 Aroma and Texture Intensity Scores for Tomato Products Based on 15-Point
Scale
Tomato ID
Green-Viney
Browned Decay. Veg.
Viscos. Thick Firm Juicy Mealy Skin Seed Fiber Pulp Amo.
Pulp Size
Fresh Tomatoes
Emeril's - Cherry 8.5 5.0 0.0 0.0 0.0 0.0 6.5 7.5 2.5 11.5 5.0 4.0 0.0 0.0 Nature Sweet - Cherry 10.0 5.0 0.0 0.0 0.0 0.0 5.0 8.5 1.5 10.5 5.0 2.5 0.0 0.0 Grape (Mexico) 7.0 3.0 0.0 0.0 0.0 0.0 6.0 9.0 2.5 12.0 2.5 5.0 0.0 0.0 Dillon's Vine Ripe - Round 7.5 6.0 0.0 0.0 0.0 0.0 4.0 8.5 5.0 8.0 6.5 5.0 0.0 0.0 KS Grown Hydro - Round 9.0 5.0 0.0 0.0 0.0 0.0 5.0 7.5 3.0 9.5 4.0 5.0 0.0 0.0 AK Grown - Round 9.0 4.0 0.0 0.0 0.0 0.0 4.5 7.5 5.5 9.0 3.5 5.0 0.0 0.0 Del Monte - Round 6.0 6.0 0.0 0.0 0.0 0.0 6.0 7.0 6.0 9.0 4.0 5.0 0.0 0.0 Dillon's - Plum 5.0 4.0 0.0 0.0 0.0 0.0 3.5 6.5 5.5 10.0 3.0 3.0 0.0 0.0 Dillon's - Round 7.0 4.0 0.0 0.0 0.0 0.0 5.0 7.5 5.0 10.0 4.0 5.5 0.0 0.0
Canned Tomatoes
Hunt's Whole 9.0 2.0 3.0 1.5 5.0 0.0 1.5 13.0 3.0 0.0 4.0 3.5 3.0 4.0 SanMWhole 10.5 2.5 3.0 3.5 4.0 0.0 3.0 10.0 2.5 0.0 4.0 4.0 3.0 4.0 Great Value Whole 8.5 2.0 2.0 2.5 4.0 0.0 5.0 10.5 1.5 0.0 4.0 8.0 3.0 4.0 FMV Whole 7.0 2.0 3.0 3.5 0.0 0.0 5.0 9.0 1.0 0.0 3.5 6.0 0.0 0.0 Kroger Whole 8.5 2.5 2.0 2.5 4.0 0.0 5.0 10.0 2.5 0.0 4.5 8.5 3.0 4.0 Linguria Crushed 9.5 2.5 3.0 2.0 11.0 11.5 0.0 0.0 0.0 2.0 10.5 0.0 12.0 11.0 Hunt's Crushed 7.5 2.5 4.0 5.0 12.0 11.0 0.0 0.0 0.0 9.0 3.5 3.5 13.0 12.5 Hunt's Diced 9.0 2.5 2.0 2.0 3.0 0.0 4.5 10.0 1.5 1.0 2.5 7.0 3.0 4.0 Del Monte Diced 8.5 2.5 3.0 3.5 2.5 0.0 3.5 11.0 3.0 0.0 2.0 4.5 1.5 2.5 GV Diced 6.0 1.5 4.0 5.0 2.0 0.0 5.0 8.0 1.0 2.0 2.0 8.5 1.5 2.5 Kroger Diced 8.0 2.5 2.5 2.5 4.0 0.0 6.0 9.0 2.0 0.0 5.0 8.5 3.0 4.5
Tomato Juices
Campbell Regular 9.0 2.5 4.0 2.0 3.5 3.5 0.0 0.0 0.0 0.0 0.0 0.0 4.0 2.0 Campbell Low Sodium 10.5 1.5 4.5 2.0 5.0 4.5 0.0 0.0 0.0 0.0 0.0 0.0 4.0 2.0 Kroger Regular 7.0 3.0 4.0 2.0 5.5 5.0 0.0 0.0 0.0 0.0 0.0 0.0 5.0 2.5 Concentrated
Tomatoes Amore Paste 9.0 1.0 7.5 5.5 14.5 13.5 0.0 0.0 1.5 0.0 0.0 0.0 14.0 9.0 Hunt's Paste 8.0 1.5 7.5 4.5 0.0 14.0 0.0 0.0 1.5 0.0 0.0 0.0 14.0 8.5 Kroger Paste 9.0 1.5 7.5 5.0 0.0 14.5 0.0 0.0 1.5 0.0 0.0 0.0 14.0 8.5 Contadina Paste 9.0 2.0 7.5 4.5 0.0 14.0 0.0 0.0 1.5 0.0 0.0 0.0 14.0 8.5 Contadina Sauce 6.0 1.5 5.0 2.0 6.5 6.0 0.0 0.0 0.0 0.0 0.0 0.0 6.5 1.0 Del Monte Organic Sauce 6.5 1.5 5.5 3.0 7.0 6.5 0.0 0.0 0.0 0.0 0.0 0.0 8.0 4.0 GV Sauce 10.0 1.5 3.5 2.0 8.0 7.5 0.0 0.0 0.0 0.0 0.0 0.0 8.0 5.0 Hunt's Sauce 8.5 3.5 4.0 3.5 7.5 7.0 0.0 0.0 0.0 0.0 0.0 0.0 8.0 6.0
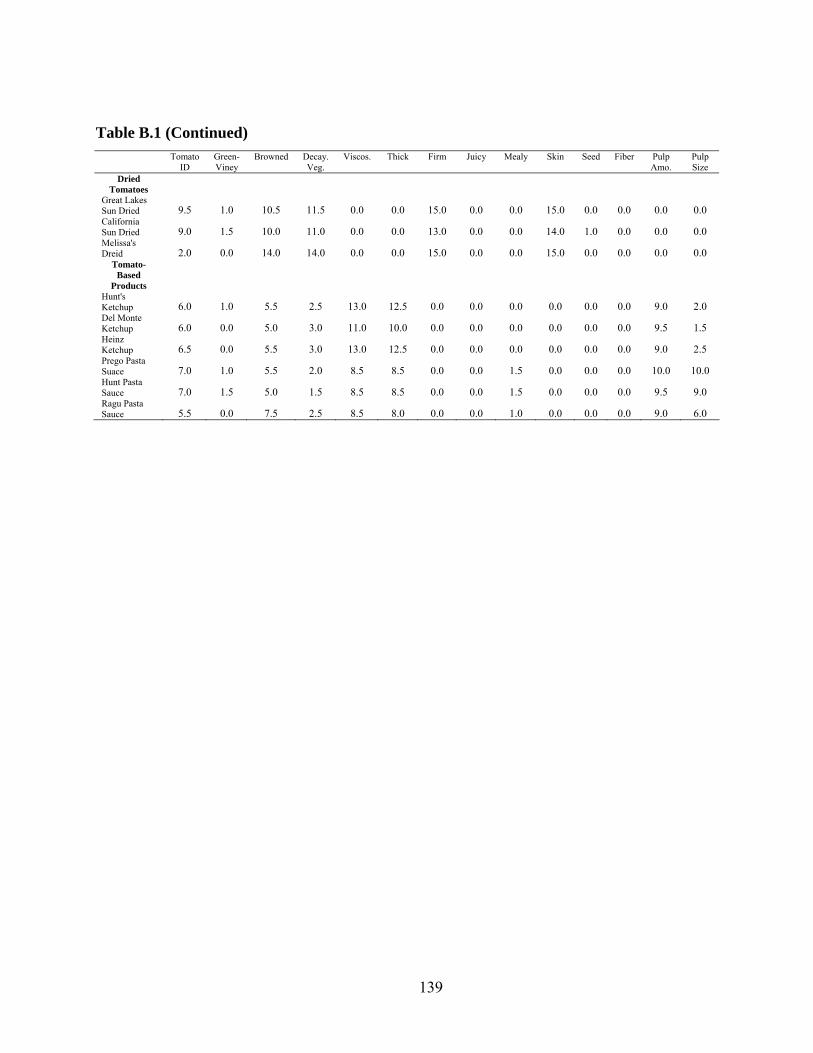
139
Table B.1 (Continued)
Tomato ID
Green-Viney
Browned Decay. Veg.
Viscos. Thick Firm Juicy Mealy Skin Seed Fiber Pulp Amo.
Pulp Size
Dried Tomatoes
Great Lakes Sun Dried 9.5 1.0 10.5 11.5 0.0 0.0 15.0 0.0 0.0 15.0 0.0 0.0 0.0 0.0 California Sun Dried 9.0 1.5 10.0 11.0 0.0 0.0 13.0 0.0 0.0 14.0 1.0 0.0 0.0 0.0 Melissa's Dreid 2.0 0.0 14.0 14.0 0.0 0.0 15.0 0.0 0.0 15.0 0.0 0.0 0.0 0.0
Tomato-Based
Products Hunt's Ketchup 6.0 1.0 5.5 2.5 13.0 12.5 0.0 0.0 0.0 0.0 0.0 0.0 9.0 2.0 Del Monte Ketchup 6.0 0.0 5.0 3.0 11.0 10.0 0.0 0.0 0.0 0.0 0.0 0.0 9.5 1.5 Heinz Ketchup 6.5 0.0 5.5 3.0 13.0 12.5 0.0 0.0 0.0 0.0 0.0 0.0 9.0 2.5 Prego Pasta Suace 7.0 1.0 5.5 2.0 8.5 8.5 0.0 0.0 1.5 0.0 0.0 0.0 10.0 10.0 Hunt Pasta Sauce 7.0 1.5 5.0 1.5 8.5 8.5 0.0 0.0 1.5 0.0 0.0 0.0 9.5 9.0 Ragu Pasta Sauce 5.5 0.0 7.5 2.5 8.5 8.0 0.0 0.0 1.0 0.0 0.0 0.0 9.0 6.0

140
Table B.2 Flavor Intensity Scores for Tomato Products Based on 15-Point Scale
Tomato ID
Ripe Cooked Browned Green-Viney
Fruity Ferment Musty Sweet Chem-ical
Sour Salt Bitter Metallic
Fresh Tomatoes
Emeril's - Cherry
8.0 7.0 0.0 0.0 4.0 2.0 0.0 2.0 2.5 0.0 3.0 1.5 2.0 0.0
Nature Sweet - Cherry
9.5 8.0 0.0 0.0 3.5 2.5 0.0 2.0 3.0 0.0 3.0 1.5 1.5 0.0
Grape (Mexico)
8.5 9.5 0.0 0.0 4.5 2.5 0.0 2.0 2.0 0.0 3.5 2.0 3.0 0.0
Dillon's Vine Ripe - Round
7.0 6.0 0.0 0.0 5.0 1.5 0.0 3.0 2.0 0.0 3.0 2.0 2.5 0.0
KS Grown Hydro - Round
8.5 7.5 0.0 0.0 4.0 2.0 0.0 2.0 2.5 0.0 3.0 1.5 1.5 0.0
AK Grown - Round
9.0 8.5 0.0 0.0 3.5 2.0 0.0 2.0 2.0 0.0 2.5 1.5 1.5 0.0
Del Monte - Round
6.5 7.0 0.0 0.0 6.0 1.5 0.0 2.0 2.0 0.0 2.5 1.0 2.0 0.0
Dillon's - Plum
5.5 4.5 0.0 0.0 5.0 1.0 0.0 3.5 1.0 0.0 2.5 1.0 2.0 0.0 Dillon's - Round
7.0 5.0 0.0 0.0 4.0 1.0 0.0 2.0 1.5 0.0 2.5 1.0 2.0 0.0 Canned
Tomatoes
Hunt's Whole 11.0 10.0 8.5 2.5 2.0 4.0 1.5 2.0 2.5 0.0 3.5 4.5 2.5 1.5
SanMWhole 11.0 10.5 8.5 3.0 2.5 3.0 1.5 2.0 2.5 0.0 3.5 4.5 2.5 2.5
Great Value Whole
10.5 10.0 7.5 3.0 2.5 2.5 1.0 2.0 2.5 0.0 3.5 5.0 2.0 1.5
FMV Whole 9.5 10.0 7.0 3.5 3.0 2.0 1.0 2.0 2.0 0.0 3.0 5.0 2.0 2.0
Kroger Whole 9.5 9.5 7.0 3.0 3.0 2.0 1.0 2.5 2.0 0.0 3.0 3.5 2.0 2.0
Linguria Crushed
11.0 10.0 8.0 4.0 2.5 2.5 1.0 2.0 2.5 0.0 3.0 4.5 2.5 2.0 Hunt's Crushed
11.0 11.5 9.0 6.5 3.5 1.0 2.0 2.5 2.0 0.0 3.5 6.0 3.0 3.5
Hunt's Diced 11.0 10.0 7.5 2.5 3.0 2.5 1.0 2.0 2.5 0.0 3.5 5.5 2.0 1.5
Del Monte Diced
8.5 11.0 7.5 3.5 3.0 2.5 2.0 2.0 2.0 0.0 3.5 3.0 3.0 2.5
GV Diced 8.0 12.0 7.0 4.0 2.5 1.5 4.0 2.0 1.5 0.0 3.0 4.0 3.0 2.5
Kroger Diced 7.0 9.0 7.0 3.0 3.5 1.5 1.0 2.5 2.0 0.0 3.5 3.5 3.0 2.0
Tomato Juices
Campbell Regular
8.5 10.0 9.5 5.5 2.5 2.0 1.0 1.5 2.5 0.0 3.0 5.5 2.5 1.0 Campbell Low Sodium
9.0 9.5 10.0 8.5 3.0 2.5 1.0 2.0 2.0 0.0 4.0 3.5 3.0 3.0 Kroger Regular
9.0 10.0 10.5 5.0 4.0 3.0 1.5 2.0 1.5 0.0 3.5 6.0 3.0 5.0
Concentrated Tomatoes
Amore Paste 9.5 10.0 12.0 9.5 1.5 2.5 2.0 2.0 2.0 0.0 3.5 4.5 3.0 4.5
Hunt's Paste 10.0 10.0 12.0 10.5 1.5 2.0 2.0 2.5 2.5 0.0 3.5 4.5 3.0 3.0
Kroger Paste 9.5 10.5 11.0 9.0 2.5 2.0 3.0 2.5 2.0 0.0 4.0 2.5 3.0 5.0
Contadina Paste
10.0 10.5 12.5 11.0 2.0 2.0 2.0 3.0 2.5 0.0 3.5 4.0 3.0 3.5 Contadina Sauce
9.0 10.5 11.0 9.0 2.0 1.5 0.0 1.0 3.0 0.0 3.0 4.5 2.0 1.0 Del Monte Organic Sauce
6.0 10.5 11.5 9.0 2.0 0.0 2.0 2.5 2.0 3.0 3.0 7.0 3.0 3.5
GV Sauce 11.0 10.5 11.5 8.5 2.0 1.5 0.0 2.0 2.5 0.0 3.0 7.0 2.0 2.5
Hunt's Sauce 9.5 9.5 10.0 8.0 3.0 2.0 1.0 2.0 2.0 0.0 3.5 3.0 3.5 3.0
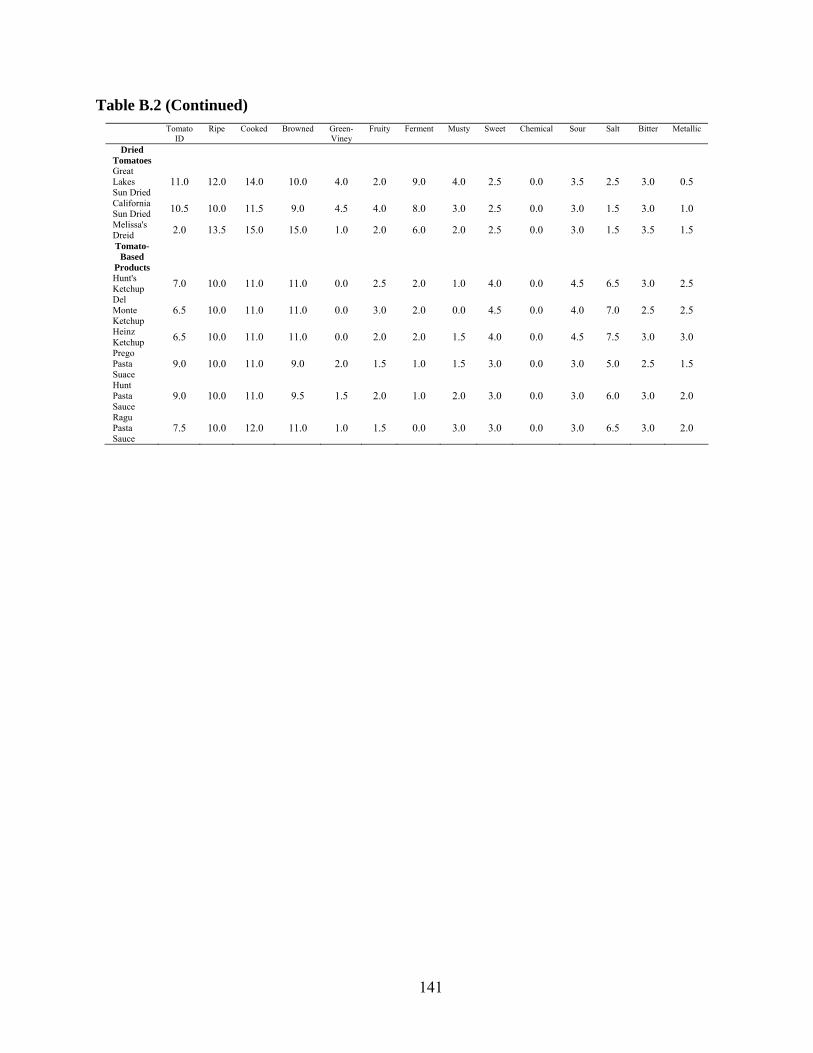
141
Table B.2 (Continued)
Tomato ID
Ripe Cooked Browned Green-Viney
Fruity Ferment Musty Sweet Chemical Sour Salt Bitter Metallic
Dried Tomatoes Great Lakes Sun Dried
11.0 12.0 14.0 10.0 4.0 2.0 9.0 4.0 2.5 0.0 3.5 2.5 3.0 0.5
California Sun Dried 10.5 10.0 11.5 9.0 4.5 4.0 8.0 3.0 2.5 0.0 3.0 1.5 3.0 1.0 Melissa's Dreid 2.0 13.5 15.0 15.0 1.0 2.0 6.0 2.0 2.5 0.0 3.0 1.5 3.5 1.5 Tomato-
Based Products
Hunt's Ketchup 7.0 10.0 11.0 11.0 0.0 2.5 2.0 1.0 4.0 0.0 4.5 6.5 3.0 2.5 Del Monte Ketchup
6.5 10.0 11.0 11.0 0.0 3.0 2.0 0.0 4.5 0.0 4.0 7.0 2.5 2.5
Heinz Ketchup 6.5 10.0 11.0 11.0 0.0 2.0 2.0 1.5 4.0 0.0 4.5 7.5 3.0 3.0 Prego Pasta Suace
9.0 10.0 11.0 9.0 2.0 1.5 1.0 1.5 3.0 0.0 3.0 5.0 2.5 1.5
Hunt Pasta Sauce
9.0 10.0 11.0 9.5 1.5 2.0 1.0 2.0 3.0 0.0 3.0 6.0 3.0 2.0
Ragu Pasta Sauce
7.5 10.0 12.0 11.0 1.0 1.5 0.0 3.0 3.0 0.0 3.0 6.5 3.0 2.0

142
Table B.3 Pearson Correlation for All Sensory Attributes
Tomato ID A
Green-Viney
A
Browned A
Decay. Veg. A
Card-board
Viscos. Thick Firm Juicy Mealy Skin Seed Fiber
Aroma
Tomato ID 1.00
Green-Viney 0.23 1.00
Browned -0.24 -0.78 1.00
Decaying Vegetation -0.17 -0.57 0.88 1.00
Cardboard -0.39 -0.10 0.21 0.40 1.00
Texture
Viscosity -0.07 -0.51 0.20 -0.03 -0.26 1.00
Thickness -0.01 -0.50 0.43 0.09 -0.29 0.63 1.00
Firmness -0.14 0.14 0.18 0.53 0.44 -0.60 -0.68 1.00
Juiciness
0.17 0.53 -0.68 -0.40 0.22 -0.48 -0.75 0.30 1.00
Mealy -0.02 0.70 -0.63 -0.50 0.13 -0.51 -0.47 0.16 0.65 1.00 Skin Awareness -0.16 0.42 -0.05 0.24 0.17 -0.53 -0.49 0.76 0.14 0.32 1.00 Seed Awareness 0.24 0.62 -0.64 -0.39 0.02 -0.22 -0.42 0.19 0.62 0.47 0.26 1.00 Fiber Awareness 0.06 0.46 -0.62 -0.32 0.32 -0.40 -0.67 0.32 0.88 0.54 0.12 0.60 1.00 Pulp Size
0.20 -0.35 0.27 0.07 -0.15 0.54 0.72 -0.57 -0.40 -0.31 -0.50 -0.08 -0.29
Pulp Amount 0.06 -0.51 0.41 0.09 -0.26 0.65 0.96 -0.71 -0.66 -0.46 -0.58 -0.37 -0.57
Flavor
Tomato ID
0.80 0.01 -0.09 -0.05 -0.43 0.08 0.12 -0.20 0.08 -0.18 -0.24 0.15 0.03
Ripeness
-0.05 -0.75 0.72 0.68 0.18 0.31 0.30 0.04 -0.37 -0.74 -0.28 -0.45 -0.29
Cooked
-0.08 -0.87 0.87 0.67 0.03 0.48 0.57 -0.18 -0.68 -0.78 -0.46 -0.66 -0.62
Browned
-0.27 -0.84 0.90 0.64 0.05 0.47 0.67 -0.16 -0.82 -0.72 -0.30 -0.75 -0.74
Green-Viney
0.21 0.80 -0.52 -0.23 -0.06 -0.64 -0.63 0.43 0.44 0.58 0.58 0.48 0.45
Fruity 0.37 -0.14 0.13 0.19 -0.10 0.01 -0.09 0.14 0.15 -0.16 -0.05 0.04 -0.08
Cardboard
-0.30 0.18 0.18 0.35 0.47 -0.46 -0.19 0.49 -0.09 0.23 0.63 -0.06 -0.06
Fermented -0.06 -0.48 0.77 0.92 0.19 -0.11 0.00 0.59 -0.32 -0.43 0.32 -0.33 -0.27
Musty/Earthy
0.15 0.18 0.14 0.28 0.10 -0.45 -0.20 0.39 0.06 0.23 0.38 0.12 0.09
Overall Sweet -0.09 -0.46 0.28 0.06 -0.29 0.48 0.41 -0.19 -0.33 -0.43 -0.22 -0.26 -0.41
Sweet -0.12 -0.44 0.25 0.02 -0.38 0.52 0.49 -0.35 -0.47 -0.51 -0.35 -0.40 -0.50
Sour 0.14 -0.50 0.32 0.19 -0.21 0.46 0.50 -0.29 -0.26 -0.51 -0.41 -0.36 -0.27
Salty -0.05 -0.63 0.25 -0.02 -0.30 0.76 0.56 -0.62 -0.40 -0.62 -0.72 -0.38 -0.32
Bitter -0.24 -0.56 0.69 0.58 0.07 0.31 0.43 -0.06 -0.52 -0.50 -0.17 -0.50 -0.44
Metallic 0.07 -0.55 0.47 0.28 -0.03 0.51 0.68 -0.53 -0.48 -0.55 -0.65 -0.45 -0.38
Chemical -0.12 -0.09 0.07 0.00 -0.10 0.10 0.06 -0.13 -0.14 -0.15 -0.11 -0.14 -0.14
Astringent -0.04 -0.40 0.38 0.43 0.18 0.17 0.17 0.17 -0.08 -0.25 0.00 -0.12 -0.04

143
Table B.3 (Continued)
Pulp Size
Pulp Amo.
Tomato ID
Ripe Cooked Browned Green-Viney
Fruity Cardboard Ferment Musty/ Earthy
Overall Sweet
Sweet Sour Salty Bitter Metallic Chem. Astring.
Texture
Pulp Size
1.00
Pulp Amount 0.85 1.00
Flavor
Tomato ID
0.42 0.24 1.00
Ripeness
0.36 0.36 0.20 1.00
Cooked
0.48 0.61 0.13 0.80 1.00
Browned
0.39 0.63 -0.12 0.67 0.92 1.00
Green-Viney
-0.38 -0.62 0.10 -0.56 -0.69 -0.73 1.00
Fruity -0.10 -0.10 0.39 0.21 0.15 0.02 -0.10 1.00
Cardboard
-0.26 -0.25 -0.43 -0.13 -0.15 0.00 0.32 -0.37 1.00
Fermented -0.05 -0.03 0.03 0.57 0.55 0.51 -0.10 0.27 0.25 1.00
Musty/Earthy
0.05 -0.16 0.15 -0.12 -0.05 -0.10 0.49 -0.22 0.42 0.33 1.00
Overall Sweet 0.06 0.33 -0.04 0.27 0.37 0.49 -0.69 0.29 -0.41 0.07 -0.56 1.00
Sweet 0.04 0.38 -0.04 0.22 0.41 0.49 -0.57 0.31 -0.49 0.08 -0.55 0.78 1.00
Sour 0.22 0.45 0.12 0.42 0.48 0.47 -0.54 0.38 -0.38 0.22 -0.29 0.50 0.63 1.00
Salty 0.47 0.61 0.17 0.48 0.62 0.52 -0.71 -0.02 -0.51 -0.07 -0.38 0.50 0.57 0.48 1.00
Bitter 0.37 0.43 -0.16 0.56 0.66 0.66 -0.35 0.07 0.08 0.52 0.15 0.04 0.16 0.50 0.26 1.00
Metallic 0.62 0.73 0.18 0.54 0.68 0.58 -0.50 0.07 -0.26 0.17 -0.10 0.03 0.31 0.58 0.59 0.60 1.00
Chemical 0.02 0.10 -0.23 0.08 0.13 0.12 -0.09 -0.44 0.19 0.03 0.09 -0.10 -0.12 -0.09 0.25 0.13 0.19 1.00
Astringent 0.32 0.23 -0.01 0.39 0.33 0.31 -0.36 -0.09 0.13 0.41 0.15 0.18 -0.11 0.09 0.19 0.29 0.20 0.27 1.00
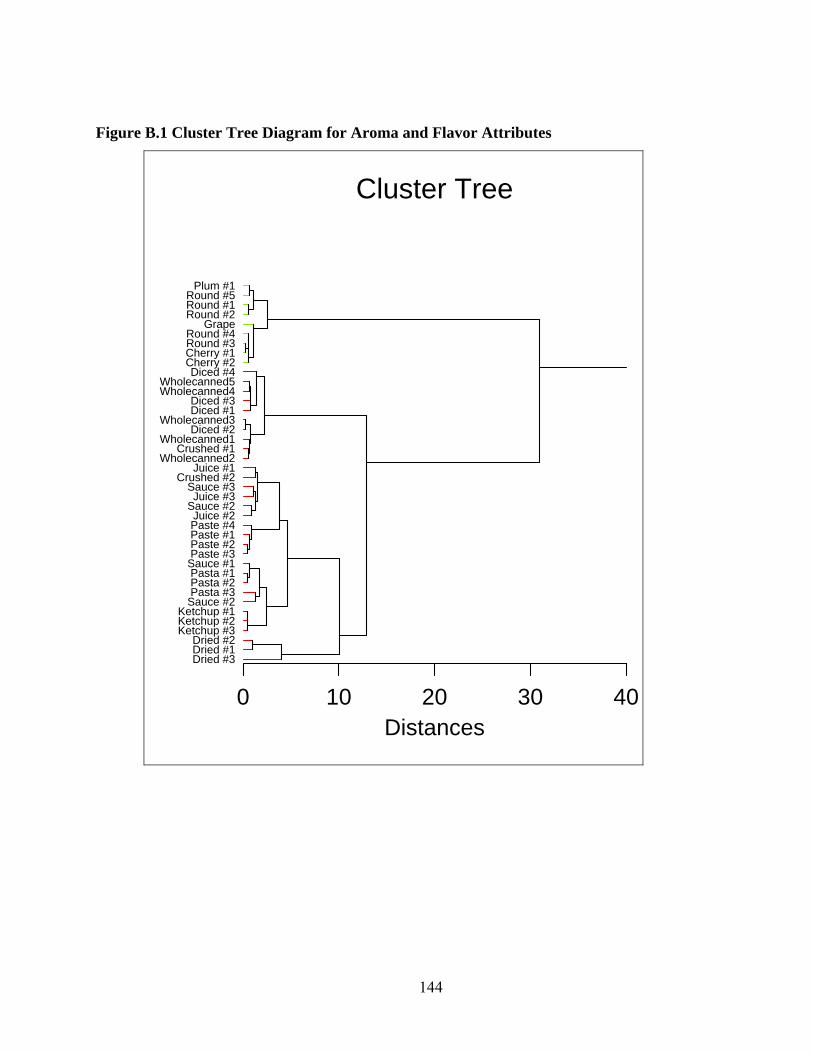
144
Figure B.1 Cluster Tree Diagram for Aroma and Flavor Attributes
Cluster Tree
0 10 20 30 40Distances
Juice #1
Sauce #1
Juice #2
Round #1
Wholecanned1
Cherry #1Cherry #2
Round #2
Wholecanned2
Sauce #2
Ketchup #1
Round #3Round #4
Grape
Diced #1Wholecanned3
Wholecanned4
Paste #1
Juice #3
Sauce #2
Crushed #1
Ketchup #2
Sauce #3Crushed #2
Paste #2Paste #3
Diced #2
Wholecanned5
Diced #3
Diced #4
Ketchup #3
Round #5Plum #1
Dried #1
Paste #4
Pasta #1
Dried #2
Dried #3
Pasta #2Pasta #3

145
Figure B.2 Cluster Tree Diagram for Texture Attributes
Cluster Tree
0 10 20 30 40 50 60 70 80Distances
Juice #1Sauce #1
Juice #2
Round #1
Wholecanned1
Cherry #1Cherry #2
Round #2
Wholecanned2
Sauce #2
Ketchup #1
Round #3
Round #4
Grape
Diced #1
Wholecanned3Wholecanned4
Paste #1
Juice #3
Sauce #2
Crushed #1
Ketchup #2
Sauce #3
Crushed #2
Paste #2Paste #3
Diced #2
Wholecanned5Diced #3
Diced #4
Ketchup #3
Round #5
Plum #1
Dried #1
Paste #4
Pasta #1
Dried #2
Dried #3
Pasta #2Pasta #3

146
Appendix C - Tomato Planting and Planning for Evaluation
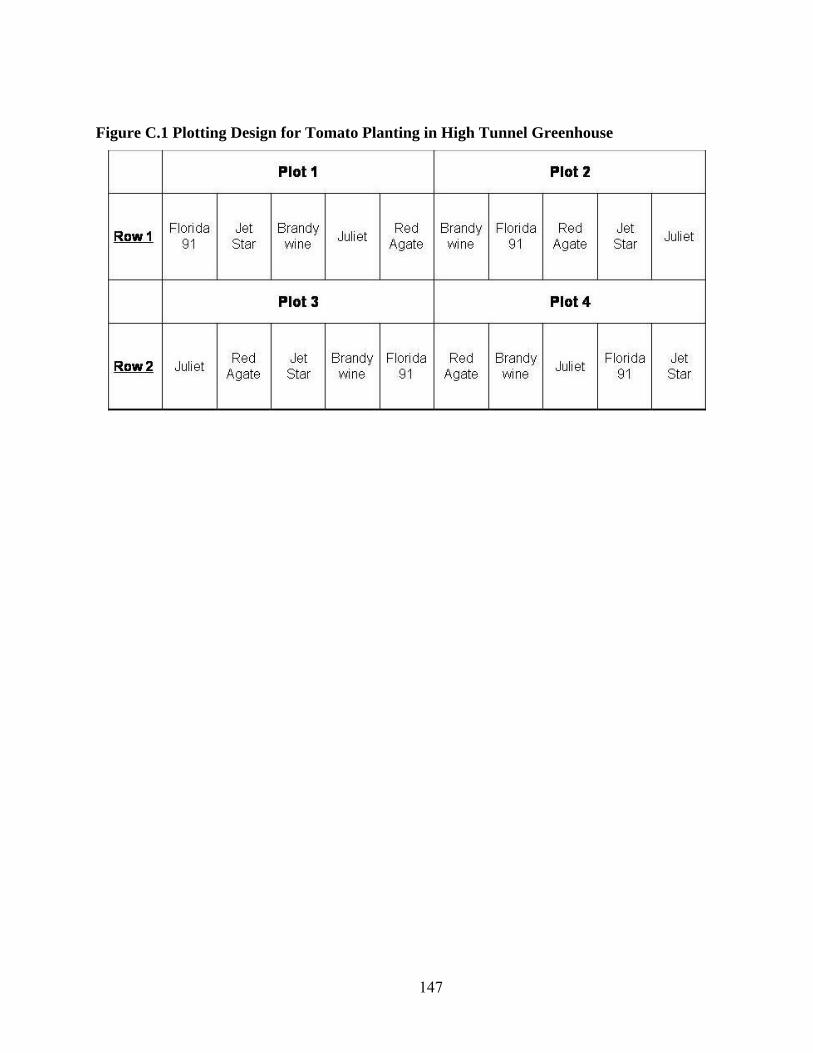
147
Figure C.1 Plotting Design for Tomato Planting in High Tunnel Greenhouse
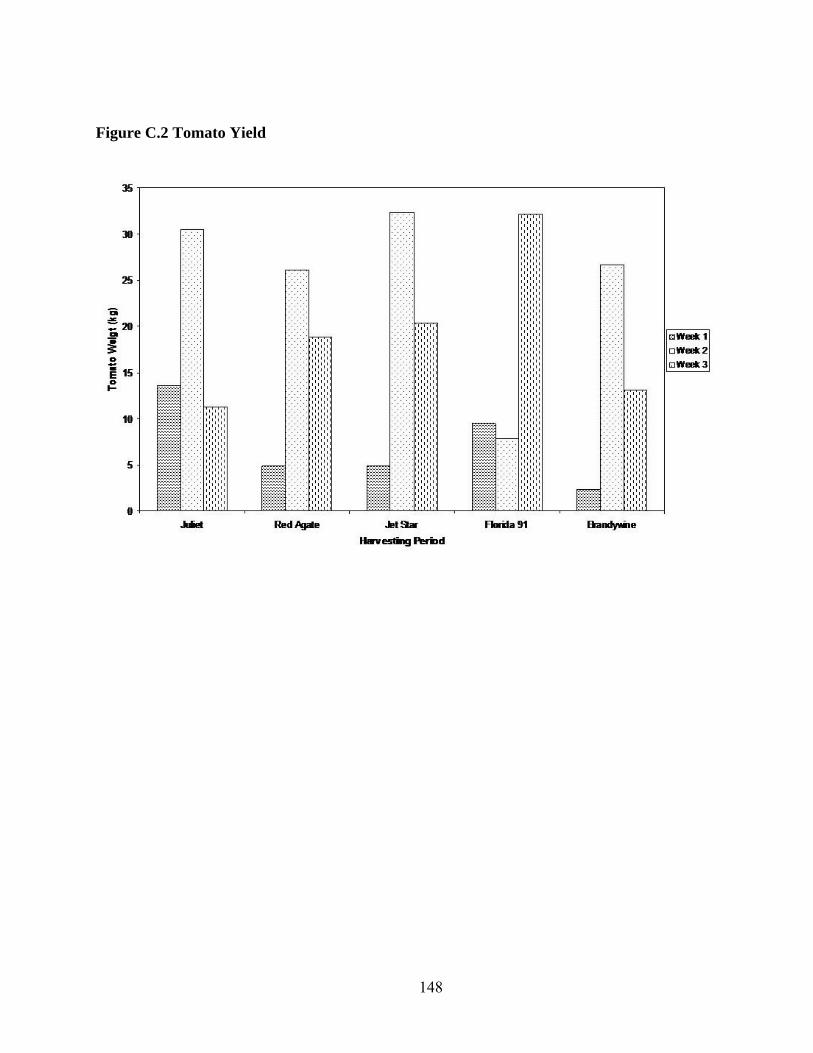
148
Figure C.2 Tomato Yield

149
Table C.1 Compositional Worksheet for pH, Total Soluble Solids and Titratable Acidity
Tomato Rep Sample pH °Brix Initial NaOH ml
read
Final NaOH ml
read
ml NaOH used
Brandywine 1
Brandywine 2
Brandywine 3
Florida 91 1
Florida 91 2
Florida 91 3
Jet Star 1
Jet Star 2
Jet Star 3
Juliet 1
Juliet 2
Juliet 3
Red Agate 1
Red Agate 2
Red Agate 3

150
Appendix D - Tomato Juice Processing Instruction

151
Ingredients
- About 2 kg (2000 g) of tomatoes - ½ tsp Pickling Salt - 1 tsp Lemon juice
1. Wash tomatoes in lukewarm water. 2. Remove stems and trim off bruised or discolored portions. 3. Cut the fruits into large pieces (~1.5” thick) and place directly in a stock pot. 4. Heat the cut tomatoes immediately to boil while crushing. 5. Then, simmer on setting 4 for 5 minutes before juicing. 6. Press heated tomatoes through a food mill to remove skins and seeds. Place the juice back
into a stock pot. 7. Heat the juice again to boiling. 8. Meanwhile, prepare the jars for canning.
a. Bring water to boil in a large pot. b. Place jars in the boiling water for 5 minutes. c. Add lemon juice and salt to the jars.
9. Fill the jars with hot tomato juice, leaving about ½ inch headspace. Adjust the metal lids. 10. Process in a boiling water canner for 35 minutes.
Tomato Juice Canning:
• Fill canner halfway with water and preheat on a gas stove to 180 ºF. • Load sealed jars onto canner rack (5 cans limit) and lower with handles into the
canner. • Make sure the water level is 1 inch above jars. Cover the canner. • Turn heat to high and bring water to boil. When water boils vigorously, lower heat to
maintain a gentle boil and process jars for the given time. Modified from “The National Center for Home Food Preservation” (http://www.uga.edu/nchfp/).

152
Appendix E - Tomato Paste Processing Instruction

153
Ingredients
- About 4 kg (4,000 g) of tomatoes - ¼ tsp Pickling Salt
1. Bring enough water (~2/3), in a stock pot, to boil. 2. Wash tomatoes with lukewarm water. 3. Dip tomatoes in boiling water for about 60 seconds (or until skins split). 4. Then, dip in cold water. Slip off skins. 5. Remove cores and chop tomatoes into pieces (~ 1.5” thick). 6. Combine tomatoes and salt in a stock pot and cook slowly on stove using setting 4 for 1
hour. 7. Press cooked tomatoes through food mill and place back in the stock pot. Continue
cooking slowly (using stove setting 3) until the product is thick enough to round up on a spoon (approximately 4 hours). Stir frequently to prevent sticking. Monitor ºBrix of the mixture using a handheld refractometer – tomato paste should contain at least 24% of tomato total soluble solids.
8. Immediately before the paste is ready, prepare glass jars for canning by: a. Bring water to boil in a large pot. b. Place jars in the boiling water for 5 minutes and remove the jars.
9. Pour boiling hot paste into hot jars, leaving about ¼ inch headspace. 10. Remove air bubbles using a spatula and adjust headspace if necessary. 11. Wipe off rims of jars with a dampened clean paper towel; adjust two-piece metal canning
lids. 12. Process in a boiling water canner for 50 minutes.
Tomato Paste Canning:
• Fill canner halfway with water and preheat on a gas stove to 180 ºF. • Load sealed jars onto canner rack (5 cans limit) and lower with handles into the
canner. • Make sure the water level is 1 inch above jars. Cover the canner. • Turn heat to high and bring water to boil. When water boils vigorously, lower heat to
maintain a gentle boil and process jars for the given time.
Modified from “The National Center for Home Food Preservation” (http://www.uga.edu/nchfp/).

154
Appendix F - SAS Code for ANOVA for pH, TSS (ºBrix) and TA
Data

155
Option ps=57 ls=95; Title 'Compositional Analysis for Raw tomatoes'; data set1; input tomato$ rep week brix pH TA; datalines; FL91 1 1 5.0 4.26 0.400 FL91 2 1 4.8 4.24 0.448 FL91 3 1 4.8 4.25 0.464 . . . ; run; proc sort data=set1; by tomato harvest; run; ********Obtain the mean table by tomato cultivars********; proc means data=set1; var brix pH TA; by tomato; output out=means1; run; ********Obtain the ANOVA for each variable********; proc mixed data=set1; class tomato; model brix = tomato; lsmeans tomato/ diff; run; proc mixed data=set1; class tomato; model pH = tomato; lsmeans tomato/ diff; run; proc mixed data=set1; class tomato; model TA = tomato; lsmeans tomato/ diff; run; quit;
156
Appendix G - SAS Code for ANOVA for Dry Matter Data

157
Option ps=57 ls=95; Title 'Dry Matter Analysis'; data set1; input tomato$ week$ dryG dry; datalines; BW wk2 12.4 6.20 BW wk1 10.3 5.15 BW wk3 12.8 6.40 … ; run; proc sort data=set1; by tomato harvest; run; proc means data=set1; var dryG dry; by tomato; output out=means1; run; proc sort; by tomato; run; proc mixed data=set1; class tomato; model dryG = tomato; lsmeans tomato/ diff; run; proc mixed data=set1; class tomato; model dry = tomato; lsmeans tomato/ diff; run;

158
Appendix H - SAS Code for ANOVA for Fresh Tomatoes

159
DM 'LOG;CLEAR;OUTPUT;CLEAR;'; options ps=65 ls=80 nodate pageno=1; options symbolgen; data step1; INPUT tomato$ week stage$ pa code IDAroma VineyA DecayVA CrbdA Firmness Juiciness Mealy Skin Seed Fiber IDFlavor Ripeness Viney Umami Fruity Crbd Fermented MustyEarthy Sweet Sour Salt Bitter Metallic Astringent; datalines;
[Data has been removed]
;
/*********Check if the data was read**********; proc print;*/ title 'Fresh Tomato Analysis'; *********Check the frequency according to the test design************; proc sort; by tomato stage; run; proc freq; tables Code Tomato week Pa; by tomato; run; *********Check Means and Standard Deviations*************; data step2; set step1; Proc sort; by tomato; proc means; var IDAroma--Astringent; by Tomato; output out=means; run; Proc sort; by tomato; proc means; var IDAroma--Astringent; by Tomato stage; output out=meanstage; run; ******* Data Analysis - ANOVA and Mean Separation (Pa treated as Random Effect) *****; proc mixed data=step1; Class tomato week pa stage; model IDAroma = tomato|week|stage/ ddfm=satterth; random pa pa*tomato pa*week pa*week*tomato pa*week*stage pa*tomato*stage; lsmeans tomato|week|stage /pdiff; run; proc mixed data=step1; Class tomato week pa stage; model VineyA = tomato|week|stage/ ddfm=satterth;

160
random pa pa*tomato pa*week pa*week*tomato pa*week*stage pa*tomato*stage; lsmeans tomato|week|stage /pdiff; run; proc mixed data=step1; Class tomato week pa stage; model CrbdA = tomato|week|stage/ ddfm=satterth; random pa pa*tomato pa*week pa*week*tomato pa*week*stage pa*tomato*stage; lsmeans tomato|week|stage /pdiff; run; proc mixed data=step1; Class tomato week pa stage; model DecayVA = tomato|week|stage/ ddfm=satterth; random pa pa*tomato pa*week pa*week*tomato pa*week*stage pa*tomato*stage; lsmeans tomato|week|stage /pdiff; run; proc mixed data=step1; Class tomato week pa stage; model Firmness = tomato|week|stage/ ddfm=satterth; random pa pa*tomato pa*week pa*week*tomato pa*week*stage pa*tomato*stage; lsmeans tomato|week|stage /pdiff; run; proc mixed data=step1; Class tomato week pa stage; model Juiciness = tomato|week|stage/ ddfm=satterth; random pa pa*tomato pa*week pa*week*tomato pa*week*stage pa*tomato*stage; lsmeans tomato|week|stage /pdiff; run; proc mixed data=step1; Class tomato week pa stage; model Mealy = tomato|week|stage/ ddfm=satterth; random pa pa*tomato pa*week pa*week*tomato pa*week*stage pa*tomato*stage; lsmeans tomato|week|stage /pdiff; run; proc mixed data=step1; Class tomato week pa stage; model Skin = tomato|week|stage/ ddfm=satterth; random pa pa*tomato pa*week pa*week*tomato pa*week*stage pa*tomato*stage; lsmeans tomato|week|stage /pdiff; run; proc mixed data=step1; Class tomato week pa stage; model Seed = tomato|week|stage/ ddfm=satterth; random pa pa*tomato pa*week pa*week*tomato pa*week*stage pa*tomato*stage; lsmeans tomato|week|stage /pdiff; run; proc mixed data=step1;

161
Class tomato week pa stage; model Fiber = tomato|week|stage/ ddfm=satterth; random pa pa*tomato pa*week pa*week*tomato pa*week*stage pa*tomato*stage; lsmeans tomato*week stage tomato*stage /pdiff; run; proc mixed data=step1; Class tomato week pa stage; model IDFlavor = tomato|week|stage/ ddfm=satterth; random pa pa*tomato pa*week pa*week*tomato pa*week*stage pa*tomato*stage; lsmeans tomato|week|stage /pdiff; run; proc mixed data=step1; Class tomato week pa stage; model Ripeness = tomato|week|stage/ ddfm=satterth; random pa pa*tomato pa*week pa*week*tomato pa*week*stage pa*tomato*stage; lsmeans tomato|week|stage /pdiff; run; proc mixed data=step1; Class tomato week pa stage; model Viney = tomato|week|stage/ ddfm=satterth; random pa pa*tomato pa*week pa*week*tomato pa*week*stage pa*tomato*stage; lsmeans tomato|week|stage /pdiff; run; proc mixed data=step1; Class tomato week pa stage; model Umami = tomato|week|stage/ ddfm=satterth; random pa pa*tomato pa*week pa*week*tomato pa*week*stage pa*tomato*stage; lsmeans tomato|week|stage /pdiff; run; proc mixed data=step1; Class tomato week pa stage; model Fruity = tomato|week|stage/ ddfm=satterth; random pa pa*tomato pa*week pa*week*tomato pa*week*stage pa*tomato*stage; lsmeans tomato|week|stage /pdiff; run; proc mixed data=step1; Class tomato week pa stage; model Crbd = tomato|week|stage/ ddfm=satterth; random pa pa*tomato pa*week pa*week*tomato pa*week*stage pa*tomato*stage; lsmeans tomato|week|stage /pdiff; run; proc mixed data=step1; Class tomato week pa stage; model Fermented = tomato|week|stage/ ddfm=satterth; random pa pa*tomato pa*week pa*week*tomato pa*week*stage pa*tomato*stage; lsmeans tomato|week|stage /pdiff;

162
run; proc mixed data=step1; Class tomato week pa stage; model MustyEarthy = tomato|week|stage/ ddfm=satterth; random pa pa*tomato pa*week pa*week*tomato pa*week*stage pa*tomato*stage; lsmeans tomato|week|stage /pdiff; run; proc mixed data=step1; Class tomato week pa stage; model Sweet = tomato|week|stage/ ddfm=satterth; random pa pa*tomato pa*week pa*week*tomato pa*week*stage pa*tomato*stage; lsmeans tomato|week|stage /pdiff; run; proc mixed data=step1; Class tomato week pa stage; model Sour = tomato|week|stage/ ddfm=satterth; random pa pa*tomato pa*week pa*week*tomato pa*week*stage pa*tomato*stage; lsmeans tomato|week|stage /pdiff; run; proc mixed data=step1; Class tomato week pa stage; model Salt = tomato|week|stage/ ddfm=satterth; random pa pa*tomato pa*week pa*week*tomato pa*week*stage pa*tomato*stage; lsmeans tomato|week|stage /pdiff; run; proc mixed data=step1; Class tomato week pa stage; model Bitter = tomato|week|stage/ ddfm=satterth; random pa pa*tomato pa*week pa*week*tomato pa*week*stage pa*tomato*stage; lsmeans tomato|week|stage /pdiff; run; proc mixed data=step1; Class tomato week pa stage; model Metallic = tomato|week|stage/ ddfm=satterth; random pa pa*tomato pa*week pa*week*tomato pa*week*stage pa*tomato*stage; lsmeans tomato|week|stage /pdiff; run; proc mixed data=step1; Class tomato week pa stage; model Astringent = tomato|week|stage/ ddfm=satterth; random pa pa*tomato pa*week pa*week*tomato pa*week*stage pa*tomato*stage; lsmeans tomato|week|stage /pdiff; run;

163
Appendix I - SAS Code for ANOVA for Tomato Juice and Paste

164
DM 'LOG;CLEAR;OUTPUT;CLEAR;'; options ps=65 ls=80 nodate pageno=1; options symbolgen; data step1; INPUT Tomato$ Week Type$ Pa$ Code IDAroma VineyA BrownedA DecayVA CrbdA Viscosity Thickness Mealy Skin Seed Fiber PulpSize PulpAmount IDFlavor Ripeness Cooked Browned Viney Umami Fruity Cardboard Fermented MustyEarthy OVSweet Sweet Sour Salt Bitter Metallic Chemical Astringent; datalines; (data has been removed) ; /*********Check if the data was read**********; title 'Tomato Juice and Paste Analysis'; *********Check the frequency according to the test design************; proc sort; by type; run; proc freq; tables Code Tomato Week Pa; by type; run; *********Check Means and Standard Deviations*************; data step2; set step1; Proc sort; by Tomato; proc means; var IDAroma--Astringent; by Tomato type; output out=means; run; *******Data Analysis - ANOVA and Mean Separation (Pa treated as a Random Effect) *****; proc mixed data=step1; Class tomato week pa; model IDAroma = tomato|week/ ddfm=satterth; random pa tomato*pa week*pa; by type; lsmeans tomato|week/pdiff; run; proc mixed data=step1; Class tomato week pa; model VineyA = tomato|week/ ddfm=satterth; random pa tomato*pa week*pa; by type; /*lsmeans tomato|rep/pdiff;*/ run;
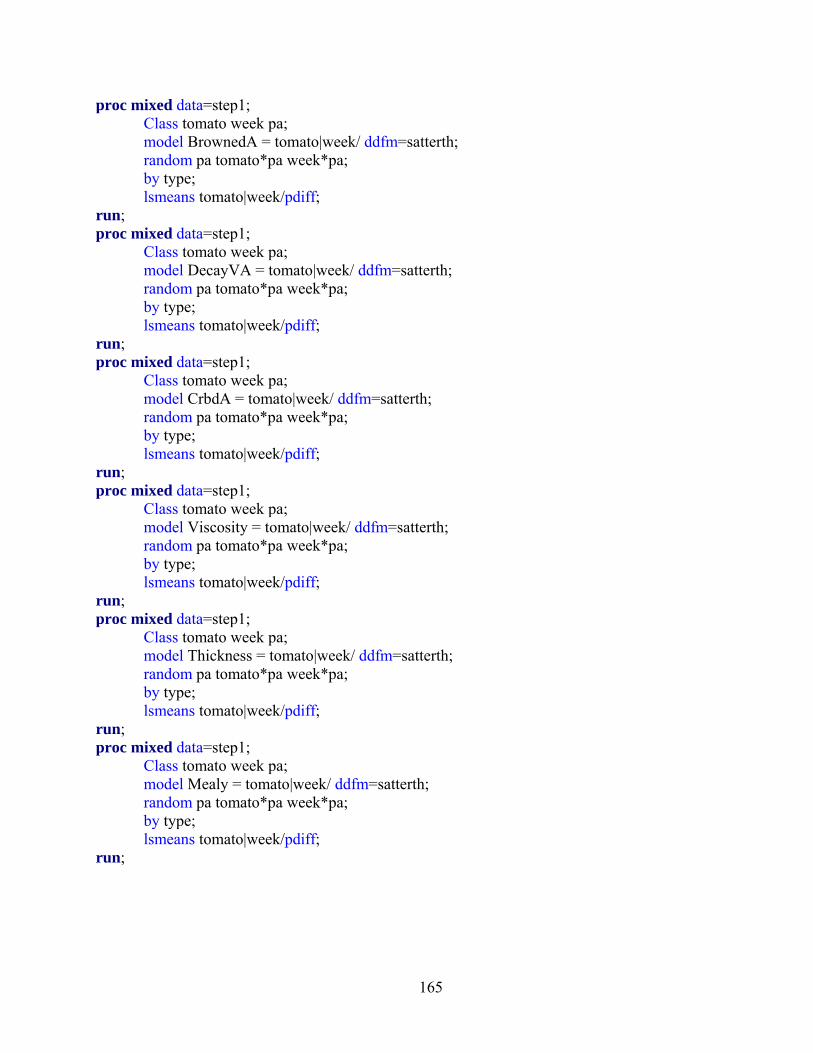
165
proc mixed data=step1; Class tomato week pa; model BrownedA = tomato|week/ ddfm=satterth; random pa tomato*pa week*pa; by type; lsmeans tomato|week/pdiff; run; proc mixed data=step1; Class tomato week pa; model DecayVA = tomato|week/ ddfm=satterth; random pa tomato*pa week*pa; by type; lsmeans tomato|week/pdiff; run; proc mixed data=step1; Class tomato week pa; model CrbdA = tomato|week/ ddfm=satterth; random pa tomato*pa week*pa; by type; lsmeans tomato|week/pdiff; run; proc mixed data=step1; Class tomato week pa; model Viscosity = tomato|week/ ddfm=satterth; random pa tomato*pa week*pa; by type; lsmeans tomato|week/pdiff; run; proc mixed data=step1; Class tomato week pa; model Thickness = tomato|week/ ddfm=satterth; random pa tomato*pa week*pa; by type; lsmeans tomato|week/pdiff; run; proc mixed data=step1; Class tomato week pa; model Mealy = tomato|week/ ddfm=satterth; random pa tomato*pa week*pa; by type; lsmeans tomato|week/pdiff; run;

166
proc mixed data=step1; Class tomato week pa; model Skin = tomato|week/ ddfm=satterth; random pa tomato*pa week*pa; by type; lsmeans tomato|week/pdiff; run; proc mixed data=step1; Class tomato week pa; model Seed = tomato|week/ ddfm=satterth; random pa tomato*pa week*pa; by type; lsmeans tomato|week/pdiff; run; proc mixed data=step1; Class tomato week pa; model Fiber = tomato|week/ ddfm=satterth; random pa tomato*pa week*pa; by type; lsmeans tomato|week/pdiff; run; proc mixed data=step1; Class tomato week pa; model PulpSize = tomato|week/ ddfm=satterth; random pa tomato*pa week*pa; by type; lsmeans tomato|week/pdiff; run; proc mixed data=step1; Class tomato week pa; model PulpAmount = tomato|week/ ddfm=satterth; random pa tomato*pa week*pa; by type; lsmeans tomato|week/pdiff; run; proc mixed data=step1; Class tomato week pa; model IDFlavor = tomato|week/ ddfm=satterth; random pa tomato*pa week*pa; by type; lsmeans tomato|week/pdiff; run;
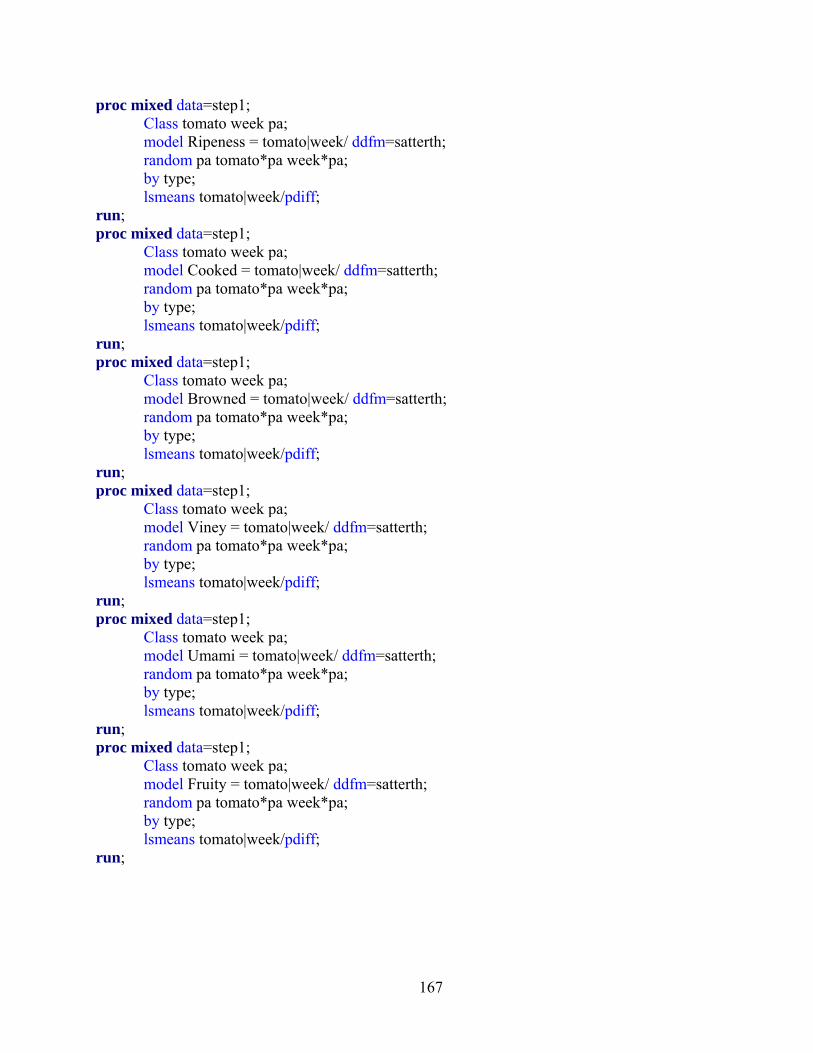
167
proc mixed data=step1; Class tomato week pa; model Ripeness = tomato|week/ ddfm=satterth; random pa tomato*pa week*pa; by type; lsmeans tomato|week/pdiff; run; proc mixed data=step1; Class tomato week pa; model Cooked = tomato|week/ ddfm=satterth; random pa tomato*pa week*pa; by type; lsmeans tomato|week/pdiff; run; proc mixed data=step1; Class tomato week pa; model Browned = tomato|week/ ddfm=satterth; random pa tomato*pa week*pa; by type; lsmeans tomato|week/pdiff; run; proc mixed data=step1; Class tomato week pa; model Viney = tomato|week/ ddfm=satterth; random pa tomato*pa week*pa; by type; lsmeans tomato|week/pdiff; run; proc mixed data=step1; Class tomato week pa; model Umami = tomato|week/ ddfm=satterth; random pa tomato*pa week*pa; by type; lsmeans tomato|week/pdiff; run; proc mixed data=step1; Class tomato week pa; model Fruity = tomato|week/ ddfm=satterth; random pa tomato*pa week*pa; by type; lsmeans tomato|week/pdiff; run;
168
proc mixed data=step1; Class tomato week pa; model Cardboard = tomato|week/ ddfm=satterth; random pa tomato*pa week*pa; by type; lsmeans tomato|week/pdiff; run; proc mixed data=step1; Class tomato week pa; model Fermented = tomato|week/ ddfm=satterth; random pa tomato*pa week*pa; by type; lsmeans tomato|week/pdiff; run; proc mixed data=step1; Class tomato week pa; model MustyEarthy = tomato|week/ ddfm=satterth; random pa tomato*pa week*pa; by type; lsmeans tomato|week/pdiff; run; proc mixed data=step1; Class tomato week pa; model OVSweet = tomato|week/ ddfm=satterth; random pa tomato*pa week*pa; by type; lsmeans tomato|week/pdiff; run; proc mixed data=step1; Class tomato week pa; model Sweet = tomato|week/ ddfm=satterth; random pa tomato*pa week*pa; by type; lsmeans tomato|week/pdiff; run; proc mixed data=step1; Class tomato week pa; model Sour = tomato|week/ ddfm=satterth; random pa tomato*pa week*pa; by type; lsmeans tomato|week/pdiff; run;
169
proc mixed data=step1; Class tomato week pa; model Salt = tomato|week/ ddfm=satterth; random pa tomato*pa week*pa; by type; lsmeans tomato|week/pdiff; run; proc mixed data=step1; Class tomato week pa; model Bitter = tomato|week/ ddfm=satterth; random pa tomato*pa week*pa; by type; lsmeans tomato|week/pdiff; run; proc mixed data=step1; Class tomato week pa; model Metallic = tomato|week/ ddfm=satterth; random pa tomato*pa week*pa; by type; lsmeans tomato|week/pdiff; run; proc mixed data=step1; Class tomato week pa; model Chemical = tomato|week/ ddfm=satterth; random pa tomato*pa week*pa; by type; lsmeans tomato|week/pdiff; run; proc mixed data=step1; Class tomato week pa; model Astringent = tomato|week/ ddfm=satterth; random pa tomato*pa week*pa; by type; lsmeans tomato|week/pdiff; run;

170
Appendix J - Additional Tomato Juice and Paste Data

171
Figure J.1 Total Soluble Solid Plot for Tomato Juice
0.0
1.0
2.0
3.0
4.0
5.0
6.0
7.0
8.0
9.0
Brandywine Florida 91 Jet Star Juliet Red Agate
Tomato Variety
Tota
l Sol
uble
Sol
ids
(ºB
rix)

172
Figure J.2 Total Soluble Solid Plot for Tomato Paste
0.0
5.0
10.0
15.0
20.0
25.0
30.0
35.0
Florida 91 Jet Star Juliet Red Agate
Tomato Variety
Tota
l Sol
uble
Sol
ids
(ºB
rix)

173
Appendix K - Code of Federal Regulations for Tomato Juice

174
(a) Identity--(1) Definition. tomato juice is the food intended for direct consumption, obtained
from the unfermented liquid extracted from mature tomatoes of the red or reddish varieties of
Lycopersicum esculentum P. Mill, with or without scalding followed by draining. In the
extraction of such liquid, heat may be applied by any method which does not add water thereto.
Such juice is strained free from peel, seeds, and other coarse or hard substances, but contains
finely divided insoluble solids from the flesh of the tomato in accordance with current good
manufacturing practice. Such juice may be homogenized, may be seasoned with salt, and may be
acidified with any safe and suitable organic acid. The juice may have been concentrated and later
reconstituted with water and/or tomato juice to a tomato soluble solids content of not less than
5.0 percent by weight as determined by the method prescribed in 156.3(b). The food is preserved
by heat sterilization (canning), refrigeration, or freezing. When sealed in a container to be held at
ambient temperatures, it is so processed by heat, before or after sealing, as to prevent spoilage.
(2) Labeling. (i) The name of the food is:
(a) "Tomato juice" if it is prepared from unconcentrated undiluted liquid extracted from mature
tomatoes of reddish varieties.
(b) "Tomato juice from concentrate" if the finished juice has been prepared from concentrated
tomato juice as specified in paragraph (a)(1) of this section or if the finished juice is a mixture
of tomato juice and tomato juice from concentrate.
(ii) Label declaration. Each of the ingredients used in the food shall be declared on the label as
required by the applicable sections of parts 101 and 130 of this chapter.
(b) Quality. (1) The standard of quality for tomato juice is as follows:
(i) The strength and redness of color is not less than the composite color produced by
spinning the Munsell color discs in the following combination: 53 percent of the area of Disc 1;
28 percent of the area of Disc 2; and 19 percent of the area of either Disc 3 or Disc 4; or 9 1/2
percent of the area of Disc 3 and 9 1/2 percent of the area of Disc 4, whichever most nearly
matches the appearance of the tomato juice.
(ii) Not more than two defects for peel and blemishes, either singly or in combination, in addition
to three defects for seeds or pieces of seeds, defined as follows, per 500 milliliters (16.9 fluid
ounces):
(a) Pieces of peel 3.2 millimeters (0.125 inch) or greater in length.
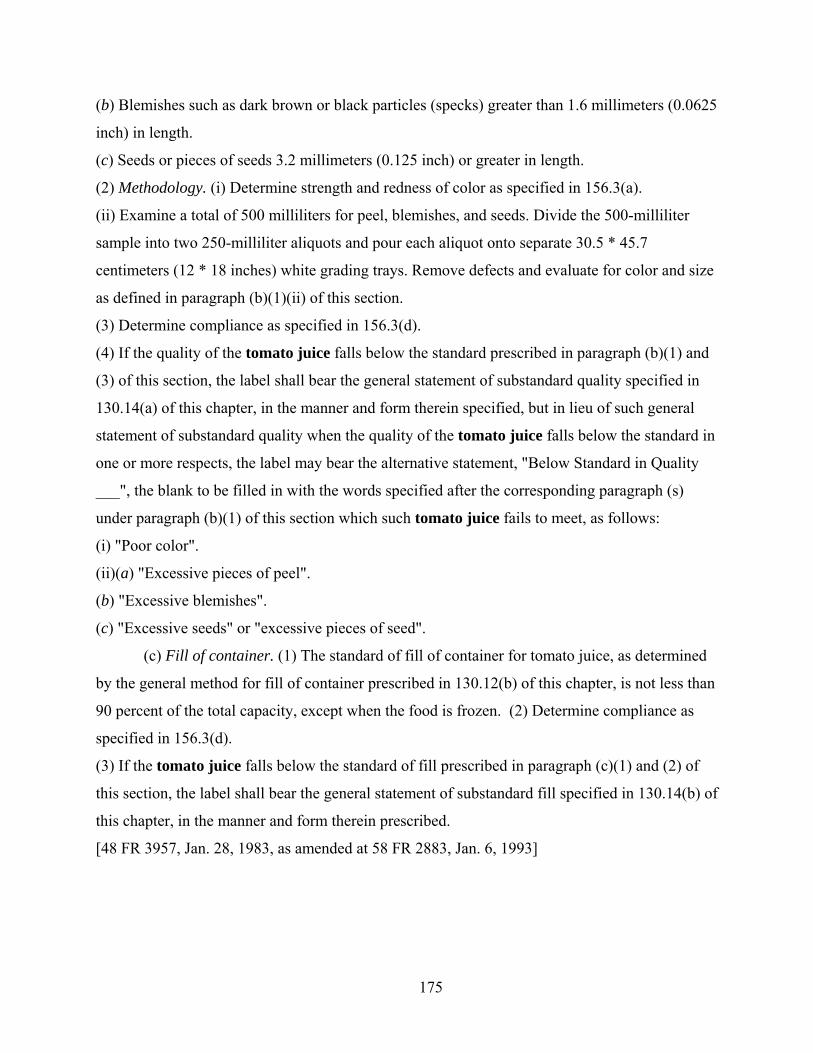
175
(b) Blemishes such as dark brown or black particles (specks) greater than 1.6 millimeters (0.0625
inch) in length.
(c) Seeds or pieces of seeds 3.2 millimeters (0.125 inch) or greater in length.
(2) Methodology. (i) Determine strength and redness of color as specified in 156.3(a).
(ii) Examine a total of 500 milliliters for peel, blemishes, and seeds. Divide the 500-milliliter
sample into two 250-milliliter aliquots and pour each aliquot onto separate 30.5 * 45.7
centimeters (12 * 18 inches) white grading trays. Remove defects and evaluate for color and size
as defined in paragraph (b)(1)(ii) of this section.
(3) Determine compliance as specified in 156.3(d).
(4) If the quality of the tomato juice falls below the standard prescribed in paragraph (b)(1) and
(3) of this section, the label shall bear the general statement of substandard quality specified in
130.14(a) of this chapter, in the manner and form therein specified, but in lieu of such general
statement of substandard quality when the quality of the tomato juice falls below the standard in
one or more respects, the label may bear the alternative statement, "Below Standard in Quality
___", the blank to be filled in with the words specified after the corresponding paragraph (s)
under paragraph (b)(1) of this section which such tomato juice fails to meet, as follows:
(i) "Poor color".
(ii)(a) "Excessive pieces of peel".
(b) "Excessive blemishes".
(c) "Excessive seeds" or "excessive pieces of seed".
(c) Fill of container. (1) The standard of fill of container for tomato juice, as determined
by the general method for fill of container prescribed in 130.12(b) of this chapter, is not less than
90 percent of the total capacity, except when the food is frozen. (2) Determine compliance as
specified in 156.3(d).
(3) If the tomato juice falls below the standard of fill prescribed in paragraph (c)(1) and (2) of
this section, the label shall bear the general statement of substandard fill specified in 130.14(b) of
this chapter, in the manner and form therein prescribed.
[48 FR 3957, Jan. 28, 1983, as amended at 58 FR 2883, Jan. 6, 1993]
176
Appendix L - Code of Federal Regulations for Tomato Paste

177
(a) Identity--(1) Definition. Tomato concentrates are the class of foods each of which is prepared
by concentrating one or any combination of two or more of the following optional tomato
ingredients:
(i) The liquid obtained from mature tomatoes of the red or reddish varieties (Lycopersicum
esculentum P. Mill).
(ii) The liquid obtained from the residue from preparing such tomatoes for canning, consisting of
peelings and cores with or without such tomatoes or pieces thereof.
(iii) The liquid obtained from the residue from partial extraction of juice from such tomatoes.
Such liquid is obtained by so straining the tomatoes, with or without heating, as to
exclude skins (peel), seeds, and other coarse or hard substances in accordance with good
manufacturing practice. Prior to straining, food-grade hydrochloric acid may be added to the
tomato material in an amount to obtain a pH no lower than 2.0. Such acid is then neutralized with
food-grade sodium hydroxide so that the treated tomato material is restored to a pH of 4.2+/-0.2.
Water may be addedto adjust the final composition. The food contains not less than 8.0 percent
tomato soluble solids as defined in 155.3(e). The food is preserved by heat sterilization
(canning), refrigeration, or freezing. When sealed in a container to be held at ambient
temperatures, it is so processed by heat, before or after sealing, as to prevent spoilage.
(2) Optional ingredients. One or any combination of two or more of the following safe and
suitable ingredients may be used in the foods:
(i) Salt (sodium chloride formed during acid neutralization shall be considered added salt).
(ii) Lemon juice, concentrated lemon juice, or organic acids.
(iii) Sodium bicarbonate.
(iv) Water, as provided for in paragraph (a)(1) of this section.
(v) Spices.
(vi) Flavoring.
(3) Labeling. (i) The name of the food is:
(a) "Tomato puree" or "tomato pulp" if the food contains not less than 8.0 percent but less than
24.0 percent tomato soluble solids.
(b) "Tomato paste" if the food contains not less than 24.0 percent tomato soluble solids.

178
(c) The name "tomato concentrate" may be used in lieu of the name "tomato puree," "tomato
pulp," or "tomato paste" whenever the concentrate complies with the requirements of such foods;
except that the label shall bear the statement "for remanufacturing purposes only" when the
concentrate is packaged in No. 10 containers (3.1 kilograms or 109 avoirdupois ounces total
water capacity) or containers that are smaller in size.
(d) "Concentrated tomato juice" if the food is prepared from the optional tomato ingredient
described in paragraph (a)(1)(i) of this section and is of such concentration that upon diluting the
food according to label directions as set forth in paragraph (a)(3)(iii) of this section, the diluted
article will contain not less than 5.0 percent by weight tomato soluble solids.
(ii) The following shall be included as part of the name or in close proximity to the name of the
food:
(a) The statement "Made from" or "Made in part from," as the case may be, "residual tomato
material from canning" if the optional tomato ingredient specified in paragraph (a)(1)(ii) of this
section is present.
(b) The statement "Made from" or "Made in part from," as the case may be, "residual
tomato material from partial extraction of juice" if the optional tomato ingredient specified in
paragraph (a)(1)(iii) of this section is present.
(c) A declaration of any flavoring that characterizes the product as specified in 101.22 of this
chapter and a declaration of any spice that characterizes the product, e.g., "Seasoned with ___,"
the blank to be filled in with the words "added spice" or, in lieu of the word "spice," the common
name of the spice.
(iii) The label of concentrated tomato juice shall bear adequate directions for dilution to result in
a diluted article containing not less than 5.0 percent by weight tomato soluble solids; except that
alternative methods may be used to convey adequate dilution directions for containers that are
larger than No. 10 containers (3.1 kilograms or 109 avoirdupois ounces total water capacity).
(iv) Label declaration. Each of the ingredients used in the food shall be declared on the label as
required by the applicable sections of parts 101 and 130 of this chapter; except that water need
not be declared in the ingredient statement when added to adjust the tomato soluble solids
content of tomato concentrates within the range of soluble solids levels permitted for these foods.
179
(v) Determine percent tomato soluble solids as specified in 155.3(e). Determine compliance as
specified in 155.3(b). A lot shall be deemed to be in compliance for tomato soluble solids as
follows:
(a) The sample average meets or exceeds the required minimum.
(b) The number of sample units that are more than 1 percent tomato soluble solids below the
minimum required does not exceed the acceptance number in the sampling plans set forth in
155.3(c)(2).
(b) Quality. (1) The standard of quality for tomato concentrate (except for concentrated tomato
juice, which when diluted to 5.0 percent tomato soluble solids shall conform to the standard of
quality for tomato juice set forth in 156.145 of this chapter) is as follows:
(i) The strength and redness of color of the food, when diluted with water (if necessary) to 8.1+/-
0.1 percent tomato soluble solids is not less than the composite color produced by spinning the
Munsell color discs in the following combination:
53 percent of the area of Disc 1;
28 percent of the area of Disc 2; and
19 percent of the area of either Disc 3 or Disc 4; or
9 1/2 percent of the area of Disc 3 and 9 1/2 percent of the area of Disc 4, whichever most nearly
matches the appearance of the sample.
(ii) Not more than one whole seed per 600 grams (21 ounces).
(iii) Not more than 36 of the following defects, either singly or in combination, per 100
grams (3.5 ounces) of the product when diluted with water to 8.1+/-0.1 percent tomato soluble
solids:
(a) Pieces of peel 5 millimeters (0.20 inch) or greater in length (without unrolling).
(b) Pieces of seed (seed particles) 1 millimeter (0.039 inch) or greater in length.
(c) Blemishes, such as dark brown or black particles (specks)--not more than four exceed 1.6
millimeters (0.0625 inch) in length of which not more than one exceeds 3.2 millimeters (0.125
inch) and none exceed 6.4 millimeters (0.25 inch).
(2) Methodology. Dilute with water, if necessary, to 8.1+/-0.1 percent tomato soluble solids. (i)
Determine strength and redness of color as prescribed in 155.3(d).
(ii) Whole seeds--Weigh out 600 grams (21 ounces) of the well-mixed, diluted concentrate; place
a U.S. No. 12 screen (1.68 millimeters (0.066 inch) openings) over the sink drain; transfer the

180
product sample onto the screen; rinse container thoroughly with water and pour through screen;
flush sample through screen by using an adequate spray of water; check screen for whole seeds;
apply the appropriate allowance.
(iii) Peel, pieces of seed, and blemishes--Spread the prepared concentrate evenly on a large white
tray and remove the individual defects, identify, classify, and measure.
(3) Sampling and acceptance. Determine compliance as specified in 155.3(b).
(4) If the quality of the tomato concentrate falls below the standard prescribed in paragraph (b)
(1) and (3) of this section, the label shall bear the general statement of substandard quality
specified in 130.14(a) of this chapter, in the manner and form therein specified, but in lieu of
such general statement of substandard quality when the quality of the tomato concentrate falls
below the standard in one or more respects, the label may bear the alternative statement, "Below
Standard in Quality ___," the blank to be filled in with the words specified after the
corresponding paragraph(s) under paragraph (b)(1) of this section which such tomato concentrate
fails to meet, as follows:
(i) "Poor color."
(ii) "Excessive seeds."
(iii)(a) "Excessive pieces of peel."
(b) "Excessive pieces of seed."
(c) "Excessive blemishes."
(c) Fill of container. (1) The standard of fill of container for tomato concentrate, as
determined by the general method for fill of container prescribed in 130.12(b) of this chapter, is
not less than 90 percent of the total capacity, except when the food is frozen.
(2) Determine compliance as specified in 155.3(b).
(3) If the tomato concentrate falls below the standard of fill prescribed in paragraph (c) (1) and
(2) of this section, the label shall bear the general statement of substandard fill specified in
130.14(b) of this chapter, in the manner and form therein prescribed.
[48 FR 3954, Jan. 28, 1983, as amended at 49 FR 15073, Apr. 17, 1984; 58 FR 2883, Jan. 6,
1993; 58 FR 17104, Apr. 1, 1993]