Embed Size (px)
Citation preview

26 YEARS LATER
VariationUnderstanding
IN 1931, Walter Shewhart published his landmark book Economic
Control of Quality of Manufactured Product. He asserted that his theory
and methods were an innovation to the science of management and wrote:
“We are sold on the idea of applying scientific principles. However, a change
is coming about in the principles themselves, and this change gives us a new
concept of control.”1
W. Edwards Deming supported this idea in a foreword he wrote for the
1986 republishing of Shewhart’s Statistical Method From the Viewpoint of
Quality Control: “Another half-century may pass before the full spectrum of
Dr. Shewhart’s contributions has been revealed in liberal education, science
and industry.”2
In 1990, QP published “Understanding Variation” by two of this article’s
authors.3 The article included examples of the economic and psychological
losses associated with interpretations of data without a framework for un-
derstanding variation. The economic losses included misguided changes to
service delivery, investigations of trends where none existed and increased
costs from increased variation. The psychological losses included blaming
workers for what were actually faults of the system and experiencing anxi-
ety from false hopes of improved operating conditions.
Reprinted with permission from Quality Progress, © 2016 ASQ, www.asq.org. No further distribution allowed without permission.

by Thomas Nolan, Rocco J. Perla and Lloyd Provost
In 50 Words Or Less • Decisions made without
knowledge of common and special causes often lead to increased variation, poor perfor-mance and misattrib-uted credit or blame.
• Extending the ap-plication of Walter Shewhart’s approach to variation to datasets across a range of pub-licly available sources is an opportunity to improve decision mak-ing and learning from reported data.
November 2016 • QP 29
26 YEARS LATER
Correctly assessing variation is fundamental to sound decisions Variation
DATA ANALYSISReprinted with permission from Quality Progress, © 2016 ASQ, www.asq.org. No further distribution allowed without permission.

QP • www.qualityprogress.com30
Today, 26 years later, big data analytics, data-driven
decision making, business intelligence and transparency
in public data have created new opportunities for an un-
derstanding of variation to guide decision making. The
U.S. Bureau of Labor Statistics, for example, is the prin-
cipal federal agency responsible for measuring labor-
market activity, working conditions and pricing changes
in the economy. Its mission statement emphasizes the
collection, analysis and dissemination of “information
to support public and private decision making.”4 Without
useful interpretation, however, this dissemination could
actually degrade decision making.
We want to extend the application of Shewhart’s
methods presented in our 1990 article to data sets across
a range of publicly available sources—sources that are
used by and the basis for the U.S. government and other
organizations to assess conditions and make decisions.
Compared with data from individual organizations, the
scale of these data sets underscores the importance of
understanding and applying Shewhart’s theory.
Shewhart’s theory of variationShewhart’s theory of variation differentiated between
common and special causes of variation in data:
• Common causes—Those causes that are inherent
in a system (process or product) over time, affect
everyone working in the system and affect all
outcomes of the system.
• Special causes—Those causes that are not always
part of a system (process or product) or do not affect
everyone, but arise because of specific circumstances.5
A process or system that has only common causes
affecting the measurement of interest is called a stable
process. A stable process is one in which the cause sys-
tem for the measure of interest remains essentially con-
stant over time. A stable process implies only that the
variation in outcomes is predictable within limits, not
that it has desirable or undesirable performance.
A process with outcomes affected by common and
special causes is called an unstable process for the mea-
sure of interest, with the magnitude of the variation from
one time period to the next being unpredictable. As spe-
cial causes are identified and appropriately acted on, the
process becomes stable.6
This theory of variation provides a basis for action to
improve a system. A stable system requires a fundamen-
tal change to affect its future performance (because it is
stable), while an unstable system requires local action
depending on the special cause.
In addition to providing the basic concepts of the the-
ory, Shewhart also introduced the control chart method
to determine whether variation in a process is due to
common or special causes. The Shewhart control chart
consists of three lines and points plotted on a graph.
Shewhart control chart example for an economic measurement / FIGURE 1
1996
Q1
Q3
1997
Q1
Q3
1998
Q1
Q3
1999
Q1
Q3
2000
Q1
Q3
2001
Q1
Q3
2002
Q1
Q3
2003
Q1
Q3
2004
Q1
Q3
2005
Q1
Q3
2006
Q1
Q3
2007
Q1
Q3
2008
Q1
Q3
2009
Q1
Q3
2010
Q1
Q3
2011
Q1
Q3
2012
Q1
Q3
2013
Q1
Q3
2014
Q1
Q3
2015
Q1
2016
Q1
Q3
2017
Q1
Q3
-10
-8
-6
-4
-2
0
2
4
6
8
12
10
MeasureGross domestic product percent change (basis in 2009 U.S. dollars)
LCL
UCL
-3.0
2.01.2
7.1
1.7
4.6
UCL = upper control limit LCL = lower control limit
Reprinted with permission from Quality Progress, © 2016 ASQ, www.asq.org. No further distribution allowed without permission.

November 2016 • QP 31
While there are numerous books describing how
to construct Shewhart’s charts, we will focus on
the broader method and its modern applications.7
Shewhart control chart methodFigure 1 shows an example of a Shewhart control
chart for a popular federal economic measure-
ment—the quarterly change in gross domestic
product (GDP). This measurement is usually pre-
sented in published reports and on the U.S. Depart-
ment of Commerce’s website.8 Business media re-
port reactions when the quarterly value is released
or revised. For example, the Wall Street Journal
used the headline “U.S. GDP Grew a Disappointing
1.2% in Second Quarter” for an article that offered
this summary of 2016’s second quarter:
Declining business investment is hobbling an al-
ready sluggish U.S. expansion, raising concerns
about the economy’s durability as the presiden-
tial campaign heads into its final stretch. Gross
domestic product, the broadest measure of goods
and services produced across the U.S., grew at a
seasonally and inflation adjusted annual rate of
just 1.2% in the second quarter, the Commerce De-
partment said Friday, well below the pace econo-
mists expected.9
Each quarter is treated as a special event. For
example, the Wall Street Journal recently pub-
lished these headlines for three sequential quar-
ters:
1. “U.S. Economy Shows Signs of Gearing
Up”—reporting on 2013’s fourth quarter in which
there was a 3.5% increase in GDP.10
2. “U.S. Economy Shrinks by Most in Five Years”—
reporting on 2014’s first quarter in which there was a
2.1% decrease in GDP.11
3. “Growth Rebound Stokes Fed Debate”—report-
ing on 2014’s second quarter in which there was a 4%
increase in GDP.12
These reports clearly suggest big, quarter-to-quarter
swings in our economy as if they confer actionable in-
formation. The Shewhart chart in Figure 1, however, in-
dicates a stable system for the previous five years. The
economic losses associated with the misinterpreted vari-
ation in quarter-to-quarter data include the consequenc-
es of actions taken by individuals and institutions based
on nonexistent trends such as potentially raising or
lowering the U.S. interest rate, which carries profound
economic implications for global markets as well as the
United States. Applying the Shewhart chart method can
minimize these losses.
The method’s five key components are:
1. A selection of a measurement and statistic to be
plotted. The choice of measurement will give differ-
ent insights about a process or system. In the GDP ex-
ample, the key statistic reported was the change (per-
centage difference from the previous quarter) in GDP.
2. A method of data collection from the process
or system—observation, measurement and
sampling procedures. These methods provide an
operational definition for the measurement, and
information in the Shewhart chart always will be
conditional on how data are collected and a mea-
surement is obtained. The U.S. Department of Com-
merce’s website offers an extensive explanation
DATA ANALYSIS
Nursing facility residents with one or more falls with major injury / FIGURE 2
2005
Q1
Q2
Q3
Q4
2006
Q1
Q2
Q3
Q4
2007
Q1
Q2
Q3
Q4
2008
Q1
Q2
Q3
Q4
2009
Q1
Q2
Q3
Q4
2010
Q1
Q2
Q3
20%
15%
10%
5%
0%
Source: U.S. Department of Health and Human Services, “Health System Measurement Project,” https://healthmeasures.aspe.hhs.gov.
Nursing facility residents with one or more falls with major injury (Shewhart chart) / FIGURE 3
2005
Q1
Q2
Q3
Q4
2006
Q1
Q2
Q3
Q4
2007
Q1
Q2
Q3
Q4
2008
Q1
Q2
Q3
Q4
2009
Q1
Q2
Q3
Q4
2010
Q1
Q2
Q3
14.2%
14.4%
14.6%
14.8%
15.0%
15.2%
15.4%
LCL
UCL
UCL = upper control limit LCL = lower control limit
Reprinted with permission from Quality Progress, © 2016 ASQ, www.asq.org. No further distribution allowed without permission.

QP • www.qualityprogress.com32
about how GDP data are collected.13
3. A strategy for determining subgroups of mea-
surements, including size and frequency. The aim
of rational subgrouping is to include only common
causes of variation in a subgroup, with all special
causes of variation occurring between subgroups. The
most common method to obtain rational subgroups is
to hold time constant within a subgroup (that is, to
include data from the same week, month or quarter).
Other subgrouping strategies can be used to test theo-
ries about potential causes of variation, such as sub-
grouping by demographics.
4. A calculation of the center line and limits that
provide criteria for identifying a sign of a spe-
cial cause. The center line is the average of the in-
dividual data points and the limits are based on sta-
tistical calculations of common cause variation that
establish the upper and lower bounds of system
performance. Shewhart’s method is empirical and
designed to minimize the risk of over and under-
reacting to the data. “An assignable [special] cause
of variation, as this term is used in quality control
work, is one that can be found by experiment with-
out costing more than it is worth to find it.”14 In oth-
er words, if it costs more to find the problem than
the value in addressing it, that is not economical.
In most applications, for points that fall outside of
Shewhart’s three-sigma limits, it will be cost effective
to search for a specific cause or to design a test
to understand it. For the GDP chart in Figure
1 (p. 30), the fourth quarter of 2008 and the
first quarter of 2009 are below the lower limit.
All the other values are inside the limits of the
chart. When the initial chart was constructed
using all the data points, there are some other
indications of additional special causes. There
were, for example, 19 consecutive quarters
above the center line from 1996 through the
fourth quarter of 1999. The limits in Figure 1
have been calculated for three time periods to
reflect these patterns.
5. A plan to address the special causes,
which uses the new knowledge to improve
the system. The goal of the chart is not to just
detect special causes but to identify the cause
and gain insights into the causal system affect-
ing the measurement. A discussion about signs
of a special cause on the GDP chart in Figure 1
would be instructive reading on the Commerce
Department’s website and in business journals.
Currently, because each reported value is
already explained in detail, there is no analysis
done for the quarters that represent signs of
special cause. This is a waste of potential new
knowledge and a potential loss for those who
assume the point-by-point explanations are in-
formative.
Case studies using government dataWe applied Shewhart control charts to data that
are publicly reported to inform interested parties
about various systems’ performances. For each of
Nursing facility residents with one or more falls with major injury (including pre and postshift phases) / FIGURE 4
2005
Q1
Q2
Q3
Q4
2006
Q1
Q2
Q3
Q4
2007
Q1
Q2
Q3
Q4
2008
Q1
Q2
Q3
Q4
2009
Q1
Q2
Q3
Q4
2010
Q1
Q2
Q3
14.2%
14.4%
14.6%
14.8%
15.0%
15.2%
15.4%
15.6%
LCL
UCL
UCL = upper control limit LCL = lower control limit
Number of fatal work injuries by state (2012) / FIGURE 5
WA67
OR43
CA375
MS63
TN 101
IL146
IN115
KY91
OH161
PA194
NY202
VT11
NH14
MA 44RI 8
CT 36NJ 92
DE 14MD 72DC 11
ME19
WV49 VA
149NC146
SC63GA
101
FL218
AL84
WI114 MI
137
MN70
IA97
MO88
AR63
LA116
TX536
OK97
KS76
NE48
SD31
ND65
AZ60
UT39
ID19
MT34
WY35
CO82
No change in 2012Decreased in 2012Increased in 2012
NM39
AK31
HI20
NV42
Reprinted with permission from Quality Progress, © 2016 ASQ, www.asq.org. No further distribution allowed without permission.

November 2016 • QP 33
these three cases, Shewhart charts are developed, and
two questions are asked:
1. Is the process currently stable? That is, are there spe-
cial causes we can learn from?
2. Based on this knowledge, what type of action makes
sense?
Case one—U.S. Department of Health and Hu-
man Services (falls with injury):15 The U.S. Centers
for Disease Control and Prevention estimates about
1,800 older adults living in nursing homes die each year
from fall-related injuries, and many more suffer perma-
nent disabilities.
Figure 2 (p. 31) shows a graph available through the
U.S. Department Health and Human Services that repre-
sents the national percentage of nursing home residents
who had one or more falls with a major injury. A final ana-
lytic report summarizing more recent data for the Centers
for Medicare and Medicaid Services in 2011 concluded
DATA ANALYSIS
Fatal work injury rate by state (2013) / FIGURE 6
WY VT
D.C
.N
D AK
SD DE
MT RI NH
ME HI
ID WV
NE
NM NV KS UT
AR
MS IO CT
OK
OR KT LA SC AL
CO
MN WI
MD
MO TE IN AZ
MA
WA
VA NJ
NC MI
GA
OH PA IL FL NY TX CA
8
7
6
5
4
3
2
1
0
State (ordered by size of population)
Nu
mb
er o
f fa
tal w
ork
inju
ries
per
100
,000
peo
ple
LCL
UCL
UCL = upper control limit LCL = lower control limit Source: U.S. Bureau of Labor Statistics
ADDITIONAL CASE STUDIES ON VARIATION SOUGHTThe authors presented four examples of pub-
licly reported data in which using Shewhart’s
theory and method would lead to better
reporting and decision making. They are
seeking to increase their number of examples
to help build the case for broad adoption of
Shewhart’s method.
The authors ask that you send them inter-
esting examples that illustrate how appropri-
ately using Shewhart’s method would lead to
more effective learning and better decision
making. They have four recommendations for
obtaining a better return on the substantial
investment in public and private data systems
by using this method:
1. Make data available over time. Any ef-
fective analytic strategy must allow users
to understand variation in the systems they
are responsible for over time to gain new
knowledge as conditions change, and as
new programs and initiatives are attempted.
Move away from judging or defining a system
or results of improvement efforts or policy
decisions based on single data points.
2. Provide data in formats that allow for
construction of Shewhart charts. The
data should be made available in formats
that allow Shewhart charts to be easily con-
structed—even if automated chart genera-
tion is not possible. For many current data
reports, it is either not possible or it takes
considerable effort to acquire data needed
to construct a Shewhart chart.
3. Determine whether a process is stable.
Always ask one simple question when mak-
ing an important decision based on data:
Is the process stable over time? Because
we live in an era of accountability, there is
intense pressure to demonstrate positive
results. Yet, decisions we make on variation
from one time period to another, often lead
to increased variation, poor performance,
failure to learn, and misattribution of credit
and blame.
4. Think carefully and creatively about how
to stratify data. Always consider approach-
es to segment and stratify data that are
being presented to inform the public. This
increases our ability to learn about the effect
of context on variation in the system and
understand the impact of changes made to
the system over time and whom they affect.
To submit your case study, email Lloyd Pro-
vost at [email protected].—T.N., R.P. and L.P.
Reprinted with permission from Quality Progress, © 2016 ASQ, www.asq.org. No further distribution allowed without permission.

QP • www.qualityprogress.com34
that “when taking this scale of scored values into account
… it is easy to see that they are not changing very much
from quarter to quarter” with no reference to a previous
upward shift in falls with major injury.16
Viewing this data on a Shewhart chart, however, a dif-
ferent conclusion is reached (see Figure 3, p. 31). The
upward shift in falls with major injuries begins around
the fourth quarter of 2007. We can separate the phases of
data (pre and postshift) to gain a better understanding of
what’s going on.
Figure 4 (p. 32) shows the same chart, but with
the center line and limits calculated separately for
pre and postshift phases. What we learn from this
analytic process is that the rate of falls with major
injury fundamentally changed for the worse.
Next, we need to answer case one’s two pri-
mary questions:
1. Is the process currently stable? A special
cause began around 2007’s fourth quarter. After
updating the limits to reflect this change, the
harm over time is stable, and we can predict
that the percentage of residents with falls will
be 14.9 to 15.4% each quarter.
2. Based on this knowledge, what type of ac-
tion makes sense? Using the Shewhart chart
method, we observed a national increase of
0.5% (3.4% relative increase) resulting in nine
additional expected deaths per year and many
disabilities. Why did this increase occur, and
what we can learn from it? Identifying the spe-
cial cause could serve as a productive topic of
conversation between the executive branch
and the legislative oversight committee.
Case two—U.S. Department of Labor
(work fatalities):17 The Bureau of Labor Statis-
tics (BLS) publishes an annual color-coded map
relating to fatal work injuries (see Figure 5, p. 32).
The colors show whether a state’s number of fa-
tal work injuries increased (yellow), decreased
(blue) or stayed the same (gray) from the previ-
ous year.
In 2012, North Dakota and Minnesota expe-
rienced an increase in work fatalities. In 2011,
North Dakota officials were concerned about the
increased frequency, which some attributed to
growth in the energy sector and an increased num-
ber of workers with riskier jobs in sectors such as
the oil industry.
If we calculate a rate18 and use a Shewhart
chart, we see that North Dakota is beyond the up-
per limit, indicating a fundamental difference from
other states in the work environment (see Figure
6, p. 33). Focusing on North Dakota over time
Fatal work injury rate in North Dakota (1992-2013) / FIGURE 7
Fatal work injury rate in North Dakota (1992-2013)—chart with limits based on 1992-2010 / FIGURE 8
1992
1993
1994
1995
1996
1997
1998
1999
2000
2001
2002
2003
2004
2005
2006
2007
2008
2009
2010
2011
2012
2013
0123456789
10
LCL
UCL
Nu
mb
er o
f fa
tal i
nju
ries
per
100
,000
peo
ple
1992
1993
1994
1995
1996
1997
1998
1999
2000
2001
2002
2003
2004
2005
2006
2007
2008
2009
2010
2011
2012
2013
0123456789
10
LCL
UCL
Nu
mb
er o
f fa
tal i
nju
ries
per
100
,000
peo
ple
WorseWorse
Worse Worse
WorseWorse
Worse Worse
Worse
Worse
Same
Better BetterBetter Better Better
BetterBetter
Better Better
Better
UCL = upper control limit LCL = lower control limit
UCL = upper control limit LCL = lower control limit
Fatal work injuries in Minnesota (1992-2013) / FIGURE 9
1992
1993
1994
1995
1996
1997
1998
1999
2000
2001
2002
2003
2004
2005
2006
2007
2008
2009
2010
2011
2012
2013
LCL
UCL
Nu
mb
er o
f fa
tal i
nju
ries
per
100
,000
peo
ple
Rate
0.0
0.5
1.0
1.5
2.0
2.5
3.0
UCL = upper control limit LCL = lower control limit
Reprinted with permission from Quality Progress, © 2016 ASQ, www.asq.org. No further distribution allowed without permission.

November 2016 • QP 35
shows that in 2011 the state was outside the upper limit of
its predicted rate of fatal work injuries (see Figure 7).
Despite the fact that data points from 2011 to 2013 are
beyond the upper limit and that the report from the Ameri-
can Federation of Labor and Congress of Industrial Orga-
nizations recently called North Dakota the most dangerous
state to work,19 the BLS’s 2013 map suggested that North
Dakota improved because the raw number of fatalities was
less than the previous year.
The period-to-period comparison is misleading and con-
tributes to unscientific use of data to support entrenched
positions. The stark contrast of these two views of varia-
tion is illustrated in Figure 8, which shows each data point
on the Shewhart chart using the BLS map’s color-coded as-
sessment.
Unlike the Shewhart chart that provides an understand-
ing of the upper and lower limits of fatal injuries over time
in North Dakota—that is, a system view of all data—the
color-coded map excludes most of the data and limits what
the analysis provides to whether conditions are getting
better or worse from the prior year.
The BLS’s map also labeled Minnesota as having an in-
crease in fatalities from 2012. Compare the North Dakota’s
chart with Minnesota’s (see Figure 9). Although the fre-
quency of injury for these two states was characterized as
increasing from 2011 to 2012, they both moved in opposite
directions.
Next, we need to answer case two’s two primary questions:
1. Is the process currently stable or predictable? There
are important special causes in the injury rate comparisons
DATA ANALYSIS
Dropout rates by family income, 15 through 24-year-olds who dropped out of grades 10 through 12 / FIGURE 10
199019751972 19951980 1985 2000 2005 2012
High income
Total
Low income
Middle income
Percentage
0
2
4
6
8
10
12
14
16
18
20
Year
Source: U.S. Department of Education, “Trends in High School Dropout and Completion Rates in the United States: 1972-2009,” https://nces.ed.gov/pubs2012/2012006.pdf.
Shewhart charts of drop-out rates by family income / FIGURE 11
0
2
4
6
8
10
12
14
16
18
20
0
2
4
6
8
10
12
14
16
18
20
All families dropout rate Low income dropout rate
0
2
4
6
8
10
12
14
16
18
20
0
2
4
6
8
10
12
14
16
18
20Middle income dropout rate High income dropout rate
4.9
15.1
11.6
8.2
5.0
3.11.90.6
1990
1992
1974
1976
1978
1972
1994
1996
1998
2000
1980
1982
1984
1986
1988
2002
2004
2006
2008
2010
2012
1990
1992
1974
1976
1978
1972
1994
1996
1998
2000
1980
1982
1984
1986
1988
2002
2004
2006
2008
2010
2012
1990
1992
1974
1976
1978
1972
1994
1996
1998
2000
1980
1982
1984
1986
1988
2002
2004
2006
2008
2010
2012
1990
1992
1974
1976
1978
1972
1994
1996
1998
2000
1980
1982
1984
1986
1988
2002
2004
2006
2008
2010
2012
Reprinted with permission from Quality Progress, © 2016 ASQ, www.asq.org. No further distribution allowed without permission.

between states and within states over time.
2. Based on this knowledge, what type of action
makes sense? Part of the BLS’s mission is to sup-
port public and private decision making, and using a
Shewhart chart in its public data displays would help it
realize this mission. If Shewhart charts were used, an
investigation of changes in systems in North Dakota
(becoming more dangerous) and Minnesota (becom-
ing safer) could provide knowledge on which to base
improvement efforts for work environments in those
states and others.
Case three—U.S. Department of Education
(high school dropouts):20 The U.S. dropout rate has
been declining for decades. Part of an annual report
from the department depicted this decline for all stu-
dents and for low, middle and high-income families (see
Figure 10, p. 35).
Even a relatively effective time series graph such as
this one can be improved using Shewhart charts. From
Figure 10’s graph, it might be concluded that current ap-
proaches to reducing dropout rates are effective, sup-
porting a “more of the same” approach.
Figure 11 (p. 35) contains four Shewhart charts in a
small-multiples layout. The charts show signs of a special
cause and suggest the dropout rate has declined primar-
ily because of two special causes (creating three time
periods).
One special cause occurs at about 1982 and the other
at about 2002. Figure 12 shows these charts with each il-
lustrating these three periods. An analyst can now focus
on understanding the changes that occurred during the
years that led to these fundamental changes. Also during
the most recent period (2002), the low-income dropout
rate seems to be decreasing while the rates for the other
two groups appear stable.
Next, we must answer case three’s two primary ques-
tions:
1. Is the process currently stable or predictable?
From 1972 to 2012, the process was not stable or pre-
dictable for all students and for the three levels of fam-
ily income.
2. Based on this knowledge, what type of action
makes sense? The U.S. Department of Education
invests millions of dollars in the High School Gradu-
ation Initiative,21 also known as the School Dropout
Prevention Program. Understanding the cause and ef-
fect associated with the special-cause periods could
help focus this investment.
QP • www.qualityprogress.com36
Shewhart charts for dropout rates by family income during three periods / FIGURE 12
1990
1992
1974
1976
1978
1972
1994
1996
1998
2000
1980
1982
1984
1986
1988
2002
2004
2006
2008
2010
2012
1990
1992
1974
1976
1978
1972
1994
1996
1998
2000
1980
1982
1984
1986
1988
2002
2004
2006
2008
2010
2012
All families dropout rate Low income dropout rate
1990
1992
1974
1976
1978
1972
1994
1996
1998
2000
1980
1982
1984
1986
1988
2002
2004
2006
2008
2010
2012
1990
1992
1974
1976
1978
1972
1994
1996
1998
2000
1980
1982
1984
1986
1988
2002
2004
2006
2008
2010
2012
Middle income dropout rate High income dropout rate
3.93.5
3.0
10.910.911.7
15.8
18.9
12.7
8.1
5.25.2
4.53.42.4 3.0
1.5
0
2
4
6
8
10
12
14
16
18
20
0
2
4
6
8
10
12
14
16
18
20
0
2
4
6
8
10
12
14
16
18
20
0
2
4
6
8
10
12
14
16
18
20
Reprinted with permission from Quality Progress, © 2016 ASQ, www.asq.org. No further distribution allowed without permission.
There were no federal appropriations from 2007 to
2009 for this initiative, but from 2010 to 2014, appropria-
tions jumped to about $50 million annually. Shewhart
charts will help us learn about the impact of this funding
and whether it makes sense to continue at current levels.
School of variationWhen Deming and Shewhart warned about economic
losses incurred by not understanding variation, they were
not talking in theoretical terms—these losses are real and
can influence people’s financial, physical, social and emo-
tional well-being. These examples are not even the tip of
the iceberg.
Until Shewhart’s theory of variation is a standard part
of citizen’s education, we will continue to have managers,
scientists and leaders confusing chance occurrences with
special events, which often leads to actions that increase
variation and produce worse outcomes. This education
can begin immediately if government agencies and other
national organizations use Shewhart’s theory and the con-
trol chart method to report and interpret the data they
disseminate.
Respected journalistic institutions also can contribute
to this education by moving away from headlines based
on uninformative, point-to-point variation to offering con-
clusions that take into account the scientific meaning of
the data based on variation over time.
Where will we be 25 years from now in our under-
standing of variation? At a minimum, simply asking two
primary questions to guide any analysis will lead to a bet-
ter understanding of variation and more effective deci-
sion making. QP
REFERENCES AND NOTES1. Walter A. Shewhart, The Economic Control of Quality of Manufactured Product,
ASQ Quality Press, 1980. 2. Walter A. Shewhart, W. Edwards Deming, ed., Statistical Method From the
Viewpoint of Quality Control, Dover Publications, 1986.3. Thomas Nolan and Lloyd Provost, “Understanding Variation,” Quality Progress,
May 1990, pp. 70-78.4. Bureau of Labor Statistics (BLS), “BLS Information,” www.bls.gov/bls/
infohome.htm.5. Ronald Moen, Thomas Nolan and Lloyd Provost, Quality Improvement Through
Planned Experimentation, third edition, McGraw-Hill Education, 2012.6. W. Edwards Deming’s Out of the Crisis (MIT Press, 2000) and the 1990 QP article
“Understanding Variation” (see reference 3) provide more information on ap-preciating the benefits of a stable process.
7. For additional information about how to construct Shewhart charts, read The Health Care Data Guide: Learning From Data for Improvement by Lloyd Provost and Sandra Murray (Jossey-Bass, 2011) and Advanced Topics in Statistical Process Control by Donald Wheeler (SPC Press, 1995).
8. Bureau of Economic Analysis, “National Economic Accounts,” www.bea.gov/national/index.htm#gdp.
9. Eric Morath and Jeffrey Sparshott, “U.S. GDP Grew a Disappointing 1.2% in Second Quarter,” Wall Street Journal, July 29, 2016.
10. Neil Shah and Sarah Portlock, “U.S. Economy Shows Signs of Gearing Up,” Wall Street Journal, Jan. 30, 2014.
11. Jonathan House, “U.S. Economy Shrinks by Most in Five Years,” Wall Street
Journal, June 25, 2014.12. Jon Hilsenrath, Eric Morath and Nick Timiraos, “Growth Rebound Stokes Fed
Debate,” Wall Street Journal, July 30, 2014.13. Bureau of Economic Analysis, “National Economic Accounts,” see reference 8.14. Shewhart, The Economic Control of Quality of Manufactured Product, see
reference 1.15. Data used for case study one are from the Office of the Assistant Secretary
for Planning and Evaluation—Health System Measurement Project. The measurement name used was the “percentage of nursing facility residents experiencing one or more fall with major injury,” and the chart type was an individual chart with the numerator and denominator not reported. The subgroup for this case study is a quarter. For more information, visit: https://healthmeasures.aspe.hhs.gov.
16. Laura Smith, Nan Tracy Zheng, Karen Reilly, Stephanie Kissam, Franziska Rokoske, Daniel Barch, Yevgeniya Kaganova, Audrey Etlinger and Jashua Man-ning, Nursing Home MDS 3.0 Quality Measures: Final Analytic Report, Centers for Medicare & Medicaid Services: Division of Ambulatory and Post Acute Care, September 2012.
17. Case study two used data from the U.S. Bureau of Labor Statistics. The mea-surement name used was the “number of fatal work injuries (2012),” and the chart type was a U-funnel plot, with states ordered by increasing population size with an adjustment for over-dispersion due to large subgroup sizes. States are the subgroup for this case study.
18. Though the U.S. Bureau of Labor Statistics uses total number of hours worked by state in its rate-based calculations of fatal work injuries, these data are not easily accessible to the public. We therefore use population density as a sur-rogate in our analysis to demonstrate how to learn from variation at the state level. Similar charts can be constructed using different rate formulas. One of the challenges to creating Shewhart charts is that it requires access to disag-gregated data, which are often not available through public sources.
19. The American Federation of Labor and Congress of Industrial Organizations (AFL-CIO), Death on the Job: The Toll of Neglect, AFL-CIO, 2012, http://tinyurl.com/afl-cio-jobdeaths.
20. Case study three’s data are from the U.S. Department of Education’s 2012 report, “Trends in High School Dropout and Completion Rates in the United States: 1972-2009.” The measurement name used was the “percentage of high school dropouts among persons 16-24 years old.” Year and family income (1972 to 2012) are considered this case study’s subgroup. For more informa-tion, visit https://nces.ed.gov/pubs2012/2012006.pdf.
21. Ibid.
BIBLIOGRAPHYDeming, W. Edwards, The New Economics, MIT Press, 1993.Shewhart, Walter A., W. Edwards Deming, ed., Statistical Method From the
Viewpoint of Quality Control, Dover Publications, 1986.
November 2016 • QP 37
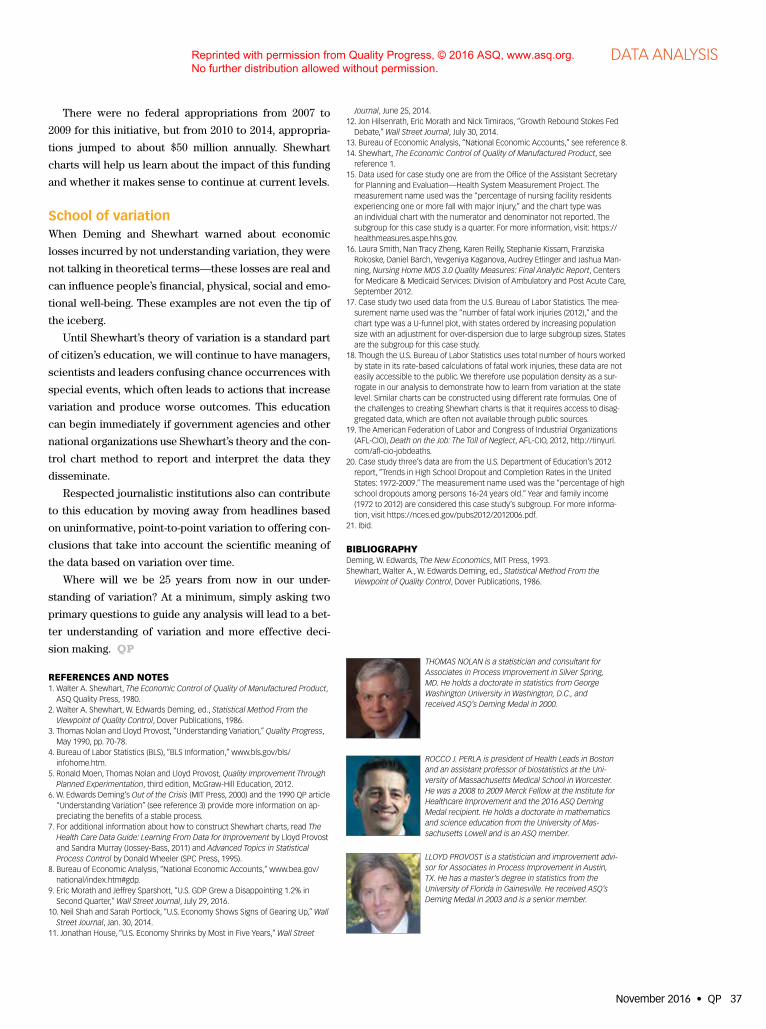
LLOYD PROVOST is a statistician and improvement advi-sor for Associates in Process Improvement in Austin, TX. He has a master’s degree in statistics from the University of Florida in Gainesville. He received ASQ’s Deming Medal in 2003 and is a senior member.
DATA ANALYSIS
ROCCO J. PERLA is president of Health Leads in Boston and an assistant professor of biostatistics at the Uni-versity of Massachusetts Medical School in Worcester. He was a 2008 to 2009 Merck Fellow at the Institute for Healthcare Improvement and the 2016 ASQ Deming Medal recipient. He holds a doctorate in mathematics and science education from the University of Mas-sachusetts Lowell and is an ASQ member.
THOMAS NOLAN is a statistician and consultant for Associates in Process Improvement in Silver Spring, MD. He holds a doctorate in statistics from George Washington University in Washington, D.C., and received ASQ’s Deming Medal in 2000.
Reprinted with permission from Quality Progress, © 2016 ASQ, www.asq.org. No further distribution allowed without permission.