Embed Size (px)
Citation preview
1
Unit - 1
PLANNINGS Economic Planning:
• Economic Planning means “It is an outline or broad statement of schemes on programmes designed to realize certain pre-determined economic objectives, in a particular order of priorities, according to a strategy within a specified period of time is called Economic Planning.” If the government fallows the plans for the development of economy is called plan policy.
• USSR (Russia) was the first country introduced planning in the world in 1920.
• After grate economic depression all countries tried to implement Russian planning model.
• Netaji Subhash Chandra Bose was first recognized economic planning for India
• After the Second World War all the developed countries followed Russian economic planning model.
• Centralized Planning: The resources are allocated into different sectors and activities used to be done by the Central planning commission is called Centralized planning.
• Decentralized Planning: Plans prepare at various levels i.e. Central level by central planning commission, state level by state planning commission and district level by District planning commission and village level by Panchayati planning commission is called Decentralized Planning.
• Physical Planning: It means, if the resources are allocated in terms of men, materials and machinery is called physical planning.
• Financial Planning: If the resources allocated in terms of outlay it is called financial planning.
• Rolling Plan: A variant of short-term plans is what has come to be known as rolling plans. Two major aspects of rolling plans: first, in a rolling plan, the central outlay allotment for major sectors within the overall five-year plan targets will be fixed on a yearly basis. Secondly, the five year horizon (scope) will be extended each year by changing the select central targets for an additional year.
• Indicative Planning: It provides direction for the development of the economy by spelling (bring) out clear goals and providing help in reaching them. These types of plans started first time in France during 1947-50.
• Structural Planning: If the plans involve changing the socio-economic institutions it is called the structural planning.
2
• Long-run Plans: if the plans prepare for 10, 15, 20 and even more its called long run plan. This also called Perspective plans.
• Medium term plan: it covers minimum period is 3 to 5 years and maximum is 7 to 10 years.
• Short run Plan: It relates to as short a period as one year. • Fixed term plans: if the plans fixed for particular period of time is
called fixed term plan. • Imperative Planning (Comprehensive Planning): This type of plans
fallows the socialistic countries. In this model plans will not prepare according consumers. All economic activities will determined by Government. This is also called Compressive Plans.
Before 1950 Economic Planning in India:
• In 1934 M. Visweswarayya wrote “Planned for economy for India” and he prepared plans for 10 years to India.
• In 1938 Indian National Congress established National Planning Commission under the chairmanship of Pandit Jawaharlal Nehru. This commission estimated natural resources, Human resources, plan outlay in India.
• In 1943-44, in Bombay 8 important Maharastrian industrialists prepared a plan popularly known as “Bombay plan”. They prepared plan for 15 years to increase industrial, agricultural product and service product. This plan draft prepared under the chairmanship of Adarsh Dalal.
• In 1943-44 M.N. Roy prepared “Peoples Plan”, in which more importance was given to Agriculture, Village production based on Ghandhian ideology. This plan was given more importance to increase double per capita income in 10 years.
• In 1944 S.N. Agarwal prepared Ghandhian Plan based on the Gandhi ideology. This plan was given more important to small scale industries, Labour intensive method and rural development.
• In 1944 government established Planning and Development department under the chairmanship of Adarsh Dalal.
• In 1946, interior government established advisory planning council under the chairmanship of K.C. Niyogi to study and discuss the problems of plans and development.
• In 1948, National Planning Commission recommended to Planning Commission as advisory body.
• In 1950 Jayaprakash Narayana prepared Sarvodaya Planning. This plan was given more important to agriculture, industries.
3
Features of Indian planning:
• Indian planning is based on mixed economy where public and private sectors both existed in economy.
• Indian plans are preparing based on market oriented decisions planning.
• Indian plans are based on Capital accumulation. • Centralized Planning followed in Indian planning till the 7th Plan. • Since 8th plan Indicative Planning following in Indian Planning.
Planning Commission:
• To achieve directive principle of state policy targets planning commission established with parliament act.
• Planning commission established as advisory body. • Prime Minister is the ex-officio chairman to the planning commission. • One Deputy Chairman Will appointed to planning commission with
cabinet status. He will act permanent executive officer. • Prime Minister Economic Advisory Council is a nodal agency to
planning commission. • Present Prime Minister Economic Advisory Council chairman is Dr.
C.Rangarajan. • Planning Commission is established on March 15, 1950 in India by the
Parliament Act, so it is not a Constitutional body and it is non – statutory body.
• Planning Commission is only Advisory Body to government of India. • The executive head or permanent employ to Planning Commission is
Deputy Chairman. • Programme Evolution Organization (PEO) and National Informatics
Centre (NIC) are affiliated bodies to Planning Commission. • PEO established in 1952 based on the government of India and Ford
Foundation Act. • PEO will report various types of development activities to Planning
Commission. • NIC provide information and technological machines to Planning
Commission. • National Development Council (NDC) constituted on August 6, 1952. It
is also non-statutory body and non constitutional body. • National Development Council constituted based on the
recommendation of Advisory Planning Council which was headed by K.C. Niyogi (1946).
• Prime Minister is the Chairman of National Development Council.

4
• Planning commission members, all states, Pondcherry and Delhi Chief Ministers and Union Territories Administrators are the members of National Development Council.
• After 1967 all central cabinet ministers are the members in National Development Council.
• Planning commission is preparing plans and this draft is sending to National Development Council and after assent of National Development Council plans are implanting by the government.
• Andhra Pradesh Planning Board established in 1974. Strategies in Indian Planning: Harrod – Domar Strategy:
• During the first five year plan this strategy followed in India • Harrod and Domar both gave more important for capital accumulation • According then capital accumulation have double character. The capital
accumulation can increase income one side and anther side production increases.
• They tried to increase full employment in the long-run period • Harrod wrote one book called Towards a dynamic economics in 1959 • In the Harrod model 3 main concepts are there
1. Actual rate of growth (G) 2. Warranted rate of growth (GW) 3. Natural rate of growth (GN)
• According Harrod growth rate = S/COR • S= Saving • COR= Capital output Ratio • Domar wrote the fallowing books
1. Capital expansion 2. Rate of growth and employment 3. Essays in the poverty of economic growth
• He gave more important dual investment character • According him investment increases productivity and real income also
increases • According him full employment get equilibrium when aggregate
demand is equal to aggregate supply
P.C.Mahalnobis: • Mahalanobis 2 sector model implemented during 3rd and 4th five ear
plan India • Mahalanobis 4 sector model implemented during 2nd, 5th, 6th and 7th
five year plan.

5
Gandhian Strategy: This strategy implemented during rolling plan from 1978-79 to 1980-81. Rao-Manmohan strategy: This strategy is also called Liberalization, Privatization and Globalization (LPG model). This policy is also called new economic policy. Since 8th five plan plannings are preparing based on LPG model. PURA:
• PURA prepared by A.P.J.Abdulkalam in 2003. • PURA announced by government on August 15th, 2004. • Since 2005 plans are preparing based on PURA strategy in the part of
Bharaat Nirman programme. Objective of Indian planning: Each and every plan having their own objectives. Along with that’s objectives Indian planning having common objectives to follow in every plan.
• Growth: By increasing faster growth of economy in case of capital goods and consumption goods.
• Modernization: Institutional changes and shifting feudal and colonial economy to progressive and independent economy
• Self-Reliance: The reduction and ultimately elimination of dependence on foreign aids and increase exports to earn foreign reserves for imports.
• To reduce regional imbalance and income inequalities • Economic and Social Justice
Plans are necessary for the country to achieve Socio Economic justice of the people. In India plans are preparing for five years, so our plans are calling as five year plans. In India five year plans are implementing since April 1, 1951. Financial resources to plannings in India: India planning commission is mobilizing resources through 3 ways. One is domestic resources, foreign sources and deficit financing. Domestic sources:
• Taxes • Production of goods and services • Gifts • Disinvestment • Public enterprises
6
• Land • Administrative income and others
Foreign sources:
• World Bank • International Monetary Fund (IMF) • Asian Development Bank (ADB) • Other international banks • Foreign governments and foreign institutions and foreign individuals
Deficit financing: • Currency printing • Domestic loans
First Five year Plan:
• First five year plan period was April 1, 1951 - March 31, 1956. • This plan was given more important to Agricultural sector. • Increase of food production and correction of disequilibrium in the
economy caused by the Second World War and partition of India are the other importance of this plan.
• First five year plan called as Agriculture and irrigation plan. • This plan was prepared based on the Harrod- Domar model. • First five year plan proposed outlay was Rs 2378, but actual
expenditure was Rs 1960 and private sector investment was Rs 1800. • This plan was allocated 31% funds to Agricultural sector. • This plan target growth rate was 2.1%. • This plan actual growth rate was 3.6%. • Food grain production target was 61.6 million tones but actual
production was 65.8 million tones from 52.2 million tones. • Irrigation facility providing target was 70.7 million acres but actual
irrigation facilities provided only 56.2 million acres. • Industrial growth rate during this plan was 3.8%. • Electricity production target was 3.6MKW but actual production was
only 3.4MKW. • NI Target was 11% But actual growth rate was 18% • Per capita income also increased 11% (from Rs. 246 to Rs. 274) • Per capita consumption level increased to 8% during this plan. • During this one locomotive Rail factory at Chittaranjan in West Bengal
established. • Hindustan Cable industry at Durgapur in WB. • National Instruments Factory established at Calcutta • Fertilizer factory at Sindhri in Jharkhand established. • Hindustan Ship yard at Vishakhapatnam. • Integral Coach Factory established at Perambadur in Tamilnadu.
7
• Hindustan Machine tools established at Mysore in Karnataka. • Indian Telephone Industry established at Bangalore. • Bakra-nagal project was constructed during this plan. • In 1952 Community Development Programme (CDP) started to over all
the development of villages with people participation.
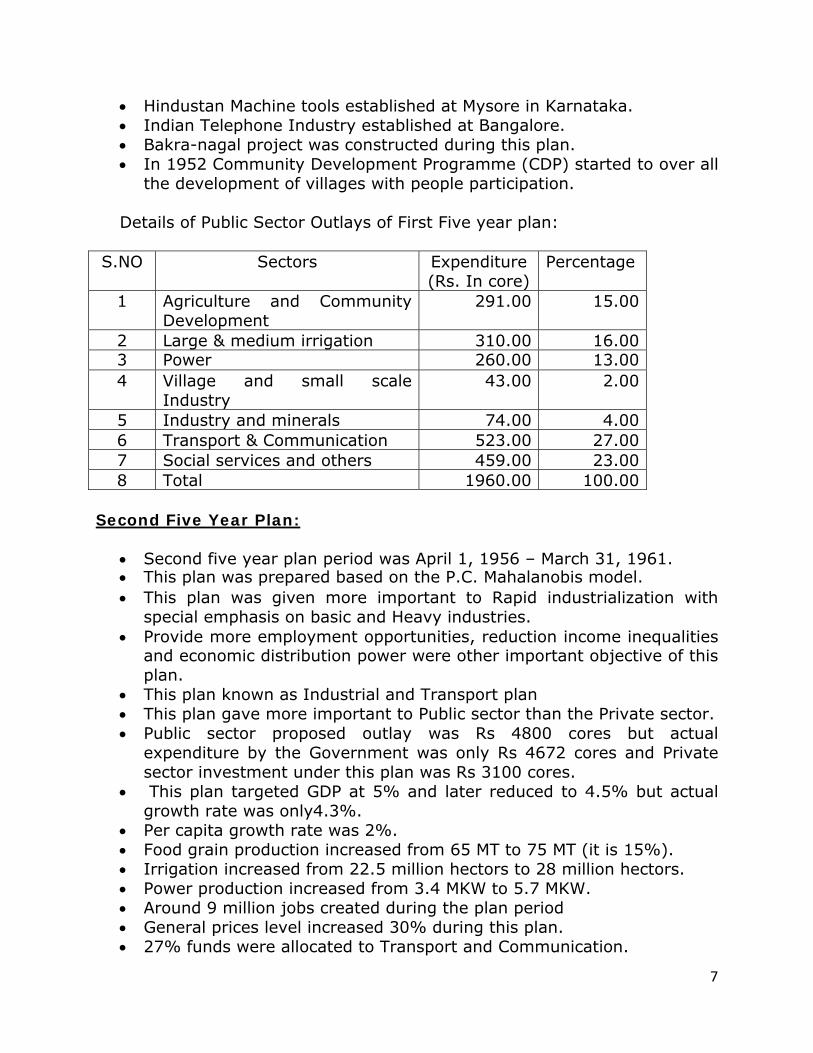
Details of Public Sector Outlays of First Five year plan:
S.NO Sectors Expenditure (Rs. In core)
Percentage
1 Agriculture and Community Development
291.00 15.00
2 Large & medium irrigation 310.00 16.00 3 Power 260.00 13.00 4 Village and small scale
Industry 43.00 2.00
5 Industry and minerals 74.00 4.00 6 Transport & Communication 523.00 27.00 7 Social services and others 459.00 23.00 8 Total 1960.00 100.00
Second Five Year Plan:
• Second five year plan period was April 1, 1956 – March 31, 1961. • This plan was prepared based on the P.C. Mahalanobis model. • This plan was given more important to Rapid industrialization with
special emphasis on basic and Heavy industries. • Provide more employment opportunities, reduction income inequalities
and economic distribution power were other important objective of this plan.
• This plan known as Industrial and Transport plan • This plan gave more important to Public sector than the Private sector. • Public sector proposed outlay was Rs 4800 cores but actual
expenditure by the Government was only Rs 4672 cores and Private sector investment under this plan was Rs 3100 cores.
• This plan targeted GDP at 5% and later reduced to 4.5% but actual growth rate was only4.3%.
• Per capita growth rate was 2%. • Food grain production increased from 65 MT to 75 MT (it is 15%). • Irrigation increased from 22.5 million hectors to 28 million hectors. • Power production increased from 3.4 MKW to 5.7 MKW. • Around 9 million jobs created during the plan period • General prices level increased 30% during this plan. • 27% funds were allocated to Transport and Communication.
8
• 24.1% of funds allocated for heave and small scale industries. • 1228KM of new rail lines & 3520KM of new roads were constructed • Rs. 948 cores currency was issued during this and this was caused to
high inflation during this plan. • In 1959 Bhilai iron and steel industry in Chattisgarh Pradesh with
cooperation of former USSR established during this plan. • In 1955-56 agreement over and established during second five year
plan the Roorkela iron and Steel industry in Orissa with cooperation of West Germany established.
• In 1960 Durgapur Iron and Steel industry in West Bengal with cooperation of United Kingdom established.
• Production capacities of Tata Iron steel company, Indian Iron Company and Mysore Iron and Steel Company further increased.
• Heavy engineering industry established at Ranchi in Jharkhand. • 9.5 million Employment opportunities provided during this plan. • One Industrial resolution based on socialistic economy introduced in
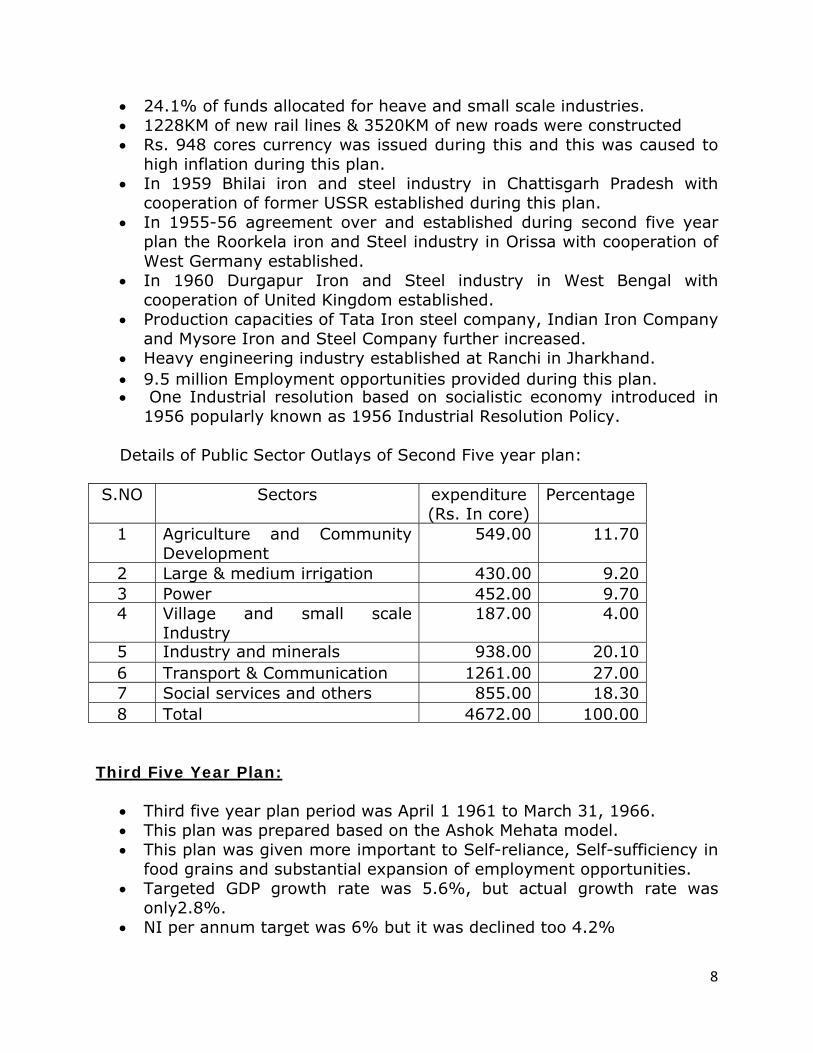
1956 popularly known as 1956 Industrial Resolution Policy. Details of Public Sector Outlays of Second Five year plan:
S.NO Sectors expenditure (Rs. In core)
Percentage
1 Agriculture and Community Development
549.00 11.70
2 Large & medium irrigation 430.00 9.20 3 Power 452.00 9.70 4 Village and small scale
Industry 187.00 4.00
5 Industry and minerals 938.00 20.10 6 Transport & Communication 1261.00 27.00 7 Social services and others 855.00 18.30 8 Total 4672.00 100.00
Third Five Year Plan:
• Third five year plan period was April 1 1961 to March 31, 1966. • This plan was prepared based on the Ashok Mehata model. • This plan was given more important to Self-reliance, Self-sufficiency in
food grains and substantial expansion of employment opportunities. • Targeted GDP growth rate was 5.6%, but actual growth rate was
only2.8%. • NI per annum target was 6% but it was declined too 4.2%

9
• Food grain production was targeted at 6% but actual growth rate was only 2%.
• Industrial annual growth rate target was 14%, but actual growth rate was only 5.7%.
• Currency (Rupee) is devaluated in this plan. • In 1964, Bokaro iron and Steel industry at Bokaro in Jharkhand state
established with cooperation of Russia. • Total investment during this plan was Rs.12677 cores. • Public sector proposed outlay was Rs.7500 cores but actual
expenditure was Rs.8577 cores. • Private sector investment was Rs.4100 cores. • This plan was failure due to War with China in 1962 and War with
Pakistan in 1965 and failures of monsoons, because of these reasons Government diverted funds foe defence purposes and the development programmes could not be properly implemented.
• In 1963 National Co-operative Development Corporation (NCDC) established
• In 1963 Agriculture Refinance Development Corporation (ARDC) started
• In 1964 Unit Trust of India (UTI) and Industrial Development Bank of India (IDBI) established
• In 1965 Food Corporation of India (FCI) and Agricultural Price Commission (APC) established
Details of Public Sector Outlays of Third Five year plan:
S.NO Sectors Expenditure (Rs. In cores)
Percentage
1 Agriculture and Community Development
1089.00 12.70
2 Large & medium irrigation 664.00 7.80 3 Power 1252.00 14.60 4 Village and small scale
Industry 241.00 2.80
5 Industry and minerals 1726.00 20.10 6 Transport & Communication 2112.00 24.60 7 Social services and others 1493.00 17.40 8 Total 8577.00 100.00
In 1st, 2nd and 3rd five year plan government fallowed Trickle down Theory. Trickle down theory means government gave more important to increase economic growth. Government planned to reduce poverty, unemployment and income in equality reduces if economic growth increases this concept is called Trickle down theory.

10
Annual Plans: (1966-1969):
• Due to failure of third five year plan Government of India did not implemented fourth five year plan.
• Some time stopped five year plans and implemented 3 Annual plans by replacing five year plan.
• This period (April 1, 1966 to March 31, 1969) known as plan holiday in Indian planning period.
• The main objective of Annual Plans are: 1. To remove the strains in the economy arising from many
unforeseen events during the third plan. 2. To secure a feasible growth rate without generating inflationary
pressures in the economy. 3. To have fuller utilization of the infrastructure already created
during previous plan periods. • Annual plans given more importance to irrigation and Agriculture
sector and to control inflation y increasing agricultural production. • 1966-67 Annual plan outlay was Rs.2081 core and further increased to
Rs.2221 cores. • 1967-68 Annual plan outlay was RS.2246 cores. • 1968-69 Annual plan outlay was Rs.2377 cores. • Growth rate in GDP increased 1.1% during 1966-67, 9.9% during
1967-68 and 10.2% during 1968-69. • Industrial growth rate was 2.8% during 1966-67, 2.2% during 1967-
68 and 7% during 1968-69. • Agricultural production increased from 76MT in 1966-67 to 95.1MT in
1967-68 and 98MT in 1968-69.
• These three annual plans paved the way for removing the strains on economy caused by failure of the Third plan.
• In 1968 government started National Textile Corporation. • In 1969 Lead bank scheme started based on the recommendation of
Nariman committee. Fourth Five Year Plan:
• Fourth five year plan period was April 1, 1969 to March 31, 1974. • This plan prepared based on the D.R. Gadgil model. • Leontiff input and output model implementing since 4th five year
plan in India. • This plan given more importance to Attainment of Economic
stability and Self-sufficient in food grain production.
11
• Social and economic justice by providing more employment opportunities to weaker sections and balanced regional development to generate the confidence among the people in planning, which was almost lost due to the failure of Third five year plan .
• Total investment during this plan was Rs.24759 cores. • Public sector proposed outlay was Rs.15902 cores, but actual
expenditure was Rs.15779 cores. And Private sector investment was Rs.8980 cores.
• Agricultural target growth rate was 5%. • Industrial target growth rate was 8-10%, but actual growth rate
was only 3.9%. • Exports target growth rate- 7%. • Per capita target growth-1%. • GDP target growth rate-5.7%, but actual growth rate was only
3.3%. • Food grain production increased from 98 MT to 125MT. • During the fourth plan general prices increased to 61%. • At the end of fourth plan then and now Prime Minister Mrs. Indira
Gandhi gave slogan of “Garibi Hatavo” to eradicate poverty in India.
• In 1970-71 Rural Works Programme started • In 1971 North East Council established • Crash Scheme for Rural Employment (CSRE) introduced in 1971-72
for rural development through the generation of new employment. • Pilot Intensive Rural Employment Programme (PIREP) introduced in
1972-73 for construction work in village. • In 1972-73 employment guarantee scheme in Maharastra started
by central government. • In 1973-74 Marginal Farmers and Agriculture Labour Agency
(MFALA) started. • During this five year plan government implanted 6 points formula
for backward development area and started regional development boards.
• Drought Prone Areas Programme (DPAP) introduced in 1973-74 to develop natural resources in drought prone areas.
• In 1974-75 Small Farmers Development Agency (SFDA) started • In 1972-73 there was surplus in Balance of Trade • In 1969 July 14 banks were nationalized • In 1969 Monopoly Restriction on Trade and Practice (MRTP) act
made to decentralize the economic concentration. • In 1969 Rural Electrification Corporation started • In 1973 Foreign Exchange Regulated Act (FERA) made by the
government.
12
• In 1974 Andhra Pradesh Planning board established. • The following industries established during the fourth five year
plan--------- 1. Salem Steel plant at Salem in Tamilnadu. 2. Vishaka Steel plant at Vishakhapatnam in Andhra Pradesh. 3. Vijayanagaram Steel plant at Vijayanagaram in Karnataka. 4. Alloy Steel plant at Durgapur in West Bengal.
• To control Steel plants Government of India established Steel Authority of India Limited (SAIL) in 1973.
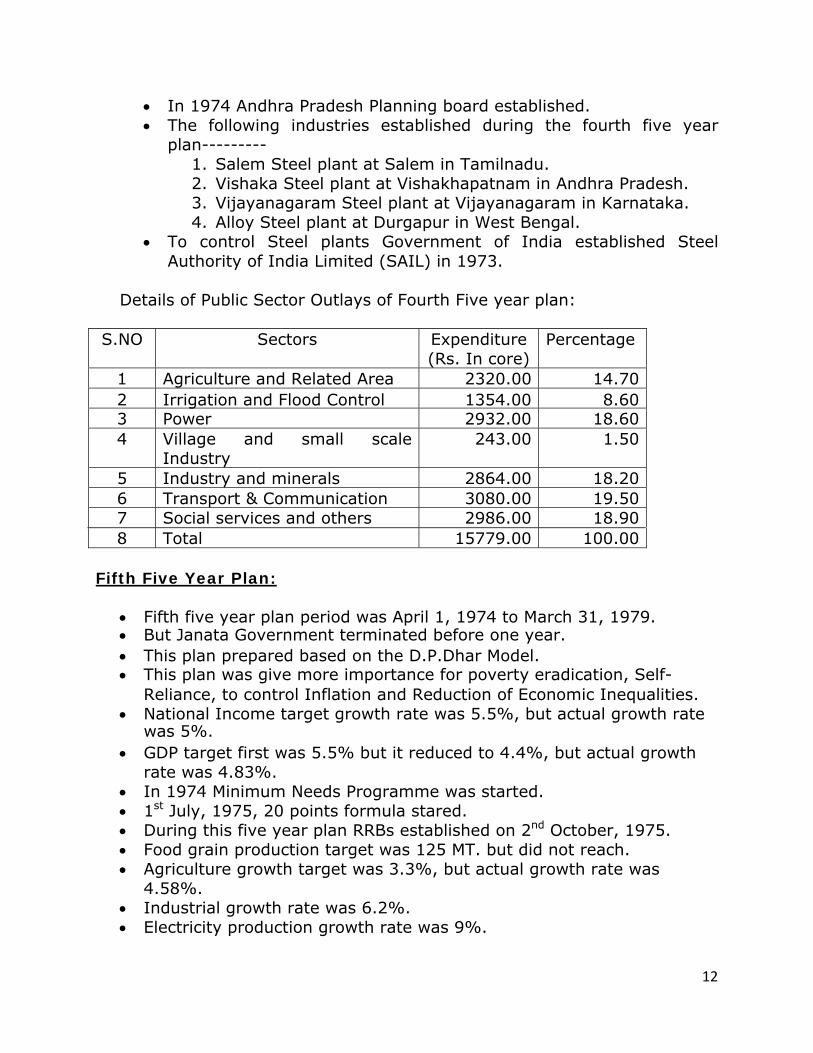
Details of Public Sector Outlays of Fourth Five year plan:
S.NO Sectors Expenditure (Rs. In core)
Percentage
1 Agriculture and Related Area 2320.00 14.70 2 Irrigation and Flood Control 1354.00 8.60 3 Power 2932.00 18.60 4 Village and small scale
Industry 243.00 1.50
5 Industry and minerals 2864.00 18.20 6 Transport & Communication 3080.00 19.50 7 Social services and others 2986.00 18.90 8 Total 15779.00 100.00
Fifth Five Year Plan:
• Fifth five year plan period was April 1, 1974 to March 31, 1979. • But Janata Government terminated before one year. • This plan prepared based on the D.P.Dhar Model. • This plan was give more importance for poverty eradication, Self-
Reliance, to control Inflation and Reduction of Economic Inequalities. • National Income target growth rate was 5.5%, but actual growth rate
was 5%. • GDP target first was 5.5% but it reduced to 4.4%, but actual growth
rate was 4.83%. • In 1974 Minimum Needs Programme was started. • 1st July, 1975, 20 points formula stared. • During this five year plan RRBs established on 2nd October, 1975. • Food grain production target was 125 MT. but did not reach. • Agriculture growth target was 3.3%, but actual growth rate was
4.58%. • Industrial growth rate was 6.2%. • Electricity production growth rate was 9%.

13
• Total public sector outlay was Rs.39, 000 cores, but actual expenditure was 39, 426Cores.
• 19, 893 cores funds allocated for the development programmes. • Self-reliance was one of the objectives of the plan but during this plan
Rs.5830 Cores taken the foreign aid. • Exports were encouraged in this plan, but due to low level production
and rapid population growth resulted in a increase of prices and inflation.
• The fifth plan started with problem and ended with problem. But overall satisfactory is good.
• Janata Government came into power in March 1977 and terminated fifth five year plan one year before i.e. after four years it was completed and started the concept of rolling plan.
• In 1976 National Population Policy first time announced by the central government.
• In 1977 National Institute of Rural Development established at Hyderabad.
• In 1977-78 Food for Works Programme started by government • In 1977-78 Antyodaya Yojana started by central government in
Rajasthan state
S.NO Sectors expenditure (Rs. In core)
Percentage
1 Agriculture and Related Area 4,865.00 12.40 2 Irrigation and Flood Control 3,877.00 9.80 3 Power 7,400.00 18.80 4 Industry and minerals 9581.00 24.30
5 Transport & Communication 6870.00 17.40 6 Social services and others 6833.00 17.3
7 Total 39,426.00 100.00 Rolling Plans:
• The Janata Government ended the fifth five year plan one year earlier to its term i.e. only within four years span (1974-78) and introduced a new plan since April 1, 1978.
• This plan was named as the Rolling plan. • Rolling plan period was 1978-1980. • The concept of rolling plan was introduced by Gunnar Myrdal in Asian
Drama. • Ghandhian Strategy was fallowed during the Rolling plan. • Rolling plan given more important for village and cottage industries. • In the first phase of this rolling plan, the sixth plan was initially started
for 5 years (1978-83) on April 1, 1978.
14
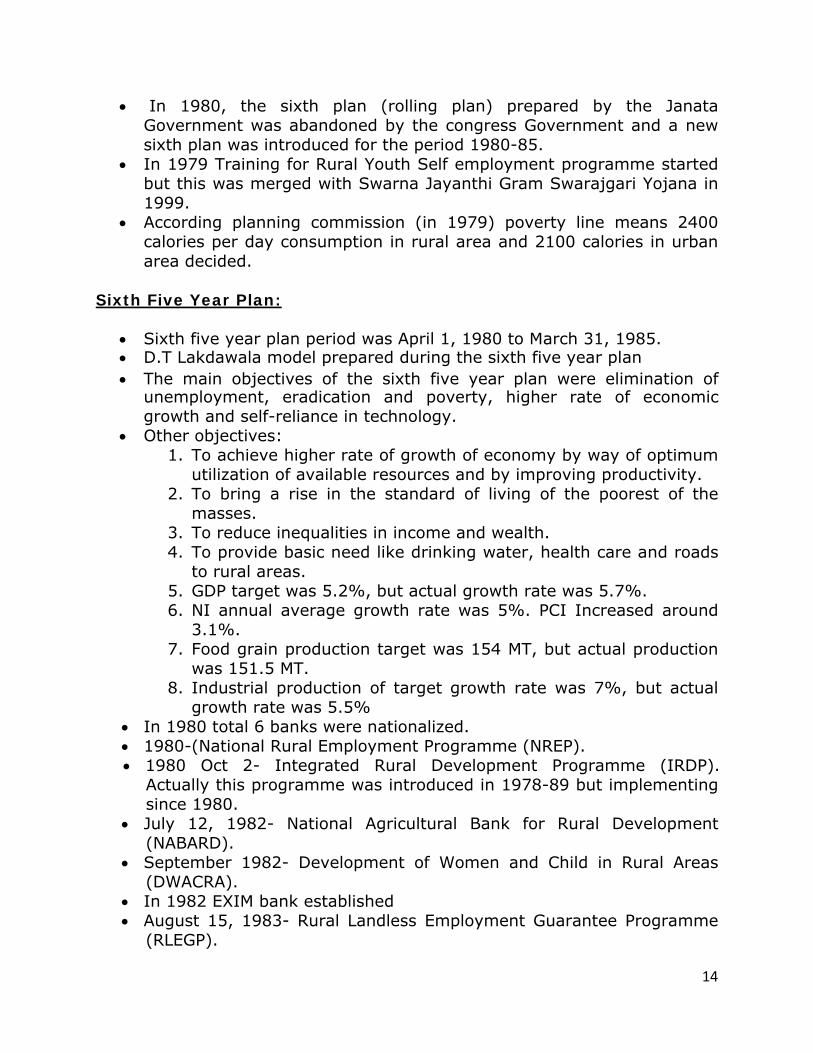
• In 1980, the sixth plan (rolling plan) prepared by the Janata Government was abandoned by the congress Government and a new sixth plan was introduced for the period 1980-85.
• In 1979 Training for Rural Youth Self employment programme started but this was merged with Swarna Jayanthi Gram Swarajgari Yojana in 1999.
• According planning commission (in 1979) poverty line means 2400 calories per day consumption in rural area and 2100 calories in urban area decided.
Sixth Five Year Plan:
• Sixth five year plan period was April 1, 1980 to March 31, 1985. • D.T Lakdawala model prepared during the sixth five year plan • The main objectives of the sixth five year plan were elimination of
unemployment, eradication and poverty, higher rate of economic growth and self-reliance in technology.
• Other objectives: 1. To achieve higher rate of growth of economy by way of optimum
utilization of available resources and by improving productivity. 2. To bring a rise in the standard of living of the poorest of the
masses. 3. To reduce inequalities in income and wealth. 4. To provide basic need like drinking water, health care and roads
to rural areas. 5. GDP target was 5.2%, but actual growth rate was 5.7%. 6. NI annual average growth rate was 5%. PCI Increased around
3.1%. 7. Food grain production target was 154 MT, but actual production
was 151.5 MT. 8. Industrial production of target growth rate was 7%, but actual
growth rate was 5.5% • In 1980 total 6 banks were nationalized. • 1980-(National Rural Employment Programme (NREP). • 1980 Oct 2- Integrated Rural Development Programme (IRDP).
Actually this programme was introduced in 1978-89 but implementing since 1980.
• July 12, 1982- National Agricultural Bank for Rural Development (NABARD).
• September 1982- Development of Women and Child in Rural Areas (DWACRA).
• In 1982 EXIM bank established • August 15, 1983- Rural Landless Employment Guarantee Programme
(RLEGP).
15
• February, 1984- NFRD (National Fund for Rural Development). • March, 1985- IRBI (Industrial Reconstruction Bank of India). • In 1984 government established Gas Authority of India Limited (GAIL)
to protect oil resources. • In 1985 government made Sick Industrial Company Act (SICA) • At the time of 1980 poverty was in India was 47%. • This plan target to reduce the poverty was 30%, but actually poverty
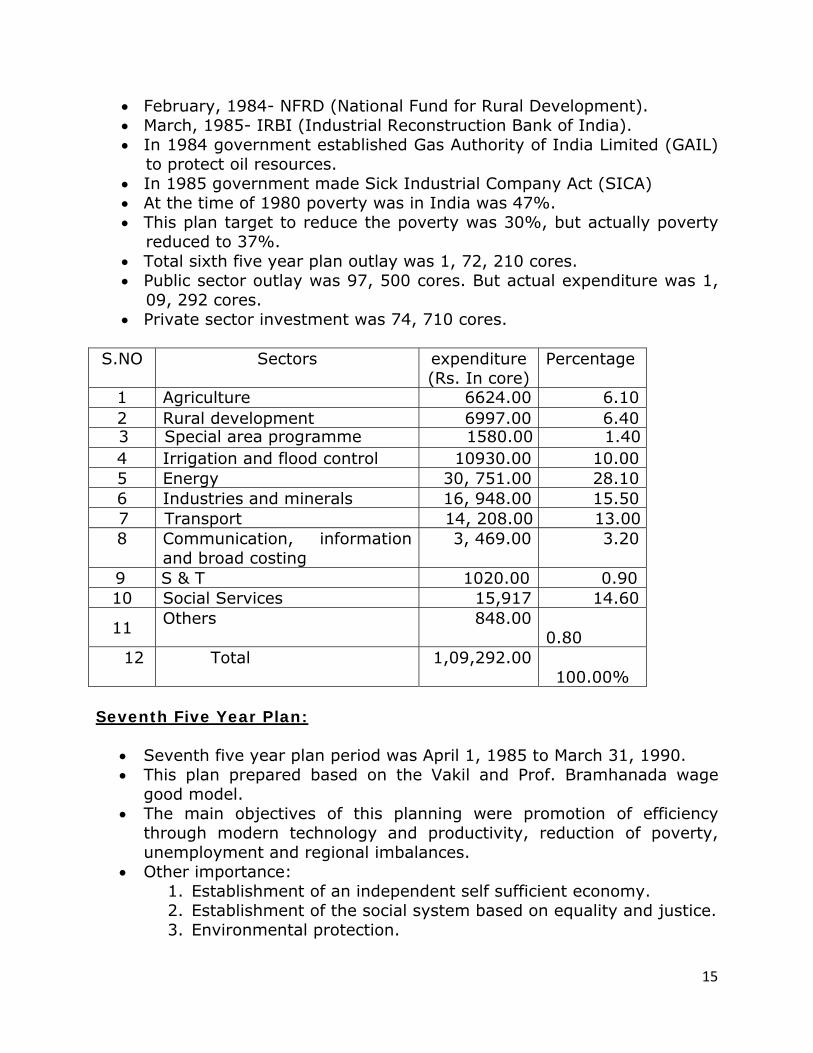
reduced to 37%. • Total sixth five year plan outlay was 1, 72, 210 cores. • Public sector outlay was 97, 500 cores. But actual expenditure was 1,
09, 292 cores. • Private sector investment was 74, 710 cores.
S.NO Sectors expenditure (Rs. In core)
Percentage
1 Agriculture 6624.00 6.10 2 Rural development 6997.00 6.40 3 Special area programme 1580.00 1.40 4 Irrigation and flood control 10930.00 10.00 5 Energy 30, 751.00 28.10 6 Industries and minerals 16, 948.00 15.50 7 Transport 14, 208.00 13.00 8 Communication, information
and broad costing 3, 469.00 3.20
9 S & T 1020.00 0.90 10 Social Services 15,917 14.60
11 Others 848.00
0.80 12 Total 1,09,292.00
100.00% Seventh Five Year Plan:
• Seventh five year plan period was April 1, 1985 to March 31, 1990. • This plan prepared based on the Vakil and Prof. Bramhanada wage
good model. • The main objectives of this planning were promotion of efficiency
through modern technology and productivity, reduction of poverty, unemployment and regional imbalances.
• Other importance: 1. Establishment of an independent self sufficient economy. 2. Establishment of the social system based on equality and justice. 3. Environmental protection.

16
• GDP target growth rate 5.0%, but actual growth rate was 6.0%. • Food grain production wax 151.5 MT in 1985, it was reduced to 138.41
MT in 1987-88. But at the time ending of this plan (1990) it increased to 172.17 MT.
• Industrial growth rate was 6%. • Electricity generation capacity increased from 47705 MW (1985) to
58080 MW in 1989. • In 1986 speed post system started in postal department. • In 1986 government announced new educational policy and
established Navodaya schools and government gave important to technical education.
• In 1985-86 Integrated Crop Insurance Programme started • In 1986 September Council for Advancement of People in Action and
Rural Technology (CAPART) established at New Delhi. • In 1986 Self Employment Programme for the Urban Poor (SEPUP)
started • In 1988 Million Well Scheme started • In 1988 Security Exchange Board of India (SEBI) established • 1989 April JRY – started to provide employment facilities in rural
areas. And in this programme NREP, RLEGP, DWACRA and IRDP were merged.
• 1989 September, NRY started to provide employment facilities in urban areas. And in this programme SEPUP merged.
• Total out lay was 3, 48, 148 cores. • Public sector outlay was 1, 80,000 cores. But actual expenditure was
218730 cores. • Private sector investment was 1, 68,148 cores.
S.NO Sectors expenditure (Rs. In core)
Percentage
1 Agriculture 12,793.00 5.80 2 Rural development 15,246.00 7.00 3 Special area programme 3470.00 1.60 4 Irrigation and flood control 16,590.00 7.60 5 Energy 61,789.00 28.10 6 Industries and minerals 29,220.00 13.40 7 Transport 29,548.00 13.50 8 Communication 8,426.00 3.90 9 S & T and Environment 3024.00 1.40
10
Economic services 2,250.00 1.00
11 Social Services 34,,960.00 16.00 General services 1514.00 0.70

17
12 13 Total 2,18,730.00 100.00
Prof Raj Krishna described the 7th five year plan as Hindu rate of growth Annual Plans:
• Due to political instability and crisis in BOP five years plans could not implemented during 1990-92.
• In 1991 congress again came into power and stared the 8th five year plan.
• In 1990 SIDBI (small industrial development bank of India) started by government for the development of small scale industries.
• In 1990 government started inter state council • In 1990-91 Urban Poor Basic Service for the development of poor in
urban areas started. • In 1991 government announce economic reforms in India.
Eighth Five Year Plan:
• Eight five year plan period was April 1, 1992 to March 31, 1997. • 8th five year plan given more important for HRD, full employment and
rural development. • Indicative planning implemented since 8th five year plan onwards.
Other importance: 1. Universilization of elementary education and complete
eradication of illiteracy among the people within 15 to 35 years. 2. Provision of safe drinking water and health care system. 3. Strengthening of infrastructure. 4. GDP target growth rate was 5.6% and actual growth rate was
6.8%. 5. Highest growth rate was occurred in 8th five year plan. 6. Per capita income target was 3.8% but actual growth rate was
4.4%. 7. Mining and quarrying target growth rate was 8.1% Actual growth
rate was 4.1%. 8. Manufacturing target growth rate was 7.5% but actual growth
rate was 9.5%. 9. Electricity, gas, water supply target growth was 7.8% but actual
growth rate was 7.3%. 10. In 1993 PMRY (Prime Minister Rojgar Yojana) started to
provide self employment facilities for educated unemployers.
18
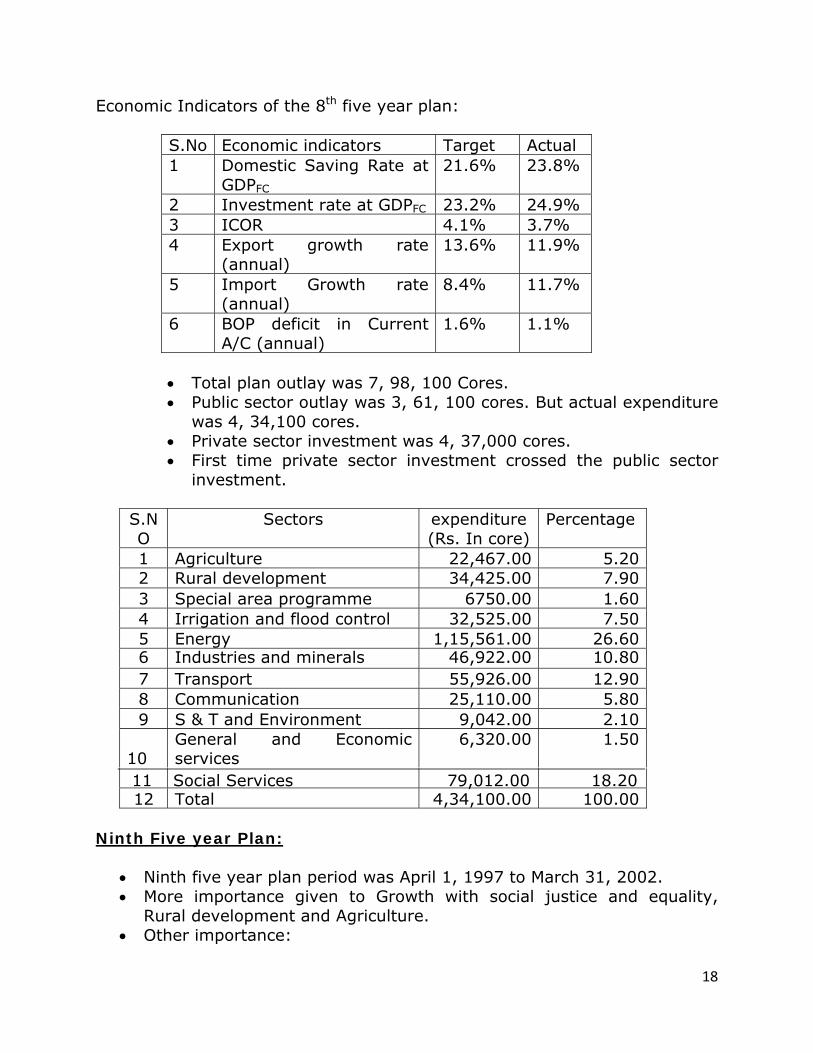
Economic Indicators of the 8th five year plan:
S.No Economic indicators Target Actual 1 Domestic Saving Rate at
GDPFC
21.6% 23.8%
2 Investment rate at GDPFC 23.2% 24.9% 3 ICOR 4.1% 3.7% 4 Export growth rate
(annual) 13.6% 11.9%
5 Import Growth rate (annual)
8.4% 11.7%
6 BOP deficit in Current A/C (annual)
1.6% 1.1%
• Total plan outlay was 7, 98, 100 Cores. • Public sector outlay was 3, 61, 100 cores. But actual expenditure
was 4, 34,100 cores. • Private sector investment was 4, 37,000 cores. • First time private sector investment crossed the public sector
investment.
S.NO
Sectors expenditure (Rs. In core)
Percentage
1 Agriculture 22,467.00 5.20 2 Rural development 34,425.00 7.90 3 Special area programme 6750.00 1.60 4 Irrigation and flood control 32,525.00 7.50 5 Energy 1,15,561.00 26.60 6 Industries and minerals 46,922.00 10.80 7 Transport 55,926.00 12.90 8 Communication 25,110.00 5.80 9 S & T and Environment 9,042.00 2.10
10
General and Economic services
6,320.00 1.50
11 Social Services 79,012.00 18.20 12 Total 4,34,100.00 100.00
Ninth Five year Plan:
• Ninth five year plan period was April 1, 1997 to March 31, 2002. • More importance given to Growth with social justice and equality,
Rural development and Agriculture. • Other importance:
19
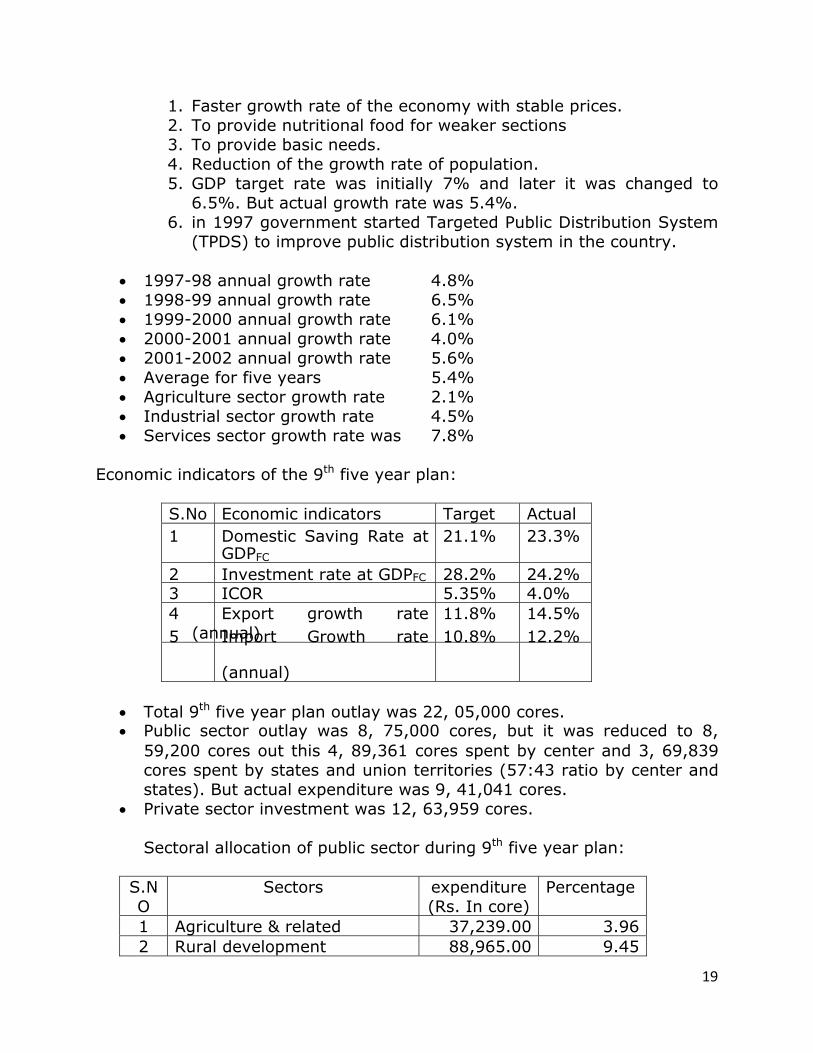
1. Faster growth rate of the economy with stable prices. 2. To provide nutritional food for weaker sections 3. To provide basic needs. 4. Reduction of the growth rate of population. 5. GDP target rate was initially 7% and later it was changed to
6.5%. But actual growth rate was 5.4%. 6. in 1997 government started Targeted Public Distribution System
(TPDS) to improve public distribution system in the country.
• 1997-98 annual growth rate 4.8% • 1998-99 annual growth rate 6.5% • 1999-2000 annual growth rate 6.1% • 2000-2001 annual growth rate 4.0% • 2001-2002 annual growth rate 5.6% • Average for five years 5.4% • Agriculture sector growth rate 2.1% • Industrial sector growth rate 4.5% • Services sector growth rate was 7.8%
Economic indicators of the 9th five year plan:
S.No Economic indicators Target Actual 1 Domestic Saving Rate at
GDPFC
21.1% 23.3%
2 Investment rate at GDPFC 28.2% 24.2% 3 ICOR 5.35% 4.0% 4 Export growth rate
(annual) 11.8% 14.5%
5 Import Growth rate
(annual)
10.8% 12.2%
• Total 9th five year plan outlay was 22, 05,000 cores. • Public sector outlay was 8, 75,000 cores, but it was reduced to 8,
59,200 cores out this 4, 89,361 cores spent by center and 3, 69,839 cores spent by states and union territories (57:43 ratio by center and states). But actual expenditure was 9, 41,041 cores.
• Private sector investment was 12, 63,959 cores. Sectoral allocation of public sector during 9th five year plan:
S.NO
Sectors expenditure (Rs. In core)
Percentage
1 Agriculture & related 37,239.00 3.96 2 Rural development 88,965.00 9.45
20
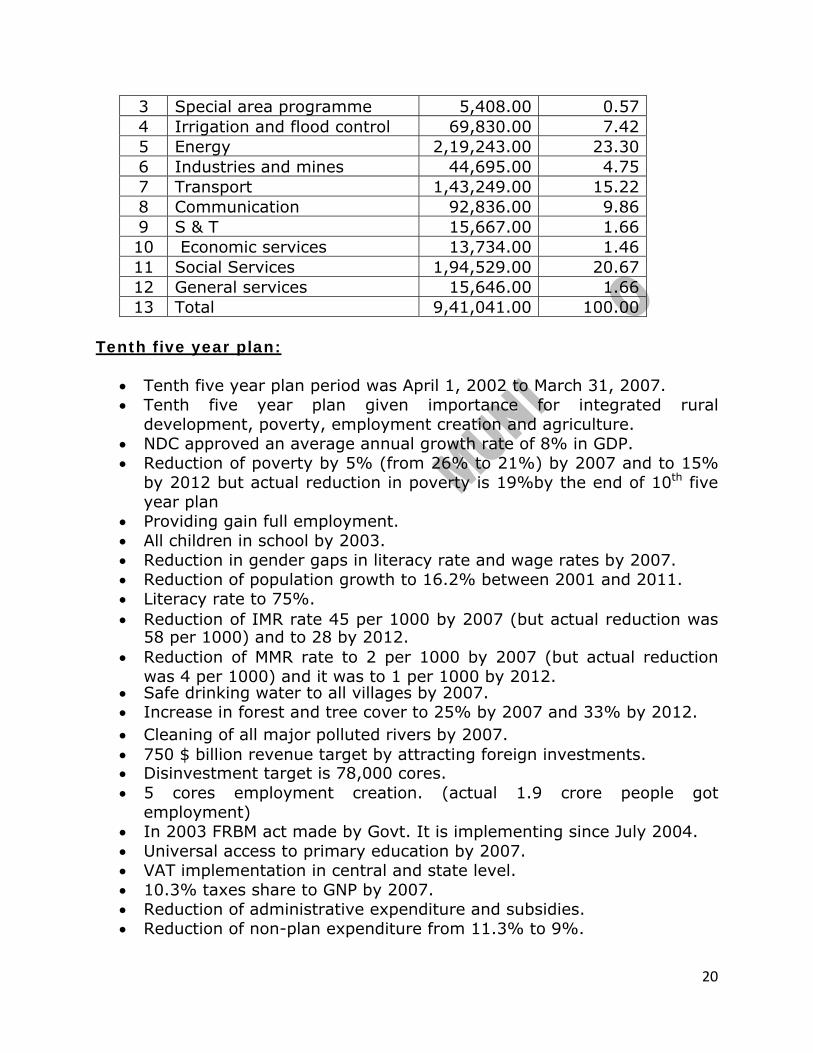
3 Special area programme 5,408.00 0.57 4 Irrigation and flood control 69,830.00 7.42 5 Energy 2,19,243.00 23.30 6 Industries and mines 44,695.00 4.75 7 Transport 1,43,249.00 15.22 8 Communication 92,836.00 9.86 9 S & T 15,667.00 1.66 10 Economic services 13,734.00 1.46 11 Social Services 1,94,529.00 20.67 12 General services 15,646.00 1.66 13 Total 9,41,041.00 100.00
Tenth five year plan:
• Tenth five year plan period was April 1, 2002 to March 31, 2007. • Tenth five year plan given importance for integrated rural
development, poverty, employment creation and agriculture. • NDC approved an average annual growth rate of 8% in GDP. • Reduction of poverty by 5% (from 26% to 21%) by 2007 and to 15%
by 2012 but actual reduction in poverty is 19%by the end of 10th five year plan
• Providing gain full employment. • All children in school by 2003. • Reduction in gender gaps in literacy rate and wage rates by 2007. • Reduction of population growth to 16.2% between 2001 and 2011. • Literacy rate to 75%. • Reduction of IMR rate 45 per 1000 by 2007 (but actual reduction was
58 per 1000) and to 28 by 2012. • Reduction of MMR rate to 2 per 1000 by 2007 (but actual reduction
was 4 per 1000) and it was to 1 per 1000 by 2012.
• Increase in forest and tree cover to 25% by 2007 and 33% by 2012. • Safe drinking water to all villages by 2007.
• Cleaning of all major polluted rivers by 2007. • 750 $ billion revenue target by attracting foreign investments. • Disinvestment target is 78,000 cores. • 5 cores employment creation. (actual 1.9 crore people got
employment) • In 2003 FRBM act made by Govt. It is implementing since July 2004. • Universal access to primary education by 2007. • VAT implementation in central and state level. • 10.3% taxes share to GNP by 2007. • Reduction of administrative expenditure and subsidies. • Reduction of non-plan expenditure from 11.3% to 9%.

21
Economic indicators of the 10th five year plan:
S.No
Economic indicators Target
Actual
1 Domestic Saving Rate at GDP
23.31
26.62%
2 Investment rate at GDP 28.41%
28.10%
3 ICOR -- 3.58% 4 Export growth rate
(annual) -- 12.38%
5 Import Growth rate (annual)
-- 17.13%
6 Current a/c deficit in GDP -- 1.57% (or) 1.6%
7 Average inflation based on WPI
5% 5.02%
8 Agriculture sector growth rate
4% 3.42%
9 Industry sector growth rate
8.90%
8.74%
10 Services sector growth rate
9.40%
9.30%
11 GDP target growth rate 8% 7.8% Average annual growth rate in different years:
Year Agriculture Industrial sector
Services sector
Average
2002-2003 -6.9% 7% 7.3% 3.8% 2003-2004 10% 7.6% 8.2% 8.5% 2004-2005 0% 9.8% 9.6% 7.5% 2005-2006 3.9% 9.6% 9.8% 9.0% 2006-2007 2.7% 10% 11.2% 9.4%
Average (2002-2007)
3.42% 8.74% 9.30% 7.6%
Review of the 10th five year plan:
• GDP growth rate was 7.8%. • Fiscal deficit was 8.4%. • Foreign currency reserves was 185 $ billions. • Foreign investments increase around 76%. • Poverty is 19% by 2007.

22
• Unemployment growth rate was 8.3%. • IMR was 58 per 1000. • MMR was 4 per 1000. • In August 15, 2003 PURA (Provision of Urban Amenities in Rural
Areas) announced by prime minister. • On November 14, 2004 NFWP (National Food Work Programme)
launched. • NREGP (National Rural Employment Guarantee Programme) launched
on November 2nd, 2006 at Anantapur district. NFWP and SJGSRY (Swarna Jayanthi Gram Swaraj Rojgar Yojana)
• Total public sector outlay was 15, 92,300 cores. But actual expenditure was 15, 25,639 cores. Out of this center’s share at Rs.9, 21,291 cores and states & UTs share at Rs.6, 71,009 cores. Sectoral allocation of public sector during 10th five year plan:
S.NO
Sectors expenditure (Rs. In core)
Percentage
1 Agriculture & allied activities 58,933.00 3.86 2 Rural development 1,21,928.00 7.99 3 Special area programme 20,879.00 1.37 4 Irrigation and flood control 1,03,315.00 6.77 5 Energy 4,03,927.00 26.47 6 Industries and mines 58,939.00 3.86 7 Transport 2,25,977.00 14.81 8 Communication 98,968.00 6.49 9 S & T 30,424.00 1.99
10 Economic services
38,630.00 2.53
11 Social Services 3,47,391.00 22.77 12 General services 16,328.00 1.07
13 Total 15,25,639.0
0 100.00
Eleventh Five Year Plan:
• Eleventh five year plan period was April 1, 2007 to March 31, 2012. • Planning commission prepared 11th five year plan approach paper on
19th October 2006. • Planning commission had meeting on November 8, 2007. Under the
chairman ship of prime minister and approved by the planning commission.
23
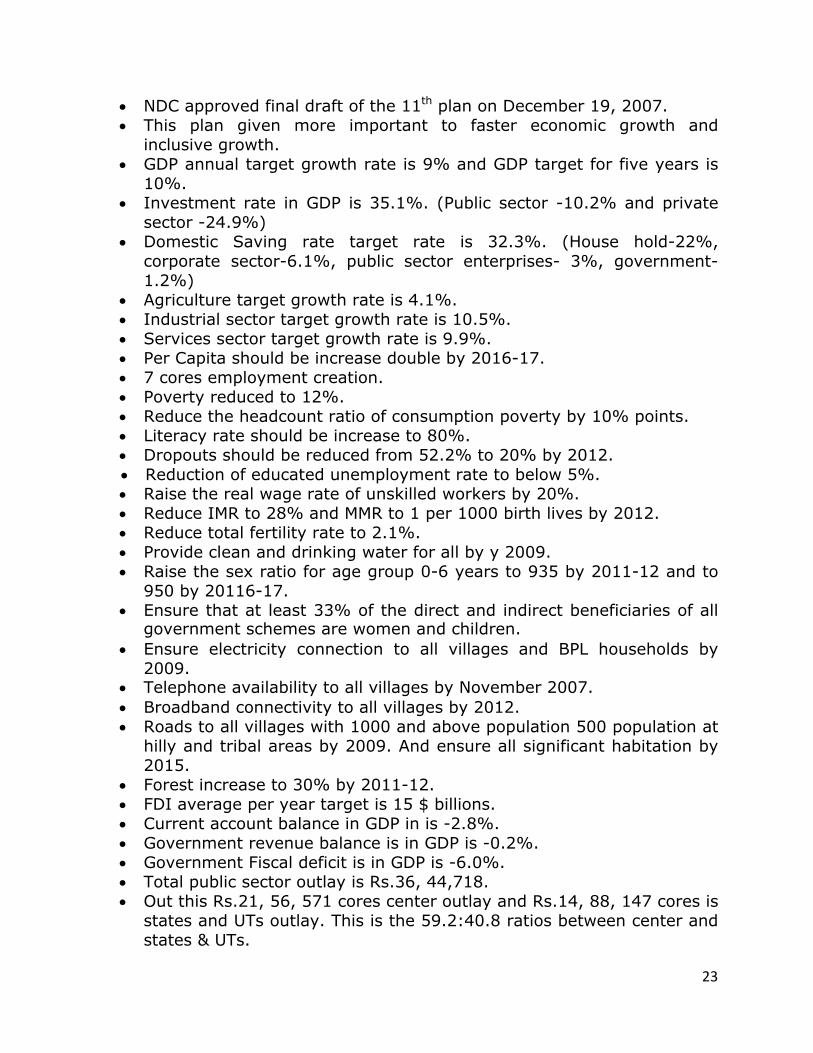
• NDC approved final draft of the 11th plan on December 19, 2007. • This plan given more important to faster economic growth and
inclusive growth. • GDP annual target growth rate is 9% and GDP target for five years is
10%. • Investment rate in GDP is 35.1%. (Public sector -10.2% and private
sector -24.9%) • Domestic Saving rate target rate is 32.3%. (House hold-22%,
corporate sector-6.1%, public sector enterprises- 3%, government- 1.2%)
• Agriculture target growth rate is 4.1%. • Industrial sector target growth rate is 10.5%. • Services sector target growth rate is 9.9%. • Per Capita should be increase double by 2016-17. • 7 cores employment creation. • Poverty reduced to 12%. • Reduce the headcount ratio of consumption poverty by 10% points. • Literacy rate should be increase to 80%. • Dropouts should be reduced from 52.2% to 20% by 2012. • Reduction of educated unemployment rate to below 5%. • Raise the real wage rate of unskilled workers by 20%. • Reduce IMR to 28% and MMR to 1 per 1000 birth lives by 2012. • Reduce total fertility rate to 2.1%. • Provide clean and drinking water for all by y 2009. • Raise the sex ratio for age group 0-6 years to 935 by 2011-12 and to
950 by 20116-17. • Ensure that at least 33% of the direct and indirect beneficiaries of all
government schemes are women and children. • Ensure electricity connection to all villages and BPL households by
2009. • Telephone availability to all villages by November 2007. • Broadband connectivity to all villages by 2012. • Roads to all villages with 1000 and above population 500 population at
hilly and tribal areas by 2009. And ensure all significant habitation by 2015.
• Forest increase to 30% by 2011-12. • FDI average per year target is 15 $ billions. • Current account balance in GDP in is -2.8%. • Government revenue balance is in GDP is -0.2%. • Government Fiscal deficit is in GDP is -6.0%. • Total public sector outlay is Rs.36, 44,718. • Out this Rs.21, 56, 571 cores center outlay and Rs.14, 88, 147 cores is
states and UTs outlay. This is the 59.2:40.8 ratios between center and states & UTs.

24
Sectoral allocation of public sector during 11th five year plan:
S.NO
Sectors expenditure (Rs. In core)
Percentage
1 Agriculture & allied activities 6,74,105.00 18.5% 2 Energy 8,54,123.00 23.4% 3 Industries and mines 1,53,600.00 4.2% 4 Transport 6,67,793.00 18.3% 5 S & T 87,933.00 2.4% 6 Economic services 62,523.00 1.7%
7 General services
42,283.00 1.2%
8 Social Services 11,02,327.0
0 30.9%
9 Total 100% 11th five year plan power production target is 92, 577 MW. Out of this 16,553 MW is with Hydro production, 58,644 MW is with Thermal production, 3,380 MW is with nuclear production, 14000 MW is with wind production.
Planning Commission
• Since the Prime Minister of India happens to be the ex-officio chairperson of planning commission of India, the position of the deputy chairperson has great significance.
• The appointments are made by the President of India, on the advice of the Prime minister.
• The appointees typically have either been economists of repute or political appointees.
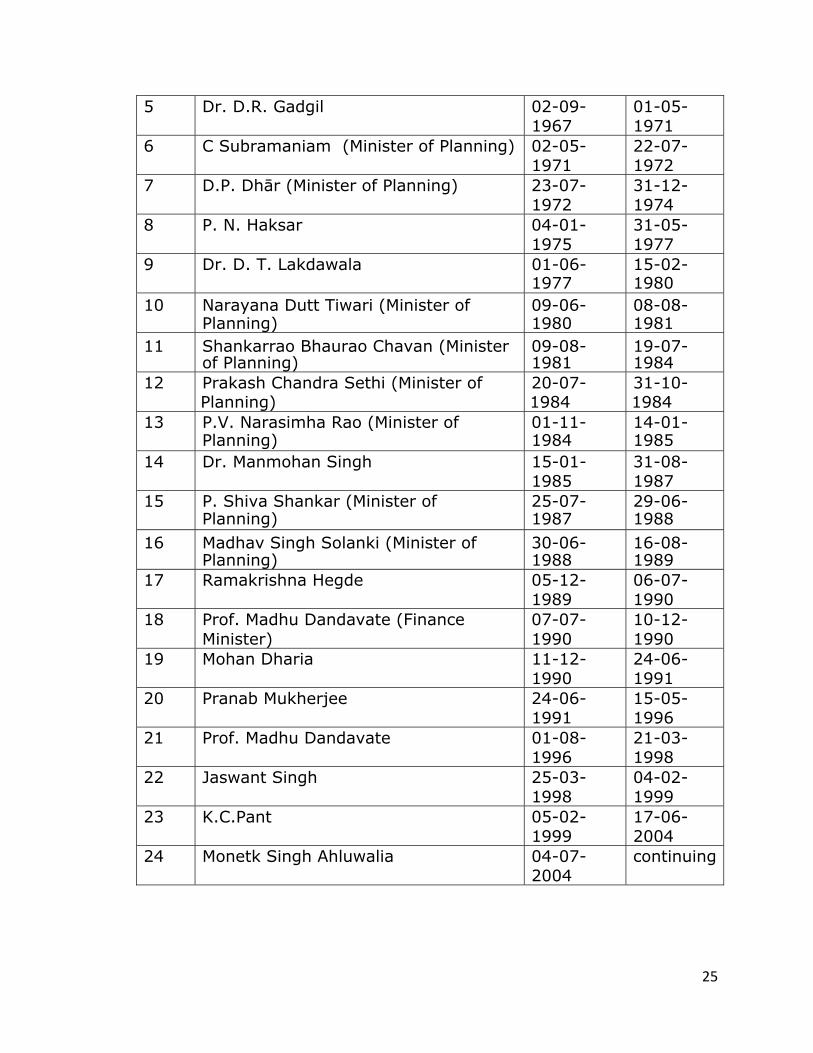
Deputy Chairpersons of the Indian Planning Commission
S.NO Deputy Chairpersons from to 1 Gulzari Lal Nanda (Minister of
Planning) 1951 1953
2 V.T. Krishnamachari 17-02-1953
21-06-1960
3 Gulzari Lal Nanda (Minister of Planning)
22-06-1960
21-09-1963
3 C.M. Trivedi 22-09-1963
02-12-1963
4 Ashok Mehta (Minister of Planning) 03-12-1963
01-09-1967
25
5 Dr. D.R. Gadgil 02-09-1967
01-05-1971
6 C Subramaniam (Minister of Planning) 02-05-1971
22-07-1972
7 D.P. Dhār (Minister of Planning) 23-07-1972
31-12-1974
8 P. N. Haksar 04-01-1975
31-05-1977
9 Dr. D. T. Lakdawala 01-06-1977
15-02-1980
10 Narayana Dutt Tiwari (Minister of Planning)
09-06-1980
08-08-1981
11 Shankarrao Bhaurao Chavan (Minister of Planning)
09-08-1981
19-07-1984
12 Prakash Chandra Sethi (Minister of Planning)
20-07-1984
31-10-1984
13 P.V. Narasimha Rao (Minister of Planning)
01-11-1984
14-01-1985
14 Dr. Manmohan Singh 15-01-1985
31-08-1987
15 P. Shiva Shankar (Minister of Planning)
25-07-1987
29-06-1988
16 Madhav Singh Solanki (Minister of Planning)
30-06-1988
16-08-1989
17 Ramakrishna Hegde 05-12-1989
06-07-1990
18 Prof. Madhu Dandavate (Finance Minister)
07-07-1990
10-12-1990
19 Mohan Dharia 11-12-1990
24-06-1991
20 Pranab Mukherjee 24-06-1991
15-05-1996
21 Prof. Madhu Dandavate 01-08-1996
21-03-1998
22 Jaswant Singh 25-03-1998
04-02-1999
23 K.C.Pant 05-02-1999
17-06-2004
24 Monetk Singh Ahluwalia 04-07-2004
continuing

26
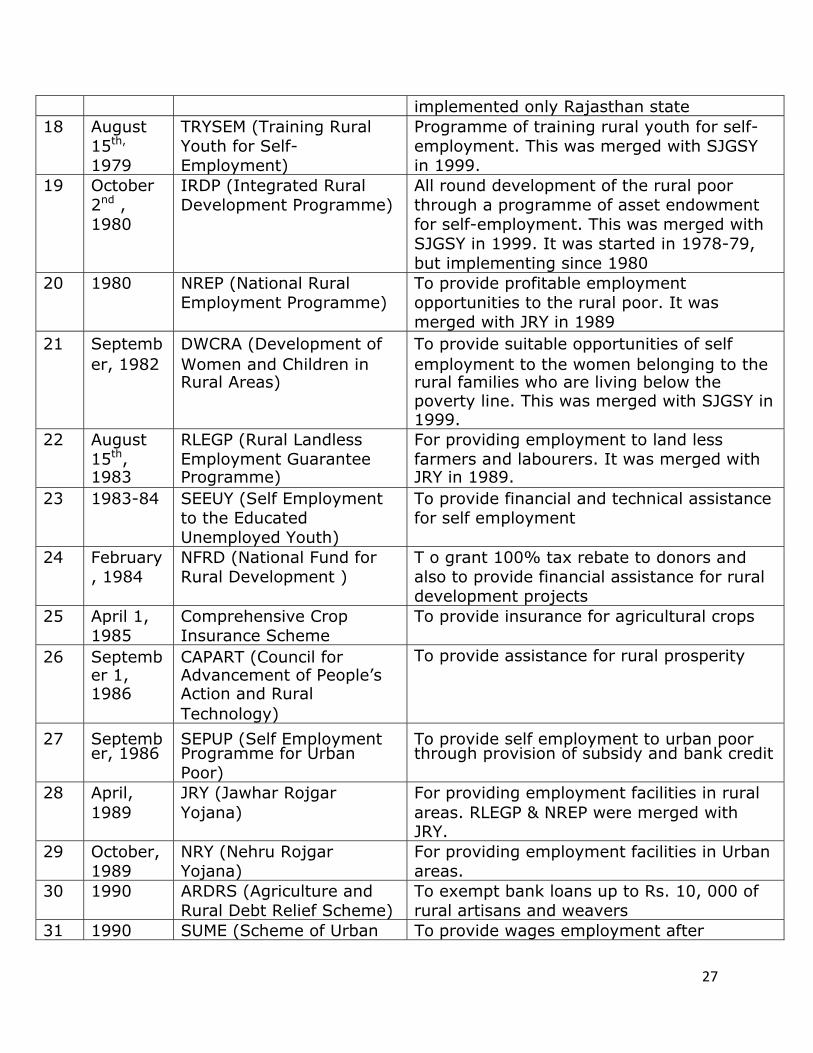
Development Programmes
S.No
Year Programme Objectives or purpose
1 1952 CDP (Community development programme)
Over all development of rural areas with people’s participation
2 1960-61 IADP (Intensive Agriculture District Programme)
To provide loan, seeds, fertilizer tools to the farmers
3 1966-67 HYVP (High Yielding Variety Programme)
To increase productivity of food grains by adopting latest varieties of inputs for crops
4 July 1969
Rural Electrification Corporation
Electrification in rural areas
5 1972-73 Employment Guarantee Scheme of Maharashtra
To assist the economically weaker sections of the rural society
6 1972-73 Accelerated Rural Water Supply Programme (ARWSP)
To provide drinking water in the villages
7 1973-74 DPAP (Drought Prone Area Programme)
To try an expedient for protection from drought by achieving environmental balance and by developing the ground water
8 1972-73 CSRE (Crash Scheme for Rural Employment)
To provide employment facilities in rural areas
9 1973-74 MFALA (Marginal Farmer and Agriculture Labour Agency)
For technical and financial assistance to marginal and small farmers and agriculture labour
10 1974-75 SFDA (Small Farmer Development Agency)
For technical and financial assistance to small farmers
11 1974-75 CADP (Command Area Development Programme )
To ensure better and rapid utilization of irrigation capacities of medium and large projects
12 1974 MNP (Minimum Needs Programme)
To provide basic necessaries for people
13 1975 Twenty points programme To poverty eradication and raising the standard of living of people
14 1977 NIRD (National Institute of Rural Development)
To provide training, investigation and advisory organization for rural development
15 1977-78 DDA (Desert Development Programme)
For controlling the desert expansion and maintaining environmental balance
16 1977-78 Food for Work Programme Providing food grains to labour for the works of development
17 1977-78 Antyodaya Yojana To make the poorest families of the village economically independent. It was
27
implemented only Rajasthan state 18 August
15th, 1979
TRYSEM (Training Rural Youth for Self-Employment)
Programme of training rural youth for self-employment. This was merged with SJGSY in 1999.
19 October 2nd , 1980
IRDP (Integrated Rural Development Programme)
All round development of the rural poor through a programme of asset endowment for self-employment. This was merged with SJGSY in 1999. It was started in 1978-79, but implementing since 1980
20 1980 NREP (National Rural Employment Programme)
To provide profitable employment opportunities to the rural poor. It was merged with JRY in 1989
21 September, 1982
DWCRA (Development of Women and Children in Rural Areas)
To provide suitable opportunities of self employment to the women belonging to the rural families who are living below the poverty line. This was merged with SJGSY in 1999.
22 August 15th, 1983
RLEGP (Rural Landless Employment Guarantee Programme)
For providing employment to land less farmers and labourers. It was merged with JRY in 1989.
23 1983-84 SEEUY (Self Employment to the Educated Unemployed Youth)
To provide financial and technical assistance for self employment
24 February, 1984
NFRD (National Fund for Rural Development )
T o grant 100% tax rebate to donors and also to provide financial assistance for rural development projects
25 April 1, 1985
Comprehensive Crop Insurance Scheme
To provide insurance for agricultural crops
26 September 1, 1986
CAPART (Council for Advancement of People’s Action and Rural Technology)
To provide assistance for rural prosperity
27 September, 1986
SEPUP (Self Employment Programme for Urban Poor)
To provide self employment to urban poor through provision of subsidy and bank credit
28 April, 1989
JRY (Jawhar Rojgar Yojana)
For providing employment facilities in rural areas. RLEGP & NREP were merged with JRY.
29 October, 1989
NRY (Nehru Rojgar Yojana)
For providing employment facilities in Urban areas.
30 1990 ARDRS (Agriculture and Rural Debt Relief Scheme)
To exempt bank loans up to Rs. 10, 000 of rural artisans and weavers
31 1990 SUME (Scheme of Urban To provide wages employment after
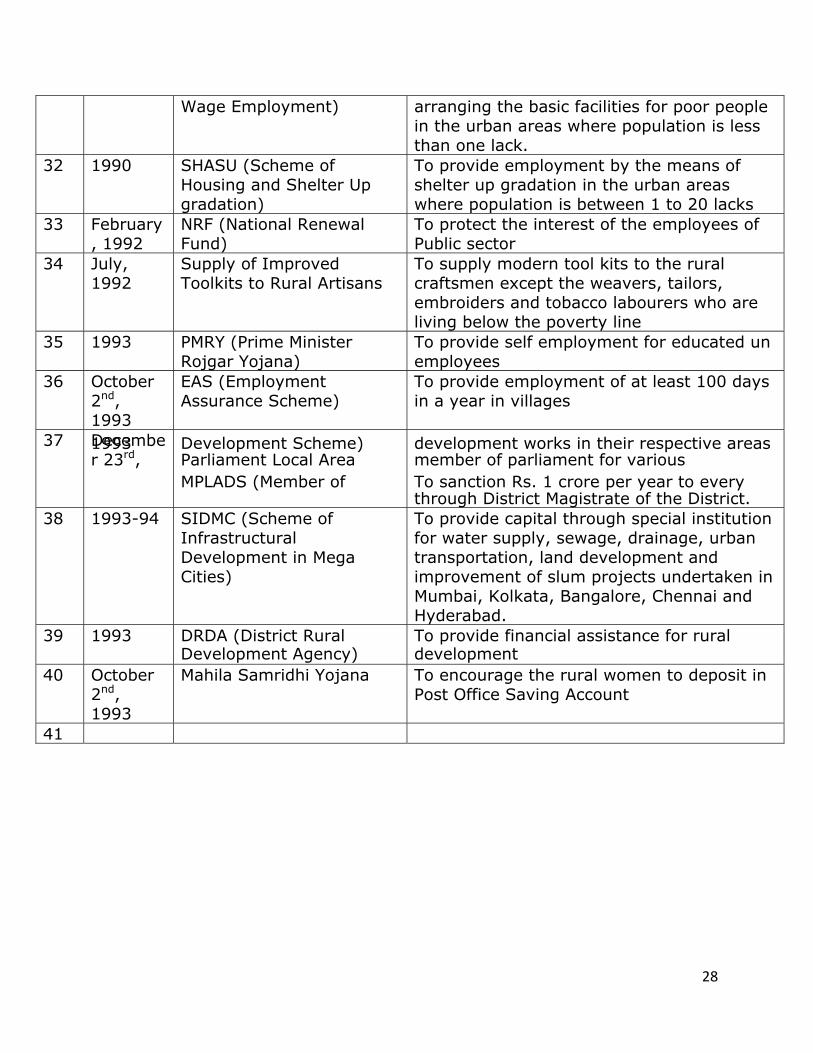
28
Wage Employment) arranging the basic facilities for poor people in the urban areas where population is less than one lack.
32 1990 SHASU (Scheme of Housing and Shelter Up gradation)
To provide employment by the means of shelter up gradation in the urban areas where population is between 1 to 20 lacks
33 February, 1992
NRF (National Renewal Fund)
To protect the interest of the employees of Public sector
34 July, 1992
Supply of Improved Toolkits to Rural Artisans
To supply modern tool kits to the rural craftsmen except the weavers, tailors, embroiders and tobacco labourers who are living below the poverty line
35 1993 PMRY (Prime Minister Rojgar Yojana)
To provide self employment for educated un employees
36 October 2nd, 1993
EAS (Employment Assurance Scheme)
To provide employment of at least 100 days in a year in villages
37 December 23rd, 1993
MPLADS (Member of Parliament Local Area Development Scheme)
To sanction Rs. 1 crore per year to every member of parliament for various development works in their respective areas
through District Magistrate of the District. 38 1993-94 SIDMC (Scheme of
Infrastructural Development in Mega Cities)
To provide capital through special institution for water supply, sewage, drainage, urban transportation, land development and improvement of slum projects undertaken in Mumbai, Kolkata, Bangalore, Chennai and Hyderabad.
39 1993 DRDA (District Rural Development Agency)
To provide financial assistance for rural development
40 October 2nd, 1993
Mahila Samridhi Yojana To encourage the rural women to deposit in Post Office Saving Account
41