Embed Size (px)
Citation preview
Unit 3, Lesson 1: Understanding ProportionalRelationshipsLet’s study some graphs.
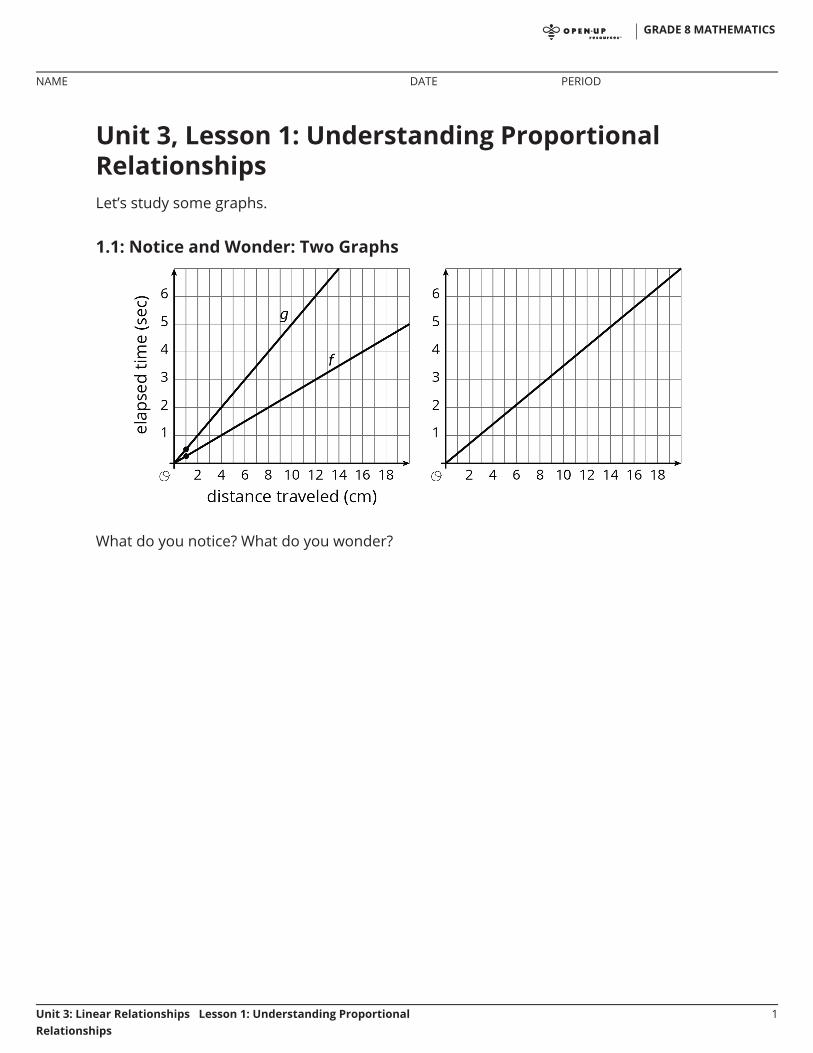
1.1: Notice and Wonder: Two Graphs
What do you notice? What do you wonder?
GRADE 8 MATHEMATICS
NAME DATE PERIOD
Unit 3: Linear Relationships Lesson 1: Understanding ProportionalRelationships
1
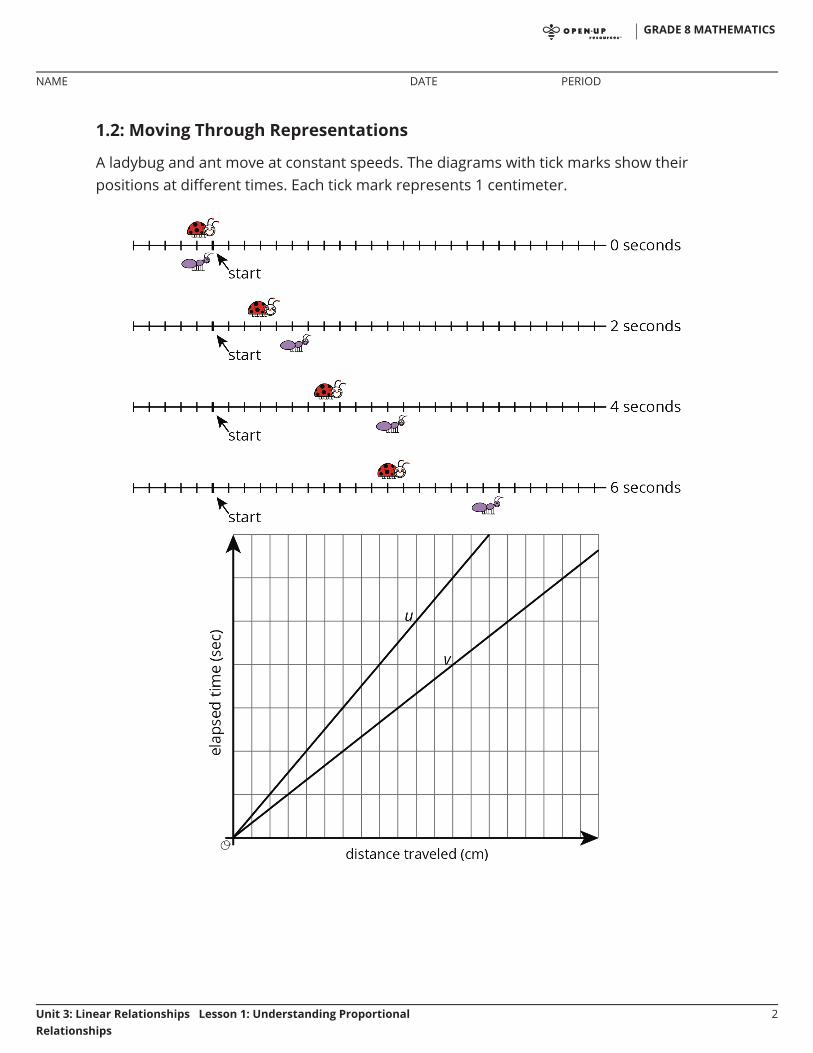
1.2: Moving Through Representations
A ladybug and ant move at constant speeds. The diagrams with tick marks show theirpositions at different times. Each tick mark represents 1 centimeter.
GRADE 8 MATHEMATICS
NAME DATE PERIOD
Unit 3: Linear Relationships Lesson 1: Understanding ProportionalRelationships
2
1. Lines and also show the positions of the two bugs. Which line shows theladybug’s movement? Which line shows the ant’s movement? Explain your reasoning.
2. How long does it take the ladybug to travel 12 cm? The ant?
3. Scale the vertical and horizontal axes by labeling each grid line with a number. Youwill need to use the time and distance information shown in the tick-mark diagrams.
4. Mark and label the point on line and the point on line that represent the time andposition of each bug after travelling 1 cm.
Are you ready for more?
1. How fast is each bug traveling?
2. Will there ever be a time when the purple bug (ant) is twice as far away from the startas the red bug (ladybug)? Explain or show your reasoning.
1.3: Moving Twice as Fast
Refer to the tick-mark diagrams and graph in the earlier activity when needed.
1. Imagine a bug that is moving twice as fast as the ladybug. On each tick-markdiagram, mark the position of this bug.
2. Plot this bug’s positions on the coordinate axes with lines and , and connect themwith a line.
3. Write an equation for each of the three lines.
GRADE 8 MATHEMATICS
NAME DATE PERIOD
Unit 3: Linear Relationships Lesson 1: Understanding ProportionalRelationships
3
Lesson 1 Summary
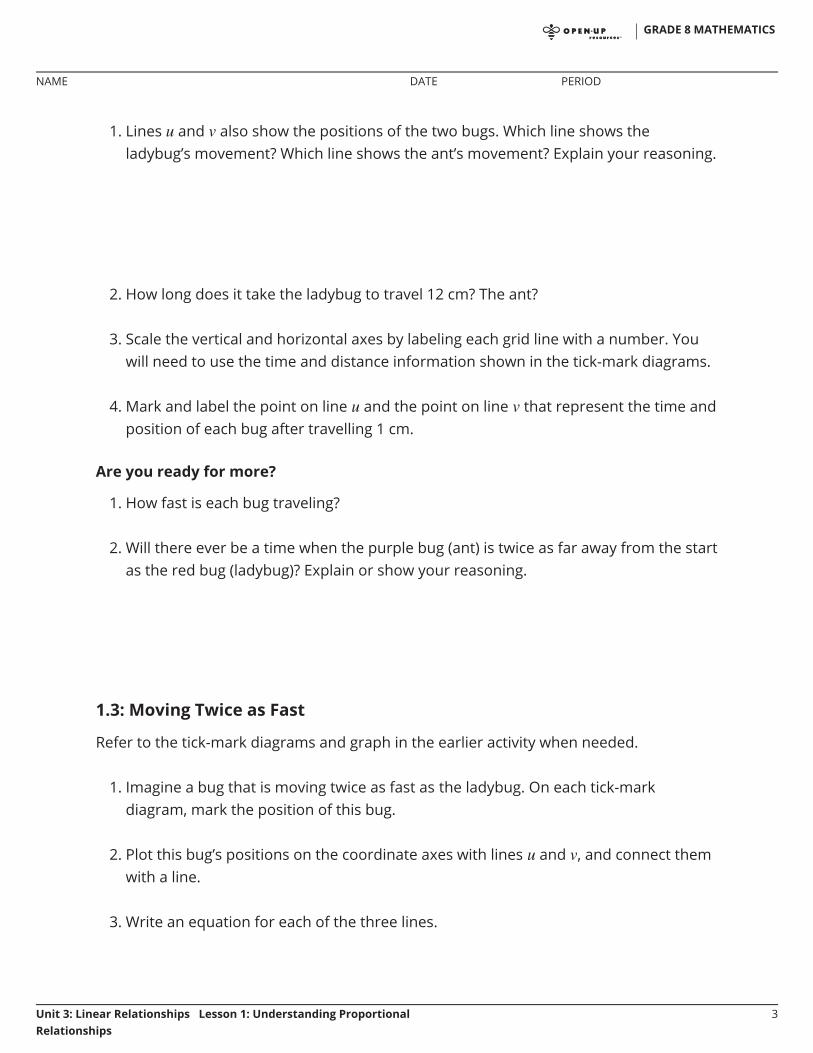
Graphing is a way to help us make sense of relationships. But the graph of a line on acoordinate axes without scale or labels isn’t very helpful. For example, let’s say we knowthat on longer bike rides Kiran can ride 4 miles every 16 minutes and Mai can ride 4 milesevery 12 minutes. Here are the graphs of these relationships:
Without labels we can’t even tell which line is Kiran and which is Mai! Without labels and ascale on the axes, we can’t use these graphs to answer questions like:
1. Which graph goes with which rider?
2. Who rides faster?
3. If Kiran and Mai start a bike trip at the same time, how far are they after 24 minutes?
4. How long will it take each of them to reach the end of the 12 mile bike path?
GRADE 8 MATHEMATICS
NAME DATE PERIOD
Unit 3: Linear Relationships Lesson 1: Understanding ProportionalRelationships
4
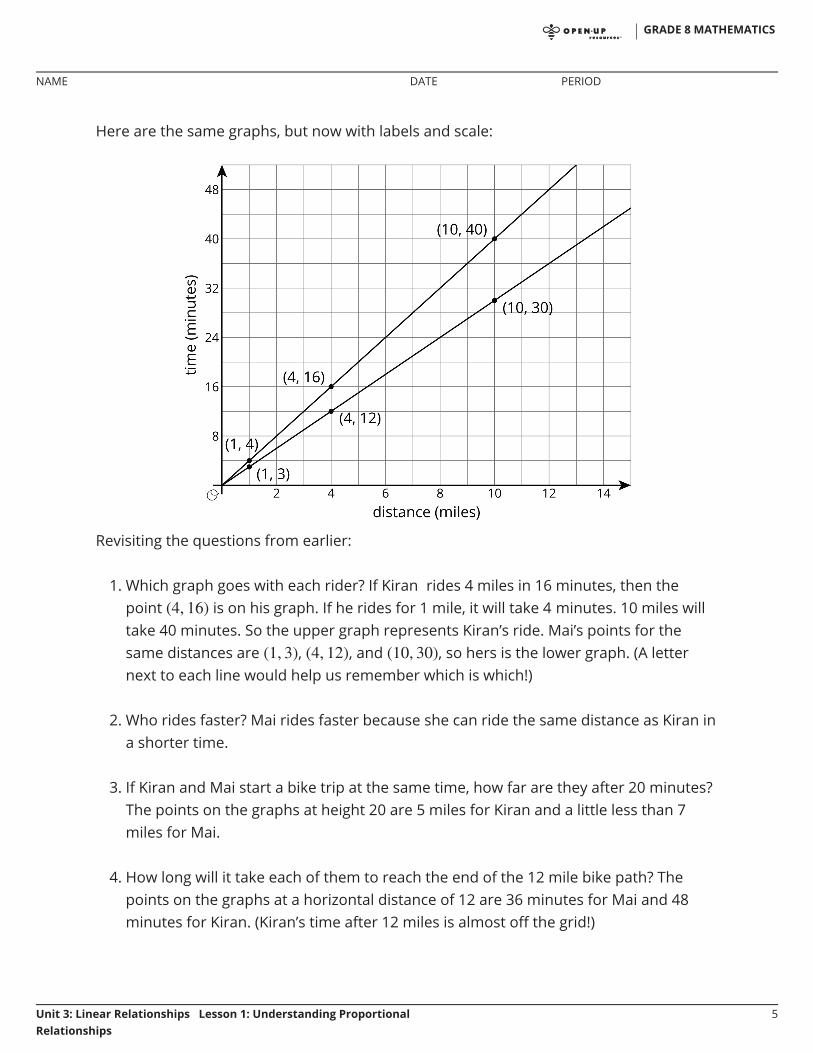
Here are the same graphs, but now with labels and scale:
Revisiting the questions from earlier:
1. Which graph goes with each rider? If Kiran rides 4 miles in 16 minutes, then thepoint is on his graph. If he rides for 1 mile, it will take 4 minutes. 10 miles willtake 40 minutes. So the upper graph represents Kiran’s ride. Mai’s points for thesame distances are , , and , so hers is the lower graph. (A letternext to each line would help us remember which is which!)
2. Who rides faster? Mai rides faster because she can ride the same distance as Kiran ina shorter time.
3. If Kiran and Mai start a bike trip at the same time, how far are they after 20 minutes?The points on the graphs at height 20 are 5 miles for Kiran and a little less than 7miles for Mai.
4. How long will it take each of them to reach the end of the 12 mile bike path? Thepoints on the graphs at a horizontal distance of 12 are 36 minutes for Mai and 48minutes for Kiran. (Kiran’s time after 12 miles is almost off the grid!)
GRADE 8 MATHEMATICS
NAME DATE PERIOD
Unit 3: Linear Relationships Lesson 1: Understanding ProportionalRelationships
5
Unit 3, Lesson 1: Understanding ProportionalRelationships
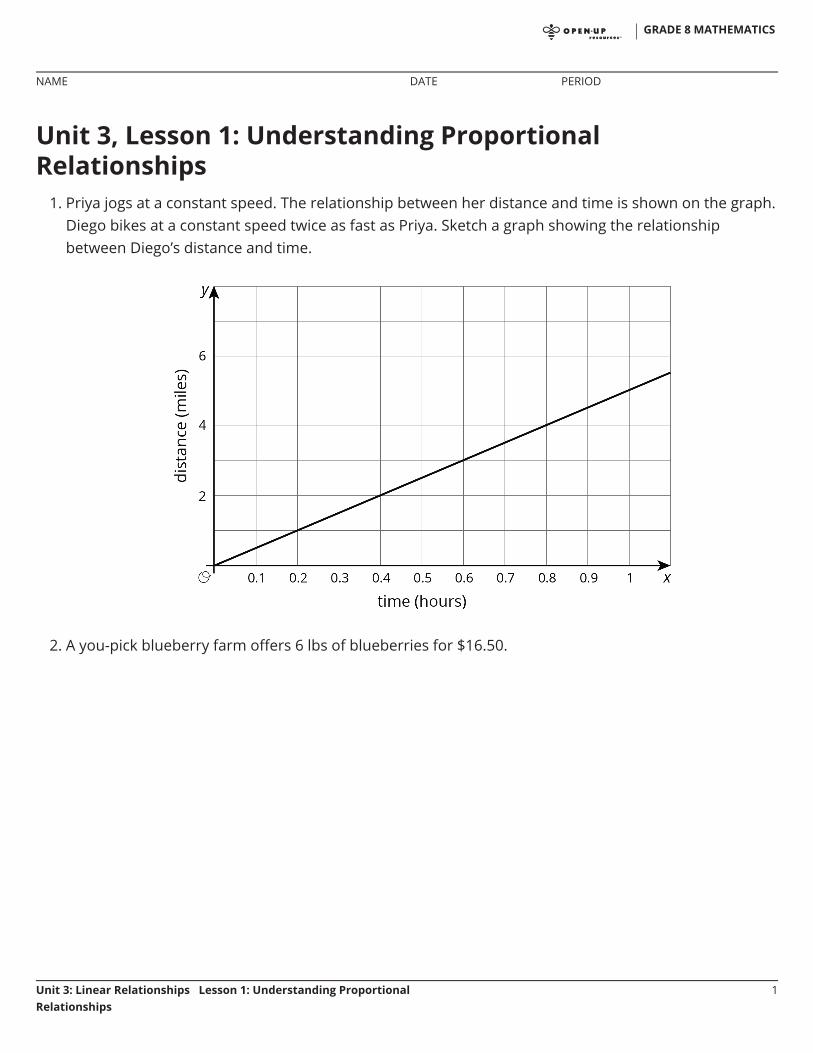
1. Priya jogs at a constant speed. The relationship between her distance and time is shown on the graph.Diego bikes at a constant speed twice as fast as Priya. Sketch a graph showing the relationshipbetween Diego’s distance and time.
2. A you-pick blueberry farm offers 6 lbs of blueberries for $16.50.
GRADE 8 MATHEMATICS
NAME DATE PERIOD
Unit 3: Linear Relationships Lesson 1: Understanding ProportionalRelationships
1
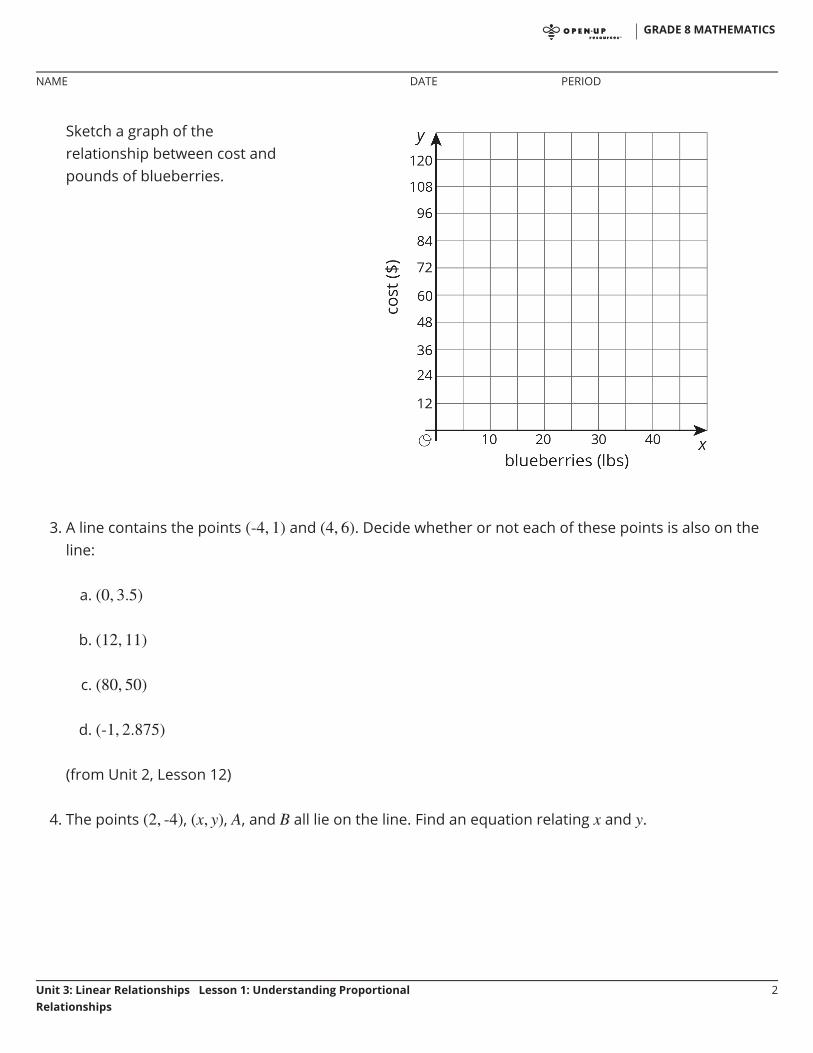
3. A line contains the points and . Decide whether or not each of these points is also on theline:
a.
b.
c.
d.
(from Unit 2, Lesson 12)
4. The points , , , and all lie on the line. Find an equation relating and .
Sketch a graph of therelationship between cost andpounds of blueberries.
GRADE 8 MATHEMATICS
NAME DATE PERIOD
Unit 3: Linear Relationships Lesson 1: Understanding ProportionalRelationships
2
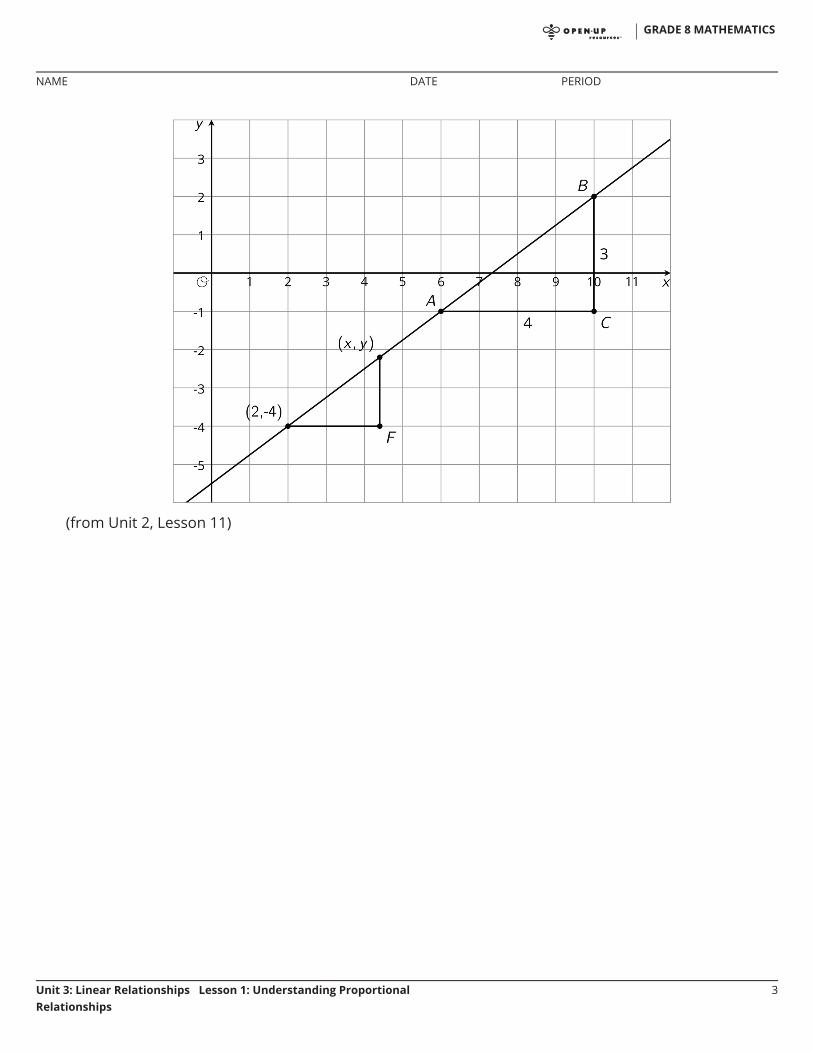
(from Unit 2, Lesson 11)
GRADE 8 MATHEMATICS
NAME DATE PERIOD
Unit 3: Linear Relationships Lesson 1: Understanding ProportionalRelationships
3
Unit 3, Lesson 2: Graphs of ProportionalRelationshipsLet's think about scale.
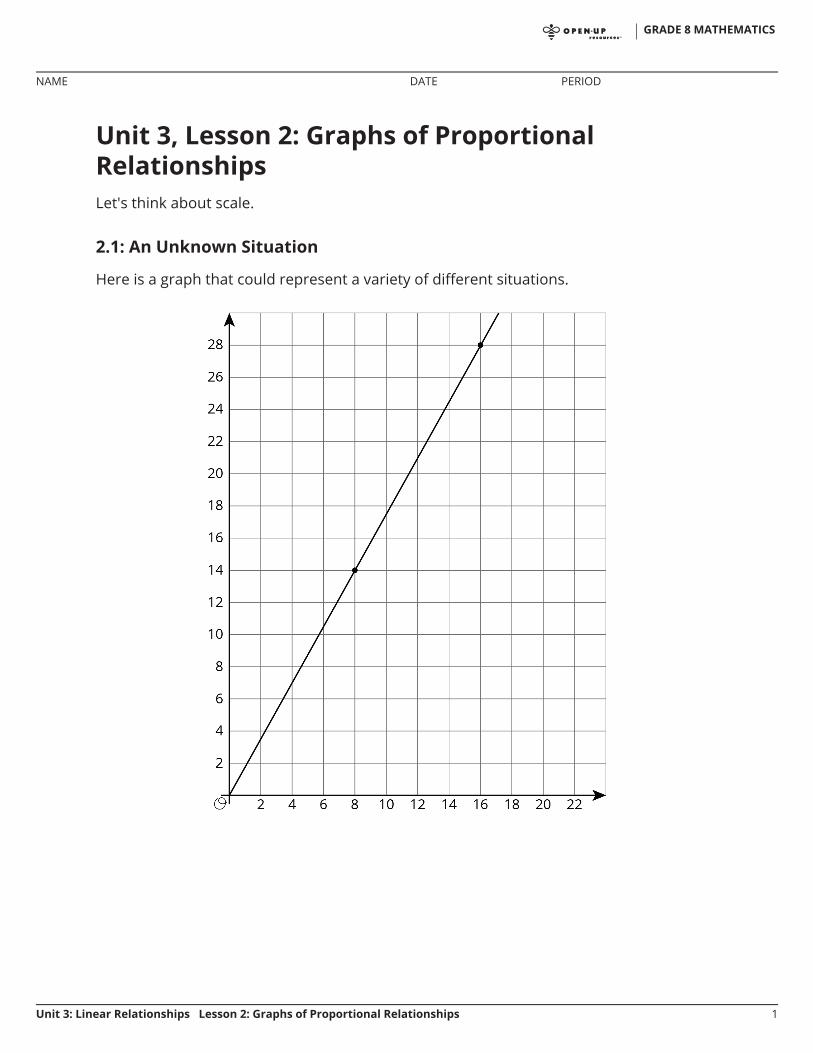
2.1: An Unknown Situation
Here is a graph that could represent a variety of different situations.
GRADE 8 MATHEMATICS
NAME DATE PERIOD
Unit 3: Linear Relationships Lesson 2: Graphs of Proportional Relationships 1
2.2: Card Sort: Proportional Relationships
You teacher will give you 12 graphs of proportional relationships.
1. Sort the graphs into groups based on what proportional relationship they represent.
2. Write an equation for each different proportional relationship you find.
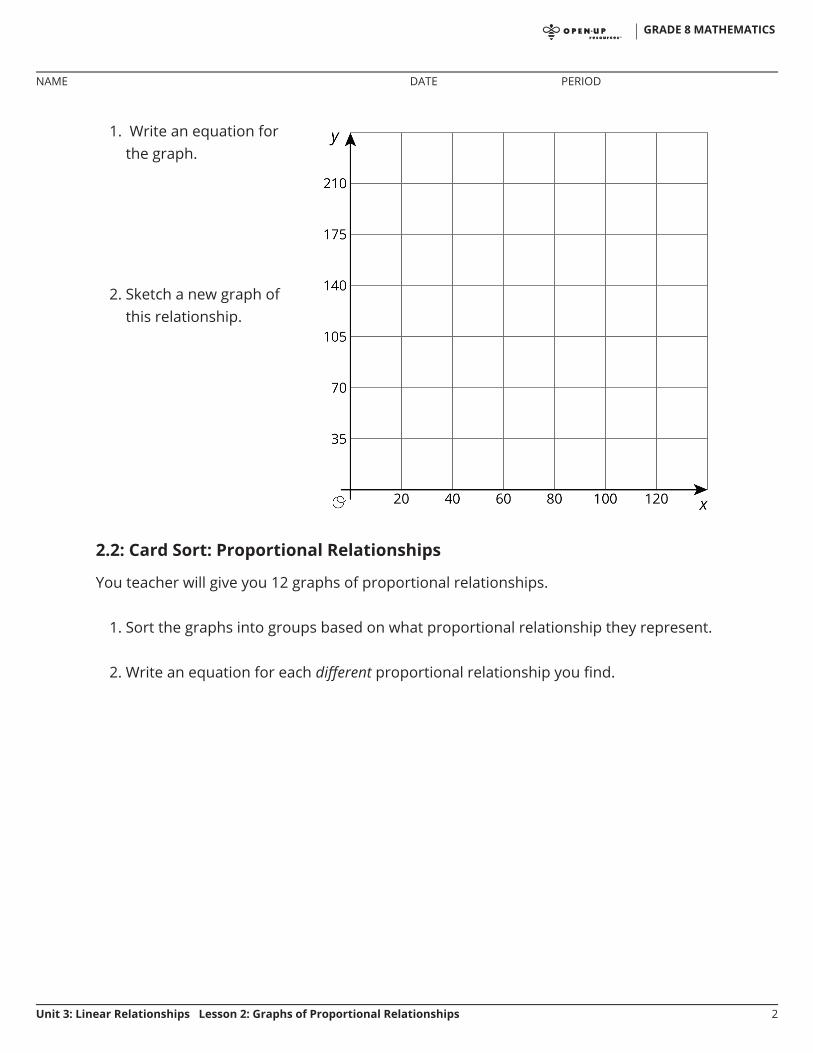
1. Write an equation forthe graph.
2. Sketch a new graph ofthis relationship.
GRADE 8 MATHEMATICS
NAME DATE PERIOD
Unit 3: Linear Relationships Lesson 2: Graphs of Proportional Relationships 2
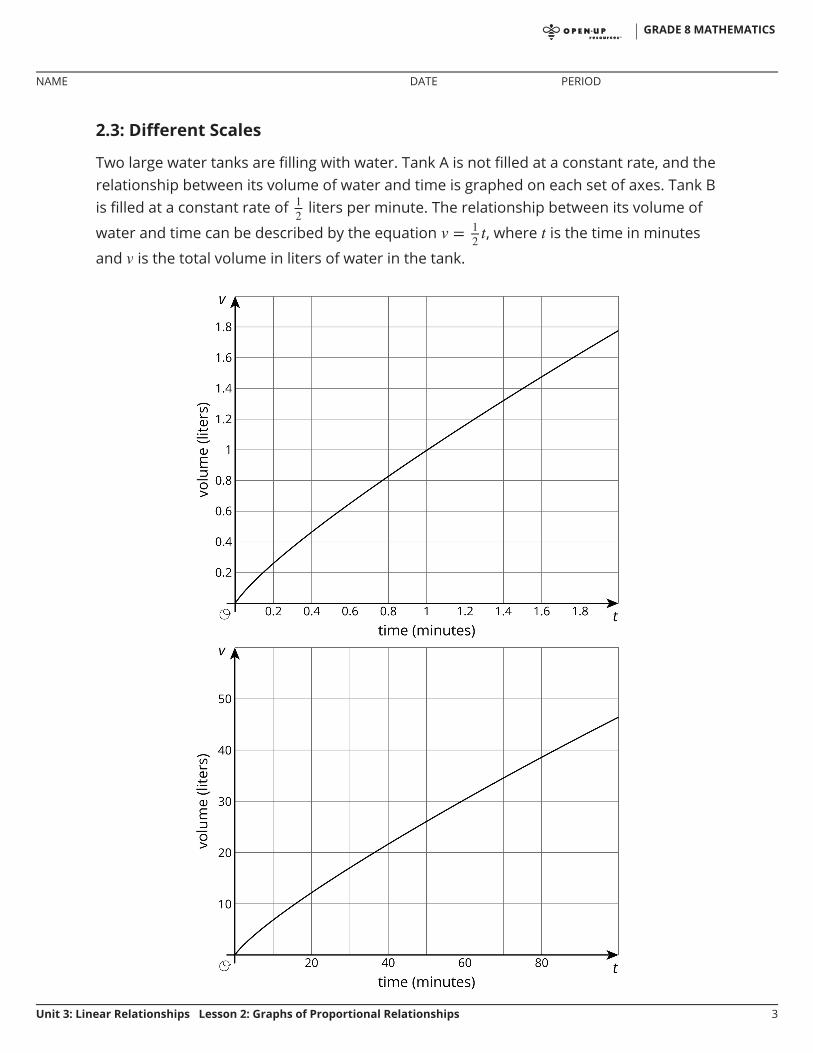
2.3: Different Scales
Two large water tanks are filling with water. Tank A is not filled at a constant rate, and therelationship between its volume of water and time is graphed on each set of axes. Tank Bis filled at a constant rate of liters per minute. The relationship between its volume of
water and time can be described by the equation , where is the time in minutes
and is the total volume in liters of water in the tank.
GRADE 8 MATHEMATICS
NAME DATE PERIOD
Unit 3: Linear Relationships Lesson 2: Graphs of Proportional Relationships 3
1. Sketch and label a graph of the relationship between the volume of water and timefor Tank B on each of the axes.
2. Answer the following questions and say which graph you used to find your answer.a. After 30 seconds, which tank has the most water?
b. At approximately what times do both tanks have the same amount of water?
c. At approximately what times do both tanks contain 1 liter of water? 20 liters?
Are you ready for more?
A giant tortoise travels at 0.17 miles per hour and an arctic hare travels at 37 miles perhour.
1. Draw separate graphs that show the relationship between time elapsed, in hours,and distance traveled, in miles, for both the tortoise and the hare.
2. Would it be helpful to try to put both graphs on the same pair of axes? Why or whynot?
3. The tortoise and the hare start out together and after half an hour the hare stops totake a rest. How long does it take the tortoise to catch up?
Lesson 2 Summary
The scales we choose when graphing a relationship often depend on what informationwe want to know. For example, say two water tanks are filled at different constant rates.The relationship between time in minutes and volume in liters of tank A is given by
. For tank B the relationship is .
GRADE 8 MATHEMATICS
NAME DATE PERIOD
Unit 3: Linear Relationships Lesson 2: Graphs of Proportional Relationships 4
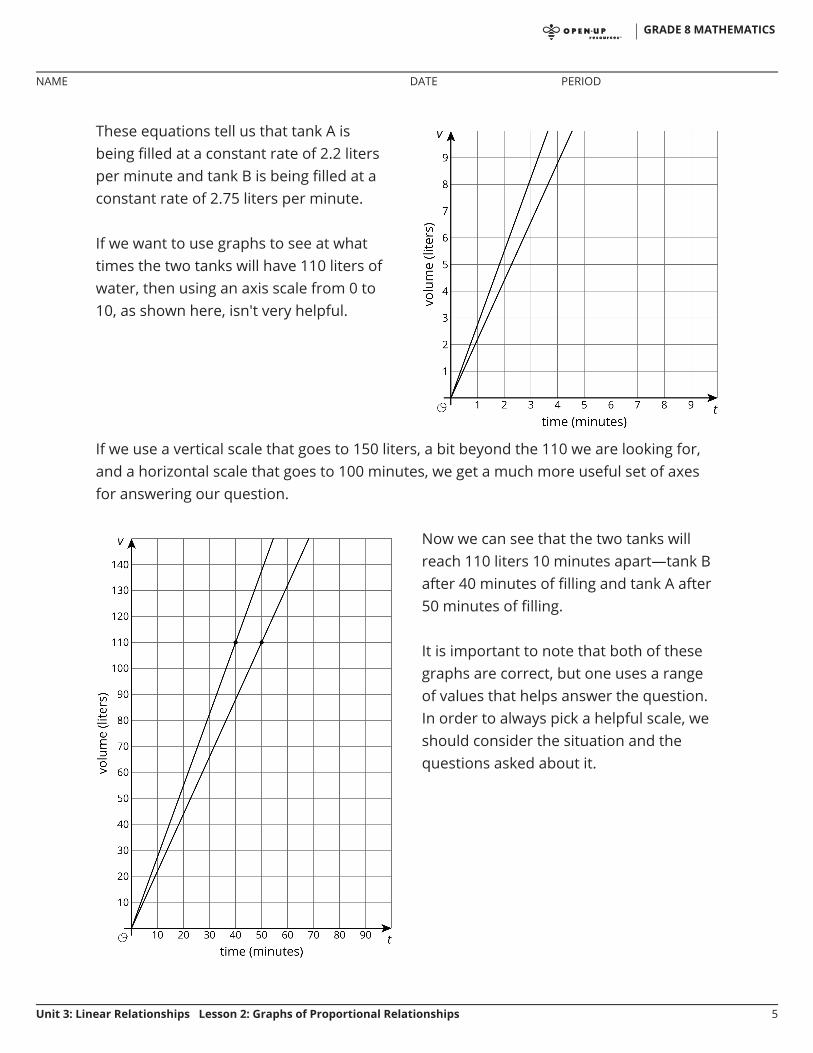
If we use a vertical scale that goes to 150 liters, a bit beyond the 110 we are looking for,and a horizontal scale that goes to 100 minutes, we get a much more useful set of axesfor answering our question.
These equations tell us that tank A isbeing filled at a constant rate of 2.2 litersper minute and tank B is being filled at aconstant rate of 2.75 liters per minute.
If we want to use graphs to see at whattimes the two tanks will have 110 liters ofwater, then using an axis scale from 0 to10, as shown here, isn't very helpful.
Now we can see that the two tanks willreach 110 liters 10 minutes apart—tank Bafter 40 minutes of filling and tank A after50 minutes of filling.
It is important to note that both of thesegraphs are correct, but one uses a rangeof values that helps answer the question.In order to always pick a helpful scale, weshould consider the situation and thequestions asked about it.
GRADE 8 MATHEMATICS
NAME DATE PERIOD
Unit 3: Linear Relationships Lesson 2: Graphs of Proportional Relationships 5
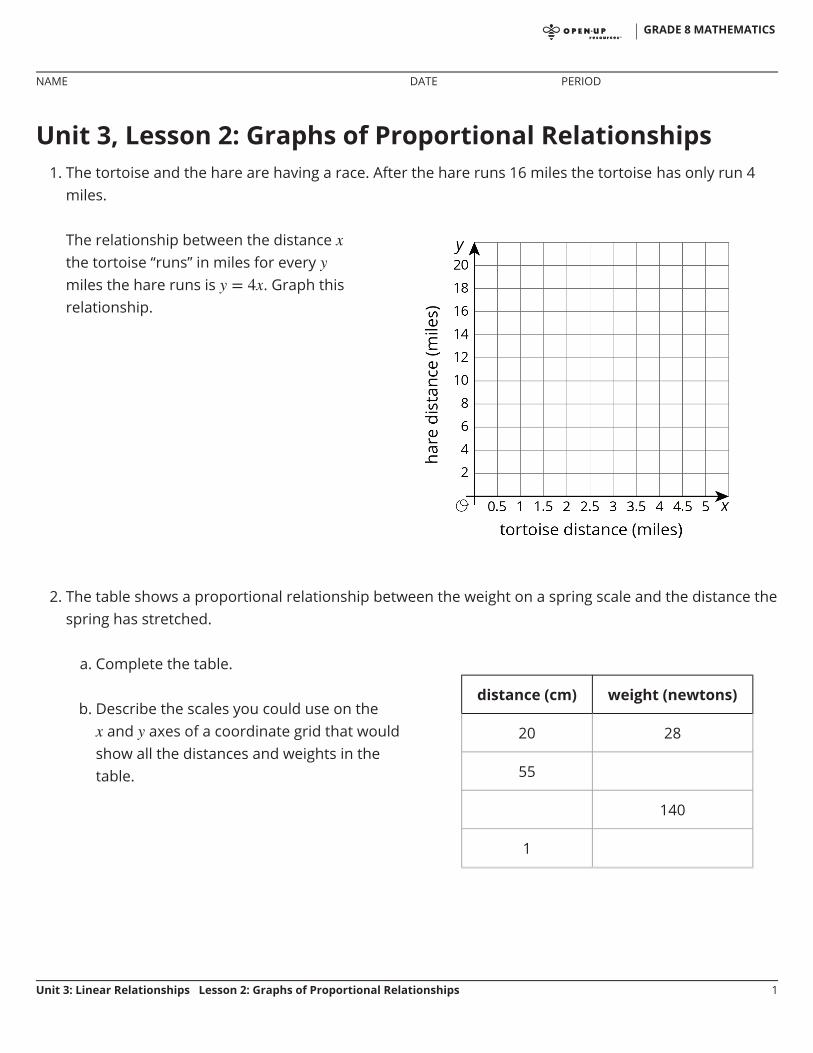
Unit 3, Lesson 2: Graphs of Proportional Relationships1. The tortoise and the hare are having a race. After the hare runs 16 miles the tortoise has only run 4
miles.
2. The table shows a proportional relationship between the weight on a spring scale and the distance thespring has stretched.
The relationship between the distancethe tortoise “runs” in miles for everymiles the hare runs is . Graph thisrelationship.
a. Complete the table.
b. Describe the scales you could use on theand axes of a coordinate grid that would
show all the distances and weights in thetable.
distance (cm) weight (newtons)
20 28
55
140
1
GRADE 8 MATHEMATICS
NAME DATE PERIOD
Unit 3: Linear Relationships Lesson 2: Graphs of Proportional Relationships 1
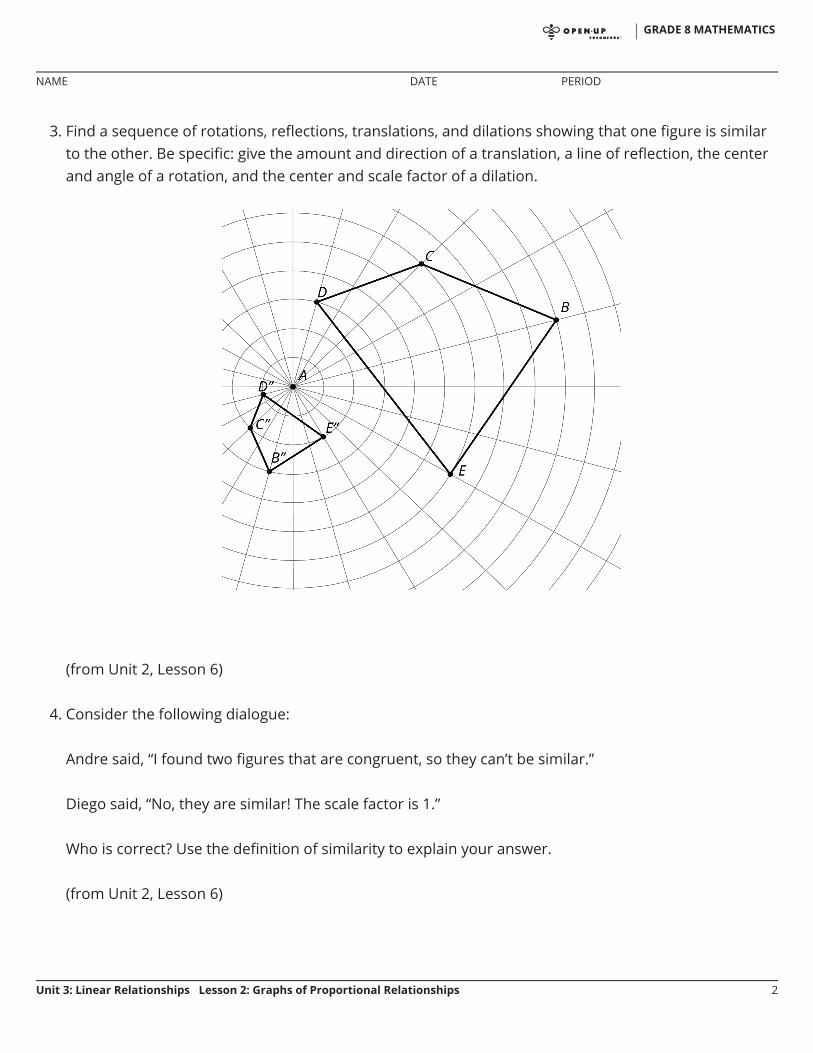
3. Find a sequence of rotations, reflections, translations, and dilations showing that one figure is similarto the other. Be specific: give the amount and direction of a translation, a line of reflection, the centerand angle of a rotation, and the center and scale factor of a dilation.
(from Unit 2, Lesson 6)
4. Consider the following dialogue:
Andre said, “I found two figures that are congruent, so they can’t be similar.”
Diego said, “No, they are similar! The scale factor is 1.”
Who is correct? Use the definition of similarity to explain your answer.
(from Unit 2, Lesson 6)
GRADE 8 MATHEMATICS
NAME DATE PERIOD
Unit 3: Linear Relationships Lesson 2: Graphs of Proportional Relationships 2
Unit 3, Lesson 3: Representing ProportionalRelationshipsLet's graph proportional relationships.
3.1: Number Talk: Multiplication
Find the value of each product mentally.
3.2: Representations of Proportional Relationships
1. Here are two ways to represent a situation.
a. Create a table that represents this situation with at least 3 pairs of values.
Description: Jada and Noah counted thenumber of steps they took to walk a setdistance. To walk the same distance,
Jada took 8 steps
Noah took 10 steps
Then they found that when Noah took15 steps, Jada took 12 steps.
Equation: Let represent the number ofsteps Jada takes and let represent thenumber of steps Noah takes.
◦
◦
GRADE 8 MATHEMATICS
NAME DATE PERIOD
Unit 3: Linear Relationships Lesson 3: Representing Proportional Relationships 1
b. Graph this relationship and label the axes.
c. How can you see or calculate the constant of proportionality in eachrepresentation? What does it mean?
d. Explain how you can tell that the equation, description, graph, and table allrepresent the same situation.
GRADE 8 MATHEMATICS
NAME DATE PERIOD
Unit 3: Linear Relationships Lesson 3: Representing Proportional Relationships 2
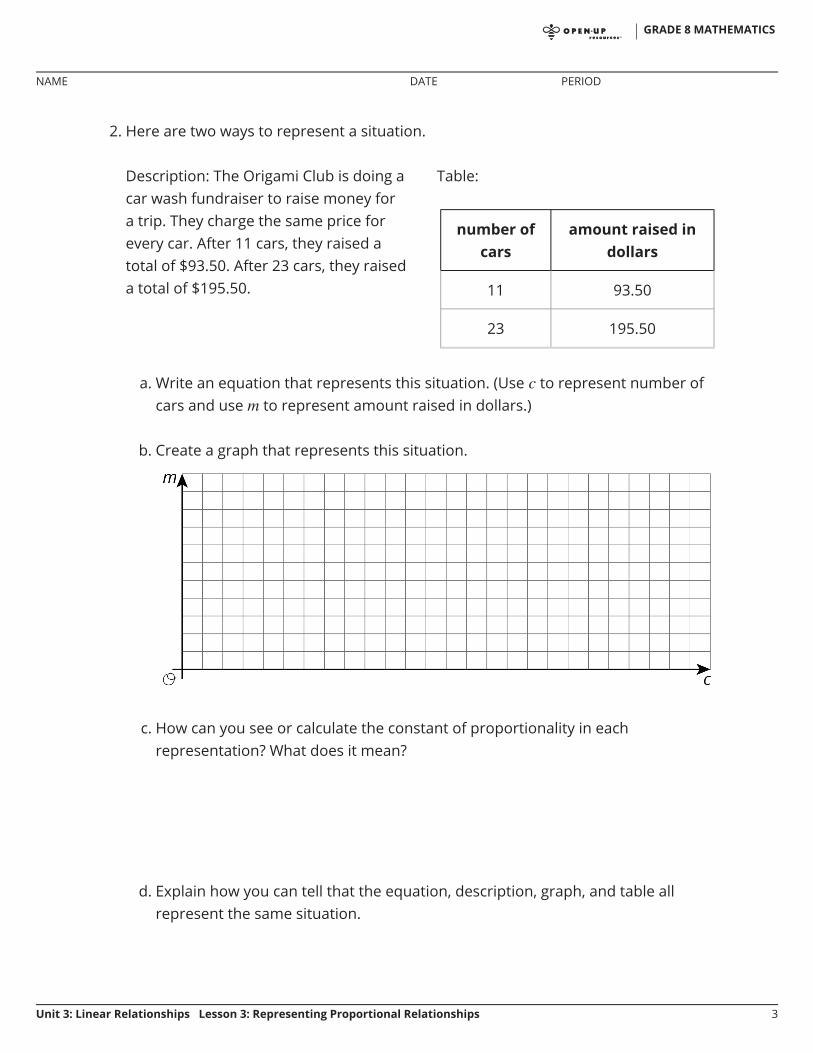
2. Here are two ways to represent a situation.
a. Write an equation that represents this situation. (Use to represent number ofcars and use to represent amount raised in dollars.)
b. Create a graph that represents this situation.
c. How can you see or calculate the constant of proportionality in eachrepresentation? What does it mean?
d. Explain how you can tell that the equation, description, graph, and table allrepresent the same situation.
Description: The Origami Club is doing acar wash fundraiser to raise money fora trip. They charge the same price forevery car. After 11 cars, they raised atotal of $93.50. After 23 cars, they raiseda total of $195.50.
Table:
number ofcars
amount raised indollars
11 93.50
23 195.50
GRADE 8 MATHEMATICS
NAME DATE PERIOD
Unit 3: Linear Relationships Lesson 3: Representing Proportional Relationships 3
3.3: Info Gap: Proportional Relationships
Your teacher will give you either a problem card or a data card. Do not show or read yourcard to your partner.
Pause here so your teacher can review your work. Ask your teacher for a new set of cardsand repeat the activity, trading roles with your partner.
Are you ready for more?
Ten people can dig five holes in three hours. If people digging at the same rate digholes in hours:
1. Is proportional to when ?
2. Is proportional to when ?
3. Is proportional to when ?
If your teacher gives you the problem card:
1. Silently read your card and thinkabout what information you need toanswer the question.
2. Ask your partner for the specificinformation that you need.
3. Explain to your partner how you areusing the information to solve theproblem.
4. Solve the problem and explain yourreasoning to your partner.
If your teacher gives you the data card:
1. Silently read the information on yourcard.
2. Ask your partner “What specificinformation do you need?” and waitfor your partner to ask forinformation. Only give informationthat is on your card. (Do not figureout anything for your partner!)
3. Before telling your partner theinformation, ask “Why do you needthat information?”
4. After your partner solves theproblem, ask them to explain theirreasoning and listen to theirexplanation.
GRADE 8 MATHEMATICS
NAME DATE PERIOD
Unit 3: Linear Relationships Lesson 3: Representing Proportional Relationships 4
Lesson 3 Summary
Proportional relationships can be represented in multiple ways. Which representation wechoose depends on the purpose. And when we create representations we can choosehelpful values by paying attention to the context. For example, a stew recipe calls for 3carrots for every 2 potatoes. One way to represent this is using an equation. If there arepotatoes and carrots, then .
Suppose we want to make a large batch of this recipe for a family gathering, using 150potatoes. To find the number of carrots we could just use the equation:
carrots.
Now suppose the recipe is used in a restaurant that makes the stew in large batches ofdifferent sizes depending on how busy a day it is, using up to 300 potatoes at at time.Then we might make a graph to show how many carrots are needed for differentamounts of potatoes. We set up a pair of coordinate axes with a scale from 0 to 300along the horizontal axis and 0 to 450 on the vertical axis, because . Then
we can read how many carrots are needed for any number of potatoes up to 300.
GRADE 8 MATHEMATICS
NAME DATE PERIOD
Unit 3: Linear Relationships Lesson 3: Representing Proportional Relationships 5
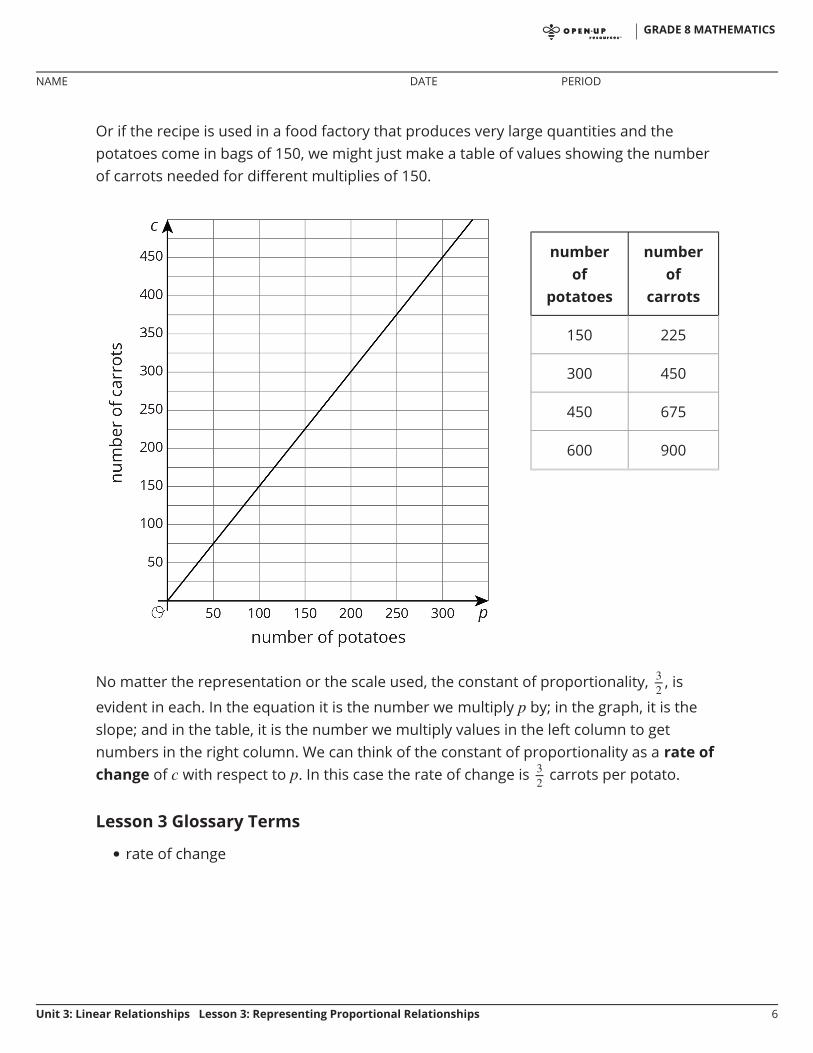
Or if the recipe is used in a food factory that produces very large quantities and thepotatoes come in bags of 150, we might just make a table of values showing the numberof carrots needed for different multiplies of 150.
No matter the representation or the scale used, the constant of proportionality, , is
evident in each. In the equation it is the number we multiply by; in the graph, it is theslope; and in the table, it is the number we multiply values in the left column to getnumbers in the right column. We can think of the constant of proportionality as a rate ofchange of with respect to . In this case the rate of change is carrots per potato.
Lesson 3 Glossary Terms
rate of change
numberof
potatoes
numberof
carrots
150 225
300 450
450 675
600 900
•
GRADE 8 MATHEMATICS
NAME DATE PERIOD
Unit 3: Linear Relationships Lesson 3: Representing Proportional Relationships 6
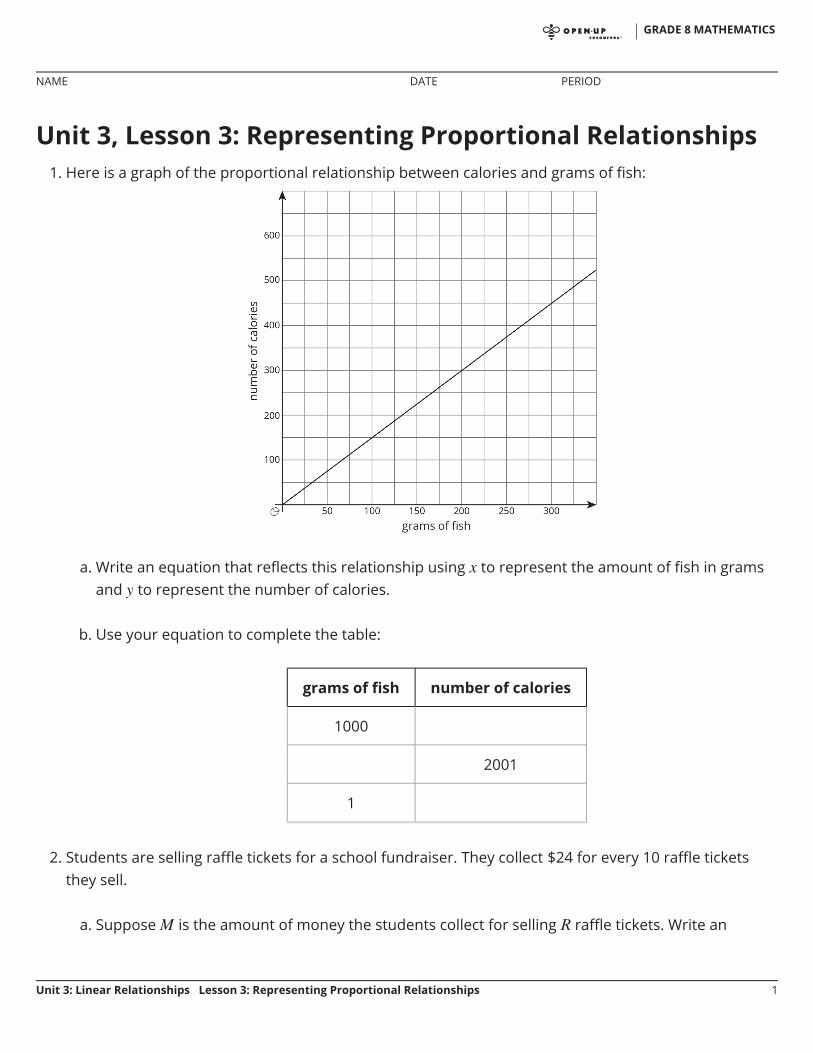
Unit 3, Lesson 3: Representing Proportional Relationships1. Here is a graph of the proportional relationship between calories and grams of fish:
a. Write an equation that reflects this relationship using to represent the amount of fish in gramsand to represent the number of calories.
b. Use your equation to complete the table:
grams of fish number of calories
1000
2001
1
2. Students are selling raffle tickets for a school fundraiser. They collect $24 for every 10 raffle ticketsthey sell.
a. Suppose is the amount of money the students collect for selling raffle tickets. Write an
GRADE 8 MATHEMATICS
NAME DATE PERIOD
Unit 3: Linear Relationships Lesson 3: Representing Proportional Relationships 1
equation that reflects the relationship between and .
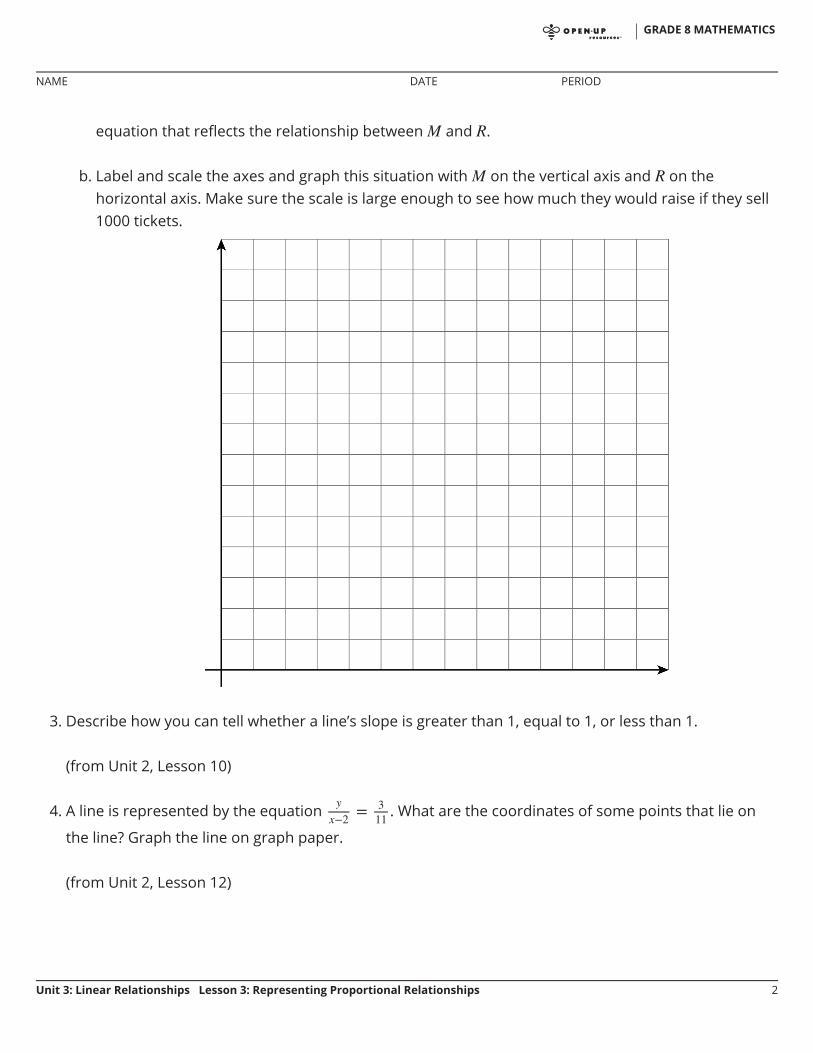
b. Label and scale the axes and graph this situation with on the vertical axis and on thehorizontal axis. Make sure the scale is large enough to see how much they would raise if they sell1000 tickets.
3. Describe how you can tell whether a line’s slope is greater than 1, equal to 1, or less than 1.
(from Unit 2, Lesson 10)
4. A line is represented by the equation . What are the coordinates of some points that lie on
the line? Graph the line on graph paper.
(from Unit 2, Lesson 12)
GRADE 8 MATHEMATICS
NAME DATE PERIOD
Unit 3: Linear Relationships Lesson 3: Representing Proportional Relationships 2
Unit 3, Lesson 4: Comparing ProportionalRelationshipsLet’s compare proportional relationships.
4.1: What's the Relationship?
The equation could represent a variety of different situations.
1. Write a description of a situation represented by this equation. Decide whatquantities and represent in your situation.
2. Make a table and a graph that represent the situation.
GRADE 8 MATHEMATICS
NAME DATE PERIOD
Unit 3: Linear Relationships Lesson 4: Comparing Proportional Relationships 1
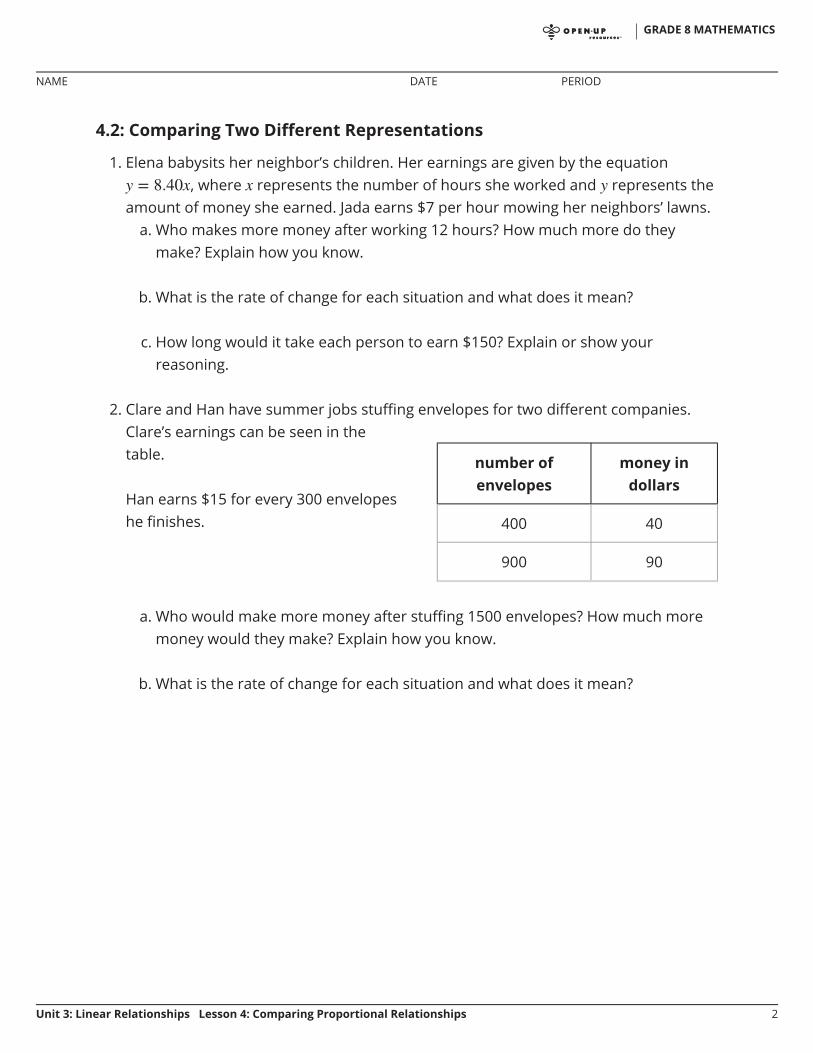
4.2: Comparing Two Different Representations
1. Elena babysits her neighbor’s children. Her earnings are given by the equation, where represents the number of hours she worked and represents the
amount of money she earned. Jada earns $7 per hour mowing her neighbors’ lawns.a. Who makes more money after working 12 hours? How much more do they
make? Explain how you know.
b. What is the rate of change for each situation and what does it mean?
c. How long would it take each person to earn $150? Explain or show yourreasoning.
2. Clare and Han have summer jobs stuffing envelopes for two different companies.
a. Who would make more money after stuffing 1500 envelopes? How much moremoney would they make? Explain how you know.
b. What is the rate of change for each situation and what does it mean?
Clare’s earnings can be seen in thetable.
Han earns $15 for every 300 envelopeshe finishes.
number ofenvelopes
money indollars
400 40
900 90
GRADE 8 MATHEMATICS
NAME DATE PERIOD
Unit 3: Linear Relationships Lesson 4: Comparing Proportional Relationships 2
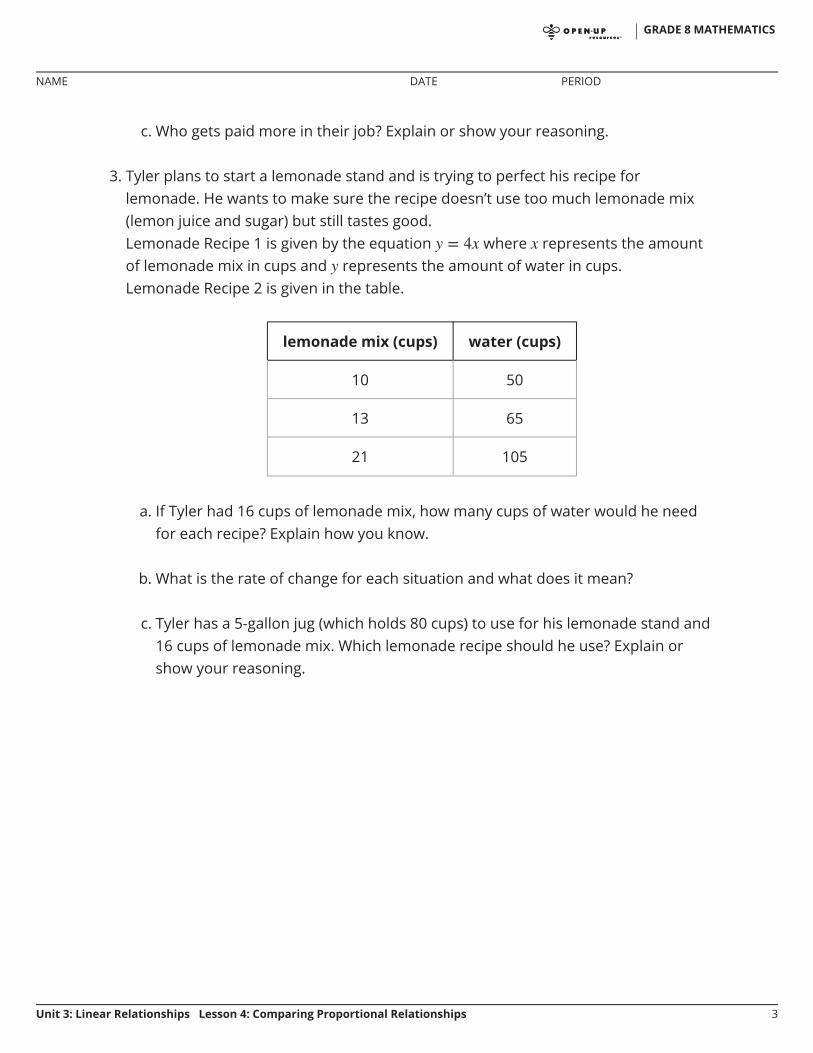
c. Who gets paid more in their job? Explain or show your reasoning.
3. Tyler plans to start a lemonade stand and is trying to perfect his recipe forlemonade. He wants to make sure the recipe doesn’t use too much lemonade mix(lemon juice and sugar) but still tastes good.Lemonade Recipe 1 is given by the equation where represents the amountof lemonade mix in cups and represents the amount of water in cups.Lemonade Recipe 2 is given in the table.
lemonade mix (cups) water (cups)
10 50
13 65
21 105
a. If Tyler had 16 cups of lemonade mix, how many cups of water would he needfor each recipe? Explain how you know.
b. What is the rate of change for each situation and what does it mean?
c. Tyler has a 5-gallon jug (which holds 80 cups) to use for his lemonade stand and16 cups of lemonade mix. Which lemonade recipe should he use? Explain orshow your reasoning.
GRADE 8 MATHEMATICS
NAME DATE PERIOD
Unit 3: Linear Relationships Lesson 4: Comparing Proportional Relationships 3
Are you ready for more?
Han and Clare are still stuffing envelopes. Han can stuff 20 envelopes in a minute, andClare can stuff 10 envelopes in a minute. They start working together on a pile of 1,000envelopes.
1. How long does it take them to finish the pile?
2. Who earns more money?
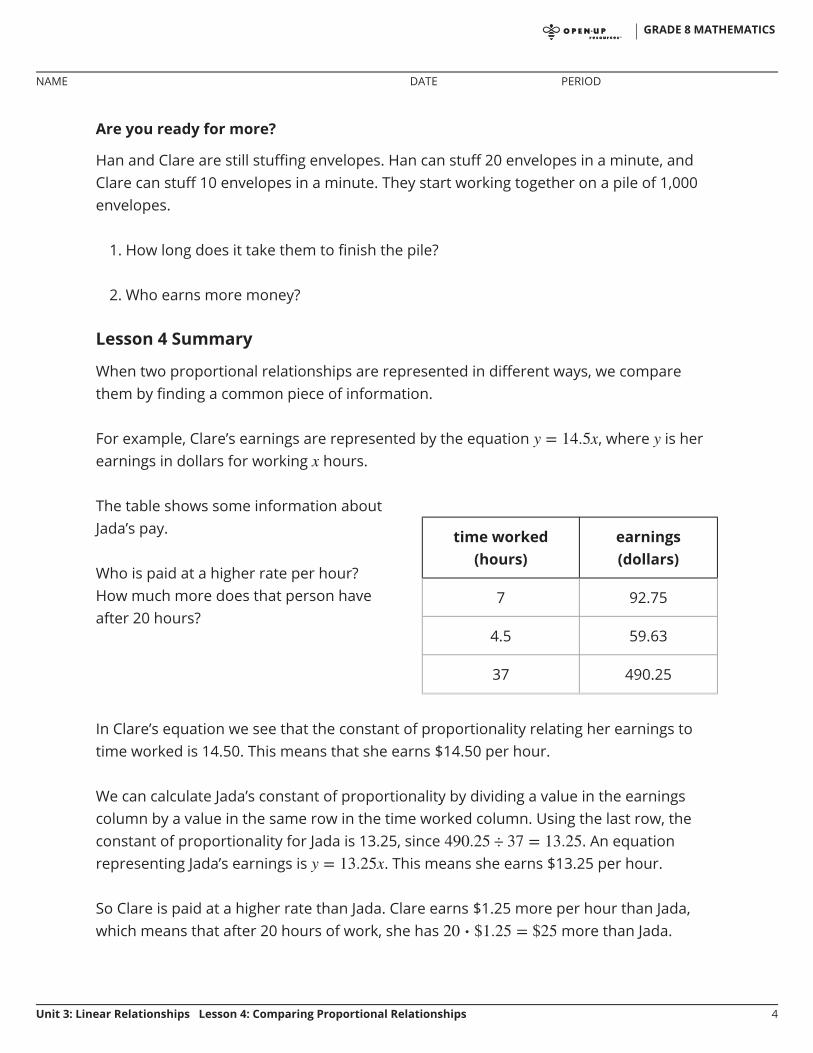
Lesson 4 Summary
When two proportional relationships are represented in different ways, we comparethem by finding a common piece of information.
For example, Clare’s earnings are represented by the equation , where is herearnings in dollars for working hours.
In Clare’s equation we see that the constant of proportionality relating her earnings totime worked is 14.50. This means that she earns $14.50 per hour.
We can calculate Jada’s constant of proportionality by dividing a value in the earningscolumn by a value in the same row in the time worked column. Using the last row, theconstant of proportionality for Jada is 13.25, since . An equationrepresenting Jada’s earnings is . This means she earns $13.25 per hour.
So Clare is paid at a higher rate than Jada. Clare earns $1.25 more per hour than Jada,which means that after 20 hours of work, she has more than Jada.
The table shows some information aboutJada’s pay.
Who is paid at a higher rate per hour?How much more does that person haveafter 20 hours?
time worked(hours)
earnings(dollars)
7 92.75
4.5 59.63
37 490.25
GRADE 8 MATHEMATICS
NAME DATE PERIOD
Unit 3: Linear Relationships Lesson 4: Comparing Proportional Relationships 4
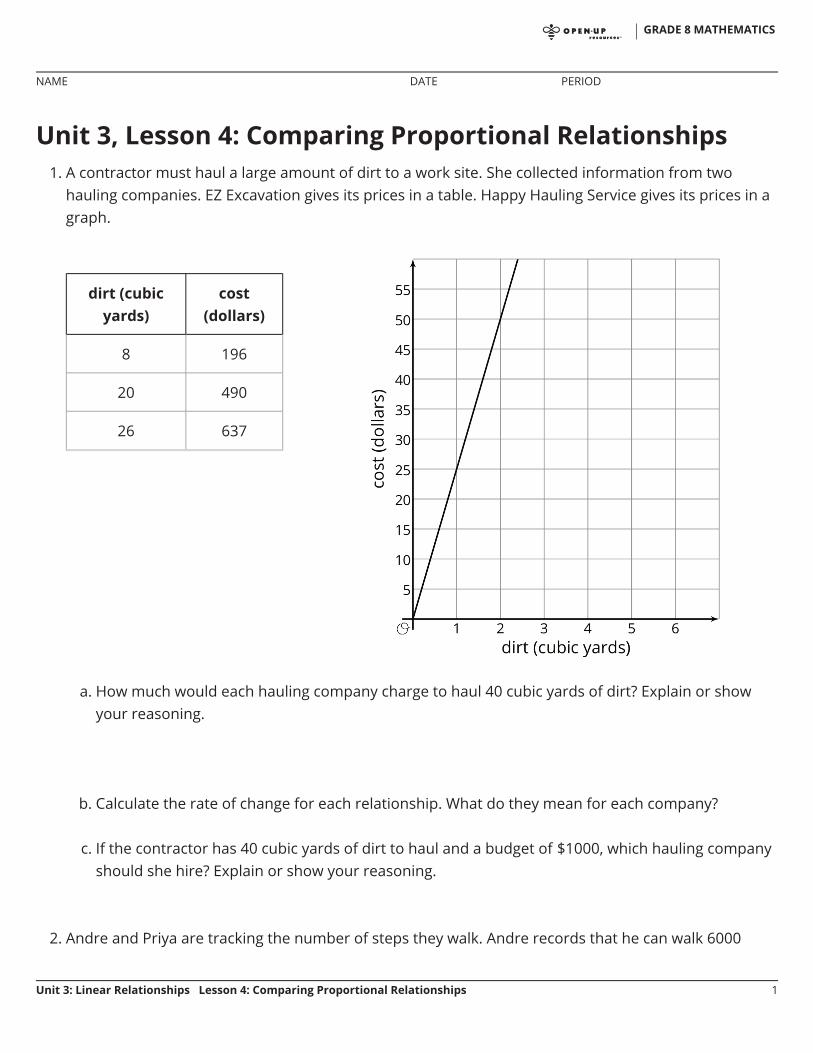
Unit 3, Lesson 4: Comparing Proportional Relationships1. A contractor must haul a large amount of dirt to a work site. She collected information from two
hauling companies. EZ Excavation gives its prices in a table. Happy Hauling Service gives its prices in agraph.
a. How much would each hauling company charge to haul 40 cubic yards of dirt? Explain or showyour reasoning.
b. Calculate the rate of change for each relationship. What do they mean for each company?
c. If the contractor has 40 cubic yards of dirt to haul and a budget of $1000, which hauling companyshould she hire? Explain or show your reasoning.
2. Andre and Priya are tracking the number of steps they walk. Andre records that he can walk 6000
dirt (cubicyards)
cost(dollars)
8 196
20 490
26 637
GRADE 8 MATHEMATICS
NAME DATE PERIOD
Unit 3: Linear Relationships Lesson 4: Comparing Proportional Relationships 1
steps in 50 minutes. Priya writes the equation , where is the number of steps and is thenumber of minutes she walks, to describe her step rate. This week, Andre and Priya each walk for atotal of 5 hours. Who walks more steps? How many more?
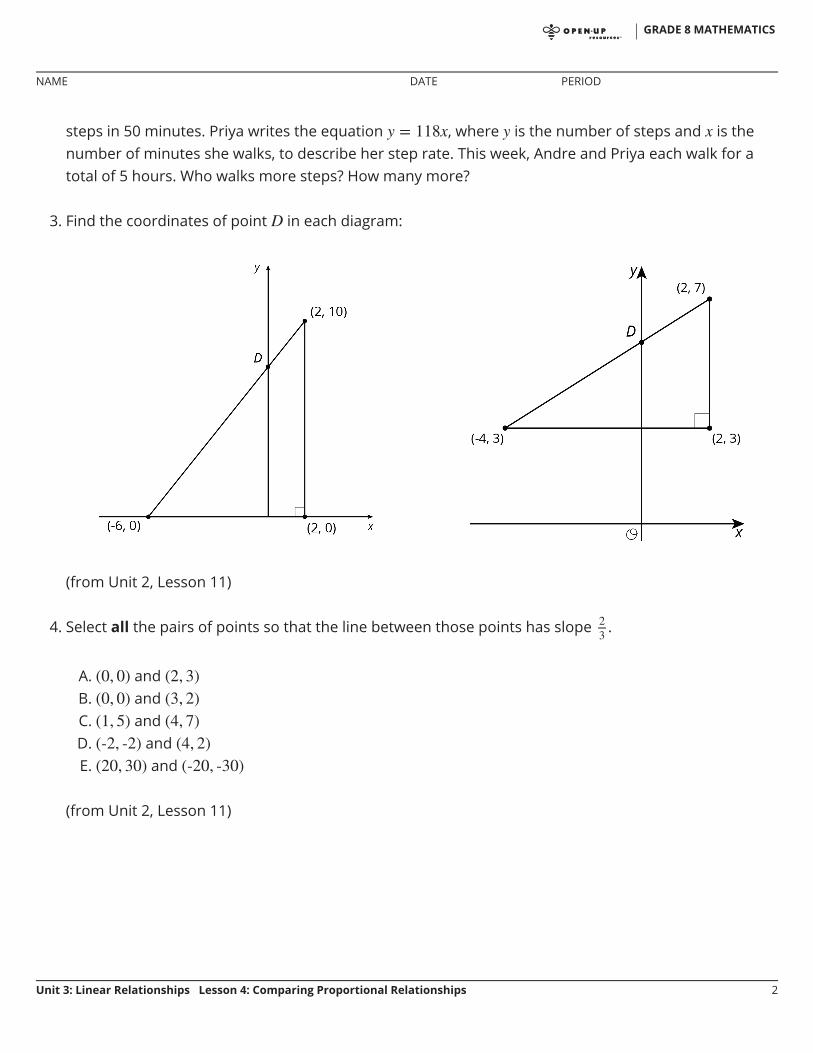
3. Find the coordinates of point in each diagram:
(from Unit 2, Lesson 11)
4. Select all the pairs of points so that the line between those points has slope .
A. andB. andC. andD. andE. and
(from Unit 2, Lesson 11)
GRADE 8 MATHEMATICS
NAME DATE PERIOD
Unit 3: Linear Relationships Lesson 4: Comparing Proportional Relationships 2
Unit 3, Lesson 5: Introduction to LinearRelationshipsLet’s explore some relationships between two variables.
5.1: Number Talk: Fraction Division
Find the value of .
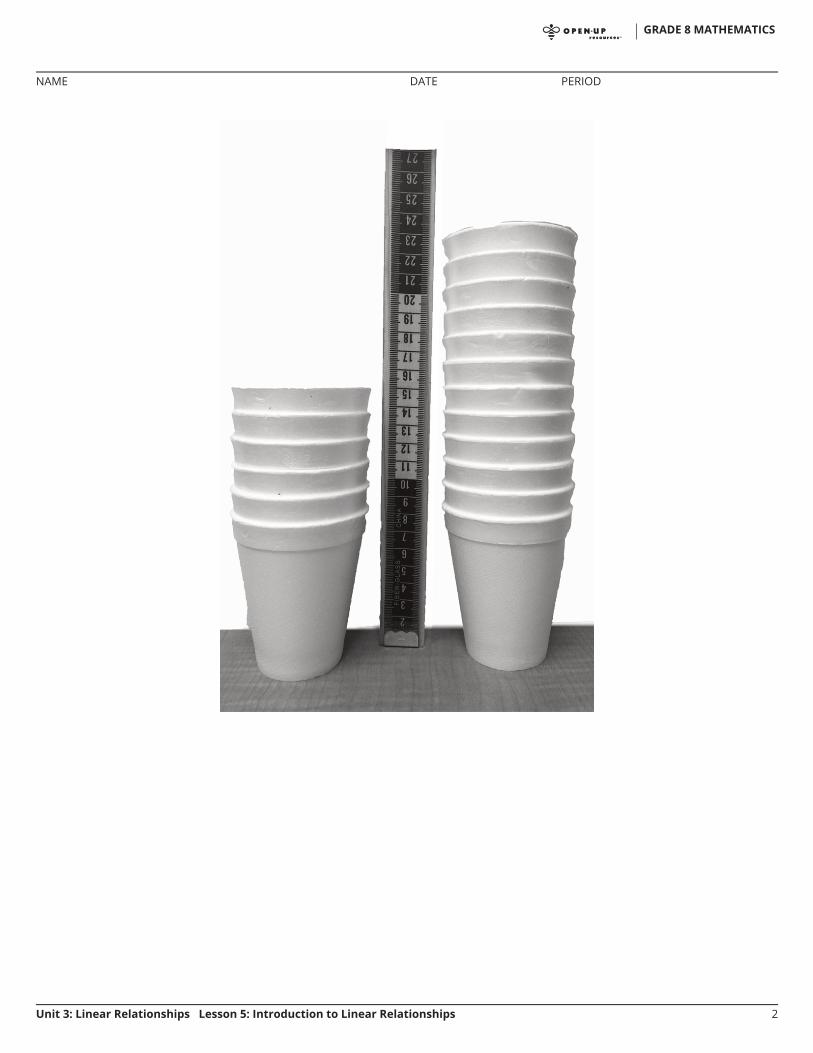
5.2: Stacking Cups
We have two stacks of styrofoam cups. One stack has 6 cups, and its height is 15 cm. Theother one has 12 cups, and its height is 23 cm. How many cups are needed for a stackwith a height of 50 cm?
GRADE 8 MATHEMATICS
NAME DATE PERIOD
Unit 3: Linear Relationships Lesson 5: Introduction to Linear Relationships 1
GRADE 8 MATHEMATICS
NAME DATE PERIOD
Unit 3: Linear Relationships Lesson 5: Introduction to Linear Relationships 2
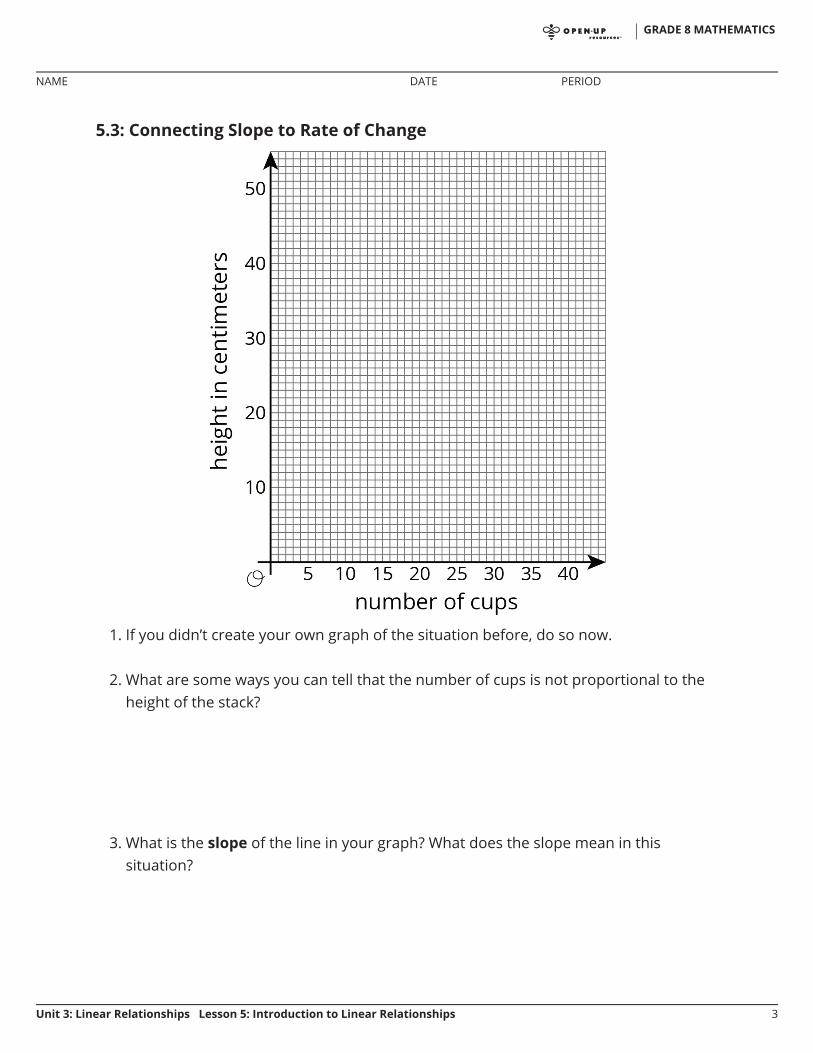
5.3: Connecting Slope to Rate of Change
1. If you didn’t create your own graph of the situation before, do so now.
2. What are some ways you can tell that the number of cups is not proportional to theheight of the stack?
3. What is the slope of the line in your graph? What does the slope mean in thissituation?
GRADE 8 MATHEMATICS
NAME DATE PERIOD
Unit 3: Linear Relationships Lesson 5: Introduction to Linear Relationships 3
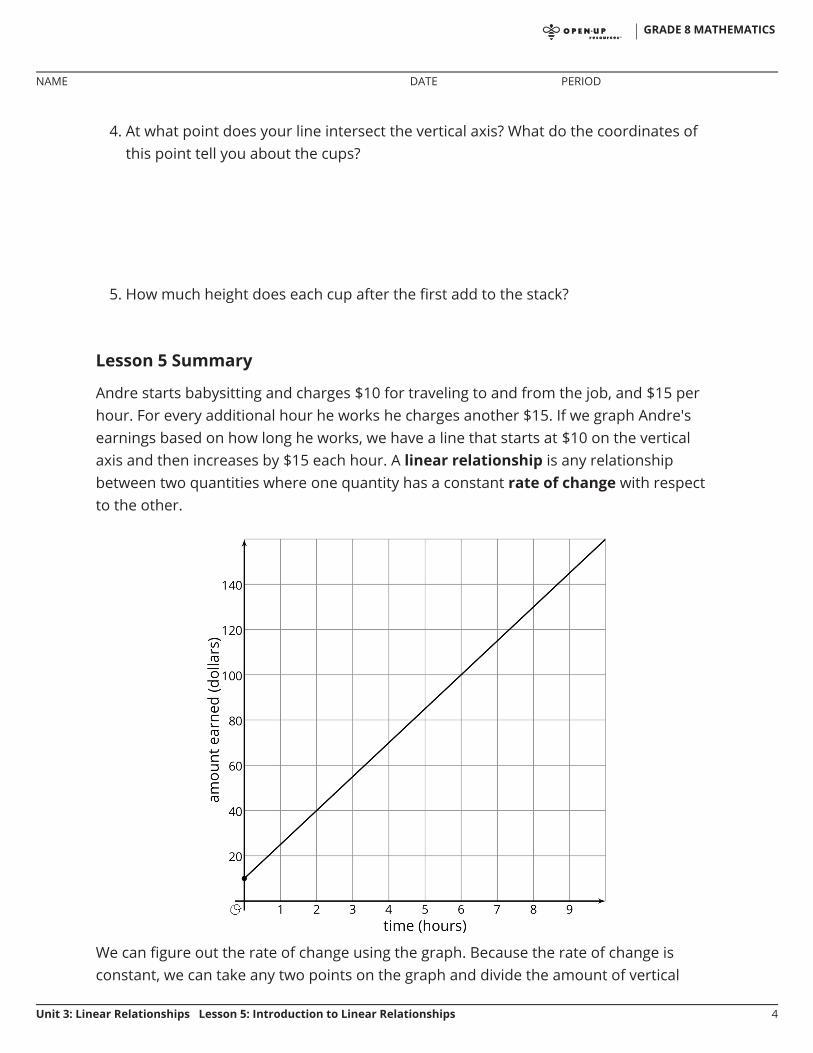
4. At what point does your line intersect the vertical axis? What do the coordinates ofthis point tell you about the cups?
5. How much height does each cup after the first add to the stack?
Lesson 5 Summary
Andre starts babysitting and charges $10 for traveling to and from the job, and $15 perhour. For every additional hour he works he charges another $15. If we graph Andre'searnings based on how long he works, we have a line that starts at $10 on the verticalaxis and then increases by $15 each hour. A linear relationship is any relationshipbetween two quantities where one quantity has a constant rate of change with respectto the other.
We can figure out the rate of change using the graph. Because the rate of change isconstant, we can take any two points on the graph and divide the amount of vertical
GRADE 8 MATHEMATICS
NAME DATE PERIOD
Unit 3: Linear Relationships Lesson 5: Introduction to Linear Relationships 4
change by the amount of horizontal change. For example, take the points and. They mean that Andre earns $40 for working 2 hours and $100 for working 6
hours. The rate of change is dollars per hour. Andre's earnings go up $15 for
each hour of babysitting. Notice that this is the same way we calculate the slope of theline. That's why the graph is a line, and why we call this a linear relationship. The rate ofchange of a linear relationship is the same as the slope of its graph.
With proportional relationships we are used to graphs that contain the point . Butproportional relationships are just one type of linear relationship. In the followinglessons, we will continue to explore the other type of linear relationship where thequantities are not both 0 at the same time.
Lesson 5 Glossary Terms
slope
rate of change
linear relationship
•
•
•
GRADE 8 MATHEMATICS
NAME DATE PERIOD
Unit 3: Linear Relationships Lesson 5: Introduction to Linear Relationships 5
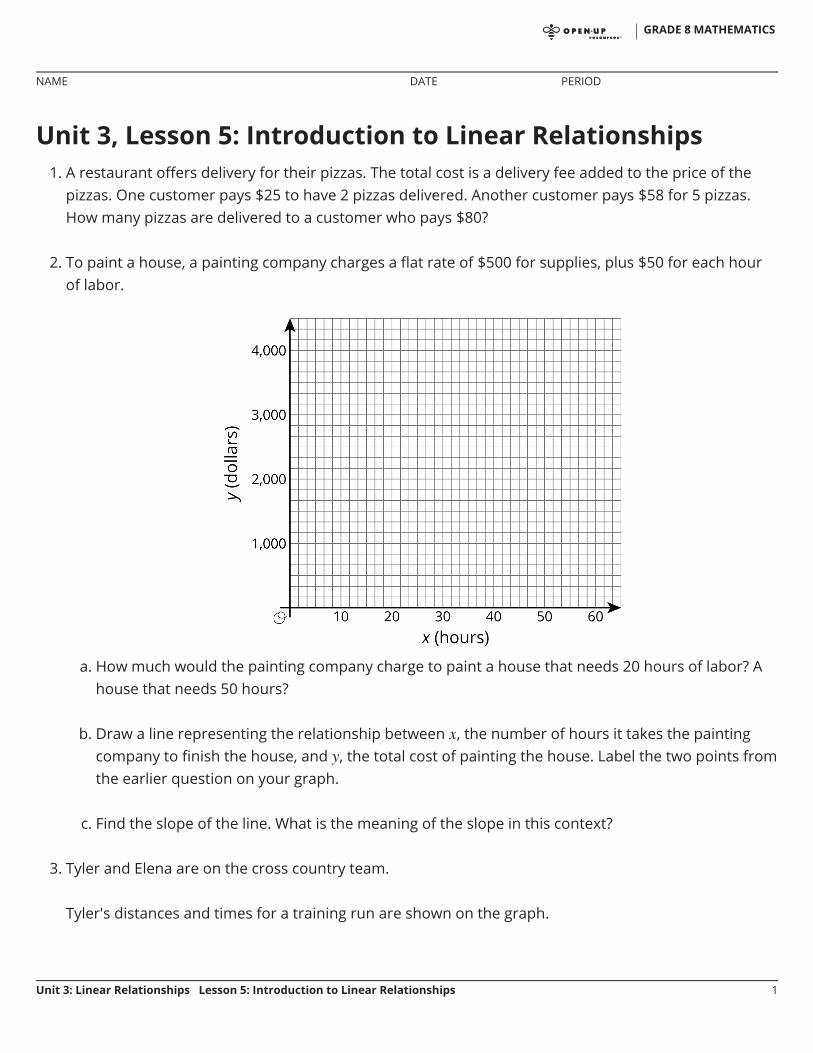
Unit 3, Lesson 5: Introduction to Linear Relationships1. A restaurant offers delivery for their pizzas. The total cost is a delivery fee added to the price of the
pizzas. One customer pays $25 to have 2 pizzas delivered. Another customer pays $58 for 5 pizzas.How many pizzas are delivered to a customer who pays $80?
2. To paint a house, a painting company charges a flat rate of $500 for supplies, plus $50 for each hourof labor.
a. How much would the painting company charge to paint a house that needs 20 hours of labor? Ahouse that needs 50 hours?
b. Draw a line representing the relationship between , the number of hours it takes the paintingcompany to finish the house, and , the total cost of painting the house. Label the two points fromthe earlier question on your graph.
c. Find the slope of the line. What is the meaning of the slope in this context?
3. Tyler and Elena are on the cross country team.
Tyler's distances and times for a training run are shown on the graph.
GRADE 8 MATHEMATICS
NAME DATE PERIOD
Unit 3: Linear Relationships Lesson 5: Introduction to Linear Relationships 1
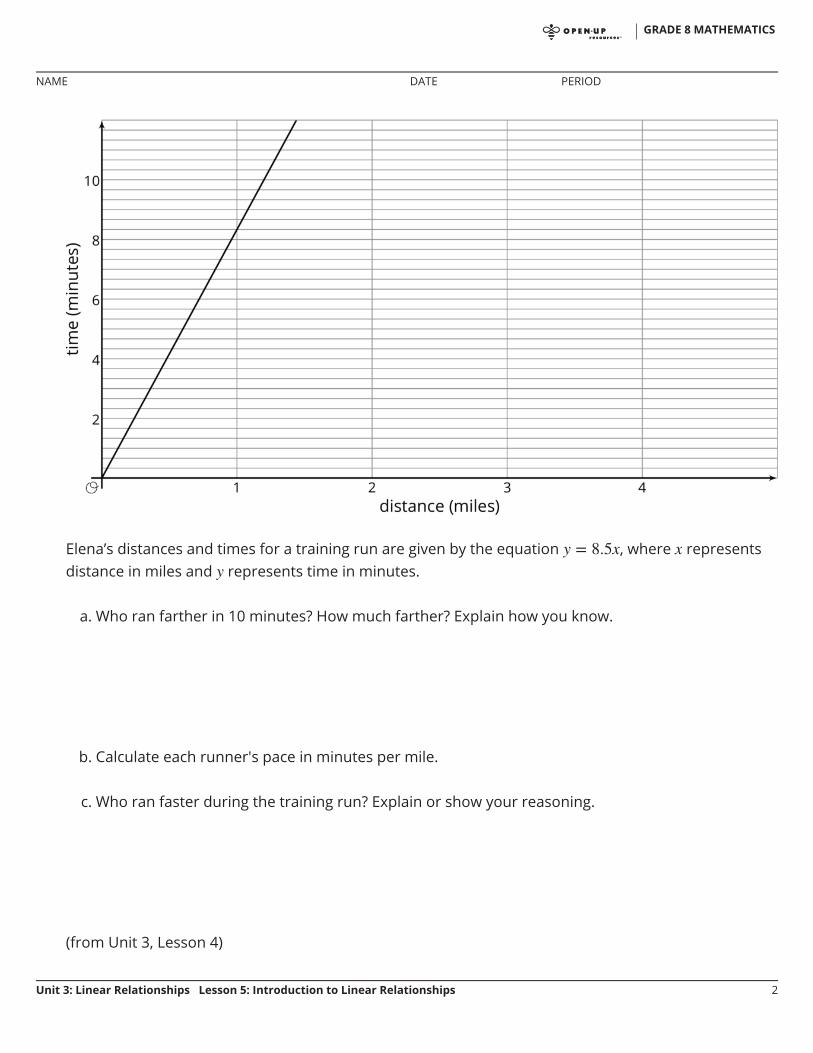
Elena’s distances and times for a training run are given by the equation , where representsdistance in miles and represents time in minutes.
a. Who ran farther in 10 minutes? How much farther? Explain how you know.
b. Calculate each runner's pace in minutes per mile.
c. Who ran faster during the training run? Explain or show your reasoning.
(from Unit 3, Lesson 4)
GRADE 8 MATHEMATICS
NAME DATE PERIOD
Unit 3: Linear Relationships Lesson 5: Introduction to Linear Relationships 2
4. Write an equation for the line that passes through and .
(from Unit 2, Lesson 12)
GRADE 8 MATHEMATICS
NAME DATE PERIOD
Unit 3: Linear Relationships Lesson 5: Introduction to Linear Relationships 3
Unit 3, Lesson 6: More Linear RelationshipsLet’s explore some more relationships between two variables.
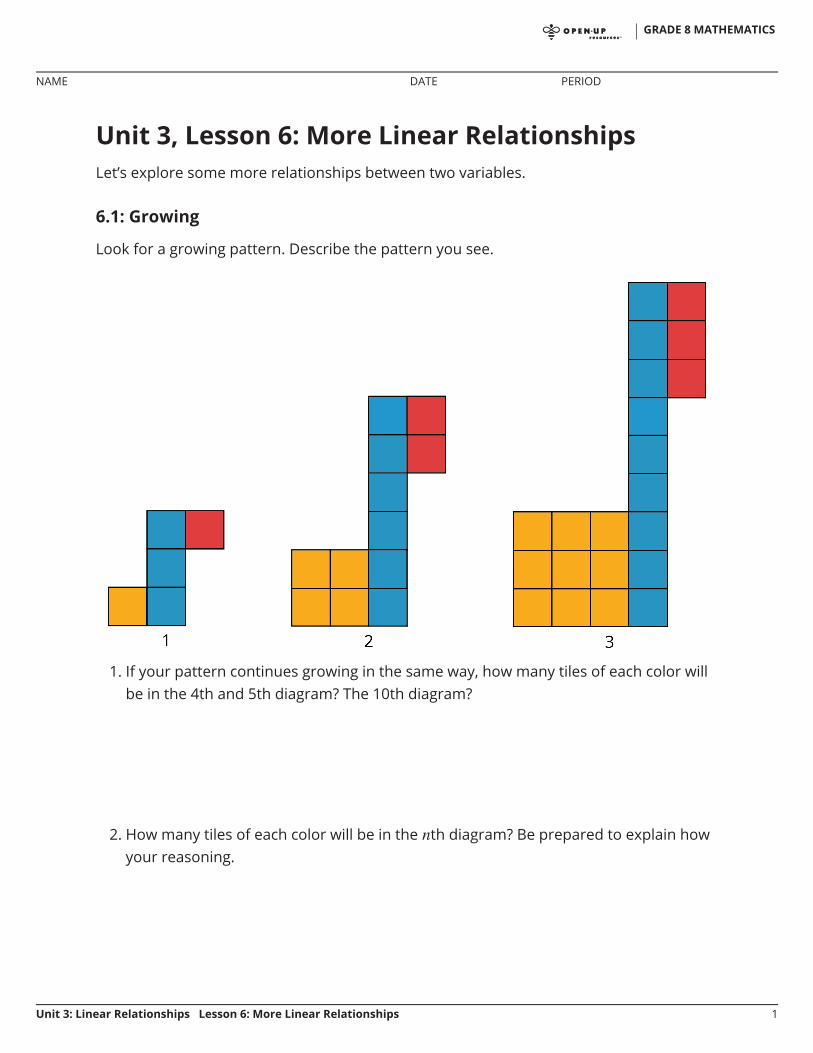
6.1: Growing
Look for a growing pattern. Describe the pattern you see.
1. If your pattern continues growing in the same way, how many tiles of each color willbe in the 4th and 5th diagram? The 10th diagram?
2. How many tiles of each color will be in the th diagram? Be prepared to explain howyour reasoning.
GRADE 8 MATHEMATICS
NAME DATE PERIOD
Unit 3: Linear Relationships Lesson 6: More Linear Relationships 1
6.2: Slopes, Vertical Intercepts, and Graphs
Your teacher will give you 6 cards describing different situations and 6 cards with graphs.
1. Match each situation to a graph.
2. Pick one proportional relationship and one non-proportional relationship andanswer the following questions about them.
a. How can you find the slope from the graph? Explain or show your reasoning.
b. Explain what the slope means in the situation.
c. Find the point where the line crosses the vertical axis. What does that point tellyou about the situation?
GRADE 8 MATHEMATICS
NAME DATE PERIOD
Unit 3: Linear Relationships Lesson 6: More Linear Relationships 2
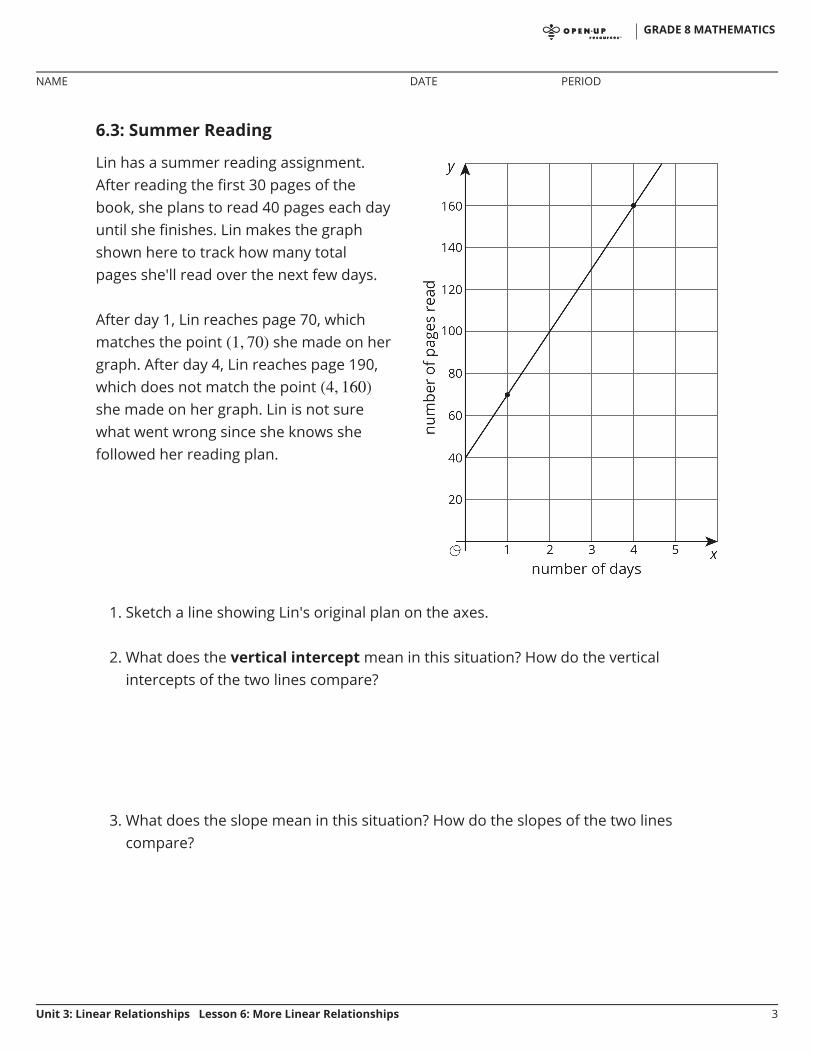
6.3: Summer Reading
1. Sketch a line showing Lin's original plan on the axes.
2. What does the vertical intercept mean in this situation? How do the verticalintercepts of the two lines compare?
3. What does the slope mean in this situation? How do the slopes of the two linescompare?
Lin has a summer reading assignment.After reading the first 30 pages of thebook, she plans to read 40 pages each dayuntil she finishes. Lin makes the graphshown here to track how many totalpages she'll read over the next few days.
After day 1, Lin reaches page 70, whichmatches the point she made on hergraph. After day 4, Lin reaches page 190,which does not match the pointshe made on her graph. Lin is not surewhat went wrong since she knows shefollowed her reading plan.
GRADE 8 MATHEMATICS
NAME DATE PERIOD
Unit 3: Linear Relationships Lesson 6: More Linear Relationships 3
Are you ready for more?
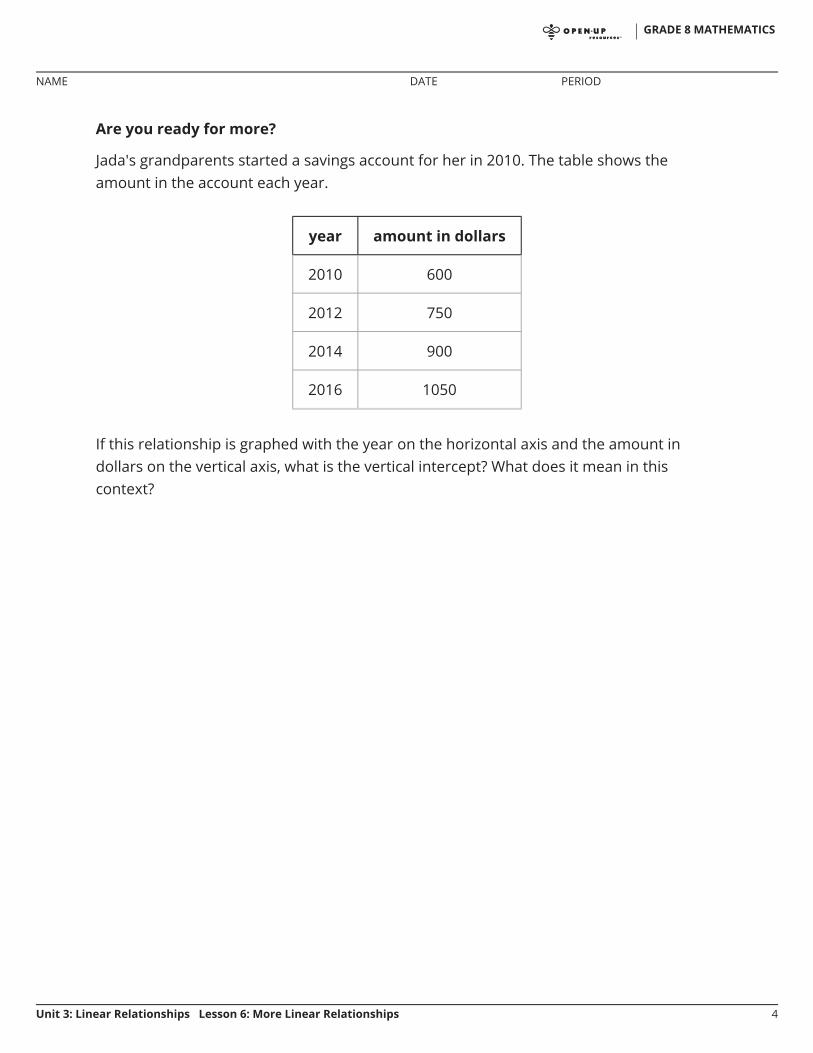
Jada's grandparents started a savings account for her in 2010. The table shows theamount in the account each year.
year amount in dollars
2010 600
2012 750
2014 900
2016 1050
If this relationship is graphed with the year on the horizontal axis and the amount indollars on the vertical axis, what is the vertical intercept? What does it mean in thiscontext?
GRADE 8 MATHEMATICS
NAME DATE PERIOD
Unit 3: Linear Relationships Lesson 6: More Linear Relationships 4
Lesson 6 Summary
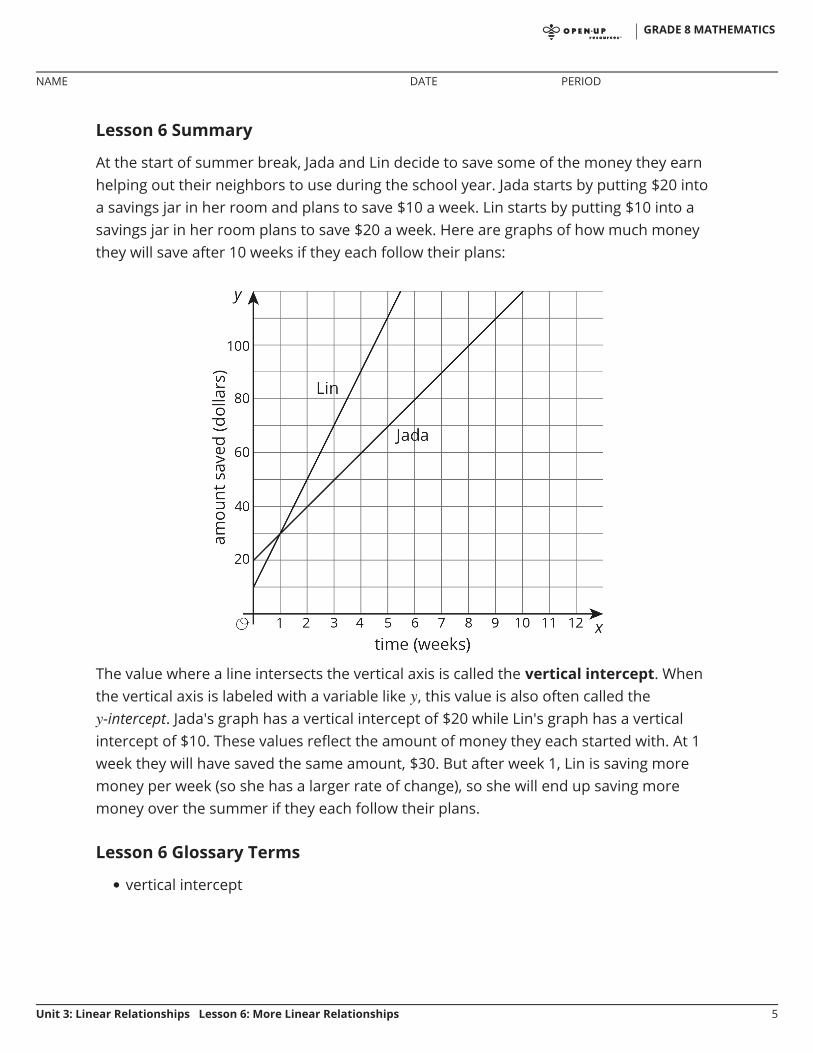
At the start of summer break, Jada and Lin decide to save some of the money they earnhelping out their neighbors to use during the school year. Jada starts by putting $20 intoa savings jar in her room and plans to save $10 a week. Lin starts by putting $10 into asavings jar in her room plans to save $20 a week. Here are graphs of how much moneythey will save after 10 weeks if they each follow their plans:
The value where a line intersects the vertical axis is called the vertical intercept. Whenthe vertical axis is labeled with a variable like , this value is also often called the-intercept. Jada's graph has a vertical intercept of $20 while Lin's graph has a vertical
intercept of $10. These values reflect the amount of money they each started with. At 1week they will have saved the same amount, $30. But after week 1, Lin is saving moremoney per week (so she has a larger rate of change), so she will end up saving moremoney over the summer if they each follow their plans.
Lesson 6 Glossary Terms
vertical intercept•
GRADE 8 MATHEMATICS
NAME DATE PERIOD
Unit 3: Linear Relationships Lesson 6: More Linear Relationships 5
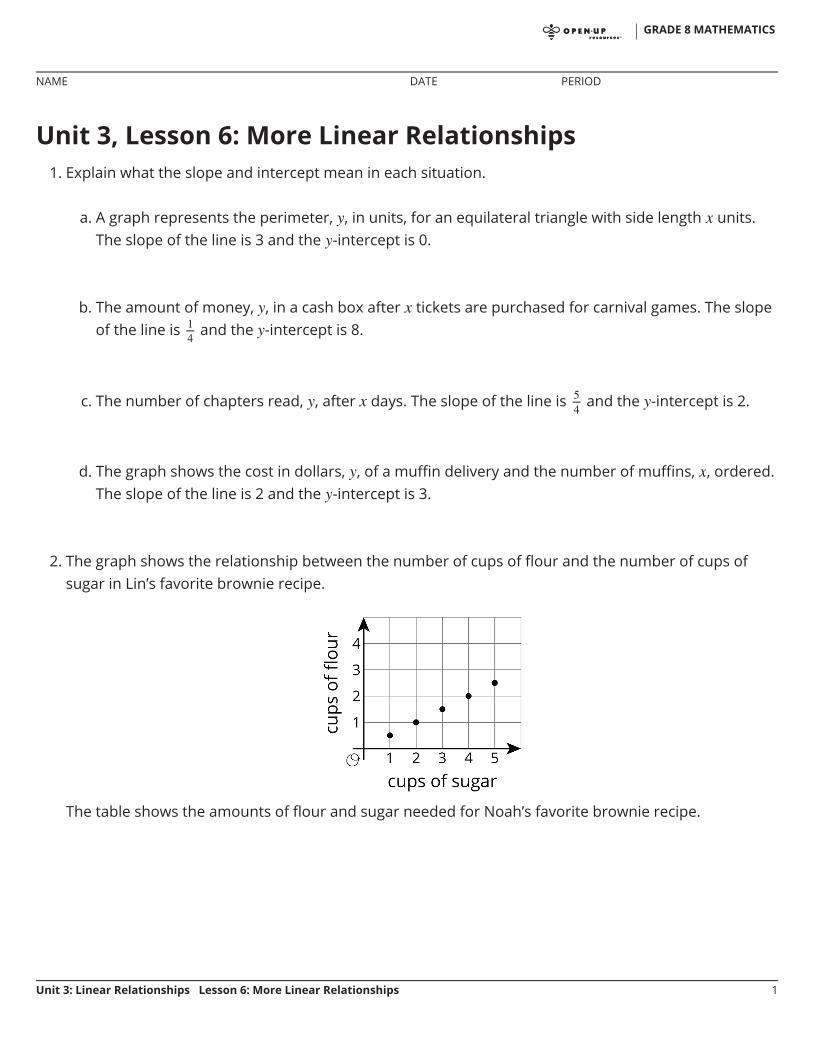
Unit 3, Lesson 6: More Linear Relationships1. Explain what the slope and intercept mean in each situation.
a. A graph represents the perimeter, , in units, for an equilateral triangle with side length units.The slope of the line is 3 and the -intercept is 0.
b. The amount of money, , in a cash box after tickets are purchased for carnival games. The slopeof the line is and the -intercept is 8.
c. The number of chapters read, , after days. The slope of the line is and the -intercept is 2.
d. The graph shows the cost in dollars, , of a muffin delivery and the number of muffins, , ordered.The slope of the line is 2 and the -intercept is 3.
2. The graph shows the relationship between the number of cups of flour and the number of cups ofsugar in Lin’s favorite brownie recipe.
The table shows the amounts of flour and sugar needed for Noah’s favorite brownie recipe.
GRADE 8 MATHEMATICS
NAME DATE PERIOD
Unit 3: Linear Relationships Lesson 6: More Linear Relationships 1
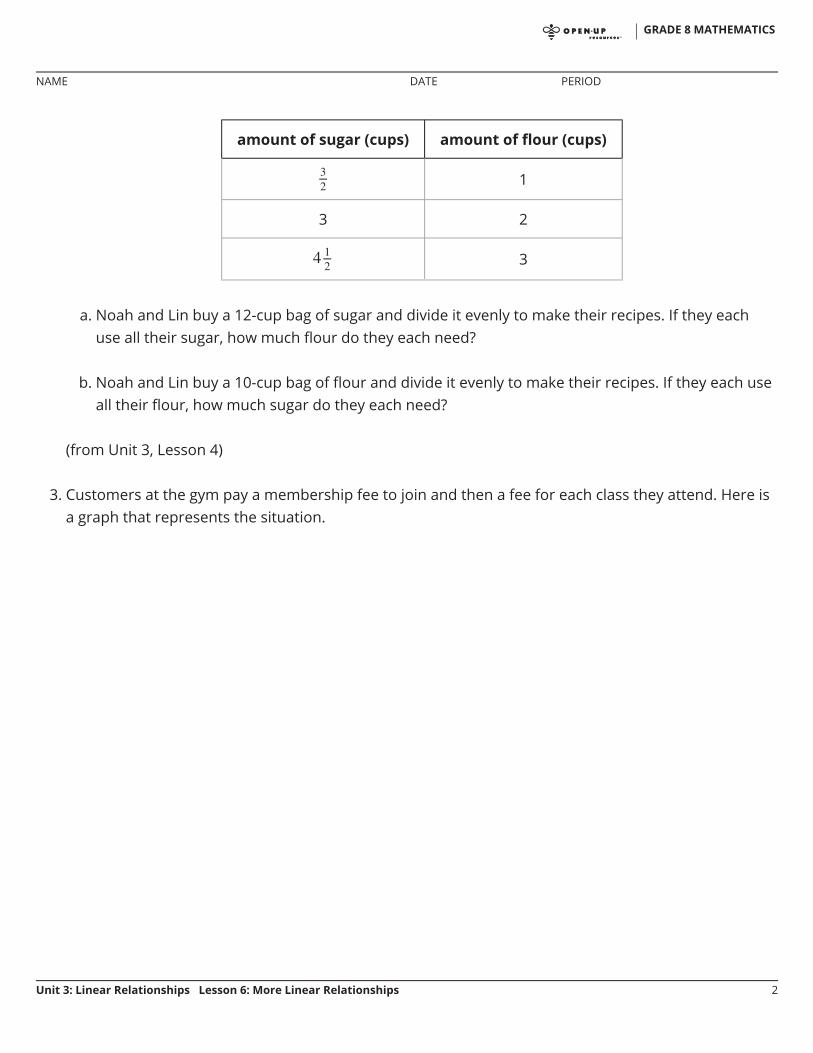
amount of sugar (cups) amount of flour (cups)
1
3 2
3
a. Noah and Lin buy a 12-cup bag of sugar and divide it evenly to make their recipes. If they eachuse all their sugar, how much flour do they each need?
b. Noah and Lin buy a 10-cup bag of flour and divide it evenly to make their recipes. If they each useall their flour, how much sugar do they each need?
(from Unit 3, Lesson 4)
3. Customers at the gym pay a membership fee to join and then a fee for each class they attend. Here isa graph that represents the situation.
GRADE 8 MATHEMATICS
NAME DATE PERIOD
Unit 3: Linear Relationships Lesson 6: More Linear Relationships 2
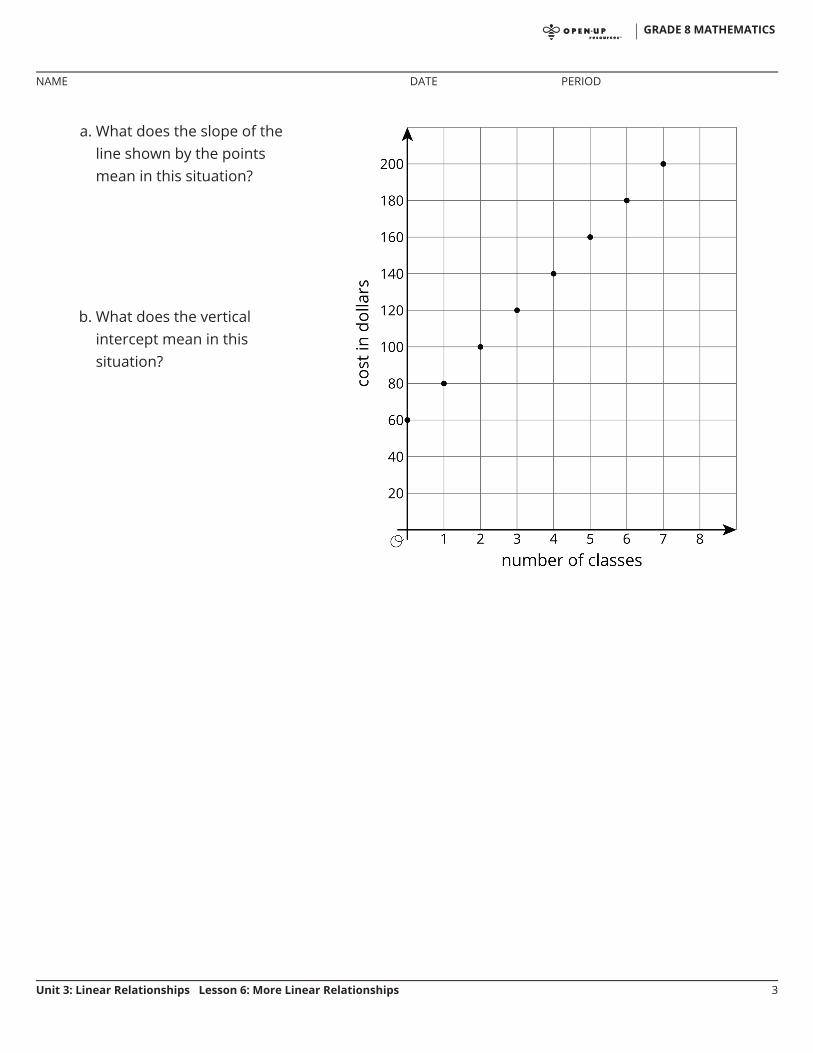
a. What does the slope of theline shown by the pointsmean in this situation?
b. What does the verticalintercept mean in thissituation?
GRADE 8 MATHEMATICS
NAME DATE PERIOD
Unit 3: Linear Relationships Lesson 6: More Linear Relationships 3
m.openup.org/1/8-3-7-2
Unit 3, Lesson 7: Representations of LinearRelationshipsLet’s write equations from real situations.
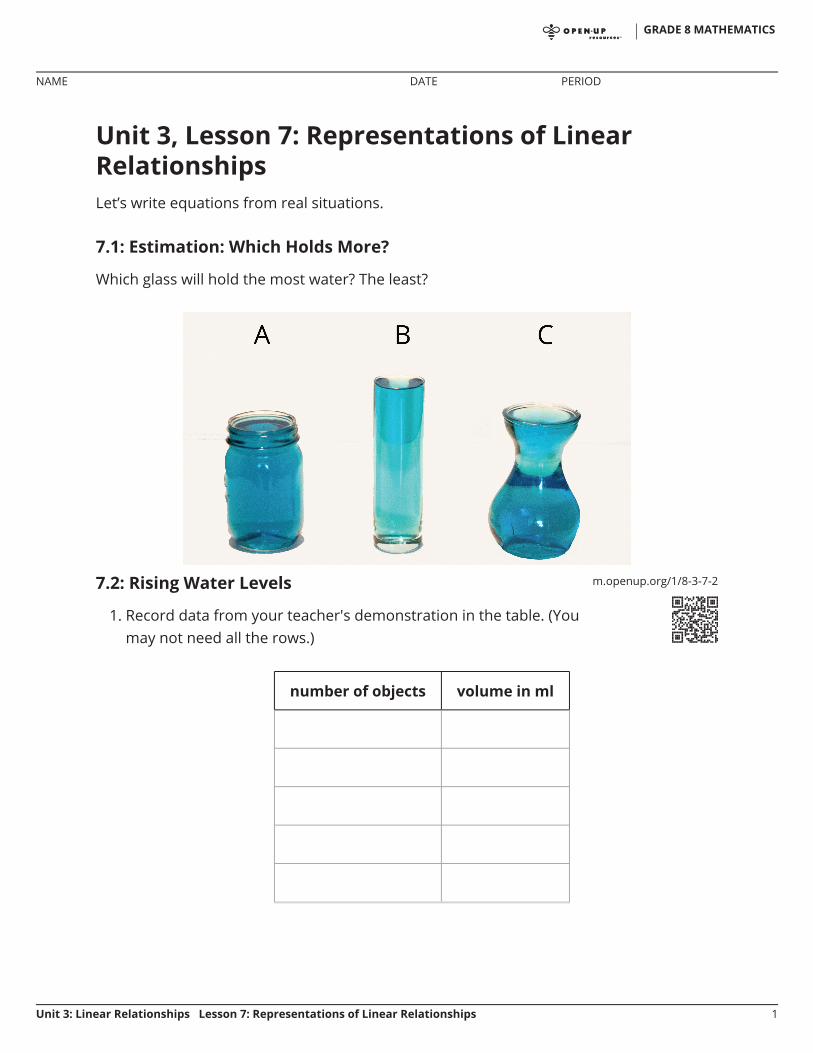
7.1: Estimation: Which Holds More?
Which glass will hold the most water? The least?
7.2: Rising Water Levels
1. Record data from your teacher's demonstration in the table. (Youmay not need all the rows.)
number of objects volume in ml
GRADE 8 MATHEMATICS
NAME DATE PERIOD
Unit 3: Linear Relationships Lesson 7: Representations of Linear Relationships 1
2. What is the volume, , in the cylinder after you add objects? Explain yourreasoning.
3. If you wanted to make the water reach the highest mark on the cylinder, how manyobjects would you need?
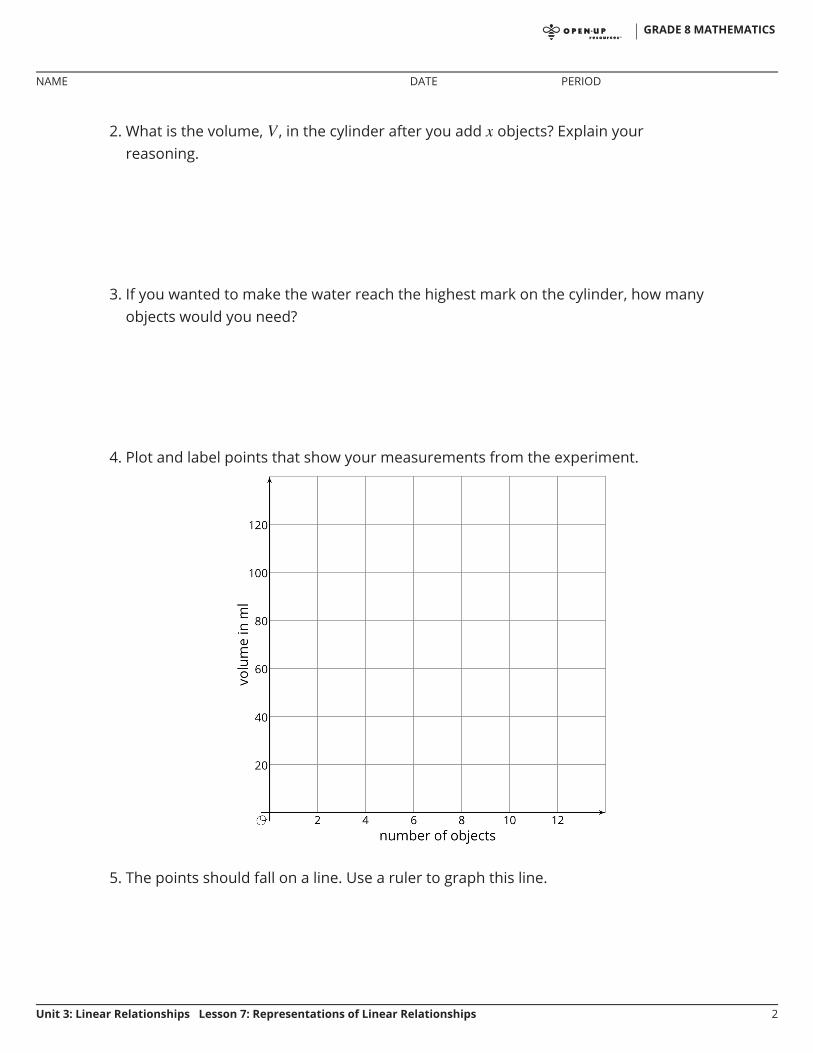
4. Plot and label points that show your measurements from the experiment.
5. The points should fall on a line. Use a ruler to graph this line.
GRADE 8 MATHEMATICS
NAME DATE PERIOD
Unit 3: Linear Relationships Lesson 7: Representations of Linear Relationships 2
6. Compute the slope of the line. What does the slope mean in this situation?
7. What is the vertical intercept? What does vertical intercept mean in this situation?
Are you ready for more?
A situation is represented by the equation .
1. Invent a story for this situation.
2. Graph the equation.
3. What do the and the 5 represent in your situation?
4. Where do you see the and 5 on the graph?
GRADE 8 MATHEMATICS
NAME DATE PERIOD
Unit 3: Linear Relationships Lesson 7: Representations of Linear Relationships 3
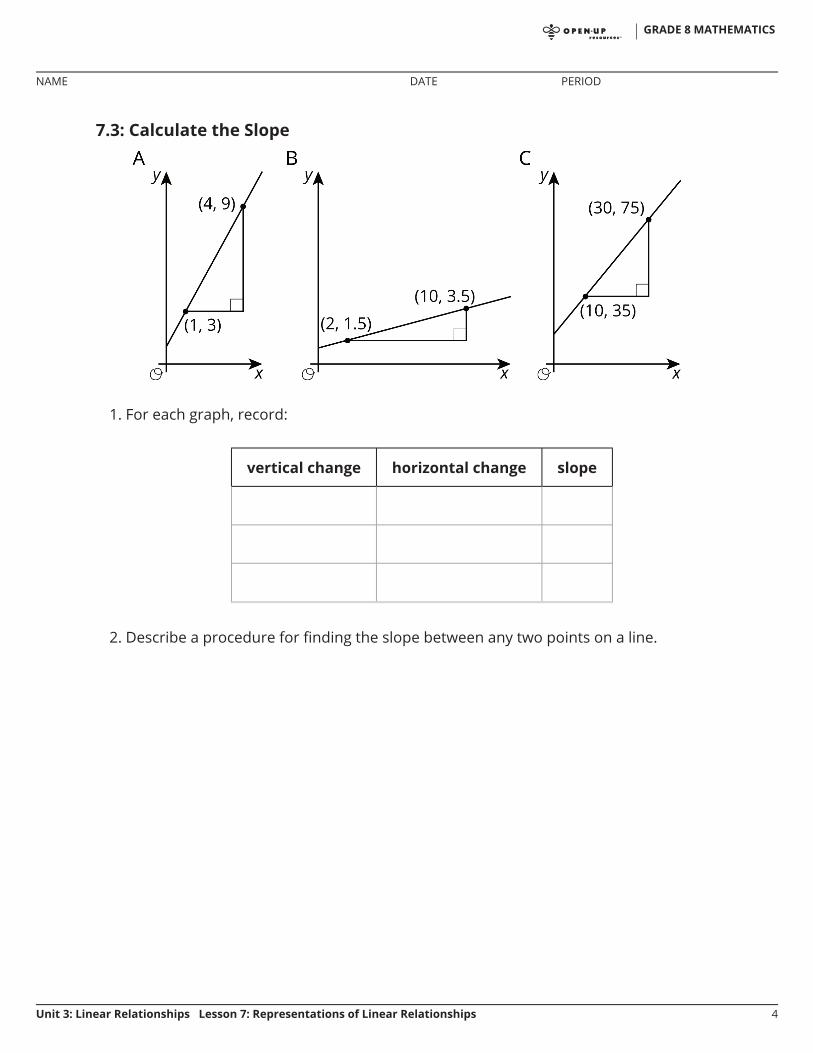
7.3: Calculate the Slope
1. For each graph, record:
vertical change horizontal change slope
2. Describe a procedure for finding the slope between any two points on a line.
GRADE 8 MATHEMATICS
NAME DATE PERIOD
Unit 3: Linear Relationships Lesson 7: Representations of Linear Relationships 4
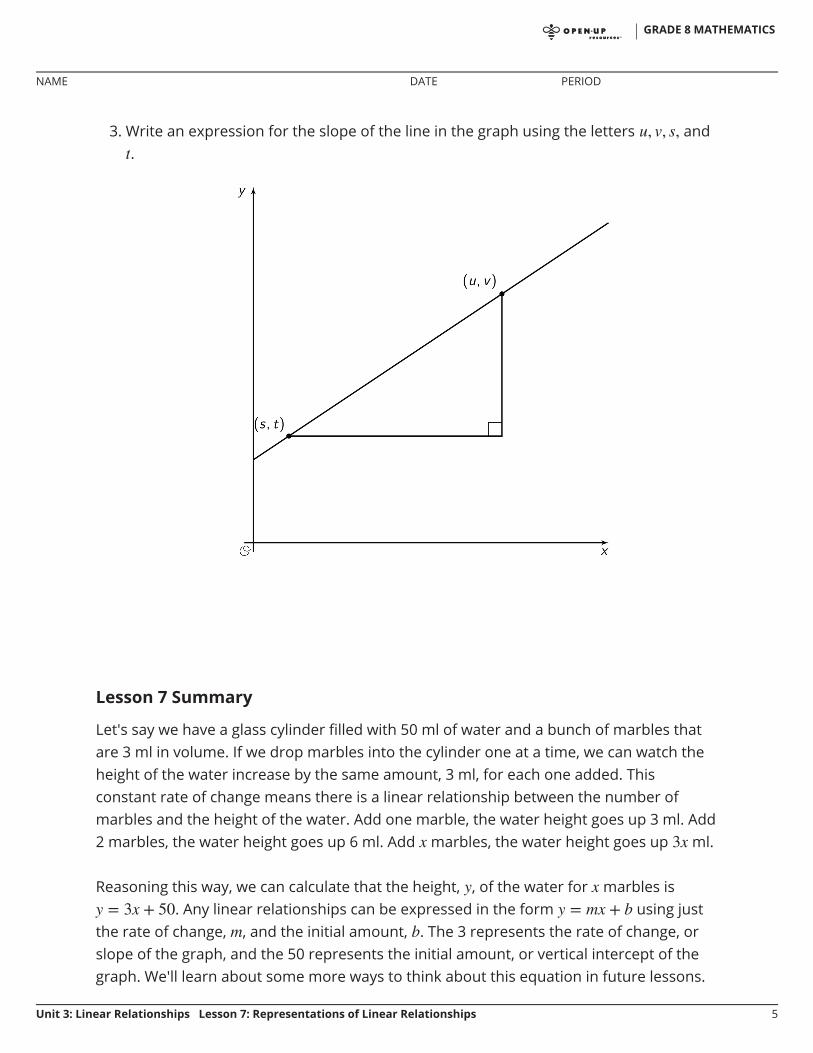
3. Write an expression for the slope of the line in the graph using the letters and.
Lesson 7 Summary
Let's say we have a glass cylinder filled with 50 ml of water and a bunch of marbles thatare 3 ml in volume. If we drop marbles into the cylinder one at a time, we can watch theheight of the water increase by the same amount, 3 ml, for each one added. Thisconstant rate of change means there is a linear relationship between the number ofmarbles and the height of the water. Add one marble, the water height goes up 3 ml. Add2 marbles, the water height goes up 6 ml. Add marbles, the water height goes up ml.
Reasoning this way, we can calculate that the height, , of the water for marbles is. Any linear relationships can be expressed in the form using just
the rate of change, , and the initial amount, . The 3 represents the rate of change, orslope of the graph, and the 50 represents the initial amount, or vertical intercept of thegraph. We'll learn about some more ways to think about this equation in future lessons.
GRADE 8 MATHEMATICS
NAME DATE PERIOD
Unit 3: Linear Relationships Lesson 7: Representations of Linear Relationships 5
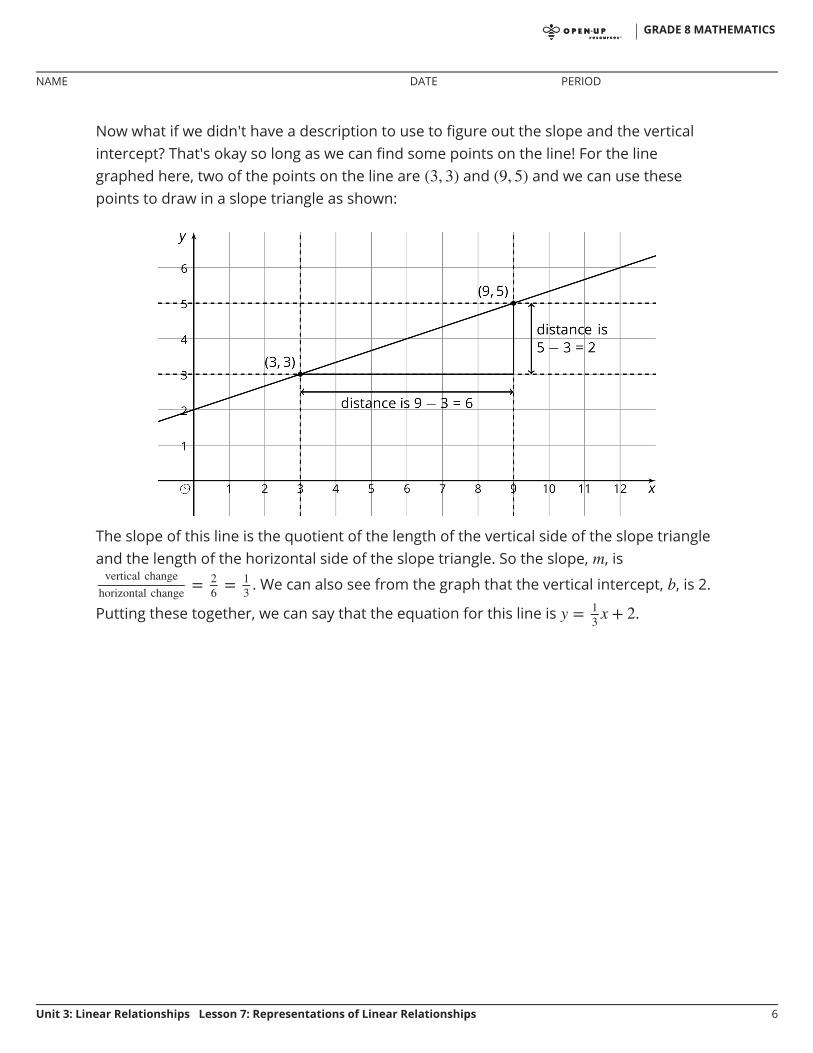
Now what if we didn't have a description to use to figure out the slope and the verticalintercept? That's okay so long as we can find some points on the line! For the linegraphed here, two of the points on the line are and and we can use thesepoints to draw in a slope triangle as shown:
The slope of this line is the quotient of the length of the vertical side of the slope triangleand the length of the horizontal side of the slope triangle. So the slope, , is
. We can also see from the graph that the vertical intercept, , is 2.
Putting these together, we can say that the equation for this line is .
GRADE 8 MATHEMATICS
NAME DATE PERIOD
Unit 3: Linear Relationships Lesson 7: Representations of Linear Relationships 6
Unit 3, Lesson 7: Representations of Linear Relationships1. Here are recipes for two different banana cakes. Information for the first recipe is shown in the table.
a. If you used 4 cups of sugar, how much flour does each recipe need?
b. What is the constant of proportionality for each situation and what does it mean?
(from Unit 3, Lesson 4)
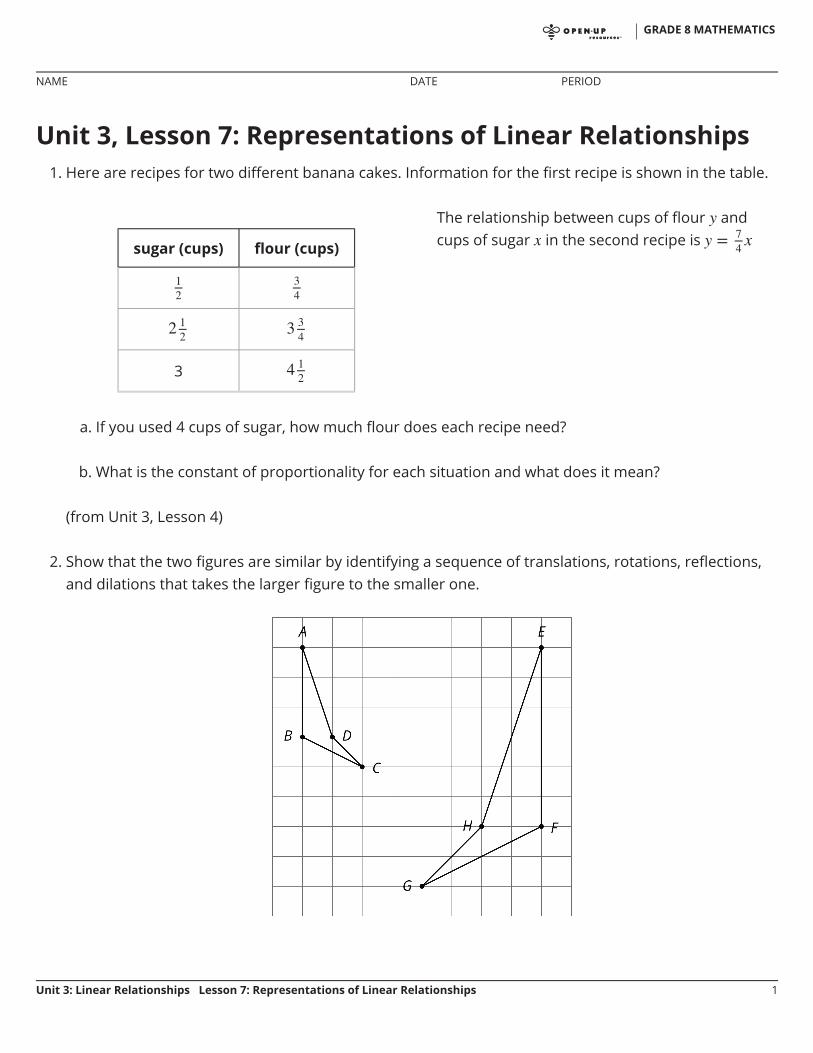
2. Show that the two figures are similar by identifying a sequence of translations, rotations, reflections,and dilations that takes the larger figure to the smaller one.
sugar (cups) flour (cups)
3
The relationship between cups of flour andcups of sugar in the second recipe is
GRADE 8 MATHEMATICS
NAME DATE PERIOD
Unit 3: Linear Relationships Lesson 7: Representations of Linear Relationships 1
(from Unit 2, Lesson 6)
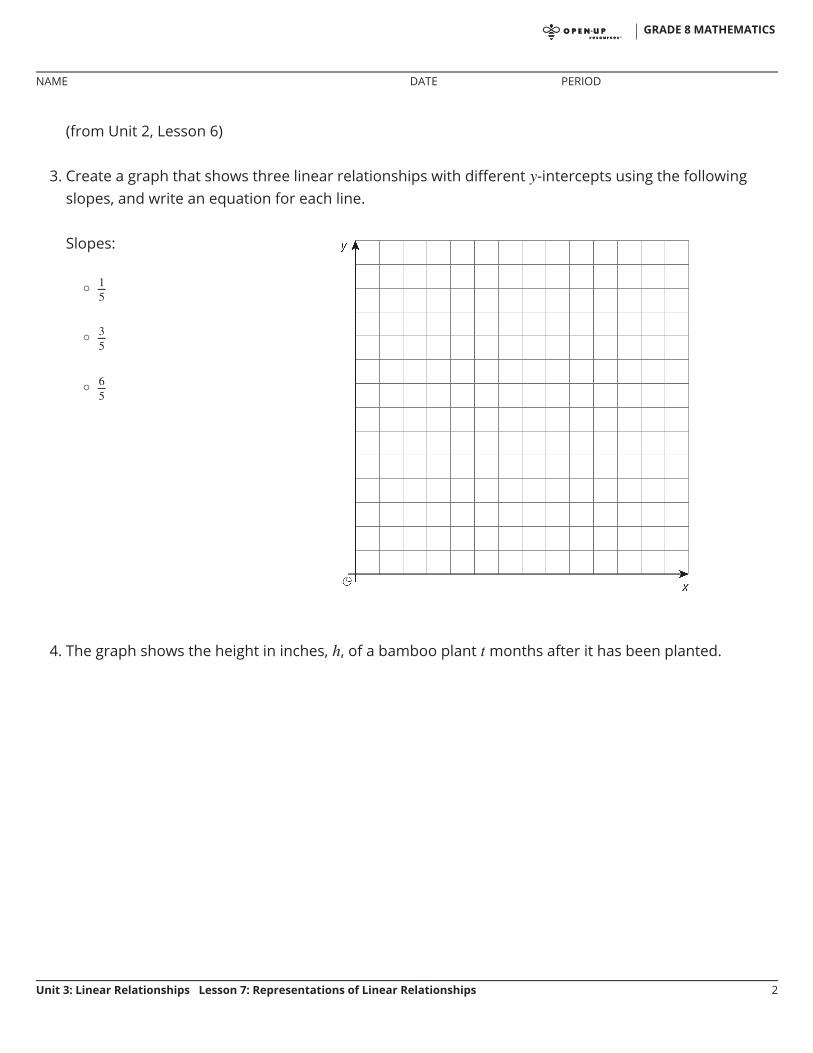
3. Create a graph that shows three linear relationships with different -intercepts using the followingslopes, and write an equation for each line.
4. The graph shows the height in inches, , of a bamboo plant months after it has been planted.
Slopes:
◦
◦
◦
GRADE 8 MATHEMATICS
NAME DATE PERIOD
Unit 3: Linear Relationships Lesson 7: Representations of Linear Relationships 2
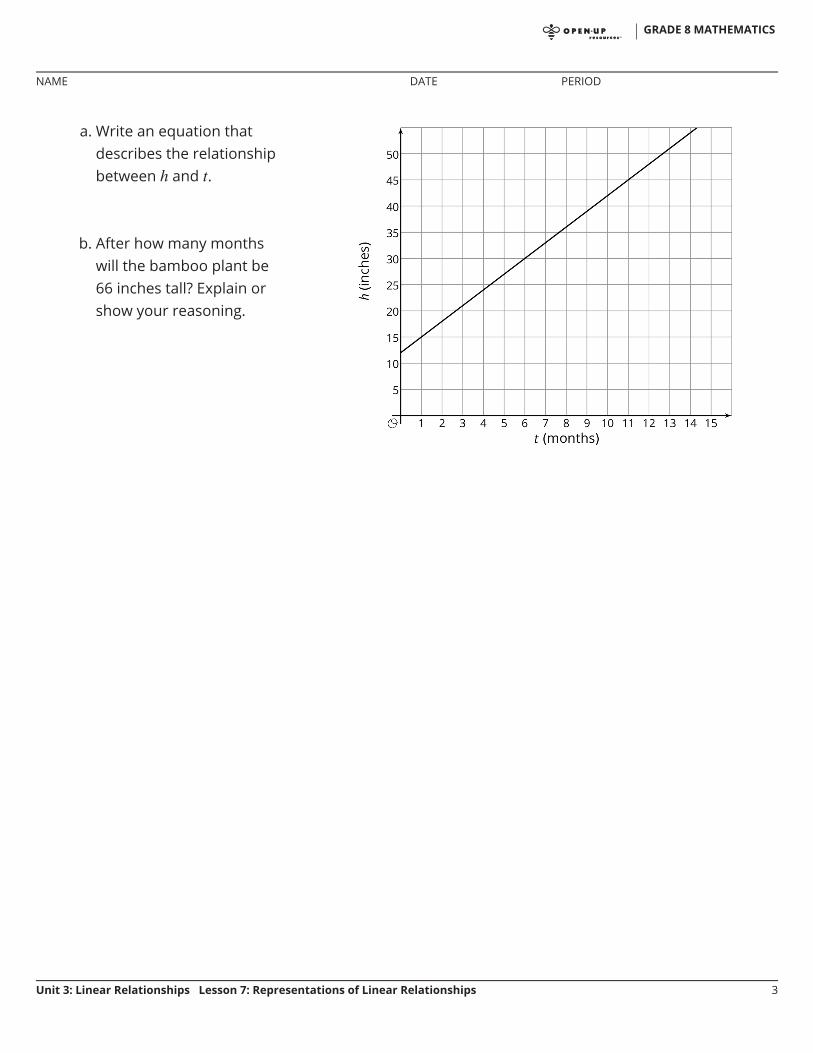
a. Write an equation thatdescribes the relationshipbetween and .
b. After how many monthswill the bamboo plant be66 inches tall? Explain orshow your reasoning.
GRADE 8 MATHEMATICS
NAME DATE PERIOD
Unit 3: Linear Relationships Lesson 7: Representations of Linear Relationships 3
Unit 3, Lesson 8: Translating toLet’s see what happens to the equations of translated lines.
8.1: Lines that Are Translations
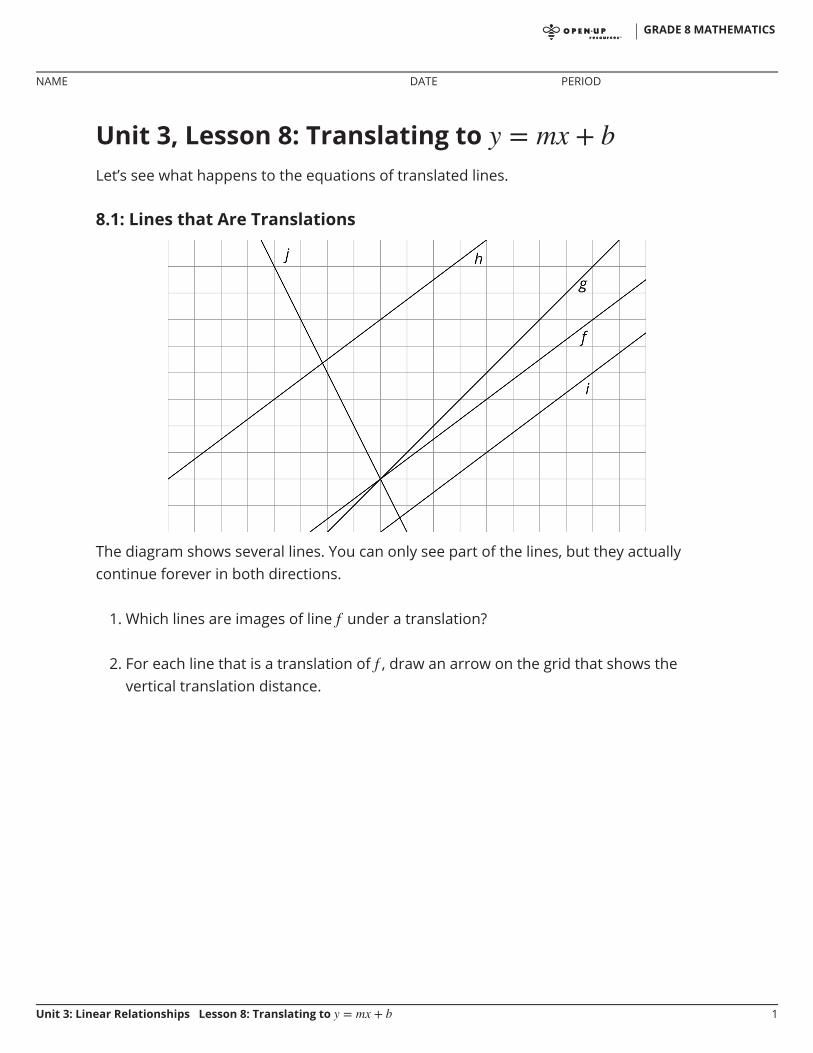
The diagram shows several lines. You can only see part of the lines, but they actuallycontinue forever in both directions.
1. Which lines are images of line under a translation?
2. For each line that is a translation of , draw an arrow on the grid that shows thevertical translation distance.
GRADE 8 MATHEMATICS
NAME DATE PERIOD
Unit 3: Linear Relationships Lesson 8: Translating to 1
m.openup.org/1/8-3-8-28.2: Increased Savings
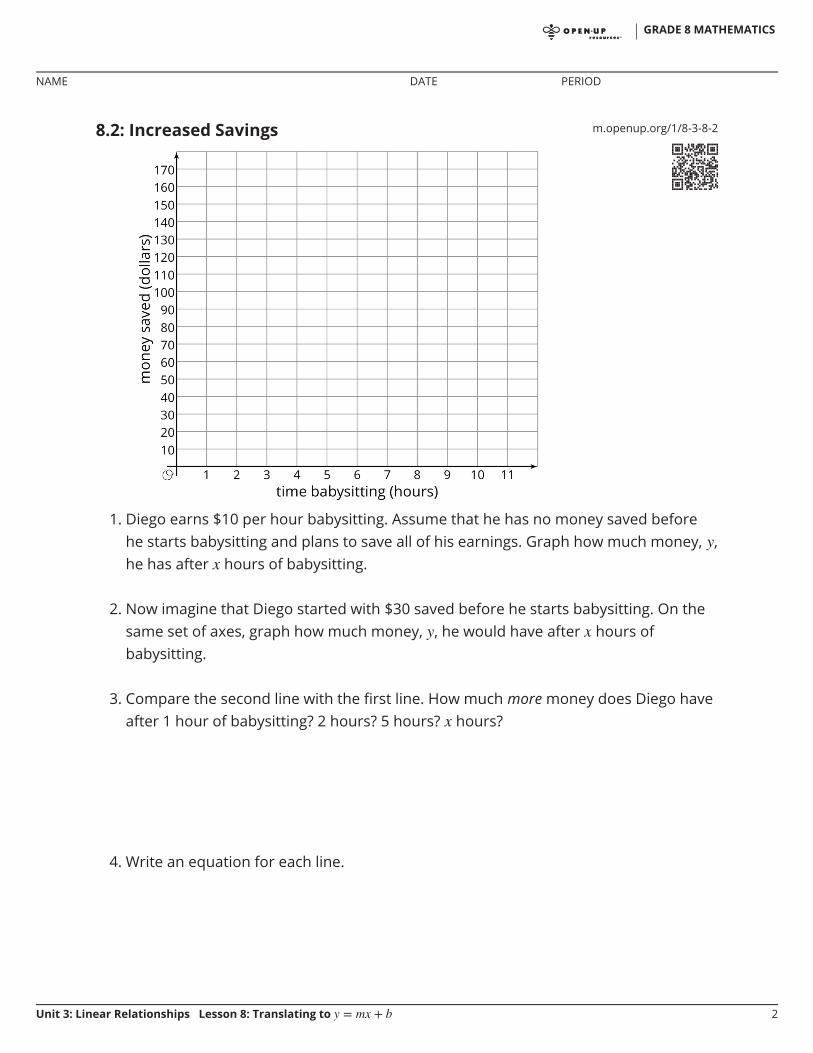
1. Diego earns $10 per hour babysitting. Assume that he has no money saved beforehe starts babysitting and plans to save all of his earnings. Graph how much money, ,he has after hours of babysitting.
2. Now imagine that Diego started with $30 saved before he starts babysitting. On thesame set of axes, graph how much money, , he would have after hours ofbabysitting.
3. Compare the second line with the first line. How much more money does Diego haveafter 1 hour of babysitting? 2 hours? 5 hours? hours?
4. Write an equation for each line.
GRADE 8 MATHEMATICS
NAME DATE PERIOD
Unit 3: Linear Relationships Lesson 8: Translating to 2
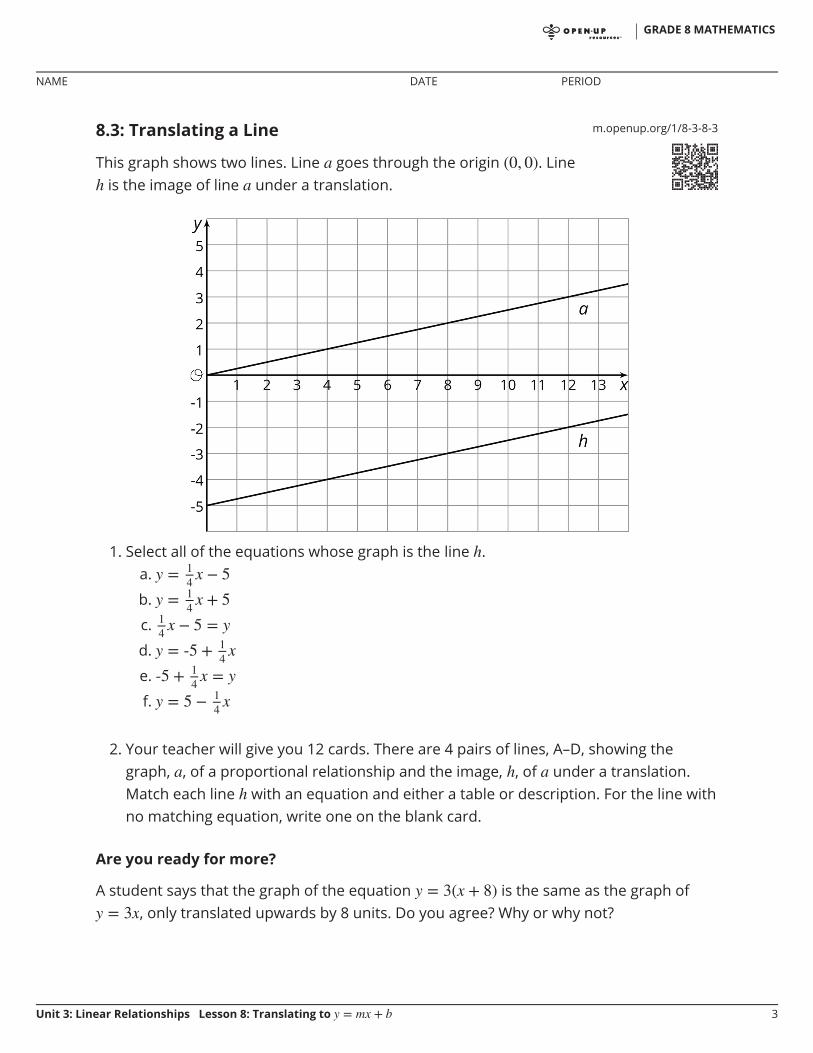
m.openup.org/1/8-3-8-38.3: Translating a Line
This graph shows two lines. Line goes through the origin . Lineis the image of line under a translation.
1. Select all of the equations whose graph is the line .a.
b.
c.
d.
e.
f.
2. Your teacher will give you 12 cards. There are 4 pairs of lines, A–D, showing thegraph, , of a proportional relationship and the image, , of under a translation.Match each line with an equation and either a table or description. For the line withno matching equation, write one on the blank card.
Are you ready for more?
A student says that the graph of the equation is the same as the graph of, only translated upwards by 8 units. Do you agree? Why or why not?
GRADE 8 MATHEMATICS
NAME DATE PERIOD
Unit 3: Linear Relationships Lesson 8: Translating to 3
Lesson 8 Summary
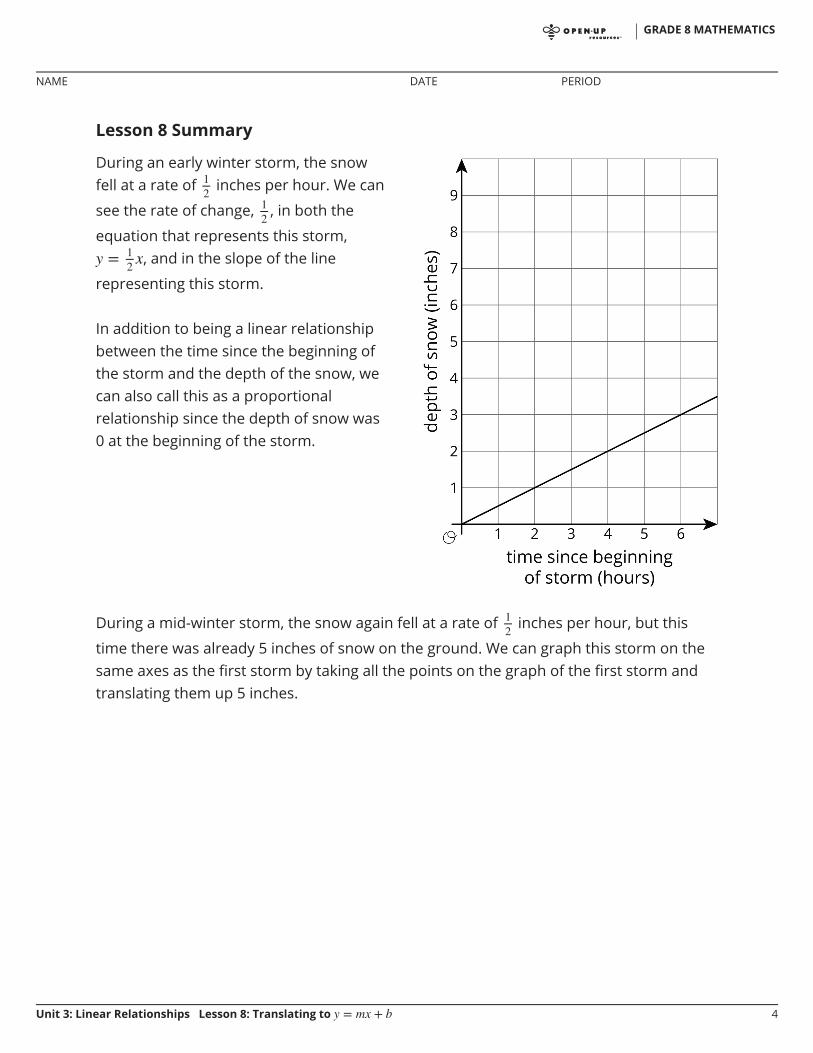
During a mid-winter storm, the snow again fell at a rate of inches per hour, but this
time there was already 5 inches of snow on the ground. We can graph this storm on thesame axes as the first storm by taking all the points on the graph of the first storm andtranslating them up 5 inches.
During an early winter storm, the snowfell at a rate of inches per hour. We can
see the rate of change, , in both the
equation that represents this storm,, and in the slope of the line
representing this storm.
In addition to being a linear relationshipbetween the time since the beginning ofthe storm and the depth of the snow, wecan also call this as a proportionalrelationship since the depth of snow was0 at the beginning of the storm.
GRADE 8 MATHEMATICS
NAME DATE PERIOD
Unit 3: Linear Relationships Lesson 8: Translating to 4
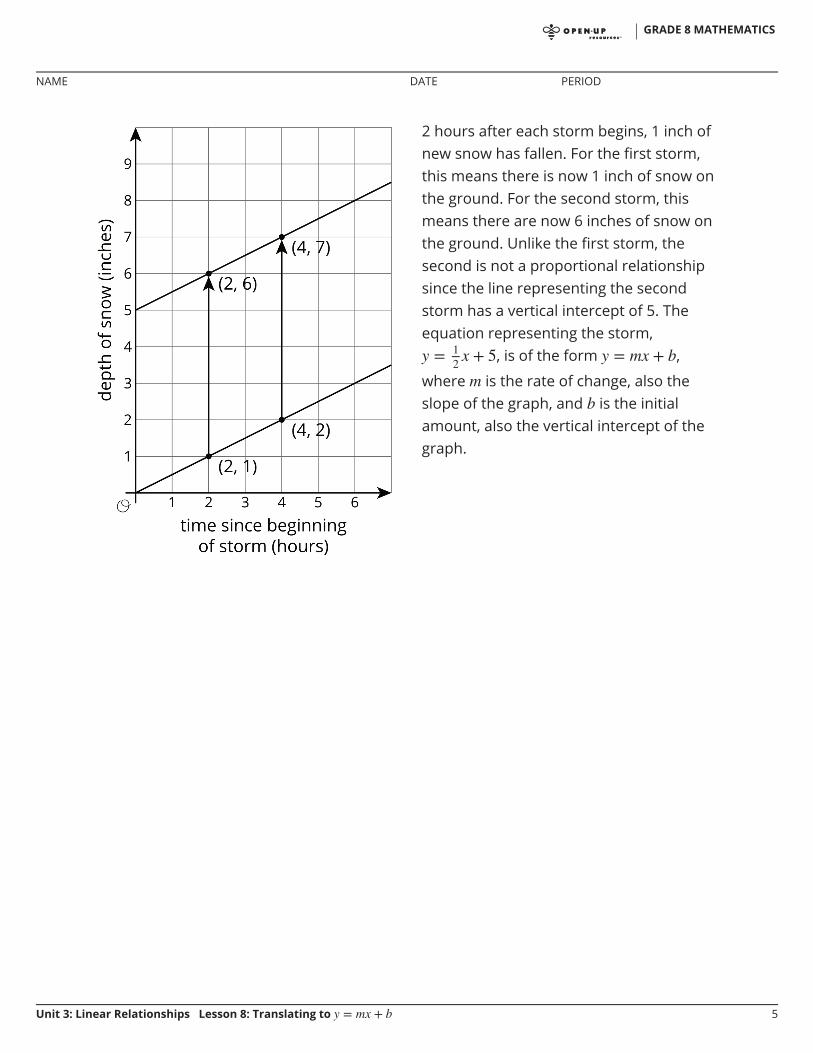
2 hours after each storm begins, 1 inch ofnew snow has fallen. For the first storm,this means there is now 1 inch of snow onthe ground. For the second storm, thismeans there are now 6 inches of snow onthe ground. Unlike the first storm, thesecond is not a proportional relationshipsince the line representing the secondstorm has a vertical intercept of 5. Theequation representing the storm,
, is of the form ,
where is the rate of change, also theslope of the graph, and is the initialamount, also the vertical intercept of thegraph.
GRADE 8 MATHEMATICS
NAME DATE PERIOD
Unit 3: Linear Relationships Lesson 8: Translating to 5
Unit 3, Lesson 8: Translating to1. Select all equations that have graphs with the same -intercept.
A.B.C.D.E.F.
2. Create a graph showing the equations and . Explain how the graphs are the same
and how they are different.
3. A cable company charges $70 per month for cable service to existing customers.
a. Find a linear equation representing the relationship between , the number of months of service,and , the total amount paid in dollars by an existing customer.
b. For new customers, there is an additional one-time $100 service fee. Repeat the previous problemfor new customers.
c. When the two equations are graphed in the coordinate plane, how are they related to each othergeometrically?
4. Match each graph to a situation.
GRADE 8 MATHEMATICS
NAME DATE PERIOD
Unit 3: Linear Relationships Lesson 8: Translating to 1
(from Unit 3, Lesson 6)
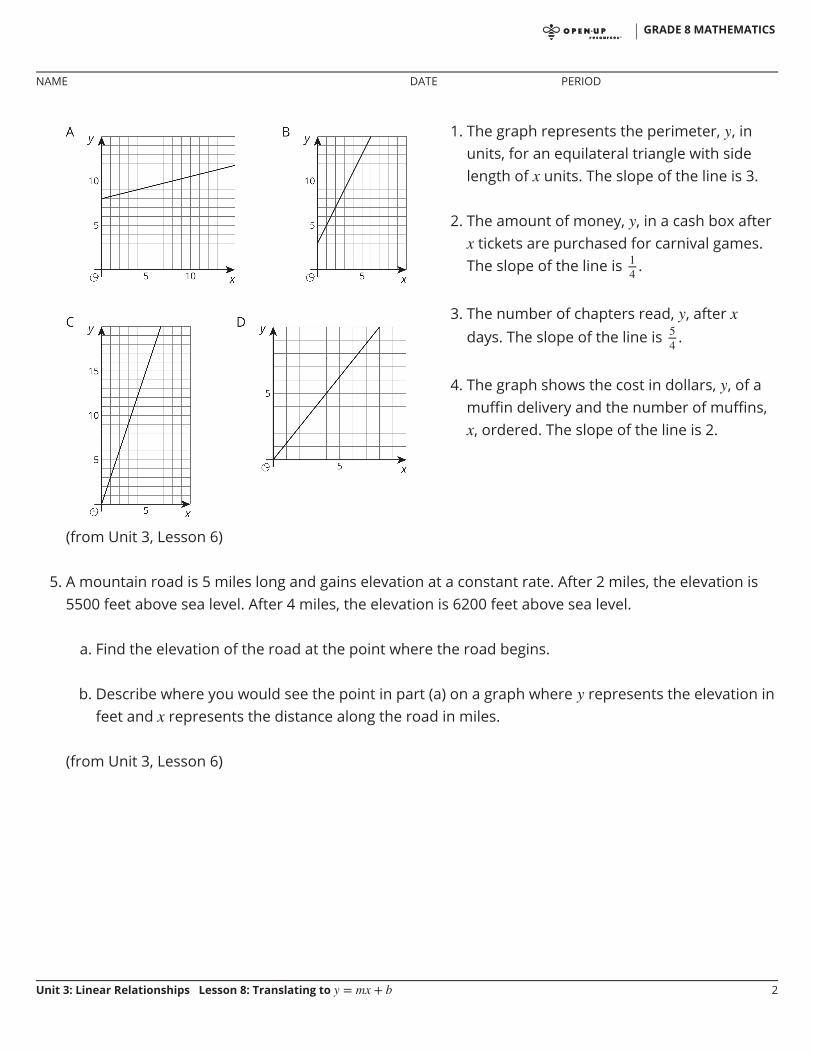
5. A mountain road is 5 miles long and gains elevation at a constant rate. After 2 miles, the elevation is5500 feet above sea level. After 4 miles, the elevation is 6200 feet above sea level.
a. Find the elevation of the road at the point where the road begins.
b. Describe where you would see the point in part (a) on a graph where represents the elevation infeet and represents the distance along the road in miles.
(from Unit 3, Lesson 6)
1. The graph represents the perimeter, , inunits, for an equilateral triangle with sidelength of units. The slope of the line is 3.
2. The amount of money, , in a cash box aftertickets are purchased for carnival games.
The slope of the line is .
3. The number of chapters read, , afterdays. The slope of the line is .
4. The graph shows the cost in dollars, , of amuffin delivery and the number of muffins,, ordered. The slope of the line is 2.
GRADE 8 MATHEMATICS
NAME DATE PERIOD
Unit 3: Linear Relationships Lesson 8: Translating to 2
m.openup.org/1/8-3-9-2
Unit 3, Lesson 9: Slopes Don't Have to be PositiveLet’s find out what a negative slope means.
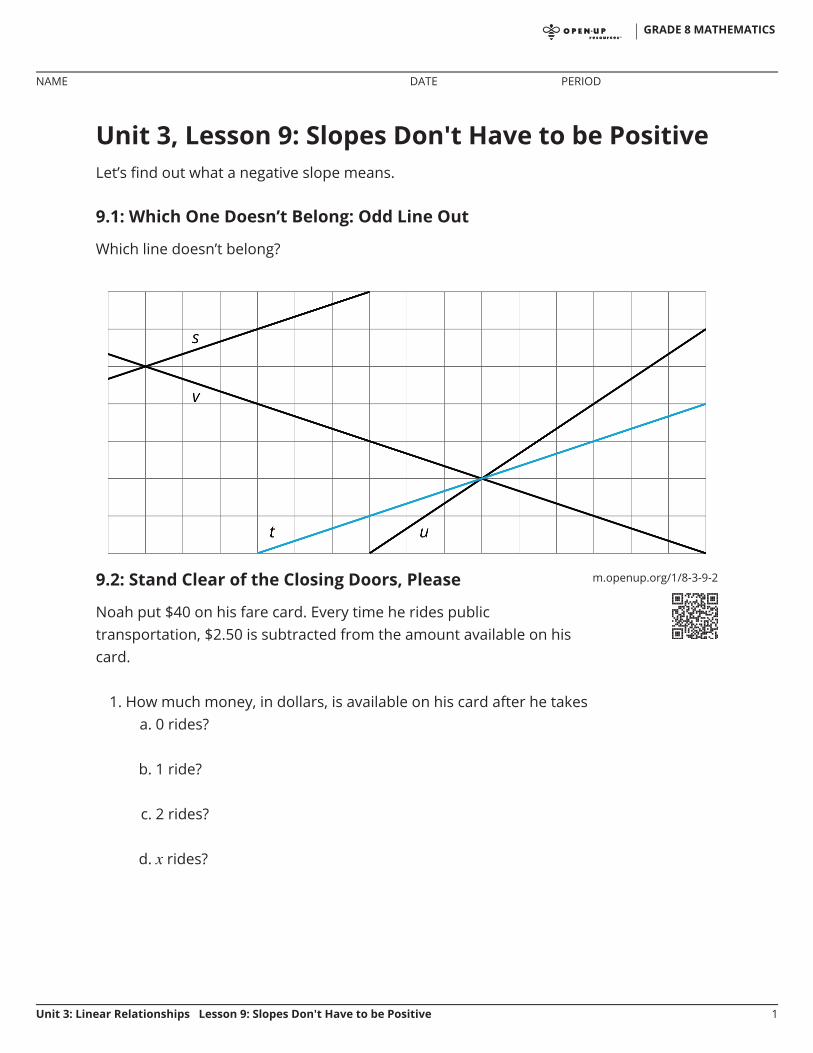
9.1: Which One Doesn’t Belong: Odd Line Out
Which line doesn’t belong?
9.2: Stand Clear of the Closing Doors, Please
Noah put $40 on his fare card. Every time he rides publictransportation, $2.50 is subtracted from the amount available on hiscard.
1. How much money, in dollars, is available on his card after he takesa. 0 rides?
b. 1 ride?
c. 2 rides?
d. rides?
GRADE 8 MATHEMATICS
NAME DATE PERIOD
Unit 3: Linear Relationships Lesson 9: Slopes Don't Have to be Positive 1
m.openup.org/1/8-3-9-3
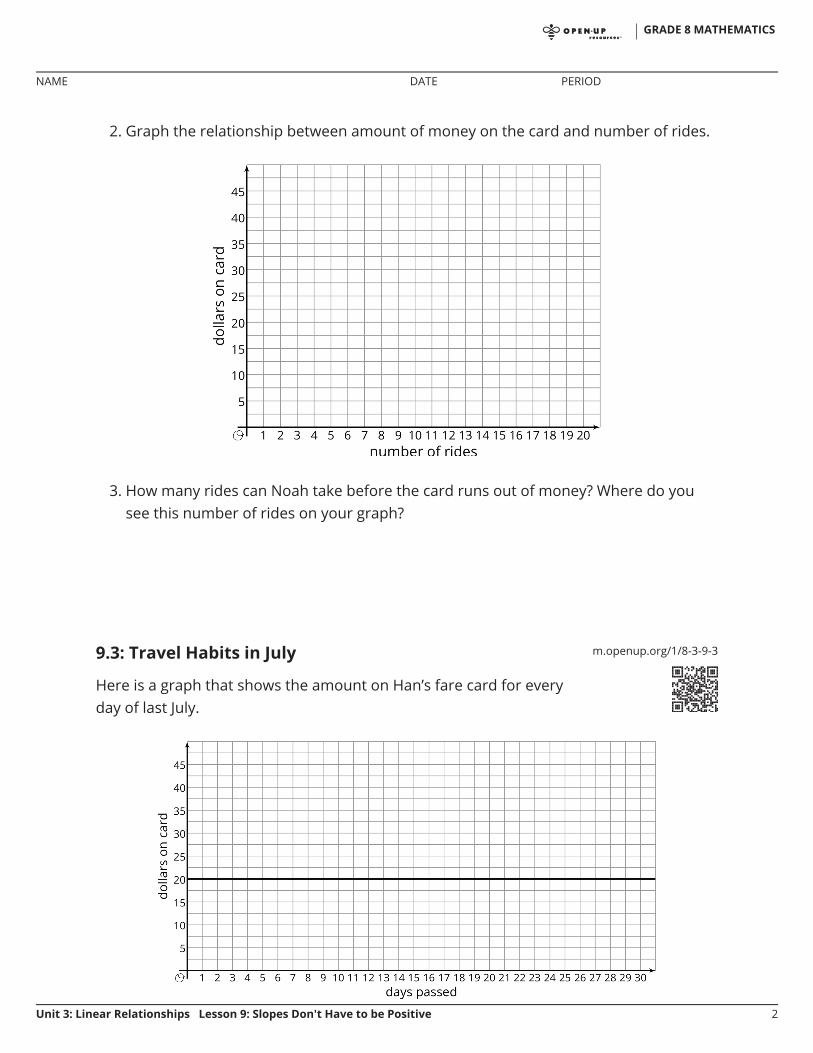
2. Graph the relationship between amount of money on the card and number of rides.
3. How many rides can Noah take before the card runs out of money? Where do yousee this number of rides on your graph?
9.3: Travel Habits in July
Here is a graph that shows the amount on Han’s fare card for everyday of last July.
GRADE 8 MATHEMATICS
NAME DATE PERIOD
Unit 3: Linear Relationships Lesson 9: Slopes Don't Have to be Positive 2
1. Describe what happened with the amount on Han’s fare card in July.
2. Plot and label 3 different points on the line.
3. Write an equation that represents the amount on the card in July, , after days.
4. What value makes sense for the slope of the line that represents the amounts onHan’s fare card in July?
Are you ready for more?
Let’s say you have taken out a loan and are paying it back. Which of the following graphshave positive slope and which have negative slope?
1. Amount paid on the vertical axis and time since payments started on the horizontalaxis.
2. Amount owed on the vertical axis and time remaining until the loan is paid off on thehorizontal axis.
3. Amount paid on the vertical axis and time remaining until the loan is paid off on thehorizontal axis.
GRADE 8 MATHEMATICS
NAME DATE PERIOD
Unit 3: Linear Relationships Lesson 9: Slopes Don't Have to be Positive 3
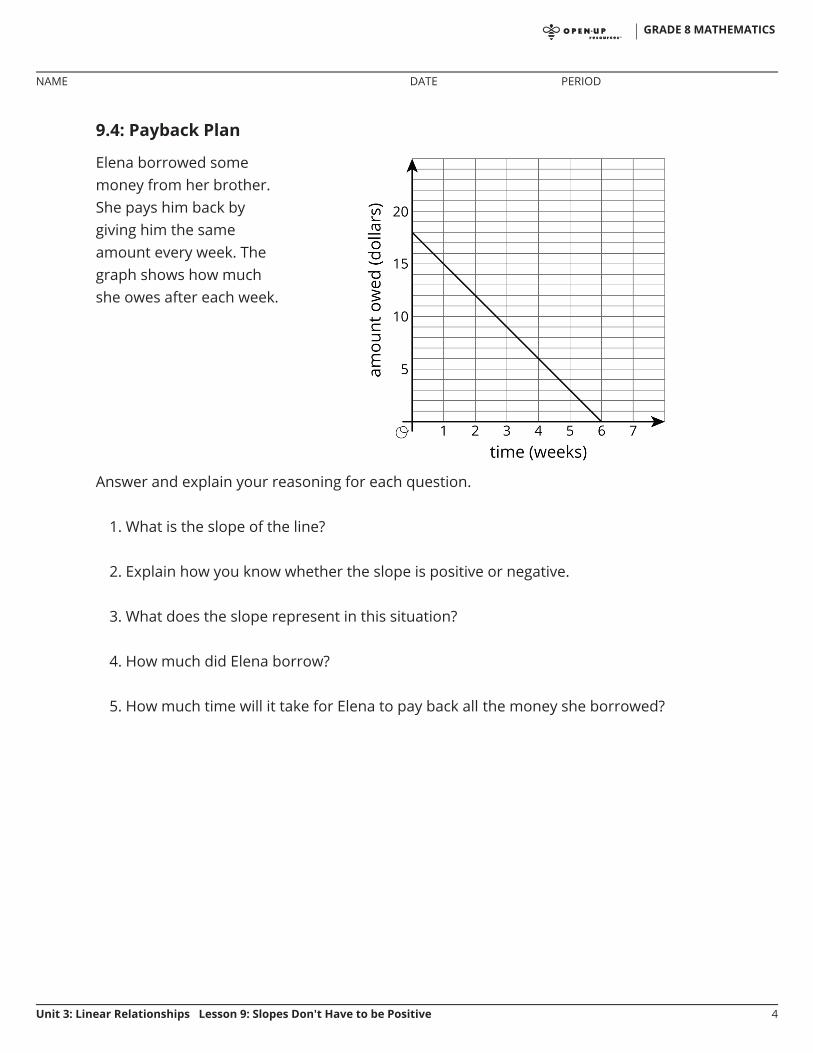
9.4: Payback Plan
Answer and explain your reasoning for each question.
1. What is the slope of the line?
2. Explain how you know whether the slope is positive or negative.
3. What does the slope represent in this situation?
4. How much did Elena borrow?
5. How much time will it take for Elena to pay back all the money she borrowed?
Elena borrowed somemoney from her brother.She pays him back bygiving him the sameamount every week. Thegraph shows how muchshe owes after each week.
GRADE 8 MATHEMATICS
NAME DATE PERIOD
Unit 3: Linear Relationships Lesson 9: Slopes Don't Have to be Positive 4
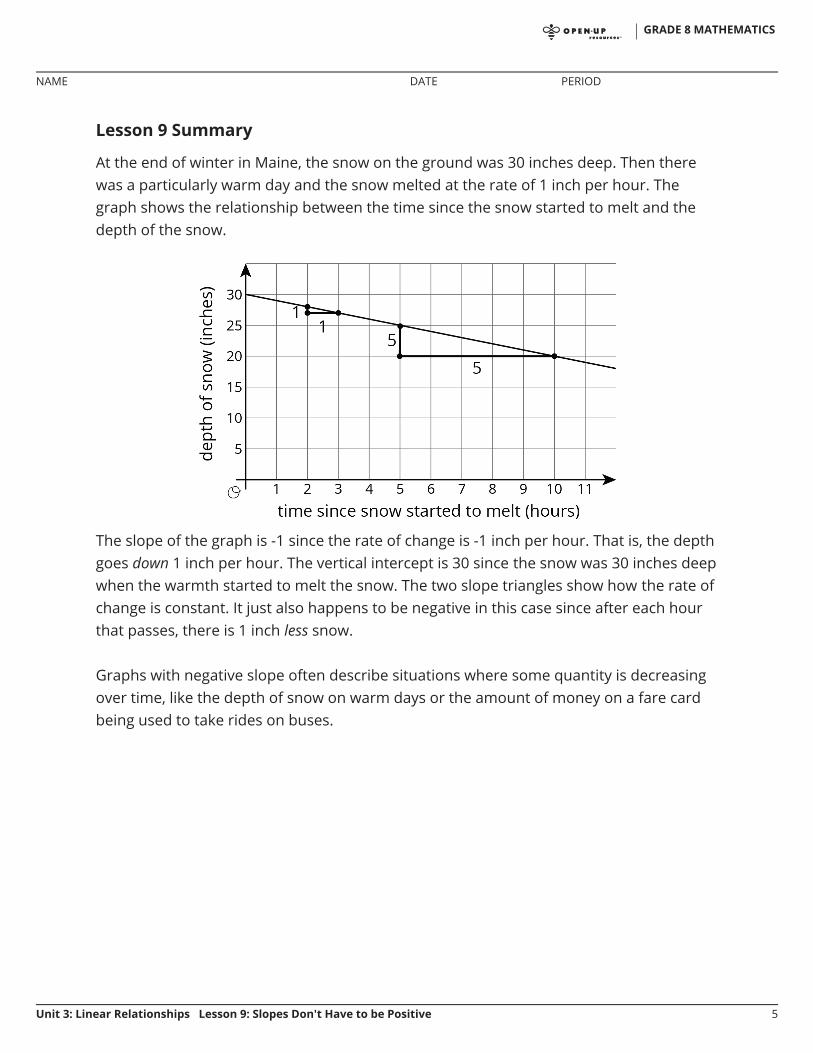
Lesson 9 Summary
At the end of winter in Maine, the snow on the ground was 30 inches deep. Then therewas a particularly warm day and the snow melted at the rate of 1 inch per hour. Thegraph shows the relationship between the time since the snow started to melt and thedepth of the snow.
The slope of the graph is -1 since the rate of change is -1 inch per hour. That is, the depthgoes down 1 inch per hour. The vertical intercept is 30 since the snow was 30 inches deepwhen the warmth started to melt the snow. The two slope triangles show how the rate ofchange is constant. It just also happens to be negative in this case since after each hourthat passes, there is 1 inch less snow.
Graphs with negative slope often describe situations where some quantity is decreasingover time, like the depth of snow on warm days or the amount of money on a fare cardbeing used to take rides on buses.
GRADE 8 MATHEMATICS
NAME DATE PERIOD
Unit 3: Linear Relationships Lesson 9: Slopes Don't Have to be Positive 5
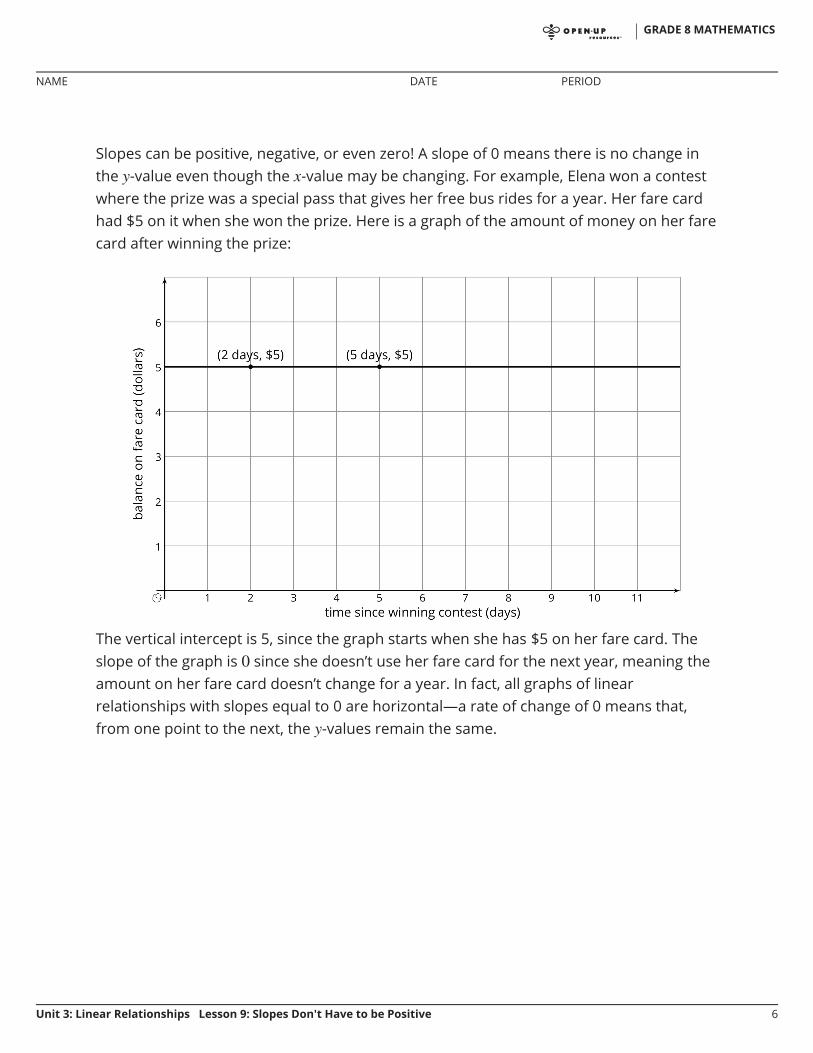
Slopes can be positive, negative, or even zero! A slope of 0 means there is no change inthe -value even though the -value may be changing. For example, Elena won a contestwhere the prize was a special pass that gives her free bus rides for a year. Her fare cardhad $5 on it when she won the prize. Here is a graph of the amount of money on her farecard after winning the prize:
The vertical intercept is 5, since the graph starts when she has $5 on her fare card. Theslope of the graph is since she doesn’t use her fare card for the next year, meaning theamount on her fare card doesn’t change for a year. In fact, all graphs of linearrelationships with slopes equal to 0 are horizontal—a rate of change of 0 means that,from one point to the next, the -values remain the same.
GRADE 8 MATHEMATICS
NAME DATE PERIOD
Unit 3: Linear Relationships Lesson 9: Slopes Don't Have to be Positive 6
Unit 3, Lesson 9: Slopes Don't Have to be Positive1. Suppose that during its flight, the elevation (in feet) of a certain airplane and its time , in minutes
since takeoff, are related by a linear equation. Consider the graph of this equation, with timerepresented on the horizontal axis and elevation on the vertical axis. For each situation, decide if theslope is positive, zero, or negative.
a. The plane is cruising at an altitude of 37,000 feet above sea level.
b. The plane is descending at rate of 1000 feet per minute.
c. The plane is ascending at a rate of 2000 feet per minute.
2. A group of hikers park their car at a trail head and hike into the forest to a campsite. The nextmorning, they head out on a hike from their campsite walking at a steady rate. The graph shows theirdistance in miles, , from the car on the day of their hike after hours.
GRADE 8 MATHEMATICS
NAME DATE PERIOD
Unit 3: Linear Relationships Lesson 9: Slopes Don't Have to be Positive 1
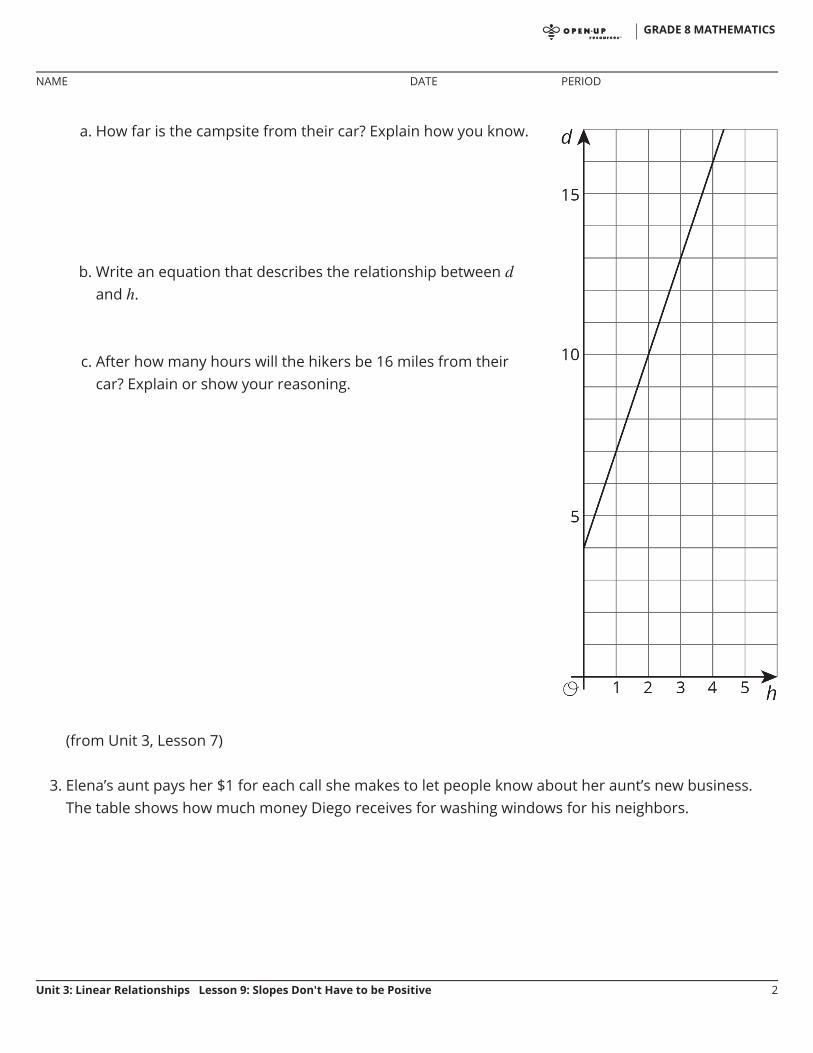
(from Unit 3, Lesson 7)
3. Elena’s aunt pays her $1 for each call she makes to let people know about her aunt’s new business.The table shows how much money Diego receives for washing windows for his neighbors.
a. How far is the campsite from their car? Explain how you know.
b. Write an equation that describes the relationship betweenand .
c. After how many hours will the hikers be 16 miles from theircar? Explain or show your reasoning.
GRADE 8 MATHEMATICS
NAME DATE PERIOD
Unit 3: Linear Relationships Lesson 9: Slopes Don't Have to be Positive 2
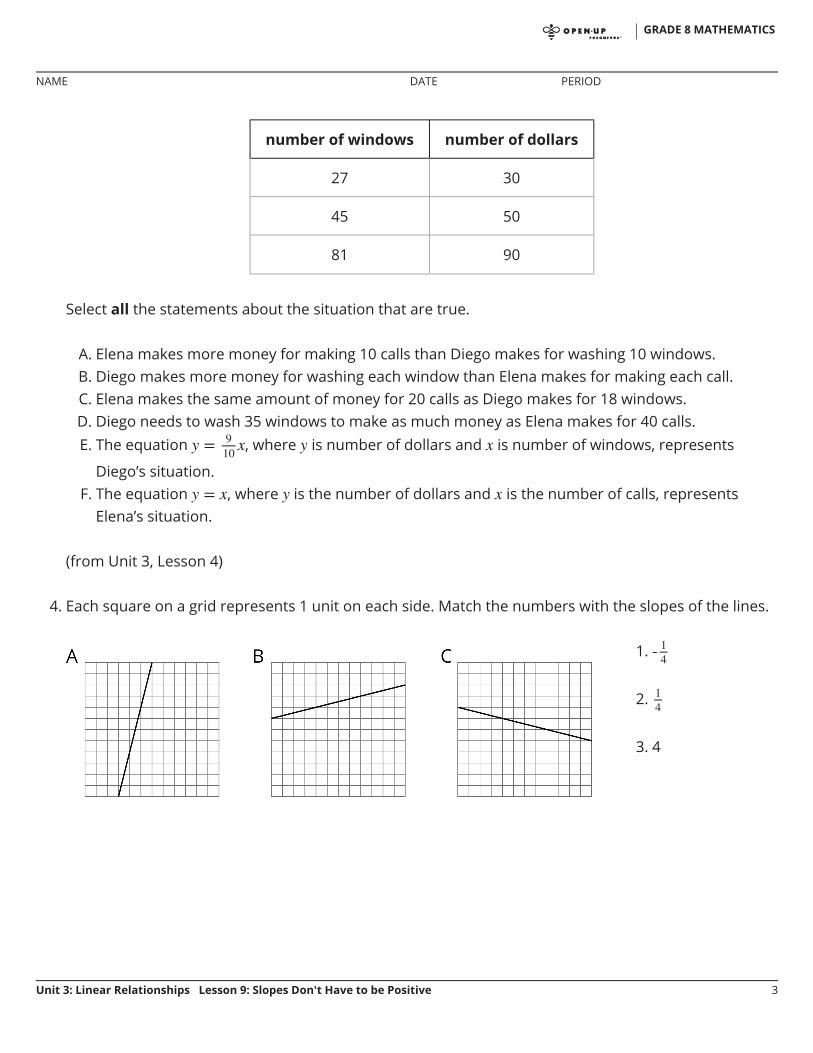
number of windows number of dollars
27 30
45 50
81 90
Select all the statements about the situation that are true.
A. Elena makes more money for making 10 calls than Diego makes for washing 10 windows.B. Diego makes more money for washing each window than Elena makes for making each call.C. Elena makes the same amount of money for 20 calls as Diego makes for 18 windows.D. Diego needs to wash 35 windows to make as much money as Elena makes for 40 calls.E. The equation , where is number of dollars and is number of windows, represents
Diego’s situation.F. The equation , where is the number of dollars and is the number of calls, represents
Elena’s situation.
(from Unit 3, Lesson 4)
4. Each square on a grid represents 1 unit on each side. Match the numbers with the slopes of the lines.
1.
2.
3. 4
GRADE 8 MATHEMATICS
NAME DATE PERIOD
Unit 3: Linear Relationships Lesson 9: Slopes Don't Have to be Positive 3
Unit 3, Lesson 10: Calculating SlopeLet’s calculate slope from two points.
10.1: Integer Operations Review
Find values for and that make each side have the same value.
1.
2.
3.
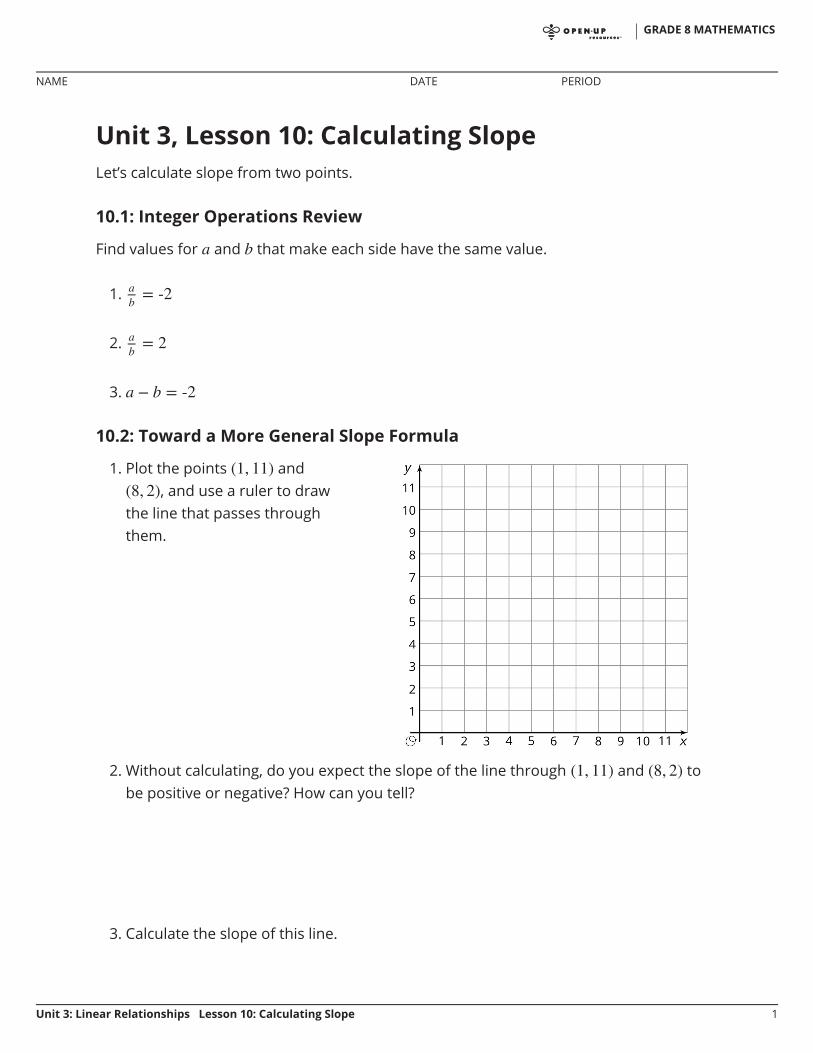
10.2: Toward a More General Slope Formula
2. Without calculating, do you expect the slope of the line through and tobe positive or negative? How can you tell?
3. Calculate the slope of this line.
1. Plot the points and, and use a ruler to draw
the line that passes throughthem.
GRADE 8 MATHEMATICS
NAME DATE PERIOD
Unit 3: Linear Relationships Lesson 10: Calculating Slope 1
Are you ready for more?
Find the value of so that the line passing through each pair of points has the givenslope.
1. and , slope = 22. and , slope = -23. and , slope =
4. and , slope =
5. and , slope = 0
10.3: Making Designs
Your teacher will give you either a design or a blank graph. Do not show your card toyour partner.
When finished, place the drawing next to the card with the design so that you and yourpartner can both see them. How is the drawing the same as the design? How is itdifferent? Discuss any miscommunication that might have caused the drawing to lookdifferent from the design.
Pause here so your teacher can review your work. When your teacher gives you a newset of cards, switch roles for the second problem.
If your teacher gives you the design:
1. Look at the design silently and thinkabout how you could communicatewhat your partner should draw. Thinkabout ways that you can describewhat a line looks like, such as its slopeor points that it goes through.
2. Describe each line, one at a time, andgive your partner time to draw them.
3. Once your partner thinks they havedrawn all the lines you described, onlythen should you show them thedesign.
If your teacher gives you the blank graph:
1. Listen carefully as your partnerdescribes each line, and draw eachline based on their description.
2. You are not allowed to ask for moreinformation about a line than whatyour partner tells you.
3. Do not show your drawing to yourpartner until you have finisheddrawing all the lines they describe.
GRADE 8 MATHEMATICS
NAME DATE PERIOD
Unit 3: Linear Relationships Lesson 10: Calculating Slope 2
Lesson 10 Summary
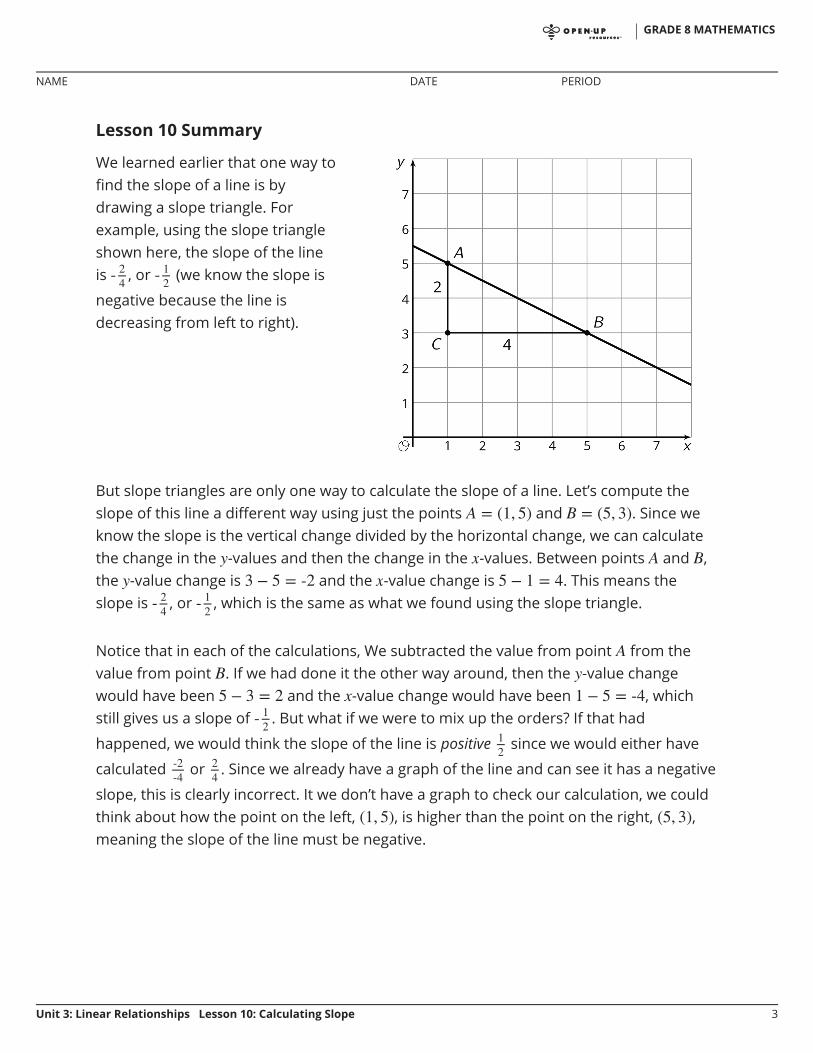
But slope triangles are only one way to calculate the slope of a line. Let’s compute theslope of this line a different way using just the points and . Since weknow the slope is the vertical change divided by the horizontal change, we can calculatethe change in the -values and then the change in the -values. Between points and ,the -value change is and the -value change is . This means theslope is , or , which is the same as what we found using the slope triangle.
Notice that in each of the calculations, We subtracted the value from point from thevalue from point . If we had done it the other way around, then the -value changewould have been and the -value change would have been , whichstill gives us a slope of . But what if we were to mix up the orders? If that had
happened, we would think the slope of the line is positive since we would either have
calculated or . Since we already have a graph of the line and can see it has a negative
slope, this is clearly incorrect. It we don’t have a graph to check our calculation, we couldthink about how the point on the left, , is higher than the point on the right, ,meaning the slope of the line must be negative.
We learned earlier that one way tofind the slope of a line is bydrawing a slope triangle. Forexample, using the slope triangleshown here, the slope of the lineis , or (we know the slope is
negative because the line isdecreasing from left to right).
GRADE 8 MATHEMATICS
NAME DATE PERIOD
Unit 3: Linear Relationships Lesson 10: Calculating Slope 3
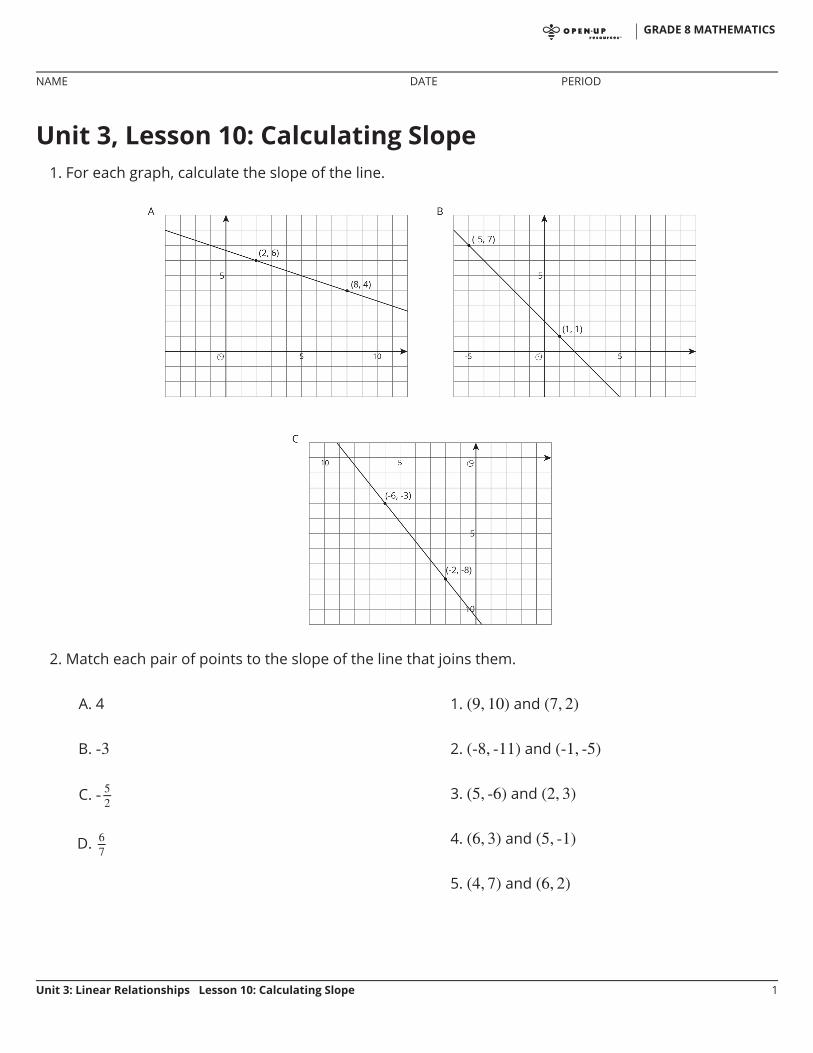
Unit 3, Lesson 10: Calculating Slope1. For each graph, calculate the slope of the line.
2. Match each pair of points to the slope of the line that joins them.
A. 4
B.
C.
D.
1. and
2. and
3. and
4. and
5. and
GRADE 8 MATHEMATICS
NAME DATE PERIOD
Unit 3: Linear Relationships Lesson 10: Calculating Slope 1
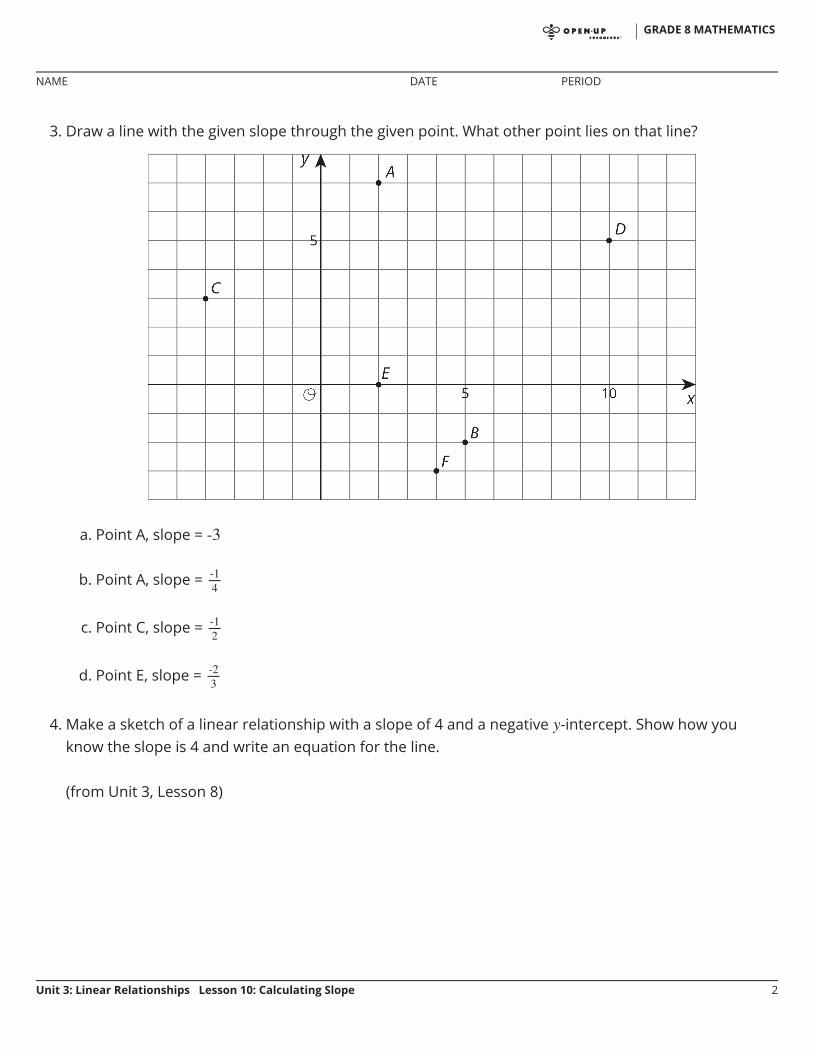
3. Draw a line with the given slope through the given point. What other point lies on that line?
a. Point A, slope =
b. Point A, slope =
c. Point C, slope =
d. Point E, slope =
4. Make a sketch of a linear relationship with a slope of 4 and a negative -intercept. Show how youknow the slope is 4 and write an equation for the line.
(from Unit 3, Lesson 8)
GRADE 8 MATHEMATICS
NAME DATE PERIOD
Unit 3: Linear Relationships Lesson 10: Calculating Slope 2
m.openup.org/1/8-3-11-2
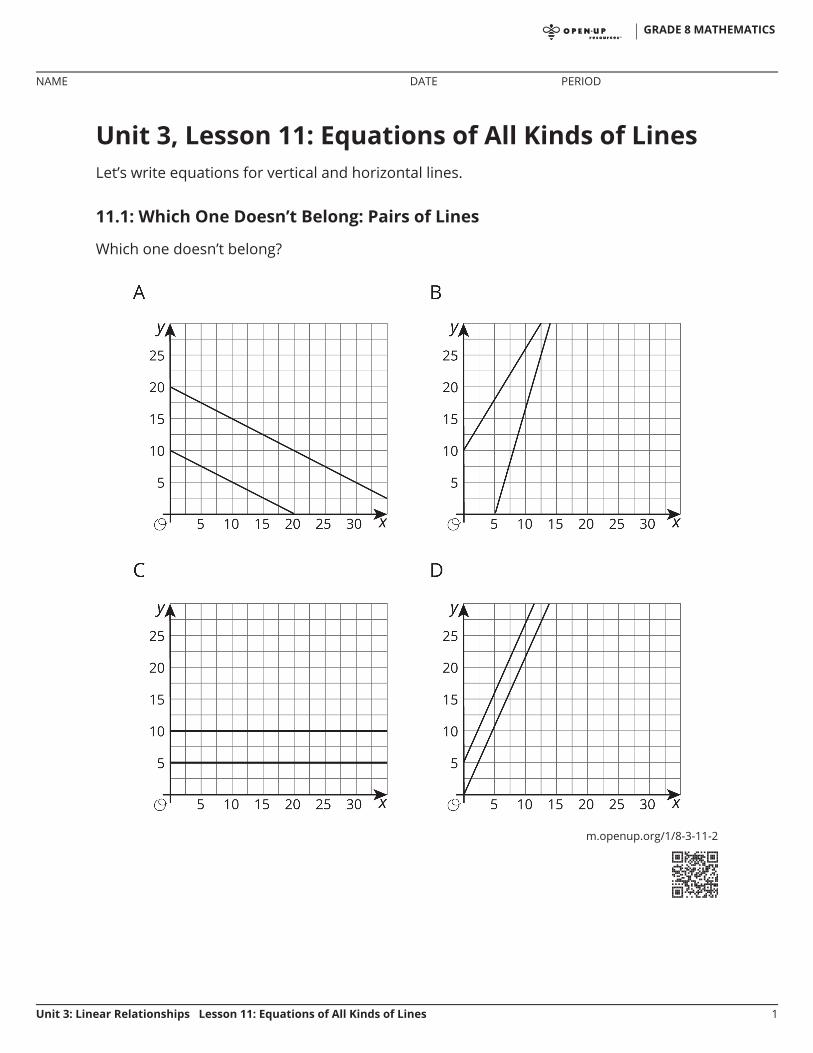
Unit 3, Lesson 11: Equations of All Kinds of LinesLet’s write equations for vertical and horizontal lines.
11.1: Which One Doesn’t Belong: Pairs of Lines
Which one doesn’t belong?
GRADE 8 MATHEMATICS
NAME DATE PERIOD
Unit 3: Linear Relationships Lesson 11: Equations of All Kinds of Lines 1
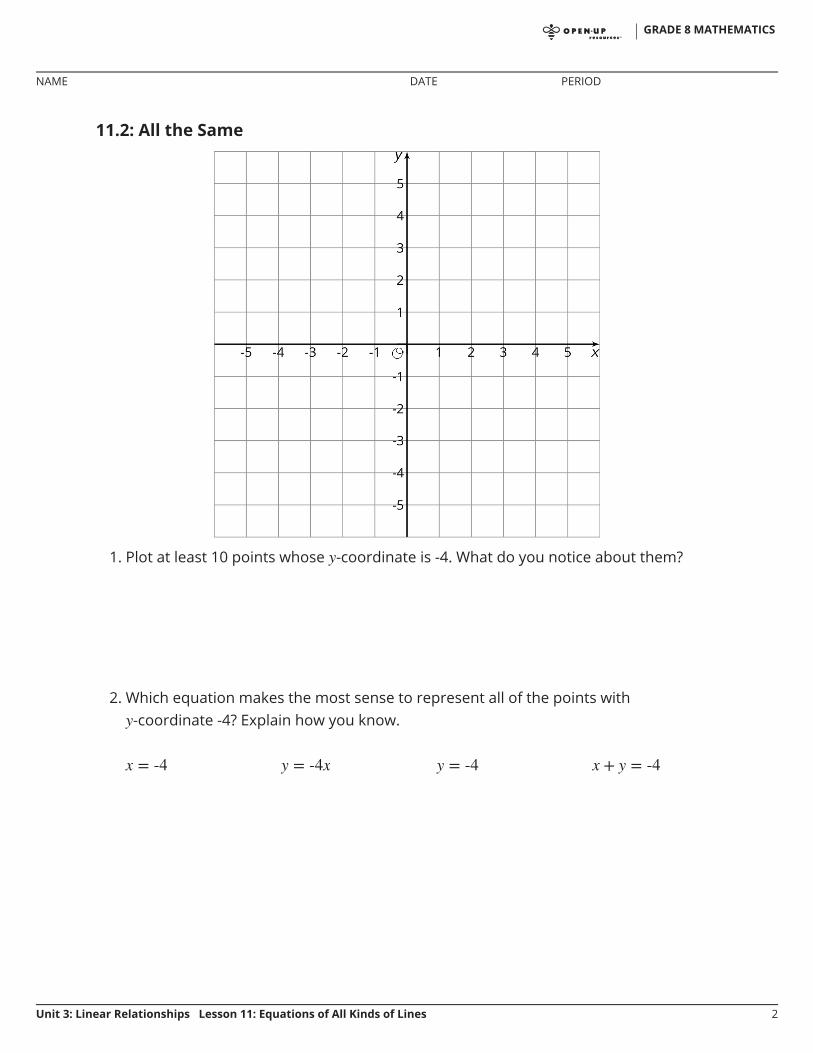
11.2: All the Same
1. Plot at least 10 points whose -coordinate is -4. What do you notice about them?
2. Which equation makes the most sense to represent all of the points with-coordinate -4? Explain how you know.
GRADE 8 MATHEMATICS
NAME DATE PERIOD
Unit 3: Linear Relationships Lesson 11: Equations of All Kinds of Lines 2
3. Plot at least 10 points whose -coordinate is 3. What do you notice about them?
4. Which equation makes the most sense to represent all of the points with-coordinate 3? Explain how you know.
5. Graph the equation .
6. Graph the equation .
Are you ready for more?
1. Draw the rectangle with vertices , , , .
2. For each of the four sides of the rectangle, write an equation for a line containing theside.
3. A rectangle has sides on the graphs of , , , . Find thecoordinates of each vertex.
GRADE 8 MATHEMATICS
NAME DATE PERIOD
Unit 3: Linear Relationships Lesson 11: Equations of All Kinds of Lines 3
m.openup.org/1/8-3-11-311.3: Same Perimeter
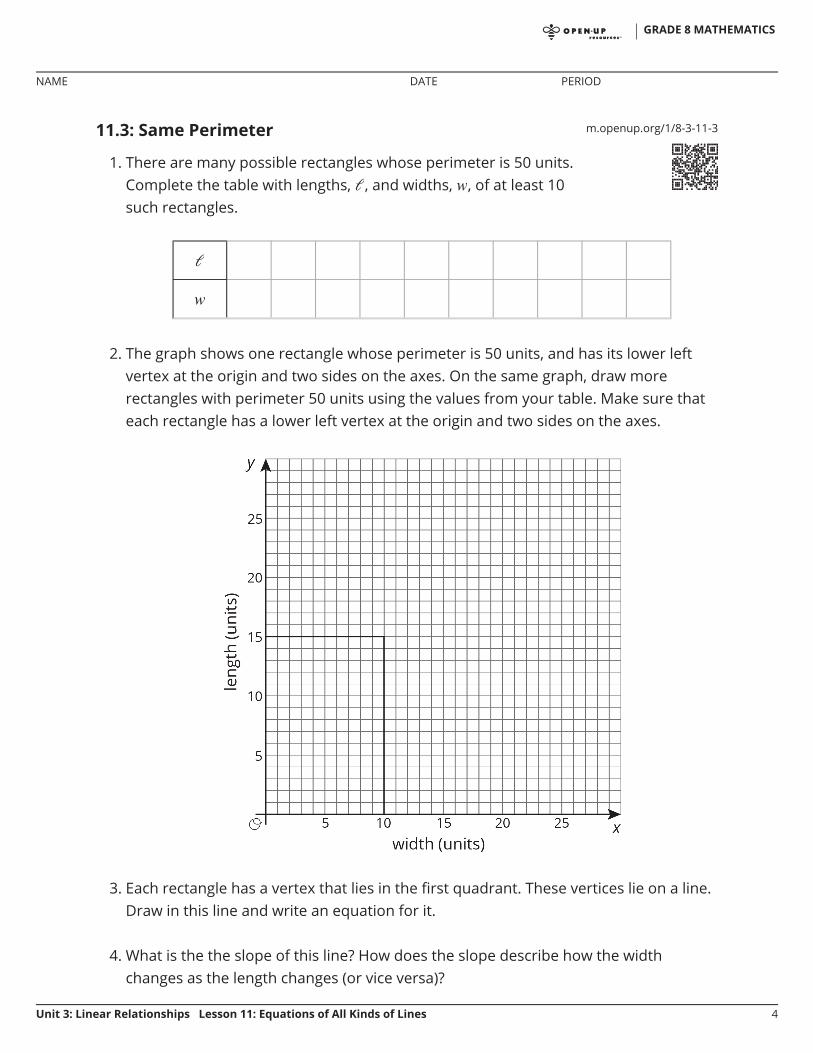
1. There are many possible rectangles whose perimeter is 50 units.Complete the table with lengths, , and widths, , of at least 10such rectangles.
2. The graph shows one rectangle whose perimeter is 50 units, and has its lower leftvertex at the origin and two sides on the axes. On the same graph, draw morerectangles with perimeter 50 units using the values from your table. Make sure thateach rectangle has a lower left vertex at the origin and two sides on the axes.
3. Each rectangle has a vertex that lies in the first quadrant. These vertices lie on a line.Draw in this line and write an equation for it.
4. What is the the slope of this line? How does the slope describe how the widthchanges as the length changes (or vice versa)?
GRADE 8 MATHEMATICS
NAME DATE PERIOD
Unit 3: Linear Relationships Lesson 11: Equations of All Kinds of Lines 4
Lesson 11 Summary
Horizontal lines in the coordinate plane represent situations where the value doesn’tchange at all while the value changes. For example, the horizontal line that goesthrough the point can be described in words as “for all points on the line, thevalue is always 13.” An equation that says the same thing is .
Vertical lines represent situations where the value doesn’t change at all while thevalue changes. The equation describes a vertical line through the point .
GRADE 8 MATHEMATICS
NAME DATE PERIOD
Unit 3: Linear Relationships Lesson 11: Equations of All Kinds of Lines 5
Unit 3, Lesson 11: Equations of All Kinds of Lines1. Suppose you wanted to graph the equation .
a. Describe the steps you would take to draw the graph.
b. How would you check that the graph you drew is correct?
2. Draw the following lines and then write an equation for each.
a. Slope is 0, -intercept is 5
b. Slope is 2, -intercept is
c. Slope is , -intercept is 1
d. Slope is , -intercept is
GRADE 8 MATHEMATICS
NAME DATE PERIOD
Unit 3: Linear Relationships Lesson 11: Equations of All Kinds of Lines 1
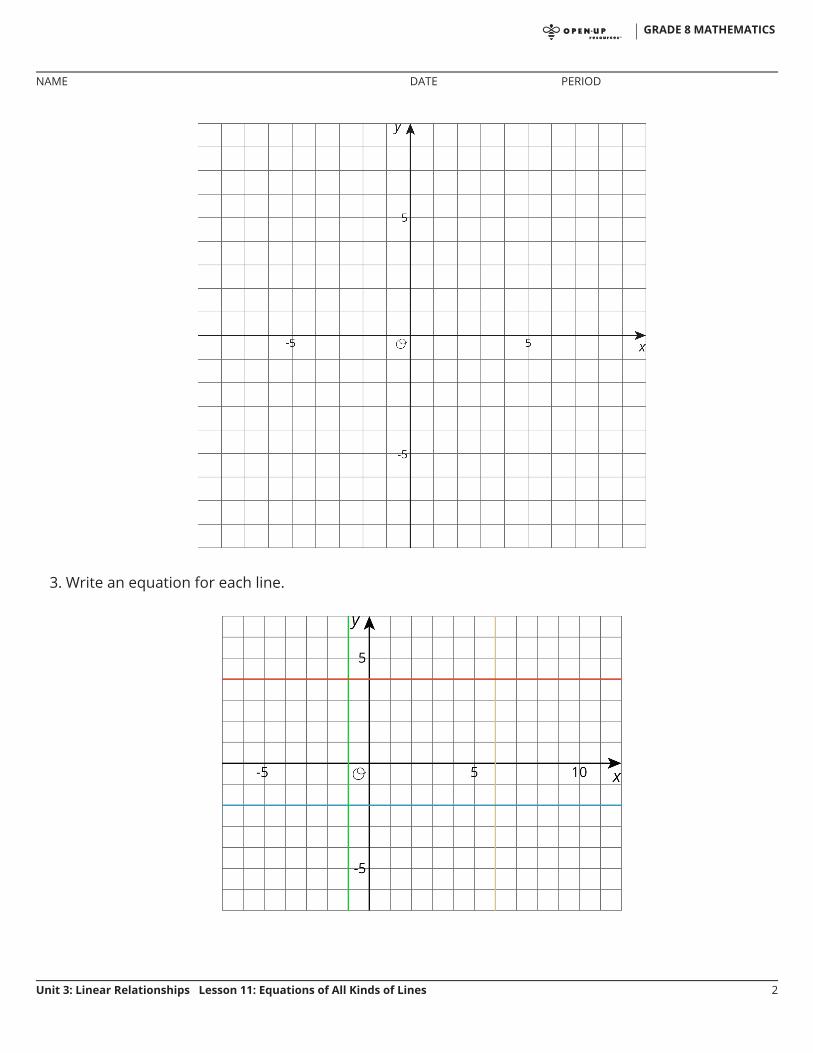
3. Write an equation for each line.
GRADE 8 MATHEMATICS
NAME DATE PERIOD
Unit 3: Linear Relationships Lesson 11: Equations of All Kinds of Lines 2
4. A publisher wants to figure out how thick their new book will be. The book has a front cover and aback cover, each of which have a thickness of of an inch. They have a choice of which type of paper
to print the book on.
a. Bond paper has a thickness of inch per one hundred pages. Write an equation for the width of
the book, , if it has hundred pages, printed on bond paper.
b. Ledger paper has a thickness of inch per one hundred pages. Write an equation for the width of
the book, , if it has hundred pages, printed on ledger paper.
c. If they instead chose front and back covers of thickness of an inch, how would this change the
equations in the previous two parts?
(from Unit 3, Lesson 7)
GRADE 8 MATHEMATICS
NAME DATE PERIOD
Unit 3: Linear Relationships Lesson 11: Equations of All Kinds of Lines 3
Unit 3, Lesson 12: Solutions to Linear EquationsLet’s think about what it means to be a solution to a linear equation with two variables init.
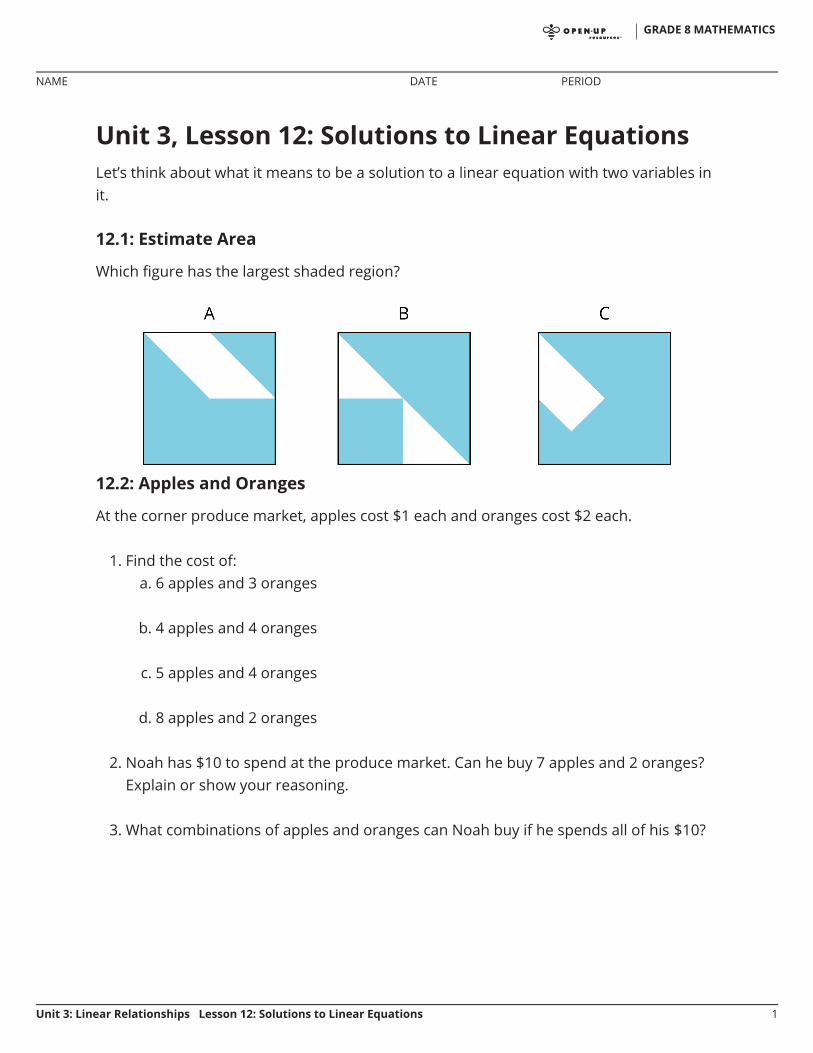
12.1: Estimate Area
Which figure has the largest shaded region?
12.2: Apples and Oranges
At the corner produce market, apples cost $1 each and oranges cost $2 each.
1. Find the cost of:a. 6 apples and 3 oranges
b. 4 apples and 4 oranges
c. 5 apples and 4 oranges
d. 8 apples and 2 oranges
2. Noah has $10 to spend at the produce market. Can he buy 7 apples and 2 oranges?Explain or show your reasoning.
3. What combinations of apples and oranges can Noah buy if he spends all of his $10?
GRADE 8 MATHEMATICS
NAME DATE PERIOD
Unit 3: Linear Relationships Lesson 12: Solutions to Linear Equations 1
4. Use two variables to write an equation that represents $10-combinations of applesand oranges. Be sure to say what each variable means.
5. What are 3 combinations of apples and oranges that make your equation true? Whatare three combinations of apples and oranges that make it false?
Are you ready for more?
1. Graph the equation you wrote relating the number of apples and the number oforanges.
2. What is the slope of the graph? What is the meaning of the slope in terms of thecontext?
3. Suppose Noah has $20 to spend. Graph the equation describing this situation. Whatdo you notice about the relationship between this graph and the earlier one?
GRADE 8 MATHEMATICS
NAME DATE PERIOD
Unit 3: Linear Relationships Lesson 12: Solutions to Linear Equations 2
12.3: Solutions and Everything Else
You have two numbers. If you double the first number and add it to the second number,the sum is 10.
1. Let represent the first number and let represent the second number. Write anequation showing the relationship between , , and 10.
2. Draw and label a set of - and -axes. Plot at least five points on this coordinateplane that make the statement and your equation true. What do you notice aboutthe points you have plotted?
3. List ten points that do not make the statement true. Using a different color, plot eachpoint in the same coordinate plane. What do you notice about these pointscompared to your first set of points?
GRADE 8 MATHEMATICS
NAME DATE PERIOD
Unit 3: Linear Relationships Lesson 12: Solutions to Linear Equations 3
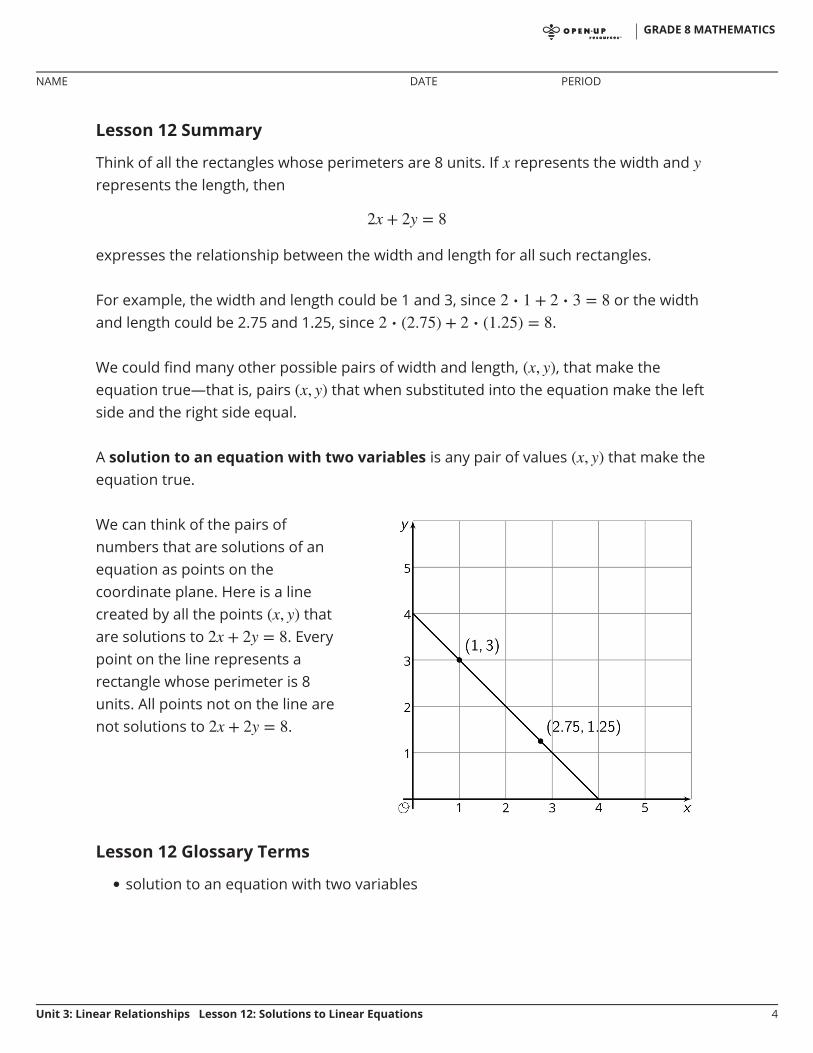
Lesson 12 Summary
Think of all the rectangles whose perimeters are 8 units. If represents the width andrepresents the length, then
expresses the relationship between the width and length for all such rectangles.
For example, the width and length could be 1 and 3, since or the widthand length could be 2.75 and 1.25, since .
We could find many other possible pairs of width and length, , that make theequation true—that is, pairs that when substituted into the equation make the leftside and the right side equal.
A solution to an equation with two variables is any pair of values that make theequation true.
Lesson 12 Glossary Terms
solution to an equation with two variables
We can think of the pairs ofnumbers that are solutions of anequation as points on thecoordinate plane. Here is a linecreated by all the points thatare solutions to . Everypoint on the line represents arectangle whose perimeter is 8units. All points not on the line arenot solutions to .
•
GRADE 8 MATHEMATICS
NAME DATE PERIOD
Unit 3: Linear Relationships Lesson 12: Solutions to Linear Equations 4
Unit 3, Lesson 12: Solutions to Linear Equations1. Select all of the ordered pairs that are solutions to the linear equation .
A.B.C.D.E.F.
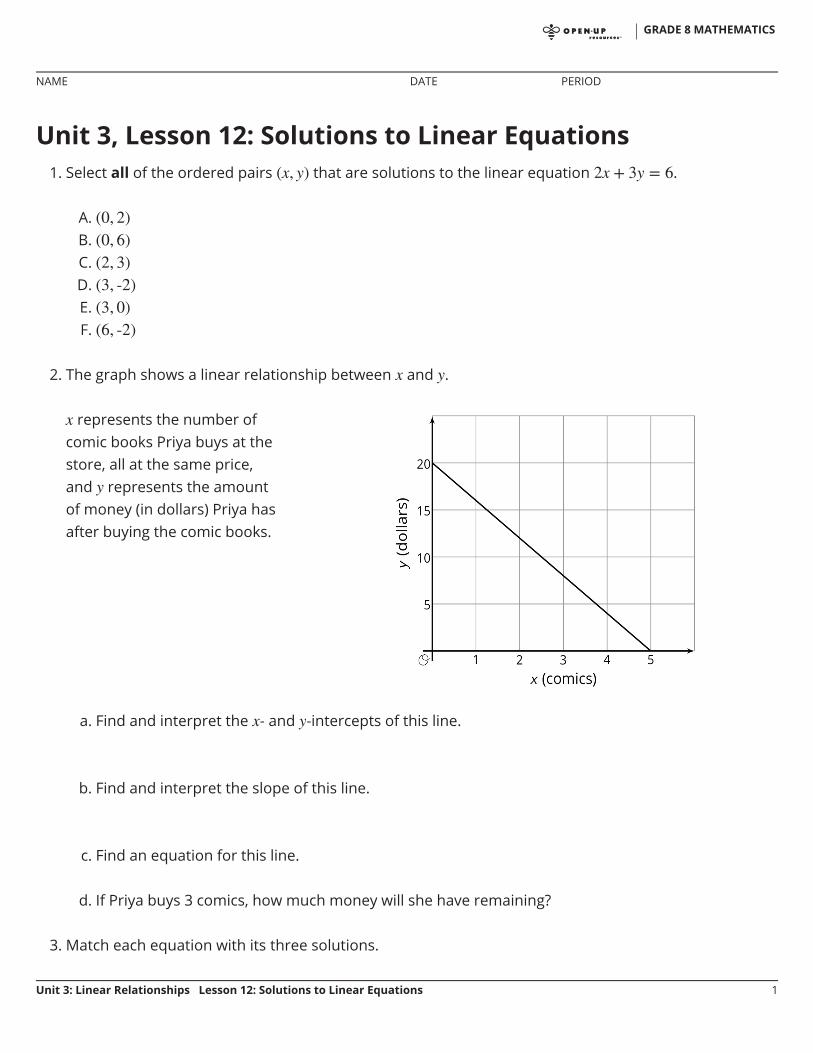
2. The graph shows a linear relationship between and .
a. Find and interpret the - and -intercepts of this line.
b. Find and interpret the slope of this line.
c. Find an equation for this line.
d. If Priya buys 3 comics, how much money will she have remaining?
3. Match each equation with its three solutions.
represents the number ofcomic books Priya buys at thestore, all at the same price,and represents the amountof money (in dollars) Priya hasafter buying the comic books.
GRADE 8 MATHEMATICS
NAME DATE PERIOD
Unit 3: Linear Relationships Lesson 12: Solutions to Linear Equations 1
4. A container of fuel dispenses fuel at the rate of 5 gallons per second. If represents the amount offuel remaining in the container, and represents the number of seconds that have passed since thefuel started dispensing, then and satisfy a linear relationship.
In the coordinate plane, will the slope of the line representing that relationship have a positive,negative, or zero slope? Explain how you know.
(from Unit 3, Lesson 10)
5. A sandwich store charges a delivery fee to bring lunch to an office building. One office pays $33 for 4turkey sandwiches. Another office pays $61 for 8 turkey sandwiches. How much does each turkeysandwich add to the cost of the delivery? Explain how you know.
(from Unit 3, Lesson 5)
A.
B.
C.
D.
E.
1. , ,
2. , ,
3. , ,
4. , ,
5. , ,
GRADE 8 MATHEMATICS
NAME DATE PERIOD
Unit 3: Linear Relationships Lesson 12: Solutions to Linear Equations 2
Unit 3, Lesson 13: More Solutions to LinearEquationsLet’s find solutions to more linear equations.
13.1: Coordinate Pairs
For each equation choose a value for and then solve to find the corresponding valuethat makes that equation true.
1.
2.
3.
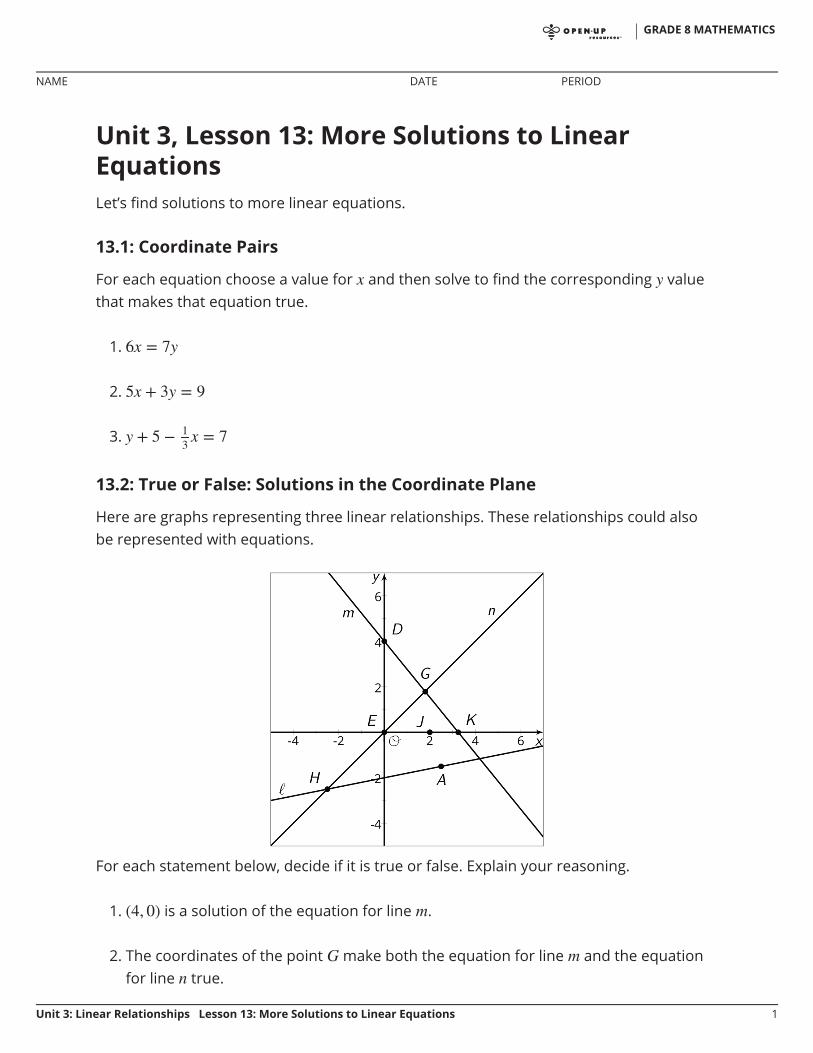
13.2: True or False: Solutions in the Coordinate Plane
Here are graphs representing three linear relationships. These relationships could alsobe represented with equations.
For each statement below, decide if it is true or false. Explain your reasoning.
1. is a solution of the equation for line .
2. The coordinates of the point make both the equation for line and the equationfor line true.
GRADE 8 MATHEMATICS
NAME DATE PERIOD
Unit 3: Linear Relationships Lesson 13: More Solutions to Linear Equations 1
3. is a solution of the equation for line .
4. makes both the equation for line and the equation for line true.
5. There is no solution for the equation for line that has .
6. The coordinates of point are solutions to the equation for line .
7. There are exactly two solutions of the equation for line .
8. There is a point whose coordinates make the equations of all three lines true.
After you finish discussing the eight statements, find another group and check youranswers against theirs. Discuss any disagreements.
13.3: I’ll Take an X, Please
One partner has 6 cards labeled A through F and one partner has 6 cards labeled athrough f. In each pair of cards (for example, Cards A and a), there is an equation on onecard and a coordinate pair, , that makes the equation true on the other card.
1. The partner with the equation asks the partner with a solution for either the -valueor the -value and explains why they chose the one they did.
2. The partner with the equation uses this value to find the other value, explaining eachstep as they go.
3. The partner with the coordinate pair then tells the partner with the equation if theyare right or wrong. If they are wrong, both partners should look through the steps tofind and correct any errors. If they are right, both partners move onto the next set ofcards.
4. Keep playing until you have finished Cards A through F.
Are you ready for more?
Consider the equation , where and are positive numbers.
1. Find the coordinates of the - and -intercepts of the graph of the equation.
GRADE 8 MATHEMATICS
NAME DATE PERIOD
Unit 3: Linear Relationships Lesson 13: More Solutions to Linear Equations 2
2. Find the slope of the graph.
Lesson 13 Summary
Let's think about the linear equation . If we know is a solution to theequation, then we also know is a point on the graph of the equation. Since thispoint is on the -axis, we also know that it is the vertical intercept of the graph. But whatabout the coordinate of the horizontal intercept, when ? Well, we can use theequation to figure it out.
Since when , we know the point is on the graph of the line. No matterthe form a linear equation comes in, we can always find solutions to the equation bystarting with one value and then solving for the other value.
GRADE 8 MATHEMATICS
NAME DATE PERIOD
Unit 3: Linear Relationships Lesson 13: More Solutions to Linear Equations 3
Unit 3, Lesson 13: More Solutions to Linear Equations1. For each equation, find when . Then find when
a.
b.
c.
d.
e.
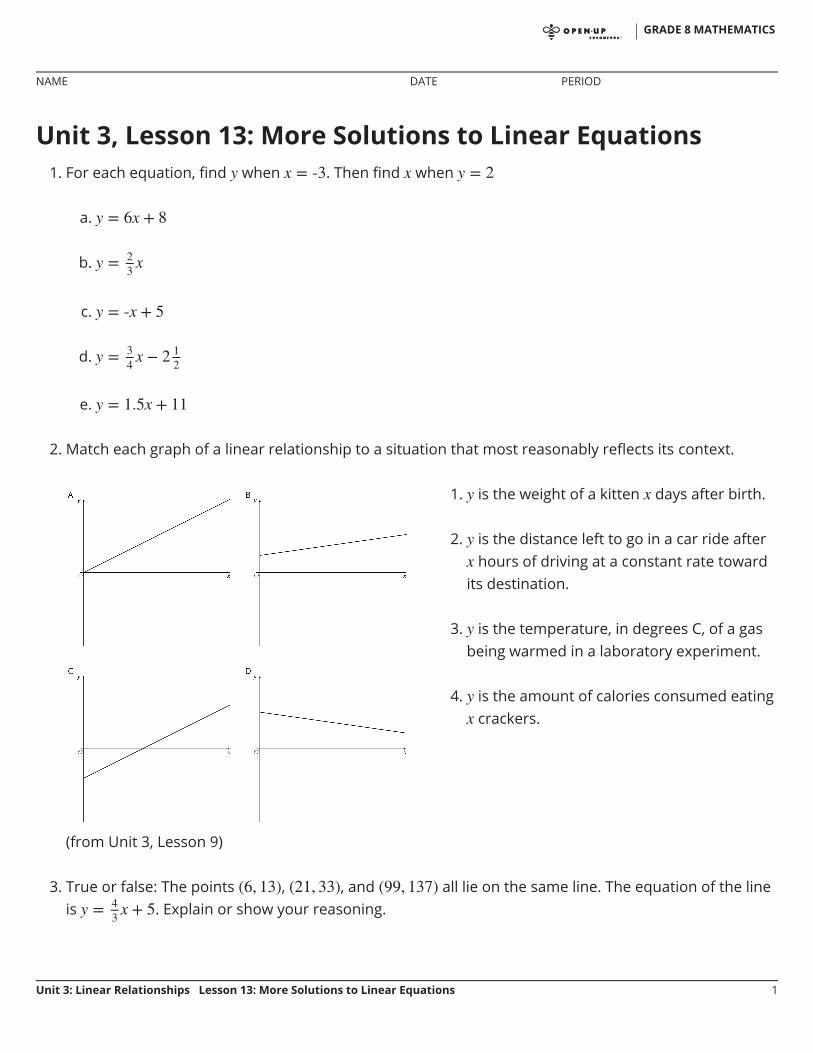
2. Match each graph of a linear relationship to a situation that most reasonably reflects its context.
(from Unit 3, Lesson 9)
3. True or false: The points , , and all lie on the same line. The equation of the lineis . Explain or show your reasoning.
1. is the weight of a kitten days after birth.
2. is the distance left to go in a car ride afterhours of driving at a constant rate toward
its destination.
3. is the temperature, in degrees C, of a gasbeing warmed in a laboratory experiment.
4. is the amount of calories consumed eatingcrackers.
GRADE 8 MATHEMATICS
NAME DATE PERIOD
Unit 3: Linear Relationships Lesson 13: More Solutions to Linear Equations 1
4. Here is a linear equation:
a. Are and solutions to the equation? Explain or show your reasoning.
b. Find the -intercept of the graph of the equation. Explain or show your reasoning.
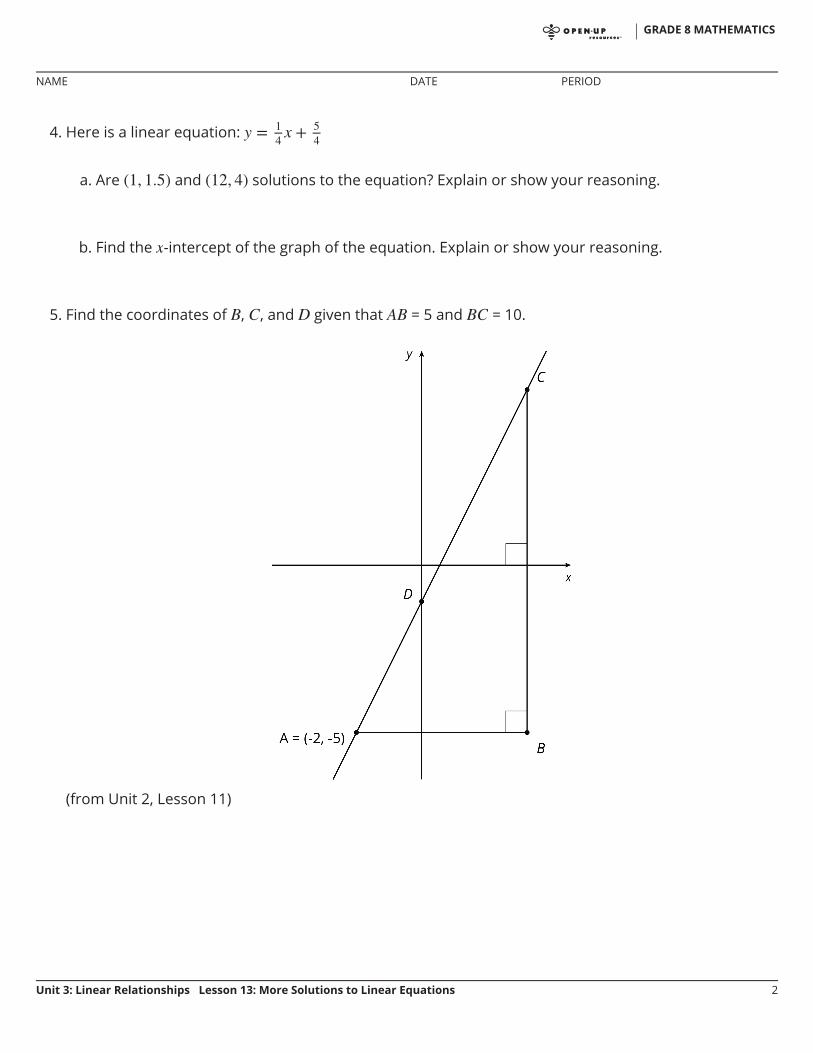
5. Find the coordinates of , , and given that = 5 and = 10.
(from Unit 2, Lesson 11)
GRADE 8 MATHEMATICS
NAME DATE PERIOD
Unit 3: Linear Relationships Lesson 13: More Solutions to Linear Equations 2
Unit 3, Lesson 14: Using Linear Relations to SolveProblemsLet’s write equations for real-world situations and think about their solutions.
14.1: Buying Fruit
For each relationship described, write an equation to represent the relationship.
1. Grapes cost $2.39 per pound. Bananas cost $0.59 per pound. You have $15 to spendon pounds of grapes and pounds of bananas.
2. A savings account has $50 in it at the start of the year and $20 is deposited eachweek. After weeks, there are dollars in the account.
GRADE 8 MATHEMATICS
NAME DATE PERIOD
Unit 3: Linear Relationships Lesson 14: Using Linear Relations to SolveProblems
1
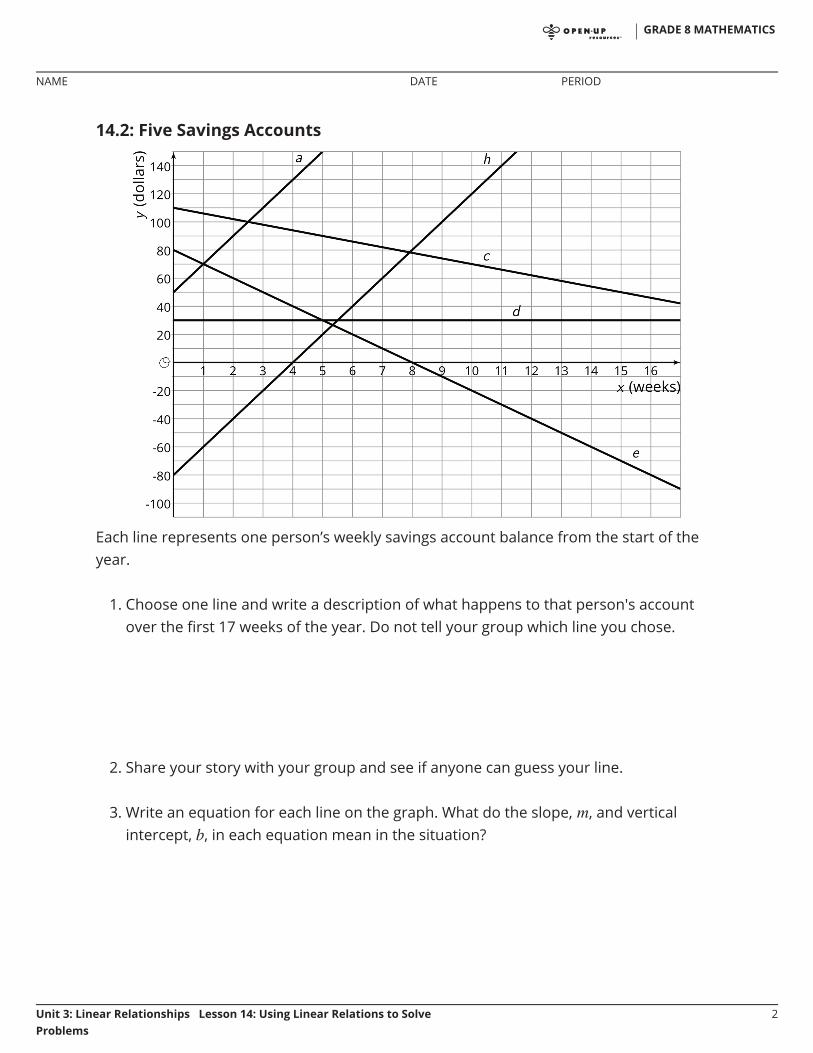
14.2: Five Savings Accounts
Each line represents one person’s weekly savings account balance from the start of theyear.
1. Choose one line and write a description of what happens to that person's accountover the first 17 weeks of the year. Do not tell your group which line you chose.
2. Share your story with your group and see if anyone can guess your line.
3. Write an equation for each line on the graph. What do the slope, , and verticalintercept, , in each equation mean in the situation?
GRADE 8 MATHEMATICS
NAME DATE PERIOD
Unit 3: Linear Relationships Lesson 14: Using Linear Relations to SolveProblems
2
4. For which equation is a solution? Interpret this solution in terms of your story.
5. Predict the balance in each account after 20 weeks.
14.3: Fabulous Fish
The Fabulous Fish Market orders tilapia, which costs $3 per pound, and salmon, whichcosts $5 per pound. The market budgets $210 to spend on this order each day.
1. What are five different combinations of salmon and tilapia that the market canorder?
2. Define variables and write an equation representing the relationship between theamount of each fish bought and how much the market spends.
GRADE 8 MATHEMATICS
NAME DATE PERIOD
Unit 3: Linear Relationships Lesson 14: Using Linear Relations to SolveProblems
3
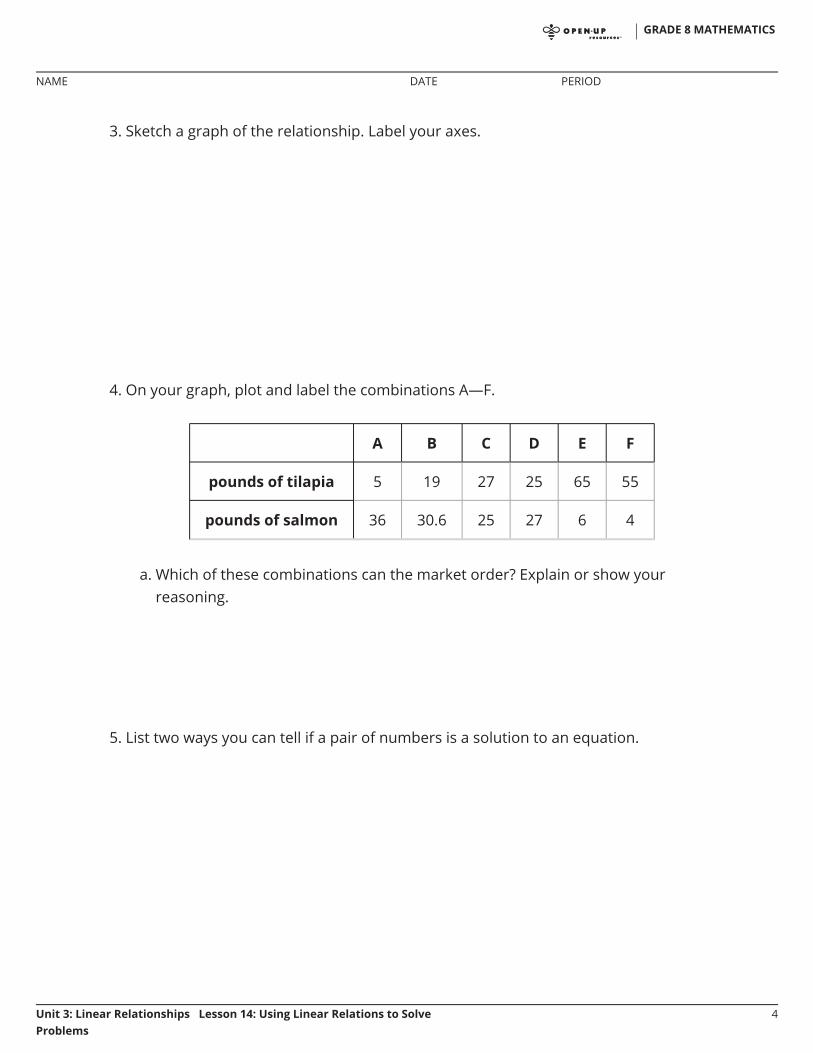
3. Sketch a graph of the relationship. Label your axes.
4. On your graph, plot and label the combinations A—F.
A B C D E F
pounds of tilapia 5 19 27 25 65 55
pounds of salmon 36 30.6 25 27 6 4
a. Which of these combinations can the market order? Explain or show yourreasoning.
5. List two ways you can tell if a pair of numbers is a solution to an equation.
GRADE 8 MATHEMATICS
NAME DATE PERIOD
Unit 3: Linear Relationships Lesson 14: Using Linear Relations to SolveProblems
4
Unit 3, Lesson 14: Using Linear Relations to Solve Problems1. The owner of a new restaurant is ordering tables and chairs. He wants to have only tables for 2 and
tables for 4. The total number of people that can be seated in the restaurant is 120.
a. Describe some possible combinations of 2-seat tables and 4-seat tables that will seat 120customers. Explain how you found them.
b. Write an equation to represent the situation. What do the variables represent?
c. Create a graph to represent the situation.
d. What does the slope tell us about the situation?
e. Interpret the and intercepts in the situation.
2. Triangle is an isosceles triangle with two angles of measure degrees and one angle of measuredegrees.
a. Find three combinations of and that make this sentence true.
GRADE 8 MATHEMATICS
NAME DATE PERIOD
Unit 3: Linear Relationships Lesson 14: Using Linear Relations to SolveProblems
1
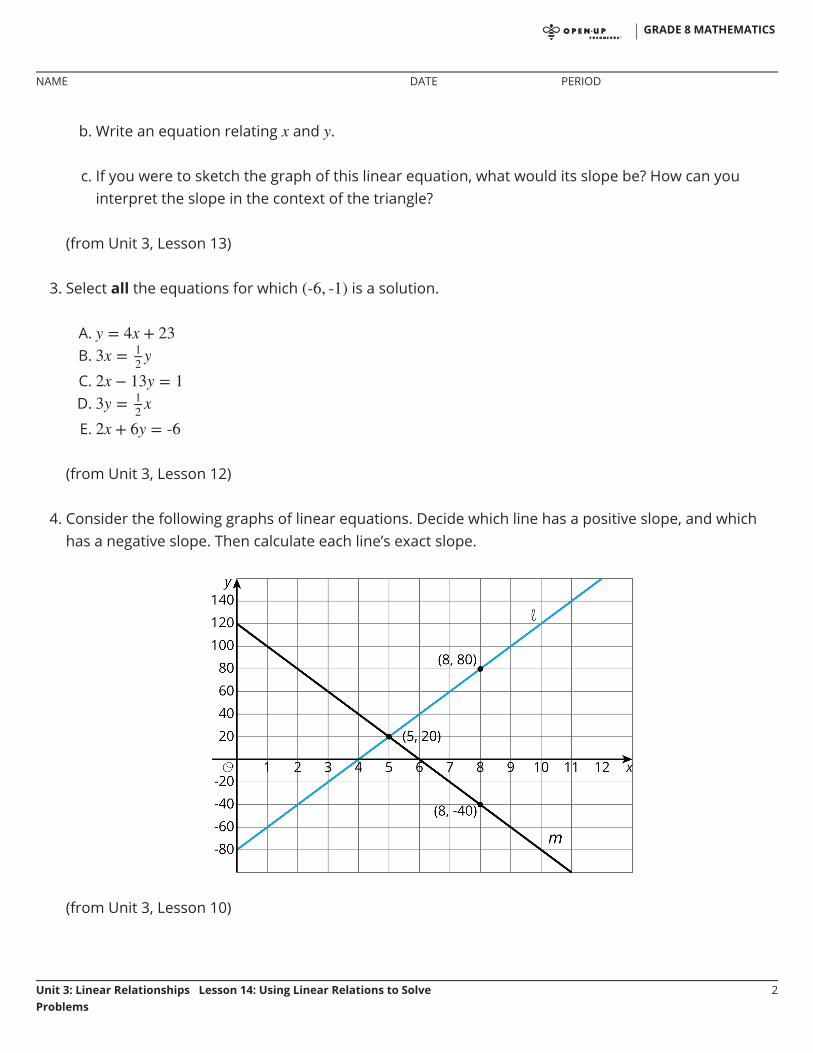
b. Write an equation relating and .
c. If you were to sketch the graph of this linear equation, what would its slope be? How can youinterpret the slope in the context of the triangle?
(from Unit 3, Lesson 13)
3. Select all the equations for which is a solution.
A.B.
C.D.
E.
(from Unit 3, Lesson 12)
4. Consider the following graphs of linear equations. Decide which line has a positive slope, and whichhas a negative slope. Then calculate each line’s exact slope.
(from Unit 3, Lesson 10)
GRADE 8 MATHEMATICS
NAME DATE PERIOD
Unit 3: Linear Relationships Lesson 14: Using Linear Relations to SolveProblems
2


![Proportional Relationships [7th grade]](https://img.pdfslide.net/doc/110x75/61a7321ba621c00d5d40c55a/proportional-relationships-7th-grade.jpg)