Embed Size (px)
Citation preview

Unit 3, Ongoing Activity, Little Black Book of Algebra II Properties
Blackline Masters, Algebra II Page 3-1
3.1 Rational Terminology – define rational number, rational expression, and rational function, least
common denominator (LCD), complex rational expression. 3.2 Rational Expressions – explain the process for simplifying, adding, subtracting, multiplying, and
dividing rational expressions; define reciprocal, and explain how to find denominator restrictions. 3.3 Complex Rational Expressions – define and explain how to simplify. 3.4 Vertical Asymptotes of Rational Functions – explain how to find domain restrictions and what the
domain restrictions look like on a graph, explain how to determine end-behavior of a rational function around a vertical asymptote.
3.5 Solving Rational Equations – explain the difference between a rational expression and a rational equation, list two ways to solve rational equations, define extraneous roots.
3.6 Solving Rational Inequalities − list the steps for solving an inequality by using the sign chart method.
Little Black Book of Algebra II Properties Unit 3 - Rational Equations & Inequalities
Unit 3, Activity 1, Math Log Bellringer
Blackline Masters, Algebra II Page 3-2
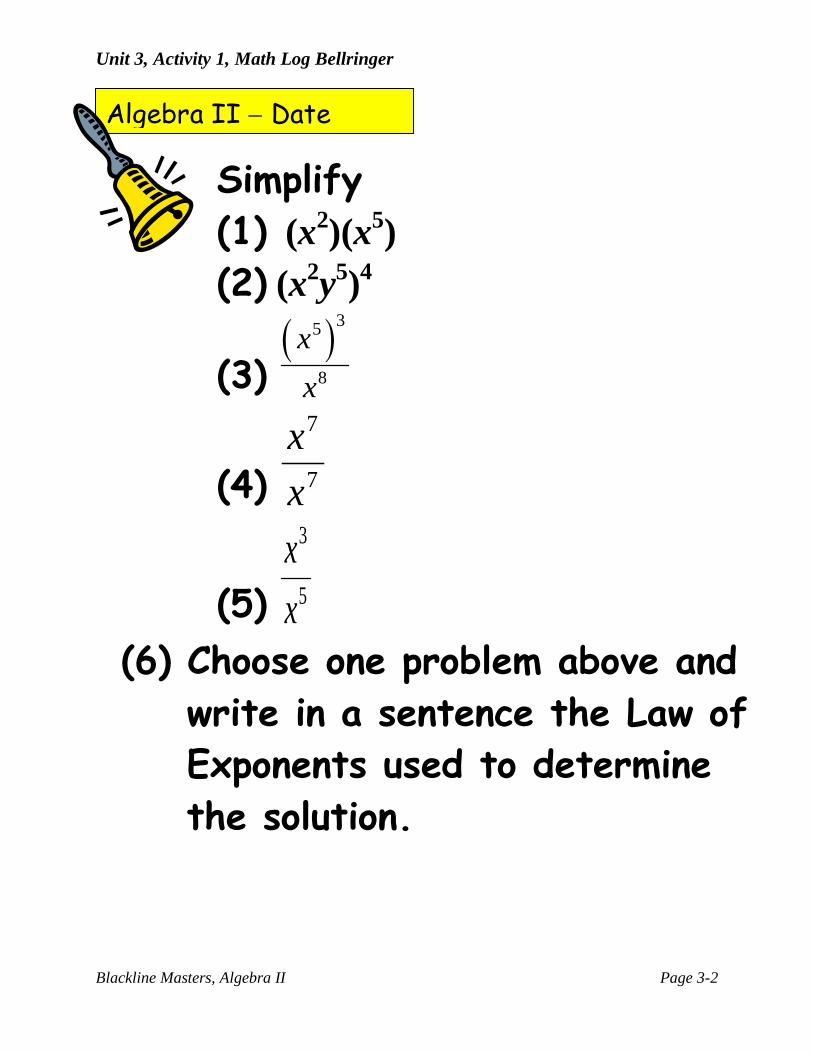
Algebra II − Date
Simplify (1) (x2)(x5) (2) (x2y5)4
(3) ( )35
8
xx
(4)
7
7
xx
(5)
3
5
xx
(6) Choose one problem above and write in a sentence the Law of Exponents used to determine the solution.

Unit 3, Activity 1, Simplifying Rational Expressions with Answers
Blackline Masters, Algebra II Page 3-3
Name Date Laws of Exponents I. Enter the following in your calculators on the home screen:
(1) 30 = (2) 33
12 and2
− = (3) .001 and 3
110
and 10-3 = (4) .00037 and 3.7 x10–4=
II. Simplify and write answers with only positive exponents.
(1) ( ) ( )3 4x x− ______________ (2) ( )32x− _____________ (3) 3
2
xx
−
− ______________
III. Define rational number as the quotient of two integers pq
in which 0q ≠ and define
rational algebraic expression as the quotient of two polynomials P(x), and Q(x) in which Q(x) ≠ 0. Find the domain restrictions on the following rational expressions.
(1) tx7
4 3
(2) 353
−+
yx (3)
7352
−+
xx (4) 2
3 25 6
xx x
+− +
(5) 9
42 −x
IV. Simplify 2440
and explain the steps you used.
V. Apply this concept to simplify the following expressions and develop the process to
simplify rational expressions. Specify all domain restrictions. (Remember, all domain restrictions on any simplified rational expression are obtained from the original expression and apply to all equivalent forms.)
(1) yxyx
4
42
927− (2)
abba
−−
(3) 2
8 45 6
xx x
−− +
(4) 1)284(8 −−xx
VI. To verify that domain restrictions on any simplified rational expression are obtained
from the original expression and applied to all equivalent forms, complete the following:
(1) Simplify 3 22 4 8( )
2x x xf x
x− + −
=−
g(x) =
(2) Graph both the original and the simplified form on the graphing calculator. Trace to x = 2
on both to find f(2) and g(2). There is a hole in one graph and not in the other; therefore, they are only equal for all values of x except x = 2. Verify this in a table: go to 2ND , [TBL SET], (above WINDOW) and TblStart = 0 and set increments ( Tbl ) = 0.2. Again you will see no value for y at x = 2.
Application
The side of a regular hexagon is 2ab3, and the side of a regular triangle is 3a2b. Find the ratio of the perimeter of the hexagon to the perimeter of the triangle. Show all your work:
Unit 3, Activity 1, Simplifying Rational Expressions with Answers
Blackline Masters, Algebra II Page 3-4
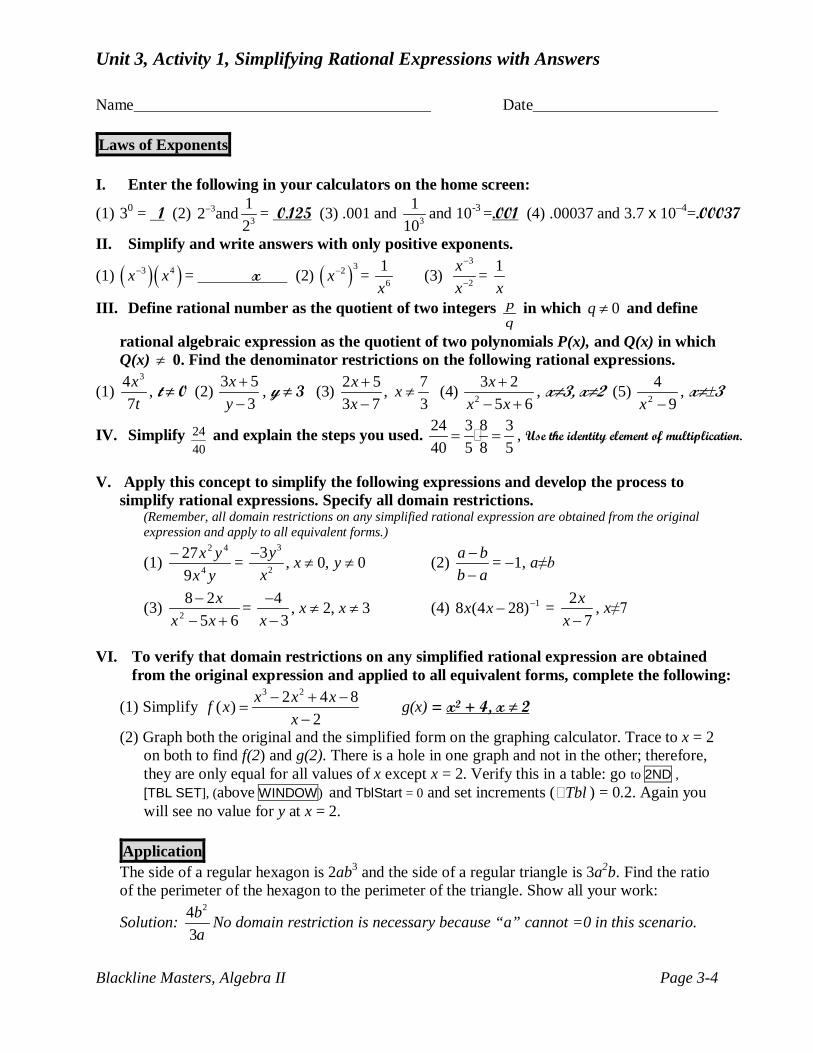
Name Date Laws of Exponents I. Enter the following in your calculators on the home screen:
(1) 30 = 1 (2) 33
12 and2
− = 0.125 (3) .001 and 3
110
and 10-3 =.001 (4) .00037 and 3.7 x 10–4=.00037
II. Simplify and write answers with only positive exponents.
(1) ( ) ( )3 4x x− = x (2) ( )32x− = 6
1x
(3) 3
2
xx
−
− = 1x
III. Define rational number as the quotient of two integers pq
in which 0q ≠ and define
rational algebraic expression as the quotient of two polynomials P(x), and Q(x) in which Q(x) ≠ 0. Find the denominator restrictions on the following rational expressions.
(1) tx7
4 3
, t ≠ 0 (2) 353
−+
yx , y ≠ 3 (3)
7352
−+
xx , 7
3x ≠ (4) 2
3 25 6
xx x
+− +
, x≠3, x≠2 (5) 9
42 −x
, x≠±3
IV. Simplify 2440
and explain the steps you used. 24 3 8 340 5 8 5
= = , Use the identity element of multiplication.
V. Apply this concept to simplify the following expressions and develop the process to
simplify rational expressions. Specify all domain restrictions. (Remember, all domain restrictions on any simplified rational expression are obtained from the original expression and apply to all equivalent forms.)
(1) yxyx
4
42
927− =
3
2
3 , 0, 0y x yx
−≠ ≠ (2)
abba
−− = −1, a≠b
(3) 65
282 +−−
xxx = 4 , 2, 3
3x x
x−
≠ ≠−
(4) 1)284(8 −−xx = 27
xx −
, x≠7
VI. To verify that domain restrictions on any simplified rational expression are obtained
from the original expression and applied to all equivalent forms, complete the following:
(1) Simplify 3 22 4 8( )
2x x xf x
x− + −
=−
g(x) = x2 + 4, x ≠ 2
(2) Graph both the original and the simplified form on the graphing calculator. Trace to x = 2 on both to find f(2) and g(2). There is a hole in one graph and not in the other; therefore, they are only equal for all values of x except x = 2. Verify this in a table: go to 2ND , [TBL SET], (above WINDOW) and TblStart = 0 and set increments ( Tbl ) = 0.2. Again you will see no value for y at x = 2.
Application The side of a regular hexagon is 2ab3 and the side of a regular triangle is 3a2b. Find the ratio of the perimeter of the hexagon to the perimeter of the triangle. Show all your work:
Solution: 24
3ba
No domain restriction is necessary because “a” cannot =0 in this scenario.
Unit 3, Activity 3, Adding & Subtracting Rational Expressions
Blackline Masters, Algebra II Page 3-5
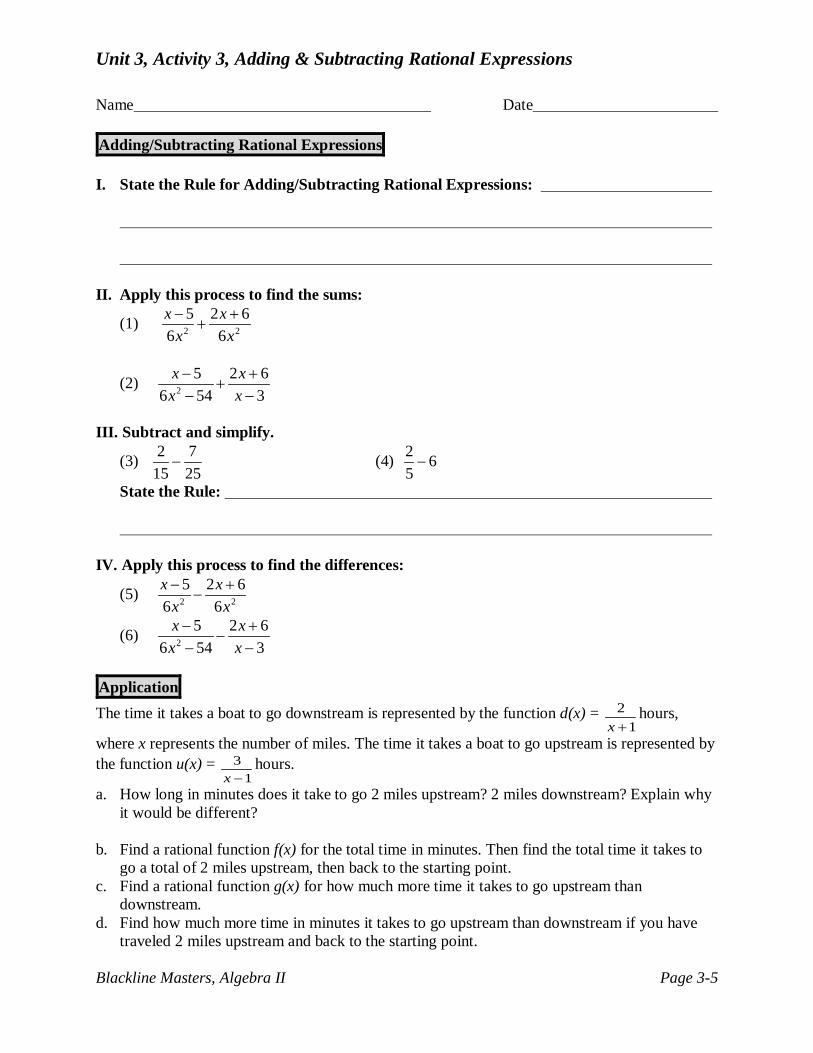
Name Date Adding/Subtracting Rational Expressions I. State the Rule for Adding/Subtracting Rational Expressions: II. Apply this process to find the sums:
(1) 2 2
5 2 66 6x x
x x− +
+
(2) 2
5 2 66 54 3
x xx x− +
+− −
III. Subtract and simplify.
(3) 2 715 25
− (4) 2 65−
State the Rule:
IV. Apply this process to find the differences:
(5) 2 2
5 2 66 6x x
x x− +
−
(6) 2
5 2 66 54 3
x xx x− +
−− −
Application The time it takes a boat to go downstream is represented by the function d(x) = 2
1x +hours,
where x represents the number of miles. The time it takes a boat to go upstream is represented by the function u(x) = 3
1x −hours.
a. How long in minutes does it take to go 2 miles upstream? 2 miles downstream? Explain why it would be different?
b. Find a rational function f(x) for the total time in minutes. Then find the total time it takes to
go a total of 2 miles upstream, then back to the starting point. c. Find a rational function g(x) for how much more time it takes to go upstream than
downstream. d. Find how much more time in minutes it takes to go upstream than downstream if you have
traveled 2 miles upstream and back to the starting point.

Unit 3, Activity 3, Adding & Subtracting Rational Expressions with Answers
Blackline Masters, Algebra II Page 3-6
Name Date Adding/Subtracting Rational Expressions I. State the Rule for Adding/Subtracting Rational Expressions: Find the LCD and add the numerators and keep the denominator II. Apply this process to find the sums:
(1) 2 2
5 2 66 6x x
x x− +
+ = 2613
xx +
(2) 2
5 2 66 54 3
x xx x− +
+− −
= 2
2
12 73 1036 54
x xx+ +−
III. Subtract and simplify.
(3) 2 7 1115 25 75
−− = (4) 2 286
5 5−
− =
State the Rule: Find the LCD and subtract the numerators and keep the denominator. ___________________________________________________________________________
IV. Apply this process to find the differences:
(5) 2 2
5 2 66 6x x
x x− +
− = 2
116x
x− −
(6) 2
5 2 66 54 3
x xx x− +
−− −
= 546
11371122
2
−−−−
xxx
Application The time it takes a boat to go downstream is represented by the function d(x) = 2
1x + hours,
where x represents the number of miles. The time it takes a boat to go upstream is represented by the function u(x) = 3
1x −hours.
a. How long in minutes does it take to go 2 miles upstream? 2 miles downstream? Explain why it would be different? u(2)= 3 hours = 180 minutes, d(2)= 40 minutes, current helps going downstream
b. Find a rational function f(x) for the total time in minutes. Then find the total time it takes to go a total of 2 miles upstream, then back to the starting point. ( ) 2
5 1( ) ( )1
xu x d x f xx+
+ = =−
f(2) = 220 minutes c. Find a rational function g(x) for how much more time it takes to go upstream than
downstream. 2
5( ) ( ) ( )1
xu x d x g xx+
− = =−
d. Find how much more time in minutes it takes to go upstream than downstream if you have traveled 2 miles upstream and back to the starting point. g(2) = 140 minutes

Unit 3, Activity 6, Rational Expressions Applications
Blackline Masters, Algebra II Page 3-7
Name Date Application Problems 1. John’s car uses 18 gallons to travel 300 miles. He has 7 gallons of gas in the car and wants to know
how much more gas will be needed to drive 650 miles. Assuming the car continues to use gas at the same rate, how many more gallons will be needed? Set up a rational equation and solve.
2. What is the formula you learned in Algebra I concerning distance, rate, and time? Write a rational equation solved for time. . Set up a rational equation and use it to solve the
following problem: Jerry walks 6 miles per hour and travels for 5 miles. How many minutes does he walk?
3. Sue and Bob are walking down an airport concourse at the same speed. Bob jumps on a 600 foot
moving sidewalk that travels 3 feet per second and ends at the airplane door. While on the sidewalk, he continues to walk at the same rate as Sue until he reaches the end. He beats Sue by 180 seconds. (a) Using the formula in #2, write the rational expression for Sue’s time. (b) Write the rational expression for Bob’s time. (c) Since Bob’s time is 180 seconds less that Sue’s time, write the rational equation that equates their
times. (d) Solve for the walking rate.
4. List the 6-step process for solving application problems developed in Unit 1.
(1) (2) (3)
(4) (5) (6)
5. Remember the Algebra I formula: Amount of work (A) = rate (r) times time (t). Rewrite the equation
as the rational equation isolating r: . Mary plants flowers at a rate of 200 seeds per hour. How many seeds has she planted in 2 hours? Write the rational equation and answer in a sentence.
6. If one whole job can be accomplished in t units of time, then the rate of work is 1rt
= . Harry and
Melanie are working on Lake Pontchartrain clean-up detail. (a) Harry can clean up the trash in his area in 6 hours. Write an equation for Harry’s rate. _____ (b) Melanie can do the same job in 4 hours. Write an equation for Melanie’s rate. _____ (c) If they work together, how long will it take them to clean that area? Write a rational equation for
the job and solve.

Unit 3, Activity 6, Rational Expressions Applications with Answers
Blackline Masters, Algebra II Page 3-8
Name Date Application Problems 1. John’s car uses 18 gallons to travel 300 miles. He has 7 gallons of gas in the car and wants to know
how much more gas will be needed to drive 650 miles. Assuming the car continues to use gas at the same rate, how many more gallons will be needed? Set up a rational equation and solve.
( )7 .18 .
300 . 650 .x galgal
mi mi+
= , x = 32, John will need 32 more gallons to drive 650 miles.
2. What is the formula you learned in Algebra I concerning distance, rate, and time? d = rt Write a rational equation solved for time. dt
r= . Set up a rational equation and use it to solve the
following problem: Jerry walks 6 miles per hour and travels for 5 miles. How many minutes does he walk? 5
6mit
mph= or 5/6 of an hour, Jerry walks 50 minutes.
3. Sue and Bob are walking down an airport concourse at the same speed. Bob jumps on a 600 foot moving sidewalk that travels 3 feet per second and ends at the airplane door. While on the sidewalk, he continues to walk at the same rate as Sue until he reaches the end. He beats Sue by 180 seconds. (a) Using the formula in #2, write the rational expression for Sue’s time. 600
r .
(b) Write the rational expression for Bob’s time. 600
3r +
(c) Since Bob’s time is 180 seconds less that Sue’s time, write the rational equation that equates their times. 600 600180
3r r− =
+
(d) Solve for the walking rate. r =2 , Sue and Bob are walking at a rate of 2 feet per second. 4. List the 6-step process for solving application problems developed in Unit 1.
(1) Define the variables and the given information (2) Determine what you are asked to find (3) Write an equation
(4) Solve the equation (5) Check (6) Answer the question in a sentence, include units
5. Remember the Algebra I formula: Amount of work (A) = rate (r) times time (t). Rewrite the equation
as the rational equation isolating r: Art
= . Mary plants flowers at a rate of 200 seeds per hour. How
many seeds has she planted in 2 hours? Write the rational equation and answer in a sentence. 200
2A
= Mary planted 400 seeds in 2 hours.
6. If one whole job can be accomplished in t units of time, then the rate of work is 1r
t= . Harry and
Melanie are working on Lake Pontchartrain clean-up detail. (a) Harry can clean up the trash in his area in 6 hours. Write an equation for Harry’s rate. 1
6r =
(b) Melanie can do the same job in 4 hours. Write an equation for Melanie’s rate. 14
r =
(c) If they work together, how long will it take them to clean that area? Write a rational equation for the job and solve. 1 1 1
6 4 t+ = , t = 2.4, It will take them 2.4 hours to clean the area if they work together.

Unit 3, Activity 7, Vertical Asymptotes Discovery Worksheet
Blackline Masters, Algebra II Page 3-9
Name Date End-Behavior Around Vertical Asymptotes This discovery worksheet will explore how the factors in the denominator and their exponents affect the graphs of equations in the form y
x a n=−1
b g. All the graphs below have a horizontal
asymptote at y = 0. Suggested calculator window: x: [−5, 5], y: [−5, 5]
Equation Sketch Vertical Asymptotes
y−intercept
Example:
yx
=−1
2
x = 2
(0, - ½ )
(1)
yx
=−12 2b g
(2)
yx
=−12 3b g
(3)
yx
=−12 4b g
(4)
yx x
=− +
12 3b gb g
(Hint: Zoom box around x = -3 to check graph)

Unit 3, Activity 7, Vertical Asymptotes Discovery Worksheet
Blackline Masters, Algebra II Page 3-10
(5)
( ) ( )21
2 3y
x x−
=− +
Use the results from the graphs above to answer the following questions: 1) How do you determine where the vertical asymptote is located? 2) What are the equations for the following vertical asymptotes?
(a) yx x x
=− + −
14 3 2 2b gb gb g (b) y
x x=
+ −1
2 7 152
3) What effect does the degree on the factor in the denominator have on the graph? 4) Predict the graphs of the following equation and then check on your calculator:
(a) yx x
=− −
405 82 3b gb g (b) y
x=
+1
2 (c) y
x=
−+12
(d) yx
=−1
92 (e) yx
=−1
3 2b g (f) y xx x
=−
− +2
8 122

Unit 3, Activity 8, Rational Equations Lab
Blackline Masters, Algebra II Page 3-11

Unit 3, Activity 8, Rational Equations Lab
Blackline Masters, Algebra II Page 3-12

Unit 3, Activity 8, Rational Equations Lab
Blackline Masters, Algebra II Page 3-13
Activity
16 Light at a Distance:
Distance and Light Intensity
While traveling in a car at night, you may have observed the headlights of an oncoming vehicle. The light starts as a dim glow in the distance, but as the vehicle gets closer, the brightness of the headlights increases rapidly. This is because the light spreads out as it moves away from the source. As a result, light intensity decreases as the distance from a typical light source increases. What is the relationship between distance and intensity for a simple light bulb?
In this activity you can explore the relationship between distance and intensity for a light bulb. You will record the intensity at various distances between a Light Sensor and the bulb. The data can then be analyzed and modeled mathematically.
OBJECTIVES
• Collect light Intensity versus distance data for a point light source. • Compare data to an inverse−square model • Compare data to a power law model • Discuss the difference between an inverse−square model and a power law model
MATERIALS
TI-83 Plus or TI-84 Plus graphing calculator EasyData application data-collection interface
Light Sensor meter stick or tape measure dc-powered point light source
*Reprinted with permission from Texas Instruments Incorporated Real-World Math Made Easy © 2005 Texas Instruments Incorporated 16 - 1

Unit 3, Activity 8, Rational Equations Lab
Blackline Masters, Algebra II Page 3-14
PROCEDURE
Activity 16
1. Arrange the equipment. There must be no obstructions between the bulb and the Light Sensor during
data collection. Remove any surfaces near the bulb, such as books, people, walls or tables. There should be no reflective surfaces behind, beside, or below the bulb. The filament and Light Sensor should be at the same vertical height. This makes the light bulb look more like a point source of light as seen by the Light Sensor. While you are taking intensity readings, the Light Sensor must be pointed directly at the light bulb.
2. Set up the Light Sensor for data collection.
a. Turn on the calculator. b. If you are using the Vernier Light Sensor, set it to 0–600 lux for a small light source, or 0–6000
lux for a larger light source. c. Connect the Light Sensor, data-collection interface, and calculator.
3. Set up EasyData for data collection.
1. Start the EasyData application, if it is not already running. 2. Select File from the Main screen, and then select New to reset the application.
3. Select Setup from the Main screen, and then select Events with Entry. 4. Dim the lights to darken the room. A very dark room is critical to obtain good results. 5. Hold the Light Sensor about 10 cm from the light bulb filament. Move the sensor away from the bulb
and watch the displayed intensity values on the calculator screen. ⇒ Answer Question 1 on the Data Collection and Analysis sheet. 6. To account for the particular brightness of your light source, choose a starting distance that gives a
reading less than the maximum reading for your sensor (600 or 6000 lux for the Vernier sensor, or 1 for the TI sensor), but as large as possible. However, do not get any closer than 5 cm for small (<5 mm) bulbs, or 10 cm otherwise. Choose the starting distance, and enter it as XL
in the Data Table on the Data Collection and Analysis sheet.
7. Again place the Light Sensor at your planned starting distance from the light bulb filament. Important: The distance must be measured carefully. Be sure you measure from the filament of the lamp to the sensor tip on the Light Sensor.
8. Select Start from the Main screen to prepare for data collection. 9. Wait for the value displayed on the calculator to stabilize. Select Keep, and then enter the
distance between the Light Sensor and the light source in meters on the calculator. Select OK to store the data pair.
10. Move the Light Sensor 1 cm farther away from the light source and repeat Step 9. 11. Continue moving the sensor in 1-cm increments until the readings fall to less than 10% of the Stop
initial reading, collecting data as before. After the final data point, select to end data collection. 16 - 2 © 2005 Texas Instruments Incorporated Real-World Math Made Easy

Unit 3, Activity 8, Rational Equations Lab
Blackline Masters, Algebra II Page 3-15
Light at a Distance
12. Inspect the graph of light intensity versus distance. Trace to read the x and y values of the left-most point, round the values to three significant figures, and record them as XL and YL
in the Data Table.
13. Select Main to return to the Main screen. Exit EasyData by selecting Quit from the Main screen and then selecting OK.
ANALYSIS
1. Redisplay your graph outside of EasyData .
a. Press 2ND
[STAT PLOT] (above Y=). b. Press ENTER to select Plot1 and then press ENTER again to select On.
c. Press ZOOM .
d. Press ∃ until ZoomStat is highlighted; press ENTER to display a graph with the x and y ranges set to fill the screen with data.
2. Inspect your graph of the light intensity versus distance.
⇒ Answer Question 2 on the Data Collection and Analysis sheet.
3. One model for light intensity holds that the intensity is proportional to the inverse square of the distance from a point light source; that is, a graph would be of the form y = C/x2
a. Press Y=
, where C is an adjustable parameter. Does your data follow this model? You can check it out by finding an approximate value for C, and then graphing the model with the data. First, enter the model equation.
b. Press CLEAR to remove any existing equation.
c. Enter C/x2 in the Y1
field. d. Press 2ND
[QUIT] (above MODE) to return to the home screen.
4. Set a value for the parameter C and then look at the resulting graph. To obtain a good fit, you will need to try several values for C. Use the steps below to determine an initial guess for the parameter. One way to find an approximate value for the parameter is to use the left-most point. If you solve for C, then C = yx2
a. Enter a value for the parameter C. Press STO % C ENTER to store the value in the variable C.
. Use the x and y values for the left-most point to calculate an initial value for C. Record this value in the Data Table on the Data Collection and Analysis sheet.
b. Press GRAPH to see the data with the model graph superimposed.
c. Press 2ND
[QUIT] (above MODE) to return to the home screen.
5. If the model is systematically high or low, you may want to adjust the value of C to improve the fit. As you did before, store a new value in C, and then display the graph and model. Once you have optimized the model, record the complete equation in the Data Table.
⇒ Answer Question 3 on the Data Collection and Analysis sheet. Real-World Math Made Easy © 2005 Texas Instruments Incorporated 16 - 3

Unit 3, Activity 8, Rational Equations Lab
Blackline Masters, Algebra II Page 3-16
Activity 16
6. Another model can be used to compare to your data. The general power law of y = ax
b
may provide a better fit than the inverse square function, especially if the light source is not small or if there are reflections from walls or other surfaces. The difference between this new model and the inverse square model is that the exponent is not fixed at –2. Instead, the exponent is now an adjustable parameter. The calculator can be used to automatically determine the parameters a and b in the general power law relation to the data.
a. Press STAT and use the cursor keys to highlight CALC.
b. Press ∃ repeatedly to scroll down to PwrReg. When it is highlighted, press ENTER to copy the command to the home screen.
c. Press 2ND [L1] , 2ND [L2] ,
to enter the lists containing the data. d. Press VARS and use the cursor keys to highlight Y−VARS.
e. Select Function by pressing ENTER .
f. Press ENTER to copy Y1
to the home screen. g. On the home screen, you will now see the entry PwrReg L1, L2, Y1. This command will perform a
power law regression with L1 as the x and L2 as the y values. The resulting regression curve will be stored in equation variable Y1
h. Press GRAPH to see the graph of your data and the power regression function.
. Press GRAPH to perform the regression. Use the parameters a and b, rounded to two significant figures, to write the power law model equation in the Data Table.
⇒ Answer Questions 4 and 5 on the Data Collection and Analysis sheet.
EXTENSIONS 1. Suppose that your patio is illuminated by an overhead light fixture with two bulbs. You decide to save
on electricity by removing one of the bulbs. If the light is currently mounted 5 m off the ground, to what height should the light fixture be moved in order to retain the same amount of light on the patio with one bulb? Does your answer depend on the model you use?
2. Two identical light bulbs shine on your favorite reading chair from different locations in the room.
The first bulb is 3 m from your chair and provides an intensity of 0.6 mW/cm2
. The second is 2 m from your chair. What intensity does this bulb provide? Does your answer depend on the model you use?
16 - 4 © 2005 Texas Instruments Incorporated Real-World Math Made Easy

Unit 3, Activity 8, Rational Equations Lab Data Collection & Analysis
Blackline Masters, Algebra II Page 3-17
Activity
16 DATA COLLECTION AND ANALYSIS
Name ____________________________
Date ____________________________
Left-most point X value XL
Left-most point Y value YL Initial model parameter C
Optimized inverse-square model y = C/x 2 Power law model y = ax b
QUESTIONS 1. What is your prediction for the relationship between intensity and the distance to a light
source? 2. Is the graph of the light intensity versus distance consistent with your earlier prediction? 3. How well does the inverse-square model y = C /x2
fit the experimental data?
4. How well does the power law model fit the data? Could it fit any better than the inverse-
square model? Could it fit more poorly? 5. How would using a brighter light bulb affect the parameters a, b, and C in the two
models? Real-World Math Made Easy © 2005 Texas Instruments Incorporated 16 - 5
DATA TABLES

Unit 3, Activity 8, Rational Equations Lab Teacher Information
Blackline Masters, Algebra II Page 3-18
Activity
16
Light at a Distance: Distance and Light Intensity
1. There are currently 2 different combinations of equipment that will work for collecting light data. The
most common method, which works for both the TI-83 Plus and TI-84 Plus families of calculators, is to use a Light Sensor attached to a CBL 2 or LabPro.
The TI-84 Plus calculator has a USB port located at the top right corner. Using the USB port, an EasyLink with a Light Sensor can be connected to collect light data. For more information on EasyLink refer to Page ix located in the front section of this book.
2. When connecting an EasyLink to a TI-84 Plus calculator using USB, the EasyData application
automatically launches when the calculator is turned on and at the home screen. 3. If you obtain readings of more than 600 or 6000 lux (Vernier sensor, depending on setting) or 1 (TI
sensor) move farther away from the light source. Students may need to adjust the range of distances used for data collection, depending on the brightness of the light source. Some students may need help with this in Step 8 of the Procedure. Because of the different light sources that could be used in the lab, the optimum range for data collection will vary.
4. Only a true point light source exhibits an inverse-square dependence of intensity on distance. It is
very difficult in a classroom to achieve a true point light source with no reflective surfaces nearby. As a result, you and your students should not consider results incorrect if you do not get an exponent of nearly –2 in the power law fit. In fact, it is unlikely you will obtain a –2 exponent. An extended light source will yield an exponent between –1 and –2. A long straight light, such as a fluorescent tube, will yield an exponent of about –1 at typical distance ranges.
5. An excellent light source for this experiment is the AA-cell size Mini Mag Lite (www.maglite.com).
The reflector can be unscrewed and removed completely, revealing a very small and intense near-point light. If another kind of flashlight is used, it is essential that it not have a reflector around the bulb, or the source will not behave at all like a point source.
6. It is important that the light be powered by DC (direct current), such as by a battery source. AC-
powered lamps exhibit a time-varying flicker that is not detectable by eye, but that may substantially reduce the quality of the data.
7. The quantity measured by the light sensors is not strictly called “intensity” but this common term is
used for convenience. 8. You may want to have students adjust the window range to replot the data to include the origin. The
inverse-square nature of the model is more readily visible when plotted this way. (See sample data below.)
Real-World Math Made Easy © 2005 Texas Instruments Incorporated 16 - 1 T

Unit 3, Activity 8, Rational Equations Lab Data Collection & Analysis with Answers
Blackline Masters, Algebra II Page 3-19
SAMPLE RESULTS Activity 16
Sample data with inverse-square model Same sample data replotted over a wider range
Sample data with power law model Power law fit parameters
DATA TABLE
Left-most point X value XL 5
Left-most point Y value YL 244
Initial model parameter C 6100 Optimized inverse-square model y = C/x 2 y = 6300/x 2
Power law model y = ax b y = 4100x –1.8
ANSWERS TO QUESTIONS 1. The intensity of the light appears to get smaller with increasing distance. The relationship could be
an inverse relationship, or it could be something else.
2. Yes, the data are consistent with a decreasing function such as an inverse function, as the graph is always decreasing but it never crosses the horizontal axis.
3. The inverse-square model fits the data very well.
4. The fit of the general power law looks very similar to the inverse-square fit. The power law fit has to be at least as good as the inverse-square fit, since the power law fit includes the possibility of the inverse-square fit with the exponent’s taking a value of –2. The fit of the power law model could be better than the inverse-square model if the data don’t actually have an inverse-square behavior.
5. A brighter bulb would shift increase all readings proportionately. So, a and C would increase, but b would stay the same.
16 - 2 T © 2005 Texas Instruments Incorporated Real-World Math Made Easy

Unit 3, Activity 9, Rational Inequalities
Blackline Masters, Algebra II Page 3-20
Name Date Using a Sign Chart to Solve Rational Inequalities Solve the following using a sign chart.
(1) 2
( 3)( 4) 0( 5)( 6)
x xx x− −
≤− −
(2) 024≥
−+
xx
(3) 0112
<−+
xx
(4) 054
162
2
>−−
−xx
x
(5) 2
2
6 0( 1)( 1)
x xx x
− −>
− +
(6) 5 12x≥
+
(7) 64
1−
≥− x
xx
(8) 21
85
41
>+aa
(9) 12+< x
x
(10) 1 2 13 5b b
− ≥
Application The production of heating oil produced by an oil refinery depends on the amount of gasoline produced. The amount of heating oil (h(g)) produced (in gallons per day) is modeled by the rational function ( ) 125,000 25
125 2gh g
g−
=+
where g is the amount of gasoline produced (in
hundreds of gallons per day). If customers need more than 300 gallons of heating oil per day, how many gallons of gasoline will need to be produced?

Unit 3, Activity 9, Rational Inequalities with Answers
Blackline Masters, Algebra II Page 3-21
Name Date Using a Sign Chart to Solve Rational Inequalities Solve the following using a sign chart.
1) 2
( 3)( 4) 0( 5)( 6)
x xx x− −
≤− −
(−∞, 3] ∪ [4, 5)
(2) 024≥
−+
xx
(∞, −4] ∪ (2, ∞)
(3) 0112
<−+
xx
(−∞, 1)
(4) 054
162
2
>−−
−xx
x
(−∞, −4) ∪ (−1, 4) ∪ (5, ∞)
(5) 2
2
6 0( 1)( 1)
x xx x
− −>
− +
(−2, −1) ∪ (−1, 1) ∪ (3, ∞)
(6) 5 12x≥
+
(−2, 3]
(7) 64
1−
≥− x
xx
[2, 3] ∪ (4, 6)
(8) 21
85
41
>+aa
,
70
4
(9) 12+< x
x
(−1, 0) ∪ (2, ∞)
(10) 1 2 13 5b b
− ≥
, − 1
015
Application The production of heating oil produced by an oil refinery depends on the amount of gasoline produced. The amount of heating oil produced (in gallons per day) is modeled by the rational function ( ) 125,000 25
125 2gh g
g−
=+
where g is the amount of gasoline produced (in hundreds of
gallons per day). If customers need more than 300 gallons of heating oil per day, how many gallons of gasoline will need to be produced?
125,000 25 300125 2
gg
−>
+Less than 199.4 gallons of gasoline will need to be produced.